the Creative Commons Attribution 4.0 License.
the Creative Commons Attribution 4.0 License.
 | 23 Oct 2023
Alkalinity and nitrate dynamics reveal dominance of anammox in a hyper-turbid estuary
Mona Norbisrath
Andreas Neumann
Kirstin Dähnke
Tina Sanders
Andreas Schöl
Justus E. E. van Beusekom
Helmuth Thomas
Total alkalinity (TA) regulates the oceanic storage capacity of atmospheric CO2. In heterotrophic temperate estuaries, anaerobic respiration of organic matter, e.g., by denitrification, can be an important source of TA. Denitrification is the anaerobic reduction of nitrate (NO) to elemental nitrogen (N2). By contrast, anammox yields N2 as its terminal product via comproportionation of ammonium (NH) and nitrite (NO); however, this occurs without release of TA as a byproduct. In order to investigate these two nitrate and nitrite respiration pathways and their resulting impact on TA generation, we sampled the highly turbid estuary of the Ems River, discharging into the North Sea in June 2020. During ebb tide, a transect was sampled from the Wadden Sea to the upper tidal estuary, where we additionally sampled fluid mud for incubation experiments and five vertical profiles in the hyper-turbid tidal river. The data reveal a strong increase of TA and dissolved inorganic carbon (DIC) in the tidal river, where stable nitrate isotopes indicate water column denitrification as the dominant pathway. However, in the fluid mud of the tidal river, the measured TA and the N2 incubation experiments imply only low denitrification rates, with the majority of the N2 being produced by anammox (>90 %). The relative abundances of anammox and denitrification, respectively, thus exert a major control on the CO2 storage capacity of adjacent coastal waters.
- Article
(3739 KB) - Full-text XML
- BibTeX
- EndNote


The profound impacts of climate change on coastal systems are receiving increasing scientific attention, with a particularly important and impactful area of this being the CO2 storage capacity of coastal oceans (Burt et al., 2016; Reithmaier et al., 2020; Thomas et al., 2009, 2007; Van Dam et al., 2021; Voynova et al., 2019). In contrast to the open ocean, the carbon cycle in coastal oceans generally exhibits much higher dynamics (Borges et al., 2005; Frankignoulle et al., 1998; Thomas et al., 2009, 2004). These dynamics are even more accentuated in estuaries that are subject to human interventions such as dredging, damming, nutrient inputs, or transportation.
Continental and intertidal estuaries, such as the Ems Estuary (German–Dutch border) on which we focus in this study, are the interface between coast and land. The Ems is exposed to high nutrient inputs, hosts high concentrations of suspended particulate matter (SPM) (Van Beusekom and De Jonge, 1998), and has already shown active nitrogen alternation (Sanders and Laanbroek, 2018; Schulz et al., 2022a), making it a perfect natural laboratory to study the linkage between total alkalinity (TA) and nitrate respiration.
One of the largest impacts on the ocean is the increasing anthropogenic CO2 content in the atmosphere, part of which is absorbed by the ocean. The ocean's TA buffers the acidification of the ocean by the absorption of the weak acid CO2. TA in turn is either generated by chemical rock weathering (Berner et al., 1983; Meybeck, 1987; Suchet and Probst, 1993), or metabolically by various anaerobic or inorganic pathways releasing TA in various stoichiometries (Brewer and Goldman, 1976; Chen and Wang, 1999; Hu and Cai, 2011; Wolf-Gladrow et al., 2007), e.g., by denitrification. Here we focus on the latter form of TA generation.
The coastal zone is exposed to high agricultural nutrient loads, which can lead to coastal eutrophication, foster primary production, increase seasonal anoxia (Große et al., 2016; Howarth et al., 2011; Nixon, 1995), and thereby also influence the CO2 buffering. High nutrient loads also trigger nitrate respiration pathways, such as denitrification and anammox. During denitrification, nitrate (NO) is reduced to nitrous oxide (N2O) and then finally to dinitrogen gas (N2). Throughout this pathway, anaerobic bacteria, i.e., denitrifiers, use NO as terminal electron acceptors and irreversibly generate TA in a ratio of 0.9 (Chen and Wang, 1999).
In contrast to denitrification, anammox, the anaerobic ammonium oxidation, has no effect on the TA concentration (Middelburg et al., 2020). Here, the electron donor ammonium (NH) is oxidized with the electron acceptor nitrite (NO) to release N2 (Meyer et al., 2005; Mulder et al., 1995; Thamdrup and Dalsgaard, 2002).
In light of governing the CO2 buffer capacity of coastal oceans, the proportion in which anammox and denitrification serve to reduce NO or NO plays a crucial role. In this study, we investigate nitrate respiration pathways and combine nitrate respiration rates and processes with carbon and nitrogen cycle observations. The combination of TA generation and nitrate removal (a) allows us to shed light on the interaction between TA and nitrate or nitrite respiration pathways, and (b) aids in disentangling anammox and denitrification in the estuary. To the best of our knowledge, this is one of the first studies in which TA generation is used as a tool to discriminate and underpin calculated potential N2 production pathways.
2.1 Study site and water sampling
The Ems Estuary is located at the border between the Netherlands and Germany. Including the outer estuary, it is approximately 100 km long, starting at the weir in Herbrum and discharging into the Wadden Sea (Fig. 1), which connects to the North Sea (NE Atlantic Shelf). From 1950 to 2010 the tidal range was found to increase from 2 to 3.6 m, respectively, in the upstream estuary (De Jonge et al., 2014; van Maren et al., 2015). The Ems Estuary is permanently subject to natural and anthropogenic pressures. Due to its location, accessibility is needed to maintain connection to estuarine and riverine sea ports as well as the German shipyard in Papenburg, and, as such, the Ems has been subject to channel deepening and dredging activities since the 1950s in the outer estuary and the 1980s in the tidal river. Overall, this has led to hyper-turbid conditions (De Jonge et al., 2014), which results in increasing loads of marine suspended particulate matter (SPM) that accumulate in the upstream estuary and cause high oxygen demand for bacterial degradation and remineralization (Jonge, 1983; De Jonge et al., 2014). Another indirect sink for oxygen is represented by the high loads of fertilizer, which also increase eutrophication and oxygen consumption (Howarth et al., 2011; Nixon, 1995; Van Beusekom et al., 2019).
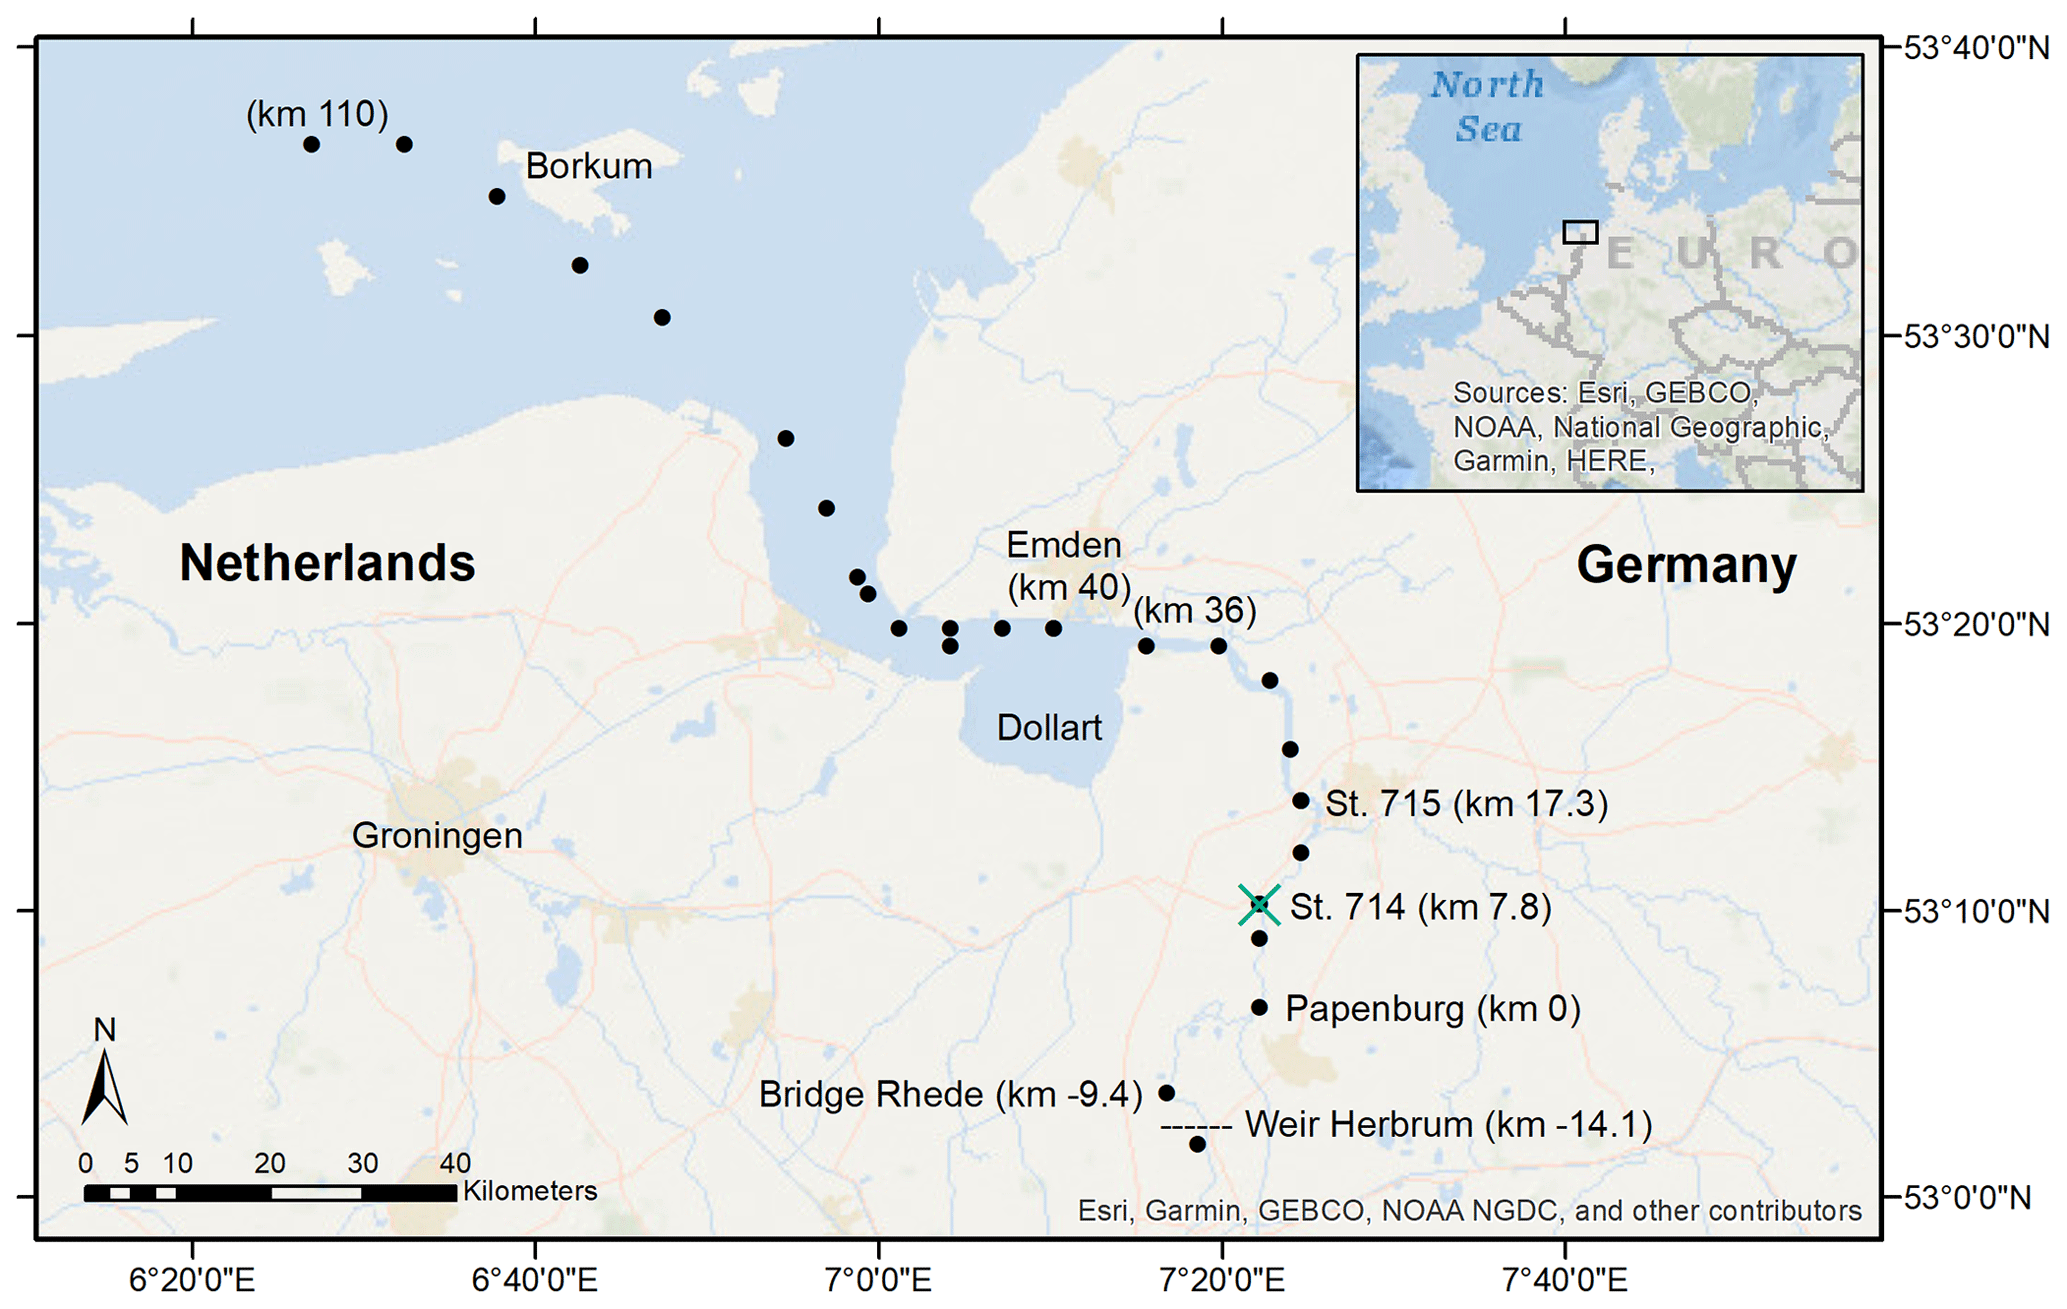
Figure 1Sampling stations in the Ems Estuary in June 2020. The vessel-based transect ended in Papenburg, corresponding to Ems stream km 0. We took samples at Bridge Rhede and upstream of the weir at Herbrum from shore. The transect sampling stations are marked with the black dots, the vertical profile station at Ems stream km 7.2 with the green cross. The tidal river reaches from the Herbrum weir downstream to Ems stream km 36 (the last station upstream of the Dollart).
A special characteristic of the present Ems Estuary is the section of fluid mud in the bottom layers of the tidal river that reaches on average the upper 40 km of the estuary (Becker et al., 2018; De Jonge et al., 2014; Talke et al., 2009). Fluid mud is highly concentrated in SPM and separated from the overlying pelagic water.
Transect water samples were collected on board the RV Ludwig Prandtl (LP20200602) along the salinity gradient, starting from the North Sea northwest of the barrier island Borkum, to the weir in Herbrum during ebb tide on 11 and 12 June 2020 (Fig. 1). We continuously collected surface water samples (1.2 m depth) using a bypass from the onboard flow-through FerryBox system (Petersen et al., 2011), which provided important physical parameters such as salinity, temperature, and oxygen. For initial river values, we took one sample upstream of the weir. A special focus is placed on the area of the tidal river that reaches from the Herbrum weir (at Ems stream km −14.1) downstream to Ems stream km 36 (last station upstream the Dollart).
For incubation experiments, we sampled fluid mud with the bottom water sampler at two stations (Ems stream km 7.8 and 17.3, named station 714 & 715, respectively) at ebb tide on 11 June 2020.
Additionally, vertical profile (VP) samples during ebb tide were provided by the German Federal Institute of Hydrology (Bundesanstalt für Gewässerkunde – BfG). These samples were taken at Ems stream km 7.2 on 17 June, 6 days after the surface transect sampling. Samples were taken from high tide to low tide, with vertical samplings started at 11:01 UTC+2 (named VP1), 12:29 (VP2), 13:58 (VP3), 15:00 (VP4), and 18:22 (VP5). Vertical profiles were measured at various depths, either directly with probes (salinity, temperature, oxygen, depth), or indirectly by discrete water samples (nutrients, isotopes). The deepest samples were always taken 0.5 m above the bottom. Oxygen concentrations, salinity, temperature, and depth were measured in situ with an YSI6660 EXO2 multi-parameter probe. Suspended particulate matter was determined gravimetrically (DIN 38 409-H2). Therefore, water samples of 0.2 to 1 L volume were filtered through pre-combusted (4 h, 450 ∘C), weighted GF/F filters, dried at 50 ∘C after sampling, and stored frozen until weighing (Röttgers et al., 2014).
2.2 TA and DIC
Along the transect, we sampled for TA and dissolved inorganic carbon (DIC) measurements by collecting 300 mL water with overflow into biological oxygen demand (BOD) bottles and preserving them with 300 µL saturated mercury chloride (HgCl2) to stop biological activity. Each BOD bottle was closed air bubble free with ground-glass stoppers coated in Apiezon® type M grease, and secured with a plastic cap. The samples were stored in a cool and dark place until analysis.
The parallel analyses of TA and DIC were carried out by using the VINDTA 3C (Versatile INstrument for the Determination of Total dissolved inorganic carbon and Alkalinity, MARIANDA – marine analytics and data), which measures TA by potentiometric titration and DIC by coulometric titration (Shadwick et al., 2011). To ensure a consistent calibration of both measurements, certified reference material (CRM batch # 187) provided by Andrew G. Dickson (Scripps Institution of Oceanography) was used.
2.3 Nutrients
Along the transect, water for nutrients was sampled with the FerryBox bypass, filtered over pre-combusted (4 h, 450 ∘C) GF/F filters, and stored frozen in 3 × 15 mL Falcon tubes.
The nitrate concentrations of the transect samples were analyzed with a continuous-flow automated nutrient analyzer (AA3, SEAL Analytical) and a standard colorimetric technique (Hansen and Koroleff, 2007). Samples were analyzed in triplicate.
The water for nutrient samples of the vertical profiles was pumped onboard, centrifuged, and the supernatant was measured back ashore. Samples of the vertical profiles were analyzed for nitrate, nitrite, and ammonium with a continuous-flow analyzer (Skalar SC 13900) at the German Federal Institute of Hydrology (BfG). The automated procedure for determining ammonia is based on the modified Berthelot reaction (Krom, 1980). The determination of nitrate and nitrite is based on the Griess reaction and measured after Kroon (1993).
To calculate horizontal nutrient consumption or production rates, we used the following equation:
where the differences Δ of nutrient concentrations (Δconc.), time (Δtime), and altitude (Δalt.) between the two deepest depths of the vertical profiles VP4 and VP5 were used to detect a nutrient consumption or production during the end of ebb tide.
2.4 δ15N and δ18O stable isotopes
Along the transect, water for stable nitrate isotopes was sampled with the FerryBox bypass, filtered over pre-combusted (4 h, 450 ∘C) GF/F filters, stored frozen in 100 mL PE bottles (acid-washed with 10 % HCl overnight), and analyzed by Schulz et al. (2022a). Vertical profile water samples provided by BfG were also analyzed for stable nitrate isotopes by using the denitrifier method (Casciotti et al., 2002; Sigman et al., 2001). The denitrifier method is based on a bacterial strain of Pseudomonas aureofaciens (ATCC#13985) that lacks nitrous oxide reductase activity and reduces nitrate and nitrite only to nitrous oxide and not further to N2. The product is then measured using an isotope mass spectrometer (Delta Plus XP, Fisher Scientific) coupled to a GasBench II.
In order to support the identification of pathways (e.g., Kendall et al., 2007), we calculated isotope effects (ε) for the deepest depth of the two last vertical profiles (VP4 & VP5), which showed the strongest nitrate decrease. We used an open-system approach assuming a steady state, and continuously supplied and partially consumed substrate, resulting in a linear relationship between the isotope values and the remaining fraction (f). The slope of the regression line corresponds to the isotope effect (ε), and (f) to the remaining fraction of substrate at time of sampling (Sigman et al., 2009).
where the δ15N (or δ18O)substrate is the delta value at the time of sampling, and δ15N (or δ18O)initial is the initial delta value at the surface in the beginning of each vertical sampling.
where C is the concentration of nitrate at time of sampling and Cinitial is the initial nitrate concentration at the surface in the beginning of each vertical sampling.
In addition, we measured stable isotopes of nitrite after the method of Böhlke et al. (2007), by using a bacterial strain of Stenotrophomonas nitritireducens (ATCC#BAA-12) that reduces nitrite to nitrous oxide. We used these data in order to quantitatively identify whether nitrite stems from organic matter (OM) and ammonium by nitrification, or from nitrate by denitrification.
2.5 Incubations for N2 determination and TA generation
Observed carbon and nitrogen data of incubation experiments in the fluid mud were combined to shed light on the interaction between TA generation and N2 production in the upper tidal river of the Ems Estuary.
In order to determine the N2 production and to detect the different isotopic N2 species 28N2, 29N2 and 30N2 in the bottom water of the Ems Estuary, we combined the N2 : Ar ratio measurements using a membrane inlet mass spectrometer (MIMS) (Kana et al., 1994) with the expanded (Risgaard-Petersen et al., 2003) isotope pairing technique (IPT) (Nielsen, 1992). The addition of the IPT allowed us to discriminate between denitrification and anammox as both pathways produce N2 (Risgaard-Petersen et al., 2003) and to calculate potential N2 production rates.
2.5.1 Incubation set-up
For the incubation experiment, we sampled fluid mud with a bottom water sampler at two stations low in surface oxygen (St. 714: ∼ 64 µmol O2 L−1; St. 715: ∼ 91 µmol O2 L−1) at ebb tide, and filled the sample of each station in a 1-L Schott bottle without headspace. To get the initial NO concentrations (St. 714: 137 µmol NO L−1; St. 715: 144 µmol NO L−1), we took samples before adding the 15N-NO tracer. After adding 30 mL 10 mM 15N-NO tracer (≥ 98 at. % 15N) stock solution, we closed the bottles bubble free with a rubber stopper for gentle mixing. For sampling, the rubber stopper was prepared with two cut pipettes: one to fill the exetainer (12 mL Labco Exetainer®), the other one to replace the outflowing water by air. The incubation ran in parallel replicates in Exetainers for 1, 4, 18, 28, and 43 h in total. The incubation time was adjusted to a parallel oxygen measurement by using a fiber-optic sensor and FireSting set-up (PyroScience GmbH) that started 1 h after labeling (at time step t1). At time step t1, the oxygen concentrations of the incubations were ∼ 11 µmol O2 L−1 at station 714, and ∼ 64 µmol O2 L−1 at station 715, providing almost anoxic conditions. To inhibit the incubation and preserve the samples, we injected approximately 100 µL 50 % zinc chloride (ZnCl2) through the septum into each exetainer.
For the carbon, i.e., TA generation data, we sampled two BODs out of the N2 incubation experiment of both incubation stations to estimate TA generation rates in the fluid mud. The TA and DIC sampling and analyses were performed in the same way as described above (Sect. 2.2). However, we preserved the first BOD directly after sampling (0 h) to get the start values, i.e., initial concentrations of TA and DIC, and the second BOD after 43 h at the end of the incubation, to ensure a comparison between the start and end point of TA and DIC along the incubation (BOD incubation).
2.5.2 N2 : Ar analysis with the MIMS
Samples for N2 measurements were analyzed with a GAM-200 quadrupole mass spectrometer (InProcess Instruments), which was connected to an in-house-built flow-through membrane inlet and a cryo-trap (liquid N2) to remove water vapor from the sample stream. The stable nitrogen isotopes were measured at a mass-to-charge ratio () 28 for 28N2, at 29 for 29N2, and 30 for 30N2, respectively. Argon was measured as the inert reference at 40 (Kana et al., 1994). The integration time was 0.5 s. To calculate the N2 concentrations, we used equilibrium values calculated after Hamme and Emerson (2004). We calibrated the sample measurements by using three different seawater standards (salinity of 20, 30, and 40) and MilliQ (0 salinity) equilibrated at 5 ∘C.
We calculated the various produced parameters based on the equations by Risgaard-Petersen et al. (2003) in which D28 (denitrification of 28N2) was calculated with their Eq. (17), D29 with their Eq. (16), D30 equals p30N2 (the produced 30N2 amount), A28 with their Eq. (18), A29 with their Eq. (19), P14 with their Eq. (4), and r14 equals the ratio of measured initial 14N-NO: added 15N-NO.
2.6 TA and N2 production coupling
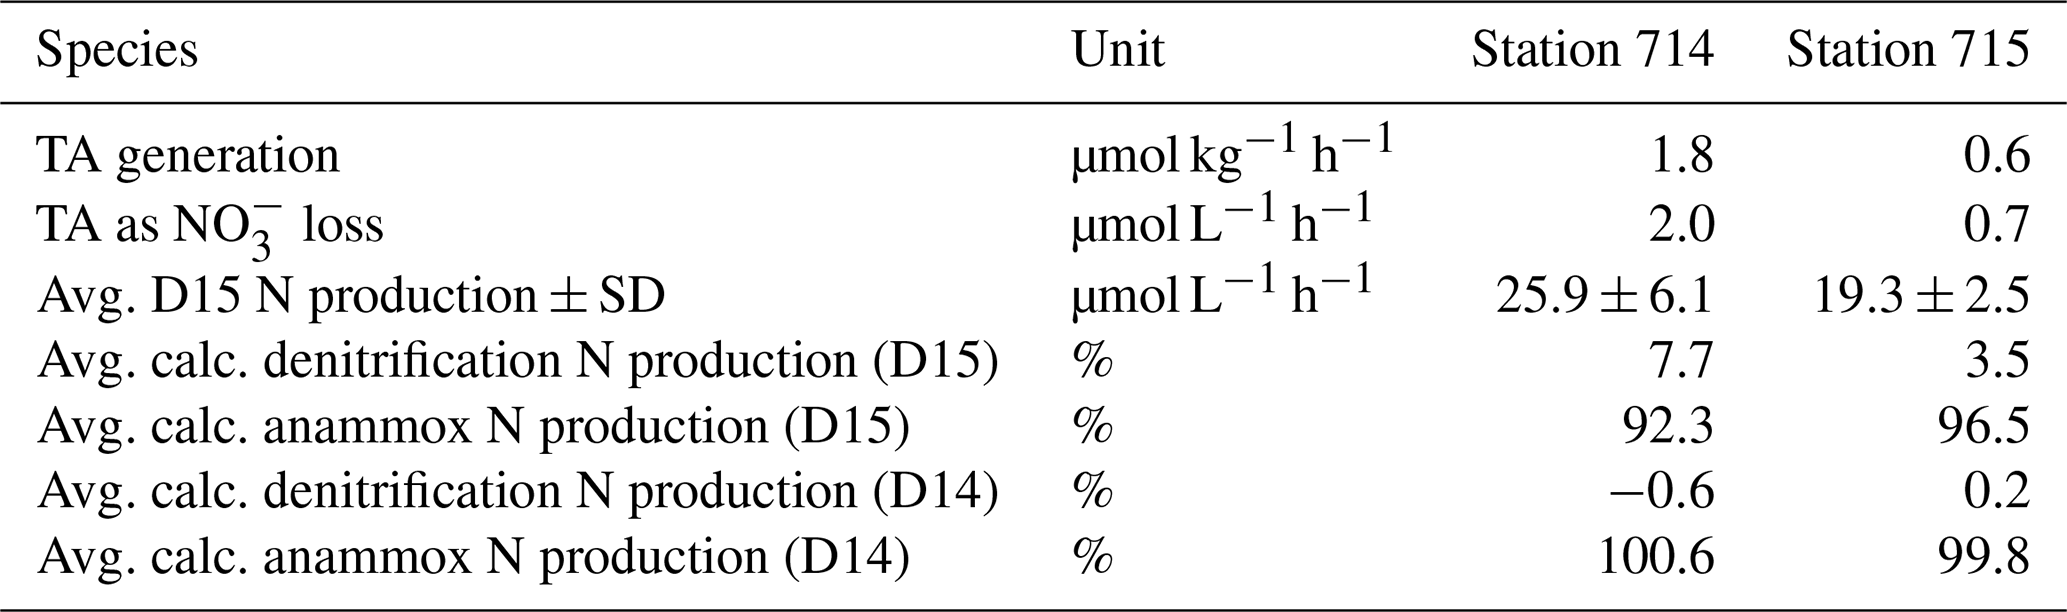
In order to shed light on the interaction between TA and denitrification, we compared the TA generation of the BOD incubation of each station with the average N2 production per station. We used the average TA increase of the BOD incubations, converted it to the equivalent maximum possible TA generation due to denitrification, and subtracted it from the total N2 production. To equalize TA generated by denitrification, we calculated the TA gain as the corresponding amount of nitrogen. For this, we used the ratio of 0.9 for TA generation by denitrification (Chen and Wang, 1999) and subtracted it from the total N2 production (Table 2). We assumed that the remaining produced N2 would be produced by anammox. By using this approach, we can estimate and prove the results of the IPT calculation, and discriminate potential N2 production pathways by denitrification and anammox.
2.7 Data analysis
The data analyses were performed by using RStudio Version 1.3.1073 ©2009–2020 RStudio, PBC, and the R packages “tidyverse,” “ggplot2,” “ggpmisc,” and “lmodel2.”
3.1 Carbon status in the estuary
The distribution of total alkalinity (TA) and dissolved inorganic carbon (DIC) ranged from 2357 µmol TA kg−1 and 2541 µmol DIC kg−1 upstream of the weir in Herbrum, over 2487 µmol TA kg−1 and 2671 µmol DIC kg−1 directly after the weir, to a maximum of 2662 µmol TA kg−1 and 2858 µmol DIC kg−1 at Ems stream km 7.8. After the maximum, TA and DIC decreased to values around 2394 µmol TA kg−1 and 2176 µmol DIC kg−1 in the North Sea (Fig. 2a). We observed maximum TA and DIC concentrations in the tidal river, and in a range between salinity 0 and 5. From the weir to the TA maximum at Ems km 7.8 (five sampling points), we observed a TA gain of 305 µmol kg−1.
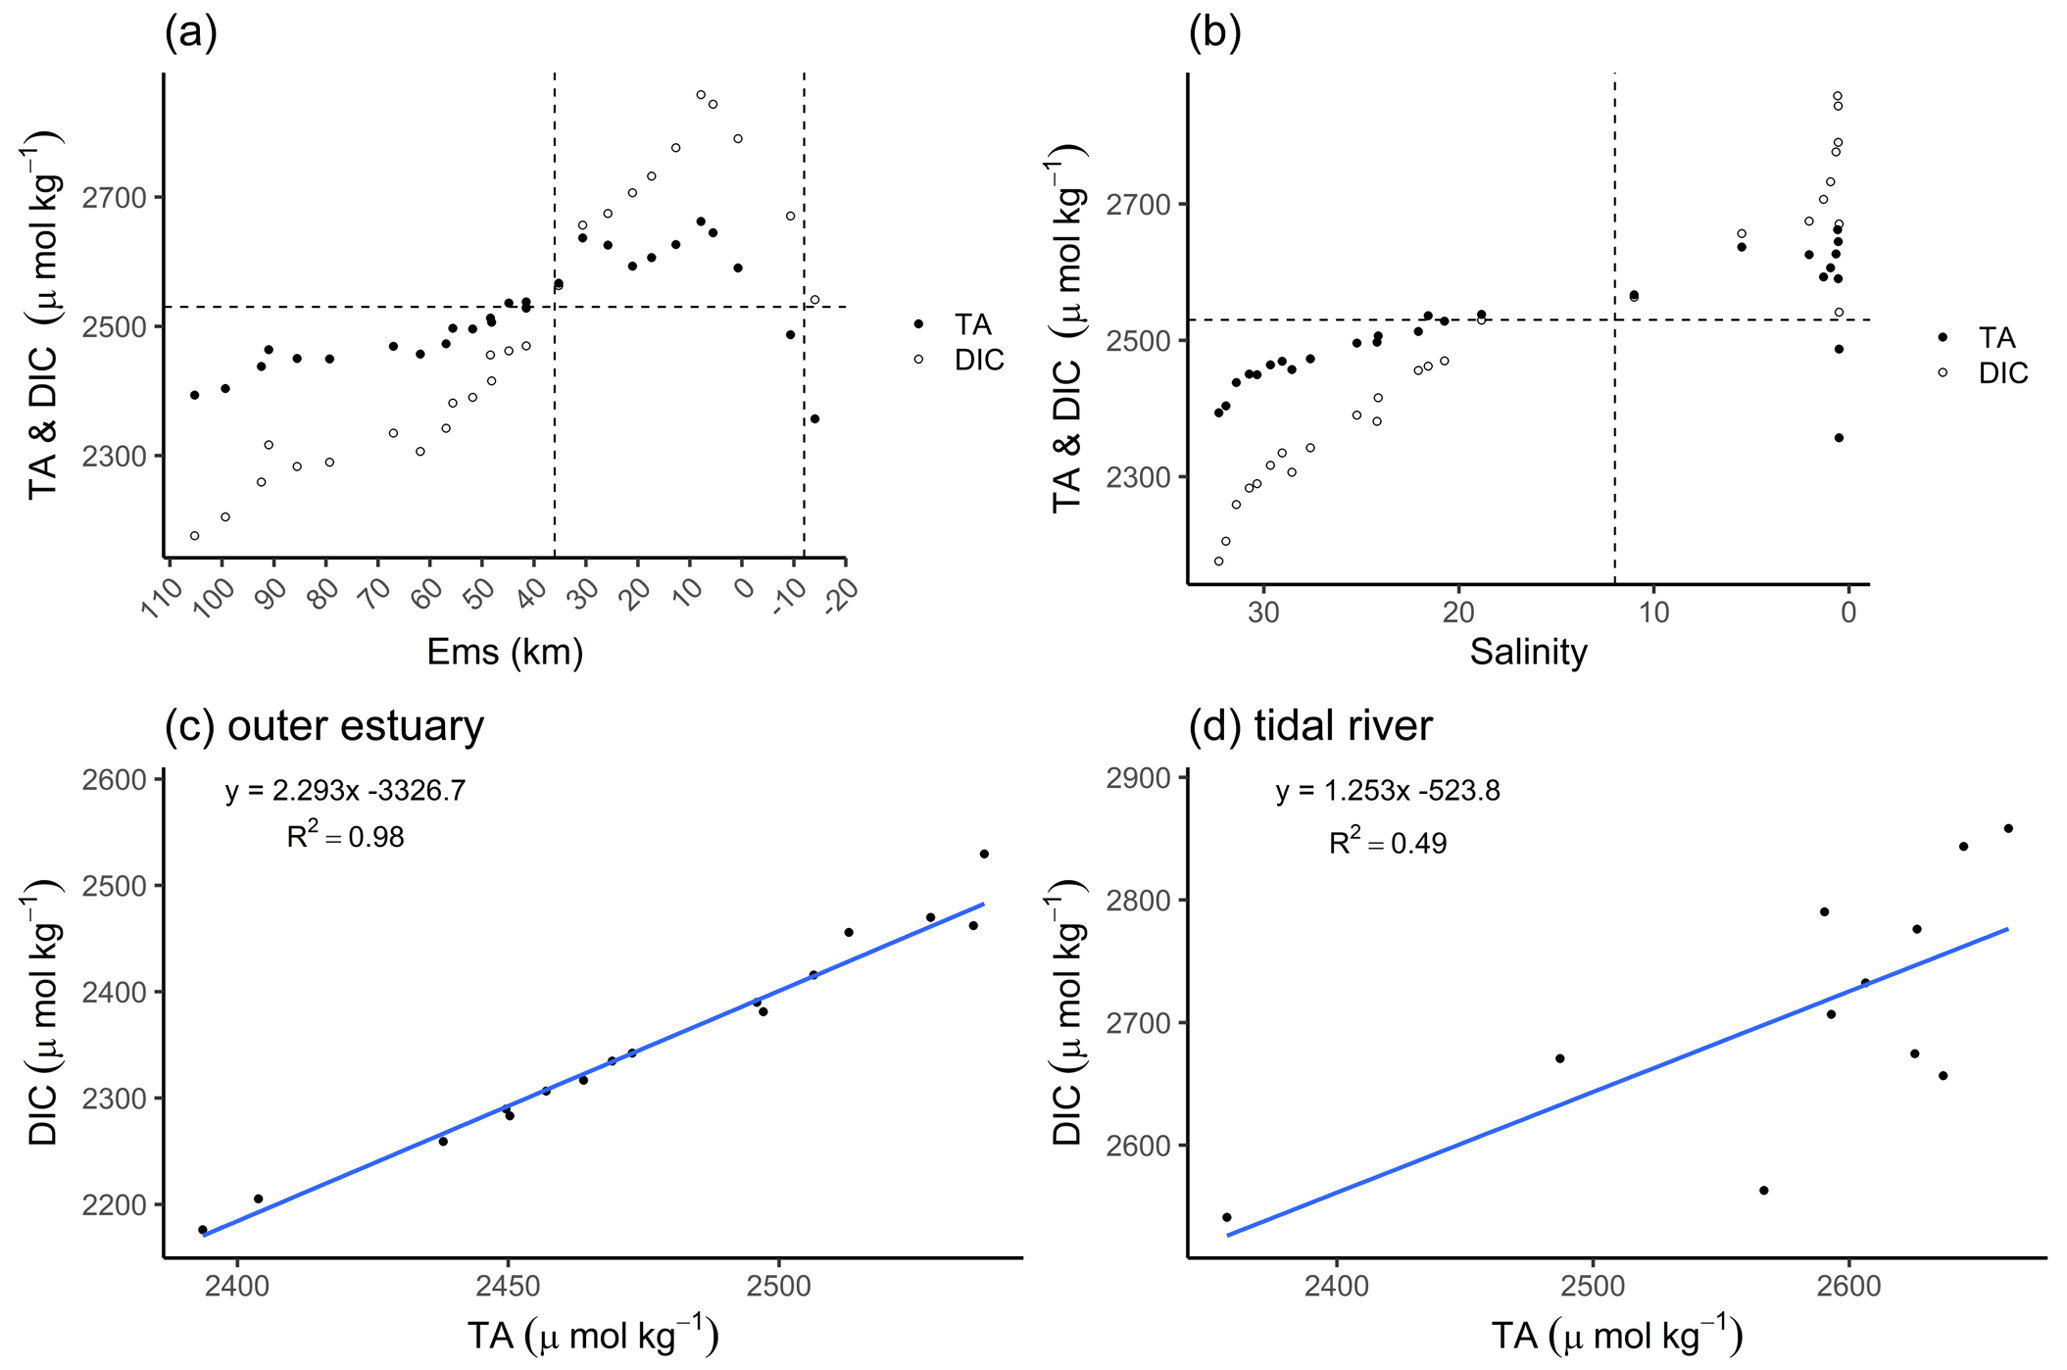
Figure 2Total alkalinity (TA) and dissolved inorganic carbon (DIC) concentrations. The TA (black dots) and DIC (white dots) distributions are shown along the Ems Estuary in (a) stream kilometer and (b) salinity. (a) The Ems stream km 110 is located around the barrier island of Borkum (North Sea), and the Ems stream km −20 is the area upstream of the Herbrum weir. The area between the weir and Ems stream km 36 is named tidal river and visualized between the two vertical dashed lines. (b) In the salinity plot, the tidal river is on the right side of the vertical dashed line between salinity 0 and 12. The plots in the second row show the relation between TA and DIC of the transect samples, in (c) the outer estuary from Borkum to Ems stream km 36, and in (d) the tidal river.
The concurrent range of salinity varied from fresh water (0.5 salinity) to a salinity of 32.31 in the North Sea. The temperature varied between 18 and 15 ∘C along the entire transect from the weir in Herbrum (fresh water) downstream to the North Sea. In the outer estuary between Ems stream km 37 and 110 (salinity > 15), TA and DIC slightly decreased with increasing salinity, indicating the stronger impact from the Ems also on downstream regions (Fig. 2a, b). The almost linear behavior of DIC and TA indicated that ongoing processes act proportionally on both species (Fig. 2c). We observed a clear deviation from linearity upstream of Ems stream km 36, i.e., in the tidal river (Fig. 2d). The R2=0.49 indicated that around 50 % of the DIC can be explained with TA, the remaining indicating other, likely oxic processes being responsible for the DIC increase. The DIC excess in the surface water of the tidal river indicated OM respiration (Wang et al., 2016) with high CO2 generation (Fig. 2d).
3.2 Nitrate assessment
3.2.1 Along the estuary
In a recent study, Schulz et al. (2022a) identified a dominance of denitrification with nitrification as an additional contributor in our focus area, the tidal river. They found δ15N values between 15 ‰ and 30 ‰ and suggested that these were caused by denitrification as the dominant process according to Kendall et al. (2007), visualized in Fig. 3a. Here, we can further distinguish the tidal river in two zones, in the upper tidal river (upstream of the weir to Ems stream km 8) and in the lower tidal river (downstream of Ems stream km 8 to Ems stream km 36). By using the data of Schulz et al. (2022a), we observed a strong enrichment in the delta values in the upper tidal river. Concurrently, we observed a maximum nitrate (NO) concentration upstream from the weir in the riverine fresh water with 182 µmol NO L−1 decreasing downstream to 149 µmol NO L−1 at Ems km 7.8. This indicated a NO loss of 32 µmol L−1 in the upper tidal river where TA had the strongest increase toward the maximum, suggesting denitrification as the nitrate respiration pathway. In the lower tidal river, a mixed signal of denitrification and nitrification is visible. The lighter delta values and the slightly increasing nitrate concentrations from Ems km 17 downstream indicated the occurrence of nitrification. In the salinity gradient, nitrate decreased to a common low marine concentration in the North Sea (Fig. 3a). Using the delta values, we calculated the slope of 0.485 between δ18O and δ15N (δ18O : δ15N) in the tidal river (Fig. 3b), which comes very close to the slope of 0.5 (Kendall et al., 2007; Schulz et al., 2022a) and supports the relevance of denitrification.
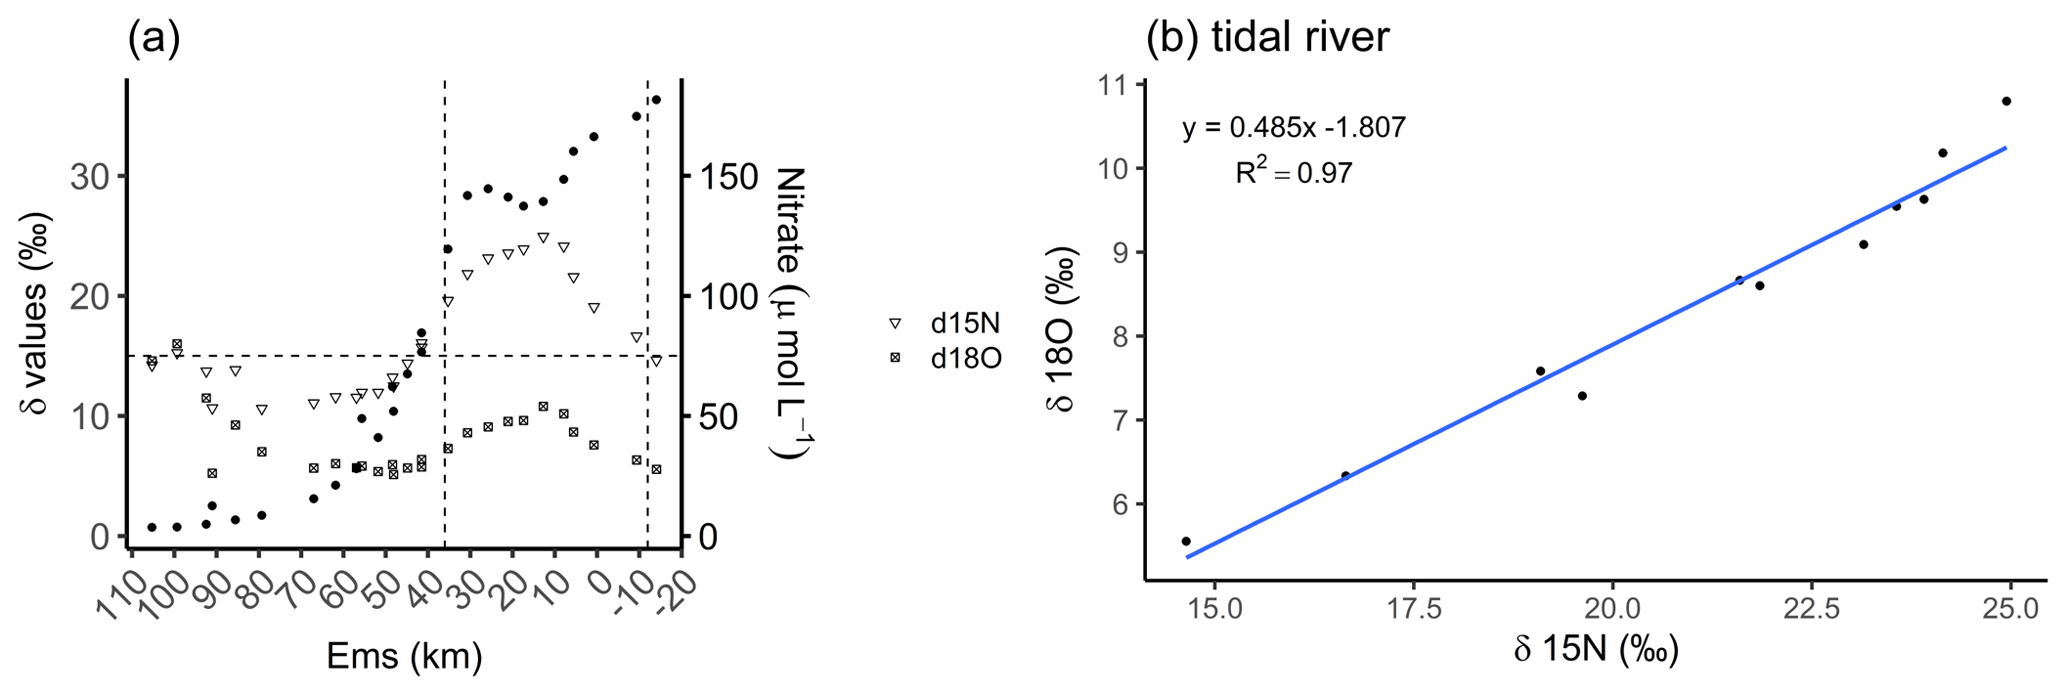
Figure 3Nitrate-based species distribution. (a) The delta values of the nitrate stable isotopes δ15N-NO (inverted triangle) and δ18O-NO (crossed square) and the nitrate concentration (filled dots) along the Ems Estuary stream kilometer. The Ems stream km 110 is located around the barrier island of Borkum (North Sea), and the Ems stream km −20 is the area upstream of the Herbrum weir. The area between the weir and Ems stream km 36 is named tidal river and visualized between the two vertical dashed lines. (b) The relationship between nitrate stable isotopes δ18O and δ15N in the tidal river (weir to Ems stream km 36). Data are from Schulz et al. (2022a), who measured and analyzed the samples and data.
3.2.2 Vertical profiles
Six days after the cruise, samples of five vertical profiles (VP1–VP5) were taken in the tidal river at Ems stream km 7.2 on 17 June during ebb tide. The water temperature varied between 19.5 and 21.3 ∘C and decreased with increasing depths (Fig. 4h). In the fresh water, the salinity varied slightly between 0.41 and 0.45 (Fig. 4i).
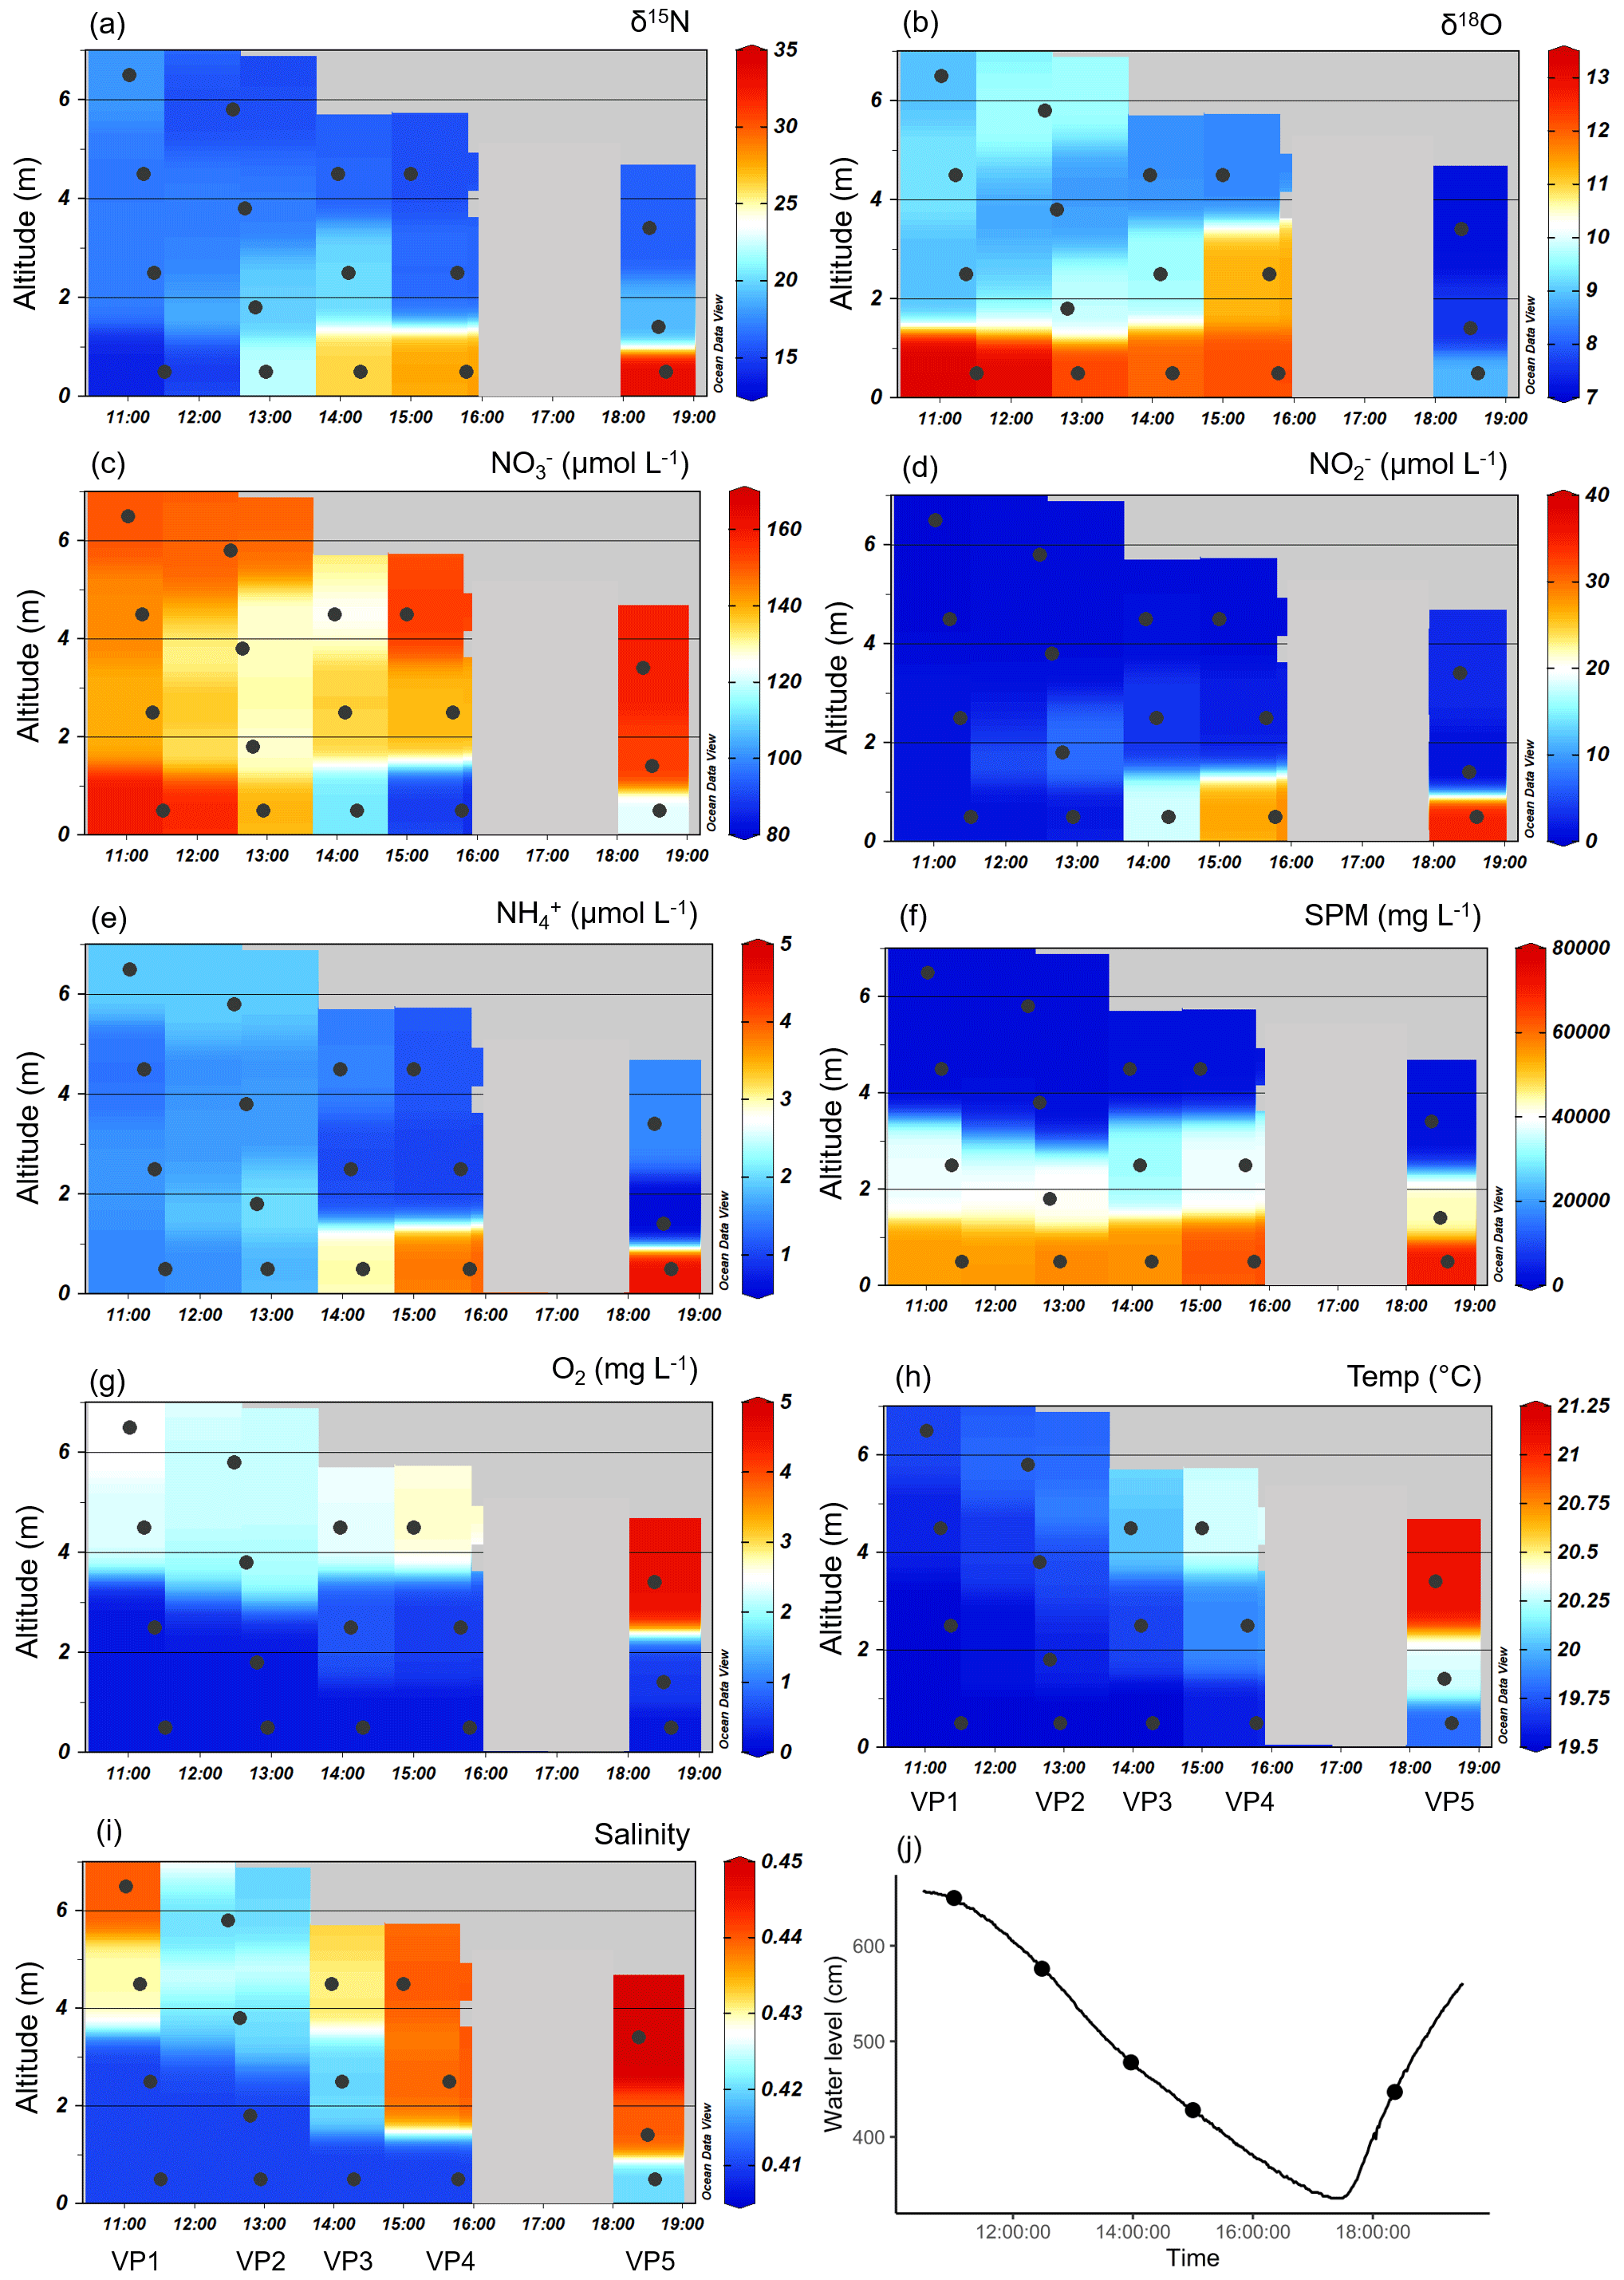
Figure 4Vertical profiles of the various parameters during ebb tide at Ems stream km 7.2 on 17 June 2020. Delta values of the nitrate stable isotopes (a) δ15N-NO and (b) δ18O-NO. Associated concentrations of (c) nitrate (NO), (d) nitrite (NO), (e) ammonium (NH), (f) suspended particulate matter (SPM), (g) oxygen (O2), (h) temperature, and (i) salinity. Ebb tide ran from the left to the right side of each plot, indicated by decreasing water depths, which are visualized as altitude (m). The vertical samplings started at 11:01 (named VP1), 12:29 (VP2), 13:58 (VP3), 15:00 (VP4), and 18:22 (VP5). The discrete samples are marked with dots, while the background values are gridded by using Ocean Data View. (j) The tidal height as water level (line) and the vertical profile samplings (dots) observed at Weener (Ems stream km 8).
The vertical differences in SPM led to differences in density, which caused the occurrence of vertical layering of the water masses. The SPM reached very high concentrations of over 40 g L−1 near the bottom, indicating that the fluid mud layer in the deepest 2 m is clearly separated from the overlying water (Fig. 4f). The separation of the water masses and a negligible effect of advection velocity is supported by the difference in flow speed at the surface (0.94 m s−1) and near the bottom (0.05 m s−1). In VP5, the increased water level and the increased values of temperature, salinity, and oxygen in the shallowest sampling point indicated the next upcoming high tide as water masses overflowing the bottom layers (Fig. 4g–j).
Dual nitrate isotope values indicated strong fractionation in the deep layers, with δ15N-NO values varying between 15 ‰ and 30 ‰ and δ18O-NO values between 5 ‰ and 15 ‰ (Fig. 4a, b). We observed the highest δ15N-NO values in the bottom water. δ18O-NO values increased strongly with depth in the first four samplings (VP1–VP4), but we observed a lower level of values toward the end of ebb tide. In particular, in the beginning of the upcoming high tide (VP5), the isotope values of δ18O were clearly lower than during ebb tide, both from surface to bottom and during the tidal cycle.
Decreasing oxygen concentrations toward the bottom favor denitrification with increasing depths (Fig. 4g). Although there may be more pathways, anoxia in the deepest layer facilitated anaerobic metabolic pathways such as denitrification and anammox. Overall, decreasing nitrate concentrations indicated a loss of nitrate in the bottom layer during the entire ebb tide (Fig. 4c). The associated vertical profiles of nitrite and ammonium both showed an increase with depth during the ebb tide. The highest nitrite concentrations were found in the bottom water (<2 m) with values between 15 and 30 µmol NO L−1 (Fig. 4d). Ammonium concentrations were up to 5 µmol NH L−1 (Fig. 4e).
By focusing on the two deepest depths, i.e., sampling points with the strongest nitrate losses of the vertical profiles VP4 and VP5, and assuming the two deepest sampling points of VP5 to be bottom layers with water masses still separated from the next upcoming high tide, we were able to calculate average horizontal nutrient loss or production rates toward the end of ebb tide (Eq. 1). Considering the differences in nutrient concentration, distance, and time, we detected an average nitrate loss rate of −4 µmol NO L−1 h−1 indicating an increasing nitrate consumption with ongoing ebb tide. At the same time, we determined average nitrite and ammonium production rates of 3.0 µmol NO L−1 h−1 and 0.4 µmol NH L−1 h−1, so that we observed higher nitrate loss than production of nitrite and ammonium.
In addition, we calculated the isotope effects (ε) of δ15N and δ18O (Eqs. 2, 3) as a linear regression for the two deepest depths of the vertical profiles VP4 and VP5. The isotope effects (ε) of VP4 were 34.2 ‰ for δ15N and 2.5 ‰ for δ18O, and of VP5 70.2 ‰ for δ15N and 6.4 ‰ for δ18O.
In order to quantitatively narrow down potential sources of nitrite in the vertical profiles, we used the stable nitrite isotopes. These δ15N-NO values revealed negative values in the first half of the ebb tide (VP1–VP3) (δ values of −6 ‰, −7 ‰, and −0.2 ‰), but strongly positive δ values (between 10 ‰ and 22 ‰) toward the end (VP4–VP5).
3.3 N2 production via denitrification and anammox
The vertical profile data suggest a strong fractionation during nitrate respiration. To quantify nitrate respiration, we determined N2 production in an incubation experiment of fluid mud from two stations in the tidal river.
Following Nielsen (1992), we identified average potential N2 production rates of added 15N-NO (D15) of 25.9 ± 6.1 and 19.3 ± 2.5 µmol N L−1 h−1 at stations 714 and 715, respectively (Table 1). At both stations, the N2 production (D15) increased during the incubation, with a slightly higher production at the more upstream station 714 (Fig. 5a, b). For the N2 production of in situ 14N-NO (D14), we only detected an increasing N2 production in the first 4 h for station 714, and a relatively stable production over the incubation time for station 715. It appears that N2 production from in situ 14N-NO (D14) at station 714 increased first, and then decreased after the first hours due to depletion of the initial pool of the lighter isotope 14N (Fig. 5b). Compared to station 715, we observed lower initial NO concentrations at station 714.
Table 1N2 production rates. N2 production rates of added 15N-NO (D15) and in situ 14N-NO (D14) calculated after Nielsen (1992). Denitrification rates of 28N (D28), 29N (D29), and 30N (D30), anammox rates of 29N (A29) and 28N (A28), and genuine 14N-N2 production (P14) calculated after Risgaard-Petersen et al. (2003). The potential contribution of anammox to total N2 production (ra) is presented as %. Rates were calculated with the linear regression of the respective concentration as a function of the entire incubation time indicated by the slope, which was used to calculate average values. The ra range shows the average minimum and maximum ra values of the incubation based on the two replicates. Because we only had one initial N2 : Ar ratio for each station, we used this as a start value for the second replicate too.
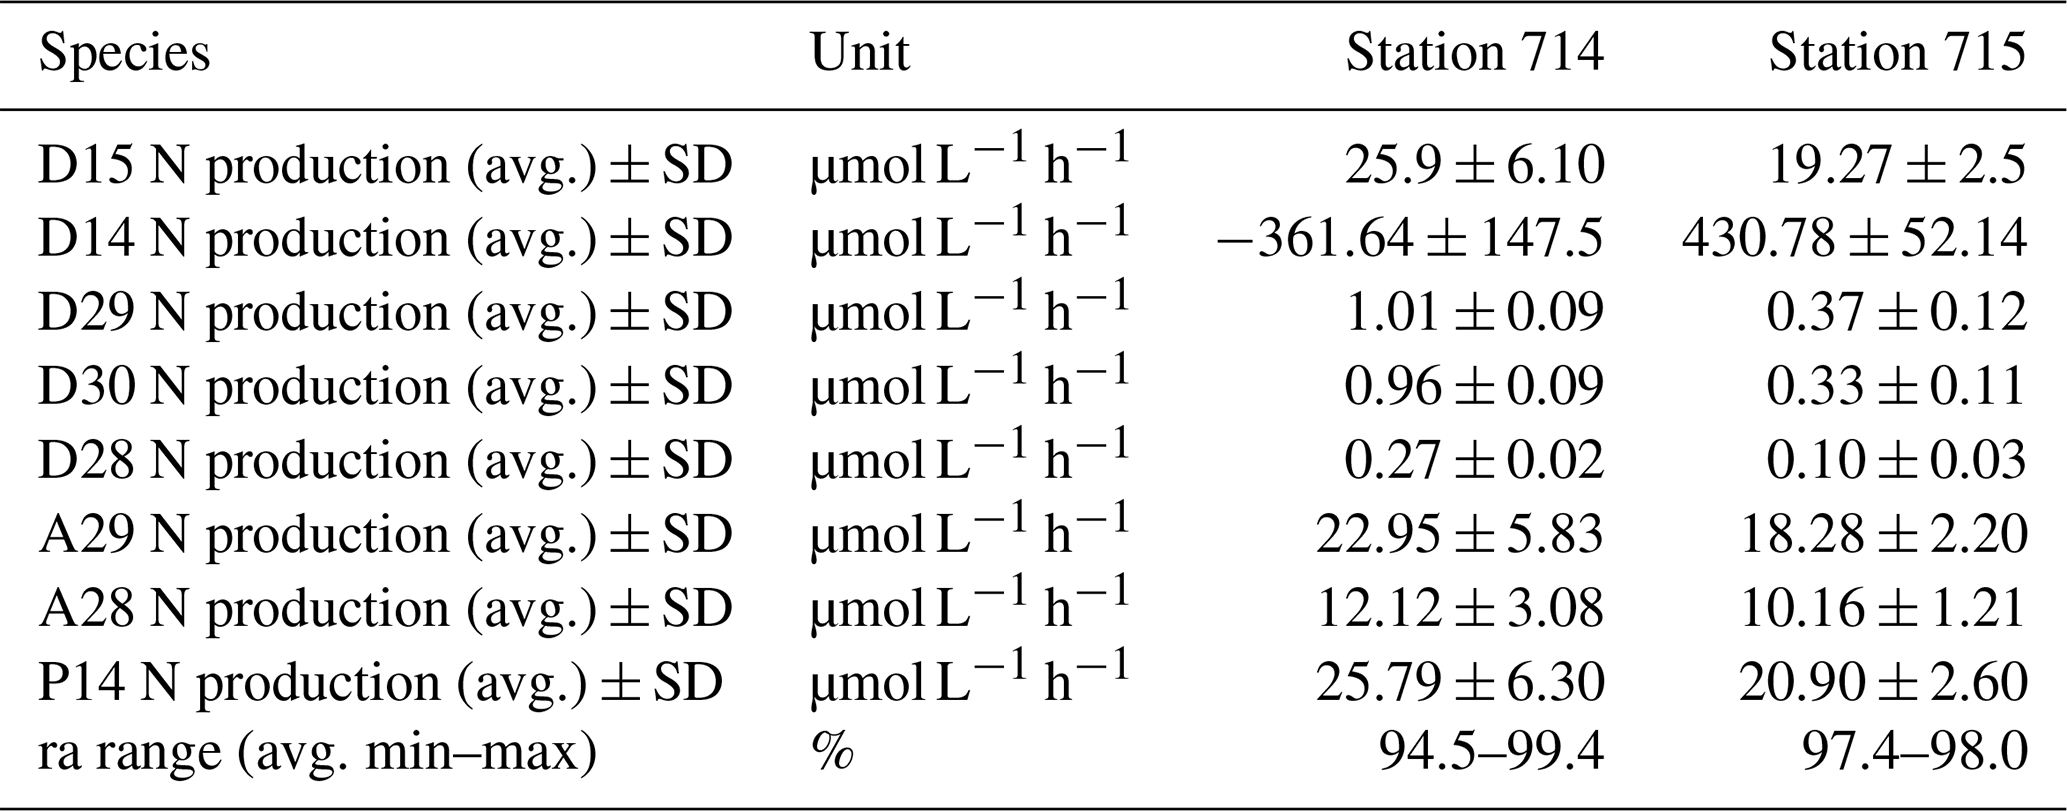
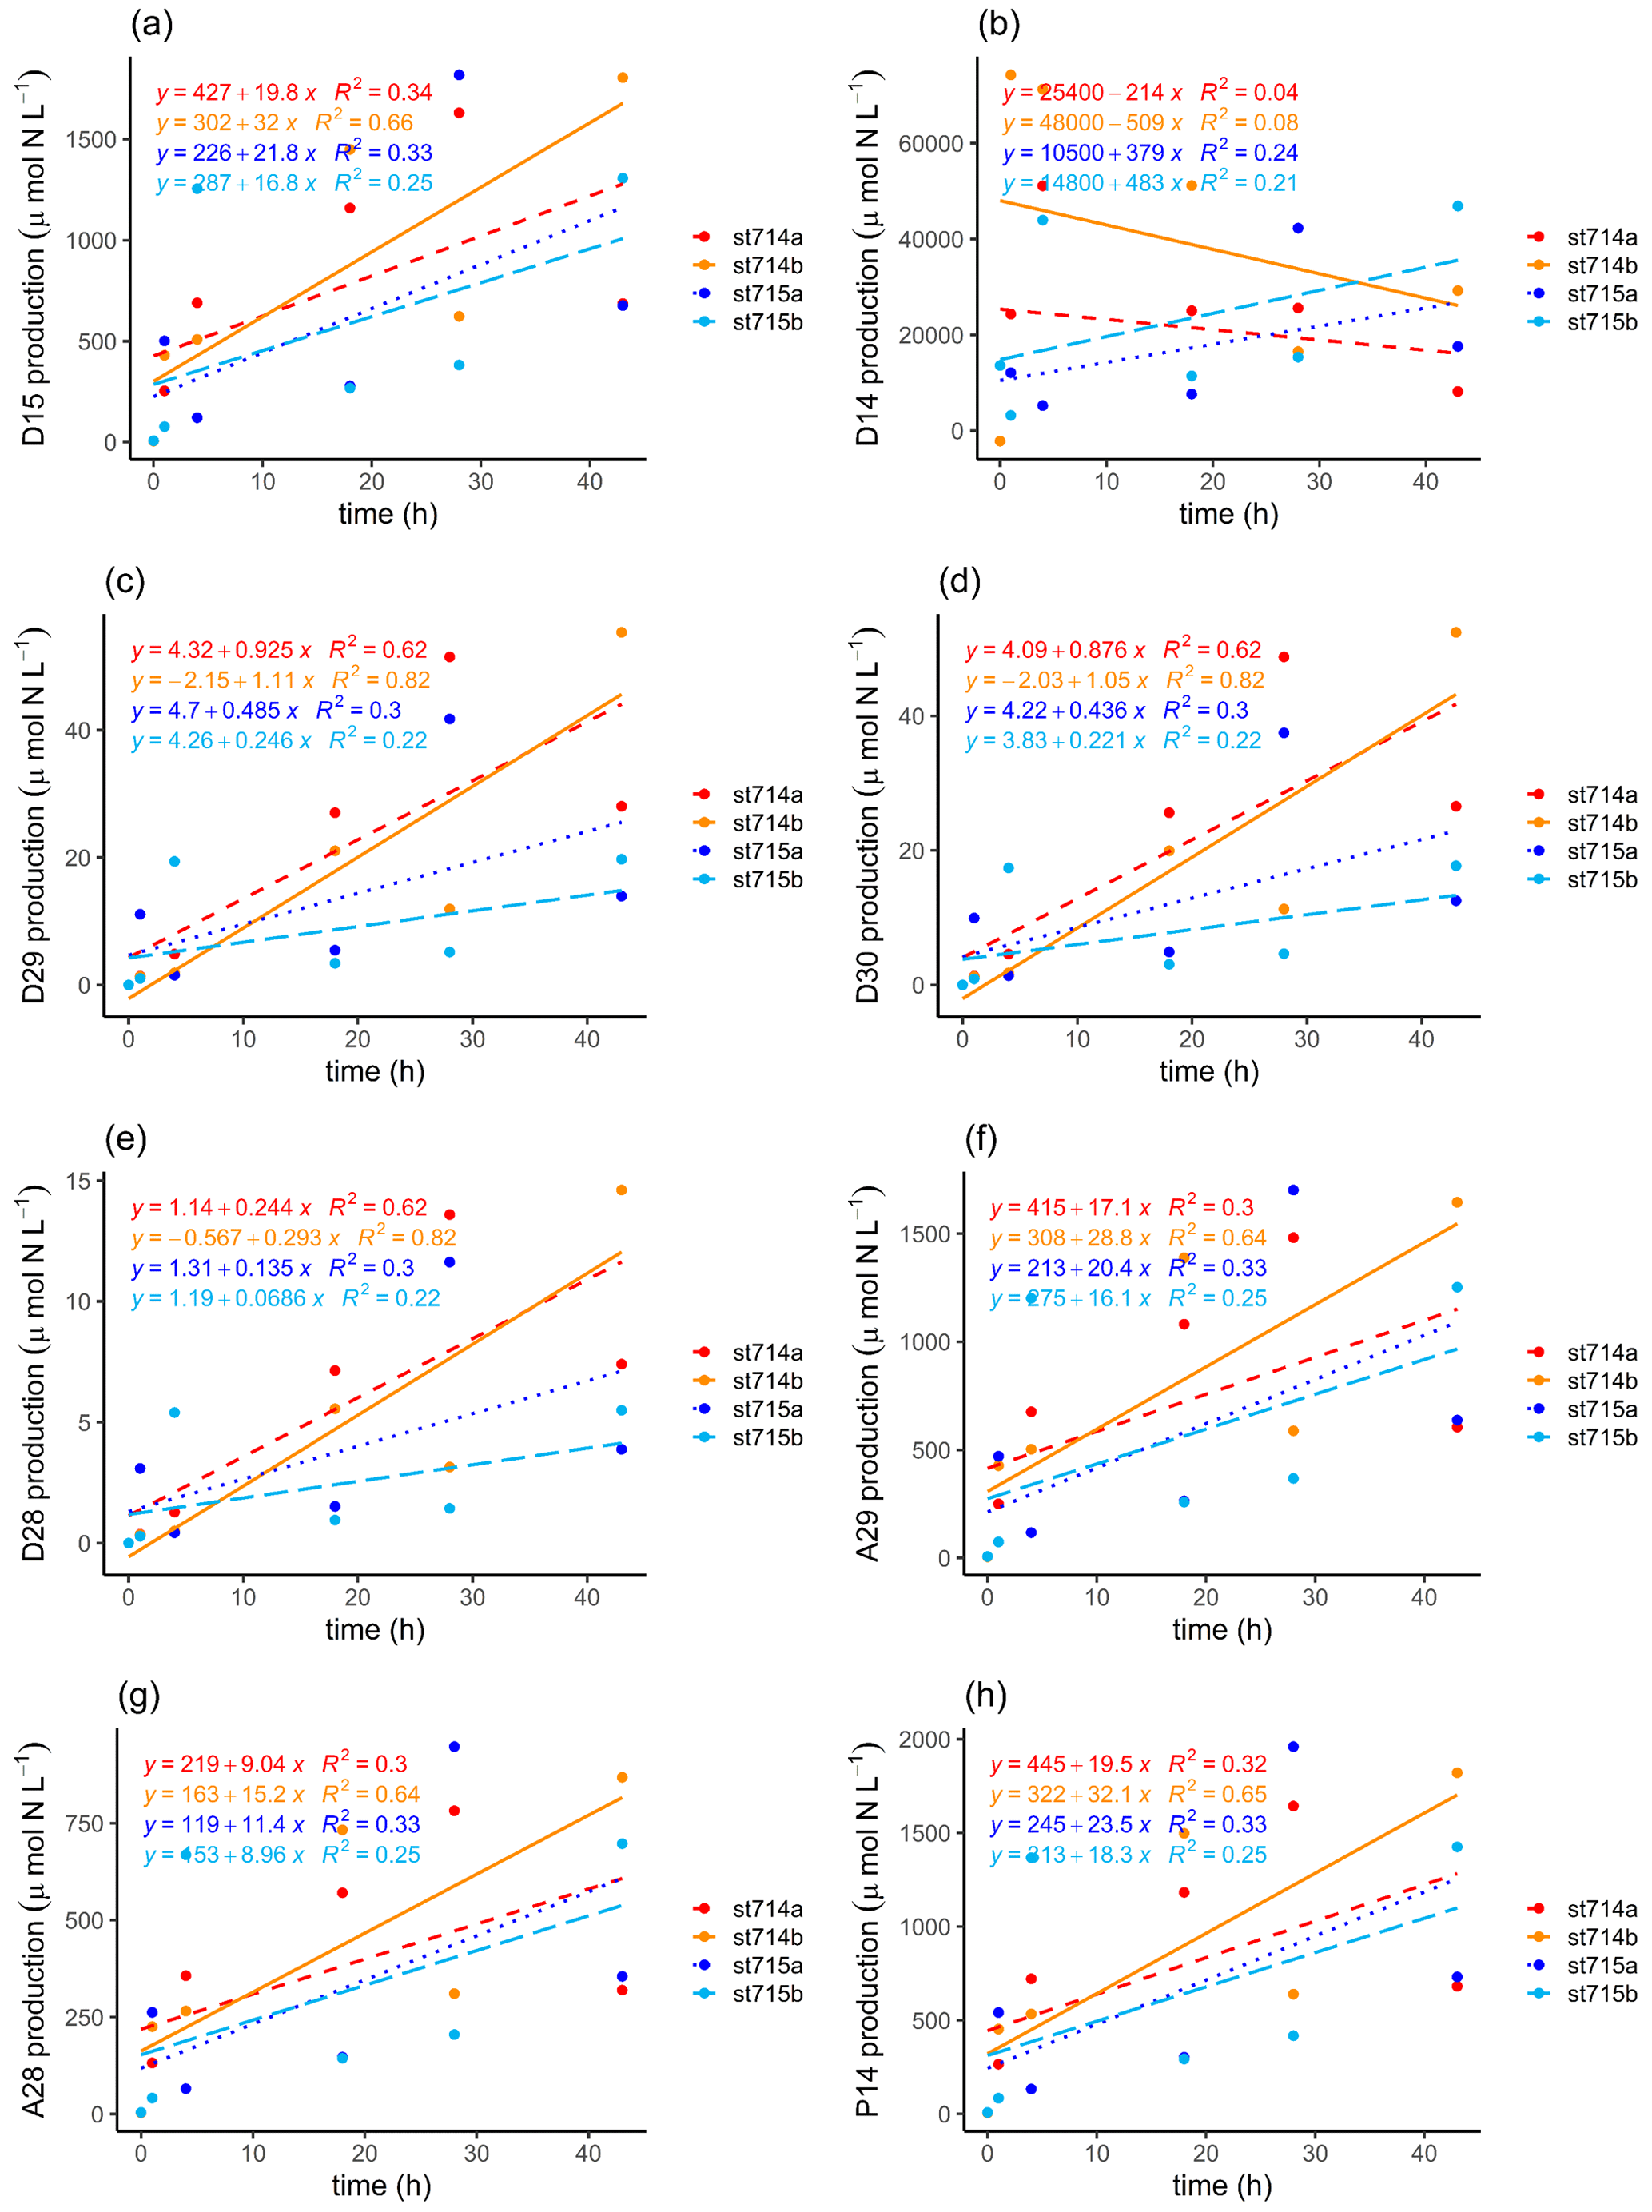
Figure 5N2 production during the incubation. N2 production calculated after Nielsen (1992) of (a) added 15N-NO (D15) and (b) in situ 14N-NO (D14). N2 production calculated after Risgaard-Petersen et al. (2003) via denitrification of (c) 29N2 (D29), (d) 30N2 (D30), (e) 28N2 (D28), and via anammox of (f) 29N2 (A29), and (g) 28N2 (A28). (h) Estimation of the genuine 14N-N2 production (P14) during the incubation after Risgaard-Petersen et al. (2003). Two replicates of each station are given, with station 714a (dashed red line) and 714b (solid orange line), and station 715a (dotted dark blue line) and 715b (long dashed light blue line). The slope of the linear regression indicates the production rate of the respective N2 production as a function of incubation time. Because we only had one initial N2 : Ar ratio for each station, we used this as a start value for the second replicate too.
In order to discriminate the relative contribution of denitrification vs. anammox in the incubations, we combined the N2 : Ar ratio measurements with the IPT after Risgaard-Petersen et al. (2003). Potential N2 production rates were calculated with the linear regression of the respective concentration as a function of time during the incubation, as indicated by the slope (Fig. 5c–h, Table 1). N2 production increased with increasing incubation time via both anaerobic pathways. We calculated a potential N2 production by anammox of 10.16–22.95 µmol L−1 h−1, which is an order of magnitude higher than the production by denitrification (0.10 to 1.01 µmol L−1 h−1, Table 2).
Table 2Carbon and nitrogen (N) values of the incubation experiment. TA generation is the rate of TA generation in the BOD incubation. TA as NO loss is the consumed NO that correspond to the amount TA generated (equated with denitrification) recalculated with 0.9. D15 N production is the total produced amount of added 15N-NO after Nielsen (1992) and calculated as the slope of a linear regression of the produced 15N2 concentration as a function of the entire incubation time. Calc. denitrification N production and calc. anammox N production are the estimated amount of added 15N-NO that was produced by denitrification and anammox, respectively. The estimation based on the approach of combining TA and the N2 production calculation after Nielsen (1992). We assumed the N2 produced by anammox as the remaining amount N2 that was not produced by denitrification. The standard deviation as sample variability is given if possible as ± SD. Average values were calculated of two replicates.
3.4 TA incubation in BODs
In order to estimate the increase in TA in fluid mud and calculate potential TA generation rates, we used the BOD incubations. In these samples, TA was higher than in surface samples (Fig. 6), with initial concentrations for TA and DIC > 3000 µmol kg−1. During the incubation, we measured increasing TA and DIC concentrations in both stations from the start (0 h) to the end (43 h). At station 714, TA increased from 3300 to 3378 µmol TA kg−1 and DIC from 3337 to 3435 µmol DIC kg−1. By contrast, station 715 had somewhat lower values, with TA increasing from 3168 to 3196 µmol TA kg−1 and DIC from 3303 to 3340 µmol DIC kg−1. We used the increasing difference to calculate potential generation rates for station 714 of 1.8 µmol TA kg−1 h−1 and 2.3 µmol DIC kg−1 h−1, and for station 715 of 0.7 µmol TA kg−1 h−1 and 0.9 µmol DIC kg−1 h−1 (Table 2).
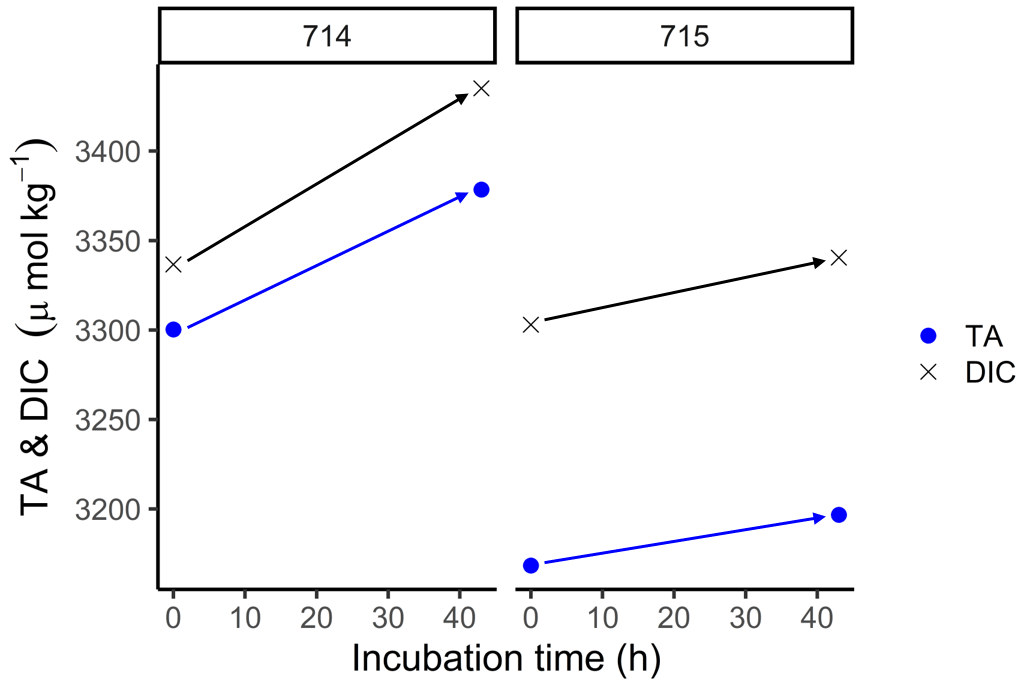
Figure 6BOD incubations. The start (0 h) and end (43 h) concentrations of total alkalinity (TA) (blue dots) and dissolved inorganic carbon (DIC) (black crosses) of the BOD incubation samples from station 714 and 715, respectively.
4.1 TA generation and nitrate respiration in the estuary
In comparison to the North Sea with TA and DIC values ranging around 2400 µmol TA kg−1 and 2100 µmol DIC kg−1 (Thomas et al., 2004), and other German estuaries such as the Elbe Estuary with average values around 2000 µmol kg−1 (Amann et al., 2015; Brasse et al., 2002; Norbisrath et al., 2022), the TA and DIC concentrations in the Ems Estuary were clearly higher with values between 2400 µmol kg−1 and 2900 µmol kg−1. In particular in the fluid mud, TA and DIC concentrations exceeded the water column concentrations of the Ems Estuary and adjacent zones with values <3000 µmol kg−1. Thus, the upper Ems Estuary and especially the fluid mud is a clear source of TA, probably driven by anaerobic pathways.
To identify nitrate sinks, nitrate isotopes are frequently used (e.g., Kendall et al., 2007; Middelburg and Nieuwenhuize, 2001; Sigman et al., 2001). According to Kendall et al. (2007), δ15N values between 15 ‰ and 30 ‰ suggest denitrification as the dominant pathway, which is an important sink for anthropogenic nitrate and the global nitrogen budget. In a recent study, Schulz et al. (2022a) identified three distinct biogeochemical zones along the Ems Estuary with different predominant nitrogen cycling pathways based on water column properties and stable isotopes. In our focus area, the tidal river, Schulz et al. (2022a) found a dominance of denitrification, with nitrification as an additional contributing pathway in the downstream part.
In addition to the assessment along the estuary, we investigated five vertical profiles at Ems stream km 7.2 in the tidal river during ebb tide. They allowed us to scan and detect vertical differences in the water column. The hydrographic properties such as temperature, salinity, and SPM confirmed the clear stratification of the fluid mud in the Ems Estuary.
In accordance with the transect data, the observed vertical delta values of nitrate also indicate strong fractionation in all depths supporting denitrification to occur in the water column. The occurrence of denitrification in the water column of the tidal river is also supported by the isotope effects (ε). The isotope effect of δ15N (34.2 ‰) of VP4 came close to the range for water column denitrification that can vary between 20 ‰ and 30 ‰ (Sigman and Casciotti, 2001), the isotope effect of δ15N (70.2 ‰) of VP5 was very high and exceeded this range by far. While we do not have an explanation for this unexpectedly high isotope effect, it is clear that strong fractionation acts on nitrate isotopes, and denitrification and anammox both are known to coincide with significant effects (Brunner et al., 2013; Casciotti et al., 2003; Granger and Wankel, 2016; Mariotti et al., 1981; Sigman and Casciotti, 2001). Noticeable are the lower δ18O values in both vertical and horizontal directions, with δ18O isotope effects of 2.5 ‰ of VP4 and 6.4 ‰ of VP5, respectively. We observed a lower fractionation of δ18O than δ15N. Interestingly, Dähnke and Thamdrup (2016) found that anammox activity can lead to a decoupling of N and O isotope effects, and that the oxygen isotope effect of nitrate consumption can even be reversed, which matches our findings. Thus, we speculate that the decrease in δ18O values might point toward anammox activity in the fluid mud.
The observed vertical loss of nitrate revealed a nitrate consumption due to water column denitrification and/or nitrate reduction to nitrite (Fig. 4c). High nitrate concentrations were present during the entire tide and provided sufficient substrate for N2-producing pathways.
Nitrite concentrations increased with depth to maximum concentrations (>30 µmol L−1) in the deepest layer, which is the intermediate product of either nitrification or denitrification. In the light of decreasing nitrate and oxygen concentrations in the water column, and anoxic conditions in the fluid mud, we rather expect nitrate respiration as the source of nitrite in the deeper layers. In addition, the vertical nitrate loss being higher than nitrite production suggests that nitrite production is fueled by denitrification of nitrate. In order to qualitatively investigate the nitrite sources and support our aforementioned results, we used the nitrite stable isotopes. The observed lighter, negative δ15N-NO values in the first half during ebb tide point toward nitrification (ammonia oxidation) as a source for nitrite, which is an aerobic pathway occurring in the more oxygenated upper water layers during high tide. By contrast, the observed change from the earlier light δ15N-NO in the first half during ebb tide to heavy, positive δ15N-NO values in the anoxic deeper layers at nearly ebb tide indicates a change in reaction pathways. The heavy, positive δ15N-NO values were similar to the observed δ values of nitrate, and are more indicative of nitrate, indicating denitrification as the main source of nitrite. Ultimately, this leaves the newly produced nitrite to then be accessible for either denitrification or anammox.
The combination of the high concentrations of nitrite and also ammonium in the deepest layer suggest OM degradation as a potential source of nitrite and ammonium (Blackburn and Henriksen, 1983). The occurrence of such high concentrations of nitrite and ammonium provides sufficient substrate for anammox. The strong stratification of the fluid mud with anoxic conditions facilitates the occurrence of anaerobic N2-producing pathways in the bottom water of this highly turbid estuary.
We further performed an incubation experiment with fluid mud, and were able to discriminate between N2 production by denitrification and anammox. When calculating N2 production according to Risgaard-Petersen et al. (2003), we found that more than 90 % of N2 in the fluid mud at both stations and each time step (Table 2) must originate from anammox (ra).
4.2 TA and N2 production coupling
The coupling of TA and N2 production in the tidal river of the Ems Estuary can be used to locate the most active area for TA generation and link part of the increase to water column denitrification. We were also able to identify nitrate/nitrite consumption in the fluid mud and discriminate between denitrification and anammox. In the following, we combined TA generation and nitrate respiration pathways three ways: firstly, for the transect surface samples; secondly, for the vertical profiles of the water column; and thirdly, for the fluid mud.
Stable nitrate isotopes in surface samples of the present Ems Estuary transect revealed denitrification (Schulz et al., 2022a) as the dominant pathway in the inner estuary in the tidal river (weir to Ems stream km 36). The observed denitrification activity matches with the observed increased TA values in this area. However, the general TA gain between upstream of the weir and the TA maximum at Ems stream km 7.8, the upper tidal river, was much higher than the concomitant nitrate loss. We assume that parts of the TA gain were generated by denitrification, but that also other metabolic anaerobic pathways or CaCO3 dissolution could generate TA in the water column of the tidal river of the Ems.
In the vertical water column profiles, we observed decreasing nitrate concentrations indicating nitrate consumption with depth. In combination with the low oxygen concentrations that also decreased with depth, and the increasing delta values with depth (Fig. 4), we suggest that denitrification appeared in the water column, in particular in the deeper layers, generating TA as a byproduct. The decreasing nitrate and oxygen concentrations and the increasing delta values suggest that high denitrification activity frequently occurred toward the bottom.
The fluid mud is indicated by strong vertical gradients of most of the observed parameters in the deepest 1 m and suggest a strong separation from the upper water column. In particular in the last sampling (VP5), the substantial nitrate consumption resulted in a significant increase of δ15N values of the remaining nitrate pool. Ongoing denitrification binds H+ ions, and thus increases TA values. We indeed observed higher TA concentrations in the fluid mud than in the water column and suspect that at least some TA is generated by denitrification in the deepest layers.
In order to further shed light on the pathways in the fluid mud, we combined the BOD incubation with the N2 production experiment. Assuming that all TA generation in the BOD incubation containing fluid mud was due to denitrification, which occurred in the deeper layers, we related the TA increase from the BOD incubation to N2 generation according to Nielsen (1992), and thus estimated N2 generation by denitrification.
Given a TA generation by denitrification with a ratio of 0.9 (Chen and Wang, 1999), we calculated theoretical denitrification rates based on TA generation and compared the results with total N2 production of D15 based on Nielsen (1992) (Table 2). We found that a large fraction of N2 production could not be attributed to denitrification. Based on this mismatch, it appears that 90 % of the N2 production stems from anammox, which is neutral with regards to TA generation (Middelburg et al., 2020). The dominance of N2 production by anammox in the fluid mud (90 % N2 production) is supported by the IPT calculation after Risgaard-Petersen et al. (2003).
It is intriguing that we find such a high contribution of anammox in a heterotrophic estuary. Traditionally, anammox has been associated with deep sediments that are poor in OM and have low oxygen consumption rates (Dalsgaard et al., 2003; Engström et al., 2005; Kuypers et al., 2003; Thamdrup and Dalsgaard, 2002).
Other studies that focused on estuarine and coastal regions also found a clear contribution of anammox, albeit in a much lower range. For instance, in the Thames Estuary (UK) the occurrence of anammox was observed to be much lower contributing to <10 % of the N2 production (Trimmer et al., 2003). Similar low values were observed during summer in the Randers Fjord in Denmark (Risgaard-Petersen et al., 2004), in estuarine and coastal sites in Rhode Island in the USA (Brin et al., 2014), and in the subtropical Logan River in Australia (Meyer et al., 2005). While in Chesapeake Bay (USA) a 2 times higher maximum contribution of anammox to N2 production (22 %) was observed by Rich et al. (2008).
But what can be the cause for the dominance of anammox that we find at our study site?
Anammox correlates with high concentrations of NO in the overlying water and high organic carbon content (Nicholls and Trimmer, 2009; Trimmer et al., 2003), which were both present in the tidal river of the Ems Estuary. Dalsgaard et al. (2012) also pointed out the correlation of higher anammox rates at stations with higher ammonium concentrations (close to 5 µmol L−1) and relatively high turbidity in the work of Hamersley et al. (2007) and Lam et al. (2009). In the tidal river of the Ems, and in particular in the fluid mud (Fig. 4), we also observed high concentrations of ammonium, providing sufficient substrate for anammox.
In addition, the reactivity of the OM can affect anammox (Engström et al., 2005; Trimmer et al., 2003). Engström et al. (2005) identified that in particular fresh and reactive OM favors denitrification, whereas old unreactive OM correlates with higher anammox rates. The reason is probably the difference in maximum growth rates, which favors fast-growing denitrifying bacteria over slow-growing anammox bacteria when available substrate is abundant (You et al., 2020 and references therein). Interestingly, Schulz et al. (2022a) found high C : N ratios in this river section, and postulated a low OM reactivity there. Thus, it is plausible that OM in the fluid mud is mostly refractory, because fresh imported OM is already degraded in the water column above the fluid mud, or in the middle reaches of the estuary before reaching the riverine part of the estuary. The DIC excess in relation to TA supports OM degradation (Wang et al., 2016) in the overlying water. This would be in line with the stratification that we found, which separates the fluid mud from the overlying water (Fig. 4). In this case, denitrifier growth and thereby denitrification may be limited by the low reactivity of the OM. This unique niche characterized by high availability of nitrate, nitrite, and ammonium, recalcitrant OM, and low oxygen enables anammox to gain importance in the Ems Estuary.
We showed that both denitrification and anammox occurred in the deeper layer of the tidal river, but suggest that anammox is the major N2-producing pathway in the fluid mud.
In the highly turbid inner Ems Estuary, we observed TA and DIC concentrations being higher than in the North Sea with both values between 2400 and 2900 µmol kg−1, indicating the estuary as a source of TA. Denitrification occurred in the water column of the tidal river, where we also detected the highest TA concentrations. This led us to assume that denitrification is the source for at least some of the generated TA. However, since the TA gain is much higher than the nitrate loss, we suggest that CaCO3 dissolution or anaerobic pathways other than denitrification could also generate TA in the water column of the tidal river.
In the incubation experiment, denitrification rates as identified according to Risgaard-Petersen et al. (2003) were low and anammox contributed >90 % to potential N2 production. Based on the assumption that all TA was generated by denitrification in the fluid mud, we were able to discriminate the N2 production pathways in the high turbidity part of the estuary. Supported by the N2 production calculations according to Risgaard-Petersen et al. (2003), we were able to show that anammox was the major N2 production pathway in the fluid mud of the tidal river in the Ems Estuary. Denitrification played a subordinate role and was only relevant in deeper layers of the water column, and denitrification was clearly outcompeted by anammox.
The carbon data set is available at https://doi.org/10.1594/PANGAEA.962184 (Norbisrath and van Beusekom, 2023). The data set of the study by Schulz et al. (2022a) is available at https://doi.org/10.1594/PANGAEA.942222 (Schulz et al., 2022b).
MN did the sampling, sample measurement and analyses, and the data interpretation and evaluation. AN supported with the MIMS set-up, the MIMS data preparation and interpretation. TS and JEEvB organized the cruise, supported the sampling and data interpretation. JEEvB did the river sampling at Bridge Rhede and Herbrum weir. AS carried out the vertical profile sample collection, measurements, data preparation, and method description. MN, KD, and HT designed this study. MN prepared the manuscript with contribution from all co-authors.
The contact author has declared that none of the authors has any competing interests.
Publisher’s note: Copernicus Publications remains neutral with regard to jurisdictional claims made in the text, published maps, institutional affiliations, or any other geographical representation in this paper. While Copernicus Publications makes every effort to include appropriate place names, the final responsibility lies with the authors.
We thank the crew from RV Ludwig Prandtl for making the cruise possible, Leon Schmidt for the support during the cruise and the nutrient measurements, and Markus Ankele for the isotope measurements. Thanks to Wasserstraßen- und Schifffahrtsamt Ems-Nordsee for providing the Ems River kilometer data, and Linda Baldewein for helping with river kilometer calculations. We thank Chantal Mears for proofreading.
This research has been funded by the German Academic Exchange Service (DAAD, project: MOPGA-GRI, grant no. 57429828), which received funds from the German Federal Ministry of Education and Research (BMBF).
The article processing charges for this open-access publication were covered by the Helmholtz-Zentrum Hereon.
This paper was edited by Sebastian Naeher and reviewed by Yu Zhen and two anonymous referees.
Amann, T., Weiss, A., and Hartmann, J.: Inorganic carbon fluxes in the inner Elbe estuary, Germany, Estuar. Coast., 38, 192–210, 2015.
Becker, M., Maushake, C., and Winter, C.: Observations of mud-induced periodic stratification in a hyperturbid estuary, Geophys. Res. Lett., 45, 5461–5469, 2018.
Berner, R. A., Lasaga, A. C., and Garrels, R. M.: Carbonate-silicate geochemical cycle and its effect on atmospheric carbon dioxide over the past 100 million years, Am. J. Sci., 283, 1983.
Blackburn, T. and Henriksen, K.: Nitrogen cycling in different types of sediments from Danish waters 1, Limnol. Oceanogr., 28, 477–493, 1983.
Böhlke, J. K., Smith, R. L., and Hannon, J. E.: Isotopic analysis of N and O in nitrite and nitrate by sequential selective bacterial reduction to N2O, Anal. Chem., 79, 5888–5895, 2007.
Borges, A. V., Delille, B., and Frankignoulle, M.: Budgeting sinks and sources of CO2 in the coastal ocean: Diversity of ecosystems counts, Geophys. Res. Lett., 32, L14601, https://doi.org/10.1029/2005GL023053, 2005.
Brasse, S., Nellen, M., Seifert, R., and Michaelis, W.: The carbon dioxide system in the Elbe estuary, Biogeochemistry, 59, 25–40, 2002.
Brewer, P. G. and Goldman, J. C.: Alkalinity changes generated by phytoplankton growth 1, Limnol. Oceanogr., 21, 108–117, 1976.
Brin, L. D., Giblin, A. E., and Rich, J. J.: Environmental controls of anammox and denitrification in southern New England estuarine and shelf sediments, Limnol. Oceanogr., 59, 851–860, 2014.
Brunner, B., Contreras, S., Lehmann, M. F., Matantseva, O., Rollog, M., Kalvelage, T., Klockgether, G., Lavik, G., Jetten, M. S., and Kartal, B.: Nitrogen isotope effects induced by anammox bacteria, P. Natl. Acad. Sci. USA, 110, 18994–18999, 2013.
Burt, W., Thomas, H., Hagens, M., Pätsch, J., Clargo, N., Salt, L., Winde, V., and Böttcher, M.: Carbon sources in the North Sea evaluated by means of radium and stable carbon isotope tracers, Limnol. Oceanogr., 61, 666–683, 2016.
Casciotti, K. L., Sigman, D. M., Hastings, M. G., Böhlke, J., and Hilkert, A.: Measurement of the oxygen isotopic composition of nitrate in seawater and freshwater using the denitrifier method, Anal. Chem., 74, 4905–4912, 2002.
Casciotti, K. L., Sigman, D. M., and Ward, B. B.: Linking diversity and stable isotope fractionation in ammonia-oxidizing bacteria, Geomicrobiol. J., 20, 335–353, 2003.
Chen, C. T. A. and Wang, S. L.: Carbon, alkalinity and nutrient budgets on the East China Sea continental shelf, J. Geophys. Res.-Oceans, 104, 20675–20686, 1999.
Dähnke, K. and Thamdrup, B.: Isotope fractionation and isotope decoupling during anammox and denitrification in marine sediments, Limnol. Oceanogr., 61, 610–624, 2016.
Dalsgaard, T., Canfield, D. E., Petersen, J., Thamdrup, B., and Acuña-González, J.: N2 production by the anammox reaction in the anoxic water column of Golfo Dulce, Costa Rica, Nature, 422, 606–608, 2003.
Dalsgaard, T., Thamdrup, B., Farías, L., and Revsbech, N. P.: Anammox and denitrification in the oxygen minimum zone of the eastern South Pacific, Limnol. Oceanogr., 57, 1331–1346, 2012.
De Jonge, V. N., Schuttelaars, H. M., van Beusekom, J. E., Talke, S. A., and de Swart, H. E.: The influence of channel deepening on estuarine turbidity levels and dynamics, as exemplified by the Ems estuary, Estuar. Coast. Shelf S., 139, 46–59, 2014.
Engström, P., Dalsgaard, T., Hulth, S., and Aller, R. C.: Anaerobic ammonium oxidation by nitrite (anammox): implications for N2 production in coastal marine sediments, Geochim. Cosmochim. Ac., 69, 2057–2065, 2005.
Frankignoulle, M., Abril, G., Borges, A., Bourge, I., Canon, C., Delille, B., Libert, E., and Théate, J.-M.: Carbon dioxide emission from European estuaries, Science, 282, 434–436, 1998.
Granger, J. and Wankel, S. D.: Isotopic overprinting of nitrification on denitrification as a ubiquitous and unifying feature of environmental nitrogen cycling, P. Natl. Acad. Sci. USA, 113, E6391–E6400, 2016.
Große, F., Greenwood, N., Kreus, M., Lenhart, H.-J., Machoczek, D., Pätsch, J., Salt, L., and Thomas, H.: Looking beyond stratification: a model-based analysis of the biological drivers of oxygen deficiency in the North Sea, Biogeosciences, 13, 2511–2535, https://doi.org/10.5194/bg-13-2511-2016, 2016.
Hamersley, M. R., Lavik, G., Woebken, D., Rattray, J. E., Lam, P., Hopmans, E. C., Damsté, J. S. S., Krüger, S., Graco, M., and Gutiérrez, D.: Anaerobic ammonium oxidation in the Peruvian oxygen minimum zone, Limnol. Oceanogr., 52, 923–933, 2007.
Hamme, R. C. and Emerson, S. R.: The solubility of neon, nitrogen and argon in distilled water and seawater, Deep-Sea Res. Pt. I, 51, 1517–1528, 2004.
Hansen, H. and Koroleff, F.: Determination of nutrients. Methods of Seawater Analysis: Third, Completely Revised and Extended Edition, edited by: Grasshoff, K., Kremling, K., and Ehrhardt, M., Weinheim, Germany, Wiley-VCH Verlag GmbH, https://doi.org/10.1002/9783527613984, 2007.
Howarth, R., Chan, F., Conley, D. J., Garnier, J., Doney, S. C., Marino, R., and Billen, G.: Coupled biogeochemical cycles: eutrophication and hypoxia in temperate estuaries and coastal marine ecosystems, Front. Ecol. Environ., 9, 18–26, 2011.
Hu, X. and Cai, W. J.: An assessment of ocean margin anaerobic processes on oceanic alkalinity budget, Global Biogeochem. Cy., 25, GB3003, https://doi.org/10.1029/2010GB003859, 2011.
Jonge, V. D.: Relations between annual dredging activities, suspended matter concentrations, and the development of the tidal regime in the Ems estuary, Can. J. Fish. Aquat. Sci., 40, s289–s300, 1983.
Kana, T. M., Darkangelo, C., Hunt, M. D., Oldham, J. B., Bennett, G. E., and Cornwell, J. C.: Membrane inlet mass spectrometer for rapid high-precision determination of N2, O2, and Ar in environmental water samples, Anal. Chem., 66, 4166–4170, 1994.
Kendall, C., Elliott, E. M., and Wankel, S. D.: Tracing anthropogenic inputs of nitrogen to ecosystems, Stable Isotopes in Ecology and Environmental Science, 2, 375–449, 2007.
Krom, M. D.: Spectrophotometric determination of ammonia: a study of a modified Berthelot reaction using salicylate and dichloroisocyanurate, Analyst, 105, 305–316, 1980.
Kroon, H.: Determination of nitrogen in water: comparison of a continuous-flow method with on-line UV digestion with the original Kjeldahl method, Anal. Chim. Acta, 276, 287–293, 1993.
Kuypers, M. M., Sliekers, A. O., Lavik, G., Schmid, M., Jørgensen, B. B., Kuenen, J. G., Sinninghe Damsté, J. S., Strous, M., and Jetten, M. S.: Anaerobic ammonium oxidation by anammox bacteria in the Black Sea, Nature, 422, 608–611, 2003.
Lam, P., Lavik, G., Jensen, M. M., van de Vossenberg, J., Schmid, M., Woebken, D., Gutiérrez, D., Amann, R., Jetten, M. S., and Kuypers, M. M.: Revising the nitrogen cycle in the Peruvian oxygen minimum zone, P. Natl. Acad. Sci. USA, 106, 4752–4757, 2009.
Mariotti, A., Germon, J., Hubert, P., Kaiser, P., Letolle, R., Tardieux, A., and Tardieux, P.: Experimental determination of nitrogen kinetic isotope fractionation: some principles; illustration for the denitrification and nitrification processes, Plant Soil, 62, 413–430, 1981.
Meybeck, M.: Global chemical weathering of surficial rocks estimated from river dissolved loads, Am. J. Sci., 287, 401–428, 1987.
Meyer, R. L., Risgaard-Petersen, N., and Allen, D. E.: Correlation between anammox activity and microscale distribution of nitrite in a subtropical mangrove sediment, Appl. Environ. Microb., 71, 6142–6149, 2005.
Middelburg, J. and Nieuwenhuize, J.: Nitrogen isotope tracing of dissolved inorganic nitrogen behaviour in tidal estuaries, Estuar. Coast. Shelf S., 53, 385–391, 2001.
Middelburg, J. J., Soetaert, K., and Hagens, M.: Ocean alkalinity, buffering and biogeochemical processes, Rev. Geophys., 58, e2019RG000681, https://doi.org/10.1029/2019RG000681, 2020.
Mulder, A., Van de Graaf, A. A., Robertson, L., and Kuenen, J.: Anaerobic ammonium oxidation discovered in a denitrifying fluidized bed reactor, FEMS Microbiol. Ecol., 16, 177–183, 1995.
Nicholls, J. C. and Trimmer, M.: Widespread occurrence of the anammox reaction in estuarine sediments, Aquat. Microb. Ecol., 55, 105–113, 2009.
Nielsen, L. P.: Denitrification in sediment determined from nitrogen isotope pairing, FEMS Microbiol. Lett., 86, 357–362, 1992.
Nixon, S. W.: Coastal marine eutrophication: a definition, social causes, and future concerns, Ophelia, 41, 199–219, 1995.
Norbisrath, M. and van Beusekom, J.: Total alkalinity (TA) and dissolved inorganic carbon (DIC) in the Ems Estuary in 2020, PANGAEA [data set], https://doi.org/10.1594/PANGAEA.962184, 2023.
Norbisrath, M., Pätsch, J., Dähnke, K., Sanders, T., Schulz, G., van Beusekom, J. E. E., and Thomas, H.: Metabolic alkalinity release from large port facilities (Hamburg, Germany) and impact on coastal carbon storage, Biogeosciences, 19, 5151–5165, https://doi.org/10.5194/bg-19-5151-2022, 2022.
Petersen, W., Schroeder, F., and Bockelmann, F.-D.: FerryBox-Application of continuous water quality observations along transects in the North Sea, Ocean Dynam., 61, 1541–1554, 2011.
Reithmaier, G. M., Ho, D. T., Johnston, S. G., and Maher, D. T.: Mangroves as a source of greenhouse gases to the atmosphere and alkalinity and dissolved carbon to the coastal ocean: A case study from the Everglades National Park, Florida, J. Geophys. Res.-Biogeo., 125, e2020JG005812, https://doi.org/10.1029/2020JG005812, 2020.
Rich, J. J., Dale, O. R., Song, B., and Ward, B. B.: Anaerobic ammonium oxidation (anammox) in Chesapeake Bay sediments, Microb. Ecol., 55, 311–320, 2008.
Risgaard-Petersen, N., Nielsen, L. P., Rysgaard, S., Dalsgaard, T., and Meyer, R. L.: Application of the isotope pairing technique in sediments where anammox and denitrification coexist, Limnol. Oceanogr.-Meth., 1, 63–73, 2003.
Risgaard-Petersen, N., Meyer, R. L., Schmid, M., Jetten, M. S., Enrich-Prast, A., Rysgaard, S., and Revsbech, N. P.: Anaerobic ammonium oxidation in an estuarine sediment, Aquat. Microb. Ecol., 36, 293–304, 2004.
Röttgers, R., Heymann, K., and Krasemann, H.: Suspended matter concentrations in coastal waters: Methodological improvements to quantify individual measurement uncertainty, Estuar. Coast. Shelf S., 151, 148–155, 2014.
Sanders, T. and Laanbroek, H. J.: The distribution of sediment and water column nitrification potential in the hyper-turbid Ems estuary, Aquat. Sci., 80, 1–13, 2018.
Schulz, G., Sanders, T., van Beusekom, J. E. E., Voynova, Y. G., Schöl, A., and Dähnke, K.: Suspended particulate matter drives the spatial segregation of nitrogen turnover along the hyper-turbid Ems estuary, Biogeosciences, 19, 2007–2024, https://doi.org/10.5194/bg-19-2007-2022, 2022a.
Schulz, G., Voynova, Y. G., Metzke, M., and Schmidt, L.: Nitrogen turnover in the Ems estuary 2020, PANGAEA [data set], https://doi.org/10.1594/PANGAEA.942222, 2022b.
Shadwick, E., Thomas, H., Gratton, Y., Leong, D., Moore, S., Papakyriakou, T., and Prowe, A.: Export of Pacific carbon through the Arctic Archipelago to the North Atlantic, Cont. Shelf Res., 31, 806–816, 2011.
Sigman, D. M. and Casciotti, K.: Nitrogen isotopes in the ocean, Encyclopedia of Ocean Sciences, 3, 1884–1894, https://doi.org/10.1006/rwos.2001.0172, 2001.
Sigman, D. M., Casciotti, K. L., Andreani, M., Barford, C., Galanter, M., and Böhlke, J.: A bacterial method for the nitrogen isotopic analysis of nitrate in seawater and freshwater, Anal. Chem., 73, 4145–4153, 2001.
Sigman, D. M., Karsh, K. L., and Casciotti, K. L.: Nitrogen isotopes in the ocean, in: Encyclopedia of Ocean Sciences, 2nd Edn., edited by: Steele, J. H., Academic Press, 40–54, https://doi.org/10.1016/B978-012374473-9.00632-9, 2009.
Suchet, P. A. and Probst, J.-L.: Modelling of atmospheric CO2 consumption by chemical weathering of rocks: application to the Garonne, Congo and Amazon basins, Chem. Geol., 107, 205–210, 1993.
Talke, S. A., de Swart, H. E., and Schuttelaars, H.: Feedback between residual circulations and sediment distribution in highly turbid estuaries: an analytical model, Cont. Shelf Res., 29, 119–135, 2009.
Thamdrup, B. and Dalsgaard, T.: Production of N2 through anaerobic ammonium oxidation coupled to nitrate reduction in marine sediments, Appl. Environ. Microb., 68, 1312–1318, 2002.
Thomas, H., Bozec, Y., Elkalay, K., and De Baar, H. J.: Enhanced open ocean storage of CO2 from shelf sea pumping, Science, 304, 1005–1008, 2004.
Thomas, H., Friederike Prowe, A., van Heuven, S., Bozec, Y., de Baar, H. J., Schiettecatte, L. S., Suykens, K., Koné, M., Borges, A. V., and Lima, I. D.: Rapid decline of the CO2 buffering capacity in the North Sea and implications for the North Atlantic Ocean, Global Biogeochem. Cy., 21, GB4001, https://doi.org/10.1029/2006GB002825, 2007.
Thomas, H., Schiettecatte, L.-S., Suykens, K., Koné, Y. J. M., Shadwick, E. H., Prowe, A. E. F., Bozec, Y., de Baar, H. J. W., and Borges, A. V.: Enhanced ocean carbon storage from anaerobic alkalinity generation in coastal sediments, Biogeosciences, 6, 267–274, https://doi.org/10.5194/bg-6-267-2009, 2009.
Trimmer, M., Nicholls, J. C., and Deflandre, B.: Anaerobic ammonium oxidation measured in sediments along the Thames estuary, United Kingdom, Appl. Environ. Microb., 69, 6447–6454, 2003.
Van Beusekom, J. and De Jonge, V.: Retention of phosphorus and nitrogen in the Ems estuary, Estuaries, 21, 527–539, 1998.
Van Beusekom, J. E., Carstensen, J., Dolch, T., Grage, A., Hofmeister, R., Lenhart, H., Kerimoglu, O., Kolbe, K., Pätsch, J., and Rick, J.: Wadden Sea Eutrophication: long-term trends and regional differences, Front. Mar. Sci., 6, 370, https://doi.org/10.3389/fmars.2019.00370, 2019.
Van Dam, B. R., Zeller, M. A., Lopes, C., Smyth, A. R., Böttcher, M. E., Osburn, C. L., Zimmerman, T., Pröfrock, D., Fourqurean, J. W., and Thomas, H.: Calcification-driven CO2 emissions exceed “Blue Carbon” sequestration in a carbonate seagrass meadow, Sci. Adv., 7, eabj1372, https://doi.org/10.1126/sciadv.abj1372, 2021.
van Maren, D. S., Winterwerp, J. C., and Vroom, J.: Fine sediment transport into the hyper-turbid lower Ems River: the role of channel deepening and sediment-induced drag reduction, Ocean Dynam., 65, 589–605, 2015.
Voynova, Y. G., Petersen, W., Gehrung, M., Aßmann, S., and King, A. L.: Intertidal regions changing coastal alkalinity: The Wadden Sea-North Sea tidally coupled bioreactor, Limnol. Oceanogr., 64, 1135–1149, 2019.
Wang, Z. A., Kroeger, K. D., Ganju, N. K., Gonneea, M. E., and Chu, S. N.: Intertidal salt marshes as an important source of inorganic carbon to the coastal ocean, Limnol. Oceanogr., 61, 1916–1931, 2016.
Wolf-Gladrow, D. A., Zeebe, R. E., Klaas, C., Körtzinger, A., and Dickson, A. G.: Total alkalinity: The explicit conservative expression and its application to biogeochemical processes, Mar. Chem., 106, 287–300, 2007.
You, Q.-G., Wang, J.-H., Qi, G.-X., Zhou, Y.-M., Guo, Z.-W., Shen, Y., and Gao, X.: Anammox and partial denitrification coupling: a review, RSC Adv., 10, 12554–12572, 2020.