the Creative Commons Attribution 4.0 License.
the Creative Commons Attribution 4.0 License.
 | 28 Nov 2023
Seasonal dynamics and annual budget of dissolved inorganic carbon in the northwestern Mediterranean deep-convection region
Caroline Ulses
Claude Estournel
Patrick Marsaleix
Karline Soetaert
Marine Fourrier
Laurent Coppola
Dominique Lefèvre
Franck Touratier
Catherine Goyet
Véronique Guglielmi
Fayçal Kessouri
Pierre Testor
Xavier Durrieu de Madron
Deep convection plays a key role in the circulation, thermodynamics, and biogeochemical cycles in the Mediterranean Sea, which is considered to be a hotspot of biodiversity and climate change. In the framework of the DEWEX (Dense Water Experiment) project, the seasonal and annual budgets of dissolved inorganic carbon in the deep-convection area of the northwestern Mediterranean Sea are investigated over the period September 2012–September 2013 using a 3D coupled physical–biogeochemical–chemical modeling approach. At the annual scale, we estimate that the northwestern Mediterranean Sea's deep-convection region was a moderate sink of 0.5 mol C m−2 yr−1 of CO2 for the atmosphere. The model results show the reduction of oceanic CO2 uptake during deep convection and its increase during the abrupt spring phytoplankton bloom following the deep-convection events. We highlight the major roles in the annual dissolved inorganic carbon budget of both the biogeochemical and physical fluxes, which amount to −3.7 and 3.3 mol C m−2 yr−1, respectively, and are 1 order of magnitude higher than the air–sea CO2 flux. The upper layer (from the surface to 150 m depth) of the northwestern deep-convection region gained dissolved inorganic carbon through vertical physical transport and, to a lesser extent, oceanic CO2 uptake, and it lost dissolved inorganic carbon through lateral transport and biogeochemical fluxes. The region, covering 2.5 % of the Mediterranean, acted as a source of dissolved inorganic carbon for the surface and intermediate water masses of the Balearic Sea and southwestern Mediterranean Sea and could represent up to 22 % and 11 %, respectively, of the CO2 exchanges with the Atlantic Ocean at the Strait of Gibraltar.
- Article
(8498 KB) - Full-text XML
-
Supplement
(2975 KB) - BibTeX
- EndNote


Quantifying the ocean carbon pump and its evolution under ongoing global warming and a rising atmospheric CO2 inventory is a challenging issue. Exchanges of CO2 at the air–sea interface result from a complex interplay of chemical, biogeochemical, and physical processes in the ocean. Physical mechanisms can quantitatively play a comparable role as biogeochemical processes in the air–sea CO2 flux at regional and global scales (Ayers and Lozier, 2012; Lévy et al., 2013; Stukel and Ducklow, 2017). In particular, deep-convection regions, such as the Labrador Sea, located at high latitudes in the Atlantic Ocean, are considered to be large sinks for atmospheric CO2 due to strong cooling and high primary production leading to long, or even persistent, periods of deficit compared to the atmosphere (Takahashi et al., 2002). In these regions, large amounts of atmospheric CO2 taken up at the ocean surface and biologically fixed carbon are transferred to the deep ocean during the intense vertical mixing periods (DeGranpre et al., 2006; Körtzinger et al., 2008a). Furthermore, respired organic carbon remaining above the winter mixing depth can be ventilated back to the surface during the following winter (DeGranpre et al., 2006; Körtzinger et al., 2008a; Palevsky and Nicholson, 2018). Lateral transport, often associated with the restratification of the water column, the dispersion of the newly formed dense water, and/or the exchanges with boundary currents, also greatly contributes to the budget of water masses and their biogeochemical contents (Wolf et al., 2018; Koelling et al., 2022).
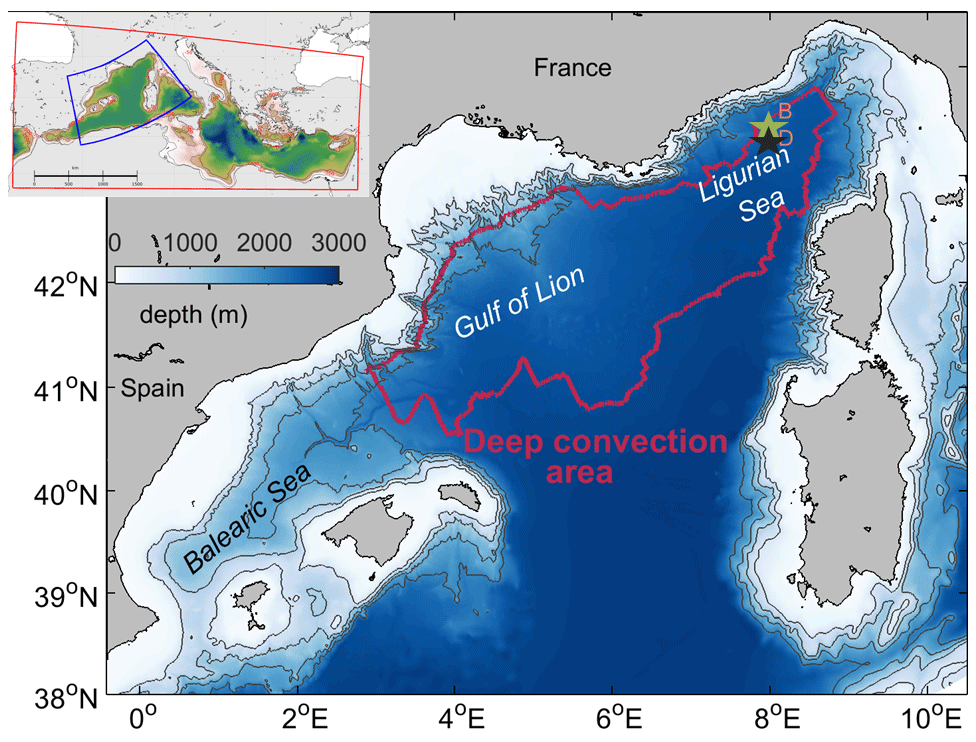
Figure 1Bathymetry (m) of the study area. The red contour indicates the limit of the deep-convection area defined for the budget calculation (see Sect. 2.1.3). The location of the BOUSSOLE buoy and EMSO-DYFAMED mooring sites in the Ligurian Sea are indicated with a green and black star, respectively. The insert representing the Mediterranean Sea indicates the limits of the coupled model used for this study in blue and of the forcing simulation in orange (see Sect. 2.1.2).
The northwestern Mediterranean Sea (Gulf of Lion and Ligurian Sea, Fig. 1), along with the South Adriatic, is one of the regions where deep convection occurs (Ovchinnikov et al., 1985; Mertens and Schott, 1998; Manca and Bregant, 1998; Béthoux et al., 2002). Few studies have investigated the dynamics of dissolved inorganic carbon (DIC hereafter) in this region, where the Western Mediterranean Deep Water is formed and which plays a crucial role in the circulation and ventilation of the Mediterranean Sea (Schroeder et al., 2016; Li and Tanhua, 2020; Mavropoulou et al., 2020). The objective of this study is to gain insights into the annual cycle of DIC by examining and quantifying the biogeochemical, physical, and air–sea fluxes.
In the northwestern Mediterranean region, a basin-scale cyclonic gyre is associated with a doming of isopycnals. The density increase, induced in winter in surface waters by cold and dry northerly winds, produces instabilities in the water column, leading to convective mixing of surface waters with deeper waters. With regards to the biogeochemical processes, the region is characterized at the sea surface by a moderate phytoplankton bloom in fall, interrupted by deep winter mixing and an abrupt phytoplankton bloom following deep winter mixing, which supplies inorganic nutrients to the euphotic layer (Severin et al., 2014; Bernardello et al., 2012; Lavigne et al., 2013; Ulses et al., 2016; Kessouri et al., 2017). At the annual scale, the net community production (NCP, defined as the gross primary production minus the community respiration) was found to be positive, leading to an autotrophic status for the area (Ulses et al., 2016; Coppola et al., 2018). The downward export of organic carbon and its interannual variability have been related to the intensity of the deep convection and the phytoplankton bloom (Heimbürger et al., 2013; Herrmann et al., 2013; Ulses et al., 2016).
Previous observational and modeling studies that have documented the dynamics of the CO2 system in this region mostly focused on the Ligurian Sea at the EMSO-DYFAMED (European Multidisciplinary Seafloor and water column Observatory-Dynamique des Flux Atmospheriques en MEDiterranee) and BOUSSOLE (BOUée pour l'acquiSition d'une Série Optique à Long termE) mooring sites (Hood and Merlivat, 2001; Copin-Montégut and Bégovic, 2002; Bégovic and Copin-Montégut, 2002; Mémery et al., 2002; Copin-Montégut et al., 2004; Touratier and Goyet, 2009; Merlivat et al., 2018; Coppola et al., 2020), where the intensity of convection generally remains moderate compared to the Gulf of Lion (Fig. 1). These 1D studies showed a pronounced seasonal cycle of pCO2 mostly controlled by the sea surface temperature. The thermal effect is counterbalanced in spring by the impact of phytoplankton growth, which leads to DIC drawdown, and in winter by intense mixing events, which bring DIC-rich water to the surface (Hood and Merlivat, 2001; Mémery et al., 2002; Copin-Montégut et al., 2004). On an annual timescale, the Ligurian Sea was found to be a medium to minor sink for atmospheric CO2 (Hood and Merlivat, 2001; Mémery et al., 2002; Copin-Montégut et al., 2004; Merlivat et al., 2008). Based on cruise data, Touratier et al. (2016) complemented those mooring observations by describing the distribution of the carbonate system properties in the central region of the deep-convection region during two winter periods, during and just after the deep-convection event. The authors showed a rapid transfer of anthropogenic CO2 to the ocean interior during the convection event and found an excess in CO2 related to the atmosphere. Finally, D'Ortenzio et al. (2008) and Cossarini et al. (2021), based on 1D models and a 3D model, respectively, found that the whole deep-convection region is a major sink of atmospheric CO2 in the open Mediterranean Sea. In the previous studies, the 3D dynamics of the CO2 system over an annual cycle has never been specifically explored for the whole northwestern deep-convection region, and a complete DIC budget is still lacking for this region.
The aim of the DEWEX (Dense Water Experiment) project (Conan et al., 2018; Testor et al., 2018) was to investigate the deep-convection process and its impact on biogeochemical fluxes based on observational platforms and numerical models. In this framework, two research cruises were carried out in winter and spring of the year 2013, completing the MOOSE-GE (Mediterranean Ocean Observing System for the Environment-Grande Echelle) observational effort that has been performed each year during stratified periods since 2010. Due to extremely strong buoyancy loss, the 2012–2013 winter was characterized by intense deep-convection events and is considered to be one of the five most intense events over the period 1980–2013 (Somot et al., 2016; Herrmann et al., 2017; Coppola et al., 2018). Using a 3D coupled physical–biogeochemical simulation, Kessouri et al. (2018) estimated that the deep-convection region was characterized over the period 2012–2013 by a positive net community production and showed higher rates of export of organic carbon below the euphotic layer compared to the surroundings. They suggested that, due to high spatial and interannual variability and the dispersion of newly formed dense water to the southern Mediterranean Sea, a fraction of the exported carbon escapes a return to the surface layer during the following winter. Here, we took advantage of the in situ measurements from the DEWEX project, the MOOSE-GE program, and the BOUSSOLE and EMSO-DYFAMED mooring sites to implement and constrain a model of the dynamics of the CO2 system and to complete the 3D coupled physical–biogeochemical modeling study on organic carbon by Kessouri et al. (2018). We (i) examined the seasonal cycle of DIC, (ii) estimated an annual carbon budget, and (iii) analyzed the contributions from air–sea CO2 exchanges and biogeochemical and physical processes to the carbon budget.
2.1 The numerical model
2.1.1 The coupled hydrodynamic–biogeochemical–chemical model
The biogeochemical model Eco3M-S (Auger et al., 2011; Ulses et al., 2021) was forced offline by daily outputs (current velocities, turbulent diffusion coefficient, temperature, and salinity) of the 3D hydrodynamic model SYMPHONIE (Marsaleix et al., 2008). The SYMPHONIE model, a 3D primitive equation model, with a free surface and generalized sigma vertical coordinate, has been used to investigate open-sea convection (Herrmann et al., 2008; Estournel et al., 2016; Damien et al., 2017) and circulation in the northwestern Mediterranean Sea (Estournel et al., 2003; Ulses et al., 2008; Bouffard et al., 2008).
The biogeochemical model Eco3M-S is a multi-nutrient and multi-plankton functional-type model that simulates the dynamics of the pelagic planktonic ecosystem and the cycles of several biogenic elements (carbon, nitrogen, phosphorus, silicon, oxygen) (Auger et al., 2011; Many et al., 2021; Ulses et al., 2021). Particulate organic detritus and micro-phytoplankton have a constant settling velocity (1 m d−1 for slow-sinking detritus and micro-phytoplankton and 90 m d−1 for fast-sinking detritus based on the modeling studies of Levy et al. (1998), Lacroix and Grégoire (2002), and Raick et al. (2005) and on calibration tests (Auger et al., 2011; Kessouri et al., 2017)). The model has been used to study biogeochemical processes in the NW (northwestern) Mediterranean deep-convection area (Herrmann et al., 2013; Auger et al., 2014; Ulses et al., 2016, 2021; Kessouri et al., 2017, 2018) and in the whole Mediterranean Sea (Kessouri, 2015).
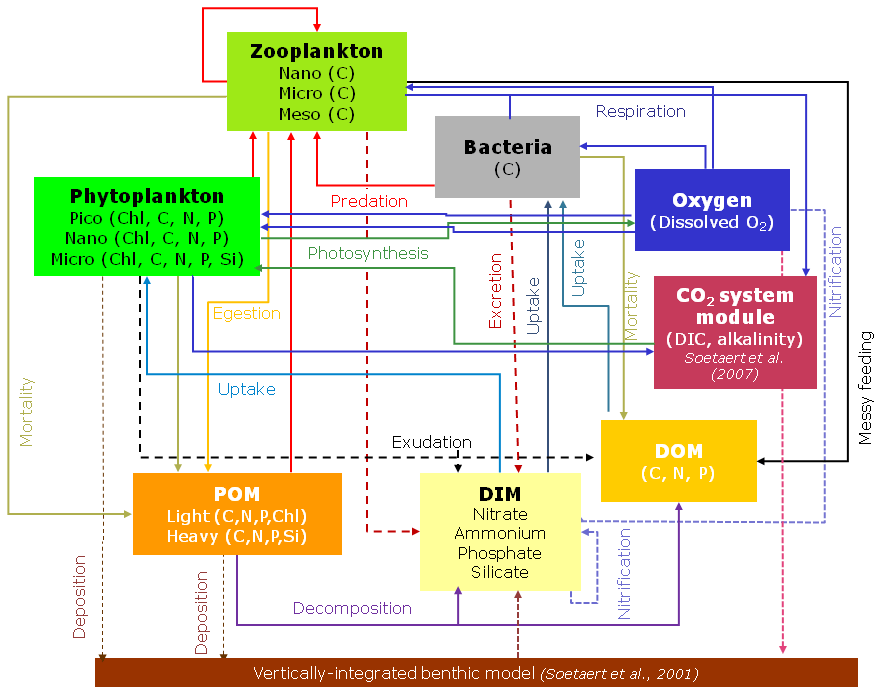
Figure 2Scheme of the upgraded biogeochemical model Eco3M-S (redrawn from Ulses et al., 2021).
In previous versions of the model, particulate and dissolved organic carbon were considered, but the dynamics of the dissolved inorganic carbon was not described. To investigate the dynamics of the CO2 system, the model was extended by implementing the carbonate chemistry model developed and described in detail by Soetaert et al. (2007) and applied by Raick-Blum (2005) in 1D in the northwestern Mediterranean Sea. The food web structure of the upgraded model and the biogeochemical processes interacting between compartments are schematically represented in Fig. 2. Two state variables were added in the upgraded version of the coupled model. The first added variable is the dissolved inorganic carbon concentration, the sum of the concentrations of the four carbon dioxide forms, namely dissolved carbonate dioxide, bicarbonate, carbonate ion, and carbonic acid. The rate of change of the concentration of DIC due to biogeochemical processes is governed by the following equation:
where GPPi and RespPhyi are gross primary production and respiration, respectively, for phytoplankton size class i (size classes 1, 2, and 3 are pico-, nano-, and micro-phytoplankton, respectively, Fig. 2); RespZooj is the respiration flux for zooplankton size class j (size classes 1, 2, and 3 are nano-, micro-, and meso-zooplankton, respectively, Fig. 2), and RespBac is bacterial respiration. The second added state variable is the excess negative charge (denoted , which is the moles of negative charges over positive charges of the acid–base system (Table 2 in Soetaert et al., 2007). As in Soetaert et al. (2007), we use this excess negative charge instead of the total alkalinity, commonly measured for proton balance. Here, we assume that the uptake of ions is compensated for by the uptake or release of protons (electroneutrality) and that is not impacted by changes in the concentrations of nitrate, phosphate, or ammonium, which is not the case for total alkalinity. The total alkalinity (TA) is then deduced from
In this first study on DIC dynamics, we neglected calcium carbonate (CaCO3) precipitation and dissolution. Schneider et al. (2007) indicated that the Mediterranean Sea is supersaturated with respect to calcite and aragonite throughout the water column and that calcium carbonate dissolution is thus not favored thermodynamically. Regarding the CaCO3 precipitation, we are aware that future refinements will have to take this into account since neglecting it could lead notably to an overestimation of air–sea CO2 flux. Sensitivity tests of this term were performed (see Sect. 2.1.4) and are presented in Sect. 5.
In this study, in the carbonate chemistry model, the dissociation equilibriums of carbonates, water, ammonium, phosphate, silicate, and borate were taken into account. The thermodynamic equilibrium constants of the carbonate system were calculated as a function of temperature, salinity, and pressure as in Millero (1995), with typographical correction from the CO2SYS program (Lewis and Wallace, 1998). In particular, carbonic acid dissociation constants are calculated in the same way as Mehrbach et al. (1973) constants, as refit by Dickson and Millero (1987).
The flux of CO2 at the air–sea interface, CO2flux, was calculated using the following equation:
where pCO2,atm and pCO2,sea (µatm) are the atmospheric and sea surface partial pressure of CO2, respectively; K0 (mol kg−1 atm−1) is the solubility coefficient; Kw (m s−1) is the gas transfer velocity; and ρ is the sea surface density (kg m−3). We calculated the solubility coefficient according to Weiss (1974) and the gas transfer velocity using the most often used parameterization of Wanninkhof et al. (1992), with a quadratic dependency on the wind speed 10 m above the sea. In addition, we performed sensitivity analyses using eight various parameterizations of the gas transfer velocity to estimate uncertainties of air–sea exchanges (see Sect. 2.1.4).
2.1.2 Model setup
The numerical domain covers most of the western Mediterranean Sea (blue contour on the insert in Fig. 1) using a curvilinear grid (Bentsen et al., 1999) with a horizontal resolution varying from 0.8 km in the north to 1.4 km in the south and with 40 vertical levels (Ulses et al., 2021). The implementation of the hydrodynamic simulation and the strategy of downscaling from the Mediterranean Basin to the western sub-basin scale in three stages (Fig. S1 in the Supplement) have been described in detail in Estournel et al. (2016) and Kessouri et al. (2017) and will be summarized here:
-
The hydrodynamic simulation was implemented over the western Mediterranean sub-basin (delimited by blue lines in the inset of Fig. 1) and was initialized and forced at its lateral boundaries with daily hydrodynamic fields of the configuration PSY2V4R4 based on the NEMO ocean model at a resolution of 1/12∘ over the Mediterranean Basin (delimited by orange lines in the inset of Fig. 1) by the Mercator Ocean International operational system (Lellouche et al., 2013). This simulation (step 1a, Fig. S1) was performed from 1 August 2012 to 31 October 2013.
-
In parallel (step 1b, Fig. S1), the biogeochemical model was computed, in offline mode, at the Mediterranean Basin scale on the same NEMO grid using the same NEMO hydrodynamic fields as those used by the SYMPHONIE simulation in step 1a. This simulation was performed from 15 June 2011 to 15 November 2013. The carbonate system module in this configuration was initialized in June 2011 using mean values of dissolved inorganic carbon and total alkalinity observations carried out in 2011 from the Meteor M84/3 (Alvarez et al., 2014), CASCADE (CAscading, Surge, Convection, Advection and Downwelling Events; Touratier et al., 2016), and MOOSE-GE cruises (Testor et al., 2010), as well as from the EMSO-DYFAMED mooring (Coppola et al., 2021) and BOUSSOLE buoy (Golbol et al., 2020) sites, over bio-regions defined in Kessouri (2015) based on Lavezza et al. (2011). To deduce the excess negative charge from total alkalinity (Eq. 2), we also used the nutrient concentration data from the MEDAR/MEDATLAS database as in Kessouri et al. (2017). Recently, Davis and Goyet (2021) described a method based upon the property variability to precisely quantify the uncertainties at any point of an interpolated data field. This approach could be used in the near future to improve both the at-sea sampling strategy (Guglielmi et al., 2022a, b) and the accuracy of model initialization.
-
In a second step (Fig. S1), the Eco3M-S biogeochemical model was implemented over the western Mediterranean sub-basin using the grid and the hydrodynamics fields of the aforementioned SYMPHONIE simulation (step 1a) in offline mode. This simulation was performed from 15 August 2012 to 30 September 2013. The initial state and lateral boundary conditions of the biogeochemical fields are provided by the biogeochemical simulation of the Mediterranean Basin of step 1b.
This nesting protocol ensures the coherence of the physical and biogeochemical fields at the open boundaries of the western Mediterranean model. For both biogeochemical simulations (steps 1b and 2), we prescribed at the river mouths the mean DIC concentration measured by Sempéré et al. (2000) for the Rhone River and climatological values according to Ludwig et al. (2010) and Schneider et al. (2007) at the other river mouths. To compute the gas transfer velocity, we used the 3 h wind speed, pressure, and humidity provided by the ECMWF model on a grid, consistently with the hydrodynamic simulation. The atmospheric pCO2,atm was deduced from the flask-air measurements of mole fraction, measured monthly at the Lampedusa site (World Data Centre for Greenhouse Gases: https://gaw.kishou.go.jp/,last access: 5 August 2019, Lan et al., 2022). Fluxes of dissolved inorganic carbon at the sediment–sea interface were considered by coupling the pelagic model with a simplified version of the meta-model described in Soetaert et al. (2001).
2.1.3 Study area and computation of DIC balance
We computed DIC fluxes and the resulting variation in the DIC inventory for the whole deep-convection area. The deep-convection area was defined as the area that includes the model grid points where the mixed-layer depth exceeded 1000 m for at least 1 d of the study period based on Kessouri et al. (2017, 2018). This area covers 70 100 km2. The budget was calculated for two vertical layers: the photic upper layer, where the photosynthesis process takes place, and the aphotic deeper layer. The base of the upper layer was set at 150 m based on the regional minimum value of the diffuse attenuation coefficient of light at 490 nm as derived from satellite observations (http://marine.copernicus.eu/, last access: 19 November 2017, product: OCEANCOLOUR_MED_OPTICS_L3_REP_OBSERVATIONS_009
_095) and following the studies by Lazzari et al. (2012) and Kessouri et al. (2018).
The variation of the DIC inventory in the upper layer between times t1 and t2 (Δ DIC Iupper) is equal to the sum of all DIC fluxes within the deep-convection area between t1 and t2:
where FDIC,lat and FDIC,vert are the lateral and vertical fluxes at the boundaries of the deep-convection area, FDIC,air–sea is the air–sea CO2 flux, and FDIC,bgc is the biogeochemical flux.
DIC Iupper,t was computed from the following:
where () belongs to the upper layer (150 m to the surface) of the DCA (deep-convection area).
The lateral exchange flux was computed from the following:
where vt is the current velocity normal to the limit of the deep-convection area (m s−1), and A (m2) is the area of the section from the base of the upper layer (150 m) to the surface of the deep-convection area.
The FDIC,air-sea was computed from
where CO2flux (µmol C m−2 s−1) is the air–sea flux given by Eq. (3).
FDIC,bgc was computed from the following:
where BGCflux is the biogeochemical flux, i.e., the sum of DIC release through respiration by living organisms and of DIC consumption through photosynthesis.
Finally, the vertical transport flux, FDIC,vert, was derived from all the other terms of Eq. (4). The computation of the DIC balance in the deeper layer is computed in a similar way, with the variation of the inventory being the sum of the lateral and vertical flux at the boundaries and of the biogeochemical flux. Here, the fluxes at the sea–sediment interface were taken into account but were negligible with respect to the other terms of the balance.
2.1.4 Sensitivity tests
We performed various sensitivity tests to estimate the uncertainties of the modeled air–sea CO2 flux. A first set of tests was based on the parametrization of the gas transfer coefficient. For these tests, we used quadratic (Wanninkhof, 2014), cubic (Wanninkhof and McGillis, 1999), and hybrid (Liss and Merlivat, 1986; Nightingale et al., 2000; Wanninkhof et al., 2009) wind speed dependency parameterizations of diffusive flux, as well as parameterizations explicitly including air–sea fluxes due to bubble formation (Woolf, 1997; Stanley et al 2009; Liang et al., 2013). In the second set of sensitivity tests, we prescribed the atmospheric mole fraction by adding and subtracting an associated uncertainty of 3 ppm due to spatial variabilities (Keraghel et al., 2020). Finally, in a third set of sensitivity tests, we performed two simulations by adding simple estimates of the calcium carbonate production into the equations of DIC (Eq. 1) and excess negative charge. Following the study of Palevsky and Quay (2017), we first estimated it based on the PIC:POC ratio and the NCP. Miquel et al. (2011) estimated that the PIC:POC ratio at 200 m depth varied between 0.31 and 0.78, with a mean value of 0.5, based on sediment trap measurements at the EMSO-DYFAMED site. Besides, Kessouri et al. (2018) estimated that POC export represents ∼70 % of the total OC (TOC) export (the remaining 30 % being attributed to DOC export). Thus, by assuming the ratio of calcium carbonate production to NCP is close to the PIC:TOC ratio, we added into Eq. (1) a consumption term representing 36 % of NCP for the mean value of the PIC:POC ratio and 22% and 55% for the minimum and maximum ratio values, respectively. This term, multiplied by 2, was added into the equation of the rate of change of the excess negative charge (Middelburg, 2019). In a second sub-test, we added a CaCO3 production term based on the parametrization used in the Gulf of Lion's shelf modeling study by Lajaunie-Salla et al. (2021) (their Table A4, Precip = , where kprecip is the PIC:POC ratio, and Ωc is the aragonite saturation, set at 3.5 based on Schneider et al. (2007)).
2.2 Data used for model skill assessment
2.2.1 BOUSSOLE buoy and EMSO-DYFAMED mooring site observations
To assess the time evolution of sea surface properties, we used high-frequency temperature, salinity, and pCO2 data collected at 3 m depth at the BOUSSOLE mooring site (43∘22′ N, 7∘54′ E; depth: ∼2400 m; green star in Fig. 1), in the Ligurian Sea in 2013 (Antoine et al., 2006; Merlivat et al., 2018). Temperature and salinity were measured using a Sea-Bird SBE 37-SMP MicroCAT instrument. The sensors were cross-calibrated before and after each mooring deployment with the ship CTD by performing a high-temporal-resolution sampling cast with 30 min long time series at the fixed depths of 300 and 1000 m. This allows for high accuracy of 0.001 ∘C in temperature and 0.005 in salinity (Houpert, 2013). fCO2 measurements were monitored using a CARIOCA sensor whose accuracy is estimated at 2 µatm. A detailed description of these data is given in Merlivat et al. (2018).
We also used monthly vertical profiles of temperature, salinity, dissolved oxygen, dissolved inorganic carbon, and total alkalinity collected from September 2012 to September 2013 at the EMSO-DYFAMED site (43∘25′ N; 7∘52′ E; depth: 2350 m; black star in Fig. 1) (Coppola et al., 2020, 2023), located 5 km from the BOUSSOLE site. Note that temperature and salinity were collected using a Sea-Bird SBE911. Dissolved oxygen measurements were performed using Winkler titration at each CTD cast and were used to correct the SBE43 sensor data by adjusting the calibration coefficients (Coppola et al., 2018). DIC and total alkalinity were measured via potentiometric titration following the methods described by Edmond (1970) and DOE (1994) with an accuracy estimated to be between 1.5 and 3 µmol kg−1. They were analyzed by the SNAPO-CO2 national service (Service National d'Analyse des Paramètres Océaniques du CO2). pCO2 and pHT (pH at total scale) were deduced from total alkalinity and total inorganic carbon using the carbonate system CO2SYS program (Lewis et Wallace, 1998; van Heuven et al., 2011), as in the system carbonate module described in Sect. 2.1.1.
2.2.2 DEWEX and MOOSE-GE cruise observations
To assess the horizontal and vertical distribution of the simulated DIC concentration, we used in situ observations collected during two cruises carried out in the framework of the DEWEX project on board the RV Le Suroît. The first cruise, DEWEX Leg1, was carried out in February 2013 during the active phase of deep convection (Testor, 2013), and the second one, DEWEX Leg2, was carried out in April 2013 during the following spring bloom (Conan, 2013). In addition, we used observations from the 2013 MOOSE-GE cruise, conducted during the stratified, oligotrophic season in June–July 2013, on board RV Tethys II (Testor et al., 2013). During the three cruises, the total dissolved inorganic carbon measurements (DEWEX Leg1: 19 stations, DEWEX Leg2: 14 stations, MOOSE-GE: 20 stations) were collected into acid-washed 500 cm3 borosilicate glass bottles and poisoned with 100 mm3 of HgCl2 following the recommendations of DOE (1994) and Dickson et al. (2007). Samples were stored in the dark at 4 ∘C pending analysis. Analyses were also performed by the national service SNAPO-CO2. Following Wimart-Rousseau et al. (2021), the values of total dissolved inorganic carbon and total alkalinity below 500 m depth, outside the range defined by ±2 the standard deviation in relation to the mean value, were not considered. The accuracy of the measurements was estimated at 1.5–3 µmol kg−1.
2.3 CANYON-MED neural networks
Since in situ observations of the carbonate system remain scarce, the comparison of model outputs versus in situ observations is completed with a comparison with dissolved inorganic carbon, total alkalinity, and pHT derived from the CANYON-MED neural networks developed by Fourrier et al. (2020) for the Mediterranean Sea. pCO2 was derived from CANYON-MED outputs using the carbonate system CO2SYS program. The neural networks were applied at the EMSO-DYFAMED and BOUSSOLE sites using as input parameters pressure, temperature, salinity, and dissolved oxygen measured between 3 and 14 m depth, as well as the geolocation and date of the sampling. The accuracies of the derived pHT, dissolved inorganic carbon, and total alkalinity were estimated at 0.014, 12 and 13 µmol kg−1, respectively, for the entire Mediterranean Sea area. However, the accuracy of the neural networks was greatly improved locally, as Fourrier et al. (2022) showed specifically for the Gulf of Lion and Ligurian Sea over the period 2013–2020.
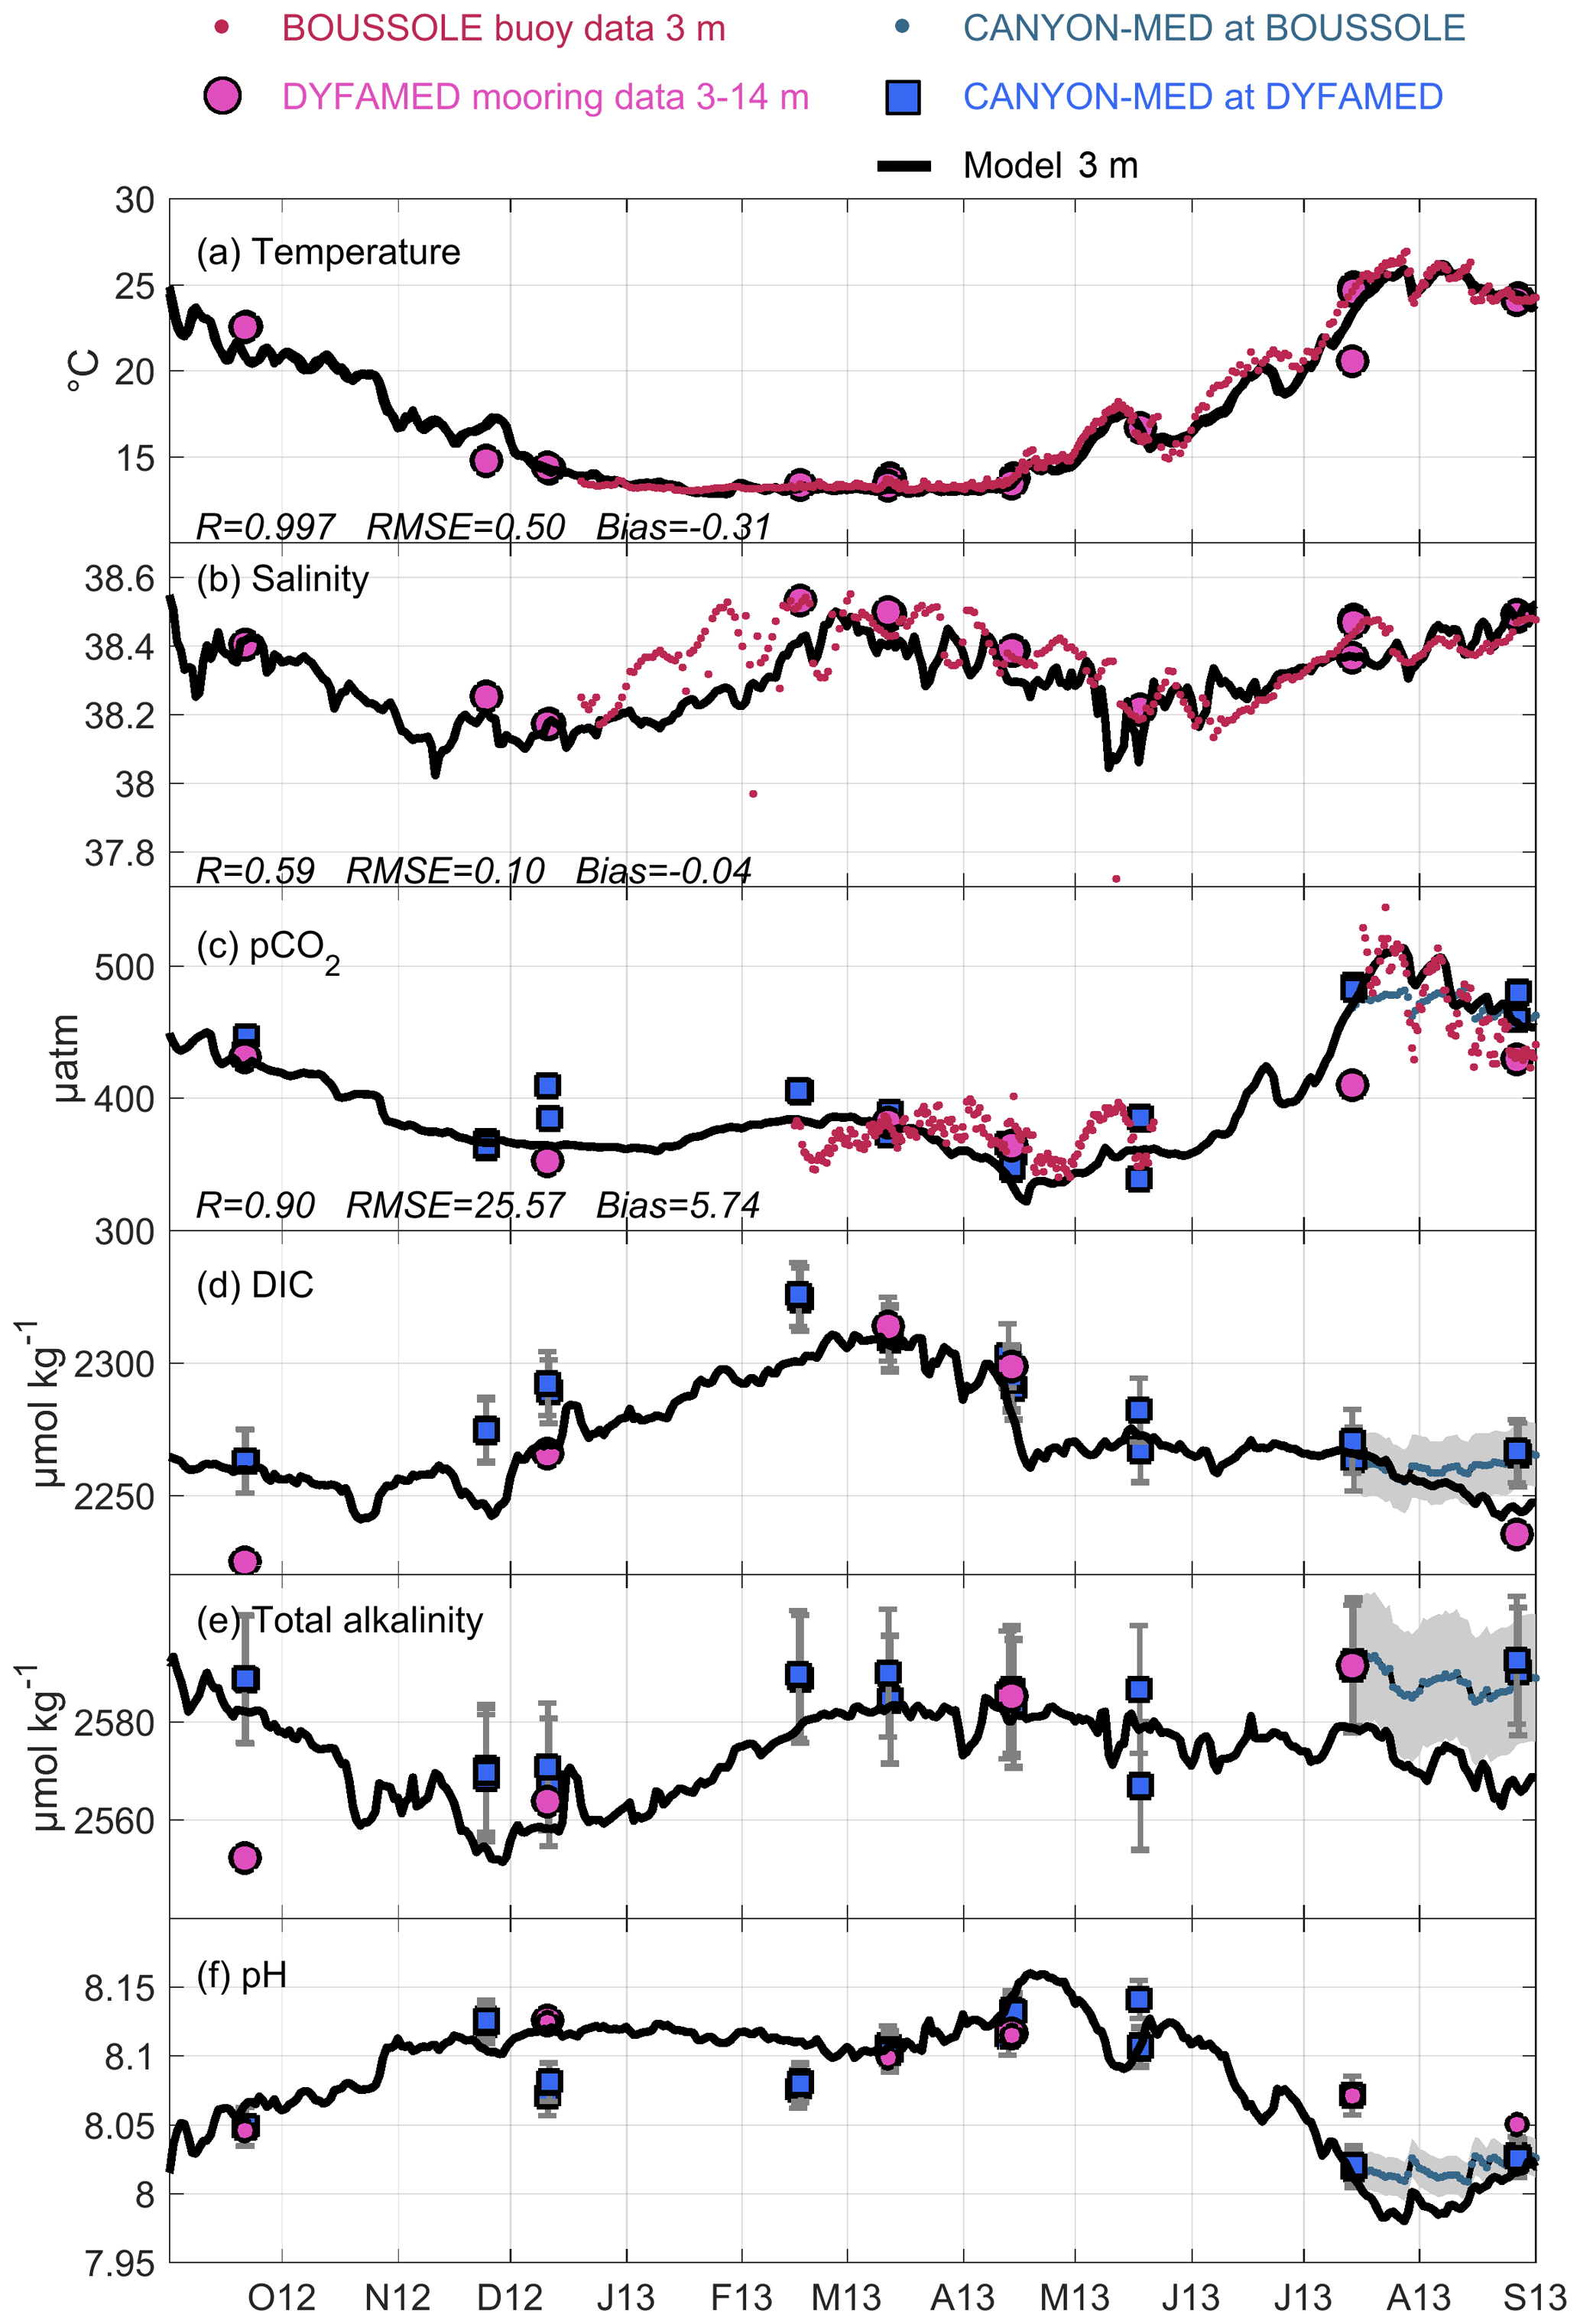
Figure 3Time series of (a) temperature, (b) salinity, (c) pCO2, (d) DIC, (e) total alkalinity, and (f) pH at total scale, modeled at 3 m depth (line in black), observed (small red dots at BOUSSOLE site and pink points at EMSO-DYFAMED site between 3 and 14 m depth) and computed with CANYON-MED neural networks (small blue dots at BOUSSOLE at 3 m and blue squares at EMSO-DYFAMED site between 3 and 14 m depth; error bars are indicated in gray). Correlation coefficient, RMSE, and bias between model outputs and BOUSSOLE observations are indicated in (a), (b), and (c).
3.1 Comparison at the BOUSSOLE and EMSO-DYFAMED sites
Figure 3 shows the seasonal cycle of temperature, salinity, pCO2, DIC, total alkalinity, and pHT observed and modeled at the surface at the EMSO-DYFAMED and BOUSSOLE sites. The temperature is very well simulated, with a highly significant correlation of 0.997 (p value < 0.01), an RMSE (root mean square error) of 0.50 ∘C, and a bias of −0.31 ∘C compared to BOUSSOLE buoy observations (Fig. 3a). Regarding the salinity, the model is close to the observations, except from December to February, when it underestimates the BOUSSOLE observations (Fig. 3b). The correlation (R=0.59, p value < 0.01) remains significant compared to the observations at the buoy, where the model has a bias of −0.04 and an RMSE of 0.10 over the whole study period. The modeled pCO2 is in good agreement with observations and values derived with CANYON-MED neural networks, with a significant correlation of 0.90 (p value < 0.01), a bias of 5.74 µatm, and an RMSE of 25.57 µatm, compared to the BOUSSOLE observations (Fig. 3c). The model simulates low values in winter, when temperatures were minimum, and in spring, during the phytoplankton bloom identified by Kessouri et al. (2018). The maximum values are modeled in summer due to warming, as in observations and in CANYON-MED results. The seasonal variation of modeled DIC is in agreement with that observed and deduced from CANYON-MED (Fig. 3d), showing an increase in winter until the end of the deep-mixing period and a drop in spring when the growth of phytoplankton was maximum. The seasonal dynamics of modeled alkalinity shows minimum values in November and December, an increase in winter, and low variations in spring (Fig. 3e). The increase in winter is also found in observations and CANYON-MED results. In summer, the model underestimates both datasets by ∼10–15 µmol kg−1. The pHT seasonal variation in observations, simulation, and CANYON-MED results all indicate a drop in summer, mostly due to the increase in temperature (Hagens and Middleburg, 2016). Finally, the model results for the variables of the carbonate system are also consistent with the seasonal variability derived by Coppola et al. (2020) from monthly mean DYFAMED observations over the period 1998–2016. The modeled variables fall within the range of the observed values gathered in this synthesis study: 300–570 µatm for pCO2, 2200–2340 µmol kg−1 for DIC, 2510–2600 µmol kg−1 for alkalinity, and 7.9–8.2 for pHT.
3.2 Comparison with DEWEX and MOOSE-GE cruise observations
Previous studies based on the present coupled model concluded that the model shows good performance in reproducing fall and winter mixing (Estournel et al., 2016), as well as the timing and intensity of the phytoplankton blooms (Kessouri et al., 2018) and the seasonal dynamics of the dissolved oxygen (Ulses et al., 2021) and inorganic nutrients (Kessouri et al., 2017) over the three cruise periods. Here, we focus the assessment of the model skills on the seasonal dynamics and spatial variability of the carbonate system, especially the DIC concentration.
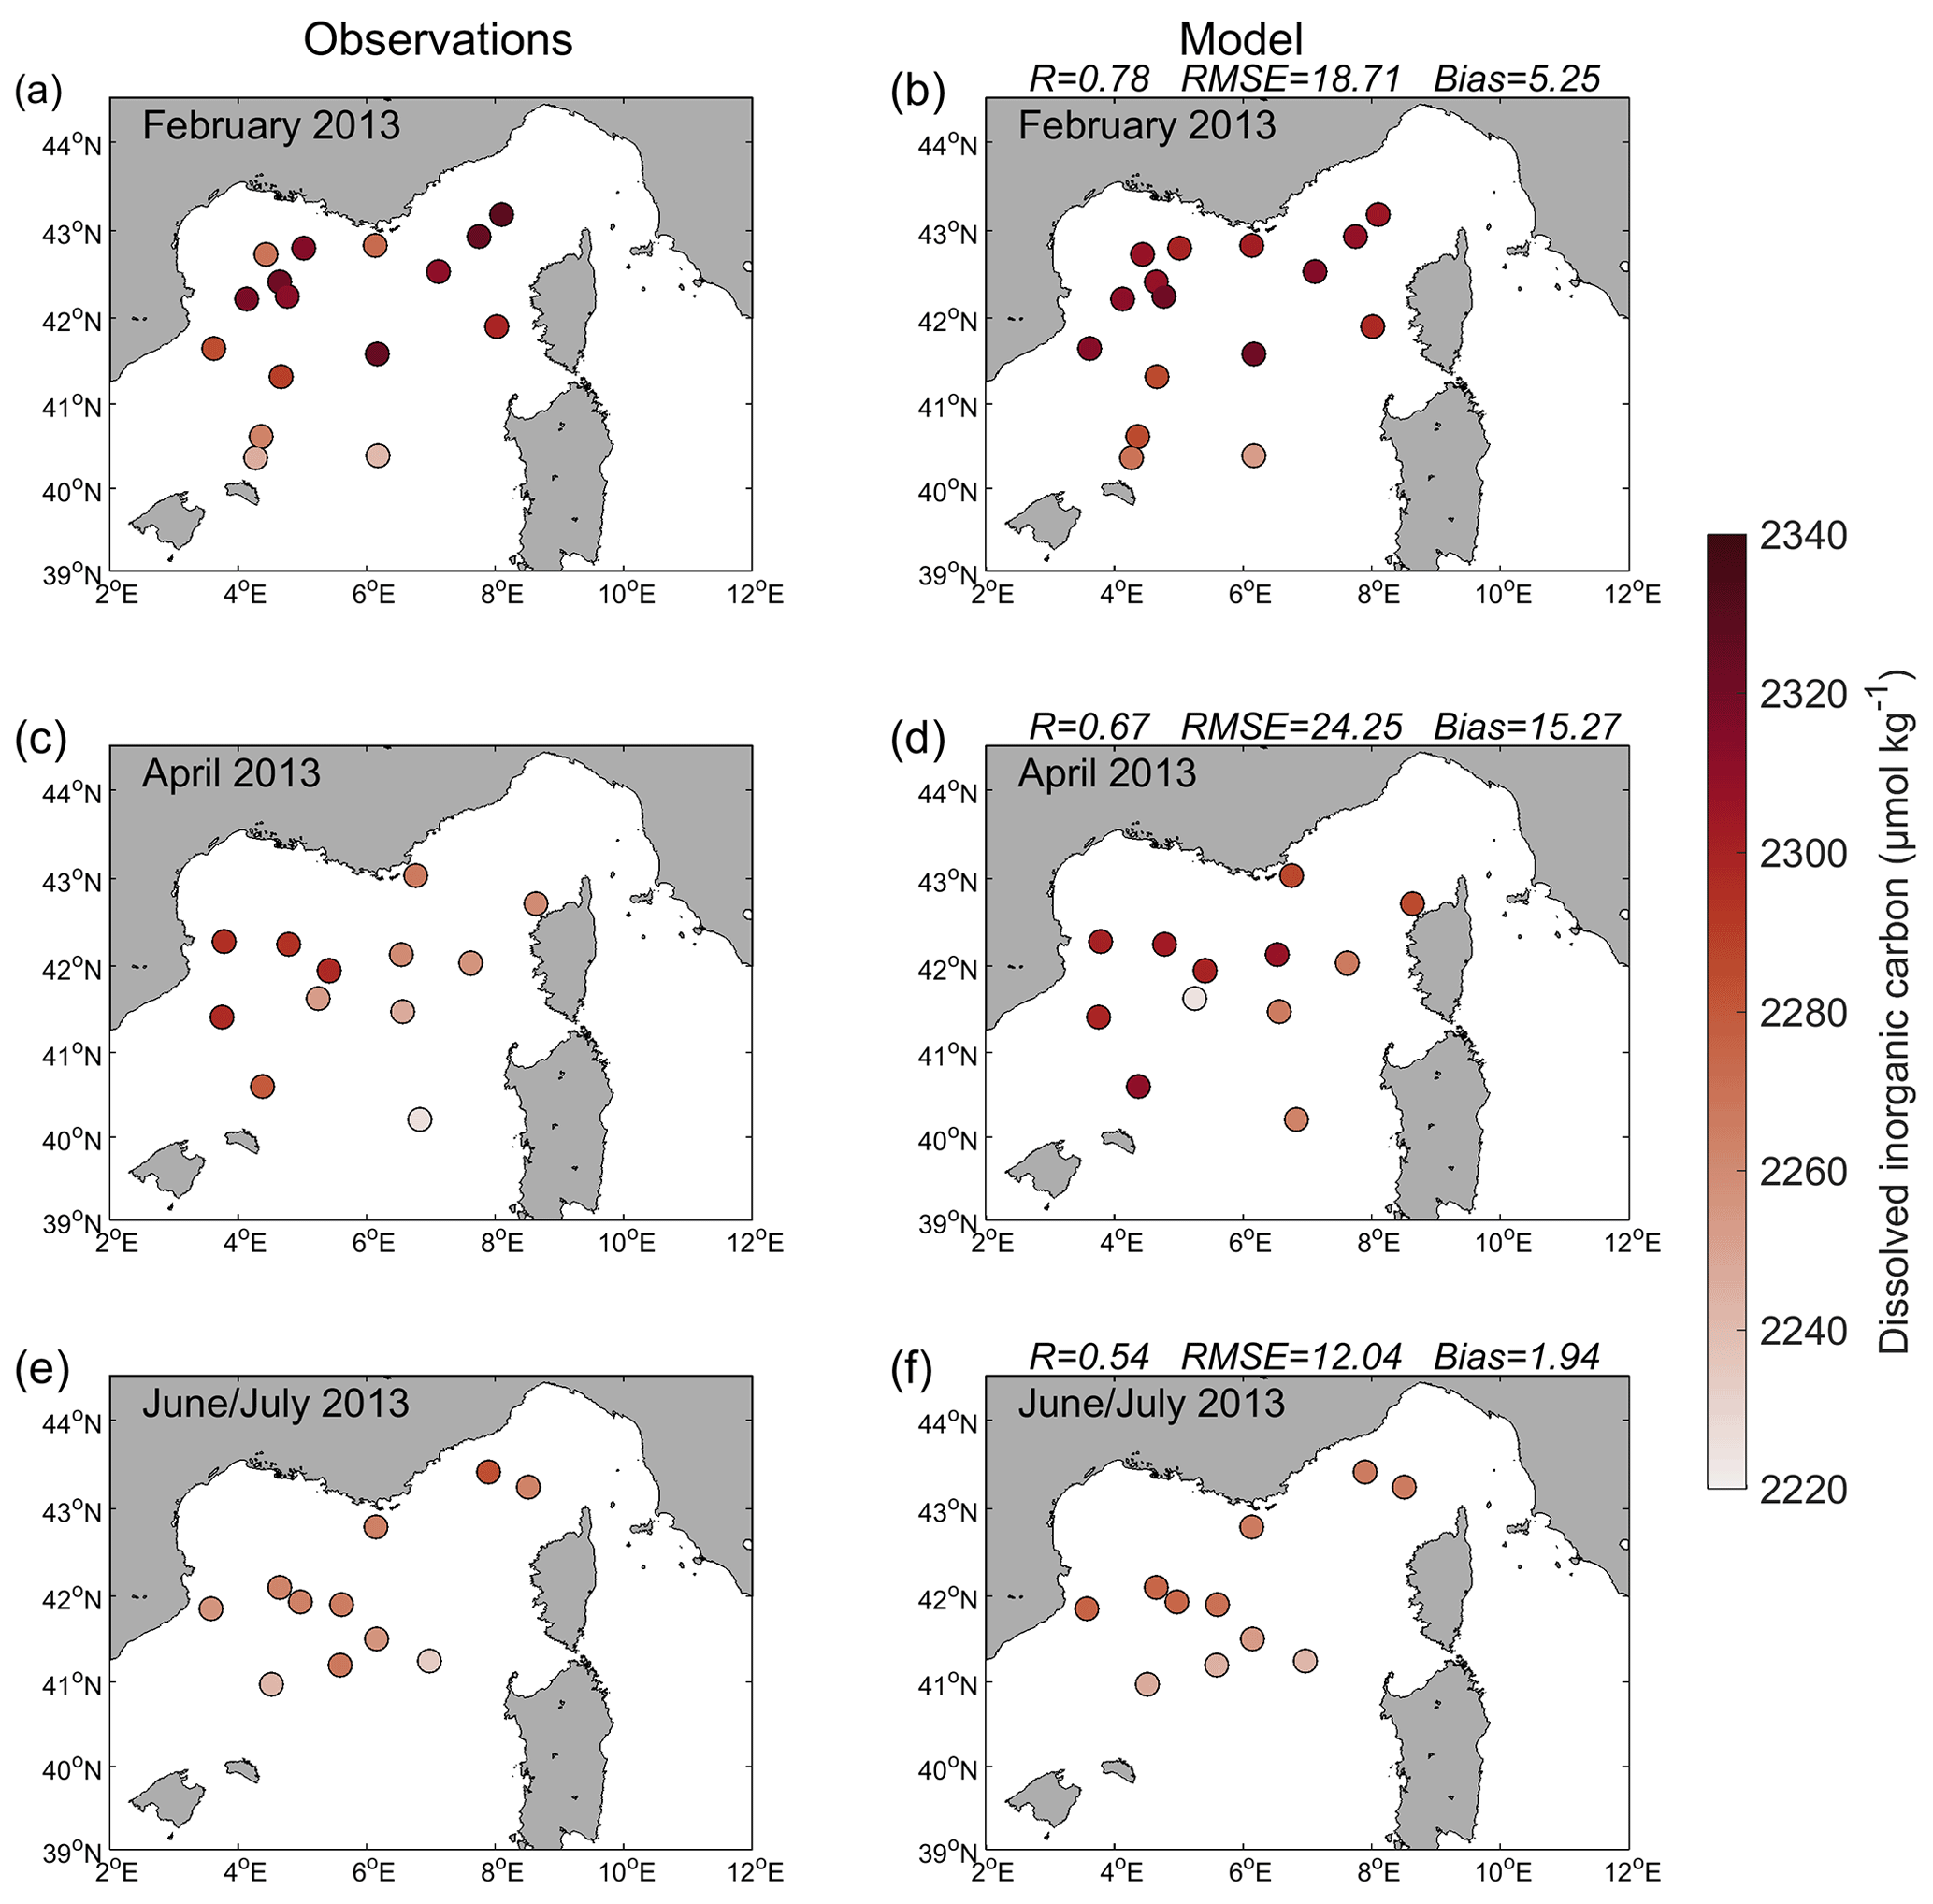
Figure 4Surface dissolved inorganic carbon (DIC) concentration (µmol kg−1) observed (a, c, e) and modeled (b, d, f) over the (a, b) DEWEX Leg1 (1–21 February 2013), (c, d) DEWEX Leg2 (5–24 April 2013), and (e, f) MOOSE-GE (11 June–9 July 2013) cruise periods. The correlation coefficient (R), root mean square error (RMSE), and bias between surface observed and modeled DIC are indicated in (b, d, f).
A comparison of modeled surface (from 5 to 10 m depth) DIC concentrations from DEWEX Leg1, DEWEX Leg2, and MOOSE-GE cruise observations is shown in Fig. 4. Figure 5 shows the modeled and observed DIC vertical profiles in the deep-convection area (indicated in Fig. 1 and defined in Sect. 2.1.3) and south of this zone (latitude <41∘ N) in the Balearic Front, where winter vertical mixing is shallower (Ulses et al., 2021), during the three cruise periods. Comparisons were performed by extracting model outputs at the same date and location as measurements. The statistical analysis for surface DIC concentrations indicates significant spatial correlations of 0.78, 0.67, and 0.54 (p value < 0.01); RMSEs of 18.71, 24.25, and 12.04 µmol kg−1; and biases of 5.25, 15.27, and 1.94 µmol kg−1 , compared, respectively, to DEWEX Leg1, DEWEX Leg2, and MOOSE-GE observations. The model correctly represents observed spatial variability. In winter, during the intense vertical mixing period, maximum values near the sea surface are found in the deep-convection zone (Fig. 4a–b), where the vertical profiles are almost homogeneous over the whole water column (Fig. 5a). In spring, the model represents the drops observed in the surface layer in both zones (Figs. 4c–d and 5b) due to phytoplankton growth (Kessouri et al., 2018). Finally, the model reproduces the low values observed at the surface in the deep-convection zone during the stratified period where the vertical profiles approach those observed in the southern zone (Figs. 4e–f and 5c). The statistical analysis based on the whole vertical profiles shows that the model is significantly correlated with the observations (R>0.7, p value < 0.01), has an RMSE smaller than 20 µmol kg−1 and a standard deviation smaller than 25 µmol kg−1, close to that of the observations (bottom panel in Fig. 5a–c).
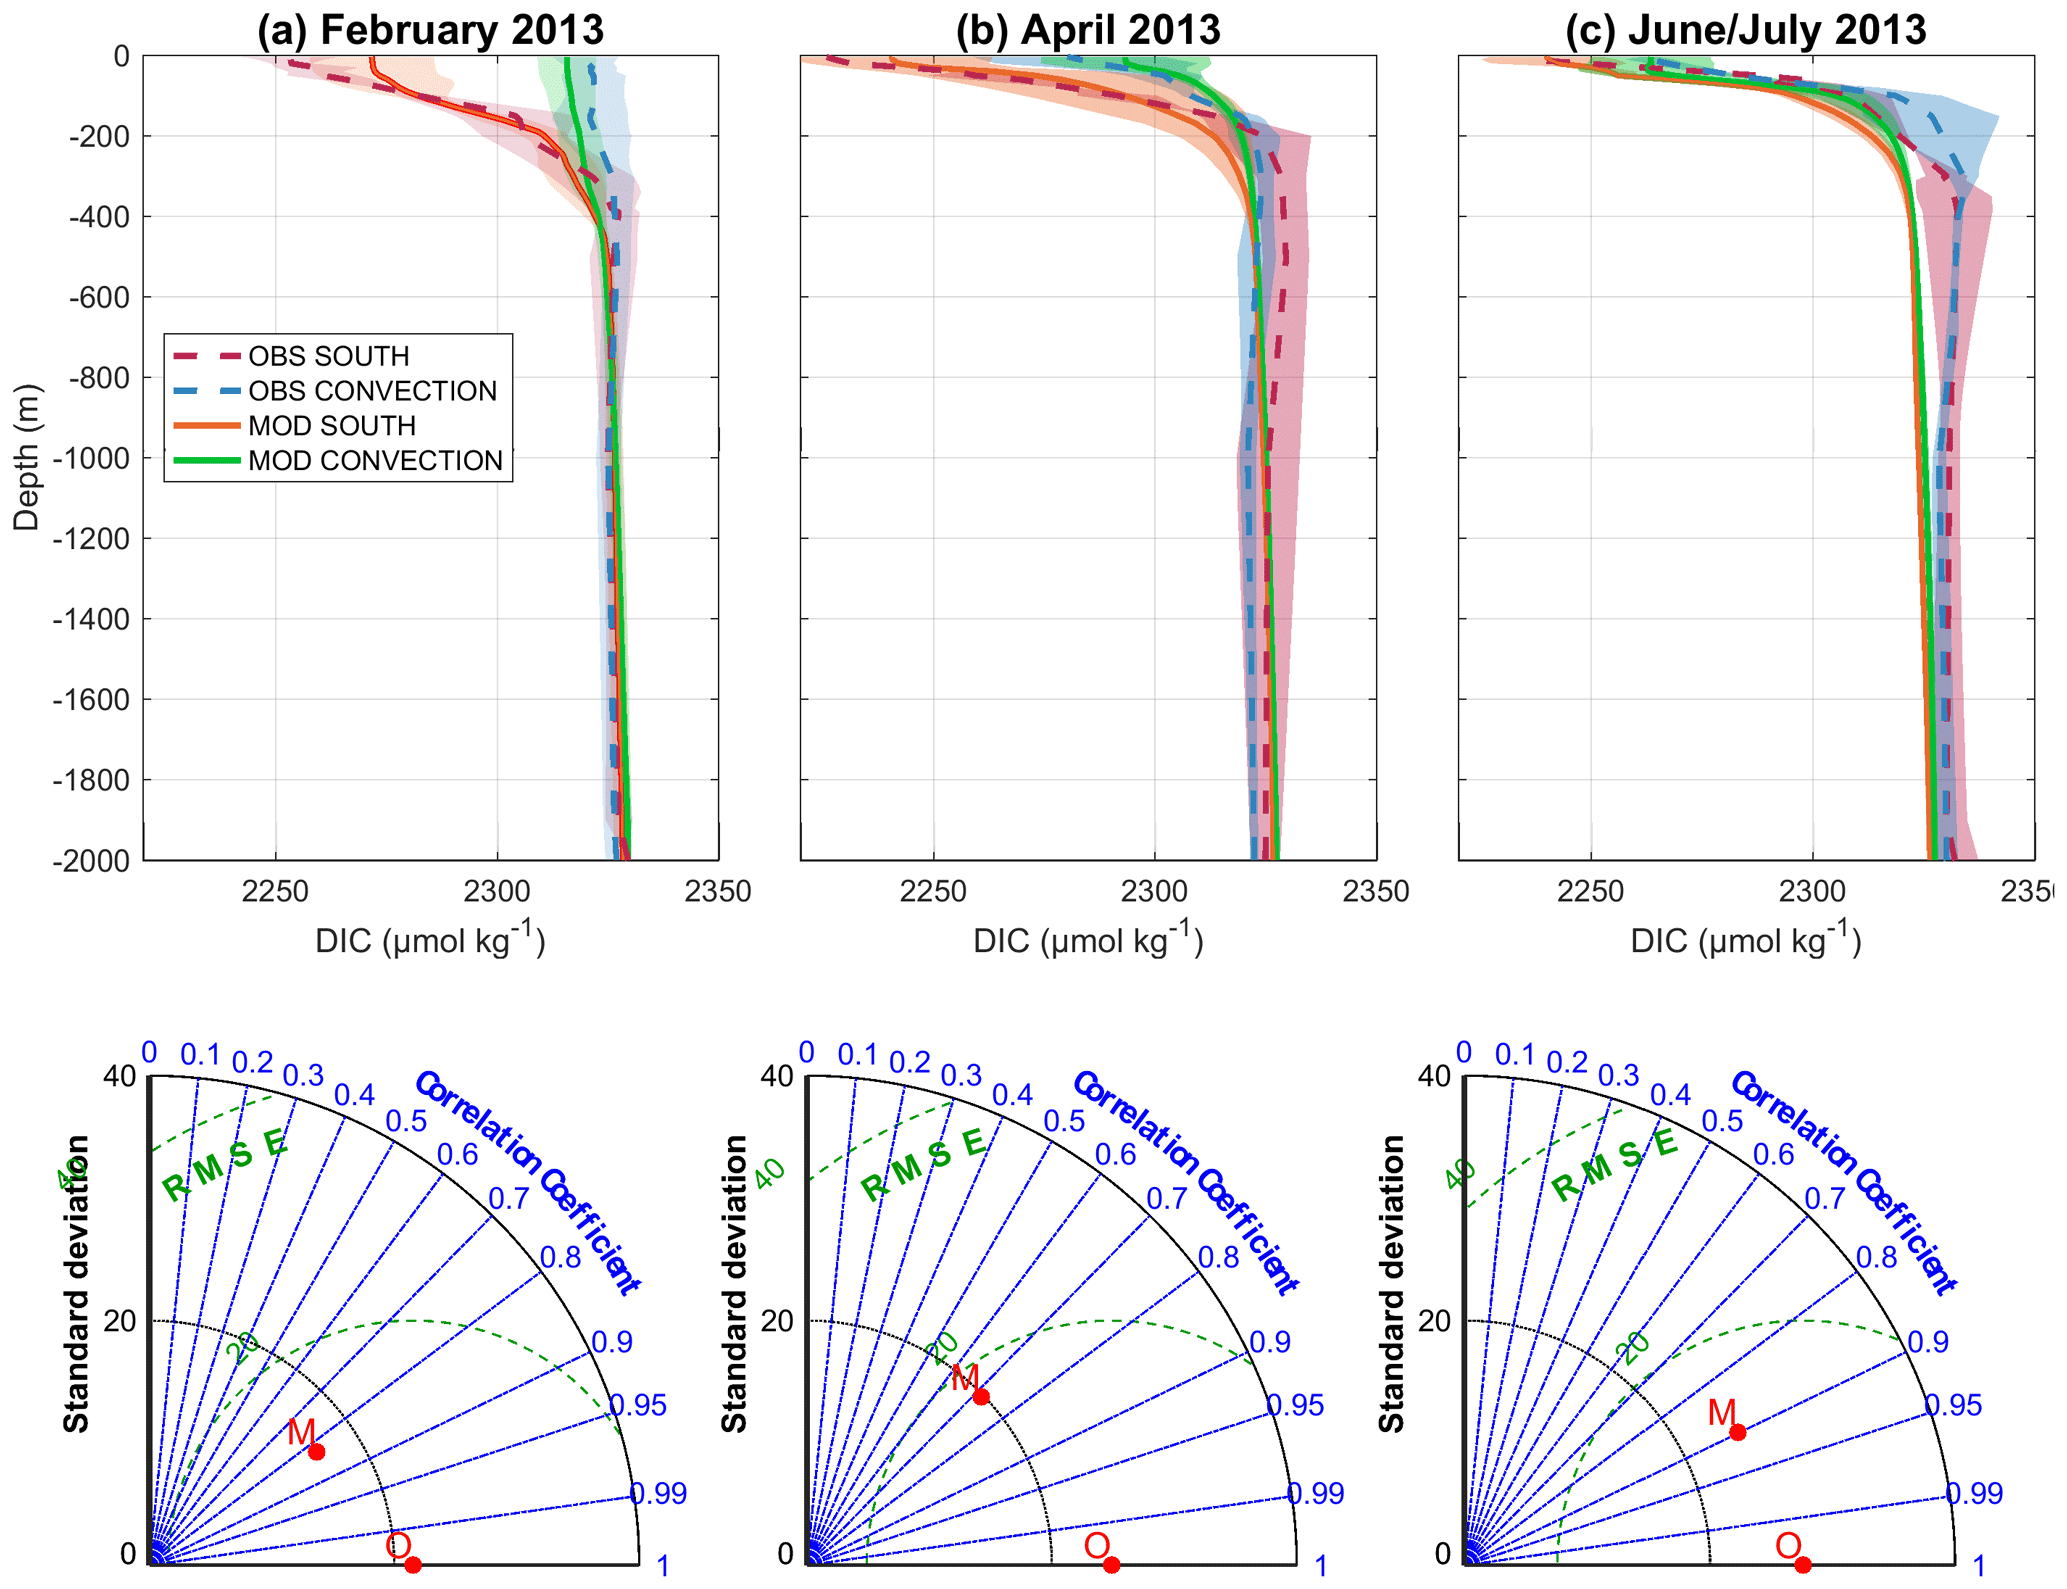
Figure 5Comparison between observed and modeled dissolved inorganic carbon (DIC) in the northwestern Mediterranean Sea over the (a) DEWEX-Leg1 (10–12 February 2013), (b) DEWEX-Leg2 (8–10 April 2013), and (c) MOOSE-GE (27 June–5 July 2013) cruise periods. (a–c) Observed (blue and red – mean is shown with dashed lines, and shaded areas are for standard deviation) and modeled (green and orange – mean is shown with solid lines, and shaded areas are for standard deviation) profiles in the deep-convection area and south of it (latitude < 41∘ N); (d–f) Taylor diagram summarizing the statistical comparisons between the entirety of the observations (noted O) collected during the three cruises and the corresponding model outputs (noted M): radius is standard deviation, angle is correlation coefficient, and distance from the origin is root mean square error (RMSE).
4.1 Seasonal cycle of dissolved inorganic carbon
We analyze here the seasonal cycle of the modeled dissolved inorganic carbon over the period September 2012–September 2013. Figure 6 shows the time evolution of atmospheric and hydrodynamic conditions, as well as of surface pCO2 and DIC fluxes, while Fig. 7 displays the cumulative DIC fluxes and the resulting change in DIC inventory for the upper (surface–150 m) and deeper (150 m–bottom) layers since 1 September 2012, along with schemes of seasonal budgets. Figure 8 shows maps of the seasonal mean pCO2 difference between the atmosphere and surface seawater (pCO2,atm–pCO2,sea) and air-to-sea CO2 flux. Finally, the time evolution of the DIC concentration profile averaged over the deep-convection area is shown in Fig. 9. The study year was divided into seasonal periods defined according to the timing of stratification and biogeochemical processes, specific to this year, according to the studies of Kessouri et al. (2017, 2018).
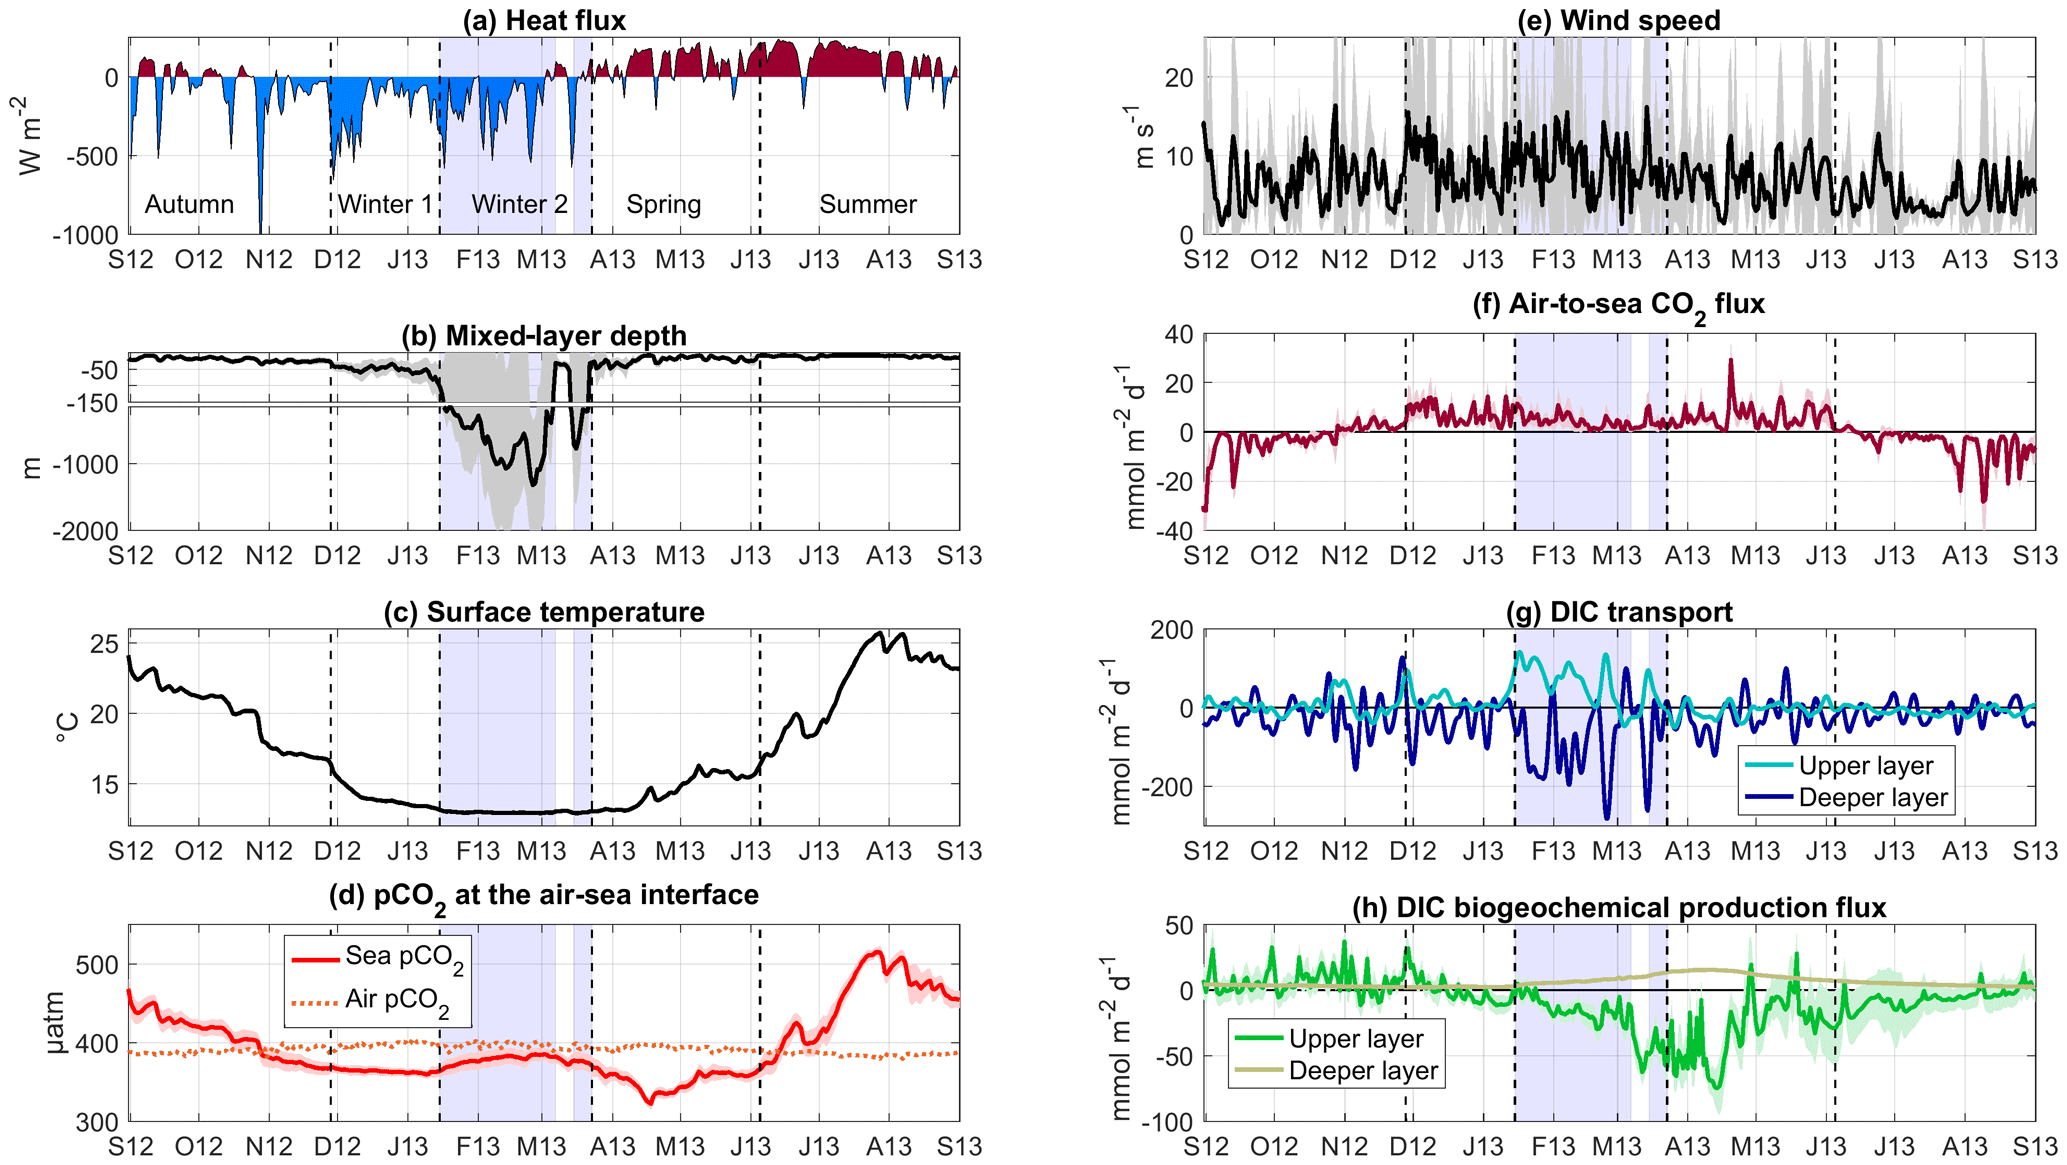
Figure 6Time series of modeled (a) total surface heat fluxes (W m−2), (b) mixed-layer depth (m), (c) sea surface temperature (∘C), (d) sea surface and atmospheric pCO2 (µatm), (e) wind speed (m s−1), (f) air-to-sea CO2 flux (mmol C m−2 d−1), (g) DIC total (vertical plus lateral) transport in the upper (light blue) and deeper layer (dark blue) towards the deep-convection area (mmol C m−2 d−1), and (h) DIC biogeochemical production (see Eq. 1, mmol C m−2 d−1) in the upper (green) and deeper (brown) layer. All the parameters are spatially averaged over the defined deep-convection area (spatial mean is shown with the solid line, and the shaded area is for SD). Sources: ECMWF for air–sea heat flux and wind speed, SYMPHONIE/Eco3M-S for the other parameters and fluxes. The blue shaded area corresponds to the deep-convection period (period when spatially averaged mixed-layer depth >100 m). Note that the range of the y axis varies for the different carbon fluxes, and due to higher values, SD for transport is not shown.
4.1.1 Autumn (1 September–27 November, 88 d)
After a period of alternating heat gain and loss events, and with the intense northerly wind event that occurred at the end of October (spatial mean heat loss reached 1000 W m−2), the deep-convection area continuously transferred heat to the atmosphere (Fig. 6a and e). The sea surface heat loss induced drops of surface temperature (Fig. 6c) and vertical mixing with a mixed layer that, on average, was shallower than 50 m during the whole autumn period (Fig. 6b).
Regarding biogeochemical processes, the shallowing of the nutricline and vertical mixing events induced nutrient supplies into the upper layer that favored primary production and growth of phytoplankton near the surface from the end of October (Kessouri et al., 2017, 2018, and Fig. 9a). This led, notably, temporally, to a low DIC concentration in the mixed layer at the end of October and end of November (Fig. 9b). However, over the whole fall period, respiration dominated primary production (Kessouri et al., 2018) (Fig. 6h), yielding a cumulative flux of DIC of 0.56 mol C m−2 and 0.30 mol C m−2 in the upper (surface–150 m) and deeper (150 m–bottom) layers, respectively, over the 88 d period (Fig. 7).
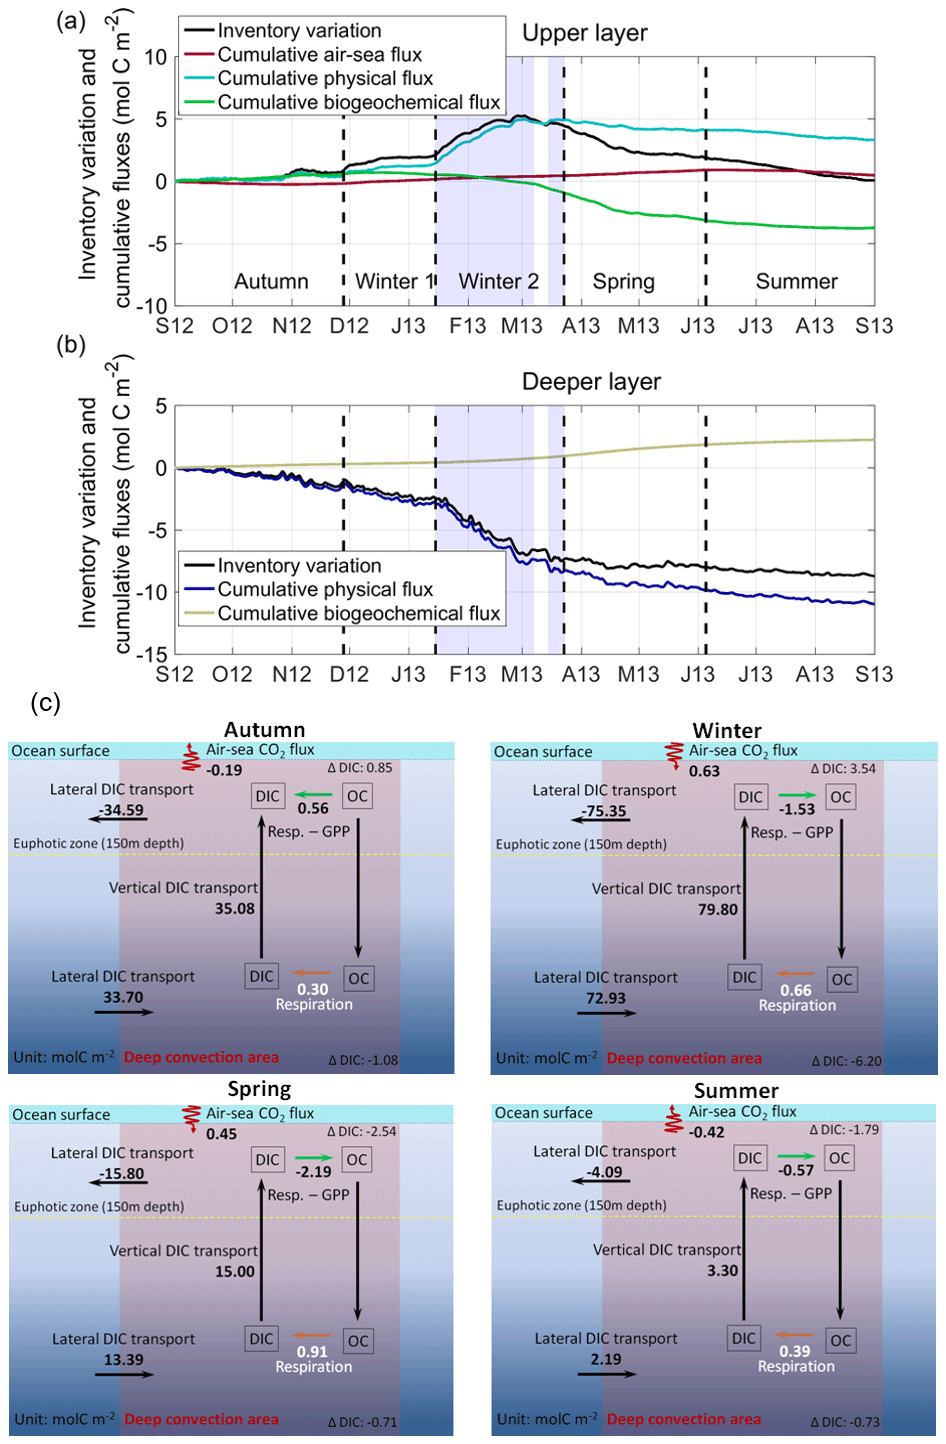
Figure 7Time series of variation in dissolved inorganic carbon (DIC) inventory since 1 September 2012 (black) and cumulative air–sea (red), physical (light and dark blue), and biogeochemical (bright and brown green) flux of dissolved inorganic carbon in the (a) upper (surface to 150 m) and (b) deeper (150 m to bottom) layers from September 2012 to September. The cumulative flux at a day d is the time-integrated flux over the period from the 1 September 2012 to day d (mol C m−2). Positive values of fluxes represent DIC inputs for the deep-convection area. The blue shaded area corresponds to the deep-convection period (period when spatially averaged mixed-layer depth >100 m). The DIC inventory on 1 September 2012 was 353 and 5560 mol C m−2 in the upper and deeper layers, respectively. (c) Scheme of cumulative seasonal fluxes (in mol C m−2) over the respective periods (fall: 88 d, winter: 116 d, spring: 74 d, and summer: 87 d). Resp. stands for respiration, and GPP stands for gross primary production. The direction of the arrows indicates the direction of the fluxes, and positive values correspond to DIC inputs for the deep-convection area.
The net physical fluxes of DIC at the deep-convection area boundaries fluctuated between −150 and 150 mmol C m−2 d−1 in the upper and deeper layers (Fig. 6g). More specifically, our model results show a net cumulative upward transport of DIC of 35.08 mol C m−2 into the upper layer of the area, while the cumulative lateral transport led to a loss of DIC of 34.59 mol C m−2 in the upper layer and a gain of DIC of 33.70 mol C m−2 in the deeper layer of the deep-convection area (Fig. 7c). This is probably induced by the upwelling and the surface divergence associated with the dynamics of the cyclonic gyre (Estournel et al., 2016). The lateral and vertical physical transfers at the boundaries resulted in a net increase in DIC inventory in the upper layer of 0.49 mol C m−2 and a net decrease in DIC inventory in the deeper layer of −1.38 mol C m−2.
Over the whole autumn period, sea surface pCO2 decreased with temperature (Fig. 6c and d, coefficient correlation of 0.99 with p value < 0.01). The air–sea CO2 flux displayed strong out-gassing peaks exceeding −20 mmol C m−2 d−1 during the northerly wind events that occurred in early and mid-September (Fig. 6f), when the pCO2 difference was greater than 60 µatm (Fig. 6d). During the intense event of heat loss and cooling at the end of October, the deep-convection area became deficient compared to the atmosphere (sea surface pCO2 smaller than atmospheric pCO2) (Fig. 6d) and started to absorb atmospheric CO2 (Fig. 6f). The air–sea flux displayed ingassing peaks smaller than 6 mmol C m−2 d−1 in November (Fig. 6f), characterized by pCO2 differences smaller than 30 µatm (Fig. 6d) and moderate wind speeds (Fig. 6e). Considering the whole autumn period (88 d), the deep-convection area was a weak source of CO2 for the atmosphere, with a cumulative air–sea flux that amounted to −0.19 mol C m−2 (Fig. 7a, c). Characterized by low temperature, the deep-convection area, outside its southwestern region, showed small averaged pCO2 differences (<25 µatm, Fig. 8a) and weak mean out-gassing fluxes compared to the surrounding open sea (Fig. 8e). In the southwestern region, intrusions of warm water from the Balearic Sea, characterized by higher pCO2 and associated with strong wind speeds (not shown), favored maximum out-gassing fluxes.
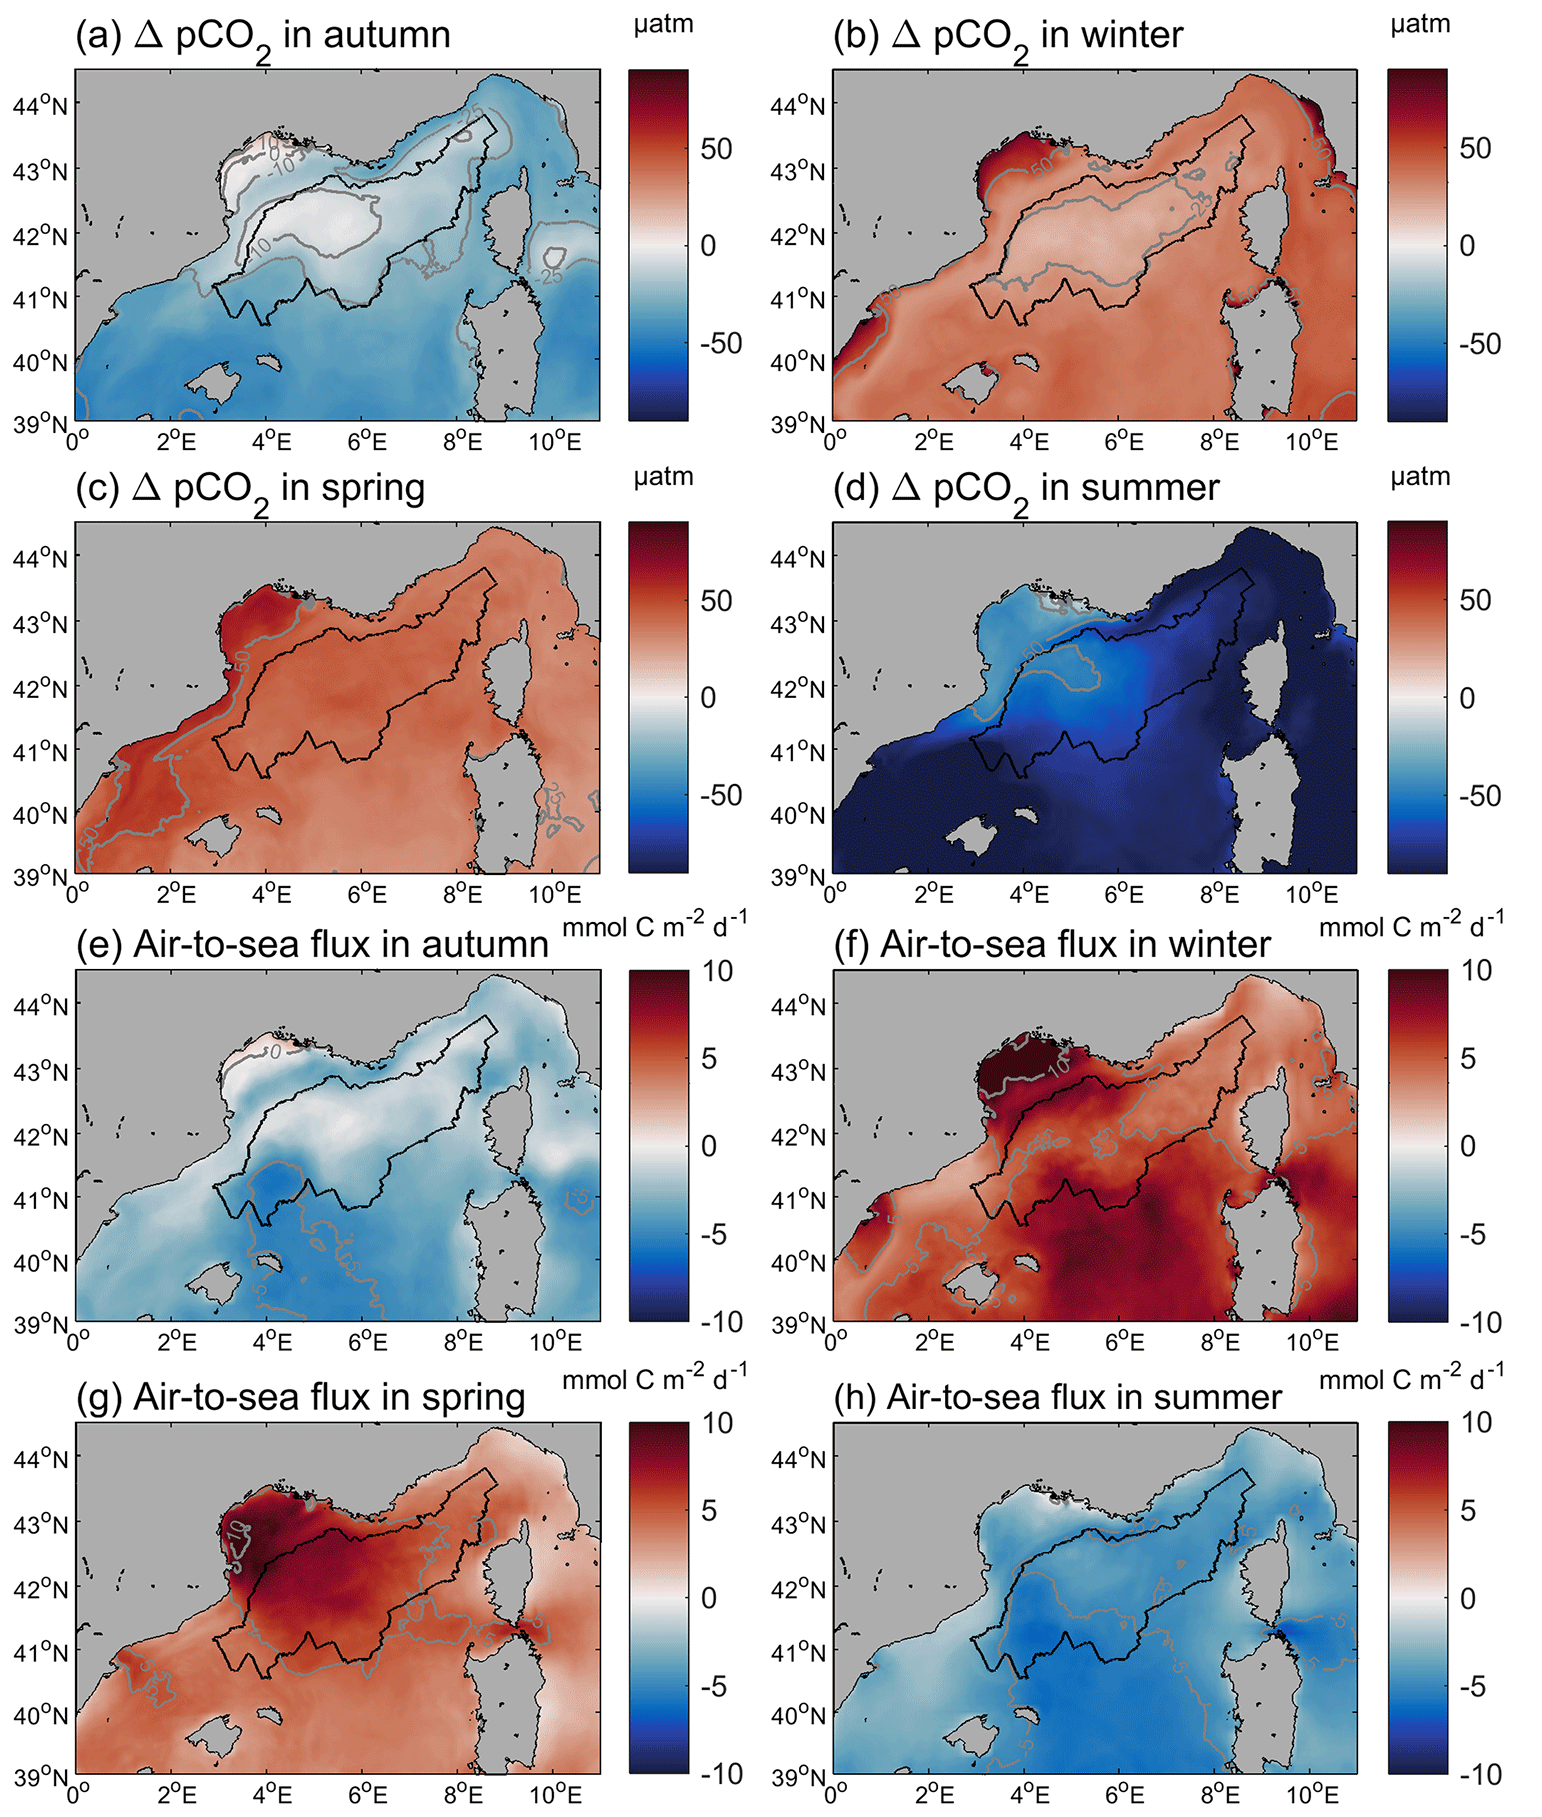
Figure 8Seasonal averages of modeled (a–d) pCO2 difference (pCO2,atm–pCO2,sea, in µatm) and (e–h) air-to-sea CO2 flux (mmol C m−2 d−1). Note that the periods of seasons here are defined in Sect. 4.1 according to mixed-layer depth and biogeochemical processes (fall: 1 September–27 November, winter: 28 November–23 March, spring: 24 March–5 June, summer: 6 June–31 August). Gray lines indicate in (a) to (d) pCO2 difference isolines (−50, −25, −10, 0, 10, 25, 50 µatm) and in (e) to (h) CO2 flux isolines (−10, −5, 0, 5, 10 mmol C m−2 d−1); the black line indicates the limit of the deep-convection area.
Finally, the inventory of DIC changed by 0.85 and −1.08 mol C m−2 over the autumn period in the upper and deeper layers, respectively (Fig. 7). To sum up, the upper layer gained DIC through biogeochemical and physical processes and lost DIC through out-gassing to the atmosphere.
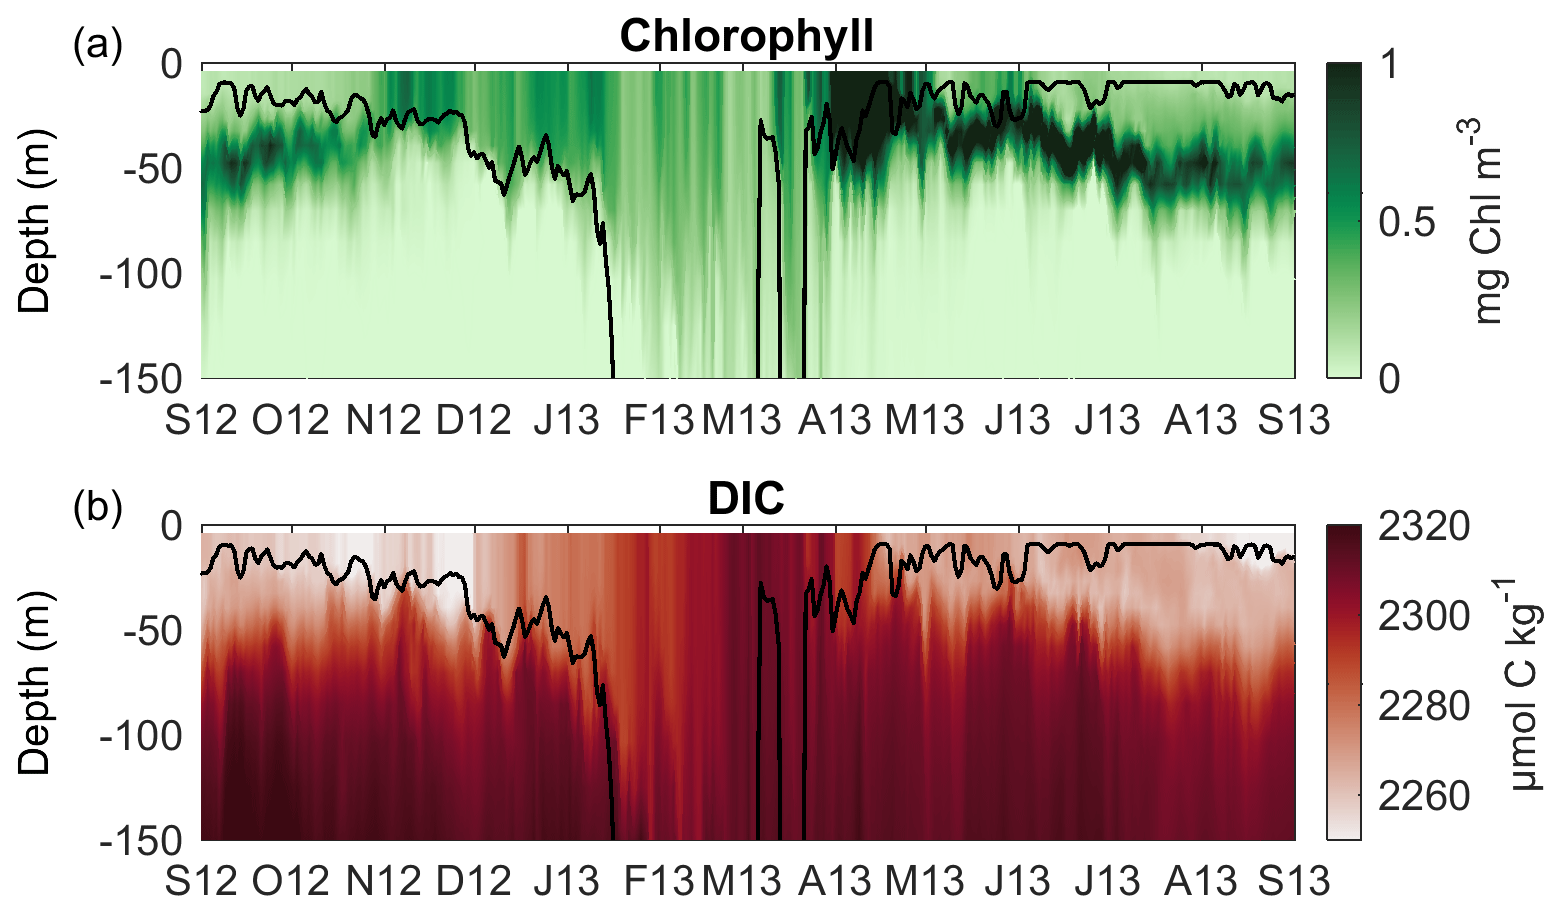
Figure 9Time evolution of (a) Chlorophyll-a (mg Chl m−3) and (b) dissolved inorganic carbon (DIC, µmol C kg−1) concentration profile, with mixed-layer depth (m) indicated by the black line, horizontally averaged over the deep-convection area.
4.1.2 Winter (28 November–23 March, 116 d)
The winter period can be further divided into two sub-periods based on the magnitude of vertical mixing (Kessouri et al., 2017).
-
Winter sub-period 1. During the first winter period (end of November–mid-January), heat loss events induced an intensification of vertical mixing that remained moderate with the spatially averaged mixed-layer depth above the euphotic layer depth (150 m) (Figs. 6a, b and 9). Vertical mixing induced new supplies of inorganic nutrients into the upper layer, supporting primary production near the surface (Kessouri et al., 2017, 2018). From mid-December, a net consumption of DIC is modeled in the whole upper layer (Fig. 6h). The cumulative biogeochemical fluxes in the upper layer showed a progressive decrease during the first winter period, leading to a weak cumulative consumption of DIC of 0.05 mol C m−2 over 49 d (Fig. 7a).
The physical fluxes at the limit of the upper layer of the deep-convection area showed similar patterns to those during autumn, with a cumulative upward flux of DIC into the upper layer of 41.40 mol C m−2 over a 2.5 month period, almost counterbalanced by a cumulative lateral export of DIC of 40.44 mol C m−2 in the upper layer and a cumulative lateral input of DIC of 39.90 mol C m−2 in the deeper layer. The net physical fluxes led to a gain of 0.97 mol C m−2 in the DIC inventory of the upper layer and a loss of DIC of 1.51 mol C m−2 in the deeper layer (Fig. 7).
Until mid-January, sea surface pCO2 continued to decrease with temperature, yielding a reinforcement of the pCO2 difference from 30 to 40 µatm (Fig. 6c and d). The spatial mean air–sea CO2 flux reached 15 mmol C m−2 d−1 during the northerly wind events (Fig. 6e and f). Over the first winter period (49 d) the deep-convection area absorbed 0.35 mol m−2 of atmospheric CO2 (Fig. 7a).
In summary, the euphotic layer showed an increase in the DIC inventory of 1.27 mol C m−2, resulting from a gain through air–sea fluxes and physical transport, and a weak net biogeochemical flux (Fig. 7a).
-
Winter sub-period 2. The second winter period, which began in mid-January, was characterized by deep convection. The mixed layer deepened strongly during the intense heat loss events that occurred until the end of February (Fig. 6a–b). After a 16 d pause during which surface restratification caused the mixed layer to be shallower, a new northerly wind generated a secondary deep-convection event in late March. During the second winter period (mid-January–end of March), vertical mixing reached deep water masses (Fig. 6b). Surface temperature remained relatively constant at a value of ∼12.9 ∘C, close to deep water temperature (Fig. 6c).
Regarding the biogeochemical fluxes, the net consumption of DIC progressively increased in the upper layer with the decrease in heterotrophic respiration and the moderate increase in primary production rates (Kessouri et al., 2018). It accelerated when vertical mixing ceased in mid-March and remained high until the end of the period. The cumulative biogeochemical flux reached −1.49 mol C m−2 over this sub-period of 67 d.
Vertical and horizontal exchanges showed the same patterns as during the preconditioning period (fall and first period of winter), but the difference between vertical and horizontal transports became more pronounced, leading to net physical fluxes exceeding 110 mmol C m−2 d−1 in the upper layer and −160 mmol C m−2 d−1 in the deeper layer during the four northerly wind events. The physical fluxes integrated over the second winter period reached 3.48 and −5.36 mol C m−2 in the upper and deeper layers, respectively.
Despite the biogeochemical consumption of DIC, a progressive increase in DIC concentration in the upper layer is clearly visible in Fig. 9b due to vertical transport. The upward fluxes led to an increase in sea surface pCO2, showing values that were, on average, close to equilibrium (Fig. 6d). The pCO2 difference decreased; despite intense wind events, air–sea flux peaks remained lower than 12 mmol C m−2 d−1; and, finally, the cumulative air–sea flux reached 0.28 mol C m−2 over the second winter sub-period of 67 d (a lower value and flux (3.1 versus 7.3 mmol C m−2 d−1) than over the first winter period).
To summarize, the upper layer showed a gain in DIC inventory through vertical transport and, to a lesser extent, uptake of atmospheric CO2, while it lost DIC through lateral transport and biogeochemical processes (Fig. 7a).
-
All winter periods. The pCO2 difference and air–sea fluxes averaged over the whole winter period (end November–end March; Fig. 8b and f, respectively) integrate various processes: (1) mistral and tramontane northerly winds blowing, on average, over a northwest–southeast axis over the Gulf of Lion (Fig. S2e, f) intensified air–sea fluxes on this axis; (2) low sea surface temperature in the deep-convection region favored an amplification of the pCO2 difference and maximum air–sea fluxes during the first winter period, especially at the northern edge of the convection zone (Fig. S2a, c); and (3) high surface DIC concentrations in the regions of intense vertical mixing generated a reduction in the pCO2 difference and air–sea fluxes, especially during the second winter period (Fig. S2b, d). The maxima of the lateral DIC transport in the upper layer of the water column averaged over the whole winter period are found in the general circulation, especially in the Northern Current, the Balearic Current, and the Balearic Front, separating the southern, less salty Atlantic waters from the deep-convection salty waters (Fig. 10a, c). The instabilities developing at the periphery of the deep-convection area favored the incorporation of saltier and DIC-rich waters in the general circulation through a bleeding effect, similarly to that described by Herrmann et al. (2008) for the export of newly formed dense waters from the deep-convection area (i) at the western boundaries of the deep-convection area towards the Balearic Sea and towards the Algerian basin through the southern extension of the Balearic Current and (ii) along the Balearic Front between the Minorca Balearic Island and Corsica, as illustrated in Fig. 10c, d. Finally, Fig. 10b shows that the vertical DIC supply into the upper layer during winter resulted from small-scale upward and downward vertical fluxes due to the absence of stratification.
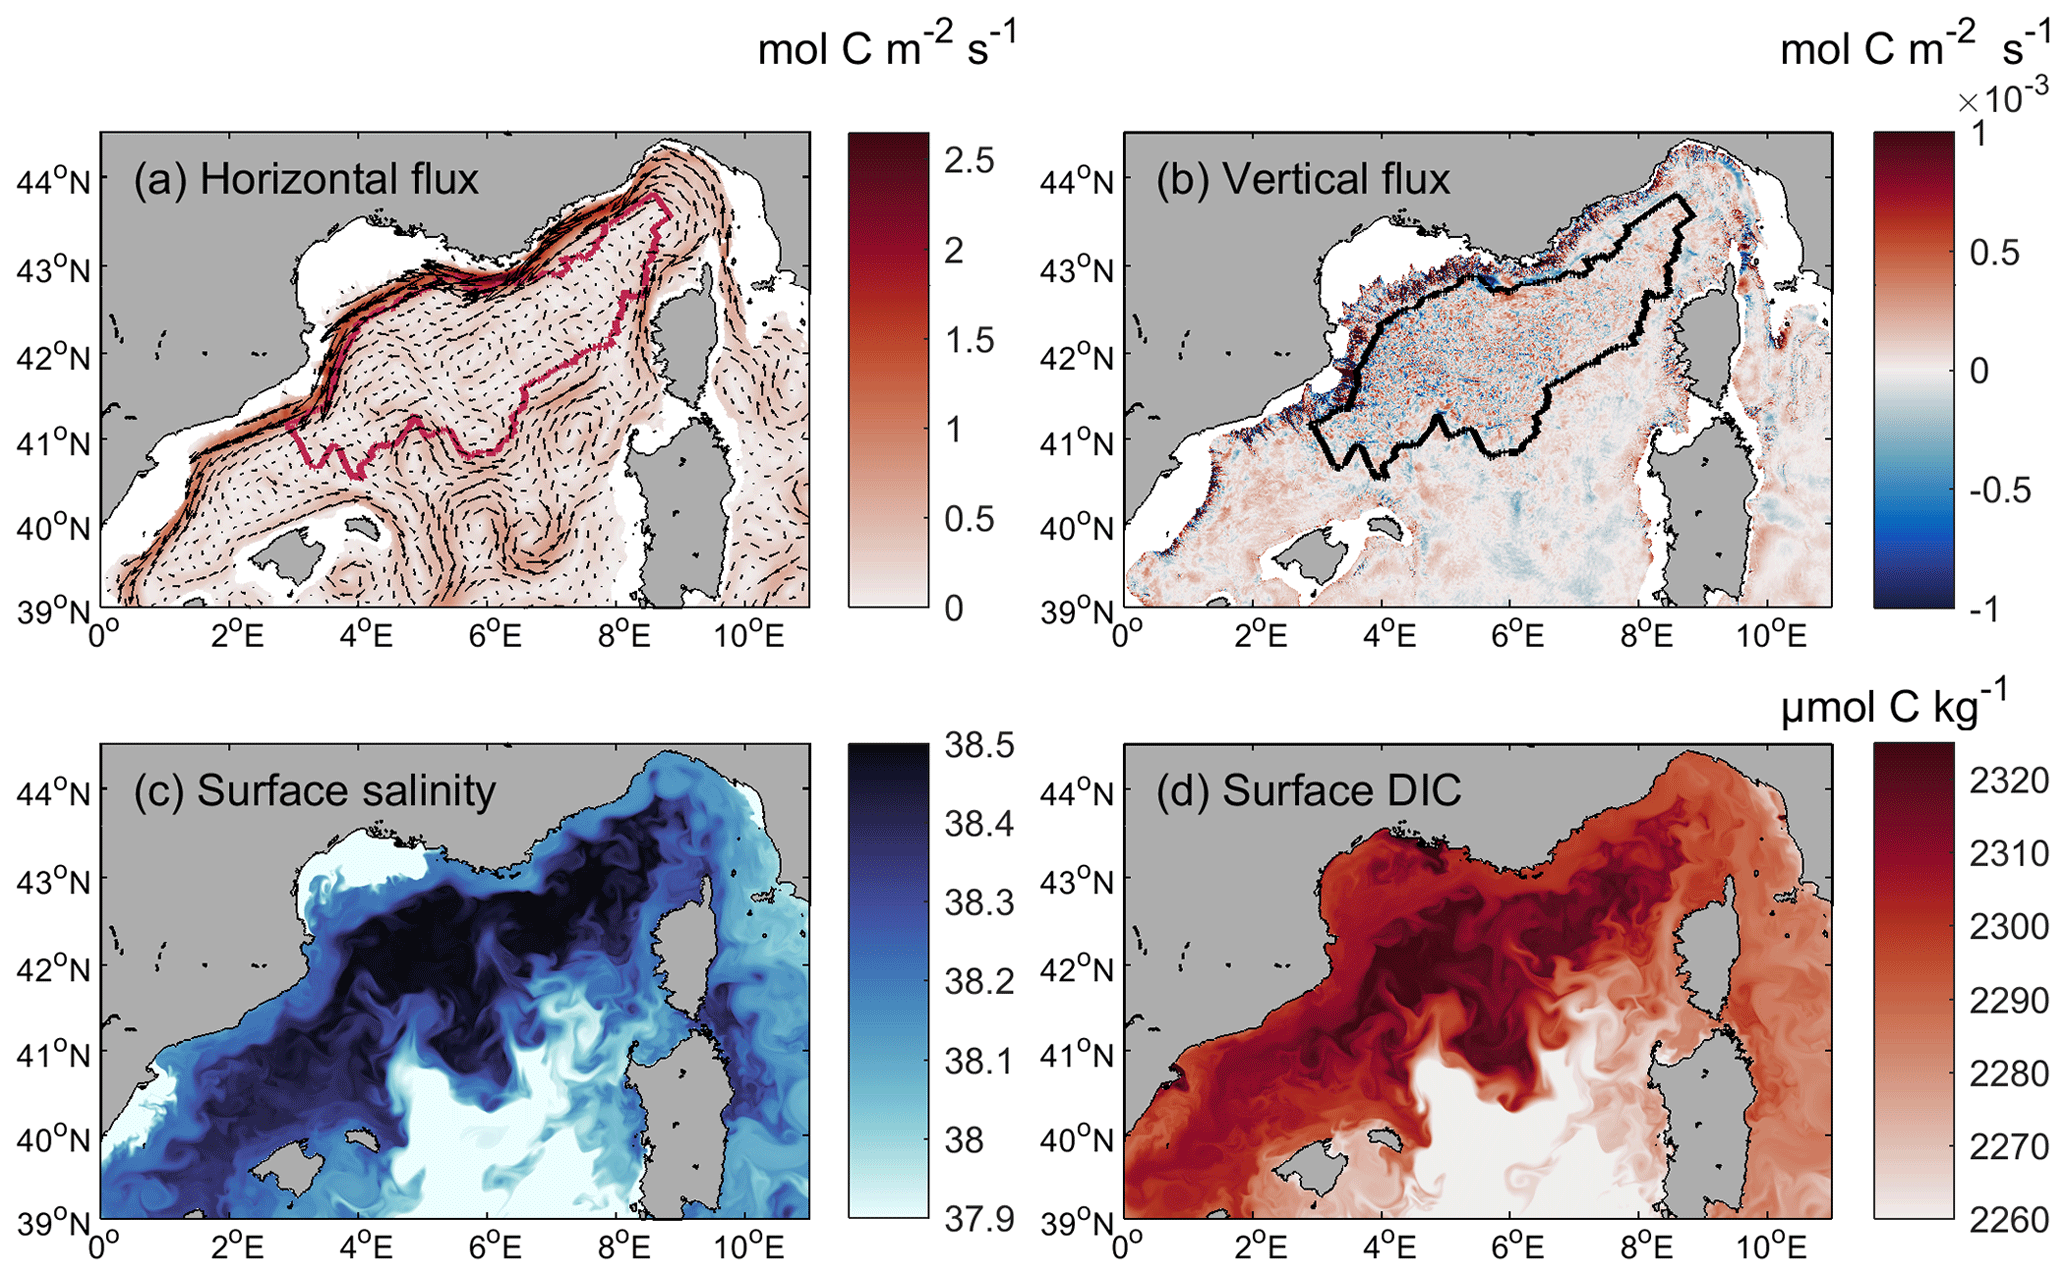
Figure 10(a) Winter horizontal flux of dissolved inorganic carbon (DIC, mol C m−2 s−1) vertically integrated over the upper layer (0–150 m), (b) winter vertical DIC flux (mol C m−2 s−1) at 150 m, (c) surface salinity, and (d) DIC concentration (µmol C kg−1) on 4 March 2013. The red and black lines in (a) and (b), respectively, indicate the limit of the deep-convection area.
4.1.3 Spring (24 March–5 June, 74 d)
From the end of March, total surface heat flux remained mostly positive (Fig. 6a). The water column rapidly stratified with a mixed-layer thickness lower than 50 m (Fig. 6b). The cessation of deep vertical mixing favored the onset of a spring phytoplankton bloom, with a peak of primary production and phytoplankton concentration at the surface mid-April (Fig. 9a; Kessouri et al., 2018), leading to a sustained consumption of DIC (Figs. 6h, 7a, and 9b). From mid-April, the near-surface layer became depleted in nutrients, a deep chlorophyll maximum (DCM) formed and progressively deepened (Fig. 9a; Kessouri et al., 2018), and the consumption of DIC was slowed down in the upper layer (Figs. 6h and 7a). In the deeper layer, the rate of DIC production through heterotrophic remineralization of organic carbon, exported during the deep convection and the bloom, was maximum during this period (Fig. 6h). The contribution of biogeochemical processes to the DIC inventory over the spring period resulted in a loss of 2.19 mol C m−2 in the upper layer and a gain of DIC of 0.91 mol C m−2 in the deeper layer over the 74 d period (Fig. 7).
The net exchanges of DIC at the deep-convection area boundaries weakened in both the upper and deeper layers compared to the previous period (Fig. 6g). Over this restratification period, characterized by baroclinic instabilities (Jones and Marshall, 1997), the cumulative physical exchange flux was negative, leading to a loss of DIC of 0.80 mol C m−2 in the upper layer and of 1.62 mol C m−2 in the deeper layer over the 74 d period (Fig. 7).
Sea surface pCO2 decreased in early spring (Fig. 6d), when DIC was consumed through strong primary production. The pCO2 difference reached a maximum positive value of 75 µatm in mid-April, at the peak of the bloom. Afterwards, when the DCM was formed (Fig. 9a), sea surface pCO2 varied with sea surface temperature, which increased until early May and remained around 15 ∘C until the end of the spring period, when the pCO2 difference was around 30 µatm (Fig. 6c and d). The air–sea flux showed positive values, with a maximum uptake of 30 mmol C m−2 d−1 in mid-April during the bloom. Over the whole spring period, the deep-convection area absorbed 0.45 mol C m−2 of atmospheric CO2 (Fig. 7a and c). The mean spring pCO2 difference varied between 30 and 40 µatm over the deep-convection area (Fig. 8c). The mean air–sea CO2 flux was the strongest in the Gulf of Lion (Fig. 8g), where wind speed was maximum (not shown).
To sum up, the upper layer gained DIC through air–sea flux and lost DIC through biogeochemical processes and physical fluxes (Fig. 7). The loss of DIC by physical fluxes resulted from a prevalence of the loss through lateral transport in comparison to the gain through vertical transport.
4.1.4 Summer (6 June–31 August, 87 d)
Two long episodes of heat gain in June and July (Fig. 6a) generated a strong stratification of the water column with a mixed layer shallower than 20 m (Figs. 6b and 9), along with increases in surface temperature (Fig. 6c). Early August surface temperature started to slowly decrease. From August onwards, the DIC drawdown due to biogeochemical processes decreased, the primary production rate becoming close to the respiration rate (Fig. 6h). We estimate the contribution of biogeochemical processes in summer to be −0.57 mol C m−2 in the surface layer and 0.39 mol C m−2 in the deeper layer over an 87 d period (Fig. 7). The cumulative physical fluxes were again negative in both layers (Fig. 7). On average, the lateral export of DIC from the upper layer prevailed over the vertical supply of DIC into this layer.
Sea surface pCO2 shows a similar evolution to that of temperature (correlation coefficient of 0.99 (p value < 0.01), Fig. 6c and d). Very quickly at the beginning of the summer period, the deep-convection area came to be in excess of CO2 relative to the atmosphere. The pCO2 difference reached a maximum absolute value of 135 µatm at the end of July. The model outputs show peaks of CO2 out-gassing varying between 18 and 28 mmol C m−2 d−1 during the northerly wind events that occurred from the end of July. The deep-convection area released 0.42 mol C m−2 over the whole summer period (Fig. 7a, c). Similarly to the fall situation, the out-gassing fluxes were maximum in the western part of the delimited deep-convection area (Fig. 8h), influenced by both strong wind speeds and the arrival of warm waters from the Balearic Sea through anticyclonic circulations, which were characterized by higher pCO2 differences (between 70 and 90 µatm, Fig. 8d).
In summary, in summer, the upper layer of the deep-convection area decreased its DIC inventory in response to physical and biogeochemical processes, as well as out-gassing towards the atmosphere (Fig. 7a, c).
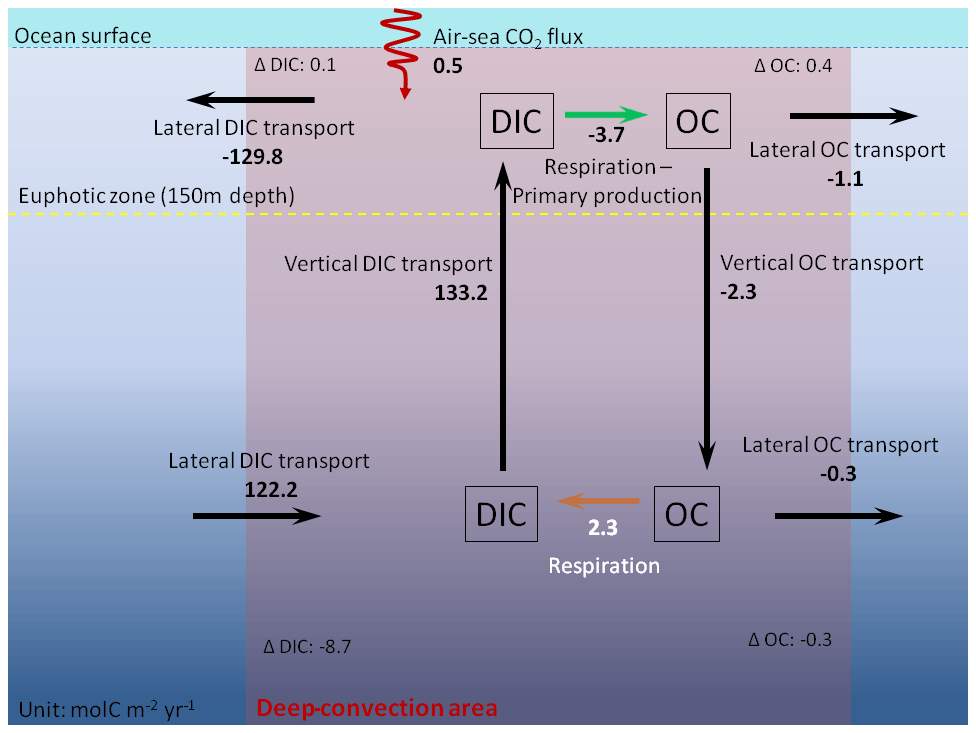
Figure 11Scheme of the annual carbon budget for the period September 2012 to September 2013 from the coupled model SYMPHONIE-Eco3M-S. Fluxes are indicated in mol C m−2 yr−1. The direction of the arrows indicates the direction of the fluxes, and positive values of fluxes represent DIC inputs for the deep-convection area (positive vertical fluxes represent inputs for the upper layer).
4.2 Annual carbon budget
Figure 11 shows a schematic of the annual budget of dissolved inorganic carbon in the deep-convection zone. Our model results show that the deep-convection area acted as a moderate CO2 sink for the atmosphere on an annual scale over the period September 2012–September 2013. We estimate that it absorbed 0.5 mol C m−2 yr−1 of atmospheric CO2. This uptake of atmospheric CO2 displayed spatial variability (Fig. 12). It was greater than 1 mol C m−2 yr−1 in the northern edge of the area along the Northern Current flowing over the Gulf of Lion continental slope and became less than 0.25 mol C m−2 yr−1 in the western and eastern edge areas. One can notice that the annual rate remained lower than on the Gulf of Lion's shelf, which is beyond the scope of this study. Within the sea, biogeochemical processes induced an annual DIC consumption of 3.7 mol C m−2 yr−1 in the upper layer and a DIC gain of 2.3 mol C m−2 yr−1 in the deeper layers. The deep-convection area thus appears as a net autotrophic region from a biogeochemical point of view, with a DIC consumption of 1.5 mol C m−2 yr−1 considering the whole water column.
Our estimate of net physical fluxes (lateral plus vertical) is an input of 3.3 mol C m−2 yr−1 into the upper layer and an export of 11.0 mol C m−2 yr−1 from the deeper layer. Specifically, the model indicates a vertical DIC supply of 133.2 mol C m−2 yr−1 from the deeper layer to the upper layer, partly offset by a lateral outflow of 129.8 mol C m−2 yr−1 in the upper layer and an inflow of 122.2 mol C m−2 yr−1 in the deeper layer. The budget in the deep layer masks different signs of physical fluxes: if the deeper layer is subdivided into an intermediate layer (150–800 m) and the deeper most layer (800 m–bottom), we find that the former, the intermediate layer, gained 83.1 mol C m−2 yr−1 of DIC through vertical transport, while it lost 87.6 mol C m−2 yr−1 of DIC through lateral export. Finally, our model shows that the convection zone was a source of DIC of 8.7 mol C m−2 yr−1 for the rest of the western Mediterranean Sea. While the DIC inventory in the upper layer remained stable (decrease of 0.07 mol C m−2 yr−1), the DIC inventory in the deeper layer experienced a decrease of 8.7 mol C m−2 yr−1. This loss occurred mainly during deep convection and, to a lesser extent, during the preconditioning period (in autumn and early winter).
Finally, we complete the inorganic carbon budget with the labile organic carbon fluxes (refractory organic carbon is not considered in our model). We estimate that, during the studied period a lateral export of organic carbon of 1.1 and 0.3 mol C m−2 yr−1, took place in the upper and deeper layers, respectively. The modeled downward export of organic carbon amounted to 2.3 mol C m−2 yr−1.
Based on high-resolution 3D modeling, we have estimated a DIC budget in the northwestern Mediterranean deep-convection zone over an annual period, September 2012–September 2013. Our results show that biogeochemical and physical processes, through their impacts on DIC concentration, both play a major role in the intensity and sign of the air–sea exchanges in the deep-convection area.
5.1 Assessment of the seasonal cycle of the pCO2
The seasonal pattern of the simulated sea surface pCO2 averaged over the deep-convection area, in deficit compared to the atmosphere from November 2012 to early June 2013 and in excess relative to the atmosphere the rest of the year, is similar to the one simulated at the EMSO-DYFAMED and BOUSSOLE sites (Fig. 3) and is in good agreement with those described in previous observational and modeling studies at these sites (Hood and Merlivat, 2001; Copin-Montégut and Bégovic, 2002; Bégovic and Copin-Montégut, 2002; Mémery et al., 2002; Copin-Montégut et al., 2004; Merlivat et al., 2018; Coppola et al., 2020). The high-frequency measurements at the CARIOCA buoy described by Hood and Merlivat (2001) and Merlivat et al. (2018) indicated an interannual variability of 4–5 weeks in terms of the date at which the pCO2 difference changes sign, depending on the interannual variability of air–sea heat flux and of the bloom onset. They showed that, in autumn, the change of sign extends from mid-September to the end of October, and in spring, it extends from early May to mid June. The magnitude of the variation of the modeled sea surface pCO2 (spatial mean: 193 µatm, between 322 and 515 µatm; at EMSO-DYFAMED site: 192 µatm) is in the range of those deduced from observations (120 µatm by Bégovic and Copin-Montégut (2002), 230 µatm by Hood and Merlivat (2001), and ∼200 µatm by Merlivat et al., 2018). More specifically, the impact of deep convection on sea surface pCO2 through a large upward transport of CO2-rich waters, leading to its increase, is consistent with previous studies. The measurements at the BOUSSOLE site gave evidence of brief windy periods marked by sea surface pCO2 higher than atmospheric pCO2 (Hood and Merlivat, 2001; Copin-Montégut and Bégovic, 2002; Copin-Montégut et al., 2004; Merlivat et al., 2018). The observations of the CASCADE cruise in March 2011 in the Gulf of Lion also showed high surface concentrations of DIC and sea surface pCO2 higher than atmospheric pCO2 in deep-convection cells (Touratier et al., 2016).
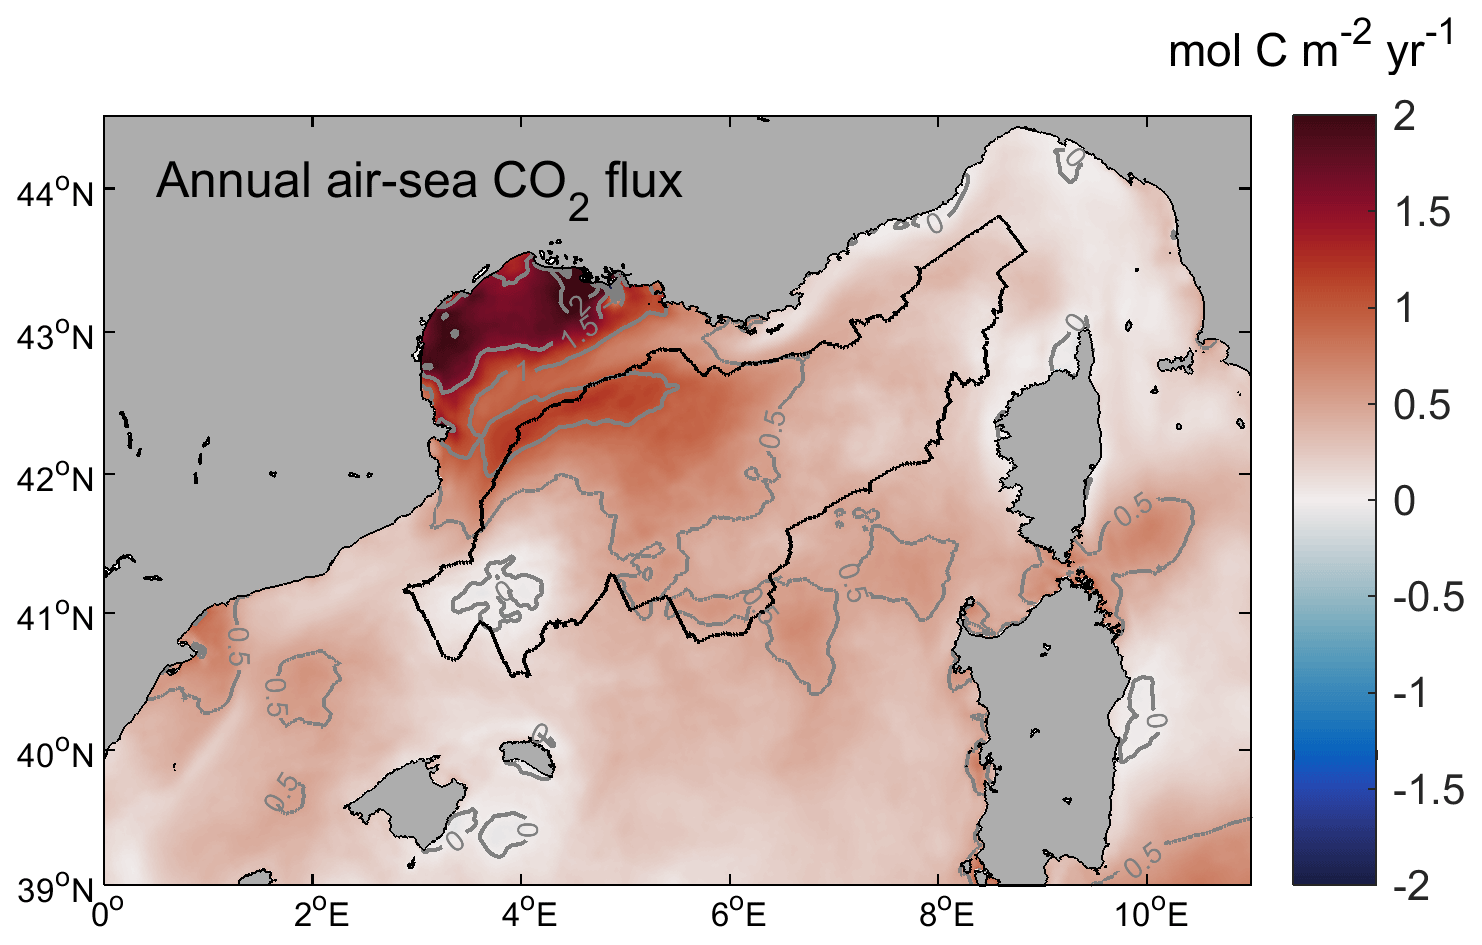
Figure 12Modeled annual air-to-sea CO2 flux (mol C m−2 yr−1) averaged over the period September 2012–September 2013. Gray lines indicate CO2 flux isolines (0, 0.5, 1, 1.5 mol C m−2 yr−1), and the black line indicates the limit of the deep-convection area.
5.2 Estimate of the annual air–sea CO2 flux and its uncertainties
On an annual scale, our results indicate that the deep-convection area was a sink for atmospheric CO2. Our estimate of the annual air-to-sea flux is 0.47 mol C m−2 yr−1, which, considering the surface of the zone, corresponds to an uptake of atmospheric CO2 of 0.4 Tg yr−1. This estimate is associated with various sources of uncertainties related to the modeling of the different physical, biogeochemical, and air–sea exchange processes. Regarding the wind speed accuracy, Ulses et al. (2021) calculated a percentage bias of −0.5 % and a normalized RMSE of 13.9 % based on comparisons between ECMWF forcing fields and high-frequency measurements during the DEWEX cruises. The statistical analysis in Sect. 3 indicates that the model has low to moderate RMSE for surface temperature (0.50 ∘C), salinity (0.10), pCO2 (<26 µatm), and DIC (<24 µmol kg−1) and low biases (respectively, −0.31 ∘C, −0.04, 6 µatm, and <15 µmol kg−1).
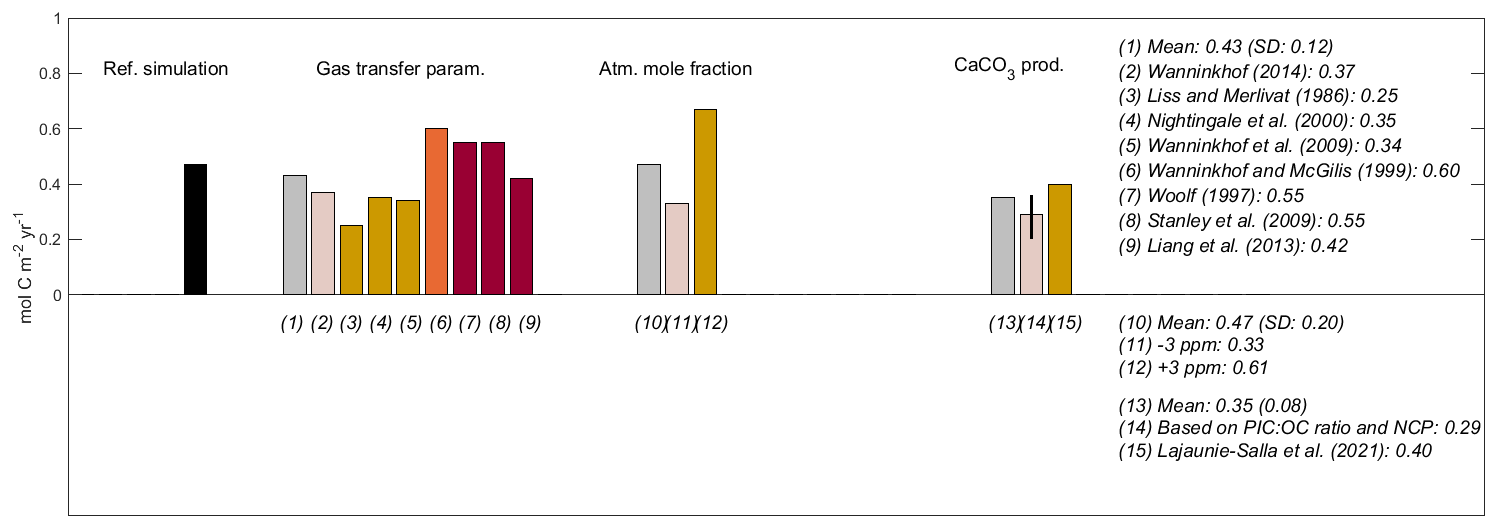
Figure 13Sensitivity tests of the annual air-to-sea CO2 flux estimate to the parameterization of gas transfer velocity, the variability of the mole fraction of CO2 in the atmosphere, and the calcification processes. The black bar indicates the annual estimate in the reference simulation, and gray bars indicate the mean value for each of the three sets of sensitivity tests. For the sensitivity tests on the parametrization of gas transfer (from 2 to 9), relations with a quadratic (2), hybrid (3 to 5), or cubic (6) wind speed dependency are, respectively, in light pink, yellow, and orange, and relations that include explicit bubble parametrizations (7 to 9) are in red. For the test (14) of calcification processes, the bar indicates the result found for the mean PIC:POC ratio, while the black line indicates the range using the minimum and maximum PIC:POC ratios.
To assess the uncertainties linked to the calculation of the gas transfer coefficient, we performed sensitivity tests using eight other parameterizations of this coefficient (Sect. 2.1.4). The estimates of the annual air–sea flux using these parameterizations are displayed in Fig. 13 and Table S1. The results of these tests indicate that the deep-convection zone is found as a moderate CO2 sink for the atmosphere using all parametrizations. The estimate in the reference run, based on the wind speed quadratic dependency relation established by Wanninkhof (1992), is close to the mean value of all the estimates at 0.43 (±0.12) mol C m−2 yr−1. The highest estimates were obtained using the relation from the cubic wind dependency parametrization of Wanninkhof and McGillis (1999) and the bubble-inclusive parametrizations of Woolf (1997) and Stanley et al. (2009). The lowest estimate, which is almost twice as small as the mean value, was obtained using the parametrization of Liss and Merlivat (1986). The second set of tests of sensitivity for atmospheric CO2 forcing shows that the annual air–sea flux varies between 0.33 and 0.61 mol C m−2 yr−1 (SD of 0.20 mol C m−2 yr−1) if an uncertainty value of 3 ppm in relation to the atmospheric mole fraction is constantly subtracted and added, respectively. Finally, sensitivity tests taking into account supplementary consumption terms in the equations of DIC and of the excess of negative charges were performed to assess the potential influence of CaCO3 precipitation on the air–sea CO2 flux (Sect. 2.1.4). They show that not taking into account calcification processes could lead to an overestimation of the annual air–sea CO2 uptake by 16 % to 57 % with estimates of 0.29 mol C m−2 yr−1 based on the mean PIC:POC ratio (Miquel et al., 2011) and the NCP (varying between 0.20 and 0.36 mol C m−2 yr−1 based on the measured maximum and minimum PIC:POC ratios (Miquel et al., 2011), respectively) and of 0.40 mol C m−2 yr−1 based on the parametrization used in Lajaunie-Salla et al. (2021). This demonstrates the need to better constrain this term in future studies on carbonate system dynamics.
5.3 Comparisons of air–sea CO2 flux with previous studies in the Mediterranean Sea
Our estimates of the annual air–sea flux over the whole deep-convection area and at the DYFAMED site – 0.47 and 0.33 mol C m−2 yr−1, respectively – are close to those provided in previous observational and modeling studies at the DYFAMED site. Based on the parametrization of Liss and Merlivat (1986) and for the period 1995–1997, Hood and Merlivat (2001) found a value of 0.10–0.15 mol C m−2 yr−1 using hourly measurements, while Mémery et al. (2002) found a value of 0.15 ± 0.07 mol C m−2 yr−1 using a 1D model. We obtained an annual flux of 0.17 mol C m−2 yr−1 at the DYFAMED site using the same gas transfer relationship. The estimates of Bégovic (2001) and Copin-Montégut et al. (2004) varied between 0.42 and 0.68 mol C m−2 yr−1 for the period 1998–2000 using monthly CO2 measurements and the parametrization proposed by Wanninkhof and McGillis (1999). Using the same parametrization, our estimate amounts to 0.40 mol C m−2 yr−1 at DYFAMED. Finally, Merlivat et al. (2018) estimated a close annual CO2 air–sea flux of 0.45 mol C m−2 yr−1 using hourly measurements for the period 2013–2015.
Based on a 1D satellite data approach (Antoine and Morel, 1995) applied with a horizontal resolution of 0.5∘ to the whole Mediterranean Sea over the period 1998–2004, D'Ortenzio et al. (2008) estimated an annual mean air–sea CO2 flux ranging between 0 and 4 mol C m−2 yr−1 over the NW deep-convection area. The larger homogeneity in our estimates (varying between −0.1 and 1.2 mol C m−2 yr−1 inside the deep-convection area) could be partly ascribed to the horizontal diffusion and advection that were accounted for in our model. Using a 3D coupled physical–biogeochemical reanalysis of the Mediterranean Sea, von Schuckmann et al. (2018), over the period 1999–2016, and Cossarini et al. (2021), over the period 1999–2019, estimated a mean annual air–sea flux in the deep-convection zone ranging between 0 and 0.5 mol C m−2 yr−1, and 0 and 1 mol C m−2 yr−1, respectively. Our results in terms of spatial distribution, with minimum values in the western edge of the deep-convection zone and maximum values in the northern area of the Gulf of Lion, are also consistent with their results.
Our estimate is close to the annual flux estimated around 0.5 mol C m−2 yr−1 by Cossarini et al. (2021) in the South Adriatic Sea, another deep-convection area of the Mediterranean Sea.
Finally, it is also noteworthy that our estimate is found in the lower range of the annual flux estimated from experimental studies for the northern Adriatic and Aegean shelves, where dense-water formation also takes place and which are identified as sinks for atmospheric CO2 most of the year and on an annual basis. With respect to the northern Adriatic shelf, our estimate is found to be close to the estimate of 0.4–0.5 mol C m−2 yr−1 for the period of 2014–2015 from Urbini et al. (2020) and between about 2- to 4-fold lower than the estimates of 0.8–0.9 mol C m−2 yr−1 from Urbini et al. (2020) over the period 2016–2017, of 1–1.1 mol C m−2 yr−1 from Catalano et al. (2014) and Cossarini et al. (2015), and of 2.2 mol C m−2 yr−1 from Cantoni et al. (2012) and Turk et al. (2010). Regarding the northern Aegean Sea, we found a lower winter flux than the one deduced from observations in February 2006 by Krasakopoulou et al. (2009) (8.6–14.7 mmol C m−2 d−1 versus 4.9 mmol C m−2 d−1 in our study). Our estimates are also lower than the CO2 uptake exceeding 1 mol C m−2 yr−1 found for the northern shelves in the modeling studies of Cossarini et al. (2015, 2021). The higher fluxes over the continental shelves compared to our study area could be explained by a lower seawater temperature in winter, riverine nutrient inputs favoring intense primary production, and a transport of DIC associated with dense-water outflow towards the deep basin (Cantoni et al., 2016; Ingrosso et al., 2017).
5.4 The major influence of physical transport on the DIC budget of the deep-convection area
Our study confirms the importance of deep convection to the vertical DIC distribution and surface pCO2 in the study area, as shown in previous observational studies (Copin-Montégut et al., 2004; Touratier et al., 2016), and highlights that physical transports play a crucial role in the DIC budget in this highly energetic region. Our 3D model results allowed us to distinguish the contribution of vertical and lateral transports to the net physical exchange flux. They both show a similar seasonal cycle, with greater magnitude (positive for the vertical transport and negative for the lateral transport with regard to the upper layer) in fall, the preconditioning phase, and in winter, the convection period, both being sea surface heat loss periods. During those periods, vertical supply overwhelmed lateral export in the upper layer. Conversely, during the stratification phase and stratified period, in spring and summer, lateral export prevailed over vertical supply. At the annual scale, we estimate that the vertical supplies amounted to 133 mol C m−2 yr−1. They were almost counterbalanced by a lateral transfer of 130 mol C m−2 yr−1 to adjacent upper-layer areas, which acted as major sinks of DIC for the deep-convection upper layer.
By estimating a water mass budget, we found that lateral and vertical DIC fluxes are highly significantly correlated with lateral (R=0.9998, p value < 0.01) and vertical (R=0.9998, p value < 0.01) water fluxes, respectively. Moreover, a detailed calculation of the water and DIC fluxes at the limits of the deep-convection area allowed us to evaluate the contribution of (1) the difference in inflowing and outflowing water fluxes at constant mean DIC concentration and (2) the difference in DIC concentrations at constant flux. We found that the first contribution is largely dominant compared to the second one, highlighting that the lateral transports of DIC are essentially related to the difference of inflows and outflows of water rather than to DIC concentration differences between deep-convection waters and surrounding waters. Strong mesoscale activities and instabilities within and on the edge of the mixed patch that characterized the convection zone shown in previous works (Marshall and Shott, 1999; Testor et al., 2018) could lead to this strong lateral transfer of water and associated DIC, as illustrated in Fig. 10. The findings of Waldman et al. (2018) showing water sinking in the general circulation suggest that DIC could be partly transferred back into deep waters in the boundary current. Studying the dissolved oxygen dynamics, Wolf et al. (2018) also found that lateral processes could play a major role in the biogeochemical annual budget in the deep convection located in the central Labrador Sea. We consider that the study of the contribution of the various lateral exchange mechanisms in the lateral DIC transfer, such as Ekman-driven transport, geostrophic advection, frontal processes, and submesoscale coherent vortices, is out of scope of this first work on the DIC budget, but further complementary works will be dedicated to this subject.
5.5 Net community production and air–sea flux relationships
Previous modeling studies (Herrmann et al., 2013; Ulses et al., 2016) showed that the northwestern Mediterranean deep-convection area acts as an autotrophic ecosystem with, on an annual timescale, gross primary production dominating over respiration and hence a positive NCP. The present modeling study displays an NCP in the upper layer of 3.7 mol C m−2 yr−1 and a DIC buildup of 2.3 mol C yr−1 through respiration of heterotrophic organisms in the deeper layer. Our budget shows that, in the upper layer, the net biogeochemical loss term of DIC is counterbalanced by 88 % by physical gain fluxes and only by 13% by air–sea gain fluxes. It clearly appears that deep vertical mixing and advection significantly slowed down the atmospheric CO2 uptake in winter by bringing into the upper layer remineralized organic carbon. We quantify here that the annual air–sea CO2 flux is ∼8 times smaller than the annual NCP in the upper layer. These results are in line with the previous findings of Oschlies and Kähler (2004), Körtzinger et al. (2008a, b) and Palevsky and Nicholson (2018) and Palevsky and Quay (2017) regarding the reducing effect of winter ventilation on atmospheric CO2 uptake in the northern Atlantic Ocean and in the Pacific Ocean, respectively.
In our simulation, the downward export of organic carbon (OC) at the base of the photic zone of the deep-convection area is estimated as 2.3 mol C m−2 yr−1. The results of Herrmann et al. (2013) and Ulses et al. (2016) showed, using a similar coupled modeling approach, that OC export is characterized by high interannual variability, with standard deviations between 24 % to 37 %, linked to the variability of the convection strength. The intensity of the winter vertical mixing has been shown to be subject itself to high interannual variability (Houpert et al., 2016; Margirier et al., 2020). Observations in the core of the convection zone by Margirier et al. (2020) evidenced that only intermediate convection events took place in the 4 years following the 2013 events. Thus, organic carbon transferred into the deeper layer could either have been stored in the deep-convection area until the next 2018 events (Fourrier et al., 2022), when it could have been reinjected in its remineralized form, or it could have been transferred, partly in remineralized form, towards the southwestern Mediterranean through the dispersion of the newly formed dense water (Schroeder et al., 2008; Beuvier et al., 2012). Here, we estimate that an amount of 0.3 mol C m−2 yr−1 of organic carbon was laterally exported from the deeper layer. We found that the vertical supply of DIC into the upper layer is 2 orders of magnitude higher than OC export or the upper layer and depth-integrated NCP. This is explained by the equilibrium role of the DIC lateral transfers towards the surrounding zone. This shows that a 1D approach would not be appropriate to take into account the complexity of the 3D mechanisms of exchanges for the DIC budget of this deep-convection area, which has to be integrated into a whole regional system, especially in the context of a changing atmosphere and ocean.
5.6 Contribution of the northwestern deep-convection region to the carbon budget of the Mediterranean Sea
Our results indicate that the NW Mediterranean deep-convection zone was a sink of carbon for the atmosphere and a source of carbon for the western Mediterranean Sea over the period of September 2012 to September 2013. More specifically, we found that the exchanges with the surrounding region were characterized by a net lateral input of total carbon into the deep layers of the deep-convection region, although organic carbon was exported towards the surrounding region, and a net lateral export of both organic and inorganic carbon in upper water masses (Fig. 11).
Previous studies investigating the air–sea CO2 flux at the scale of the whole Mediterranean Sea showed that this sea acted as a moderate sink of atmospheric CO2 over the past decades (Copin-Montégut, 1993; D'Ortenzio et al., 2008; Cossarini et al., 2021). According to those studies, the northern continental shelves and open seas (Gulf of Lion, Adriatic and Aegean seas) absorbed atmospheric CO2, while the southeastern Mediterranean was in excess of CO2 relative to the atmosphere and released CO2 to the atmosphere. The water formation areas and, in particular, the northwestern Mediterranean deep-convection area were shown to be regions of relatively strong atmospheric CO2 uptake (Cossarini et al., 2021). Estimates of air–sea flux for the whole Mediterranean Sea varied between 0.2 Tg C yr−1 (D'Ortenzio et al., 2008) and 2.6 Tg C yr−1 (Cossarini et al., 2021) if only the open seas were considered and between 4.2 Tg C yr−1 (Copin-Montégut, 1993; Cossarini et al., 2021) and 12.6 Tg C yr−1 (Solidoro et al., 2022) when including the continental shelves. Thus the NW Mediterranean deep-convection area, which represents 2.5% of the Mediterranean Sea surface and which we estimate here absorbed at the sea surface 0.4 Tg C yr−1, could strongly contribute to the uptake of atmospheric CO2 in the open Mediterranean Sea.
Our results show that DIC was transferred from the deep depths and, to a much lesser extent, from the atmosphere to the surface and intermediate water masses and was then transferred laterally to the neighboring sub-basins. The transfer of DIC into surface water masses, which is here estimated at 109 Tg C yr−1, could also mitigate the air–sea CO2 uptake in winter and spring in the surrounding western and southern seas. It could represent 21 % of the DIC export from the western to the eastern Mediterranean sub-basin estimated by Solidoro et al. (2022) to be 509 Tg C yr−1 and between 8 % to 22 % of the Atlantic CO2 surface inflow estimated to be between 660 to 1310 Tg C yr−1 by Aït-Ameur and Goyet (2006) and 487 Tg C yr−1 by Solidoro et al. (2022). Finally, the transfer of DIC into intermediate waters, estimated here to be 73 Tg C yr−1, could represent up to 11% to the Mediterranean DIC export towards the Atlantic Ocean at the Gibraltar Strait, estimated to range between 680 and 1380 Tg C yr−1 (Aït-Ameur and Goyet, 2006; Huertas et al., 2009), and up to 100 % of the net DIC outflow (difference between Atlantic surface inflow and Mediterranean outflow), estimated to be between 18 and 70 Tg C yr−1 (Dafner et al., 2001; Aït-Ameur and Goyet, 2006; de la Paz et al., 2009; Huertas et al., 2009). The large discrepancy found here in the percentages of DIC fluxes at the Gibraltar Strait that DIC outflows from the deep-convection area represent is due to the large range in the DIC flux estimates at the Gibraltar Strait found by Aït-Ameur and Goyet (2006). This latter discrepancy is in turn explained by the large range in the estimates of water mass transport used in their computations, which can be attributed to the complex topography and strong tidal currents at the strait (Jordà et al., 2017). In their synthesis study on the exchanges at the Gibraltar Strait, Jordà et al. (2017) found a mean value of the water flux estimates based on observations close to that proposed by Baschek et al. (2001), from which Aït-Ameur and Goyet (2006) derived the lower values of DIC fluxes. This suggests that the higher percentage values that we calculated would be more reliable.
Our results for the northwestern deep-convection area could be compared to those obtained in one of the other major deep-water formation areas of the Mediterranean Sea, the Adriatic Sea. The latter has been shown to be a sink of atmospheric CO2 (Cossarini et al., 2021) and a sequestration region of anthropogenic carbon (Krasakopoulou et al., 2011; Palmiéri et al., 2015; Hassoun et al., 2015; Ingrosso et al. 2017), as is the case with the study area (Touratier et al., 2016). In particular, experimental studies showed that the deep layer of the southern Adriatic Sea was occupied by dense water rich in DIC and anthropogenic carbon formed in the deep-convection regions of the southern Adriatic Pit and Pomo Pit, as well as on the northern shelf (Krasakopoulou et al., 2011; Cantoni et al, 2016; Ingrosso et al. 2017). The deep dense waters could then be transferred towards the Ionian Sea and the Mediterranean general deep circulation. Krasakopoulou et al. (2011) deduced from in situ measurements over February 1995 inorganic carbon fluxes crossing the Otranto Strait, which connects the Ionian Sea to the southern Adriatic Sea. They estimated that, on an annual basis, the Adriatic Sea could act as a sink of 314 Tg C yr−1 of dissolved inorganic carbon for the Ionian Sea. This net flux resulted from an inflow of 1563 Tg C yr−1, with 27 % in the Levantine Intermediate Water. and an outflow of 1249 Tg C yr−1, with 21 % in the Adriatic Deep Water. Thus, the northwestern Mediterranean deep-convection region and the southern Adriatic, which includes shallower areas, could have opposite contributions in the deep and intermediate layers of the Mediterranean general circulation. However, our DIC budget assessment is limited to a single year and will need to be extended to a longer period to investigate, in particular, the question of carbon sequestration. The deep-convection process exhibits strong interannual variability related to that of air–sea heat flux intensity and the hydrological properties of water masses (Houpert et al., 2016; Somot et al., 2016; Estournel et al., 2016; Margirier et al., 2020). The interannual variability in the intensity and extent of deep convection is expected to directly impact the vertical supply of respired carbon into the upper layer. Furthermore, through variability in temperature and in the vertical supply of dissolved inorganic nutrients into the upper layer, it should also alter biogeochemical and air–sea fluxes of CO2.
Along with interannual variability, the Mediterranean Sea is experiencing changes in atmospheric forcing and water mass properties in response to global warming and rising atmospheric CO2 levels. The findings of Merlivat et al. (2018) based on pCO2 measurements over the two periods 1995–1997 and 2013–2015 suggested an increasing trend in surface DIC concentration. Based on observations from EMSO mooring sites and MOOSE cruises, Coppola et al. (2020) confirmed this trend and also evidenced increasing trends in intermediate (300–800 m) and deep (>2000 m) waters of the Ligurian Sea over the period 1998–2016. The increasing trend in surface DIC concentration could be explained by the trend in atmospheric pCO2 and is also expected to be influenced by biogeochemical changes in water masses flowing in at the Gibraltar Strait (Merlivat et al., 2018), as well as over the entire Mediterranean Basin, especially in the intermediate- and deep-water formation areas of the eastern basin (Wimart-Rousseau et al., 2021).
Finally, the reduction of winter mixing and the intensification of marine heat waves predicted by models in the second half of the 21st century (Darmaraki et al., 2019; Soto-Navarro et al., 2020) should clearly modify the contribution of the NW deep-convection zone in the Mediterranean. Based on coupled models over the entire Mediterranean Sea, Solidoro et al. (2022) and Reale et al. (2022) predicted, in response to the increase in atmospheric pCO2, temperature, and stratification, an increase in atmospheric CO2 uptake and in the DIC inventory in the whole Mediterranean Sea and modifications of the exchange fluxes between the eastern and western sub-basins. The 3D coupled models clearly constitute useful tools to gain insight into carbon budgets, and multi-model ensemble exercises on these issues, as performed by Friedland et al. (2021) regarding the influence of inorganic nutrient river inputs, could allow a refinement of the carbon budget terms and their evolution together with an assessment of their uncertainties.
We have estimated for the first time a CO2 budget for the whole northwestern Mediterranean deep-convection zone over an annual period using a high-resolution 3D coupled hydrodynamic–biogeochemical–chemical model. An assessment of the model results through comparisons with DEWEX and MOOSE-GE cruise observations, as well as EMSO-DYFAMED mooring and BOUSSOLE buoy site observations and outputs of the CANYON-MED neural networks, shows the ability of the model to describe the seasonal cycle and spatial variability of the DIC dynamics in this region with good accuracy. Based on the present study over the period 2012–2013, we can draw the following conclusions for this key region in the ocean circulation and biogeochemical cycles in the Mediterranean Sea.
The CO2 dynamics in the NW Mediterranean deep-convection area underwent large seasonal variation. The region was marked by a deficit of CO2 compared to the atmosphere from November to early June, which led to a 7-month ingassing of atmospheric CO2. The deficit situation, to a large extent controlled by temperature variability, was, on the one hand, reduced by vertical supply of DIC during the period of deep convection and, on the other hand, accentuated and extended by the spring phytoplankton bloom. This underlines the findings of Mémery et al. (2002) regarding the importance of data of sea surface DIC or pCO2 data during deep convection for precise estimates of air–sea CO2 flux in this area in addition to sea surface temperature observations and spring NCP estimates.
On an annual basis, the NW Mediterranean deep-convection area acted as a sink of atmospheric CO2. We estimate an annual uptake of 0.47 mol C m−2 yr−1. The maximum fluxes (>1 mol C m−2 yr−1) occurred in the northern Gulf of Lion region, subject to strong northerly continental winds and located at the edge of the deep convection between the Northern Current and the core of the deep convection, while minimum values (close to null values) are found in the western zone where warm anticyclonic gyres developed. The sensitivity tests of the annual estimate to the parametrization of the gas transfer velocity indicate an uncertainty of 28 %. Calcification processes could lead to an overestimation of 16 % to 57 % of the annual uptake, highlighting the need for the refinement of the model in future studies.
The annual DIC budget in the upper layer of the deep-convection area was co-dominated by biogeochemical and physical fluxes, estimated here to be −3.7 and 3.3 mol C m−2 yr−1, respectively. The net physical flux resulted from a balance of a net upward transfer and a net lateral export, both exhibiting maximum intensity during the preconditioning and deep-convection period. The air–sea CO2 flux only represents 13 % of the upper-layer NCP and 31 % of the NCP integrated over the whole water column. These results confirm that the DIC budget in this region should be addressed with a 3D approach that considers the complex physical mechanisms taking place.
The NW Mediterranean deep-convection area acted as a source of DIC for the surface and intermediate water masses flowing towards the southwestern Mediterranean. The transfers of DIC into the adjacent surface and intermediate water masses could also mitigate the atmospheric CO2 uptake in the surrounding open sea of the sub-basin and represent up to 22 % and 11 %, respectively, of the DIC exchanges with the Atlantic Ocean at the Strait of Gibraltar.
The BOUSSOLE and DYFAMED data are available from the SEANOE database (https://doi.org/10.17882/56709, Merlivat and Boutin, 2020; https://doi.org/10.17882/43749, Coppola et al., 2023), and DEWEX data are available from the SISMER database (https://doi.org/10.17600/13020010, Testor, 2013; https://doi.org/10.17600/13020030, Conan, 2013). Results of the simulations are available on request (caroline.ulses@univ-tlse3.fr).
The supplement related to this article is available online at: https://doi.org/10.5194/bg-20-4683-2023-supplement.
CU, CE, PM, KS, and FK developed the coupled model. CU designed the simulations. CU performed model simulations. CU and CE performed the analyses of the model outputs. MF, LC, DL, FT, CG, and VG provided the observational and CANYON-MED data. MF, LC, and DL helped with data interpretation. PT and XDM contributed to the experimental design, carrying out of the DEWEX cruises, and analysis of the hydrological data. CU wrote the initial version of the paper. All the authors discussed the results and revised the paper.
The contact author has declared that none of the authors has any competing interests.
Publisher’s note: Copernicus Publications remains neutral with regard to jurisdictional claims made in the text, published maps, institutional affiliations, or any other geographical representation in this paper. While Copernicus Publications makes every effort to include appropriate place names, the final responsibility lies with the authors.
We want to acknowledge the scientists and crews of the Flotte Océanographique Française (https://www.flotteoceanographique.fr/ , last access: 3 November 2023) who contributed to the cruises carried out in the framework of the DEWEX project and MOOSE programme. We thank Nicolas Metzl from LOCEAN for the helpful discussions and the Service National des Paramètres Océaniques du CO2 (SNAPO-CO2, LOCEAN, Sorbonne University-CNRS, France) for the total inorganic carbon and total alkalinity analyses. We thank Thibaut Wagener from MIO for his help with the data analysis and for his useful comments on an earlier version of the paper. We are grateful to Dariia Atamanchuk from the Department of Oceanography at Dalhousie University for her help in the calculation of air–sea CO2 fluxes. We also thank Xin Lan and Edward Dlugokencky from NOAA Global Monitoring Laboratory for the flask-air CO2 data. We thank Marta Álvarez from IEO and collaborators for making available the CARIMED database to us. This study is a contribution to the MerMex (Marine Ecosystem Response in the Mediterranean Experiment) project of the MISTRALS international programme. The numerical simulations were computed on the cluster of Laboratoire d’Aérologie and HPC resources from CALMIP grants (grant nos. P1325, P09115, and P1331). The authors would like to thank the National Observing Service (SNO) MOOSE and the Community Code (CC) SIROCCO (https://sirocco.obs-mip.fr/, last access: 3 November 2023), coordinated by the Research Infrastructure ILICO (CNRS-IFREMER) dedicated to coastal ocean observations (https://www.ir-ilico.fr/?PagePrincipale, last access: 3 November 2023), for providing data of the EMSO-DYFAMED mooring and the SYMPHONIE simulations, respectively. We thank the two anonymous reviewers for their constructive comments.
This research has been supported by the international programme MISTRALS dedicated to the understanding of the Mediterranean basin environmental processes (https://www.odatis-ocean.fr/activites/activites-liees-au-pole/chantiers/mistrals, last access: 20 November 2023), in particular by the French MERMEX (Marine Ecosystem Response in the Mediterranean Experiment), HYMEX (Hydrological cycle in the Mediterranean EXperiment) and MOOSE (Mediterranean Ocean Observing System for the Environment) programmes coordinated by CNRS-INSU. It has also been supported by the European Union's Horizon 2020 EuroSea project.
This paper was edited by Peter Landschützer and reviewed by two anonymous referees.
Aït-Ameur, N. and Goyet, C.: Distribution and transport of natural and anthropogenic CO2 in the Gulf of Cádiz, Deep-Sea Res. Pt. II, 53, 1329–1343, https://doi.org/10.1016/j.dsr2.2006.04.003, 2006.
Álvarez, M., Sanleón-Bartolomé, H., Tanhua, T., Mintrop, L., Luchetta, A., Cantoni, C., Schroeder, K., and Civitarese, G.: The CO2 system in the Mediterranean Sea: a basin wide perspective, Ocean Sci., 10, 69–92, https://doi.org/10.5194/os-10-69-2014, 2014.
Antoine, D., Chami, M., Claustre, H., d'Ortenzio, F., Morel, A., Bécu, G., Gentili, B., Louis, F., Ras, J., Roussier, E., Scott, A. J., Tailliez, D., Hooker, S. B., Guevel, P., Desté, J.-F., Dempsey, C., and Adams, D.: BOUSSOLE: A joint CNRS-INSU, ESA, CNES, and NASA ocean color calibration and validation activity, NASA Tech. Memo., 2006-214147, 2006.
Antoine, D. and Morel, A.: Modelling the seasonal course of the upper ocean pCO2, Development of one-dimensional model, Tellus, 47, 103–121, https://doi.org/10.3402/tellusb.v47i1-2.16035, 1995.
Auger, P. A., Diaz, F., Ulses, C., Estournel, C., Neveux, J., Joux, F., Pujo-Pay, M., and Naudin, J. J.: Functioning of the planktonic ecosystem on the Gulf of Lions shelf (NW Mediterranean) during spring and its impact on the carbon deposition: a field data and 3-D modelling combined approach, Biogeosciences, 8, 3231–3261, https://doi.org/10.5194/bg-8-3231-2011, 2011.
Auger, P., Ulses, C., Estournel, C., Stemmann, L., Somot, S., and Diaz, F.: Interannual control of plankton communities by deep winter mixing and prey/predator interactions in the NW Mediterranean: Results from a 30-year 3D modeling study, Prog. Oceanogr., 124, 12–27, https://doi.org/10.1016/j.pocean.2014.04.004, 2014.
Aumont, O., Ethé, C., Tagliabue, A., Bopp, L., and Gehlen, M.: PISCES-v2: an ocean biogeochemical model for carbon and ecosystem studies, Geosci. Model Dev., 8, 2465–2513, https://doi.org/10.5194/gmd-8-2465-2015, 2015.
Ayers, J. M. and Lozier, M.S.: Unraveling dynamical controls on the north pacific carbon sink, J. Geophys. Res., 117, C01017, https://doi.org/10.1029/2011JC007368, 2012.
Baschek, B., Send, U., Garcia-Lafuente, J., and Candela, J.: Transport estimates in the Strait of Gibraltar with a tidal inverse model, J. Geophys. Res., 106, 31033–31044, https://doi.org/10.1029/2000JC000458, 2001.
Bégovic, M.: Contribution à l'étude du système des carbonates en Méditerranée-Distribution et variation spatio-temporelle de la pression partielle de CO2 dans les eaux superficielles du bassin Liguro-Provençal, Ph.D. thesis, Université Pierre et Marie Curie – Paris VI, 303 pp., https://theses.hal.science/tel-00002793, 2001.
Bégovic, M. and Copin-Montégut, C.: Processes controlling annual variations in the partial pressure of CO2 in surface waters of the central northwestern Mediterranean Sea (Dyfamed site), Deep-Sea Res. Pt. II, 49, 2031–2047, https://doi.org/10.1016/S0967-0645(02)00026-7, 2002.
Bentsen, M., Evensen, G., Drange, H., and Jenkins, A. D.: Coordinate transformation on a sphere using conformal mapping, Mon. Weather Rev., 127, 2733–2740, https://doi.org/10.1175/1520-0493(1999)127<2733:CTOASU>2.0.CO;2, 1999.
Bernardello, R., Cardoso, J. G., Bahamon, N., Donis, D., Marinov, I., and Cruzado, A.: Factors controlling interannual variability of vertical organic matter export and phytoplankton bloom dynamics – a numerical case-study for the NW Mediterranean Sea, Biogeosciences, 9, 4233–4245, https://doi.org/10.5194/bg-9-4233-2012, 2012.
Béthoux, J. P., Durrieu de Madron, X., Nyffeler, F., and Tailliez, D.: Deep water in the western Mediterranean: peculiar 1999 and 2000 characteristics, shelf formation hypothesis, variability since 1970 and geochemical inferences, J. Mar. Syst., 3, 117–131, https://doi.org/10.1016/S0924-7963(02)00055-6, 2002.
Beuvier, J., Béranger, K., Brossier, C. L., Somot, S., Sevault, F., Drillet, Y., and Lyard, F.: Spreading of the Western Mediterranean deep water after winter 2005: Time scales and deep cyclone transport, J. Geophys. Res., 117, C07022, https://doi.org/10.1029/2011JC007679, 2012.
Bouffard, J., Vignudelli S., Herrmann M., Lyard F., Marsaleix P., Ménard Y., and Cipollini P.: Comparison of ocean dynamics with a regional circulation model and improved altimetry in the North-western Mediterranean. Terrestrial, Atmos. Ocean. Sci., 19, 117–133, https://doi.org/10.3319/TAO.2008.19.1-2.117(SA), 2008.
Cantoni, C., Luchetta, A., Celio, M., Cozzi, S., Raicich, F., and Catalano, G.: Carbonate system variability in the gulf of Trieste (north Adriatic sea), Estuar. Coast. Shelf Sci. 115, 51–62, https://doi.org/10.1016/j.ecss.2012.07.006, 2012.
Cantoni, C., Luchetta, A., Chiggiato, J., Cozzi, S., Schroeder, K., and Langone, L.: Dense water flow and carbonate system in the southern Adriatic: A focus on the 2012 event, Mar. Geol., 375, 15–27, https://doi.org/10.1016/j.margeo.2015.08.013, 2016.
Catalano, G., Azzaro, M., Bastianini, M., Bellucci, L. G., Bernardi Aubry, F., Bianchi, F., Burca, M., Cantoni, C., Caruso, G., Casotti, R., Cozzi, S., Del Negro, P., Fonda Umani, S., Giani, M., Giuliani, S., Kovacevic, V., La Ferla, R., Langone, L,. Luchetta, A., Monticelli, L. S., Piacentino, S., Pugnetti, A., Ravaioli, M., Socal, G., Spagnoli, F., and Ursella, L.: The carbon budget in the northern Adriatic Sea, a winter case study, J. Geophys. Res., 119, 1399–1417, https://doi.org/10.1002/2013JG002559, 2014.
Conan, P.: DEWEX-MERMEX 2013 LEG2 cruise, RV Le Suroît, SISMER, Brest, France, [data set], https://doi.org/10.17600/13020030, 2013.
Conan, P., Testor, P., Estournel, C., D'Ortenzio, F., Pujo-Pay, M., and Durrieu de Madron, X.: Preface to the Special Section: Dense water formations in the northwestern Mediterranean: From the physical forcings to the biogeochemical consequences, J. Geophys. Res.-Oceans, 123, 6983–6995, https://doi.org/10.1029/2018JC014301, 2018.
Copin-Montégut, C.: Alkalinity and carbon budgets in the Mediterranean, Global Biogeochem. Cy., 7, 915–925, https://doi.org/10.1029/93GB01826, 1993.
Copin-Montégut, C., and Bégovic, M.: Distributions of carbonate properties and oxygen along the water column (0–2000 m) in the central part of the NW Mediterranean Sea (Dy famed site): influence of winter vertical mixing on air–sea CO2 and O2 exchanges, Deep-Sea Res. Pt. II, 49, 2049–2066, https://doi.org/10.1016/S0967-0645(02)00027-9, 2002.
Copin-Montégut, C., Bégovic, M., and Merlivat, L.: Variability of the partial pressure of CO2 on diel to annual time scales in the Northwestern Mediterranean Sea, Mar. Chem., 85, 3–4, https://doi.org/10.1016/j.marchem.2003.10.005, 2004.
Coppola, L., Boutin, J., Gattuso, J.-P., Lefevre, D., and Metzl, N.: The Carbonate System in the Ligurian Sea, in: The Mediterranean Sea in the Era of Global Change 1, edited by: Migon, C., Nival, P., and Sciandra, A., https://doi.org/10.1002/9781119706960.ch4, 2020.
Coppola, L., Diamond Riquier, E., Carval, T., Irisson, J.-O., and Desnos, C.: Dyfamed observatory data, SEANOE [data set], https://doi.org/10.17882/43749, 2023.
Coppola, L., Legendre, L., Lefevre, D., Prieur, L., Taillandier, V., and Diamond Riquiera, E.: Seasonal and inter-annual variations of dissolved oxygen in the northwestern Mediterranean Sea (DYFAMED site), Prog. Oceanogr., 162, 187–201, https://doi.org/10.1016/j.pocean.2018.03.001, 2018.
Cossarini, G., Feudale, L., Teruzzi, A., Bolzon, G., Coidessa, G., Solidoro, C., Di Biagio, V., Amadio, C., Lazzari, P., Brosich, A., and Salon, S.: High-Resolution Reanalysis of the Mediterranean Sea Biogeochemistry (1999–2019), Front. Mar. Sci., 8, 741486, https://doi.org/10.3389/fmars.2021.741486, 2021.
Cossarini, G., Lazzari, P., and Solidoro, C.: Spatiotemporal variability of alkalinity in the Mediterranean Sea, Biogeosciences, 12, 1647–1658, https://doi.org/10.5194/bg-12-1647-2015, 2015.
Dafner, E. V., Gonzaìlez-Daìvila, M., Santana-Casiano, J. M., and Sempéré, R.: Total organic and inorganic carbon exchange through the Strait of Gibraltar in September 1997, Deep-Sea Res. Pt. I, 48, 1217–1235, https://doi.org/10.1016/S0967-0637(00)00064-9, 2001.
Damien, P., Bosse, A., Testor, P., Marsaleix, P., and Estournel, C.: Modeling postconvective submesoscale coherent vortices in the northwestern Mediterranean Sea, J. Geophys. Res.-Oceans, 122, 9937–9961, https://doi.org/10.1002/2016JC012114, 2017.
Darmaraki, S., Somot, S., Sevault, F., Nabat, P., Cabos, W., Cavicchia, L., Djurdjevic, V., Li, L., Sannino, G., and Sein, D. V.: Future evolution of marine heat waves in the Mediterranean Sea, Clim. Dynam., 53, 1371–1392, 2019.
Davis, D. and Goyet, C.: Balanced Error Sampling With applications to ocean biogeochemical sampling. Presses Universitaires de Perpignan (PUP), 224 pp., ISBN 978-2-35412-452-6, 2021.
DeGrandpre, M. D., Körtzinger, A., Send, U., Wallace, D. W. R., and Bellerby, R. G. J.: Uptake and sequestration of atmospheric CO2 in the Labrador Sea deep convection region, Geophys. Res. Lett., 33, L21S03, https://doi.org/10.1029/2006GL026881, 2006.
De la Paz, M., Goìmez-Parra, A., and Forja, J.: Seasonal variability of surface fCO2 in the Strait of Gibraltar, Aquat. Sci., 71, 55–64, https://doi.org/10.1007/s00027-008-8060-y, 2009.
Dickson, A. G., Sabine, C. L., and Christian, J. R.: Guide to Best Practices for Ocean CO2 Measurements, Report, Dickson Bible, North Pacific Marine Science Organization, ISBN 9781897176078, 2007.
Dickson, A. G. and Millero, F. J.: A comparison of the equilibrium constants for the dissociation of carbonic acid in seawater media, Deep-Sea Res., 34, 1733–1743, https://doi.org/10.1016/0198-0149(87)90021-5, 1987.
D'Ortenzio, F., Antoine, D., and Marullo, S.: Satellite-driven modelling of the upper ocean mixed layer and air-sea CO2 flux in the Mediterranean Sea, Deep-Sea Res. Pt. I, 55, 405–434, https://doi.org/10.1016/j.dsr.2007.12.008, 2008.
DOE: “Handbook of methods for the analysis of the various parameters of the carbon dioxide system in sea water – Version 2”, edited by: Dickson, A. G. and Goyet, C., ORNL/CDIAC-74, San Diego, 1994.
Edmond, J. M.: High precision determination of titration alkalinity and total carbon dioxide content of sea water by potentiometric titration, Deep-Sea Res., 17, 737–750, https://doi.org/10.1016/0011-7471(70)90038-0, 1970.
Estournel, C., Durrieu de Madron, X., Marsaleix, P., Auclair, F., Julliand, C., and Vehil, R.: Observation and modeling of the winter coastal oceanic circulation in the Gulf of Lion under wind conditions influenced by the continental orography (FETCH experiment), J. Geophys. Res., 108, 8059, https://doi.org/10.1029/2001JC000825, 2003.
Estournel, C., Testor, P., Damien, P., D’Ortenzio, F., Marsaleix, P., Conan, P., Kessouri, F., Durrieu de Madron, X., Coppola, L., Lellouche, J.-M., Belamari, S., Mortier, L., Ulses, C., Bouin, M.-N., Prieur, L.: High resolution modeling of dense water formation in the north-western Mediterranean during winter 2012–2013: Processes and budget, J. Geophys. Res.-Oceans, 121, 5367–5392, https://doi.org/10.1002/2016JC011935, 2016.
Fourrier, M., Coppola, L., Claustre, H., D'Ortenzio, F., Sauzède, R., and Gattuso, J.-P.: A Regional Neural Network Approach to Estimate Water-Column Nutrient Concentrations and Carbonate System Variables in the Mediterranean Sea: CANYON-MED ”, Front. Mar. Sci., 7, 620, https://doi.org/10.3389/fmars.2020.00620, 2020.
Fourrier, M., Coppola, L., D'Ortenzio, F., Migon, C., and Gattuso, J.-P.: Impact of intermittent convection in the northwestern Mediterranean Sea on oxygen content, nutrients, and the carbonate system, J. Geophys. Res.-Oceans, 127, e2022JC018615, https://doi.org/10.1029/2022JC018615, 2022.
Friedland, R., Macias, D., Cossarini, G., Daewel, U., Estournel, C., Garcia-Gorriz, E., Grizzetti, B., Grégoire, M., Gustafson, B., Kalaroni, S., Kerimoglu, O., Lazzari, P., Lenhart, H., Lessin, G., Maljutenko, I., Miladinova, S., Müller-Karulis, B., Neumann, T., Parn, O., Pätsch, J., Piroddi, C., Raudsepp, U., Schrum, C., Stegert, C., Stips, A., Tsiaras, K., Ulses, C., and Vandenbulcke, L.: Effects of Nutrient Management Scenarios on Marine Eutrophication Indicators: A Pan-European, Multi-Model Assessment in Support of the Marine Strategy Framework Directive, Front. Mar. Sci., 8, 596126, https://doi.org/10.3389/fmars.2021.596126, 2021.
Golbolm M. and Veluccim V.: BOUSSOLE 2020 cruise, RV Téthys II, https://doi.org/10.17600/18001113, 2020.
Guglielmi, V., Touratier, F., and Goyet, C.: Mathematical determination of discrete sampling locations minimizing both the number of samples and the maximum interpolation error: application to measurements of surface ocean properties, EarthArxiv, https://doi.org/10.31223/X5G64B, 2022a.
Guglielmi, V., Touratier, F., and Goyet, C.: Design of sampling strategy measurements of CO2/carbonate properties, J. Oceanogr. Aqua., 6, 000227, https://doi.org/10.23880/ijoac-16000227, 2022b.
Jones, H. and Marshall, J.: Restratification after Deep Convection, J. Phys. Ocean., 27, 2276–2287, https://doi.org/10.1175/1520-0485(1997)027<2276:RADC>2.0.CO;2, 1997.
Hagens, M. and Middleburg, J. J.: Attributing seasonal pH variability in surface ocean waters to governing factors, Geophys. Res. Lett., 43, 12528–12537, https://doi.org/10.1002/2016GL071719, 2016.
Hassoun, A. E. R., Gemayel, E., Krasakopoulou, E., Goyet, C., Saab, M. A.-A., Guglielmi, V., Touratier, F., and Falco, C.: Acidification of the Mediterranean Sea from anthropogenic carbon penetration, Deep-Sea Res. Pt. I, 102, 1–15, https://doi.org/10.1016/j.dsr.2015.04.005, 2015.
Heimbürger, L.-E., Lavigne, H., Migon, C., D'Ortenzio, F., Estournel, C., Coppola, L., and Miquel, J.-C.: Temporal variability of vertical export flux at the DYFAMED time-series station (Northwestern Mediterranean Sea), Prog. Oceanogr., 119, 59–67, https://doi.org/10.1016/j.pocean.2013.08.005, 2013.
Herrmann, M., Auger, P.-A., Ulses, C., and Estournel, C.: Long-term monitoring of ocean deep convection using multisensors altimetry and ocean color satellite data, J. Geophys. Res.-Oceans, 122, 1457–1475, https://doi.org/10.1002/2016JC011833, 2017.
Herrmann, M., Diaz, F., Estournel, C., Marsaleix, P., and Ulses, C.: Impact of atmospheric and oceanic interannual variability on the Northwestern Mediterranean Sea pelagic planktonic ecosystem and associated carbon cycle, J. Geophys. Res.-Oceans, 118, 5792–5813, https://doi.org/10.1002/jgrc.20405, 2013.
Herrmann, M., Somot, S., Sevault, F., Estournel, C., and Déqué, M.: Modeling the deep convection in the Northwestern Mediterranean sea using an eddy-permitting and an eddy-resolving model: Case study of winter 1986–87, J. Geophys. Res., 113, C04011, https://doi.org/10.1029/2006JC003991, 2008.
Hood, E. M. and Merlivat, L.: Annual to interannual variations of fCO2 in the northwestern Mediterranean Sea: Results from hourly measurements made by CARIOCA buoys, 1995–1997, J. Mar. Res., 59, 113–131, 2001.
Houpert, L.: Contribution to the study of transfer processes from the surface to the deep ocean in the Mediterranean Sea using in situ measurements, Ph.D. thesis, Université de Perpignan Via Domitia, https://theses.hal.science/tel-01148986 (last access: 20 November 2023), 2013.
Houpert, L., Durrieu de Madron, X., Testor, P., Bosse, A., D'Ortenzio, F., Bouin, M. N., Dausse, D., Le Goff, H., Kunesch, S., Labaste, M., Coppola, L., Mortier, L., and Raimbault P.: Observations of open ocean deep convection in the northwestern Mediterranean Sea: Seasonal and interannual variability of mixing and deep water masses for the 2007–2013 Period, J. Geophys. Res.-Oceans, 121, 8139–8171, https://doi.org/10.1002/2016JC011857, 2016.
Huertas, I. E., Ríos, A. F., García-Lafuente, J., Makaoui, A., Rodríguez-Gálvez, S., Sánchez-Román, A., Orbi, A., Ruíz, J., and Pérez, F. F.: Anthropogenic and natural CO2 exchange through the Strait of Gibraltar, Biogeosciences, 6, 647–662, https://doi.org/10.5194/bg-6-647-2009, 2009.
Ingrosso, G., Bensi, M., Cardin, V., and Giani, M.: Anthropogenic CO2 in a dense water formation area of the Mediterranean Sea, Deep Sea Res. Pt. I, 123, 118–128, https://doi.org/10.1016/j.dsr.2017.04.004, 2017.
Jordà, G., von Schuckmann, K., Josey, S.A., Caniaux, G., García-Lafuente, J., Sammartino, S., Özsoy, E., Polcher, J., Notarstefano, G., Poulain, P.-M., Adloff, F., Salat, J., Naranjo, C., Schroeder, K., Chiggiato, J., Sannino, G, and Macías, D.: The Mediterranean Sea heat and mass budgets: Estimates, uncertainties and perspectives, Prog. Oceanogr., 156, 174–208, https://doi.org/10.1016/j.pocean.2017.07.001, 2017.
Keraghel, M. A., Louanchi, F., Zerrouki, M., Aït, K. M., Aït-Ameur, N., Labaste, M., Legoff, H., Taillandier, V., Harid, R., and Mortier, L.: Carbonate system properties and anthropogenic carbon inventory in the Algerian Basin during SOMBA cruise (2014): Acidification estimate, Mar. Chem., 221, 103783, https://doi.org/10.1016/j.marchem.2020.103783, 2020.
Kessouri, F.: Cycles biogéochimiques de la Mer Méditerranée: processus et bilans, Ph.D. thesis, Université Toulouse, http://thesesups.ups-tlse.fr/3334/ (last access: 20 November 2023), 2015.
Kessouri, F., Ulses, C., Estournel, C., Marsaleix, P., Severin, T., Pujo-Pay, M., Caparros, J., Raimbault, P., Pasqueron de Fommervault, O., D'Ortenzio, F., Taillandier, V., Testor, P., and Conan P.: Nitrogen and phosphorus budgets in the Northwestern Mediterranean deep convection region, J. Geophys. Res.-Oceans, 122, 9429–9454, https://doi.org/10.1002/2016JC012665, 2017.
Kessouri, F., Ulses, C., Estournel, C., Marsaleix, P., D’Ortenzio, F., Severin, T., Taillandier, V., and Conan, P.: Vertical mixing effects on phytoplankton dynamics and organic carbon export in the western Mediterranean Sea, J. Geophys. Res.-Oceans, 123, 1647–1669, https://doi.org/10.1002/2016JC012669, 2018.
Koelling, J., Atamanchuk, D., Karstensen, J., Handmann, P., and Wallace, D. W. R.: Oxygen export to the deep ocean following Labrador Sea Water formation, Biogeosciences, 19, 437–454, https://doi.org/10.5194/bg-19-437-2022, 2022.
Körtzinger, A., Send, U., Lampitt, R. S., Hartman, S., Wallace, D. W. R., Karstensen, J., Villagarcia, M. G., Llinaìs, O., and DeGrandpre, M. D.: The seasonal pCO2 cycle at 49∘ N/16.5∘ W in the northeastern Atlantic Ocean and what it tells us about biological productivity, J. Geophys. Res., 113, C04020, https://doi.org/10.1029/2007JC004347, 2008a.
Körtzinger, A., Send, U., Wallace, D. W. R., Kartensen, J., and DeGrandpre, M.: Seasonal cycle of O2sand pCO2 in the central Labrador Sea: Atmospheric, biological, and physical implications, Global Biogeochem. Cy., 22, GB1014, https://doi.org/10.1029/2007GB003029, 2008b.
Krasakopoulou, E., Rapsomanikis, S., Papadopoulos, A., and Papathanassiou, E.: Partial pressure and air–sea CO2 flux in the Aegean Sea during February 2006, Cont. Shelf Res., 29, 1477–1488, https://doi.org/10.1016/j.csr.2009.03.015, 2009.
Krasakopoulou, E., Souvermezoglou, E., and Goyet, C.: Anthropogenic CO2 fluxes in the Otranto strait (E. Mediterranean) in February 1995, Deep-Sea Res. Pt. I, 58, 1103–1114, https://doi.org/10.1016/j.dsr.2011.08.008, 2011.
Lacroix, G. and Grégoire, M.: Revisited ecosystem model (MODECOGeL) of the Ligurian Sea: seasonal and interannual variability due to atmospheric forcing, J. Mar. Syst., 37, 229–258, https://doi.org/10.1016/S0924-7963(02)00190-2, 2002.
Lajaunie-Salla, K., Diaz, F., Wimart-Rousseau, C., Wagener, T., Lefèvre, D., Yohia, C., Xueref-Remy, I., Nathan, B., Armengaud, A., and Pinazo, C.: Implementation and assessment of a carbonate system model (Eco3M-CarbOx v1.1) in a highly dynamic Mediterranean coastal site (Bay of Marseille, France), Geosci. Model Dev., 14, 295–321, https://doi.org/10.5194/gmd-14-295-2021, 2021.
Lan, X., Dlugokencky, E. J., Mund, J. W., Crotwell, A. M., Crotwell, M. J., Moglia, E., Madronich, M., Neff, D., and Thoning, K. W.: Atmospheric Carbon Dioxide Dry Air Mole Fractions from the NOAA GML Carbon Cycle Cooperative Global Air Sampling Network, 1968–2021, Version: 2022-07-28, https://doi.org/10.15138/wkgj-f215, 2022.
Lavigne, H., D’Ortenzio, F., Migon, C., Claustre, H., Testor, P., Ribera d’Alcalà, M., Lavezza, R., Houpert, L., and Prieur L.: Enhancing the comprehension of mixed layer depth control on the Mediterranean phytoplankton phenology, J. Geophys. Res.-Oceans, 118, 3416–3430, https://doi.org/10.1002/jgrc.20251, 2013.
Lazzari, P., Solidoro, C., Ibello, V., Salon, S., Teruzzi, A., Béranger, K., Colella, S., and Crise, A.: Seasonal and inter-annual variability of plankton chlorophyll and primary production in the Mediterranean Sea: a modelling approach, Biogeosciences, 9, 217–233, https://doi.org/10.5194/bg-9-217-2012, 2012.
Lellouche, J.-M., Le Galloudec, O., Drévillon, M., Régnier, C., Greiner, E., Garric, G., Ferry, N., Desportes, C., Testut, C.-E., Bricaud, C., Bourdallé-Badie, R., Tranchant, B., Benkiran, M., Drillet, Y., Daudin, A., and De Nicola, C.: Evaluation of global monitoring and forecasting systems at Mercator Océan, Ocean Sci., 9, 57–81, https://doi.org/10.5194/os-9-57-2013, 2013.
Levy, M., Bopp, L., Karleskind, P., Resplandy, L., Ethe, C., and Pinsard, F.: Physical pathways for carbon transfers between the surface mixed layer and the ocean interior, Global Biogeochem. Cy., 27, 1001–1012, https://doi.org/10.1002/gbc.20092, 2013.
Levy, M., Mémery, L., and André, J.-M.: Simulation of primary production and export fluxes in the Northwestern Mediterranean Sea, J. Mar. Res., 56, 197–238, 1998.
Lewis, E. and Wallace, D. W. R.: Program developed for CO2 system calculations, ORNL/CDIA-105, Carbon dioxide information analysis center, Tennessee, USA, https://doi.org/10.2172/639712, 1998.
Li, P. and Tanhua, T.: Recent Changes in Deep Ventilation of the Mediterranean Sea, Evidence From Long-Term Transient Tracer Observations, Front. Mar. Sci., 7, 594, https://doi.org/10.3389/fmars.2020.00594, 2020.
Liang, J.-H., Deutsch, C., McWilliams, J. C., Baschek, B., Sullivan, P. P., and Chiba, D.: Parameterizing bubble-mediated air-sea gas exchange and its effect on ocean ventilation, Global Biogeochem. Cy., 27, 894–905, https://doi.org/10.1002/gbc.20080, 2013.
Liss, P. S. and Merlivat, L.: Air–sea exchange rates: introduction and synthesis, in: Role of the Air Sea Gas Exchange in Geochemical Cycling, edited by: Buat-Menard, P., NATO ASI-Series, 113–128, 1986.
Ludwig, W., Bouwman, A. F., Dumont, E., and Lespinas, F.: Water and nutrient fluxes from major Mediterranean and Black Sea rivers: Past and future trends and their implications for the basin-scale budgets, Global Biogeochem. Cy., 24, GB0A13, https://doi.org/10.1029/2009GB003594, 2010.
Manca, B. and Bregant, D.: Dense water formation in the Southern Adriatic Sea during winter 1996, Rapp. Comm. Int. Mer Médit., 35, 176–177, 1998.
Many, G., Ulses, C., Estournel, C., and Marsaleix, P.: Particulate organic carbon dynamics in the Gulf of Lion shelf (NW Mediterranean) using a coupled hydrodynamic–biogeochemical model, Biogeosciences, 18, 5513–5538, https://doi.org/10.5194/bg-18-5513-2021, 2021.
Margirier, F., Testor, P., Heslop, E., Mallil, K., Bosse, A., Houpert, L., Mortier, L., Bouin, M.-N., Coppola, L., D’Ortenzio, F., Durrieu de Madron, X., Mourre, B., Prieur, L., Raimbault, P., and Taillandier, V.: Abrupt warming and salinification of intermediate waters interplays with decline of deep convection in the Northwestern Mediterranean Sea, Sci. Rep., 10, 20923, https://doi.org/10.1038/s41598-020-77859-5, 2020.
Marsaleix P., Auclair, F., Floor, J. W., Herrmann, M. J., Estournel, C., Pairaud, I., and Ulses C.: Energy conservation issues in sigma-coordinate free-surface ocean models, Ocean Modell., 20, 61–89, https://doi.org/10.1016/j.ocemod.2007.07.005, 2008.
Marshall, J. and Schott, F.: Open-ocean convection: Observations, theory, and models, Rev. Geophys., 37, 1–64, https://doi.org/10.1029/98RG02739, 1999.
Mavropoulou, A.-M., Vervatis, V., and Sofianos, S.: Dissolved oxygen variability in the Mediterranean Sea, J. Mar. Syst., 208, 103348, https://doi.org/10.1016/j.jmarsys.2020.103348, 2020.
Mémery, L., Levy, M., Verant, S., and Merlivat, L.: The relevant time scales in estimating the air–sea CO2 exchange in a mid latitude region: a numerical study at the DYFAMED station (NW Mediterranean Sea), Deep-Sea Res. Pt. II, 49, 2067–2092, https://doi.org/10.1016/S0967-0645(02)00028-0, 2002.
Mehrbach, C., Culberson, C. H., Hawley, J. E., and Pytkowicz, R. M..: Measurement of the apparent dissociation constants of carbonic acid in seawater at atmospheric pressure, Limnol. Oceanogr., 18, 897907, https://doi.org/10.4319/lo.1973.18.6.0897, 1973.
Merlivat, L., Boutin, J., Antoine, D., Beaumont, L., Golbol, M., and Vellucci, V.: Increase of dissolved inorganic carbon and decrease in pH in near-surface waters in the Mediterranean Sea during the past two decades, Biogeosciences, 15, 5653–5662, https://doi.org/10.5194/bg-15-5653-2018, 2018.
Merlivat L. and Boutin J.: Mediterranean Sea surface CO2 partial pressure and temperature data, SEANOE [data set], https://doi.org/10.17882/56709, 2020.
Mertens, C. and Schott, F.: Interannual variability of deep-water formation in the northwestern Mediterranean, J. Phys. Oceanogr., 28, 1410–1424, https://doi.org/10.1175/1520-0485(1998)028<1410:IVODWF>2.0.CO;2, 1998.
Middelburg, J. J.: Marine Carbon Biogeochemistry, SpringerBriefs in Earth System Sciences, Springer Cham, https://doi.org/10.1007/978-3-030-10822-9, 2019.
Miquel, J. C., Mart ın, J., Gasser, B., Rodriguez-y-Baena, A., Toubal, T., and Fowler, S. W.: Dynamics of particle flux and carbon export in the northwestern Mediterranean Sea: A two decade time-series study at the DYFAMED site, Prog. Oceanogr., 91, 461–481, https://doi.org/10.1016/j.pocean.2011.07.018, 2011.
Millero, F. J.: Thermodynamics of the carbon dioxide system in the oceans, Geochim. Cosmochim. Ac., 59, 661–677, https://doi.org/10.1016/0016-7037(94)00354-O, 1995.
Nightingale, P. D., Malin, G., Law, C. S., Watson, A. J., Liss, P. S., Liddicoat, M. I., Boutin, J., and Upstill-Goddard, R. C.: In situ evaluation of air-sea gas exchange parameterizations using novel conservative and volatile tracers, Global Biogeochem. Cy., 14, 373–387, 2000.
Oschlies, A. and Kähler, P.: Biotic contribution to air-sea fluxes of CO2 and O2 and its relation to new production, export production, and net community production, Global Biogeochem. Cy., 18, GB1015, https://doi.org/10.1029/2003GB002094, 2004.
Ovchinnikov, I. M., Zats, V. I., Krivosheya, V. G., and Udodov, A. I.: Formation of deep eastern Mediterranean water in the Adriatic Sea, Oceanology, 25, 704–707, 1985.
Palevsky, H. I. and Nicholson, D. P.: The North Atlantic biological pump: Insights from the Ocean Observatories Initiative Irminger Sea Array, Oceanography, 31, 42–49, https://doi.org/10.5670/oceanog.2018.108, 2018.
Palevsky, H. I. and Quay, P. D.: Influence of biological carbon export on ocean carbon uptake over the annual cycle across the North Pacific Ocean, Global Biogeochem. Cy., 31, 81–95, https://doi.org/10.1002/2016GB005527, 2017.
Palmiéri, J., Orr, J. C., Dutay, J.-C., Béranger, K., Schneider, A., Beuvier, J., and Somot, S.: Simulated anthropogenic CO2 storage and acidification of the Mediterranean Sea, Biogeosciences, 12, 781–802, https://doi.org/10.5194/bg-12-781-2015, 2015.
Raick-Blum, C.: Mathematical modelling of the Ligurian Sea ecosystem using models of different complexities. Application of a Kalman filter to improve models reliability, PhD thesis, University of Liège, Liège, Belgium, 2005.
Raick, C., Delhez, E. J. M., Soetaert, K., and Grégoire, M.: Study of the seasonal cycle of the biogeochemical processes in the Ligurian Sea using a 1D interdisciplinary model, J. Mar. Syst., 55, 177–203, https://doi.org/10.1016/j.jmarsys.2004.09.005, 2005.
Reale, M., Cossarini, G., Lazzari, P., Lovato, T., Bolzon, G., Masina, S., Solidoro, C., and Salon, S.: Acidification, deoxygenation, and nutrient and biomass declines in a warming Mediterranean Sea, Biogeosciences, 19, 4035–4065, https://doi.org/10.5194/bg-19-4035-2022, 2022.
Schneider, A., Wallace, D. W. R., and Körtzinger, A.: Alkalinity of the Mediterranean Sea, Geophys. Res. Lett., 34, L15608, https://doi.org/10.1029/2006GL028842, 2007.
Schroeder, K., Chiggiato, J., Bryden, H., Borghini, M., and Ismail, S. B.: Abrupt climate shift in the Western Mediterranean Sea. Sci. Rep., 6, 23009, https://doi.org/10.1038/srep23009, 2016.
Schroeder, K., Taillandier, V., Vetrano, A., and Gasparini, G. P.: The circulation of the western Mediterranean Sea in spring 2005 as inferred from observations and from model outputs, Deep Sea Res. Pt. I, 55, 947–965, https://doi.org/10.1016/j.dsr.2008.04.003, 2008.
Sempéré, R., Charrière, B., Van Wambeke, F., and Cauwet, G.: Carbon inputs of the Rhône River to the Mediterranean Sea: Biogeochemical Implications, Global Biogeochem. Cy., 14, 669–681, https://doi.org/10.1029/1999GB900069, 2000.
Severin, T., Conan, P., Durrieu de Madron, X., Houpert, L., Oliver, M. J., Oriol, L., Caparros, J., Ghiglione, J. F., and Pujo-Pay, M.: Impact of open-ocean convection on nutrients, phytoplankton biomass and activity, Deep Sea Res. Pt. I, 94, 62–71, https://doi.org/10.1016/j.dsr.2014.07.015, 2014.
Soetaert, K., Herman, P. M. J., Middelburg, J. J., Heip, C., Smith, C. L., Tett, P., and Wild-Allen, K.: Numerical modelling of the shelf break ecosystem: Reproducing benthic and pelagic measurements, Deep-Sea Res. Pt. II, 48, 3141–3177, https://doi.org/10.1016/S0967-0645(01)00035-2, 2001.
Soetaert, K., Hofmann, A., Middelburg, J. J., Meysmann, F. J. R., and Greenwood, J.: The effect of biogeochemical processes on pH, Mar. Chem., 106, 380–401, https://doi.org/10.1016/j.marchem.2006.12.012, 2007.
Solidoro, C., Cossarini, G., Lazzari, P., Galli, G., Bolzon, G., Somot, S. and Salon, S.: Modeling Carbon Budgets and Acidification in the Mediterranean Sea Ecosystem Under Contemporary and Future Climate, Front. Mar. Sci., 8, 781522, https://doi.org/10.3389/fmars.2021.781522, 2022.
Somot, S., Houpert, L., Sevault, F., Testor, P., Bosse, A., Taupier-Letage, I., Bouin, M.-N., Waldman, R., Cassou, C., Sanchez-Gomez, E., Durrieu de Madron, X., Adloff, F., Nabat, P., and Herrmann M.: Characterizing, modelling and understanding the climate variability of the deep water formation in the North-Western Mediterranean Sea, Clim. Dynam., 51, 1179–1210, https://doi.org/10.1007/s00382-016-3295-0, 2016.
Soto-Navarro, J., Jordá, G., Amores, A., Cabos, W., Somot, S., Sevault, F., Macías, D., Djurdjevic, V., Sannino, G., Li, L., and Sein, D.: Evolution of Mediterranean Sea water properties under climate change scenarios in the Med-CORDEX ensemble, Clim. Dynam., 54, 2135–2165, https://doi.org/10.1007/s00382-019-05105-4, 2020.
Stanley, R. H. R., Jenkins, W. J., Lott, D. E., and Doney, S. C.: Noble gas constraints on air-sea gas exchange and bubble fluxes, J. Geophys. Res., 114, C11020, https://doi.org/10.1029/2009JC005396, 2009.
Stukel, M. R. and Ducklow, H. W.: Stirring up the biological pump: Vertical mixing and carbon export in the Southern Ocean, Global Biogeochem. Cy., 31, 1420–1434, https://doi.org/10.1002/2017GB005652, 2017.
Takahashi, T., Sutherland, S. C., Sweeney, C., Poisson, A., Metzl, N., Tillbrook, B., Bates, N., Wanninkhof, R., Feely, R. A., Sabine, C., Olafsson, J., and Nojiri, Y.: Global sea-air CO2 flux based on climatological surface ocean pCO2, and seasonal biological and temperature effects, Deep Sea Res. Pt. II, 49, 1601–1622, https://doi.org/10.1016/S0967-0645(02)00003-6, 2002.
Testor, P.: DEWEX-MERMEX 2013 LEG1 cruise, RV Le Suroît, SISMER, Brest, France, [data set], https://doi.org/10.17600/13020010, 2013.
Testor, P., Bosse, A., and Coppola, L.: MOOSE-GE, https://doi.org/10.18142/235, 2010.
Testor, P., Bosse, A., Houpert, L., Margirier, F., Mortier, L., Legoff, H., Dausse, D. , Labaste, M., Karstensen, J., Hayes, D., Olita, A. , Ribotti, A., Schroeder, K. , Chiggiato, J., Onken, R., Heslop, E. , Mourre, B., D'ortenzio, F. , Mayot, N. , Lavigne, H. , de Fommervault O., Coppola, L., Prieur, L. , Taillandier, V. , Durrieu de Madron, X. , Bourrin , F. , Many, G., Damien, P. , Estournel, C., Marsaleix, P. , Taupier-Letage, I., Raimbault, P., Waldman, R. , Bouin, M. N. , Giordani, H., Caniaux, G., Somot, S., Ducrocq, V., and Conan, P.: Multiscale observations of deep convection in the northwestern Mediterranean Sea during winter 2012–2013 using multiple platforms, J. Geophys. Res.-Oceans, 123, 1745–1776, https://doi.org/10.1002/2016JC012671, 2018.
Testor, P., Coppola, L., and Mortier, L.: MOOSE-GE 2013 cruise, RV Téthys II, SISMER, Brest, France, https://doi.org/10.17600/13450110, 2013.
Touratier, F. and Goyet C.: Decadal evolution of anthropogenic CO2 in the northwestern Mediterranean Sea from the mid-1990s to the mid-2000s, Deep-Sea Res. Pt. I, 56, 1708–1716, https://doi.org/10.1016/j.dsr.2009.05.015, 2009.
Touratier, F., Goyet, C., Houpert, L., Durrieu de Madron, X., Lefèvre, D., Stabholz, M., and Guglielmi, V.: Role of deep convection on anthropogenic CO2 sequestration in the Gulf of Lions (northwestern Mediterranean Sea), Deep Sea Res. Pt. I, 113, 33–48, https://doi.org/10.1016/j.dsr.2016.04.003, 2016.
Turk, D., Malačič, V., DeGrandpre, M. D., and McGillis, W. R.: Carbon dioxide variability and air-sea fluxes in the northern Adriatic Sea, J. Geophys. Res., 115, C10043, https://doi.org/10.1029/2009JC006034, 2010.
Urbini, L., Ingrosso, G., Djakovac, T., Piacentino, S., and Giani, M.: Temporal and Spatial Variability of the CO2 System in a Riverine Influenced Area of the Mediterranean Sea, the Northern Adriatic, Front. Mar. Sci., 7, 679, https://doi.org/10.3389/fmars.2020.00679, 2020.
Ulses, C., Auger, P.-A., Soetaert, K., Marsaleix, P., Diaz, F., Coppola, L., Herrmann, M. J., Kessouri, F., and Estournel, C.: Budget of organic carbon in the North-Western Mediterranean Open Sea over the period 2004–2008 using 3D coupled physical biogeochemical modeling, J. Geophys. Res.-Oceans, 121, 7026–7055, https://doi.org/10.1002/2016JC011818, 2016.
Ulses, C., Estournel, C., Bonnin, J., Durrieu de Madron, X., and Marsaleix, P.: Impact of storms and dense water cascading on shelf-slope exchanges in the Gulf of Lion (NW Mediterranean), J. Geophys. Res., 113, C02010, https://doi.org/10.1029/2006JC003795, 2008.
Ulses, C., Estournel, C., Fourrier, M., Coppola, L., Kessouri, F., Lefèvre, D., and Marsaleix, P.: Oxygen budget of the north-western Mediterranean deep- convection region, Biogeosciences, 18, 937–960, https://doi.org/10.5194/bg-18-937-2021, 2021.
van Heuven, S., Pierrot, D., Rae, J., Lewis, E., and Wallace, D.: MATLAB program developed for CO2 system calculations [Software], ORNL/CDIAC-105b. Carbon Dioxide Information Analysis Center, Oak Ridge National Laboratory, U.S. Department of Energy, Oak Ridge, Tennessee, 2011.
von Schuckmann, K., Le Traon, P. Y., Smith, N., Pascual, A., Brasseur, P., Fennel, K., Djavidnia, S., Aaboe, S., Alvarez Fanjul, E., Autret, E., Axell, L., Aznar, R., Benincasa, M., Bentamy, A., Boberg, F., Bourdallé-Badie, R., Buongiorno Nardelli, B., Brando, V. E., Bricaud, C., Breivik, L.-A., Brewin, R. J.W., Capet, A., Ceschin, A., Ciliberti, S., Cossarini, G., de Alfonso, M., de Pascual Collar, A., de Kloe, J., Deshayes, J., Desportes, C., Drévillon, M., Drillet, Y., Droghei, R., Dubois, C., Embury, O., Etienne, H., Fratianni, C., García Lafuente, J., Garcia Sotillo, M., Garric, G., Gasparin, F., Gerin, R., Good, S., Gourrion, J., Grégoire, M., Greiner, E., Guinehut,S., Gutknecht, E., Hernandez,F., Hernandez, O., Høyer, J., Jackson, L., Jandt, S., Josey, S., Juza, M., Kennedy, J., Kokkini, Z., Korres, G., Kõuts, M., Lagemaa,P., Lavergne, T., le Cann, B., Legeais, J.-F., Lemieux-Dudon, B., Levier, B., Lien, V., Maljutenko, I., Manzano,F., Marcos, M., Marinova, V., Masina, S., Mauri, E., Mayer, M., Melet, A., Mélin, F., Meyssignac, B., Monier, M., Müller, M., Mulet, S., Naranjo, C., Notarstefano, G., Paulmier, A., Pérez Gomez, B., Pérez Gonzalez, I., Peneva, E., Perruche, C., Peterson, K. A., Pinardi, N., Pisano, A., Pardo, S., Poulain, P.-M., Raj, R. P., Raudsepp, U., Ravdas, M., Reid, R., Rio, M.-H., Salon, S., Samuelsen, A., Sammartino, M., Sammartino, S., Sandø, A. B., Santoleri, R., Sathyendranath, S., She, J., Simoncelli, S., Solidoro, C., Stoffelen, A., Storto,A., Szerkely, T., Tamm, S., Tietsche, S., Tinker, J., Tintore, J., Trindade, A., van Zanten, D., Vandenbulcke, L., Verhoef, A., Verbrugge, N., Viktorsson, L., von Schuckmann, K., Wakelin, S. L., Zacharioudaki, A., and Zuo, H.: Copernicus marine service ocean state report, J. Operat. Oceanogr., 11, 1–142, 2018.
Waldman, R., Brüggemann, N., Bosse, A., Spall, M., Somot, S., and Sevault, F.: Overturning the Mediterranean thermohaline circulation, Geophys. Res. Lett., 45, 8407–8415, https://doi.org/10.1029/2018GL078502, 2018.
Wanninkhof, R.: Relationship between wind speed and gas exchange over the ocean, J. Geophys. Res., 97, 7373–7382, https://doi.org/10.1029/92JC00188, 1992.
Wanninkhof, R.: Relationship between wind speed and gas exchange over the ocean revisited, Limnol. Oceanogr.-Meth., 12, 351–362, https://doi.org/10.4319/lom.2014.12.351, 2014.
Wanninkhof, R., Asher, W. E., Ho, D. T., Sweeney, C., and McGillis, W. R.: Advances in quantifying air-sea gas exchange and environmental forcing, Annu. Rev. Mar. Sci., 1, 213–244, https://doi.org/10.1146/annurev.marine.010908.163742, 2009.
Wanninkhof, R. and McGillis, W. R.: A cubic relationship between gas transfer and wind speed, Geophys. Res. Lett., 26, 1889–1893, 1999.
Weiss, R.: Carbon dioxide in water and seawater: The solubility of a non ideal gas, Mar. Chem., 2, 203215, https://doi.org/10.1016/0304-4203(74)90015-2, 1974.
Wimart-Rousseau, C., Wagener, T., Álvarez, M., Moutin, T., Fourrier, M., Coppola, L., Niclas-Chirurgien, L., Raimbault, P., D'Ortenzio, F., Durrieu de Madron, X., Taillandier, V., Dumas, F., Conan, P., Pujo-Pay, M., and Lefèvre, D.: Seasonal and Interannual Variability of the CO2 System in the Eastern Mediterranean Sea: A Case Study in the North Western Levantine Basin, Front. Mar. Sci., 8, 649246, https://doi.org/10.3389/fmars.2021.649246, 2021.
Wolf, M. K., Hamme, R. C., Gilbert, D., Yashayaev, I., and Thierry, V.: Oxygen saturation surrounding Deep Water formation events in the Labrador Sea from Argo-O2 data, Global Biogeochem. Cy., 32, 635–653, https://doi.org/10.1002/2017GB005829, 2018.
Woolf, D. K.: Bubbles and their role in gas exchange, in: The Sea Surface and Global Change, edited by: Liss, P. S. and Duce, R. A., Cambridge Univ. Press, Cambridge, U. K., 173–206, https://doi.org/10.1017/CBO9780511525025.007, 1997.