the Creative Commons Attribution 4.0 License.
the Creative Commons Attribution 4.0 License.
 | 21 Dec 2023
Microbial methane formation in deep aquifers associated with the sediment burial history at a coastal site
Reo Ikawa
Masaru Koshigai
Elucidating the mechanisms underlying microbial methane formation in subsurface environments is essential to understanding the global carbon cycle. This study examined how microbial methane formation (i.e., methanogenesis) occurs in natural-gas-bearing sedimentary aquifers throughout the sediment burial history. Water samples collected from six aquifers of different depths exhibited ascending vertical gradients in salinity from brine to fresh water and in temperature from mesophilic to psychrophilic conditions. Analyses of gas and water isotopic ratios and microbial communities indicated the predominance of methanogenesis via CO2 reduction. However, the hydrogen isotopic ratio of water changed along the depth and salinity gradient, whereas the ratio of methane changed little, suggesting that in situ methanogenesis in shallow sediments does not significantly contribute to methane in the aquifers. The population of methane-producing microorganisms (methanogens) was highest in the deepest saline aquifers, where the water temperature, salinity, and total organic carbon content of the adjacent mud sediments were the highest. Cultivation of the dominant hydrogenotrophic methanogens in the aquifers showed that the methanogenesis rate was maximized at the temperature corresponding to that of the deepest aquifer. These results suggest that high-temperature conditions in deeply buried sediments are associated with enhanced in situ methanogenesis and that methane that forms in the deepest aquifer migrates upward into the shallower aquifers by diffusion.
- Article
(2079 KB) - Full-text XML
-
Supplement
(2148 KB) - BibTeX
- EndNote


Terrestrial subsurface environments are massive reservoirs of water and organic matter where microbial processes drive geochemical cycling (Lovley and Chapelle, 1995; McMahon and Parnell, 2014). Aquifers that form in sedimentary environments provide microorganisms with pore spaces, water, and buried organic materials that serve as energy and carbon sources, thereby sustaining metabolic activity and influencing the organic and inorganic geochemistry of subsurface environments (McMahon and Chapelle, 1991; Lovley and Chapelle, 1995; Fredrickson et al., 1997; Krumholz et al., 1997).
Methanogenesis, the process of methane formation by methanogens, represents a terminal step in the degradation of organic matter in anoxic environments (Lovley and Chapelle, 1995). Methanogens form a diverse group of archaea that produce methane from various substrates, including H2 and CO2 (hydrogenotrophic), methylated compounds (methylotrophic), acetate (acetoclastic), methoxylated aromatic compounds (Mayumi et al., 2016), and alkanes (Zhou et al., 2022). Because active methanogens are widespread in subsurface environments (Mesle et al., 2013), it has been speculated that microbial methane may comprise a larger proportion of natural gas reserves than previously thought (Kotelnikova, 2002). In addition to methanogenesis, recent research has shed light on the process of methane formation by certain nonmethanogenic microbes, including cyanobacteria, algae, fungi, purple nonsulfur bacteria, and cryptogamic covers, which occur in oxygen-saturated aquatic and terrestrial ecosystems (Liu et al., 2022).
The sedimentary aquifers explored in this study are located beneath the Teshio Plain in a coastal area of northern Japan (Fig. S1 in the Supplement). Isotopic analysis of hydrocarbon gases in this area has revealed that methane predominates over ethane and propane, thus suggesting a microbial origin for natural gases (Tamamura et al., 2014). Ikawa et al. (2014), who conducted geochemical analyses of pore waters extracted from sediment core samples from the D-1 borehole drilled to a depth of 1000 m below the ground surface (m b.g.s.) of the plain, found vertical gradients of the Cl− concentration and the hydrogen isotopic ratio of water (Fig. 1b and c). They proposed the following processes to explain how these gradients formed. Sediments corresponding to the Yuchi Formation were deposited in shallow marine environments during the late Pliocene Epoch. Deposition of the sediments corresponding to the Sarabetsu Formation, which overlies the Yuchi Formation, occurred in bay, lagoon, or fluvial environments during the early Pleistocene Epoch. Brackish and fresh waters trapped during this period became mixed with brine from the Yuchi Formation by diffusion, resulting in the formation of a continuous vertical salinity gradient. Aquifers within the upper part of the Sarabetsu Formation (90–280 m b.g.s.) were recharged with paleo-meteoric water. Throughout the burial history of the Yuchi Formation, temperature increased along the geothermal gradient (Fig. 1d). Therefore, aquifers in the Yuchi Formation provide an opportunity to explore the impacts of these geochemical changes on microbial methane formation.
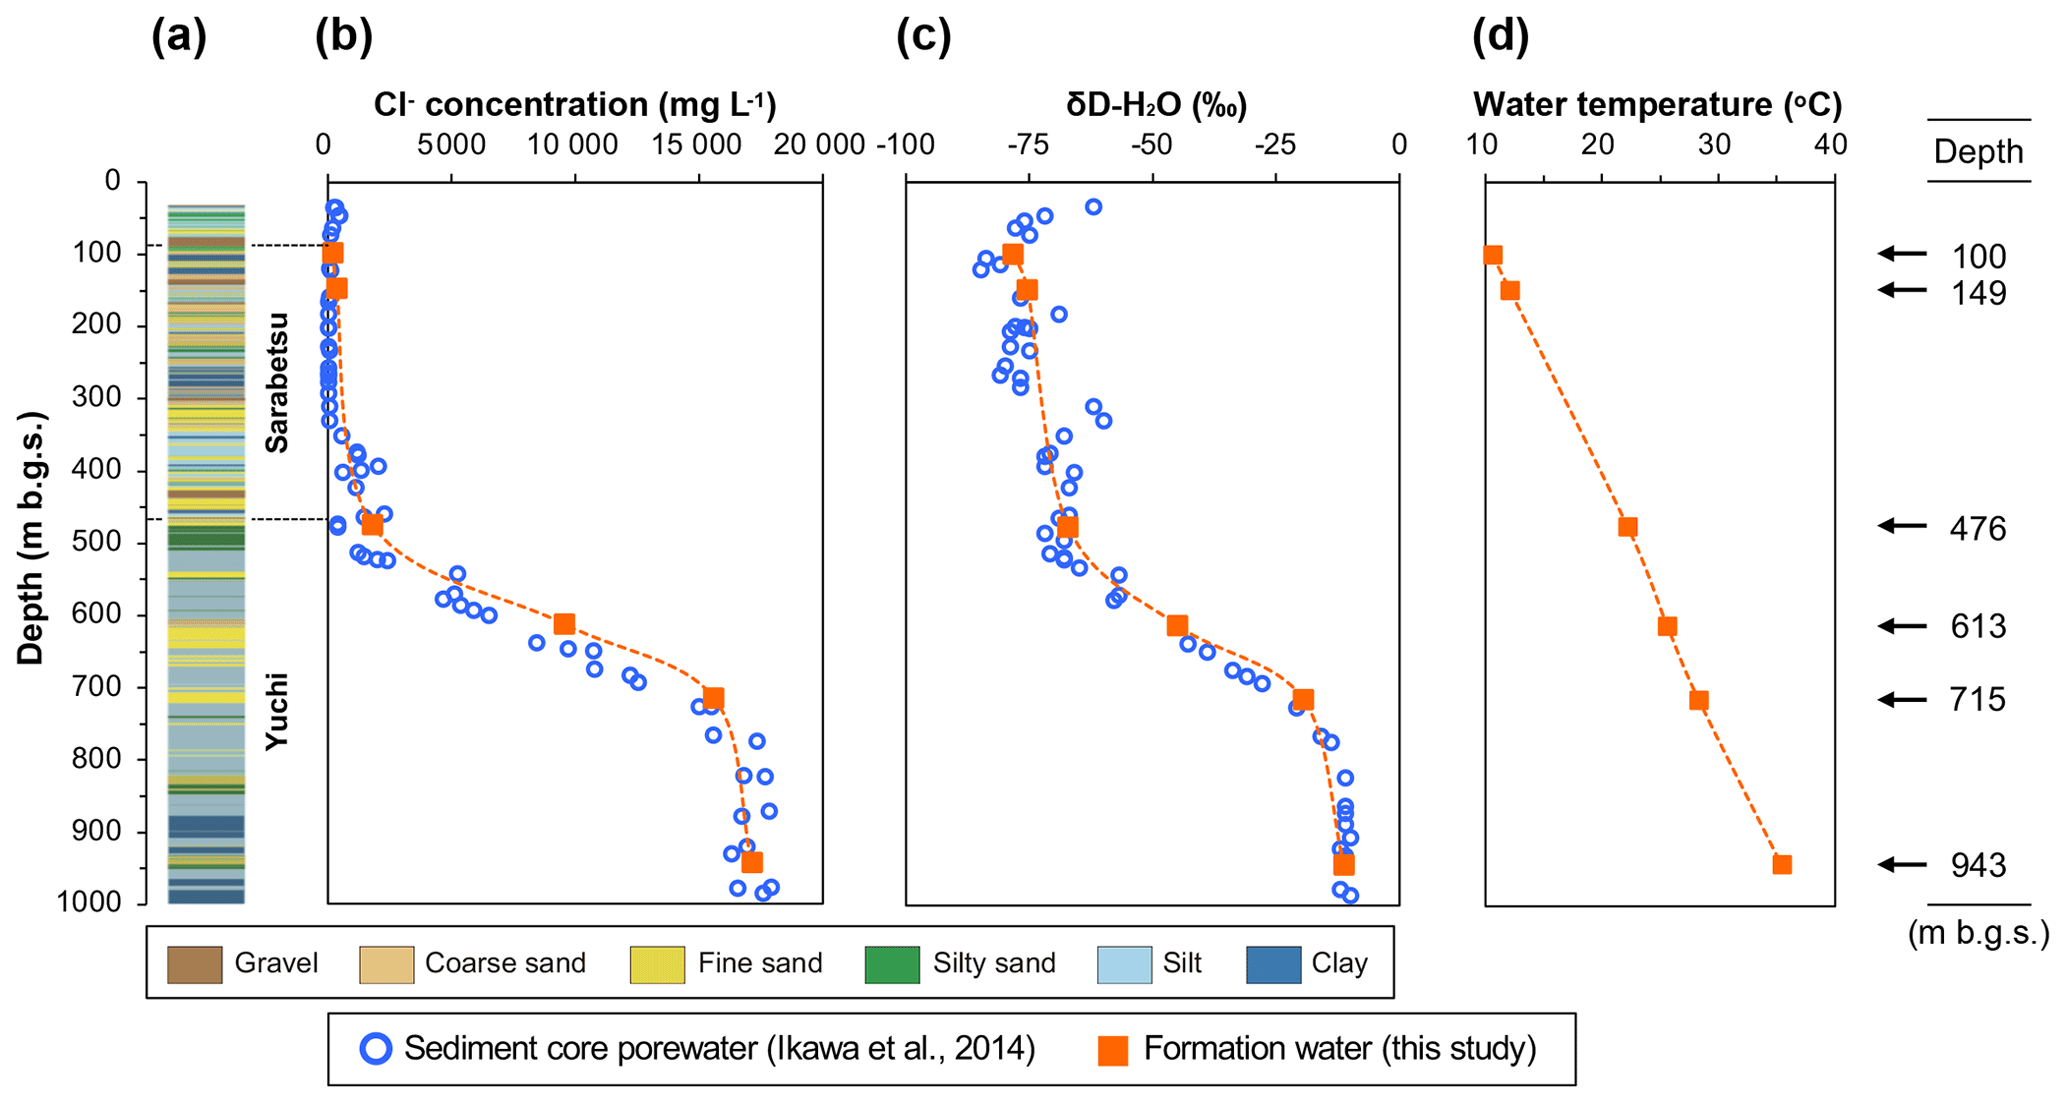
Figure 1Depth profiles of borehole D-1: (a) lithology, (b) Cl− concentration, (c) hydrogen isotopic ratio, and (d) temperature of sediment core pore water (blue open circles) (data from Ikawa et al., 2014) and water samples from the aquifers investigated in this study (orange solid squares). The aquifer depths at which the waters were sampled are shown on the right.
In this study, water samples were collected from the saline aquifers in the Yuchi Formation (fine sand at 476, coarse sand at 613, fine sand at 715, and fine sand at 943 m b.g.s.) and from the freshwater aquifers (coarse sand at 100 and 149 m b.g.s.) in the upper part of the Sarabetsu Formation as reference material for the Yuchi Formation samples (Fig. 1). Whereas many previous studies have conducted geologic and geochemical analyses to examine the relationship between the burial history of geological formations and the occurrence of methane deposits (e.g., Zhang et al., 2013, and references therein), this study combines microbiological analyses (e.g., gene sequencing and cultivation-based analyses) with geochemical analyses to elucidate this relationship from multiple perspectives.
2.1 Site description and sample collection
The study site was located on a sand dune 300 m from the coastline of the Teshio Plain located in northern Hokkaido (44.9948∘ N, 141.6882∘ E) at an elevation of 5.2 m above sea level (Fig. S1). The geology of this site down to a depth of 1000 m b.g.s. consists of the Yuchi Formation, the Sarabetsu Formation, and alluvium, in ascending order. Hydraulic gradient and conductivity, water isotopic, and geological data indicate that clay aquitards at approximately 300 m b.g.s. prevent water in the upper part of the Sarabetsu Formation from mixing with connate water in the lower part of the Sarabetsu Formation and the underlying Yuchi Formation (Ikawa et al., 2014). Indeed, a drastic change observed in the stable hydrogen (δD) isotope ratio of the water at approximately 300 m b.g.s. (Fig. 1c) indicates that the aquifers above and below that depth are hydrologically different (Ikawa et al., 2014).
The water samples for this study were collected from three wells: D-1, D-2, and D-3. The D-2 and D-3 wells are located within 30 m of D-1. Two samples from D-2 and D-3 are made up of fresh water derived from the upper Sarabetsu Formation, and four samples from D-1 are brines derived from the Yuchi Formation. Samples from D-2 and D-3 were pumped through strainers at depths of 90–100 and 130–149 m b.g.s., respectively, while samples from D-1 were pumped with borehole packer assemblies at depths of 476, 613, 715, and 943 m b.g.s. The water samples were obtained after chemical parameters, such as the water temperature, electrical conductivity, pH, and oxidation–reduction potential, had stabilized. Before sample collection, waters of approximately 44–160 times the wellbore volume of D-2 or D-3 and 4–13 times the packer-sealed area of D-1 were pumped out.
Water samples for microbial cultures were collected in sterilized glass bottles with butyl rubber stoppers and screw caps. The bottles were purged with N2 gas before and during sample collection and then filled with the water sample to raise the internal pressure of the bottles, effectively preventing the penetration of air. For the molecular analysis, 4 L water samples were collected and filtered through a 0.2 µm pore size Millipore Express Plus membrane filter (Millipore, Billerica, MA, USA) and stored at −20 ∘C. The samples used for total cell counts were fixed with formalin at a final concentration of 2 % () immediately after sampling and stored at 4 ∘C. The gases that were associated with the formation water in aquifers (i.e., under high-pressure conditions) were naturally separated from the water when it was sampled under atmospheric pressure. These separated gases were collected using the water displacement method.
2.2 Geochemical analysis
The chemical compositions and stable hydrogen isotope ratios (δD) of the water samples were measured by using ion chromatography (DIONEX ICS-5000, Thermo Fisher Scientific, Bremen, Germany) and a liquid water isotope analyzer (L2120-i, Picarro, Santa Clara, CA, USA), respectively. The standard deviation of δD for water was 1 ‰.
The gas composition was analyzed using two gas chromatographs: a Shimadzu GC-8A equipped with a thermal conductivity detector (TCD) and a Molecular Sieve 5A column and an Agilent 6890 equipped with a flame ionization detector and a PoraPLOT Q column. Stable carbon (δ13C) and hydrogen (δD) isotope ratios of methane, along with the δ13C of carbon dioxide, were measured using a Trace Ultra gas chromatograph connected to a DELTA V plus isotope ratio mass spectrometer (IRMS) through a GC IsoLink combustion–pyrolysis interface (Thermo Fisher Scientific), and the column was a PoraPLOT Q. The Natural Gas Standard NGS3 was used as an isotope reference material. The standard deviations of δD and δ13C for methane were 1.6 ‰ and 0.3 ‰, respectively, and the standard deviation of δ13C for carbon dioxide was 0.2 ‰.
The total organic carbon (TOC) content of silty or clayey sediment core samples from the Yuchi Formation, collected previously by Ikawa et al. (2014), was measured with a TruSpec CHN analyzer (LECO). Before the measurements, samples were pulverized to less than 200 mesh and treated with 1 M HCl to remove inorganic carbon.
2.3 Direct cell counts
A fixed water sample was filtered through a 0.2 µm pore size Isopore membrane filter (Millipore), stained for 10 min with SYBR Green solution (10 µg mL−1), and observed under an epifluorescence microscope (Olympus, Tokyo, Japan).
2.4 DNA extraction and quantitative PCR for 16S rRNA and mcrA genes
DNA was extracted from the filtered water and methanogenic culture (as described below) samples by using a PowerWater kit (MoBio Laboratories, CA, USA) according to the manufacturer's protocol. Quantitative PCR targeting bacterial and archaeal 16S rRNA genes in water samples was performed in triplicate by the quenching probe method (Tani et al., 2009) using TITANIUM Taq DNA polymerase (Takara, Otsu, Japan) in a Rotor-Gene Q real-time cycler (QIAGEN, Valencia, CA). The primers and probes used for real-time PCR and sequencing (as described below) are listed in Table S1 in the Supplement. The cycling conditions were 95 ∘C for 2 min, followed by 50 cycles of 93 ∘C for 15 s, 61 ∘C for 20 s, and 72 ∘C for 25 s. The copy numbers of the mcrA gene, which encodes a methyl-coenzyme M reductase alpha subunit, an enzyme central to methanogenesis, were quantified in triplicate by SYBR Green real-time PCR using SYBR Premix Ex-Taq II (Takara) in a LightCycler 1.0 (Roche, Basel, Switzerland). The cycling conditions were 95 ∘C for 30 s, followed by 50 cycles of 95 ∘C for 15 s, 52 ∘C for 20 s, and 72 ∘C for 25 s. Tenfold serial dilutions of the target PCR products for Escherichia coli K12 (ATCC 10798) (for the bacterial 16S rRNA gene) and Methanobacterium bryantii M.o.H. (ATCC 33272) (for the archaeal 16S rRNA and mcrA genes) were also amplified to calculate the gene copy numbers.
2.5 454 pyrosequencing of 16S rRNA genes
The 16S rRNA genes, including the V3 and V4 regions, were amplified using AmpliTaq Gold 360 DNA polymerase (Life Technologies, CA, USA) with a Univ515F primer (fused to the 454-specific adaptor A and 6-nt barcode sequences) and a Univ926R primer (fused to adaptor B). The cycling conditions were 95 ∘C for 10 min, followed by 25–27 cycles of 95 ∘C for 30 s, 50 ∘C for 40 s, and 72 ∘C for 30 s, with a final extension period of 7 min at 72 ∘C. Four replicates of PCR products for each sample were pooled and purified by using a MonoFas DNA purification kit. Pyrosequencing was performed using a 454 Life Sciences GS FLX Titanium platform (Roche, Basel, Switzerland) at Hokkaido System Science Co., Ltd. (Sapporo, Japan).
2.6 Cloning and Sanger sequencing of the mcrA gene
The mcrA gene was amplified from the six original water and methanogenic culture samples (as described below) by using the MLf and MLr primer pair (Luton et al., 2002) and AmpliTaq Gold 360 DNA Polymerase (Thermo Fisher Scientific). The PCR products were purified by using a MonoFas DNA purification kit (GL Sciences, Tokyo, Japan), cloned in the pCR4-TOPO vector (Thermo Fisher Scientific), and sequenced by the dideoxynucleotide chain-termination method using BigDye terminator reagents (Thermo Fisher Scientific) and an automated sequence analyzer (3730 DNA Analyzer, Thermo Fisher Scientific) according to the manufacturer's instructions.
2.7 Sequence analysis
The 454 pyrosequencing reads of the 16S rRNA genes were analyzed by using Mothur version 1.48 software (Schloss et al., 2009), as described previously (Katayama et al., 2015, 2022) with the following modifications. Quality-filtered sequences with an average length of 250 bp were classified by using a Bayesian classifier based on the Silva taxonomy SSU Ref 138.1 dataset (Pruesse et al., 2007) with a confidence threshold of 80 %. The putative methanogens in the 16S rRNA gene sequences were searched based on this taxonomic classification.
Sanger sequences of the mcrA gene were translated to amino acids and aligned by using MAFFT version 7 software (Katoh and Standley, 2013). Amino acid sequences with >93 % sequence identity were treated as operational taxonomic units (OTUs). In each OTU, the most abundant sequence was selected as the representative sequence. The species most closely related to the OTUs were searched by using BLAST (http://blast.ncbi.nlm.nih.gov/Blast.cgi, last access: 6 May 2023).
The 454-sequencing data were submitted to the DDBJ Sequence Read Archive database under accession number DRA001113. The GenBank/EMBL/DDBJ accession numbers for the mcrA gene sequences are LC214911 to LC214935.
2.8 Cultivation of methanogens
The basal medium used for the methanogenic cultures consisted of 10 mM NH4Cl, 1 mM KH2PO4, 15 mM MgCl2⋅6H2O, 1 mM CaCl2⋅2H2O, 30 mM NaHCO3, 1 mL L−1 selenium and tungsten solution, 1 mL L−1 trace element solution, 2 mL L−1 vitamin solution, 1 mL L−1 resazurin solution (1 mg mL−1), and 0.5 mM titanium(III) nitrilotriacetate (as a reducing agent) (Katayama and Kamagata, 2018; Katayama et al., 2020). A total of 20 mL of basal mineral medium was dispensed into 67 mL serum vials. The vials were sealed with butyl rubber septa and aluminum crimps under an atmosphere of (80:20, ). The medium was supplemented with either (80:20, ; 0.1 MPa) or acetate (20 mM) as methanogenic substrates. The medium was further supplemented with NaCl at final concentrations of 250 and 500 mM, which approximated its in situ concentrations at 613 and 943 m b.g.s., respectively. The 1 mL aliquots of the water samples from 613 and 943 m b.g.s. were dispensed into each medium and incubated at 25 ∘C (for the 613 m b.g.s. sample) and 35 ∘C (for the 943 m b.g.s. sample) to approximate the in situ water temperature. Methane production was measured using a GC equipped with a TCD. After methane production was terminated, 4 mL of the sample cultures were harvested by filtration, and the mcrA gene was cloned and sequenced as described above.
2.9 Effects of salinity and temperature on methanogenesis
Methane-producing cultures supplemented with or acetate from the 943 m b.g.s. water sample were subsequently inoculated into fresh media to examine the methanogenic activity under different salinity and temperature conditions. Cultures with different salinities were grown in basal mineral media containing 15, 270, or 480 mM Cl− at 35 ∘C. Cultures with different temperatures were grown in basal mineral media containing 480 mM Cl− at 20, 25, 35, or 45 ∘C. Both culture sets were supplemented with (80:20, ; 0.1 MPa) or acetate (20 mM). The time course for methane production was determined to calculate the methane production rate.
2.10 Cultivation of microorganisms syntrophically oxidizing acetate to methane
Semicontinuous cultivation supplemented with a low concentration of acetate (0.4 mM) was performed in a modified 132 mL glass vial containing sterilized pieces of nonwoven fabric as the carrier material for microbial cells (Fig. S2a in the Supplement) to culture microorganisms involved in syntrophic acetate oxidation (SAO) coupled to methanogenesis via CO2 reduction. A total of 40 mL of basal mineral medium (as described above) supplemented with NaCl (500 mM) and acetate (0.4 mM) was dispensed into the vial. Then, 10 mL of the 943 m b.g.s. water sample was used as an inoculum. The top and bottom of the vial were sealed with a butyl rubber septum and aluminum crimps, and the culture was incubated at 35 ∘C under an (80:20, ) atmosphere for 10 months. During cultivation, the culture was manually fed acetate (0.4 mM) at 3-week intervals. Before feeding, 20 mL of culture liquid was removed from the vial through the bottom septum using a needle syringe, and 20 mL of fresh medium containing acetate (final concentration: 0.4 mM) was then added to the vial through the top septum so that the syntrophic association of microbial cells was not physically disrupted by turning the vial upside down.
After cultivation, 2 mL of culture liquid and a piece of nonwoven fabric were transferred from the semicontinuous cultivation system to 67 mL serum vials containing basal mineral medium with 0.4 mM [2-13C]-acetate or nonlabeled acetate (used as a control) to determine the presence of SAO activity. In both cultures, 0.4 mM labeled or unlabeled acetate supplement was added at 2-week intervals. The incubation was performed in duplicate. Time courses for methane production and the stable carbon isotopic ratio of dissolved inorganic carbon (DIC) in the culture liquid were determined by using GC and GC/IRMS, respectively, as described above.
3.1 Geochemistry of water and sediment
The geochemical properties of the six water samples are summarized in Tables 1 and 2. The redox potentials in the freshwater samples from the upper Sarabetsu Formation aquifers (100 and 149 m b.g.s.) were higher (> −210 mV) than those in the brine samples from the Yuchi Formation aquifers (476, 613, 715, and 943 m b.g.s.) (< −290 mV). and were detected only in the upper Sarabetsu Formation samples but mostly in small amounts not exceeding 1.4 mg L−1. The water temperature increased with depth (r>0.99, p<0.001; linear regression t test) and ranged from 10.6 to 35.4 ∘C. Stiff diagrams showed a difference in water chemistry between the upper Sarabetsu and Yuchi Formation samples (Fig. S3 in the Supplement), which is consistent with hydrologic separation above and below the clay aquitards (Ikawa et al., 2014). The Cl− concentrations and δD-H2O values of all six water samples were similar to those of pore water within the sediment cores at the corresponding depths (Fig. 1); thus, they showed no sign of cross-contamination among the samples.
Table 1Geochemical characteristics of the water samples.
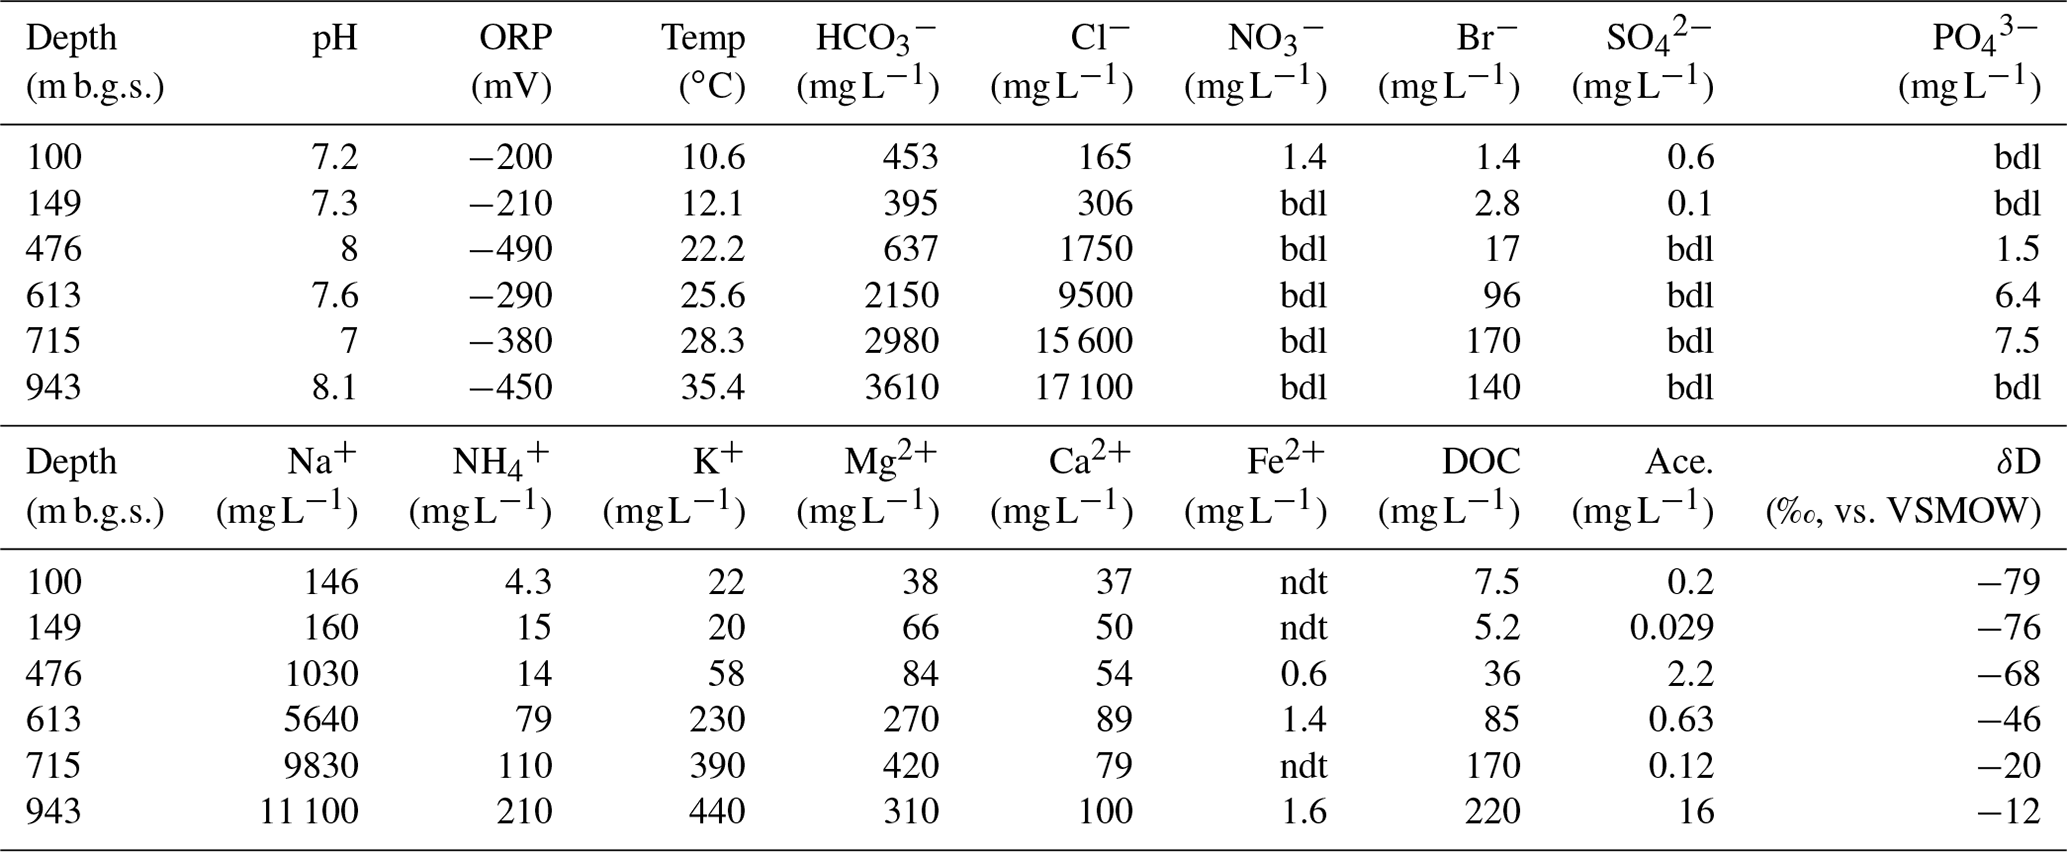
Abbreviations: Ace., acetate; bdl, below the detection limit; DOC, dissolved organic carbon; ORP, oxidation–reduction potential; ndt, not determined; Temp, temperature.
Table 2Geochemical characteristics of the dissolved gas samples.
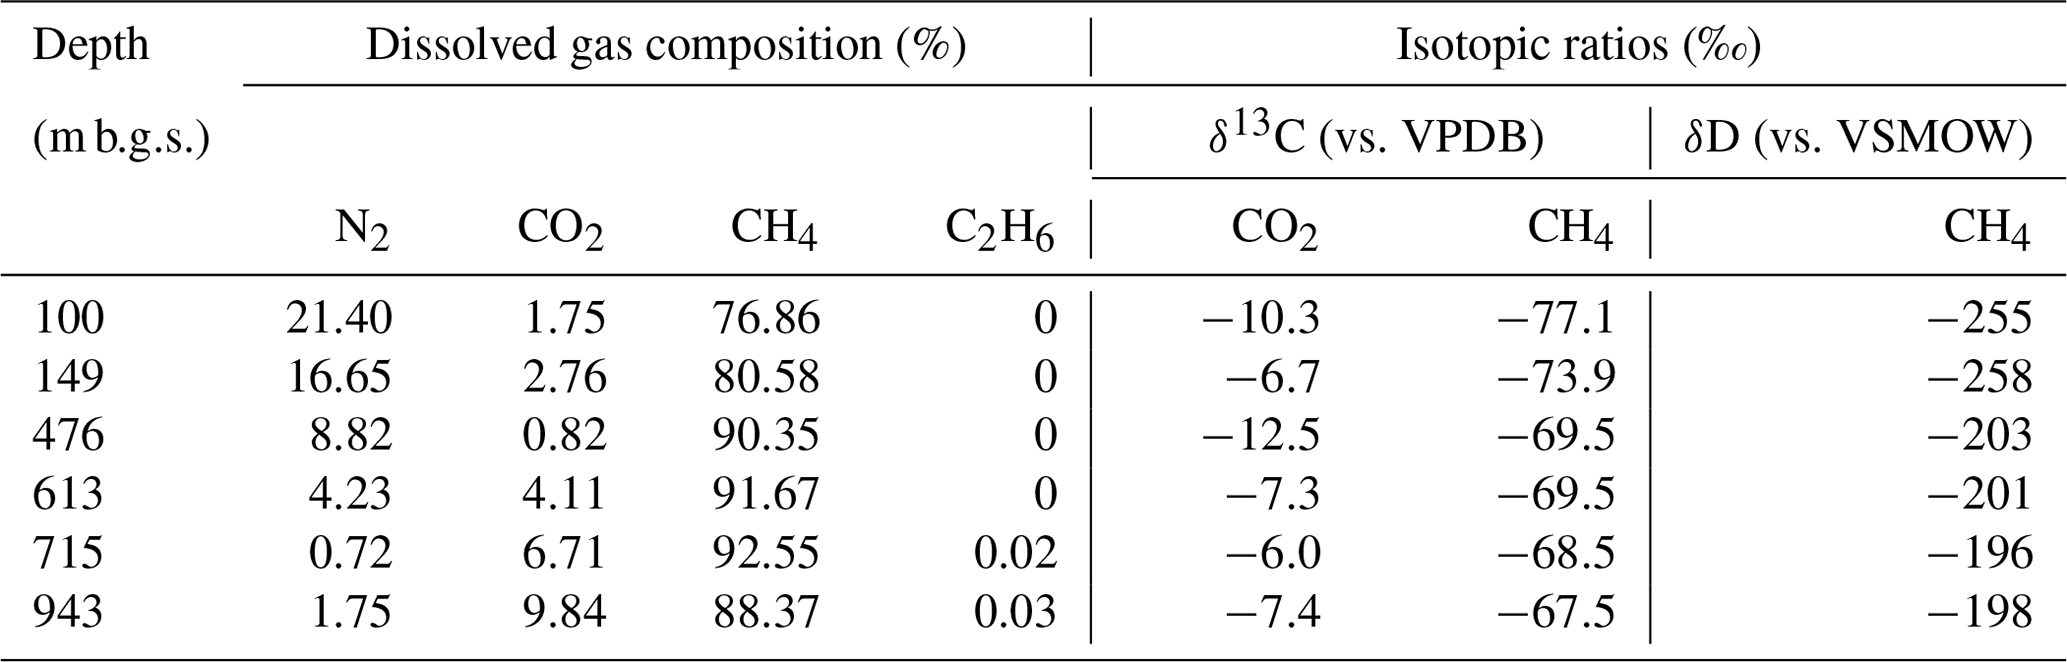
In all water samples, CH4 accounted for >75 % of the total dissolved gas (Table 2). The proportions of CH4 and CO2 increased with depth, whereas that of N2 decreased. The stable carbon (δ13C) and hydrogen (δD) isotopic ratios of methane ranged from −77.1 ‰ to −67.5 ‰ and from −258 ‰ to −196 ‰, respectively. Among the samples from the Yuchi Formation, changes in δD-CH4 values were small (7 ‰) compared with changes in δD-H2O values (56 ‰) (also evident in Fig. 2c). Plots of the isotopic ratios of the gases and water, i.e., δ13C-CH4 versus δD-CH4, δ13C-CO2 versus δ13C-CH4, and δD-CH4 versus δD-H2O (Whiticar, 1999) (Fig. 2a–c), indicated a microbial origin of dissolved methane via the CO2 reduction pathway in both the upper Sarabetsu and the Yuchi Formation samples. Methane dissolved in water from the Koetoi Formation, which underlies the Yuchi Formation (Fig. S1), plotted near the boundary between a biogenic and a thermogenic origin (Tamamura et al., 2014) (Fig. 2a). The isotopic difference indicates that the proportion of methane in the upper Sarabetsu and Yuchi Formations derived from the lower Koetoi Formation was minimal.
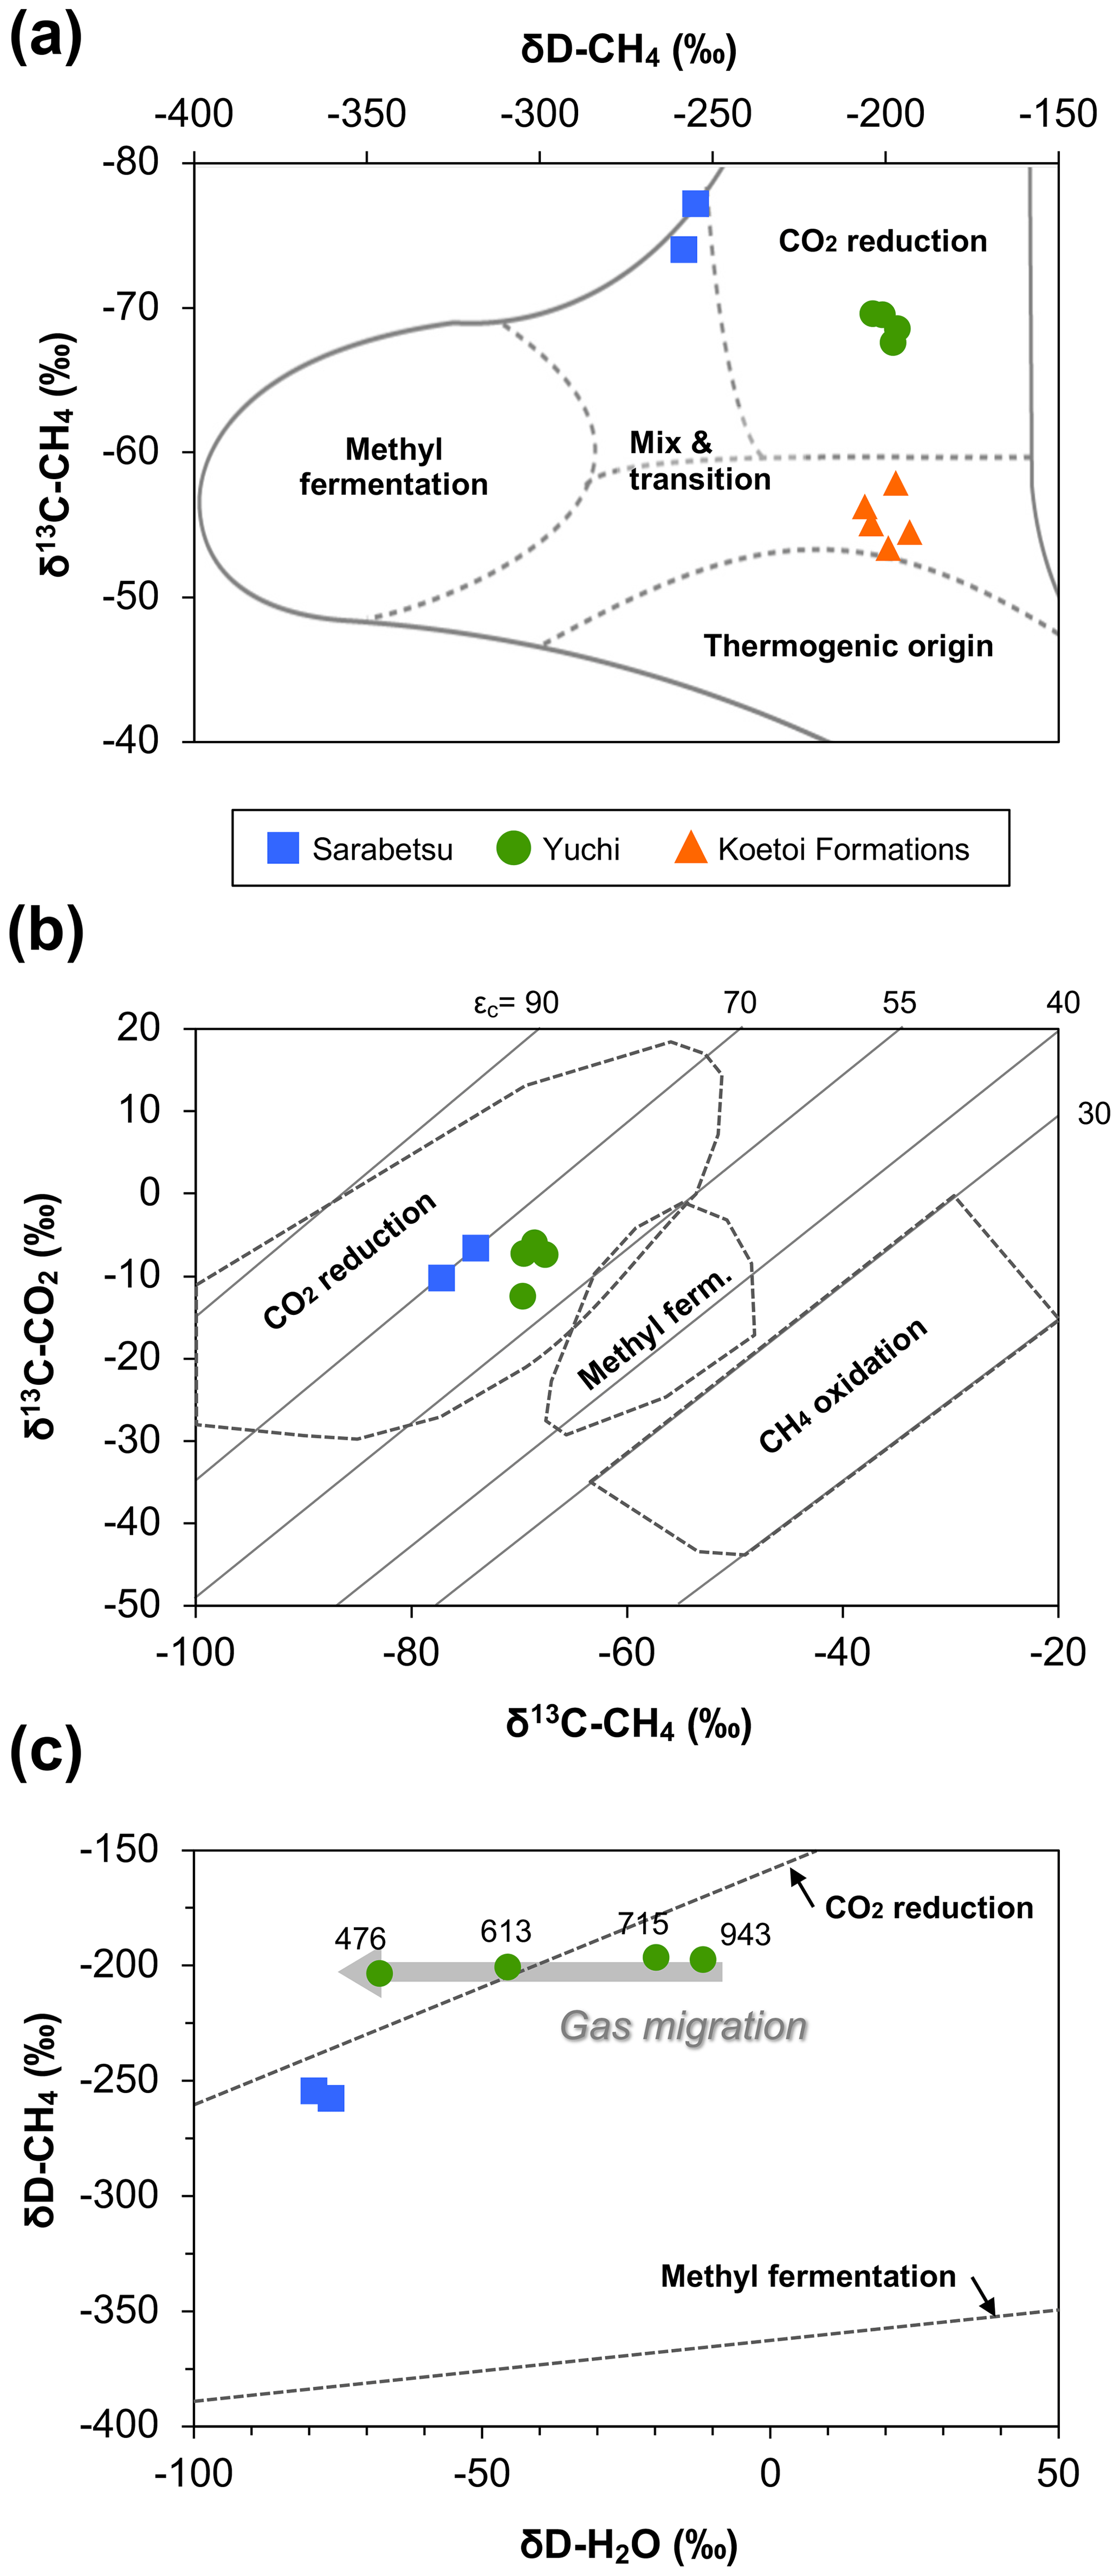
Figure 2Relationships between (a) δD and δ13C of methane, (b) δ13C of methane and δ13C of carbon dioxide, and (c) δD of methane and δD of water for water samples from the upper Sarabetsu Formation (▪) and the Yuchi Formation (•). The origins of methane are estimated in each plot according to Whiticar (1999). In (a), data for water samples from the Koetoi Formation (triangles) (Tamamura et al., 2014) are shown for comparison. The light gray diagonal lines in (b) indicate carbon isotopic fractionation contours (). In (c), the depths (m b.g.s.) of water samples from the Yuchi Formation are indicated.
The TOC contents in sediment core samples from the Yuchi Formation ranged from less than 0.1 % to more than 0.5 % (Fig. S4 in the Supplement). Despite some dispersion associated with lithological changes, the TOC contents showed an overall increasing trend with increasing depth (r=0.77, p<0.001).
3.2 Enumeration of total microbial cells and of 16S rRNA and mcrA genes
The number of microbial cells in the water samples ranged from 1.8×10⁴ to 1.5×10⁶ cells mL−1 (Fig. 3a). The highest and lowest numbers were measured in the 100 and 715 m b.g.s. samples, respectively, and the microbial cell densities in the studied aquifers are comparable to those reported in other deep aquifers (102 to 106 cells mL−1) (Pedersen, 1993).
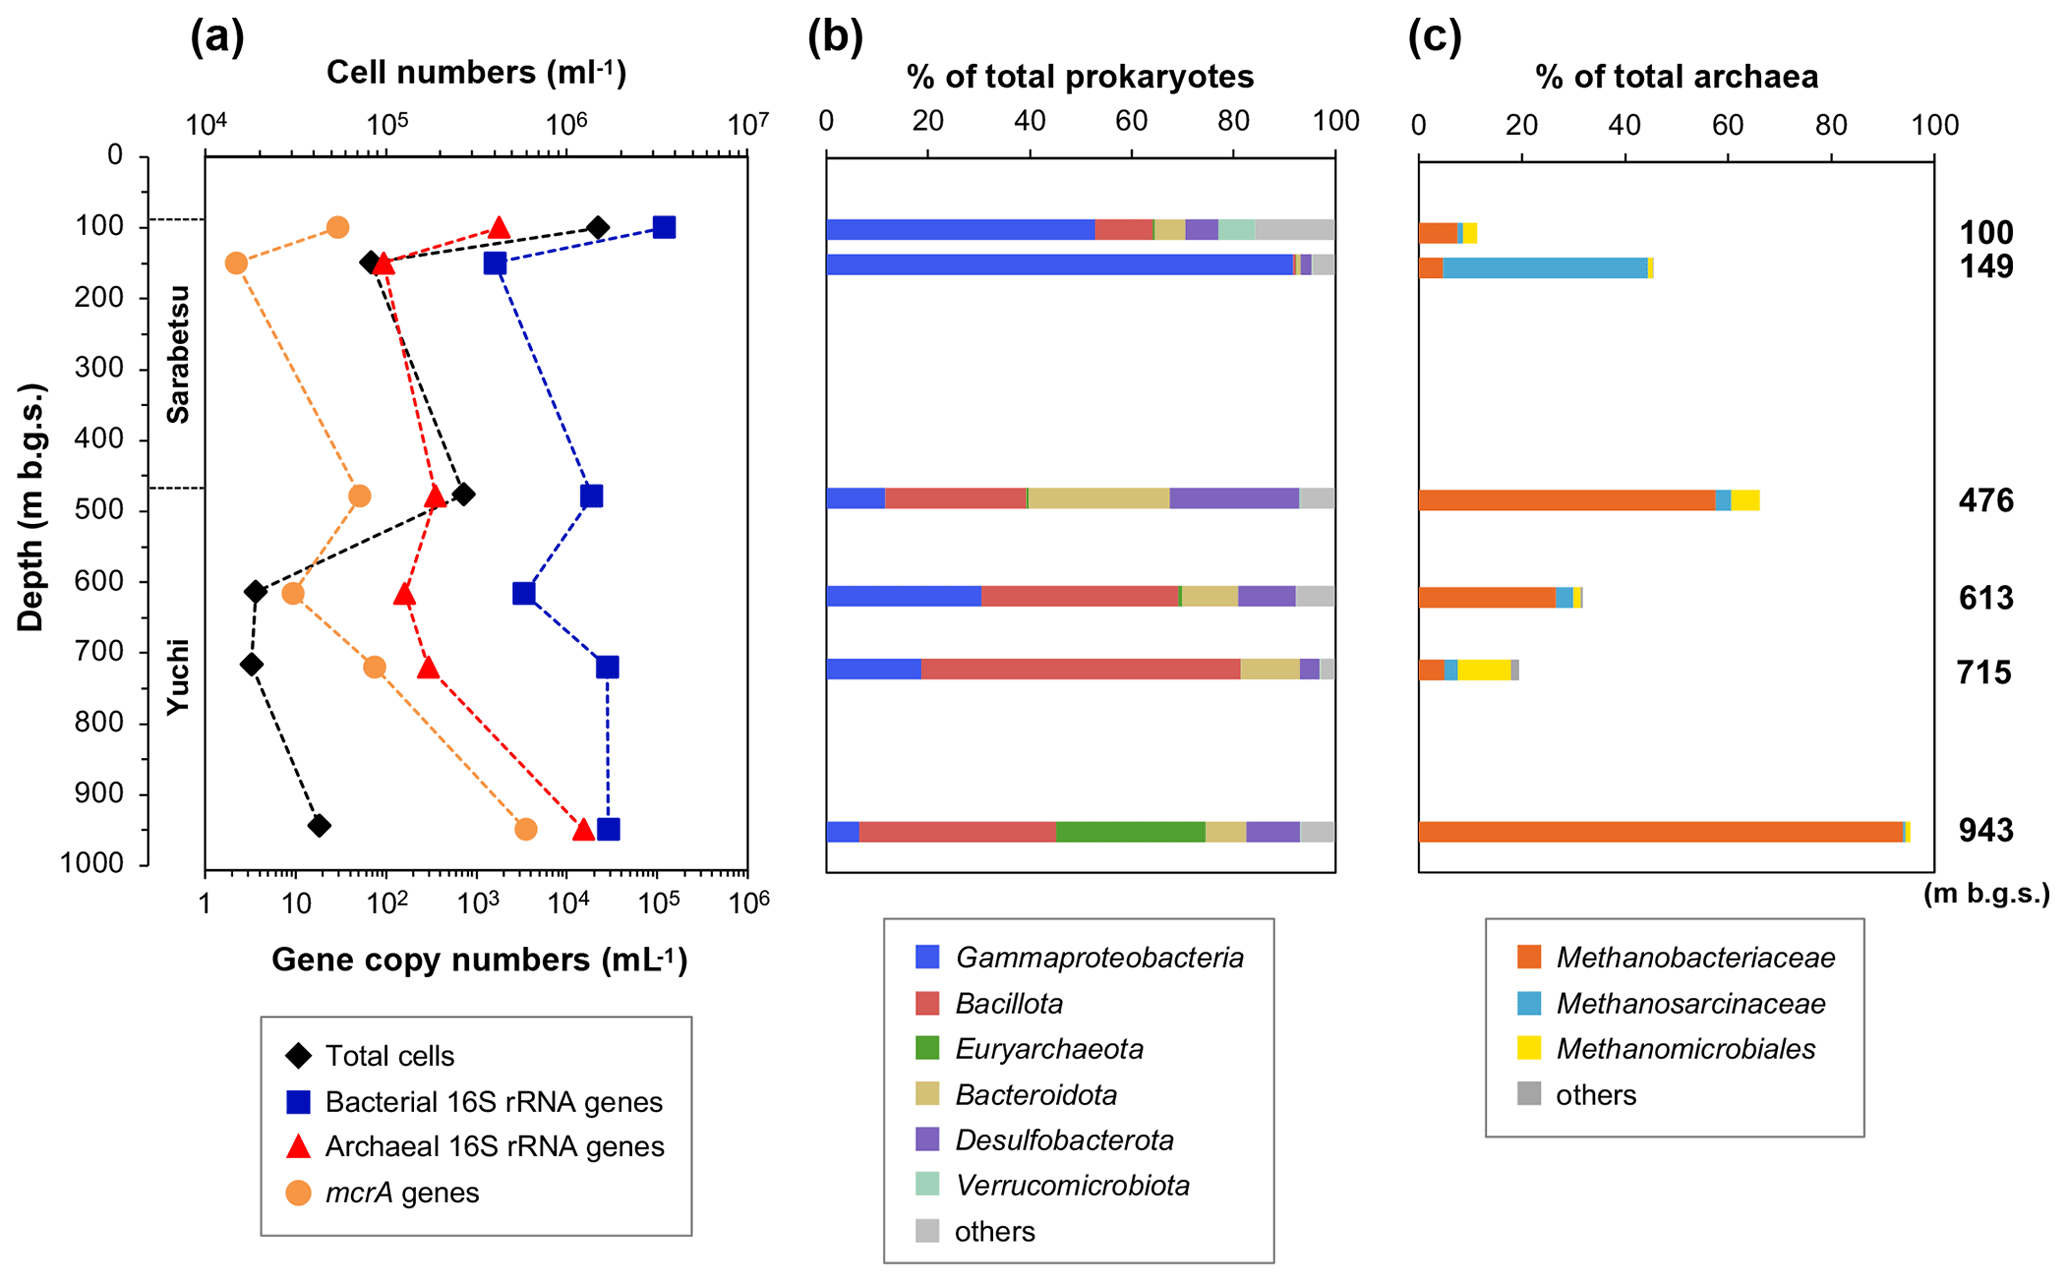
Figure 3Depth-related changes in (a) microbial populations as well as (b) prokaryotic and (c) methanogenic community compositions based on the 16S rRNA gene sequences in water samples.
Bacterial and archaeal populations were measured by quantitative real-time PCR (Fig. 3a). The copy numbers of the bacterial 16S rRNA gene were 103–105 mL−1, whereas those of archaea were 102–104 mL−1. In the Yuchi Formation, the copy numbers of bacterial and archaeal genes were the highest in the deepest (943 m b.g.s.) sample. The copy number of the mcrA gene, which is used to estimate methanogen populations, was also the highest in this sample at 3.5×10³ gene copies mL−1, which is 2–3 orders of magnitude higher than the number of copies of the mcrA gene in the other samples.
3.3 Microbial community compositions in the water samples
The 454-pyrosequencing analysis of 16S rRNA genes was performed to examine the compositions of prokaryotic and methanogenic communities and their consistency with the mcrA gene sequencing analysis results, as described below. After quality filtering, the pyrosequencing reads yielded 14 304–43 532 reads per sample. The major taxonomic groups (>5 % of the total reads in at least one sample) belonged to the following phyla or classes: Gammaproteobacteria, Bacillota (formerly Firmicutes), Euryarchaeota, Bacteroidota, Desulfobacterota, and Verrucomicrobiota (Fig. 3b). Gammaproteobacteria sequences were more abundant in the upper Sarabetsu Formation samples, whereas Bacillota and Bacteroidota were more abundant in the Yuchi Formation samples.
The sequences assigned to putative methanogens accounted for 0.2 %–30 % and 11 %–95 % of prokaryotic and archaeal 16S RNA gene sequences (Fig. 3c), respectively. The high proportion of methanogenic sequences in the 943 m b.g.s. sample is consistent with the quantitative PCR results. Sequences assigned to hydrogenotrophic Methanobacteriales were commonly detected at all depths. In the 149 m b.g.s. sample, high proportions of acetoclastic and/or methylotrophic methanogens of the genus Methanosarcina (Methanosarcinales) were detected.
Apart from the conventional methanogens mentioned above, recent studies indicate the potential of archaea outside the classification of Euryarchaeota to produce methane or break down nonmethane alkanes. Specifically, Methanomethylicales, Nezhaarchaeales, Korarchaeia, and Methanodesulfokores have been found to possess methyl-S-CoM reductase, the central enzyme of methanogenesis, while Bathyarchaeota and Asgard possess alkyl-S-CoM reductase (Acr), which activates nonmethane alkanes (Mei et al., 2023). In the archaeal 16S RNA gene sequences of our samples, however, none of these potential methanogens or hydrocarbon-oxidizing archaea were identified.
3.4 Methanogen diversity in the water samples based on the mcrA genes
A total of 64–69 clones of the mcrA gene per sample were grouped into 14 OTUs (Table 3). Similar to the 16S rRNA gene sequencing analysis results, methanogen diversity differed between the upper Sarabetsu and Yuchi Formation samples. Sequences related to acetoclastic Methanosaeta and hydrogenotrophic Methanoregula were abundant in the upper Sarabetsu Formation samples, whereas hydrogenotrophic Methanobacterium sequences were abundant in the Yuchi Formation samples. In the upper Sarabetsu Formation samples, Candidatus Methanoperedens, which oxidizes methane by coupling to nitrate reduction (Haroon et al., 2013), was also detected. Despite its high proportion, a shift in carbon isotope values toward the methane oxidation region on the δ13C-CH4 versus δ13C-CO2 plot (Whiticar, 1999) was not observed in those samples (Fig. 2b).
Table 3Methanogen diversity based on the mcrA gene in the original water and culture samples.
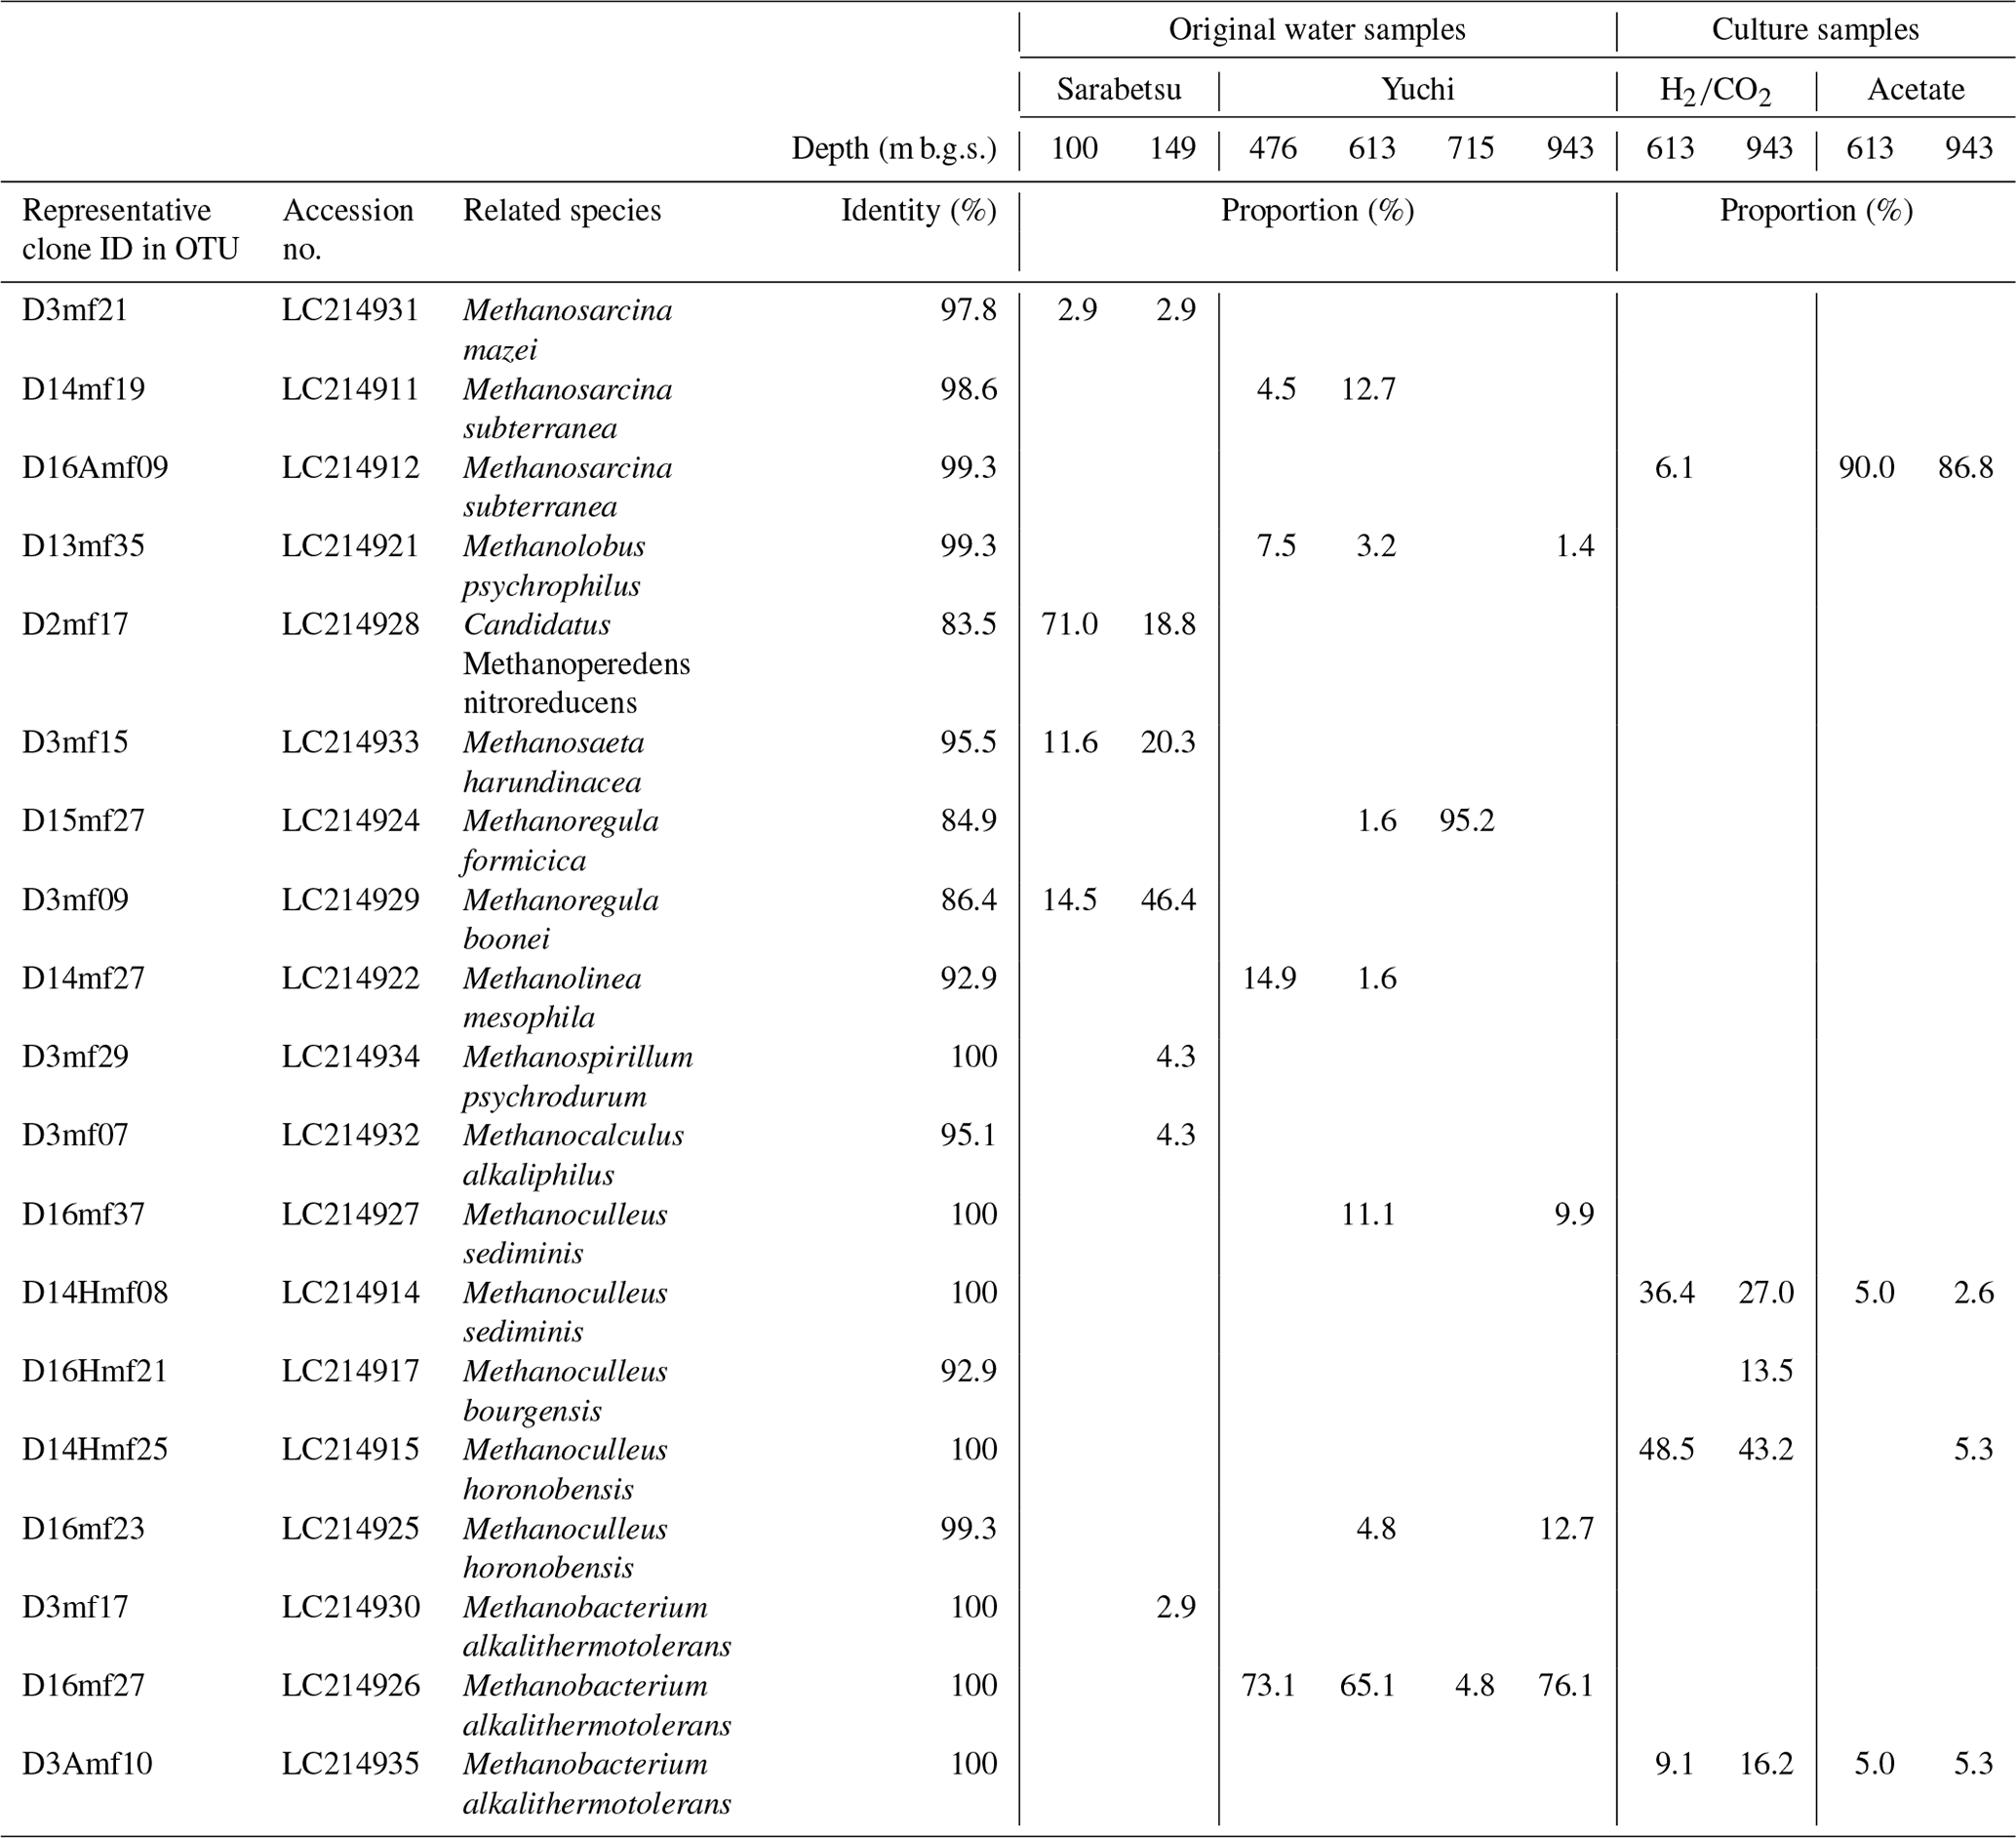
3.5 Methanogen diversity in cultures
The 613 and 943 m b.g.s. water samples from the Yuchi Formation aquifers were cultured with methanogenic substrates (i.e., or acetate) under in situ salinity and temperature conditions to obtain culturable methanogens. Methane was produced from all samples. More than 82 % () of the maximum theoretical yield of methane was obtained, indicating that the supplied methanogenic substrates were primarily used for methanogenesis.
In the acetate-amended cultures, Methanosarcina dominated, whereas Methanoculleus and Methanobacterium were detected in large proportions in the -amended cultures (Table 3). The sequences of these taxa were almost identical to those obtained directly from the original water samples, indicating that the predominant methanogens inhabiting the saline aquifers were successfully cultured. The diversity of the culturable methanogens was not clearly different between the 613 and 943 m b.g.s. samples.
3.6 Effects of salinity and temperature on methanogenic activity
The methanogen cultures from the 943 m b.g.s. water sample were subsequently cultured under different salinity and temperature conditions based on their depth profiles in the Yuchi Formation (Fig. 1b and d). In the -supplemented cultures, the methane production rate decreased slightly under the lowest salinity condition (i.e., 15 mM Cl−), whereas a more notable decrease was observed under the highest salinity condition (480 mM Cl−) in the acetate-supplemented cultures (Fig. 4a). Temperature changes more drastically affected methanogenic activity than salinity changes (Fig. 4b). In both - and acetate-supplemented cultures, methane production rates were the highest at 35 ∘C. At a temperature of 45 ∘C, which approximately corresponds to that at a depth of 1275 m b.g.s. (assuming a thermal gradient of 2.92 ∘C per 100 m; Fig. 1d), methane production was observed only in the -amended culture.
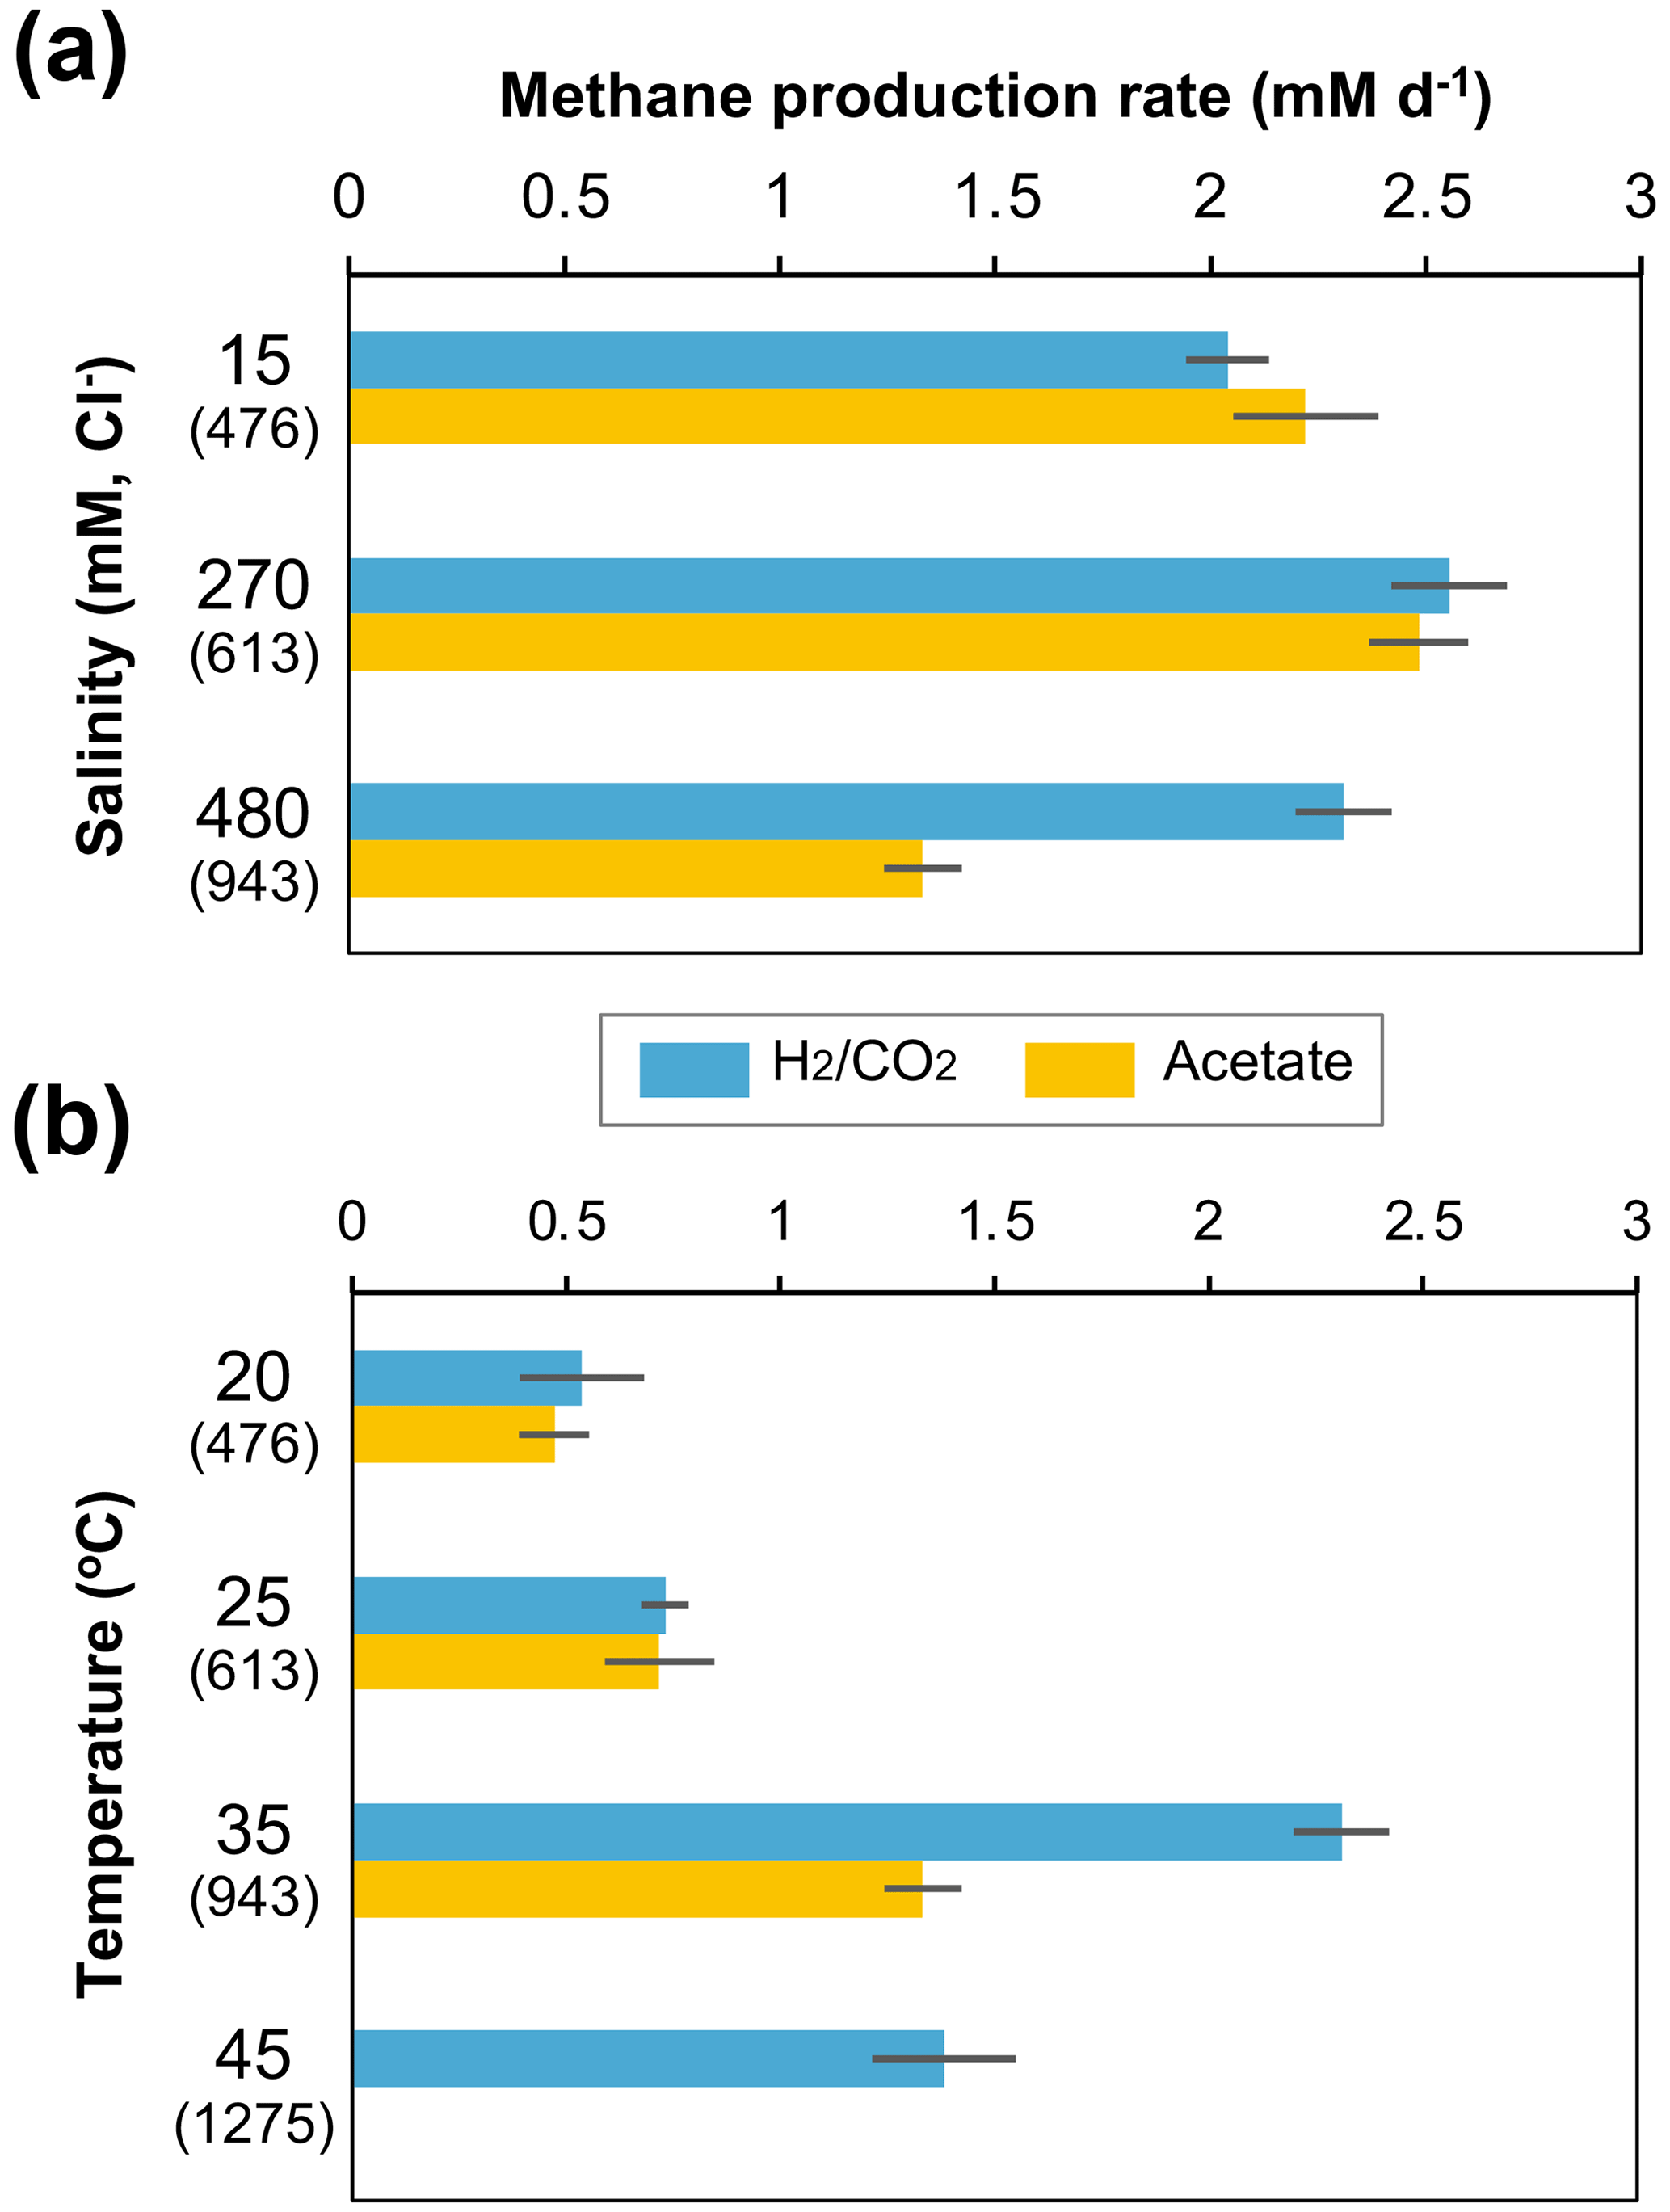
Figure 4Effects of depth-related salinity (a) and temperature (b) changes on methane production rates in - and acetate-amended microcosms in the 943 m b.g.s. water sample. The cultivation temperature for (a) was 35 ∘C, and the Cl− concentration in the culture medium for (b) was 480 mM. The values in parentheses are the depths (m b.g.s.) of the saline aquifers corresponding to each culture condition.
3.7 The potential for syntrophic acetate oxidation (SAO) coupled with hydrogenotrophic methanogenesis
The SAO activity coupled with hydrogenotrophic methanogenesis (Zinder and Koch, 1984) in the 943 m b.g.s. water sample was assessed by semicontinuous cultivation of SAO microorganisms fed a low concentration of acetate (Shigematsu et al., 2004) (Fig. S2a). After 10 months of cultivation, SAO activity was measured by using [2-13C]-acetate.
Methane was produced stoichiometrically from acetate in cultures supplemented with labeled and nonlabeled acetate (Fig. S2b). The values of δ13C-DIC increased from approximately −25 ‰ to 9 ‰ over time in the culture supplemented with [2-13C]-acetate, whereas no significant change was observed in the culture with nonlabeled acetate (Fig. S2c), clearly indicating SAO activity: in the acetoclastic methanogenic pathway, the methyl group of acetate is converted to methane but not to CO2 (Ferry, 1993), whereas the methyl group of acetate is converted to CO2 and subsequently to methane when SAO is coupled with hydrogenotrophic methanogenesis (Zinder and Koch, 1984).
This study examined microbial methane formation in relation to geochemical changes in deep sedimentary environments. Gas isotope analysis results suggested that methanogenesis occurred mostly via a CO2 reduction pathway in the Yuchi Formation. This finding is consistent with sequencing analysis results showing the predominance of hydrogenotrophic methanogens. In this formation, the isotopic ratio of hydrogen in water changed with depth and was coupled with a decrease in salinity due to diffusive mixing of brine with fresh water from the overlying formation (Ikawa et al., 2014). If substantial methanogenesis had occurred via the CO2 reduction pathway after this dilution, the δD-CH4 value would have changed along with the δD-H2O value and become distinct from the value of the deepest 943 m b.g.s. sample: that is, the least diluted brine. This change would have occurred because all hydrogen atoms in methane produced via the CO2 reduction pathway are derived from ambient water (Daniels et al., 1980). However, the results showed almost no change in δD-CH4 compared with δD-H2O, suggesting that in situ methanogenesis in the shallow part of this formation does not contribute significantly to methane deposits overall and that methane produced in the deeper layers of the Yuchi Formation migrated upward in association with the diffusive mixing of brine with fresh water (Fig. 2c).
This interpretation is supported by the experimental results. A distinctly high methanogen population, composed primarily of hydrogenotrophic methanogens, was observed in the deepest brine sample. In addition, hydrogenotrophic methanogenesis was estimated to proceed faster in deeper aquifers in the Yuchi Formation, where salinity and temperature are higher. The TOC content of the sediment core samples from this formation increased with depth, and the sediments adjacent to the deepest aquifer contained 2 to 3 times as much TOC as those adjacent to other shallower aquifers (Fig. S4). Similar to our results, the population of microorganisms, including methanogens represented by their lipid biomarkers, locally increases with increasing TOC content in deep marine sediments (Cragg et al., 1996; Oba et al., 2015). Previous studies have indicated that low-permeability sediments are rich in organic materials and that their fermentation products, such as acetate, diffuse into adjacent, more permeable aquifers, where they are consumed by microorganisms (McMahon and Chapelle, 1991; Krumholz et al., 1997). Previous laboratory heating experiments simulating the burial of marine sediments have shown an increase in acetate, which may sustain the deep subseafloor biosphere (Wellsbury et al., 1997). Indeed, the pore water acetate concentration in deep subseafloor sediments increases with depth, which stimulates potential methanogenic activities (Heuer et al., 2020; Beulig et al., 2022). Collectively, these data suggest that with increasing depth, an increased organic carbon content provides microorganisms with more energy and carbon sources and that the increased temperature accelerates the biodegradation of sedimentary organic matter and methanogenesis; as a result, the deepest aquifers in the Yuchi Formation function as sources of microbial methane. Acetate is considered a key intermediate product, but as described above, acetoclastic methanogens constitute a minor proportion of the methanogens in the Yuchi Formation, and in our experiments under high-salinity conditions, corresponding to that of the deepest sample, methanogenic activity from acetate decreased. We further demonstrate the SAO activity coupled with hydrogenotrophic methanogenesis to convert acetate to methane in the sample from the deep part of this formation. A previous study suggested the potential for SAO with methanogenesis in deep subseafloor sediments at high temperatures (Beulig et al., 2022). Investigating the diversity of microorganisms involved in SAO in deep subsurface environments is among the targets for future studies.
Our findings offer insight into microbial processes in the global carbon cycle over geological timescales and provide important reference data for geomicrobiological studies of deep subsurface environments that are enriched in microbial methane.
DNA sequencing data are available at GenBank, as described in the “Materials and methods” section. Other datasets generated during the current study are available from the corresponding author upon reasonable request.
The supplement related to this article is available online at: https://doi.org/10.5194/bg-20-5199-2023-supplement.
All authors contributed to the study conception and design. TK, RI, and MK collected the samples. RI and MK analyzed the water and sediment geochemistry. SS analyzed the gas geochemistry. TK performed the cultivation experiments and the DNA sequencing analysis. All the authors have read and approved the final paper.
The contact author has declared that none of the authors has any competing interests.
Publisher's note: Copernicus Publications remains neutral with regard to jurisdictional claims made in the text, published maps, institutional affiliations, or any other geographical representation in this paper. While Copernicus Publications makes every effort to include appropriate place names, the final responsibility lies with the authors.
This study was carried out as a part of the R&D supporting program titled “Development of enhancing the evaluation technology for fresh–salt water interface in the coastal region” (2012 FY) under contract with the Ministry of Economy, Trade and Industry (METI). We thank Hanako Mochimaru, Chiwaka Miyako, and Fumie Nozawa for assistance in the sample collection, sequencing analysis, and cultivation experiments. Thanks are further extended to Atsunao Marui for managing the borehole drilling project and to Yoichi Kamagata for valuable comments that improved our paper.
This research has been supported by the Japan Society for the Promotion of Science (KAKENHI (grant nos. JP17K15183 and JP18H05295)).
This paper was edited by Helge Niemann and reviewed by Simon Guerrero Cruz and one anonymous referee.
Beulig, F., Schubert, F., Adhikari, R. R., Glombitza, C., Heuer, V. B., Hinrichs, K. U., Homola, K. L., Inagaki, F., Jørgensen, B. B., Kallmeyer, J., Krause, S. J. E., Morono, Y., Sauvage, J., Spivack, A. J., and Treude, T.: Rapid metabolism fosters microbial survival in the deep, hot subseafloor biosphere, Nat. Commun., 13, 312, https://doi.org/10.1038/s41467-021-27802-7, 2022.
Cragg, B. A., Parkes, R. J., Fry, J. C., Weightman, A. J., Rochelle, P. A., and Maxwell, J. R.: Bacterial populations and processes in sediments containing gas hydrates (ODP Leg 146: Cascadia Margin), Earth Planet. Sc. Lett., 139, 497–507, https://doi.org/10.1016/0012-821x(95)00246-9, 1996.
Daniels, L., Fulton, G., Spencer, R. W., and Ormejohnson, W. H.: Origin of hydrogen in methane produced by Methanobacterium thermoautotrophicum, J. Bacteriol., 141, 694–698, https://doi.org/10.1128/jb.141.2.694-698.1980, 1980.
Ferry, J. G.: Fermentation of acetate, in: Methanogenesis, edited by: Ferry, J. G., Chapman & Hall Microbiology Series, Springer, USA, 304–334, https://doi.org/10.1007/978-1-4615-2391-8_7, 1993.
Fredrickson, J. K., McKinley, J. P., Bjornstad, B. N., Long, P. E., Ringelberg, D. B., White, D. C., Krumholz, L. R., Suflita, J. M., Colwell, F. S., Lehman, R. M., Phelps, T. J., and Onstott, T. C.: Pore-size constraints on the activity and survival of subsurface bacteria in a late Cretaceous shale-sandstone sequence, northwestern New Mexico, Geomicrobiol. J., 14, 183–202, https://doi.org/10.1080/01490459709378043, 1997.
Haroon, M. F., Hu, S., Shi, Y., Imelfort, M., Keller, J., Hugenholtz, P., Yuan, Z., and Tyson, G. W.: Anaerobic oxidation of methane coupled to nitrate reduction in a novel archaeal lineage, Nature, 500, 567–570, https://doi.org/10.1038/nature12375, 2013.
Heuer, V. B., Inagaki, F., Morono, Y., Kubo, Y., Spivack, A. J., Viehweger, B., Treude, T., Beulig, F., Schubotz, F., Tonai, S., Bowden, S. A., Cramm, M., Henkel, S., Hirose, T., Homola, K., Hoshino, T., Ijiri, A., Imachi, H., Kamiya, N., Kaneko, M., Lagostina, L., Manners, H., McClelland, H.-L., Metcalfe, K., Okutsu, N., Pan, D., Raudsepp, M. J., Sauvage, J., Tsang, M.-Y., Wang, D. T., Whitaker, E., Yamamoto, Y., Yang, K., Maeda, L., Adhikari, R. R., Glombitza, C., Hamada, Y., Kallmeyer, J., Wendt, J., Wörmer, L., Yamada, Y., Kinoshita, M., and Hinrichs, K.-U.: Temperature limits to deep subseafloor life in the Nankai Trough subduction zone, Science, 370, 1230–1234, https://doi.org/10.1126/science.abd7934, 2020.
Ikawa, R., Machida, I., Koshigai, M., Nishizaki, S., and Marui, A.: Coastal aquifer system in late Pleistocene to Holocene deposits at Horonobe in Hokkaido, Japan, Hydrogeol. J., 22, 987–1002, https://doi.org/10.1007/s10040-014-1106-4, 2014.
Katayama, T. and Kamagata, Y.: Cultivation of methanogens, in: Isolation and Cultivation (Hydrocarbon and Lipid Microbiology Protocols), edited by: McGenity, T. J., Timmis, K. N., and Nogales, B., Springer, Berlin, Heidelberg, 177–195, https://doi.org/10.1007/978-3-662-45179-3, 2018.
Katayama, T., Yoshioka, H., Muramoto, Y., Usami, J., Fujiwara, K., Yoshida, S., Kamagata, Y., and Sakata, S.: Physicochemical impacts associated with natural gas development on methanogenesis in deep sand aquifers, ISME J., 9, 436–446, https://doi.org/10.1038/ismej.2014.140, 2015.
Katayama, T., Nobu, M. K., Kusada, H., Meng, X. Y., Hosogi, N., Uematsu, K., Yoshioka, H., Kamagata, Y., and Tamaki, H.: Isolation of a member of the candidate phylum “Atribacteria” reveals a unique cell membrane structure, Nat. Commun., 11, 6381, https://doi.org/10.1038/s41467-020-20149-5, 2020.
Katayama, T., Yoshioka, H., Kaneko, M., Amo, M., Fujii, T., Takahashi, H. A., Yoshida, S., and Sakata, S.: Cultivation and biogeochemical analyses reveal insights into methanogenesis in deep subseafloor sediment at a biogenic gas hydrate site, ISME J., 16, 1464–1472, https://doi.org/10.1038/s41396-021-01175-7, 2022.
Katoh, K. and Standley, D. M.: MAFFT multiple sequence alignment software version 7: improvements in performance and usability, Mol. Biol. Evol., 30, 772–780, https://doi.org/10.1093/molbev/mst010, 2013.
Kotelnikova, S.: Microbial production and oxidation of methane in deep subsurface, Earth-Sci. Rev., 58, 367–395, https://doi.org/10.1016/S0012-8252(01)00082-4, 2002.
Krumholz, L. R., McKinley, J. P., Ulrich, F. A., and Suflita, J. M.: Confined subsurface microbial communities in Cretaceous rock, Nature, 386, 64–66, https://doi.org/10.1038/386064a0, 1997.
Liu, L.-Y., Xie, G.-J., Ding, J., Liu, B.-F., Xing, D.-F., Ren, N.-Q., and Wang, Q.: Microbial methane emissions from the non-methanogenesis processes: A critical review, Sci. Total Environ., 806, 151362, https://doi.org/10.1016/j.scitotenv.2021.151362, 2022.
Lovley, D. R. and Chapelle, F. H.: Deep subsurface microbial processes, Rev. Geophys., 33, 365–381, https://doi.org/10.1029/95rg01305, 1995.
Luton, P. E., Wayne, J. M., Sharp, R. J., and Riley, P. W.: The mcrA gene as an alternative to 16S rRNA in the phylogenetic analysis of methanogen populations in landfill, Microbiology, 148, 3521–3530, https://doi.org/10.1099/00221287-148-11-3521, 2002.
Mayumi, D., Mochimaru, H., Tamaki, H., Yamamoto, K., Yoshioka, H., Suzuki, Y., Kamagata, Y., and Sakata, S.: Methane production from coal by a single methanogen, Science, 354, 222–225, https://doi.org/10.1126/science.aaf8821, 2016.
McMahon, P. B. and Chapelle, F. H.: Microbial production of organic acids in aquitard sediments and its role in aquifer geochemistry, Nature, 349, 233–235, https://doi.org/10.1038/349233a0, 1991.
McMahon, S. and Parnell, J.: Weighing the deep continental biosphere, FEMS Microbiol. Ecol., 87, 113–120, https://doi.org/10.1111/1574-6941.12196, 2014.
Mei, R., Kaneko, M., Imachi, H., and Nobu, M. K.: The origin and evolution of methanogenesis and Archaea are intertwined, PNAS Nexus, 2, pgad023, https://doi.org/10.1093/pnasnexus/pgad023, 2023.
Mesle, M., Dromart, G., and Oger, P.: Microbial methanogenesis in subsurface oil and coal, Res. Microbiol., 164, 959–872, https://doi.org/10.1016/j.resmic.2013.07.004, 2013.
Oba, M., Sakata, S., and Fujii, T.: Archaeal polar lipids in subseafloor sediments from the Nankai Trough: Implications for the distribution of methanogens in the deep marine subsurface, Org. Geochem., 78, 153–160, https://doi.org/10.1016/j.orggeochem.2014.11.006, 2015.
Pedersen, K.: The deep subterranean giosphere, Earth-Sci. Rev., 34, 243–260, https://doi.org/10.1016/0012-8252(93)90058-F, 1993.
Pruesse, E., Quast, C., Knittel, K., Fuchs, B. M., Ludwig, W., Peplies, J., and Glockner, F. O.: SILVA: a comprehensive online resource for quality checked and aligned ribosomal RNA sequence data compatible with ARB, Nucleic Acids Res., 35, 7188–7196, https://doi.org/10.1093/nar/gkm864, 2007.
Schloss, P. D., Westcott, S. L., Ryabin, T., Hall, J. R., Hartmann, M., Hollister, E. B., Lesniewski, R. A., Oakley, B. B., Parks, D. H., Robinson, C. J., Sahl, J. W., Stres, B., Thallinger, G. G., Van Horn, D. J., and Weber, C. F.: Introducing mothur: open-source, platform-independent, community-supported software for describing and comparing microbial communities, Appl. Environ. Microb., 75, 7537–7541, https://doi.org/10.1128/AEM.01541-09, 2009.
Shigematsu, T., Tang, Y. Q., Kobayashi, T., Kawaguchi, H., Morimura, S., and Kida, K.: Effect of dilution rate on metabolic pathway shift between aceticlastic and nonaceticlastic methanogenesis in chemostat cultivation, Appl. Environ. Microbiol., 70, 4048–4052, https://doi.org/10.1128/Aem.70.7.4048-4052.2004, 2004.
Tamamura, S., Akatsuka, M., Ikawa, R., Koshigai, M., Shiimizu, S., Ueno, A., Ohmi, Y., Kaneko, K., Igarashi, T., and Marui, A.: Origin of methane dissolved in formation waters in the Koetoi Formation through the alluvium in northwestern part of Hokkaido, Japan, Geochemistry, 48, 39–50, https://doi.org/10.14934/chikyukagaku.48.39, 2014.
Tani, H., Miyata, R., Ichikawa, K., Morishita, S., Kurata, S., Nakamura, K., Tsuneda, S., Sekiguchi, Y., and Noda, N.: Universal quenching probe system: flexible, specific, and cost-effective real-time polymerase chain reaction method, Anal. Chem., 81, 5678–5685, https://doi.org/10.1021/Ac900414u, 2009.
Wellsbury, P., Goodman, K., Barth, T., Cragg, B. A., Barnes, S. P., and Parkes, R. J.: Deep marine biosphere fuelled by increasing organic matter availability during burial and heating, Nature, 388, 573–576, https://doi.org/10.1038/41544, 1997.
Whiticar, M. J.: Carbon and hydrogen isotope systematics of bacterial formation and oxidation of methane, Chem. Geol., 161, 291–314, https://doi.org/10.1016/S0009-2541(99)00092-3, 1999.
Zhang, S., Shuai, Y., Huang, L., Wang, L., Su, J., Huanh, H., Ma, D., and Li, M.: Timing of biogenic gas formation in the Qaidam Basin, NW China, Chem. Geol., 352, 70–80, 2013.
Zhou, Z., Zhang, C. J., Liu, P. F., Fu, L., Laso-Pérez, R., Yang, L., Bai, L. P., Li, J., Yang, M., Lin, J. Z., Wang, W. D., Wegener, G., Li, M., and Cheng, L.: Non-syntrophic methanogenic hydrocarbon degradation by an archaeal species, Nature, 601, 257–262, https://doi.org/10.1038/s41586-021-04235-2, 2022.
Zinder, S. and Koch, M.: Non-aceticlastic methanogenesis from acetate: acetate oxidation by a thermophilic syntrophic coculture, Arch. Microbiol., 138, 263–272, https://doi.org/10.1007/BF00402133, 1984.