the Creative Commons Attribution 4.0 License.
the Creative Commons Attribution 4.0 License.
 | 22 Dec 2023
The influence of carbon cycling on oxygen depletion in north-temperate lakes
Austin Delany
Robert Ladwig
Cal Buelo
Ellen Albright
Paul C. Hanson
Hypolimnetic oxygen depletion during summer stratification in lakes can lead to hypoxic and anoxic conditions. Hypolimnetic anoxia is a water quality issue with many consequences, including reduced habitat for cold-water fish species, reduced quality of drinking water, and increased nutrient and organic carbon (OC) release from sediments. Both allochthonous and autochthonous OC loads contribute to oxygen depletion by providing substrate for microbial respiration; however, their relative contributions to oxygen depletion across diverse lake systems remain uncertain. Lake characteristics, such as trophic state, hydrology, and morphometry, are also influential in carbon-cycling processes and may impact oxygen depletion dynamics. To investigate the effects of carbon cycling on hypolimnetic oxygen depletion, we used a two-layer process-based lake model to simulate daily metabolism dynamics for six Wisconsin lakes over 20 years (1995–2014). Physical processes and internal metabolic processes were included in the model and were used to predict dissolved oxygen (DO), particulate OC (POC), and dissolved OC (DOC). In our study of oligotrophic, mesotrophic, and eutrophic lakes, we found autochthony to be far more important than allochthony to hypolimnetic oxygen depletion. Autochthonous POC respiration in the water column contributed the most towards hypolimnetic oxygen depletion in the eutrophic study lakes. POC water column respiration and sediment respiration had similar contributions in the mesotrophic and oligotrophic study lakes. Differences in terms of source of respiration are discussed with consideration of lake productivity and the processing and fates of organic carbon loads.
- Article
(2564 KB) - Full-text XML
-
Supplement
(2953 KB) - BibTeX
- EndNote


Hypolimnetic oxygen depletion is a persistent and global phenomenon that degrades lake ecosystem services (Nürnberg, 1995; Cole and Weihe, 2016; Jenny et al., 2016a, b). In lakes where oxygen depletion results in hypoxia and even anoxia, habitat availability for cold-water fish species is eliminated (Magee et al., 2019), the quality of drinking water is reduced (Bryant et al., 2011), and nutrient and OC release from lake sediments becomes elevated (Hoffman et al., 2013; McClure et al., 2020). An increase in the prevalence of hypolimnetic anoxia and associated water quality degradation in temperate lakes indicate the need to better understand how lake ecological processes interact with external forcings, such as hydrology and nutrient inputs, to control the development of anoxia (Jenny et al., 2016a, b).
Allochthonous organic carbon (OC) loading to lakes, which explains the prevalence of negative net ecosystem production (i.e., net heterotrophy), provides substrate for hypolimnetic oxygen depletion (Houser et al., 2003). Allochthonous OC sources have also been shown to influence dissolved oxygen (DO) and carbon dynamics in lakes by providing recalcitrant substrate for respiration (Cole et al., 2002; Hanson et al., 2014; Solomon et al., 2015). In lake surveys, dissolved allochthonous OC correlates positively with net heterotrophy (Jansson et al., 2000), indicating the importance of allochthony to both the carbon balance and the dynamics of dissolved gases (Prairie et al., 2002; Hanson et al., 2003). However, the persistent and often stable concentration of allochthonous DOC in the water column of lakes also indicates its recalcitrant nature, raising the question of whether allochthony alone can support high oxygen demand in the sediments and deeper waters of lakes.
The contributions of OC from autochthony to hypolimnetic oxygen depletion may be important as well, despite its low concentration relative to that of allochthonous OC in many lakes (Cole et al., 2002). Autochthonous OC tends to be highly labile (Amon and Brenner, 1996; Thorpe and Delong, 2002), and spot samples from lake surveys may not detect autochthonous DOC, reducing its power as a correlate of ecosystem functioning. A positive correlation between anoxia and lake phosphorus concentrations suggests that autochthony may contribute substantially to hypolimnetic oxygen demand (Rhodes et al., 2017; Rippey and McSorley, 2009; Jenny et al., 2016a, b); however, the link between nutrient concentrations, autochthony, and hypolimnetic respiration is rarely quantified. Lakes with high autochthony can still be net heterotrophic (Staehr et al., 2010; Cole et al., 2000); however, it matters where in the lake autochthony is respired. Export of phytoplankton from the epilimnion to the hypolimnion and sediments contributes to deep-water oxygen demand (Müller et al., 2012; Rhodes et al., 2017; Beutel, 2003), and the magnitude and timing of organic carbon inputs to deeper waters in lakes and the subsequent fate of that carbon deserve further exploration.
Understanding the relative contributions of autochthony and allochthony to hypolimnetic oxygen depletion requires consideration of a number of physical and biological processes controlling oxygen sources and sinks in lakes (Hanson et al., 2015). For dimictic north-temperate lakes, the timing and dynamics of seasonal stratification determine the ambient temperature and light conditions for metabolism and the extent to which the hypolimnion is isolated from oxygen-rich surface waters (Snortheim et al., 2017; Ladwig et al., 2021). In many lakes, the hypolimnion is below the euphotic zone, but in very clear lakes, primary production within the hypolimnion may be an oxygen source (Houser et al., 2003). Lake morphometry influences the spatial extents of stratified layers, which determines the ratio of hypolimnetic volume to sediment surface area and the magnitude of the sediment oxygen sink for the hypolimnetic oxygen budget (Livingstone and Imboden, 1996). Thus, the sources and labilities of OC, lake morphometry, and lake hydrodynamics all contribute to hypolimnetic oxygen budgets, making it an emergent ecosystem property with a plethora of causal relationships to other ecologically important variables.
The availability of long-term observational data combined with process-based models provides an opportunity to investigate OC sources and their control over the dynamics of lake DO across multiple timescales. Long-term studies of lakes on regional and global scales highlight how environmental trends can influence metabolic processes in lakes and how lakes can broaden our understanding of large-scale ecosystem processes (Richardson et al., 2017; Kraemer et al., 2017; Williamson et al., 2008). For example, long-term studies allow us to investigate the impact that current and legacy conditions have on lake ecosystem functioning in a given year (Carpenter et al., 2007). Process-based modeling has been used to investigate metabolism dynamics and to understand both lake carbon cycling (Hanson et al., 2004; Cardille et al., 2007) and the formation of anoxia (Ladwig et al., 2021); however, explicitly tying lake carbon cycling and metabolism dynamics with long-term hypolimnetic DO depletion across a variety of lakes remains largely unexplored. The combination of process-based modeling with available long-term observational data, including exogenous driving data representative of climate variability, can be especially powerful for recreating representations of long-term lake metabolism dynamics (Staehr et al., 2010; Cardille et al., 2007).
In this study, our goal is to investigate OC source contributions to lake carbon cycling and hypolimnetic oxygen depletion. The importance of excess primary production to anoxia has been established (Nürnberg et al., 1995; Müller et al., 2012). We build upon this research by quantifying the timing and magnitude of OC contributions to hypolimnetic anoxia. We are particularly interested in the relative loads of autochthonous and allochthonous OC to lakes and how they contribute to hypolimnetic DO depletion across seasonal to decadal scales. We use a process-based lake metabolism model, combined with daily external driving data and long-term limnological data, to study six lakes within the North Temperate Lakes Long-Term Ecological Research network (NTL-LTER) over a 20-year period (1995–2014). We address the following questions: (1) what are the dominant sources of organic carbon that contribute to hypolimnetic oxygen depletion, and how do their contributions differ across a group of diverse lakes over two decades? (2) How does lake trophic state influence the processing and fates of organic carbon loads in ways that affect hypolimnetic dissolved oxygen?
2.1 Study site
This study includes six Wisconsin lakes from the NTL-LTER program (Magnuson et al., 2006). Trout Lake (TR), Big Muskellunge Lake (BM), Sparkling Lake (SP), and Allequash Lake (AL) are in the Northern Highlands Lake District of Wisconsin and have been regularly sampled since 1981 (Magnuson et al., 2006). Lake Mendota (ME) and Lake Monona (MO) are in southern Wisconsin and have been regularly sampled by the NTL-LTER since 1995 (NTL-LTER, Magnuson et al., 2006). The NTL-LTER provides a detailed description of each lake (Magnuson et al., 2006). The six lakes span gradients in size, morphometry, landscape setting, and hydrology, which creates diverse carbon-cycling characteristics and processes across these systems. TR and AL are drainage lakes with high allochthonous carbon inputs from surface water, while BM and SP are groundwater seepage systems with allochthony dominated by aerial OC inputs from the surrounding landscape (Hanson et al., 2014). All four northern lakes (TR, AL, BM, SP) are surrounded by a forested landscape. ME and MO are both eutrophic drainage lakes surrounded by an urban and agricultural landscape. Although the full range of DOC concentrations for lakes in northern Wisconsin varies from about 2 to >30 mg L−1 (Hanson et al., 2007), DOC concentrations among our study lakes covered a relatively narrow range typical of non-dystrophic lakes in Wisconsin (Hanson et al., 2007) and are near the global averages previously estimated, i.e., 3.88 mg L−1 (Toming et al., 2020) and 5.71 mg L−1 (Sobek et al., 2007). Morphometry, hydrology, and other information can be found in Table 1.
Table 1Physical and biogeochemical characteristics of the study lakes. The table includes lake area (area), maximum depth (Zmax), hydrologic residence time (RT), mean annual temperature (temp), mean annual surface total phosphorus concentration (mean TP), and mean annual surface DOC (mean DOC).
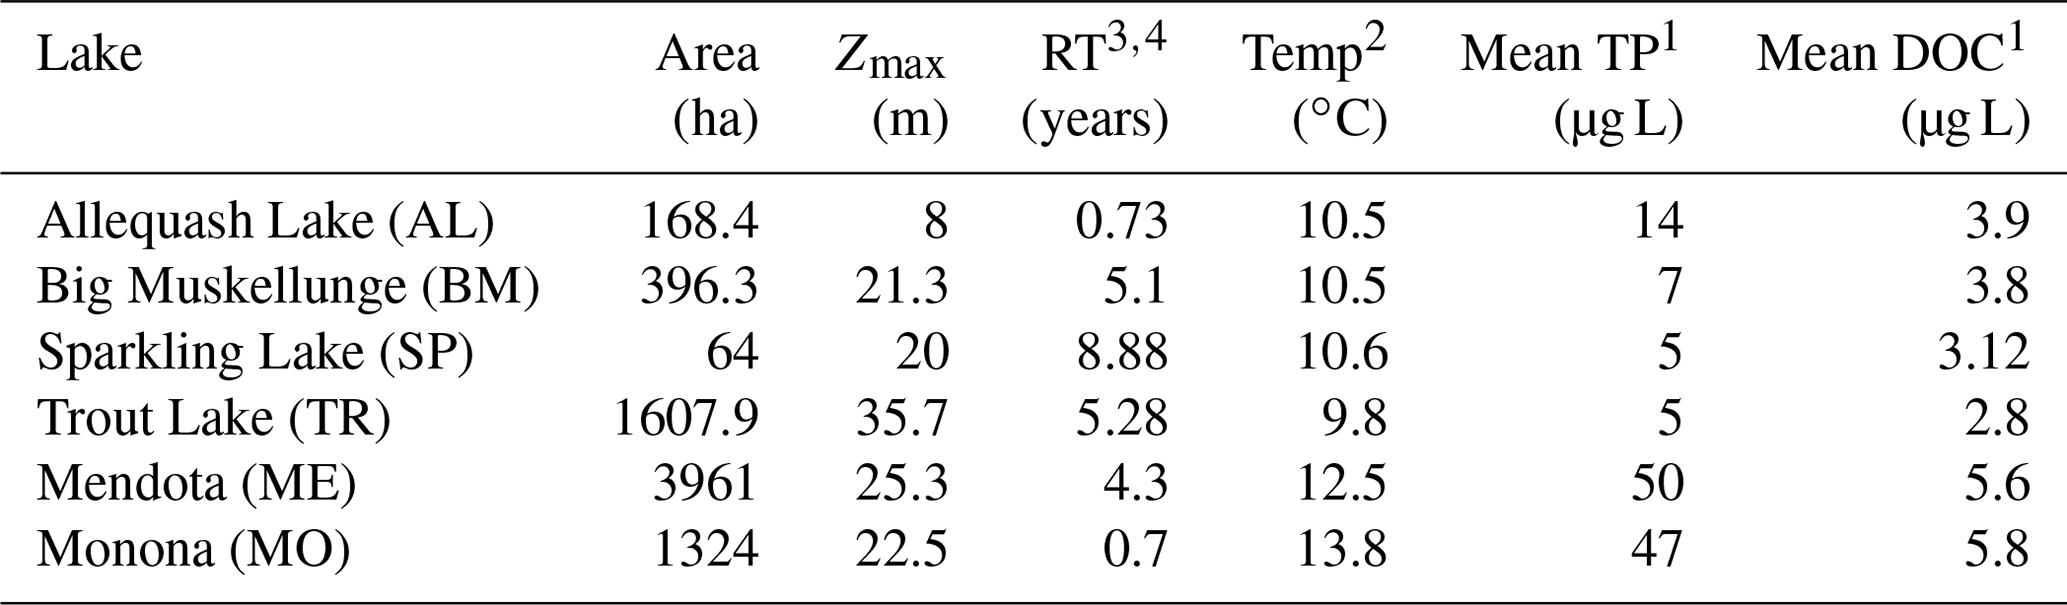
1 Magnuson et al. (2020, 2006). 2 Magnuson et al. (2022). 3 Hunt et al. (2013). 4 Webster et al. (1996).
2.2 Driving data and limnological data
Most driving data for the model are provided by the “Process-based predictions of water temperature in the Midwest US” USGS data product (Read et al., 2021). This includes lake characteristic information such as lake area and hypsometry, daily modeled temperature profiles, ice flags, meteorology data, and solar radiation for the six study lakes. Derived hydrology data are used in calculating daily OC loading and outflow for the study lakes. Hydrology for the northern lakes is taken from Hunt and Walker (2017), which was estimated using a surface and groundwater hydrodynamic model. Hydrology for ME is taken from Hanson et al. (2020), which used the Penn State Integrated Hydrologic Model (Qu and Duffy, 2007). We assume for ME and MO that evaporation from the lake surface is approximately equal to precipitation on the lake surface and that groundwater inputs and outputs to the lake are a small part of the hydrologic budgets (Lathrop and Carpenter, 2014). Therefore, ME outflow is assumed to be equal to ME inflow. ME is the predominant hydrologic source for MO (Lathrop and Carpenter, 2014); thus, MO inflow is assumed to be equal to ME outflow, and MO outflow is assumed to be equal to MO inflow. We found that the derived discharge data for ME, TR, AL, and SP were approximately 20 %–50 % higher than previously reported values (Hunt et al., 2013; Webster et al., 1996), depending on the lake, while hydrology in BM was approximately 25 % too low (Hunt et al., 2013). To accommodate this issue, we adjusted the total annual hydrological inputs to match published water residence times for each lake (Table 1) while retaining temporal hydrological patterns. NTL-LTER observational data are interpolated to estimate daily nutrient concentration values, which are used in calculating daily primary production in the model (Magnuson et al., 2020).
The NTL-LTER observational data used to calibrate and validate the model for the six lakes include DO, DOC, and Secchi depth (Magnuson et al., 2020, 2022). Saturation values for DO and gas exchange velocity used in calculating atmospheric exchange for DO are calculated using the o2.at.sat.base and using the Cole and Caraco gas exchange method from the K600.2.KGAS.base function within the USGS LakeMetabolizer package in R (Winslow et al., 2016).
2.3 The model
The goal of our model is to use important physical and metabolic processes involved in the lake ecosystem carbon cycle to best predict DO, DOC, and POC while keeping the model design simple in comparison with more comprehensive water quality models (e.g., Hipsey et al., 2022). We ran our model with a daily time step over a 20-year period (1995–2014) for each lake and included seasonal physical dynamics, such as lake mixing, stratification, and ice cover from Read et al. (2021). Throughout each year, the model tracks state variables and fluxes in the lake for each day (Fig. 1). These state variables include DO and the labile and recalcitrant components of particulate organic carbon (POC) and dissolved organic carbon (DOC). Initial conditions for each state variable are based on literature values or lake observational data (Table S5 in the Supplement). The model is initialized on 1 January of the first year so we set the initial labile POC mass to zero under the assumption that the concentration is low in the middle of winter. The initial DO value is set to the saturation value based on the conditions of the initial model run day and is calculated using the LakeMetabolizer R package (Winslow et al., 2016). During stratified periods, the state variables and fluxes for the epilimnion and hypolimnion are tracked independently. Atmosphere, sediments, and hydrologic inputs and outputs are boundary conditions.
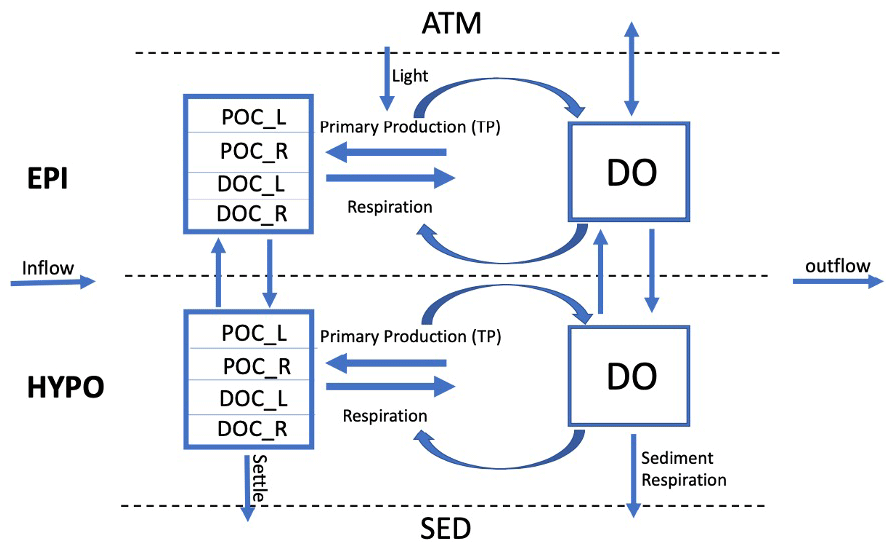
Figure 1Conceptual lake model showing state variables (boxes) and fluxes (arrows). The model has two thermal layers under stratified conditions, as shown here, and tracks state variables separately for each layer. The sediment (SED), atmosphere (ATM), inflow, and outflow are system boundaries. The state variables included are DO (dissolved oxygen), DOC_L (labile dissolved organic carbon), DOC_R (recalcitrant dissolved organic carbon), POC_L (labile particulate organic carbon), and POC_R (recalcitrant particulate organic carbon). Observed total phosphorus (TP) is used as a driving variable for primary production in the model.
The model is built specifically for this analysis; however, many of the assumptions around the model complexity and mathematical formulations are borrowed from literature cited (Ladwig et al., 2021; Hipsey et al., 2022; Hanson et al., 2014; McCullough et al., 2018). We chose to develop our own process-based model for water quality rather than use an existing model, such as GLM-AED2 (Hipsey et al., 2022; note that AED2 is the water quality component of the coupled hydrodynamic–water-quality model) or Simstrat (Goudsmit et al., 2002) so that we could simulate and measure the specific metabolism fluxes related to our study questions. We used a pre-existing dataset (Read et al., 2021) that provided GLM-modeled daily water temperature profiles for our study lakes; however, our study did not use any established water quality models to calculate the relative OC or DO pools.
2.3.1 Stratification dynamics
Lake physical dynamics are taken from the output of a previous hydrodynamic modeling study on these same lakes over a similar time period (Read et al., 2021), which used the General Lake Model (Hipsey et al., 2019). Before running the metabolism model, a thermocline depth for each time step is estimated using derived temperature profiles for each lake (Read et al., 2021) by determining the center of buoyancy depth (Read et al., 2011). After calculating the thermocline depth, the volumes and average temperatures for each layer and the specific area at thermocline depth are determined using lake-specific hypsography. The criteria for stratification include a vertical density gradient between the surface and bottom layer of at least 0.05 kg m−3, an average water column temperature above 4 ∘C, and the presence of a derived thermocline (Ladwig et al., 2021). For any day that does not meet all of these criteria, the water column is considered to be fully mixed. The thermocline depth values are smoothed using a moving average with a window size of 14 d to prevent large entrainment fluxes that can destabilize the model at very short timescales when thermal strata are shallow. During mixed periods, the entire lake is treated as the epilimnion, and a separate hypolimnion is not incorporated into the model dynamics. Ice cover in the model is determined using the ice flag provided in the derived temperature profile data from Read et al. (2021). Our metabolism model does simulate under-ice conditions; however, we do not include the presence of inverse stratification during winter periods.
2.3.2 External lake and environment physical fluxes
Atmospheric exchange of DO, external loading of OC, and outflow of OC are the three environmental boundary fluxes accounted for in the water quality model (Table 2, Eqs. 9–11). The gas exchange velocity for atmospheric exchange is determined using the Cole and Caraco model (1998) and is calculated using the LakeMetabolizer R package (Winslow et al., 2016). Oxygen saturation values are also calculated using this package. During ice-covered conditions, we assume that the atmospheric exchange value is 10 % of the value during non-ice-covered conditions based on sea ice gas exchange estimates (Loose and Schlosser, 2011).
For the northern lakes (TR, AL, BM, SP), we assume that allochthonous OC loads consist of entirely recalcitrant substrates. We verify total OC load, total inflow concentration, and recalcitrant OC export values with estimates from Hanson et al. (2014). For ME, we verify the total annual allochthonous OC load and OC inflow concentrations against observed inflow data from Hart et al. (2017) by back calculating inflow concentrations based on the modeled OC equilibrium of the lake. MO inflow concentrations are equivalent to the in-lake epilimnetic concentrations of OC from ME at each model time step. The total OC loads for MO are verified based on the total allochthonous load found in McCullough et al. (2018).
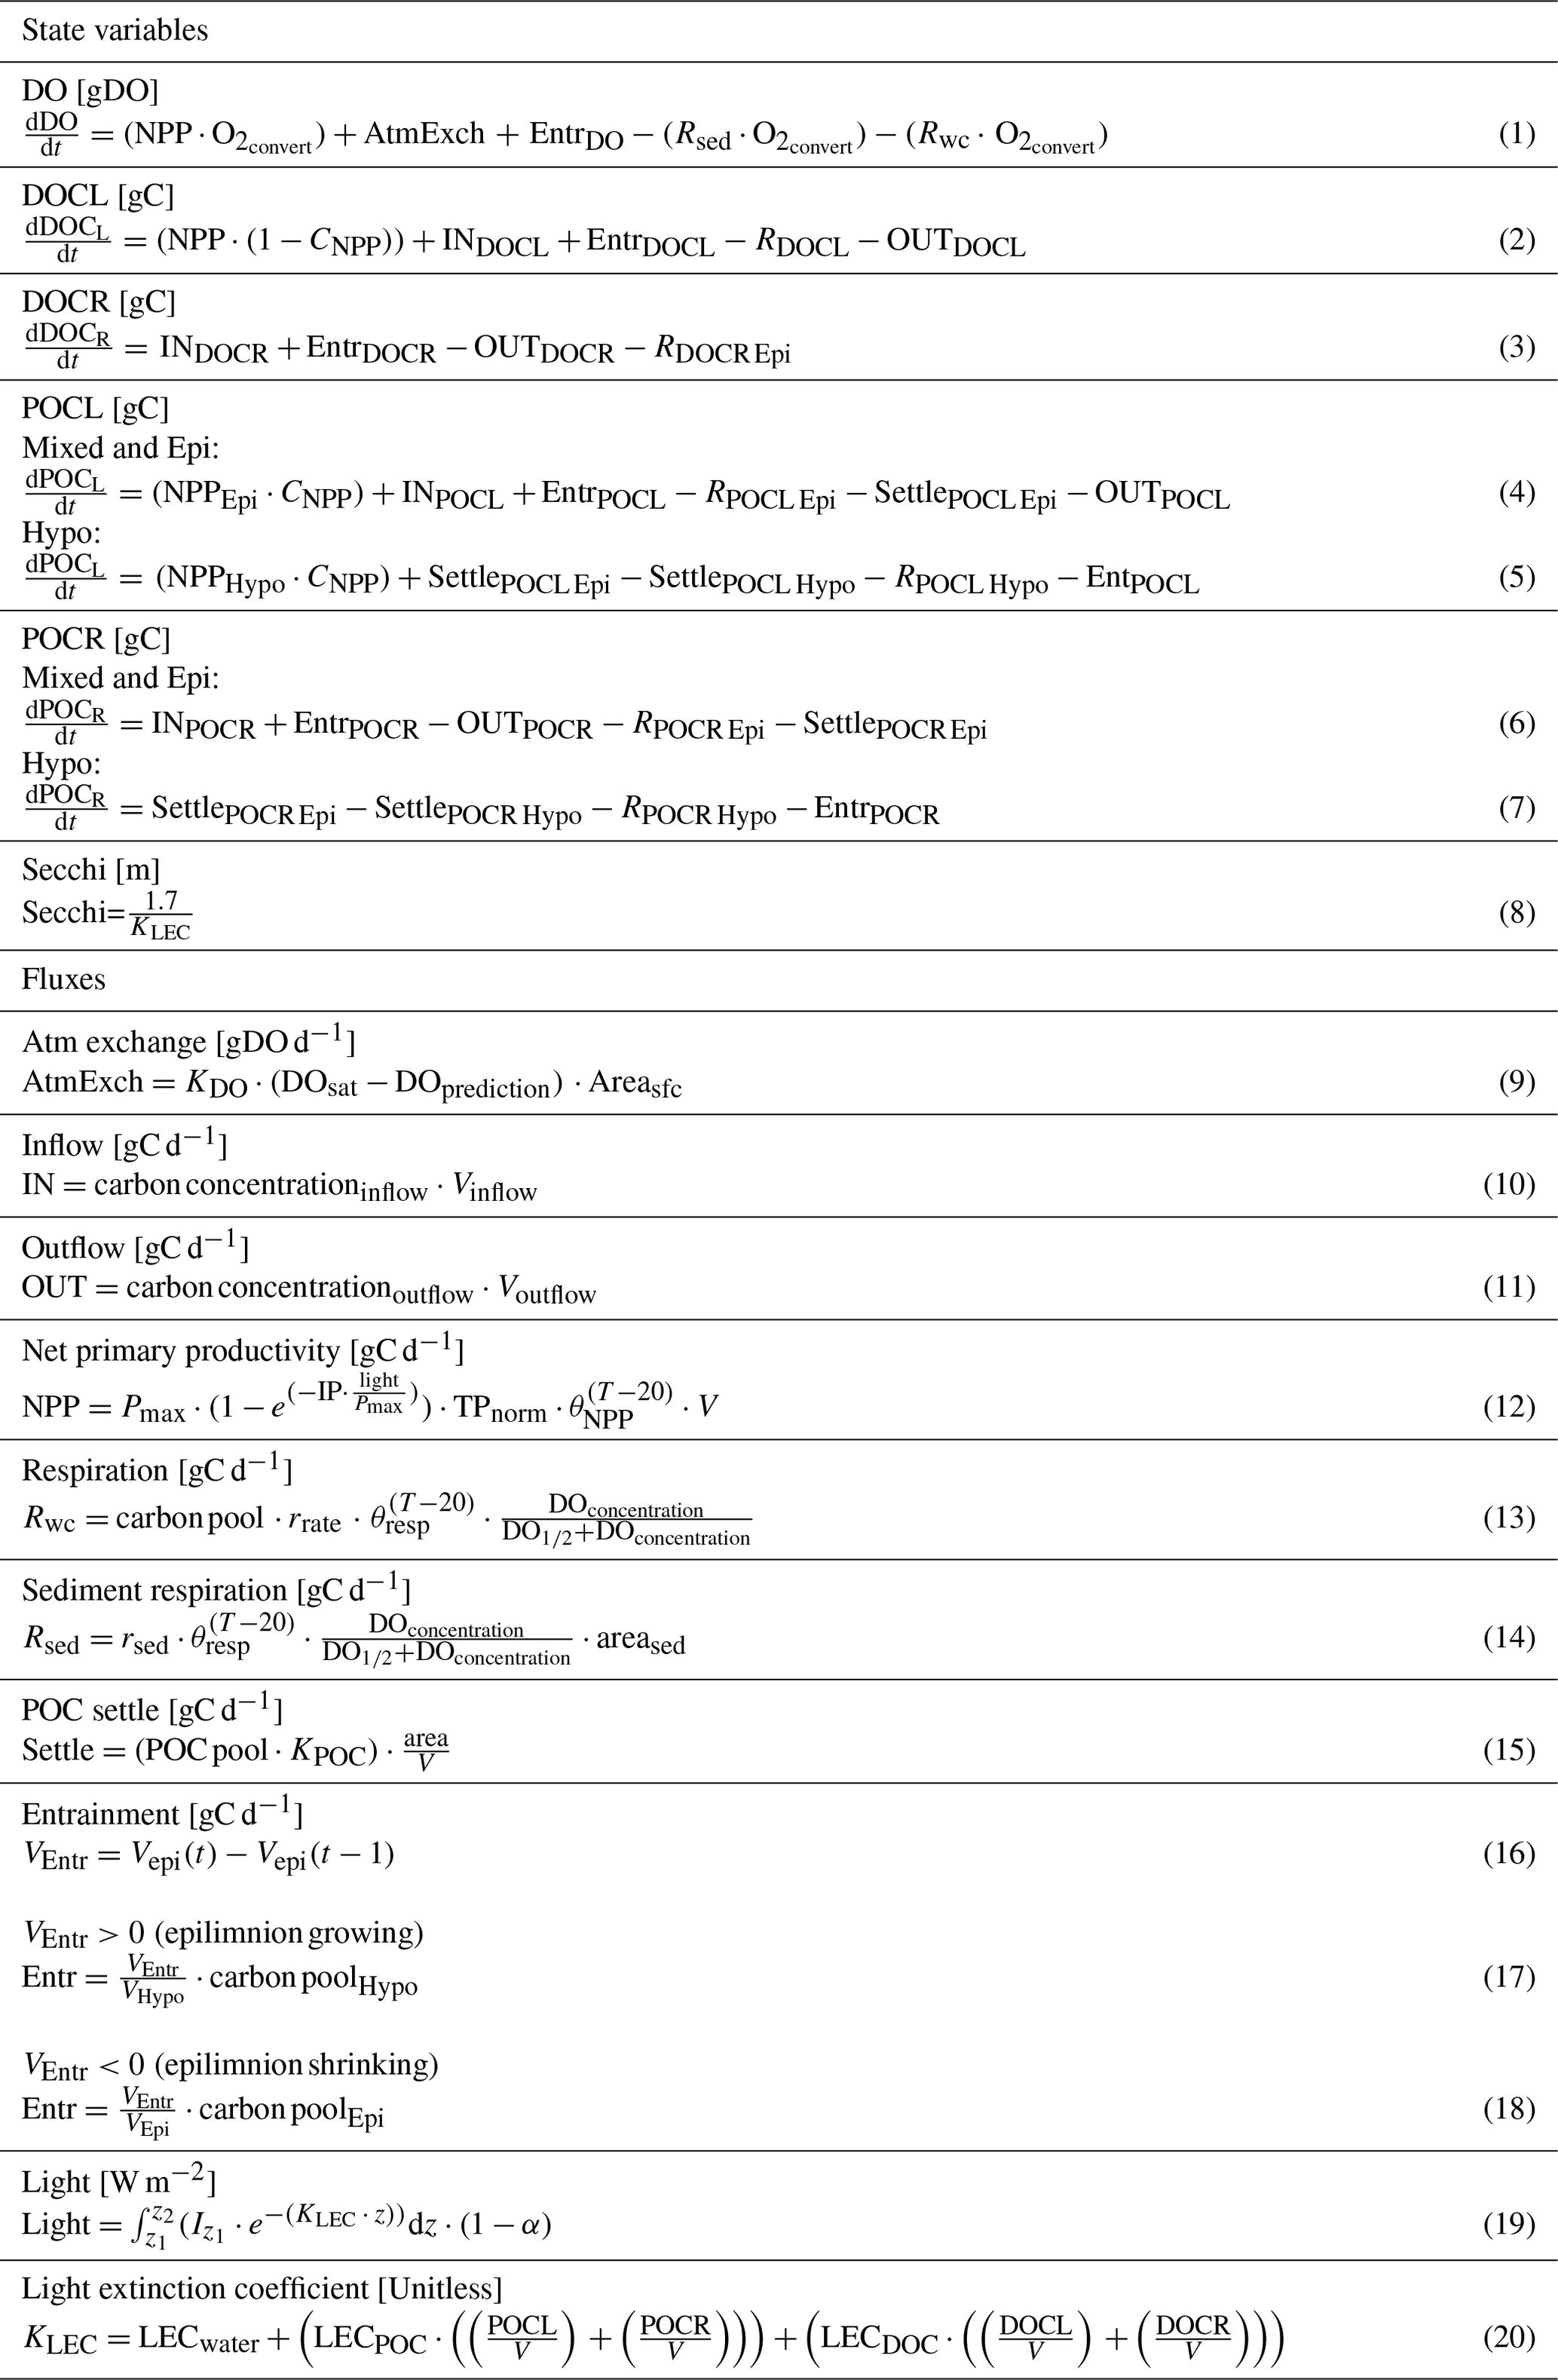
Table 2Equations for the model, organized by state variables (DO (dissolved oxygen), DOCL (labile dissolved organic carbon), DOCR (recalcitrant dissolved organic carbon), POCL (labile particulate organic carbon), POCR (recalcitrant particulate organic carbon), Secchi) and relevant fluxes. Note that the entrainment flux (Entr) is only included during thermally stratified periods. The inflow (IN) and outflow (OUT) fluxes are not included in the calculations for the hypolimnetic layer. The inflow of the labile DOC (INDOCL) parameter in Eq. (2) is only used for calculating allochthonous OC loads for MO. Atmospheric gas exchange of dissolved oxygen (AtmExch) is not included for the hypolimnetic DO calculation. Normalized total phosphorus is represented by TPnorm. The volume (V) term represents the respective lake layer volume or the discharge volume for the inflow and outflow equations. The term rrate is included in Eq. (13) to represent the respiration rates of the different OC pools. It is included to simplify the table of equations. Terms not defined here are included in Table 3.
2.3.3 Internal lake physical fluxes
The two in-lake physical fluxes included in the model are POC settling and entrainment of all state variables. POC settling is the product of a sinking rate (m d−1) and the respective POC pool (g), divided by the layer depth (m) (Table 2, Eq. 15). Sinking rates are either borrowed from literature values (Table 3) or fit during model calibration (see below). Entrainment is calculated as a proportion of epilimnetic volume change (Table 2, Eqs. 17–18). A decrease in epilimnetic volume shifts the mass of state variables from the epilimnion into the hypolimnion, and an increase in volume shifts the mass from the hypolimnion to the epilimnion.
2.3.4 Internal lake metabolism fluxes
The metabolism fluxes in the model are net primary production (NPP) and respiration (R). Respiration includes water column respiration for each OC state variable in the epilimnion and hypolimnion and is calculated at each time step as the product of the OC state variable and its associated first-order decay rate (Table 2, Eq. 13). Sediment respiration for the hypolimnion during stratified periods and the epilimnion (entire lake) during mixed periods is a constant daily rate that is individually fit for each lake. Note that we did not include anaerobic carbon metabolism in our modeling approach and discuss potential shortcomings in the discussion section. We assume that inorganic carbon is not a limiting carbon source. In the model, we consider any DO concentration less than 1 g DO m−3 to be anoxic (Nürnberg, 1995).
NPP is tracked in both the epilimnion and hypolimnion. NPP is a function of light, total phosphorus concentration, temperature, a maximum productivity coefficient (Pmax), and a slope parameter defining the irradiance and productivity curve (IP) (Table 2, Eq. 12). Total phosphorus concentration in a layer is taken from observational data for each lake interpolated to the daily timescale. Maximum daily primary production rates were taken from Wetzel (2001). As these maximum production rates are not phosphorus-specific but subsume lake-specific nutrient concentrations, we multiplied them with time-transient, normalized TP concentrations. Normalizing was done by removing the mean of observed TP and dividing by TP variance. This allows us to retain the time dynamics of the normalized TP, which we use to represent seasonal TP dynamics for each lake. The Arrhenius equation provides temperature control for NPP, and we determined through model fitting a θ of 1.12. All OC derived from NPP is assumed to be labile and is split between particulate and dissolved OC production, with 80 % produced as POC and 20 % produced as DOC. This ratio was determined through model fitting and is similar to previously reported values (Hipsey et al., 2022). Average light in a layer is calculated for each day and is dependent on the depth of a layer and the light extinction coefficient (Table 2 Eq. 19). During ice-covered conditions, average light is assumed to be 5 % of the average non-ice-covered value (Lei et al., 2011).
Epilimnetic and hypolimnetic water column respiration is tracked independently for each OC pool in the model. During mixed periods, there are four OC pools: DOCR (recalcitrant dissolved organic carbon), DOCL (labile dissolved organic carbon), POCR (recalcitrant particulate organic carbon), and POCL (labile particulate organic carbon). During stratified periods, those pools are split into a total of eight pools that are tracked independently for the epilimnion and hypolimnion. Respiration is calculated as a product of the mass of a respective variable, a first-order decay rate coefficient, temperature, and oxygen availability (Table 2, Eq. 13). The respiration decay rate coefficients are based on literature values (Table 3) or were fit during model calibration. An Arrhenius equation is used for temperature control of respiration, with θResp being equal to 1.04, which was determined through manual model fitting. The respiration fluxes are also scaled by oxygen availability using the Michaelis–Menten equation with a half-saturation coefficient of 0.5 g DO m−3 such that, at very low DO concentrations, the respiration flux approaches zero.
Sediment respiration is calculated from a constant daily respiration flux, adjusted for temperature and oxygen availability, using the Arrhenius and Michaelis–Menten equations, respectively (Table 2, Eq. 14). The mass of sediment OC is not tracked in the model. During stratified periods, we assume that the majority of epilimnetic sediment area is in the photic zone and therefore has associated productivity from macrophytes and other biomass. It is assumed that this background productivity and sediment respiration are of similar magnitude and are inseparable from water column metabolism given the observational data. Therefore, epilimnetic sediment respiration is not accounted for in the model during stratified conditions. During mixed conditions, we assume that sediment respiration is active on all lake sediment surfaces, which are assumed to be equivalent in area to the total surface lake area. During stratified periods, we use the area at the thermocline as the sediment area for calculating hypolimnetic sediment respiration.
2.3.5 Other in-lake calculations and assumptions
We calculate a total light extinction coefficient (LEC) for the epilimnion and hypolimnion. The total LEC for each layer is calculated by multiplying the dissolved and particulate specific LEC values with their respective OC state variable concentrations combined with a general LEC value for water (Table 2, Eq. 20). This total LEC value is used to calculate a daily estimate of Secchi depth (Table 2, Eq. 8). The coefficients for the light extinction of water, DOC, and POC are manually calibrated based on observed Secchi depth ranges for the study lakes (Tables 3 and S5).
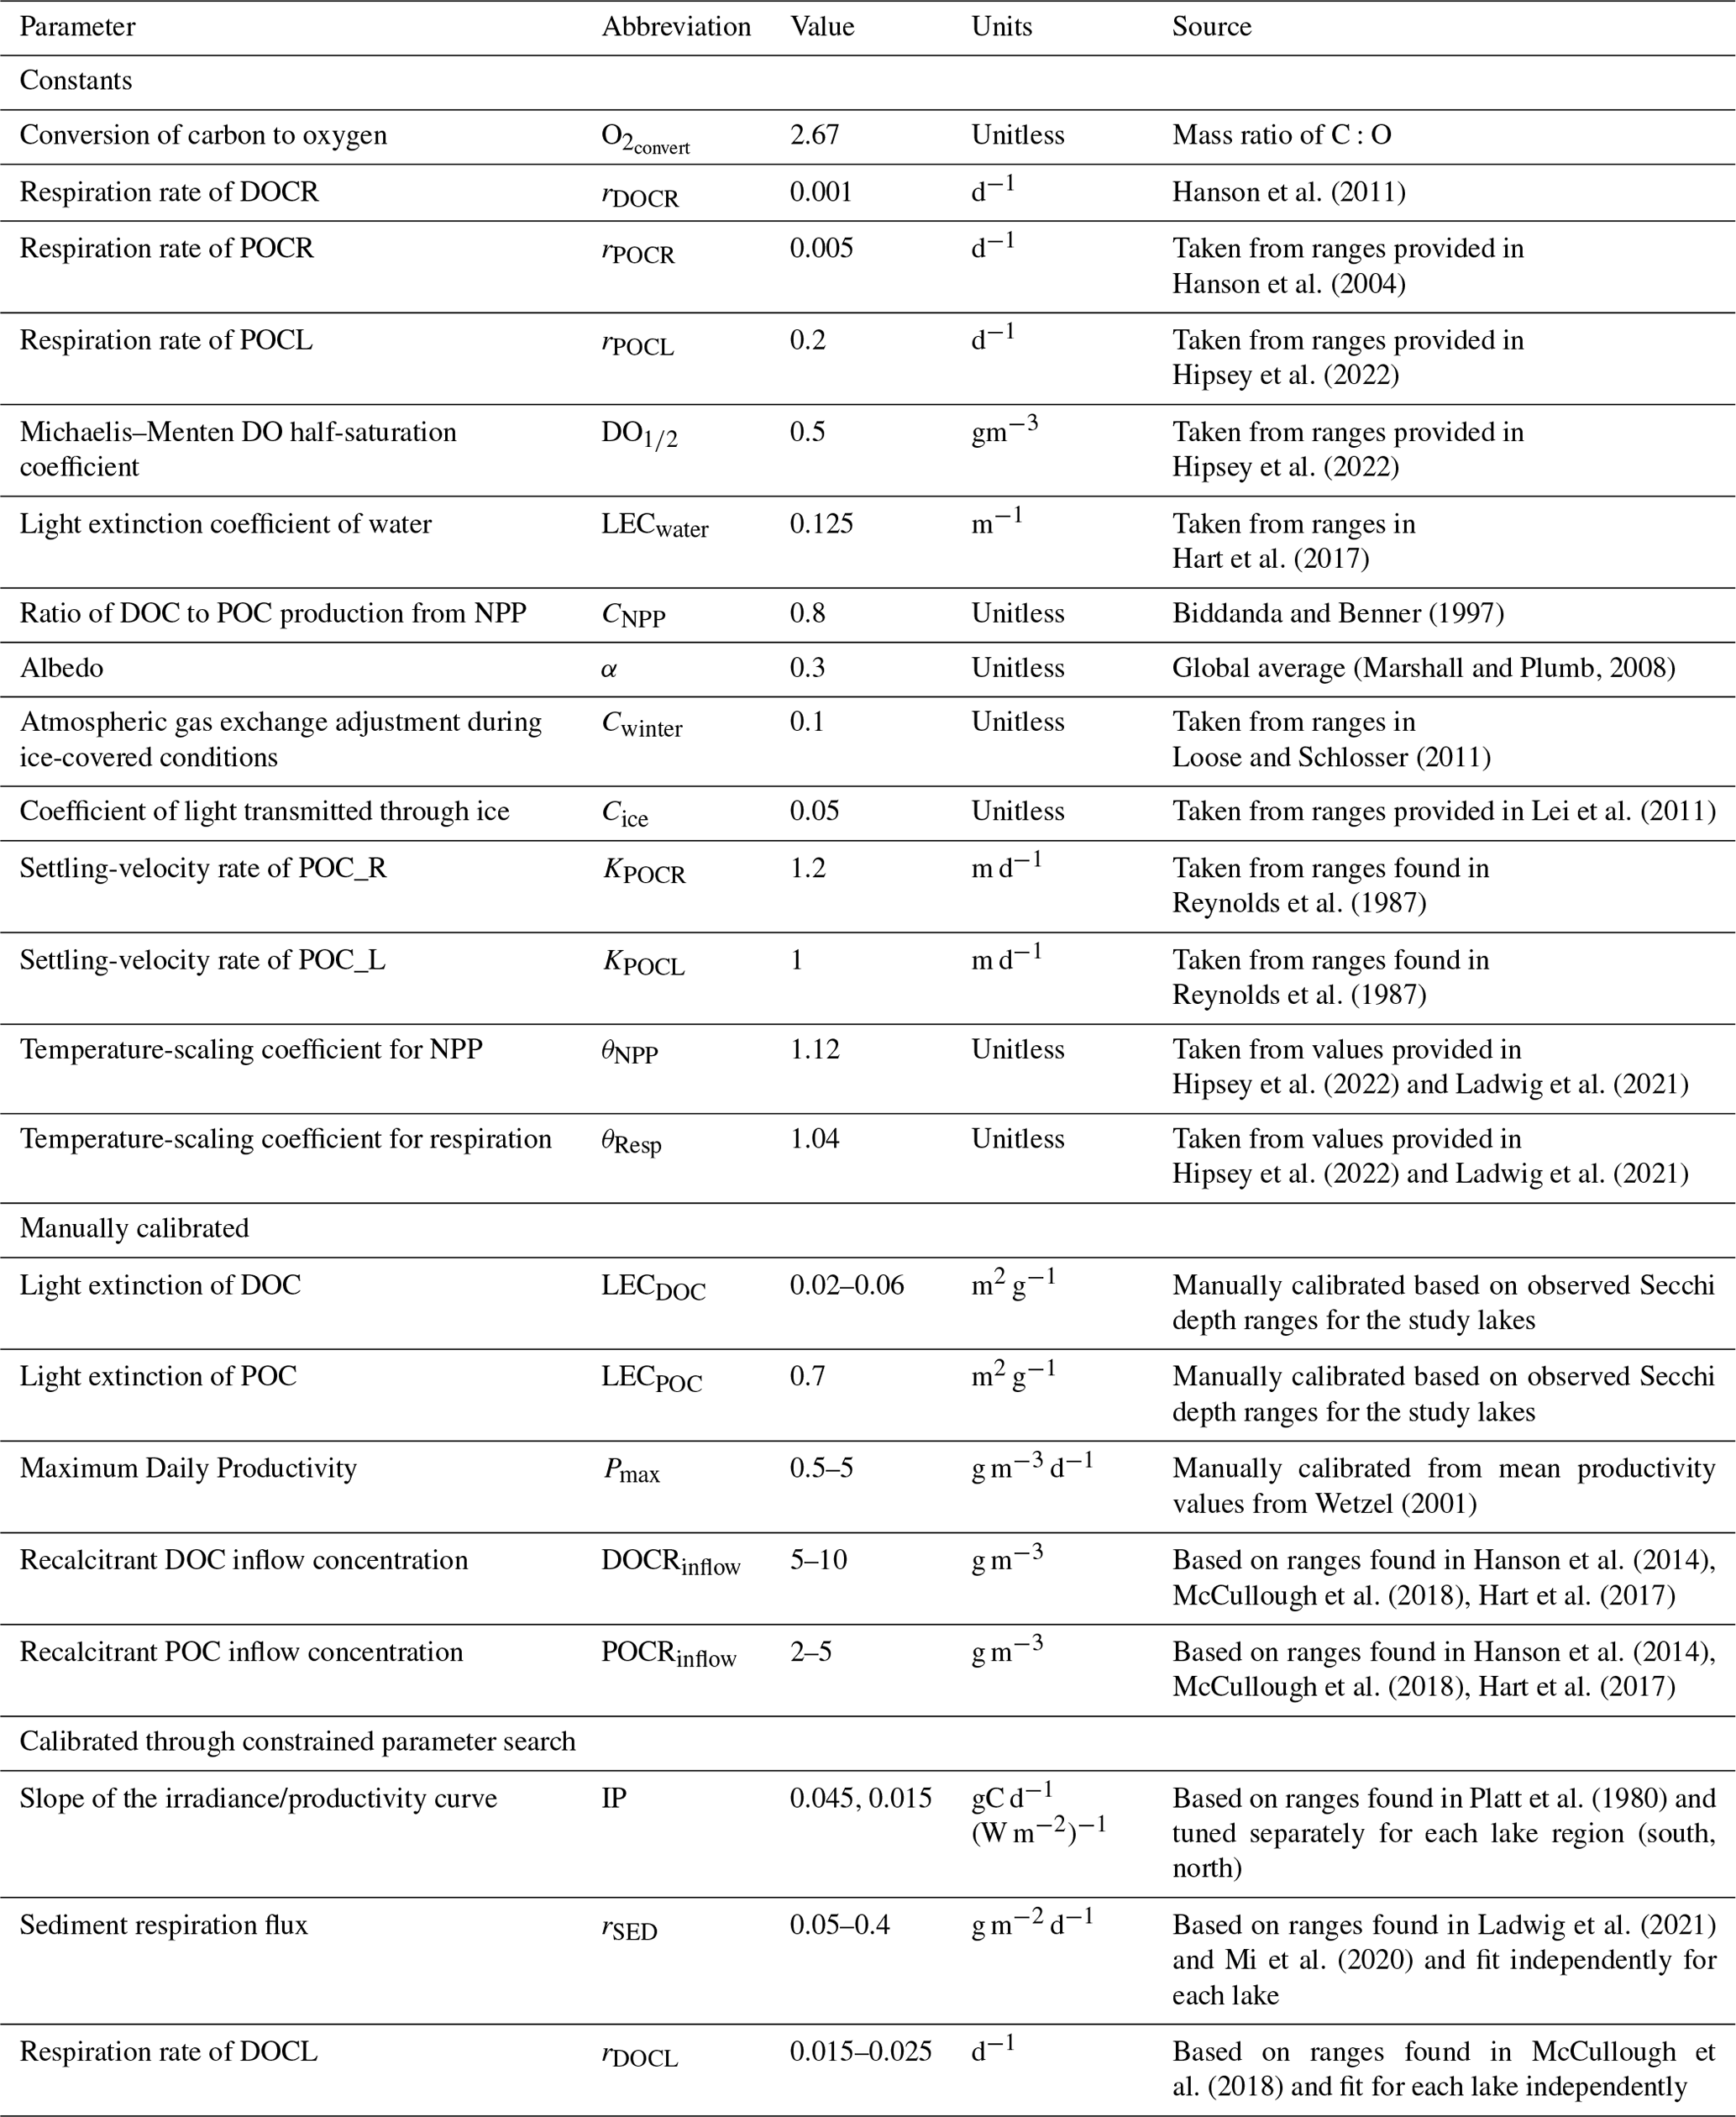
Table 3Model parameters grouped into three categories: constants, which are values that were not tuned; manually calibrated, which are parameters manually tuned, typically guided by ranges from the literature; and parameters calibrated through constrained parameter search, which are calibrated through an automated search of parameter space.
2.4 Model sensitivity and parameter calibration
To better understand the sensitivities of the model output to parameter values, we performed a sensitivity analysis of the model parameters using the global sensitivity method from Morris (1991). The sensitivity analysis showed that there were nine parameters to which the model was consistently sensitive across the six study lakes. This group included the ratio of DOC to POC produced from NPP (CNPP), the maximum daily productivity parameter (Pmax), the inflow concentration of recalcitrant POC (POCRinflow), the setting velocity of recalcitrant POC (KPOCR), the temperature-fitting coefficients for productivity and respiration (θNPP, θResp), the slope of the irradiance or productivity curve (IP), the sediment respiration flux (rSED), and the respiration rate of DOCL (rDOCL). We chose a subset of the nine parameters to include in the uncertainty analysis based on the following justifications. The model results showed that recalcitrant substrates are of lesser importance for lake metabolism dynamics so we chose not to further investigate the uncertainty of the POCRinflow and KPOCR parameters. The Pmax and IP parameters are directly correlated so we chose to remove Pmax from further uncertainty considerations. The θNPP and θRESP parameters act as substitutes for water temperature, a well-known master variable in water quality modeling, and directly reflect seasonality in the model. Therefore, we chose to omit these parameters for further uncertainty calculations. The final subset of parameters for uncertainty analysis consisted of CNPP, rDOCL, rSED, and IP. Of the four parameters, we felt CNPP was best constrained by the literature. To reduce the number of parameters estimated in the calibration process, we restricted the automated constrained parameter search to the remaining three.
Model parameters are grouped into three categories: constants, manually calibrated, and parameters calibrated through an automated constrained parameter search. The constant parameters are consistent across the study lakes and are not tuned. The manually calibrated parameters were allowed to vary by lake and are typically guided by ranges from the literature. The constrained parameter search uses an automated search of parameter space, constrained by literature values, to fit the IP, rSED, and rDOCL parameters for the study lakes. Specifically, we performed a constrained fitting of the model to observational data using the Levenberg–Marquardt algorithm within the modFit function of the FME R package (Soetaert and Petzoldt, 2010). During the model fitting, errors in modeled DO, DOC, and Secchi depth are weighted equally in the southern lakes. Secchi depths in the northern lakes were highly stochastic, and therefore, we use a moving average on observational data and predictions of Secchi depth and calculate the residuals as the difference between the two averaged time series. We use a moving-average window of 15 observations because we want to capture the average annual Secchi depth trend, and there are roughly 15 observations per year.
The first 15 years of the model output were used for calibration, and the last 5 years were used for model validation. We chose the first 15 years for calibration because the observational data were relatively stable and were not indicative of any large trends in ecosystem processes as opposed to the last 5 years, which showed slightly more model deviation from DOC observational data in the southern lakes (Fig. S2).
2.5 Model uncertainty
Sensitivity guided the uncertainty analysis. To quantify uncertainty around model predictions, we sampled IP, rSED, and rDOCL simultaneously from uniform distributions defined by ±30 % of the literature ranges used for our calibrated parameter values (Table 3). We ran 100 model iterations, randomly sampling the three model state variables across these distributions. We plotted the minimum and maximum values for these uniform distributions and included them in the time series plots (Figs. 2, 3, 4, S1, S2, and S3).
3.1 Model fit to ecosystem states
Model predictions of DO reproduce observed seasonal variability well. Note that RMSE values presented here represent model error combined over both the validation and calibration periods (see Table S1 for calibration- and validation-specific RMSE values) and that state variables are presented with truncated time ranges for visual clarity (see Figs. S1–S3 for full time series). Epilimnetic DO generally has lower RMSE than DO in the hypolimnion (Fig. 2). In the epilimnion, RMSE ranges from 0.74 g DO m−3 (TR) to 2.11 g DO m−3 (MO), and in the hypolimnion, RMSE ranges from 1.22 g DO m−3 (ME) to 2.77 g DO m−3 (AL, SP). Validation NSE values for DO ranged from −1.45 (AL) to 0.02 (ME) in the epilimnion and −0.30 (SP) to 0.86 (ME) in the hypolimnion. Validation KGE values for DO ranged from 0.40 (AL) to 0.90 (TR) in the epilimnion and 0.35 (SP) to 0.80 (ME) in the hypolimnion. KGE and NSE values for all the lakes can be found in Table S7. In the southern lakes, modeled values reach anoxic levels and generally follow the DO patterns recorded in the observed data (Fig. 2a–b). Observational data for the northern lakes show an occasional late-summer onset of anoxia, and these events are generally captured in the model output. A late-summer spike in hypolimnetic DO predictions commonly occurs as well, which is likely a model artifact caused by the reduction of hypolimnetic volumes to very small values over short time periods prior to fall mixing. The reduction to small volumes, coincident with modest fluxes due to high concentration gradients, results in transient high concentrations. Overall, the goodness of fit of hypolimnetic DO in our study lakes does not seem to follow any regional or lake-characteristic patterns.
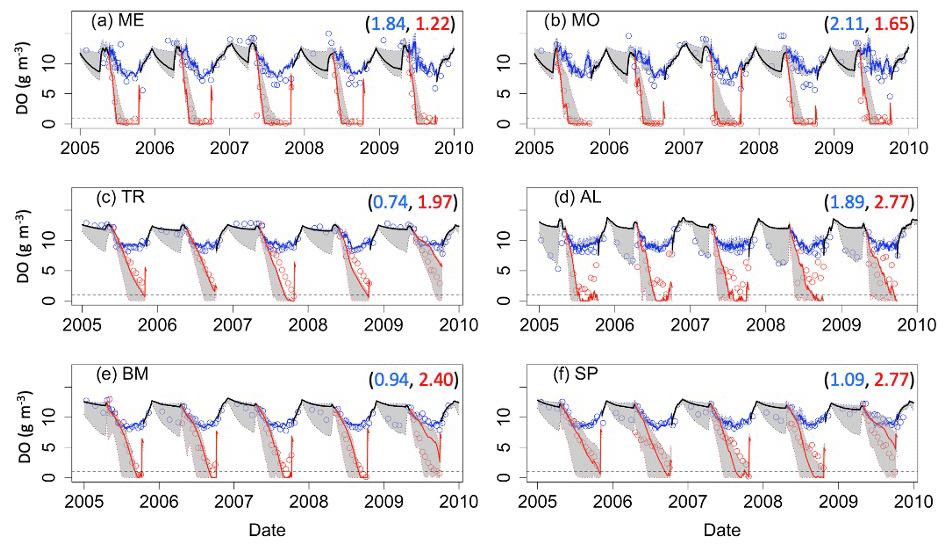
Figure 2Dissolved oxygen (DO) time series for the years 2005–2010 for the six study lakes (a–f). Model predictions are represented by lines, and circles represent the observational data. Epilimnetic DO values are blue, and hypolimnetic DO values are red. Fully mixed periods for the lake are indicated by a single black line. RMSE values (epilimnion, hypolimnion; g m−3) for the validation period are included in the upper right of each panel. Uncertainty is represented by gray shading.
The two southern lakes (ME, MO) have epilimnetic DOC RMSE values greater than 1.00 g C m−3, while the RMSE for the northern lakes ranges from 0.41 g C m−3 (TR) to 0.70 g C m−3 (AL) (Fig. 3). In the southern lakes, NSE epilimnetic DOC values were below −3.00, and KGE values ranged from −0.29 to −0.32. In the northern lakes, NSE values for DOC ranged between -2.75 (SP) and −0.31 (AL). KGE values ranged from −0.07 (BM) to 0.35 (TR). All NSE and KGE metrics for DOC can be found in Table S7. Observational data in both southern lakes indicate a decrease in DOC concentration beginning around 2010, which is largely missed in the model predictions (Figs. 3a–b, S2a–b) and causes an overestimation of DOC by about 1–2 g C m−3. However, model predictions converge with observed DOC toward the end of the study period (Fig. S2a–b). In AL, the seasonal patterns of modeled DOC are smaller in amplitude than the observational data (Fig. S2d).
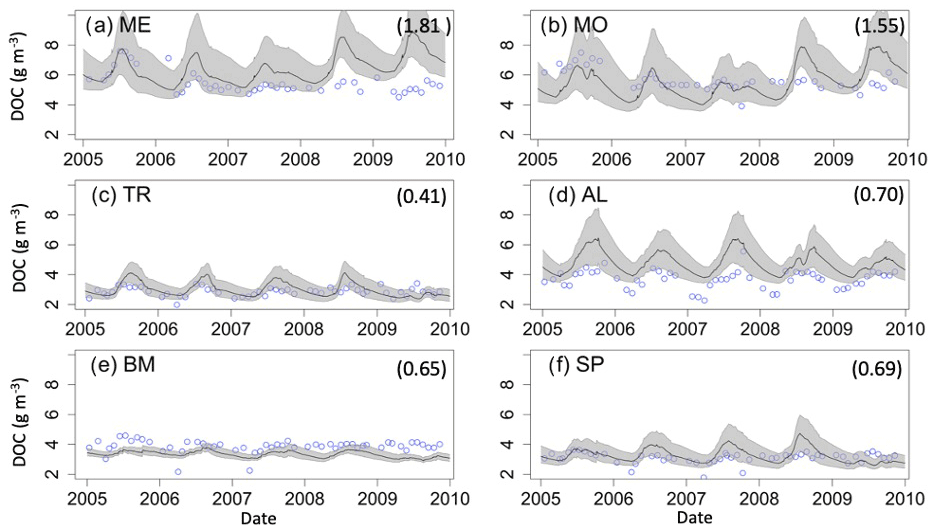
Figure 3Epilimnetic dissolved organic carbon (DOC) time series for the years 2005–2010 for the six study lakes (a–f). Model predictions are represented by lines, and circles represent the observational data. RMSE values for the validation period are included for each lake (g C m−3). Uncertainty is represented by gray shading.
Secchi depth predictions reproduce the mean and seasonal patterns in all lakes (Fig. 4). Although the model produced annual cycles of Secchi depth that generally covered the range of observed values, short-term deviations from annual patterns in the observed data are not reproduced. The timing of minimum and maximum Secchi depth sometimes differed between predicted and observed values for the northern lakes. In addition, winter extremes in observed Secchi depth are not always reproduced by the model, which is especially evident for ME (Fig. 4a). However, winter observational data for Secchi are more sparse than in other seasons.
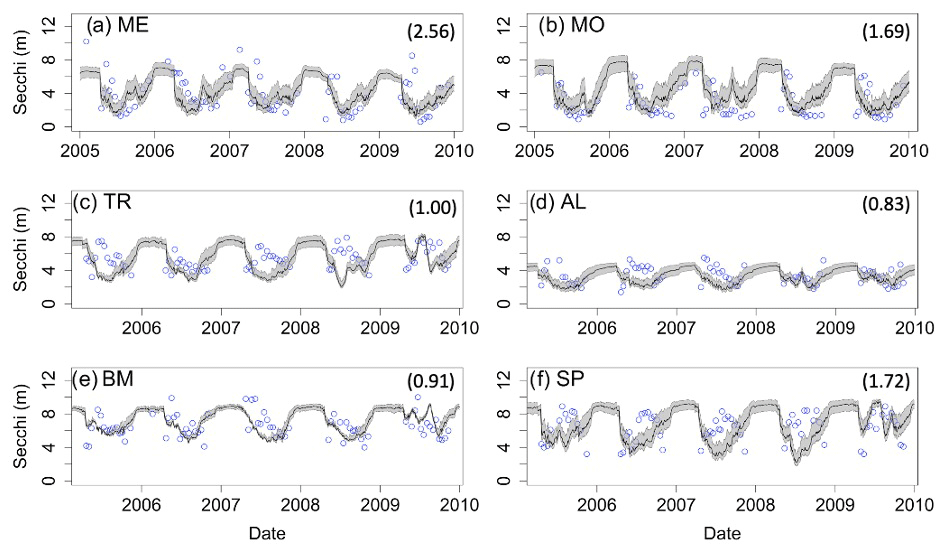
Figure 4Secchi depth time series for the years 2005–2010 for the six study lakes (a–f). Model predictions are represented by lines, and circles represent the observational data. RMSE values for the validation period are included for each lake. Uncertainty is represented by gray shading.
3.2 Ecosystem processes
The mean annual OC budgets of all six lakes show large differences in the sources and fates of OC among lakes (Fig. 5, Table S3). Autochthony is the dominant source of OC for all study lakes. Water column respiration is the largest portion of whole-lake respiration in ME, MO, TR, SP, and BM. Sediment respiration contributions make up a lower proportion of total respiration in ME, MO, and TR (mean of 14.1 %) and are slightly higher in BM and SP (mean of 18.7 %). AL has a more even distribution of OC fates. OC burial amounts also vary across the study lakes, with the highest percentage in AL (34.1 %) and the lowest percentage in SP (5.25 %).
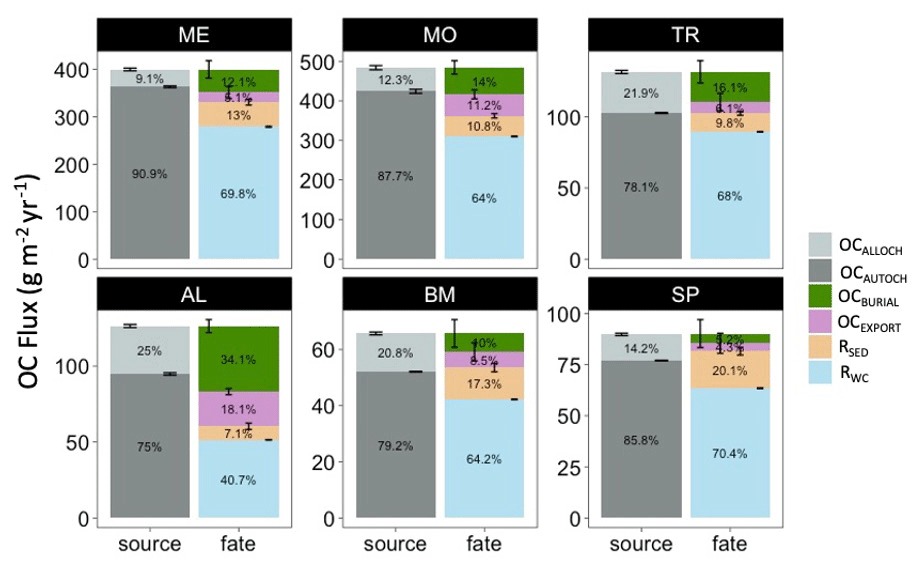
Figure 5Total annual budget, sources (left stacked bars), and fates (right stacked bars) of organic carbon (OC) in each lake over the study period. The OC sources include allochthonous OC (OCALLOCH) and autochthonous OC (OCAUTOCH). The OC fates include burial of OC (OCBURIAL), export of OC (OCEXPORT), sediment respiration of OC (RSED), and water column respiration of OC (RWC). Standard error bars for the annual means are indicated for each source and fate as well. Note that the magnitudes of the y axis differ among the lakes. A significance test comparing these fluxes across the study lakes can be found in Table S6.
The lakes show interannual variations in terms of trophic state, as quantified by NEP (Fig. 6). Total respiration (water column and sediment) exceeds autochthony in SP, BM, and TR, indicating predominantly net heterotrophy for these systems. The remaining lakes (ME, MO, AL) are generally net autotrophic. The southern lakes (ME, MO) are net autotrophic (positive NEP) for the majority of the study years but became less autotrophic over the last 5 years of the study period (2010–2014). BM and SP are mostly net heterotrophic (negative NEP) over the study period, with a few brief instances of net autotrophy. The strongest autotrophic signal for these lakes occurred around 2010. TR experienced prolonged periods of both autotrophy and heterotrophy. AL is net autotrophic over the study period but had lower average NEP than the southern lakes. ME, MO, and AL all have negative trends in NPP, but only ME and AL were significant (p value < 0.1, Mann–Kendall test) (Table S2). Of these three lakes, ME and AL also have significant decreasing trends in annual total phosphorus concentration (Table S2). No significant trends were found for NPP or total phosphorus in the other lakes (MO, TR, BM, SP). It is worth noting that our interpretation of metabolism dynamics in the results is based on the median NPP and respiration flux values produced by the model. Because of the high uncertainty associated with these fluxes, we should be cautious about asserting inferences about long-term changes in trophic state.
Hypolimnetic DO consumption during stratified periods was modeled as a function of the two components of hypolimnetic respiration, hypolimnetic water column respiration and hypolimnetic sediment respiration. Water column respiration contributes more than sediment respiration to total hypolimnetic respiration in the deepest lakes. In ME and MO, the mass of summer autochthonous POC entering the hypolimnion is similar to the total hypolimnetic OC mass respired for the beginning of the stratified period (Fig. 7a–b, green line). Later in the stratified period, an increase in epilimnetic POC and associated settling exceeds total hypolimnetic respiration (Fig. 7a–b; hashed green area). This is due, in part, to lower respiration rates that occur once DO (gray line) has been fully depleted, which occurs in early July for ME and late June for MO. In BM and SP, the total hypolimnetic respiration slightly exceeds autochthonous POC inputs during parts of the stratified period, indicating the importance of allochthony in these systems (Fig. 7c, f). BM shows that autochthonous POC entering the hypolimnion and total hypolimnetic respiration are similar for much of the stratified period (Fig. 7d). AL is the only lake to have autochthonous POC inputs consistently larger than total hypolimnetic respiration during the stratified season. All lakes show that summer allochthonous POC entering the hypolimnion makes a small contribution to the overall hypolimnetic POC load.
Respiration of autochthonous POC and sediment respiration account for most of the total hypolimnetic respiration in all lakes (Fig. 8). Respiration of DOC accounts for a relatively small proportion of total respiration. Total hypolimnetic respiration is higher in the southern lakes than in the northern lakes. TR has the highest amount of hypolimnetic respiration for the northern lakes, and AL and BM have the lowest amounts of hypolimnetic respiration. Water column respiration contributed the most towards total hypolimnetic respiration in all lakes. Sediment respiration contributed the largest proportion towards total hypolimnetic respiration in BM and SP. DOC water column respiration made up the smallest proportion of total hypolimnetic respiration in all six study lakes.
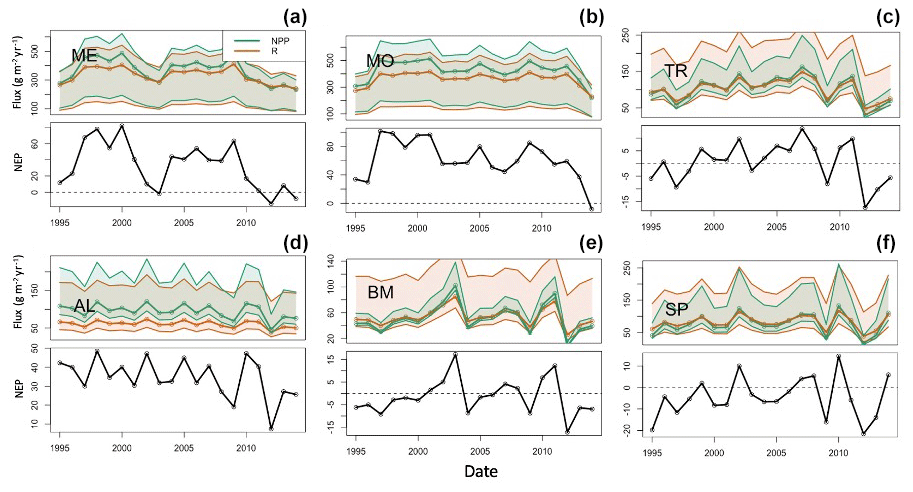
Figure 6Time series of calibrated lake net primary production (green), total respiration (red) (a–c), and net ecosystem production (NEP, d–f) for the six lakes: (a) Lake Mendota, (b) Lake Monona, (c) Trout Lake, (d) Allequash Lake, (e) Big Muskellunge Lake, and (f) Sparkling Lake. Fluxes are in units of grams of carbon per meter squared per year. The solid line represents predictions based on best parameter estimates. Shaded regions represent prediction uncertainty based on parameter ranges in Table 3. The shaded region is for NEP, not shown to reduce axis limits and to emphasize the NEP pattern.
4.1 Autochthonous and allochthonous loads
Autochthony was the dominant source of OC subsidizing hypolimnetic respiration in the modeling results for our study lakes. The high contribution of autochthonous OC to ecosystem respiration relative to that of the allochthonous pool was surprising, given ample research highlighting the dominance of allochthonous OC in north-temperate lakes (Wilkinson et al., 2013; Hanson et al., 2011, 2014). Similarly to what was found by Wilkinson et al. (2013), the standing stock of DOC in the water column of lakes in our study was from predominantly allochthonous sources. However, we emphasize in our study that autochthonous OC pools have higher turnover rates than allochthonous OC pools (Dordoni et al., 2022) and often are lower in concentration than the more recalcitrant allochthonous pools (Wilkinson et al., 2013). Thus, studies based on correlative relationships between lake concentrations of organic matter and water quality metrics likely overlook the importance of more labile organic matter in driving observable ecosystem phenomena, such as gas flux and the formation of hypolimnetic anoxia (Evans et al., 2005; Feng et al., 2022). By quantifying metabolism fluxes relevant to both OC pools, we can recreate shorter-term OC processes that quantify high turnover of labile organic matter, which would typically be missed by empirical studies based on monthly or annual observations.
Allochthony and autochthony are important to lake carbon cycling but in ways that play out at different timescales. Allochthonous OC has been well established as an important factor in driving negative NEP through a number of mechanisms (Wilkinson et al., 2013; Hanson et al., 2014, 2011). Allochthony contributes to water quality variables, such as Secchi depth (Solomon et al., 2015), by providing the bulk of DOC in most lakes (Wilkinson et al., 2013) and can drive persistent hypolimnetic anoxia in dystrophic lakes (Knoll et al., 2018). In contrast, autochthony contributes to seasonal dynamics of water quality through rapid changes in OC that can appear and disappear within a season. Within that seasonal time frame, autochthonous POC settling from the epilimnion can drive hypolimnetic respiration, thus controlling another key water quality metric, oxygen depletion. It is worth noting that our model does not discern allochthonous and autochthonous sediment OC; however, we show that autochthonous OC makes up the largest proportion of OC loads in our study lakes, and therefore, autochthony likely contributes substantially to the sediment OC pool. For highly eutrophic lakes, the model results show excess autochthony stored in the sediments which may carry into subsequent years, potentially providing additional substrate for sediment respiration. Thus, understanding and predicting controls over hypolimnetic oxygen depletion benefits from quantifying both allochthonous and autochthonous OC cycles.
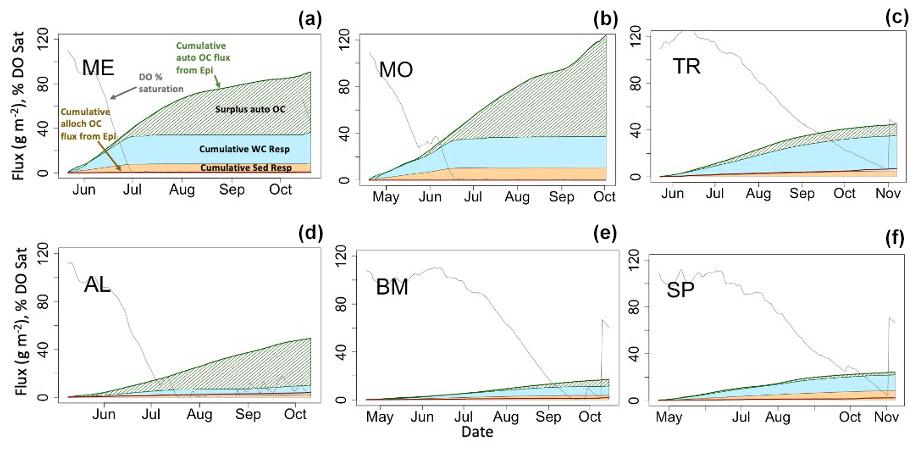
Figure 7Hypolimnetic dissolved oxygen, allochthonous (alloch) and autochthonous (auto) organic carbon loading, and respiration dynamics during one stratified period (2005) for each lake. Fluxes are cumulative (gC m−2), and DO is presented as percent saturation. Labels are in (a). Note that the cumulative water column (WC) and sediment (Sed) respiration fluxes are stacked, while other cumulative fluxes are not.
Differences in trophic status, hydrologic residence time, and inflow sources help explain the relative proportion of allochthonous versus autochthonous OC among lakes in our study. Water residence times (Hotchkiss et al., 2018; McCullough et al., 2018) and surrounding land cover (Hanson et al., 2014) have been shown to have a substantial impact on OC dynamics by controlling allochthonous OC loading and NEP trends in lakes included in our study (Hanson et al., 2014; McCullough et al., 2018). We built upon these ideas by recreating daily watershed-loading dynamics of POC and DOC from derived discharge data and incorporating nutrient controls over lake primary production by using high-quality and long-term observational data. The northern lakes are embedded in forest and wetland landscapes, which characteristically have higher DOC than the urban and agricultural landscape of the southern lakes (Creed et al., 2003). This creates variation in allochthonous loading across the study lakes. Lake trophic state and productivity are a major control for autochthonous production, which influences autochthonous loads across the study lakes as well. For lake metrics that are comparable between studies, such as allochthonous loading and export, allochthonous water column respiration, and total OC burial, our results were within 20 % of the values in related studies (Hanson et al., 2014; McCullough et al., 2018).
4.2 Hypolimnetic respiration
Given the importance of autochthonous POC to hypolimnetic respiration, we assume it contributes substantially to both sediment respiration and respiration in the water column. While previous work found that sediment respiration was the dominant respiration source for lakes with depth ranges encompassed within our study (Steinsberger, 2020), we found that water column respiration was at least as important, if not more so. Differences in these findings could be linked to uncertainty in the settling velocity of POC due to the lack of empirical POC settling-velocity measurements. Perhaps POC mineralized in the hypolimnia of our modeled lakes passes more quickly to the sediments in real ecosystems, shifting the balance of respiration more toward the sediments. OC respiration can contribute substantially to hypolimnetic DO depletion in both lakes and reservoirs (Beutel, 2003), and POC settling velocities can be highly variable, suggesting that assumptions around the vertical distribution of lake POC deserve further investigation. Another possible explanation for these differences could be that our model missed allochthonous POC loads from extreme events (Carpenter et al., 2012), which can increase the amount of legacy OC stored in the sediments and increase sediment respiration. Our model also does not account for reduced respiration rates due to OC aging, which may explain our higher values of water column respiration. Finally, our model includes entrainment as a possible oxygen source to the hypolimnion, which must be offset by respiration to fit observed hypolimnetic DO changes. Any study that underestimates DO sources to the hypolimnion likely underestimates total respiration.
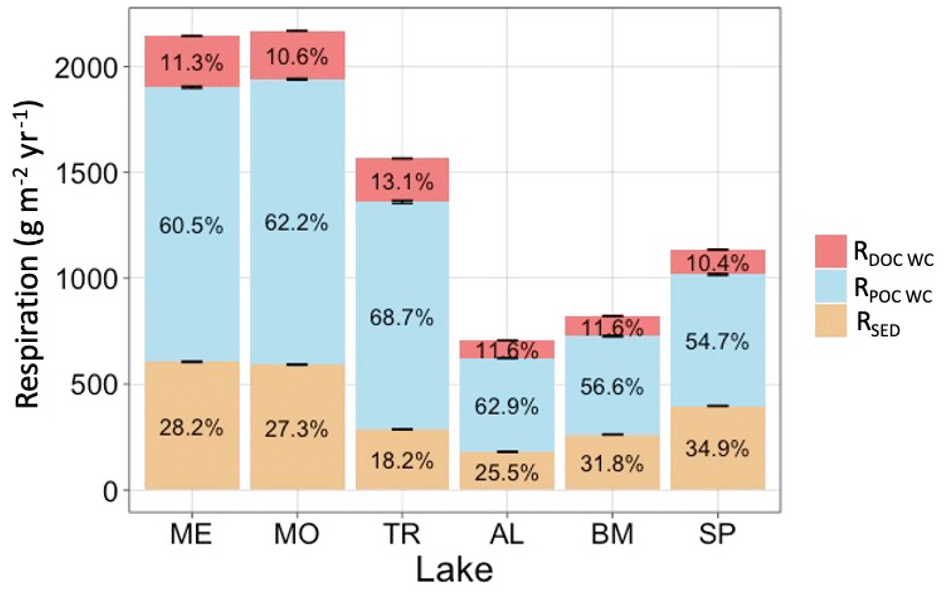
Figure 8Total average annual hypolimnetic respiration, separated by percentages attributed to water column DOC (RDOC WC), water column POC (RPOC WC), and sediment (RSED) organic carbon sources. Standard error bars for the annual respiration values are indicated as well.
Anaerobic mineralization of organic carbon is an important biogeochemical process and can be a substantial carbon sink through methanogenesis (Maerki et al., 2009). Although methanogenesis is not incorporated into our model, methane dissolved in the water column of Lake Mendota is mostly oxidized (Hart, 2017), thus contributing to the overall oxygen demand, which is accounted for in our model. What remains unaccounted for is ebullition of methane, which is a carbon flux that is difficult to quantify (McClure et al., 2020). Future metabolism studies that include these processes might find a decrease in annual OC burial rates relative to the rates in our study. Although we believe that ebullition is not a substantial portion of the lake's carbon mass budget, this remains to be studied more carefully. As the model accounts for DO consumption through calibration, the overall flux would not change even if we link DO consumption to methane oxidation; only the process description would be more realistic.
Our findings highlight the importance of autochthonous POC in hypolimnetic oxygen depletion and suggest that related processes, such as the timing of nutrient loading, changes in thermocline depth, or zooplankton grazing, could impact overall lake respiration dynamics and anoxia formation (Schindler et al., 2016; Ladwig et al., 2021; Müller et al., 2012). We also recognize that the DO depletion rate in SP is more uncertain than in the other study lakes. Although we are uncertain of the cause, we speculate that differences in morphometry for this lake could impact the hypolimnetic volume and its capacity to hold DO, as well as the rate of sediment oxygen consumption (Livingstone and Imboden, 1996). Although lake hypsometry, along with the thermal profile, controls the volume of hypolimnion in contact with sediments in our model, there may be other factors related to morphometry (e.g., sediment focusing) that remain unaccounted for, and we see this as an opportunity for future study.
4.3 Long-term dynamics
Although autochthonous OC dominated the loads across the study lakes, analysis of the long-term OC dynamics supports the importance of allochthony in lakes. Net ecosystem production (NEP) has been used to quantify heterotrophy and autotrophy in lakes (Odum, 1956; Hanson et al., 2003; Cole et al., 2000; Lovett et al., 2006), and using this metric over multiple decades allowed us to analyze the long-term impacts of allochthony. TR, BM, and SP fluctuated between heterotrophy and autotrophy, usually in tandem with trends in hydrology, which acts as a main control of allochthonous OC. This suggests that allochthonous OC inputs may be less important for seasonal anoxia but can still drive a lake toward negative NEP and contribute to sediment carbon storage over long time periods. ME, MO, and AL tended to become less autotrophic over time (Fig. 6), a pattern that coincided with significant decreasing trends in mean epilimnetic total phosphorus concentrations for ME and AL (Fig. S5). In our model, NPP and phosphorus are directly related so decreases in phosphorus are likely to cause decreases in NEP. Short-term respiration of autochthonous POC can account for rapid decreases in hypolimnetic DO, but allochthonous POC, which tends to be more recalcitrant, provides a long-term subsidy of ecosystem respiration that can result in long-term net heterotrophy. Thus, it is critical to understand and quantify both the rapid internal cycling based on autochthony and the long and slow turnover of allochthony.
Through explicitly simulating the cycling of both allochthony and autochthony, we can expand our conceptual model of metabolism to better understand time dynamics of lake water quality at the ecosystem scale. Autochthony has pronounced seasonal dynamics, typically associated with the temporal variability of phytoplankton communities and the growth and senescence of macrophytes (Rautio et al., 2011). While allochthony can also have strong seasonal patterns associated with leaf litter input, pollen blooms, and spring runoff events, its more recalcitrant nature leads to a less pronounced seasonal signal at the ecosystem scale (Wilkinson et al., 2013; Tranvik, 1998). When considered together, it seems that allochthony underlies long and slow changes in metabolism patterns, while autochthony overlays strong seasonality. Both OC pools are important for ecosystem-scale metabolism processes, and their consequences are evident at different timescales. Therefore, the interactions of both OC sources and their influences on water quality patterns deserve further investigation.
Autochthonous OC control over hypolimnetic respiration should be a primary consideration for understanding the influence of OC on ecosystem dynamics. Hypolimnetic oxygen depletion and anoxia in productive lakes can be mitigated by reducing autochthonous production of OC, which we show is mainly driven by nutrient availability. This study also identifies the need for a better understanding of internal and external OC loads in lakes. Previous studies have found heterotrophic behavior in less productive lakes, but our findings highlight the importance of autochthony in these lakes, especially for shorter-timescale processes that can be missed by looking at broad annual patterns. By using a one-dimensional, two-layer model, we are also able to understand how surface metabolism processes can impact bottom-layer dynamics, which would not be possible with a zero-dimensional model. Looking forward, we believe that our understanding of these processes could be improved by building a coupled watershed–metabolism model to more closely explore causal relations between watershed hydrology, nutrient dynamics, and lake morphometry.
Model code, figure creation code, driving data, model configuration files, and model result data are archived in the Environmental Data Initiative repository (https://portal.edirepository.org/nis/mapbrowse?packageid=knb-lter-ntl.421.2, last access: 7 December 2022) (Delany, 2022).
The supplement related to this article is available online at: https://doi.org/10.5194/bg-20-5211-2023-supplement.
AD, PCH, RL, and CB assisted with model development and analysis of the results. AD and PCH prepared the paper with contributions from RL, CB, and EA.
The contact author has declared that none of the authors has any competing interests.
Publisher’s note: Copernicus Publications remains neutral with regard to jurisdictional claims made in the text, published maps, institutional affiliations, or any other geographical representation in this paper. While Copernicus Publications makes every effort to include appropriate place names, the final responsibility lies with the authors.
Data were provided by the North Temperate Lakes Long-Term Ecological Research Program and were accessed through the Environmental Data Initiative (https://doi.org/10.6073/pasta/0dbbfdbcdee623477c000106c444f3fd).
This research has been supported by the National Science Foundation (grant nos. DEB-1753639, DEB- 1753657, and DEB-2025982). Funding for Ellen Albright was provided by the NSF Graduate Research Fellowship Program (GRFP) and the Iowa Department of Natural Resources (contract no. 22CRDLWBMBALM-0002). Funding for Robert Ladwig was provided by the NSF ABI development grant (no. DBI-90 1759865), the UW-Madison Data Science Initiative grant, and the NSF HDR grant (no. DEB-1934633).
This paper was edited by Sebastian Naeher and reviewed by three anonymous referees.
Amon, R. M. W. and Benner, R.: Photochemical and microbial consumption of dissolved organic carbon and dissolved oxygen in the Amazon River system, Geochim. Cosmochim. Ac., 60, 1783–1792, https://doi.org/10.1016/0016-7037(96)00055-5, 1996.
Beutel, M. W.: Hypolimnetic Anoxia and Sediment Oxygen Demand in California Drinking Water Reservoirs, Lake Res. Manage., 19, 208–221, https://doi.org/10.1080/07438140309354086, 2003.
Bryant, L. D., Hsu-Kim, H., Gantzer, P. A., and Little, J. C.: Solving the problem at the source: Controlling Mn release at the sediment-water interface via hypolimnetic oxygenation, Water Res., 45, 6381–6392, https://doi.org/10.1016/j.watres.2011.09.030, 2011.
Cardille, J. A., Carpenter, S. R., Coe, M. T., Foley, J. A., Hanson, P. C., Turner, M. G., and Vano, J. A.: Carbon and water cycling in lake-rich landscapes: Landscape connections, lake hydrology, and biogeochemistry, J. Geophys. Res., 112, G02031, https://doi.org/10.1029/2006JG000200, 2007.
Carpenter, S. R., Benson, B. J., Biggs, R., Chipman, J. W., Foley, J. A., Golding, S. A., Hammer, R. B., Hanson, P. C., Johnson, P. T. J., Kamarainen, A. M., Kratz, T. K., Lathrop, R. C., McMahon, K. D., Provencher, B., Rusak, J. A., Solomon, C. T., Stanley, E. H., Turner, M. G., Vander Zanden, M. J., Wu, C.-H., and Yuan, H.: Understanding Regional Change: A Comparison of Two Lake Districts, BioScience, 57, 323–335, https://doi.org/10.1641/B570407, 2007.
Carpenter, S., Arrow, K., Barrett, S., Biggs, R., Brock, W., Crépin, A.-S., Engström, G., Folke, C., Hughes, T., Kautsky, N., Li, C.-Z., McCarney, G., Meng, K., Mäler, K.-G., Polasky, S., Scheffer, M., Shogren, J., Sterner, T., Vincent, J., Walker, B., Xepapadeas, A., and Zeeuw, A.: General Resilience to Cope with Extreme Events, Sustainability, 4, 3248–3259, https://doi.org/10.3390/su4123248, 2012.
Catalán, N., Marcé, R., Kothawala, D. N., and Tranvik, L. J.: Organic carbon decomposition rates controlled by water retention time across inland waters, Nat. Geosci., 9, 501–504, https://doi.org/10.1038/ngeo2720, 2016.
Cole, G. and Weihe, P.: Textbook of Limnology, Waveland Press, Inc., ISBN 978-1-4786-2307-6, 2016.
Cole, J. J. and Caraco, N. F.: Atmospheric exchange of carbon dioxide in a low-wind oligotrophic lake measured by the addition of SF 6, Limnol. Oceanogr., 43, 647–656, https://doi.org/10.4319/lo.1998.43.4.0647, 1998.
Cole, J. J., Pace, M. L., Carpenter, S. R., and Kitchell, J. F.: Persistence of net heterotrophy in lakes during nutrient addition and food web manipulations, Limnol. Oceanogr., 45, 1718–1730, https://doi.org/10.4319/lo.2000.45.8.1718, 2000.
Cole, J. J., Carpenter, S. R., Kitchell, J. F., and Pace, M. L.: Pathways of organic carbon utilization in small lakes: Results from a whole-lake 13C addition and coupled model, Limnol. Oceanogr., 47, 1664–1675, https://doi.org/10.4319/lo.2002.47.6.1664, 2002.
Creed, I. F., Sanford, S. E., Beall, F. D., Molot, L. A., and Dillon, P. J.: Cryptic wetlands: integrating hidden wetlands in regression models of the export of dissolved organic carbon from forested landscapes, Hydrol. Process., 17, 3629–3648, https://doi.org/10.1002/hyp.1357, 2003.
Delany, A.: Modeled Organic Carbon, Dissolved Oxygen, and Secchi for six Wisconsin Lakes, 1995–2014, Environmental Data Initiative [data set, code], https://portal.edirepository.org/nis/mapbrowse?packageid=knb-lter-ntl.421.2 (last access: 7 December 2022), 2022.
Dordoni, M., Seewald, M., Rinke, K., Friese, K., van Geldern, R., Schmidmeier, J., and Barth, J. A. C.: Mineralization of autochthonous particulate organic carbon is a fast channel of organic matter turnover in Germany's largest drinking water reservoir, Biogeosciences, 19, 5343–5355, https://doi.org/10.5194/bg-19-5343-2022, 2022.
Evans, C. D., Monteith, D. T., and Cooper, D. M.: Long-term increases in surface water dissolved organic carbon: Observations, possible causes and environmental impacts, Environ. Pollut., 137, 55–71, https://doi.org/10.1016/j.envpol.2004.12.031, 2005.
Feng, L., Zhang, J., Fan, J., Wei, L., He, S., and Wu, H.: Tracing dissolved organic matter in inflowing rivers of Nansi Lake as a storage reservoir: Implications for water-quality control, Chemosphere, 286, 131624, https://doi.org/10.1016/j.chemosphere.2021.131624, 2022.
Goudsmit, G.-H., Burchard, H., Peeters, F., and Wüest, A.: Application of k-ϵ turbulence models to enclosed basins: The role of internal seiches: APPLICATION OF k-ϵ turbulence models, J. Geophys. Res., 107, 1–13, https://doi.org/10.1029/2001JC000954, 2002.
Hanson, P. C., Bade, D. L., Carpenter, S. R., and Kratz, T. K.: Lake metabolism: Relationships with dissolved organic carbon and phosphorus, Limnol. Oceanogr., 48, 1112–1119, https://doi.org/10.4319/lo.2003.48.3.1112, 2003.
Hanson, P. C., Pollard, A. I., Bade, D. L., Predick, K., Carpenter, S. R., and Foley, J. A.: A model of carbon evasion and sedimentation in temperate lakes: Landscape-lake carbon cycling model, Global Change Biol., 10, 1285–1298, https://doi.org/10.1111/j.1529-8817.2003.00805.x, 2004.
Hanson, P. C., Carpenter, S. R., Cardille, J. A., Coe, M. T., and Winslow, L. A.: Small lakes dominate a random sample of regional lake characteristics, Freshwater Biol, 52, 814–822, https://doi.org/10.1111/j.1365-2427.2007.01730.x, 2007.
Hanson, P. C., Hamilton, D. P., Stanley, E. H., Preston, N., Langman, O. C., and Kara, E. L.: Fate of Allochthonous Dissolved Organic Carbon in Lakes: A Quantitative Approach, PLoS ONE, 6, e21884, https://doi.org/10.1371/journal.pone.0021884, 2011.
Hanson, P. C., Buffam, I., Rusak, J. A., Stanley, E. H., and Watras, C.: Quantifying lake allochthonous organic carbon budgets using a simple equilibrium model, Limnol. Oceanogr., 59, 167–181, https://doi.org/10.4319/lo.2014.59.1.0167, 2014.
Hanson, P. C., Pace, M. L., Carpenter, S. R., Cole, J. J., and Stanley, E. H.: Integrating Landscape Carbon Cycling: Research Needs for Resolving Organic Carbon Budgets of Lakes, Ecosystems, 18, 363–375, https://doi.org/10.1007/s10021-014-9826-9, 2015.
Hanson, P. C., Stillman, A. B., Jia, X., Karpatne, A., Dugan, H. A., Carey, C. C., Stachelek, J., Ward, N. K., Zhang, Y., Read, J. S., and Kumar, V.: Predicting lake surface water phosphorus dynamics using process-guided machine learning, Ecol. Model., 430, 109136, https://doi.org/10.1016/j.ecolmodel.2020.109136, 2020.
Hart, J., Dugan, H., Carey, C., Stanley, E., and Hanson, P.: Lake Mendota Carbon and Greenhouse Gas Measurements at North Temperate Lakes LTER 2016, https://doi.org/10.6073/PASTA/170E5BA0ED09FE3D5837EF04C47E432E, 2019.
Hipsey, M. R.: Modelling Aquatic Eco-Dynamics: Overview of the AED modular simulation platform, Zenodo, https://doi.org/10.5281/ZENODO.6516222, 2022.
Hipsey, M. R., Bruce, L. C., Boon, C., Busch, B., Carey, C. C., Hamilton, D. P., Hanson, P. C., Read, J. S., de Sousa, E., Weber, M., and Winslow, L. A.: A General Lake Model (GLM 3.0) for linking with high-frequency sensor data from the Global Lake Ecological Observatory Network (GLEON), Geosci. Model Dev., 12, 473–523, https://doi.org/10.5194/gmd-12-473-2019, 2019.
Hoffman, A. R., Armstrong, D. E., and Lathrop, R. C.: Influence of phosphorus scavenging by iron in contrasting dimictic lakes, Can. J. Fish. Aquat. Sci., 70, 941–952, https://doi.org/10.1139/cjfas-2012-0391, 2013.
Hotchkiss, E. R., Sadro, S., and Hanson, P. C.: Toward a more integrative perspective on carbon metabolism across lentic and lotic inland waters, Limnol. Ocean. Lett, 3, 57–63, https://doi.org/10.1002/lol2.10081, 2018.
Houser, J. N., Bade, D. L., Cole, J. J., and Pace, M. L.: The dual influences of dissolved organic carbon on hypolimnetic metabolism: organic substrate and photosynthetic reduction, Biogeochemistry, 64, 247–269, https://doi.org/10.1023/A:1024933931691, 2003.
Hunt, R. J. and Walker, J. F.: 2016 Update to the GSFLOW groundwater-surface water model for the Trout Lake Watershed, https://doi.org/10.5066/F7M32SZ2, 2017.
Hunt, R. J., Walker, J. F., Selbig, W. R., Westenbroek, S. M., and Regan, R. S.: Simulation of Climate-Change Effects on Streamflow, Lake Water Budgets, and Stream Temperature Using GSFLOW and SNTEMP, Trout Lake Watershed, Wisconsin, United States Geological Survey, http://pubs.usgs.gov/sir/2013/5159/ (last access: 27 April 2022), 2013.
Jane, S. F., Hansen, G. J. A., Kraemer, B. M., Leavitt, P. R., Mincer, J. L., North, R. L., Pilla, R. M., Stetler, J. T., Williamson, C. E., Woolway, R. I., Arvola, L., Chandra, S., DeGasperi, C. L., Diemer, L., Dunalska, J., Erina, O., Flaim, G., Grossart, H.-P., Hambright, K. D., Hein, C., Hejzlar, J., Janus, L. L., Jenny, J.-P., Jones, J. R., Knoll, L. B., Leoni, B., Mackay, E., Matsuzaki, S.-I. S., McBride, C., Müller-Navarra, D. C., Paterson, A. M., Pierson, D., Rogora, M., Rusak, J. A., Sadro, S., Saulnier-Talbot, E., Schmid, M., Sommaruga, R., Thiery, W., Verburg, P., Weathers, K. C., Weyhenmeyer, G. A., Yokota, K., and Rose, K. C.: Widespread deoxygenation of temperate lakes, Nature, 594, 66–70, https://doi.org/10.1038/s41586-021-03550-y, 2021.
Jansson, M., Bergström, A.-K., Blomqvist, P., and Drakare, S.: Allochthonous organic carbon and phytoplankton/bacterioplankton production relationships in lakes, Ecology, 81, 3250–3255, https://doi.org/10.1890/0012-9658(2000)081[3250:AOCAPB]2.0.CO;2, 2000.
Jenny, J.-P., Francus, P., Normandeau, A., Lapointe, F., Perga, M.-E., Ojala, A., Schimmelmann, A., and Zolitschka, B.: Global spread of hypoxia in freshwater ecosystems during the last three centuries is caused by rising local human pressure, Global Change Biol., 22, 1481–1489, https://doi.org/10.1111/gcb.13193, 2016a.
Jenny, J.-P., Normandeau, A., Francus, P., Taranu, Z. E., Gregory-Eaves, I., Lapointe, F., Jautzy, J., Ojala, A. E. K., Dorioz, J.-M., Schimmelmann, A., and Zolitschka, B.: Urban point sources of nutrients were the leading cause for the historical spread of hypoxia across European lakes, P. Natl. Acad. Sci. USA, 113, 12655–12660, https://doi.org/10.1073/pnas.1605480113, 2016b.
Knoll, L. B., Williamson, C. E., Pilla, R. M., Leach, T. H., Brentrup, J. A., and Fisher, T. J.: Browning-related oxygen depletion in an oligotrophic lake, Inland Waters, 8, 255–263, https://doi.org/10.1080/20442041.2018.1452355, 2018.
Kraemer, B. M., Chandra, S., Dell, A. I., Dix, M., Kuusisto, E., Livingstone, D. M., Schladow, S. G., Silow, E., Sitoki, L. M., Tamatamah, R., and McIntyre, P. B.: Global patterns in lake ecosystem responses to warming based on the temperature dependence of metabolism, Glob Change Biol, 23, 1881–1890, https://doi.org/10.1111/gcb.13459, 2017.
Ladwig, R., Hanson, P. C., Dugan, H. A., Carey, C. C., Zhang, Y., Shu, L., Duffy, C. J., and Cobourn, K. M.: Lake thermal structure drives interannual variability in summer anoxia dynamics in a eutrophic lake over 37 years, Hydrol. Earth Syst. Sci., 25, 1009–1032, https://doi.org/10.5194/hess-25-1009-2021, 2021.
Lathrop, R. and Carpenter, S.: Water quality implications from three decades of phosphorus loads and trophic dynamics in the Yahara chain of lakes, Inland Waters, 4, 1–14, https://doi.org/10.5268/IW-4.1.680, 2014.
Lei, R., Leppäranta, M., Erm, A., Jaatinen, E., and Pärn, O.: Field investigations of apparent optical properties of ice cover in Finnish and Estonian lakes in winter 2009, Est. J. Earth Sci., 60, 50, https://doi.org/10.3176/earth.2011.1.05, 2011.
Livingstone, D. M. and Imboden, D. M.: The prediction of hypolimnetic oxygen profiles: a plea for a deductive approach, Can. J. Fish. Aquat. Sci., 53, 924–932, https://doi.org/10.1139/f95-230, 1996.
Loose, B. and Schlosser, P.: Sea ice and its effect on CO2 flux between the atmosphere and the Southern Ocean interior, J. Geophys. Res., 116, 2010JC006509, https://doi.org/10.1029/2010JC006509, 2011.
Lovett, G. M., Cole, J. J., and Pace, M. L.: Is Net Ecosystem Production Equal to Ecosystem Carbon Accumulation?, Ecosystems, 9, 152–155, https://doi.org/10.1007/s10021-005-0036-3, 2006.
Maerki, M., Müller, B., Dinkel, C., and Wehrli, B.: Mineralization pathways in lake sediments with different oxygen and organic carbon supply, Limnol. Oceanogr., 54, 428–438, https://doi.org/10.4319/lo.2009.54.2.0428, 2009.
Magee, M. R., McIntyre, P. B., Hanson, P. C., and Wu, C. H.: Drivers and Management Implications of Long-Term Cisco Oxythermal Habitat Decline in Lake Mendota, WI, Environ. Manage., 63, 396–407, https://doi.org/10.1007/s00267-018-01134-7, 2019.
Magnuson, J., Carpenter, S., and Stanley, E.: North Temperate Lakes LTER: Chemical Limnology of Primary Study Lakes: Nutrients, pH and Carbon 1981–current, https://portal.edirepository.org/nis/mapbrowse?packageid=knb-lter-ntl.1.52 (last access: 28 April 2022), 2020.
Magnuson, J. J., Benson, B. J., and Kratz, T. K.: Long-term dynamics of lakes in the landscape: long-term ecological research on north temperate lakes, Oxford University Press on Demand, ISBN 9780195136906, 2006.
Magnuson, J. J., Carpenter, S. R., and Stanley, E. H.: North Temperate Lakes LTER: Physical Limnology of Primary Study Lakes 1981–current, https://portal.edirepository.org/nis/mapbrowse?packageid=knb-lter-ntl.29.30 (last access: 28 April 2022), 2022.
McClure, R. P., Lofton, M. E., Chen, S., Krueger, K. M., Little, J. C., and Carey, C. C.: The Magnitude and Drivers of Methane Ebullition and Diffusion Vary on a Longitudinal Gradient in a Small Freshwater Reservoir, J. Geophys. Res.-Biogeo., 125, https://doi.org/10.1029/2019JG005205, 2020.
McCullough, I. M., Dugan, H. A., Farrell, K. J., Morales-Williams, A. M., Ouyang, Z., Roberts, D., Scordo, F., Bartlett, S. L., Burke, S. M., Doubek, J. P., Krivak-Tetley, F. E., Skaff, N. K., Summers, J. C., Weathers, K. C., and Hanson, P. C.: Dynamic modeling of organic carbon fates in lake ecosystems, Ecol. Model., 386, 71–82, https://doi.org/10.1016/j.ecolmodel.2018.08.009, 2018.
Mi, C., Shatwell, T., Ma, J., Wentzky, V. C., Boehrer, B., Xu, Y., and Rinke, K.: The formation of a metalimnetic oxygen minimum exemplifies how ecosystem dynamics shape biogeochemical processes: A modelling study, Water Res., 175, 115701, https://doi.org/10.1016/j.watres.2020.115701, 2020.
Morris, M. D.: Factorial Sampling Plans for Preliminary Computational Experiments, Technometrics, 33, 161–174, https://doi.org/10.1080/00401706.1991.10484804, 1991.
Müller, B., Bryant, L. D., Matzinger, A., and Wüest, A.: Hypolimnetic Oxygen Depletion in Eutrophic Lakes, Environ. Sci. Technol., 46, 9964–9971, https://doi.org/10.1021/es301422r, 2012.
Nürnberg, G. K.: Quantifying anoxia in lakes, Limnol. Oceanogr., 40, 1100–1111, https://doi.org/10.4319/lo.1995.40.6.1100, 1995.
Nürnberg, G. K.: Quantified Hypoxia and Anoxia in Lakes and Reservoirs, Sci. World J., 4, 42–54, https://doi.org/10.1100/tsw.2004.5, 2004.
Odum, H. T.: Primary Production in Flowing Waters, Limnol. Oceanogr., 1, 102–117, https://doi.org/10.4319/lo.1956.1.2.0102, 1956.
Platt, T., Gallegos, C., and Harrison, W.: Photoinhibition of photosynthesis in natural assemblages of marine phytoplankton, J. Mar. Res., 38, 687–701, 1980.
Prairie, Y. T., Bird, D. F., and Cole, J. J.: The summer metabolic balance in the epilimnion of southeastern Quebec lakes, Limnol. Oceanogr., 47, 316–321, https://doi.org/10.4319/lo.2002.47.1.0316, 2002.
Qu, Y. and Duffy, C. J.: A semidiscrete finite volume formulation for multiprocess watershed simulation: Multiprocess watershed simulation, Water Resour. Res., 43, W08419, https://doi.org/10.1029/2006WR005752, 2007.
Rautio, M., Mariash, H., and Forsström, L.: Seasonal shifts between autochthonous and allochthonous carbon contributions to zooplankton diets in a subarctic lake, Limnol. Oceanogr., 56, 1513–1524, https://doi.org/10.4319/lo.2011.56.4.1513, 2011.
Read, E. K., Ivancic, M., Hanson, P., Cade-Menun, B. J., and McMahon, K. D.: Phosphorus speciation in a eutrophic lake by 31P NMR spectroscopy, Water Res., 62, 229–240, https://doi.org/10.1016/j.watres.2014.06.005, 2014.
Read, J. S., Hamilton, D. P., Jones, I. D., Muraoka, K., Winslow, L. A., Kroiss, R., Wu, C. H., and Gaiser, E.: Derivation of lake mixing and stratification indices from high-resolution lake buoy data, Environ. Model. Softw., 26, 1325–1336, https://doi.org/10.1016/j.envsoft.2011.05.006, 2011.
Read, J. S., Zwart, J. A., Kundel, H., Corson-Dosch, H. R., Hansen, G. J. A., Vitense, K., Appling, A. P., Oliver, S. K., and Platt, L.: Data release: Process-based predictions of lake water temperature in the Midwest US, https://doi.org/10.5066/P9CA6XP8, 2021.
Reynolds, C. S., Oliver, R. L., and Walsby, A. E.: Cyanobacterial dominance: The role of buoyancy regulation in dynamic lake environments, New Zeal. J. Mar. Fresh., 21, 379–390, https://doi.org/10.1080/00288330.1987.9516234, 1987.
Rhodes, J., Hetzenauer, H., Frassl, M. A., Rothhaupt, K.-O., and Rinke, K.: Long-term development of hypolimnetic oxygen depletion rates in the large Lake Constance, Ambio, 46, 554–565, https://doi.org/10.1007/s13280-017-0896-8, 2017.
Richardson, D. C., Carey, C. C., Bruesewitz, D. A., and Weathers, K. C.: Intra- and inter-annual variability in metabolism in an oligotrophic lake, Aquat. Sci., 79, 319–333, https://doi.org/10.1007/s00027-016-0499-7, 2017.
Rippey, B. and McSorley, C.: Oxygen depletion in lake hypolimnia, Limnol. Oceanogr., 54, 905–916, https://doi.org/10.4319/lo.2009.54.3.0905, 2009.
Schindler, D. W., Carpenter, S. R., Chapra, S. C., Hecky, R. E., and Orihel, D. M.: Reducing Phosphorus to Curb Lake Eutrophication is a Success, Environ. Sci. Technol., 50, 8923–8929, https://doi.org/10.1021/acs.est.6b02204, 2016.
Snortheim, C. A., Hanson, P. C., McMahon, K. D., Read, J. S., Carey, C. C., and Dugan, H. A.: Meteorological drivers of hypolimnetic anoxia in a eutrophic, north temperate lake, Ecol. Model., 343, 39–53, https://doi.org/10.1016/j.ecolmodel.2016.10.014, 2017.
Sobek, S., Tranvik, L. J., Prairie, Y. T., Kortelainen, P., and Cole, J. J.: Patterns and regulation of dissolved organic carbon: An analysis of 7500 widely distributed lakes, Limnol. Oceanogr., 52, 1208–1219, https://doi.org/10.4319/lo.2007.52.3.1208, 2007.
Soetaert, K. and Petzoldt, T.: Inverse Modelling, Sensitivity and Monte Carlo Analysis in R Using Package FME, J. Stat. Soft., 33, 1–28, https://doi.org/10.18637/jss.v033.i03, 2010.
Solomon, C. T., Bruesewitz, D. A., Richardson, D. C., Rose, K. C., Van De Bogert, M. C., Hanson, P. C., Kratz, T. K., Larget, B., Adrian, R., Babin, B. L., Chiu, C.-Y., Hamilton, D. P., Gaiser, E. E., Hendricks, S., Istvànovics, V., Laas, A., O'Donnell, D. M., Pace, M. L., Ryder, E., Staehr, P. A., Torgersen, T., Vanni, M. J., Weathers, K. C., and Zhu, G.: Ecosystem respiration: Drivers of daily variability and background respiration in lakes around the globe, Limnol. Oceanogr., 58, 849–866, https://doi.org/10.4319/lo.2013.58.3.0849, 2013.
Solomon, C. T., Jones, S. E., Weidel, B. C., Buffam, I., Fork, M. L., Karlsson, J., Larsen, S., Lennon, J. T., Read, J. S., Sadro, S., and Saros, J. E.: Ecosystem Consequences of Changing Inputs of Terrestrial Dissolved Organic Matter to Lakes: Current Knowledge and Future Challenges, Ecosystems, 18, 376–389, https://doi.org/10.1007/s10021-015-9848-y, 2015.
Soranno, P. A., Carpenter, S. R., and Lathrop, R. C.: Internal phosphorus loading in Lake Mendota: response to external loads and weather, Can. J. Fish. Aquat. Sci., 54, 1883–1893, https://doi.org/10.1139/f97-095, 1997.
Staehr, P. A., Bade, D., Van de Bogert, M. C., Koch, G. R., Williamson, C., Hanson, P., Cole, J. J., and Kratz, T.: Lake metabolism and the diel oxygen technique: State of the science: Guideline for lake metabolism studies, Limnol. Oceanogr.-Meth., 8, 628–644, https://doi.org/10.4319/lom.2010.8.0628, 2010.
Steinsberger, T., Schwefel, R., Wüest, A., and Müller, B.: Hypolimnetic oxygen depletion rates in deep lakes: Effects of trophic state and organic matter accumulation, Limnol. Oceanogr., 65, 3128–3138, https://doi.org/10.1002/lno.11578, 2020.
Thorp, J. H. and Delong, M. D.: Dominance of autochthonous autotrophic carbon in food webs of heterotrophic rivers, Oikos, 96, 543–550, https://doi.org/10.1034/j.1600-0706.2002.960315.x, 2002.
Toming, K., Kotta, J., Uuemaa, E., Sobek, S., Kutser, T., and Tranvik, L. J.: Predicting lake dissolved organic carbon at a global scale, Sci. Rep., 10, 8471, https://doi.org/10.1038/s41598-020-65010-3, 2020.
Tranvik, L. J.: Degradation of Dissolved Organic Matter in Humic Waters by Bacteria, in: Aquatic Humic Substances, vol. 133, edited by: Hessen, D. O. and Tranvik, L. J., Springer Berlin Heidelberg, Berlin, Heidelberg, 259–283, https://doi.org/10.1007/978-3-662-03736-2_11, 1998.
Webster, K. E., Kratz, T. K., Bowser, C. J., Magnuson, J. J., and Rose, W. J.: The influence of landscape position on lake chemical responses to drought in northern Wisconsin, Limnol. Oceanogr., 41, 977–984, https://doi.org/10.4319/lo.1996.41.5.0977, 1996.
Wilkinson, G. M., Pace, M. L., and Cole, J. J.: Terrestrial dominance of organic matter in north temperate lakes: ORGANIC MATTER COMPOSITION IN LAKES, Global Biogeochem. Cy., 27, 43–51, https://doi.org/10.1029/2012GB004453, 2013.
Williamson, C. E., Dodds, W., Kratz, T. K., and Palmer, M. A.: Lakes and streams as sentinels of environmental change in terrestrial and atmospheric processes, Front. Ecol. Environ., 6, 247–254, https://doi.org/10.1890/070140, 2008.
Winslow, L. A., Zwart, J. A., Batt, R. D., Dugan, H. A., Woolway, R. I., Corman, J. R., Hanson, P. C., and Read, J. S.: LakeMetabolizer: an R package for estimating lake metabolism from free-water oxygen using diverse statistical models, Inland Waters, 6, 622–636, https://doi.org/10.1080/IW-6.4.883, 2016.