the Creative Commons Attribution 4.0 License.
the Creative Commons Attribution 4.0 License.
 | 06 Feb 2023
Technical note: Novel estimates of the leaf relative uptake rate of carbonyl sulfide from optimality theory
Georg Wohlfahrt
Albin Hammerle
Felix M. Spielmann
Florian Kitz
Chuixiang Yi
In order to estimate the gross primary productivity (GPP) of terrestrial ecosystems from the canopy uptake of carbonyl sulfide (COS), leaf relative uptake rate (LRU) of COS with respect to carbon dioxide needs to be known a priori. Currently, the variability of LRU between plant species in different biomes of the world is poorly understood, making the choice of an appropriate LRU uncertain and hampering further progress towards developing COS as a tracer of GPP. Here we propose a novel approach for estimating light-saturated LRU based on plant optimality principles, validate it against in situ leaf gas exchange measurements and provide global monthly climatological estimates. The global vegetation season average simulated LRUs fall into the 95 % range of 0.68–1.58 and are thus lower than most other published global estimates. We advocate for these LRU estimates to be adopted by global modellers in order to test to what degree these are compatible with our current understanding of the sources and sinks in the global COS budget.
- Article
(3109 KB) - Full-text XML
-
Supplement
(478 KB) - BibTeX
- EndNote


The gross primary productivity (GPP) is a key conceptual term in the ecosystem carbon cycle; however it cannot be directly measured at ecosystem scale, requiring the application of indirect approaches based on the combination of proxy measurements and modelling (Wohlfahrt and Gu, 2015). During the last decade, carbonyl sulfide (COS) has emerged as a promising proxy for GPP, based on the observation that COS co-diffuses into plant leaves together with carbon dioxide (CO2) during photosynthesis, but in contrast to the latter is not re-emitted (Sandoval-Soto et al., 2005).
The leaf relative uptake rate of COS with respect to CO2, abbreviated as LRU, is instrumental to using COS as a proxy for GPP (Wohlfahrt et al., 2012). LRU is the dimensionless ratio of the deposition velocities, which is the flux (F; and ) normalized by the ambient (subscript a) mole fraction (C), of COS (superscript s; pmol mol−1) with respect to CO2 (superscript c; µmol mol−1):
Assuming negligible daytime mitochondrial leaf respiration (or accounting for it) allows for replacing Fc with GPP, and, provided LRU is known, rearrangement of Eq. (1) then yields a framework for estimating GPP based on measurements of , and Fs (Campbell et al., 2008):
Initial studies on LRU suggested its value to gravitate to ca. 1.6 (Stimler et al., 2011, 2010; Berkelhammer et al., 2014), a value which was successfully used by Asaf et al. (2013) in the first ever study that estimated ecosystem-scale GPP from corresponding COS flux measurements. The most recent review of published LRU values (Whelan et al., 2018) however indicates that even though the median LRU amounts to 1.68, 95 % of the values fall into the range of 0.7–6.2, which is consistent with theoretical back-of-the-envelope calculations by Wohlfahrt et al. (2012). Here it should be noted that some of the higher values may result from measurements under low, non-saturating light conditions, which are known to cause LRU to increase (Kooijmans et al., 2019). More recently, two field studies (Kooijmans et al., 2019; Sun et al., 2018) reported values around 1 under high incident photosynthetically active radiation (PAR).
Replacing the flux terms in Eq. (1) with the underlying Fick's diffusion equations (see Seibt et al., 2010, for a derivation) yields Eq. (3), which allows for an assessment of the drivers underlying LRU:
where and represent the stomatal and internal, respectively, conductances to COS (); is the CO2 mole fraction in the leaf intercellular space (µmol mol−1); and the factor 1.21 converts the stomatal conductance to COS to its CO2 counterpart. Note that the boundary layer conductances for COS and CO2 have been assumed to be infinite here, as is typically the case in vigorously ventilated leaf chambers (Seibt et al., 2010). Equation (3) shows LRU to depend on two dimensionless ratios: (i) the stomatal-to-internal conductance to COS and (ii) the internal-to-ambient CO2 mole fraction ratio. While the magnitude and drivers of are poorly understood, and the ratio are well known to vary over short timescales in response to diel changes in environmental drivers, as well as along large-scale bioclimatic gradients (Lloyd and Farquhar, 1994). With regard to the former, recent work by Kohonen et al. (2022) and Sun et al. (2022) demonstrated that contrasting leaf gas exchange theories are able to reproduce and explain the observed short-term response of LRU to key drivers such as incident PAR or the vapour pressure deficit (VPD).
In contrast, variability in LRU between biomes is poorly understood, partially due to a scarcity of measurements (Whelan et al., 2018) and the lack of a suitable theoretical framework to predict LRU a priori, and the motivation for this work is thus to propose and apply a new theoretical approach for estimating large-scale bioclimatic patterns of LRU. To this end we make use of recent developments in plant optimality theory (Harrison et al., 2021).
2.1 Model theory
Here we use the P model as described by Mengoli et al. (2022) and refer to this paper and references cited therein for further details. Briefly, the model, applicable only to C3 plant species, is based on the combination of two optimality hypotheses – the least-cost and the coordination hypotheses. The least-cost hypothesis (Prentice et al., 2014) assumes that plants balance the carbon costs (per unit of photosynthesis) of maintaining the transpiration stream with those required for maintaining the carboxylation capacity and yields a ratio under which this balance is optimally realized:
Here Γ∗ represents the CO2 compensation point (Pa) in the absence of mitochondrial respiration, D the VPD (Pa), Km the effective Michaelis–Menten coefficient of RUBISCO (Pa), η∗ the dimensionless ratio of the viscosity of water at a given temperature to that at 25 ∘C and β a calibrated constant representing the ratio of the two cost terms. Wang et al. (2017b) calibrated β to a value of 146; based on their Table 1 we estimate a standard deviation for β of ±18. ξ (Pa0.5) represents the VPD response of the ratio. Equation (4) has been successfully validated against global ratios derived from C13 isotope data by Wang et al. (2017b).
The coordination hypothesis (Maire et al., 2012) assumes that plants coordinate the investment of resources into electron transport and carboxylation capacity in a way such that photosynthesis, under average environmental conditions, is co-limited by the two and yields optimal values of the maximum carboxylation rate (VCmax; ) and the maximum electron transport rate (Jmax; ):
Here φo stands for the intrinsic quantum efficiency of photosynthesis (mol mol−1), I represents absorbed PAR () and c∗ is a calibrated (0.41) dimensionless cost factor for electron transport. VCmax was successfully validated against corresponding leaf gas exchange measurements by Smith et al. (2019).
Usually, absorbed PAR in Eq. (7) is derived by multiplying the incident PAR with the (satellite-derived) fraction of absorbed PAR (fAPAR) as a simple means of leaf-to-canopy scaling (Stocker et al., 2020). Here, in order to compare to the available LRU studies and in order to avoid the complexities of leaf-to-canopy scaling, the main interest is in the leaf scale, and the P model was thus driven by incident PAR (leaf absorptance of PAR is included in the value of φo). Model simulations can thus be thought to represent leaves at the top of the plant canopy.
VCmax and Jmax, together with the optimal ratio, allow for estimating GPP via the familiar FvCB photosynthesis model (Farquhar et al., 1980) and applying Fick's law in turn yields and thus . Finally, is obtained by scaling it to VCmax, as first proposed by Berry et al. (2013):
The parameter α was calibrated to for C3 species by Berry et al. (2013); here we use the more recent value of ± derived by Kooijmans et al. (2021) through calibration of the SiB4 model against ecosystem-scale flux observations. Together, Eqs. (4)–(8) with the five environmental inputs temperature, VPD, PAR, and air pressure allow for calculating the LRU via Eq. (3).
The optimality implied in the P model is likely to operate on multi-day to weekly timescales, as plants acclimate to the prevailing environmental conditions. Mengoli et al. (2022) thus devised an approach in which optimal (acclimated) values of ξ, VCmax and Jmax are calculated as running averages over a defined antecedent period. They show that a 15 d moving average over midday hours produces the best correspondence with empirical GPP derived from eddy covariance CO2 flux measurements. We follow their approach, but recognize that this may cause a bias in situations when the peak of GPP occurs outside of this time window, e.g. in the case of drought stress. For short-term, e.g. hourly, simulations, the acclimated values are then adjusted to the current environmental conditions on the basis of which instantaneous values of GPP, and the ratio are finally calculated.
2.2 Data and model application
For validation we retrieved the datasets underlying the work by Kooijmans et al. (2019) and Sun et al. (2018) from the associated data repositories. Kooijmans et al. (2019) investigated the leaf-scale COS exchange of Scots pine (Pinus sylvestris) at the study site Hyytiälä in Finland ( N, E) using two independent chambers, while Sun et al. (2018) studied the leaf-scale COS exchange of broadleaf cattail (Typha latifolia) at the San Joaquin freshwater marsh site in California, USA ( N, W). The major environmental difference between both studies is air temperature, which was ca. 7 and 22 ∘C during the study period of Kooijmans et al. (2019) and Sun et al. (2018), respectively. The latter dataset did not include air pressure, which was inferred from elevation using the equation implemented in the P model (Wang et al., 2017a). Given that the large-scale bioclimatic patterns of LRU, rather than its short-term variability, are the central interest of this paper, all model output was filtered for in order to assure light saturation. Validation statistics include the mean bias error (MBE), the root mean square error (RMSE) and the coefficient of determination (R2).
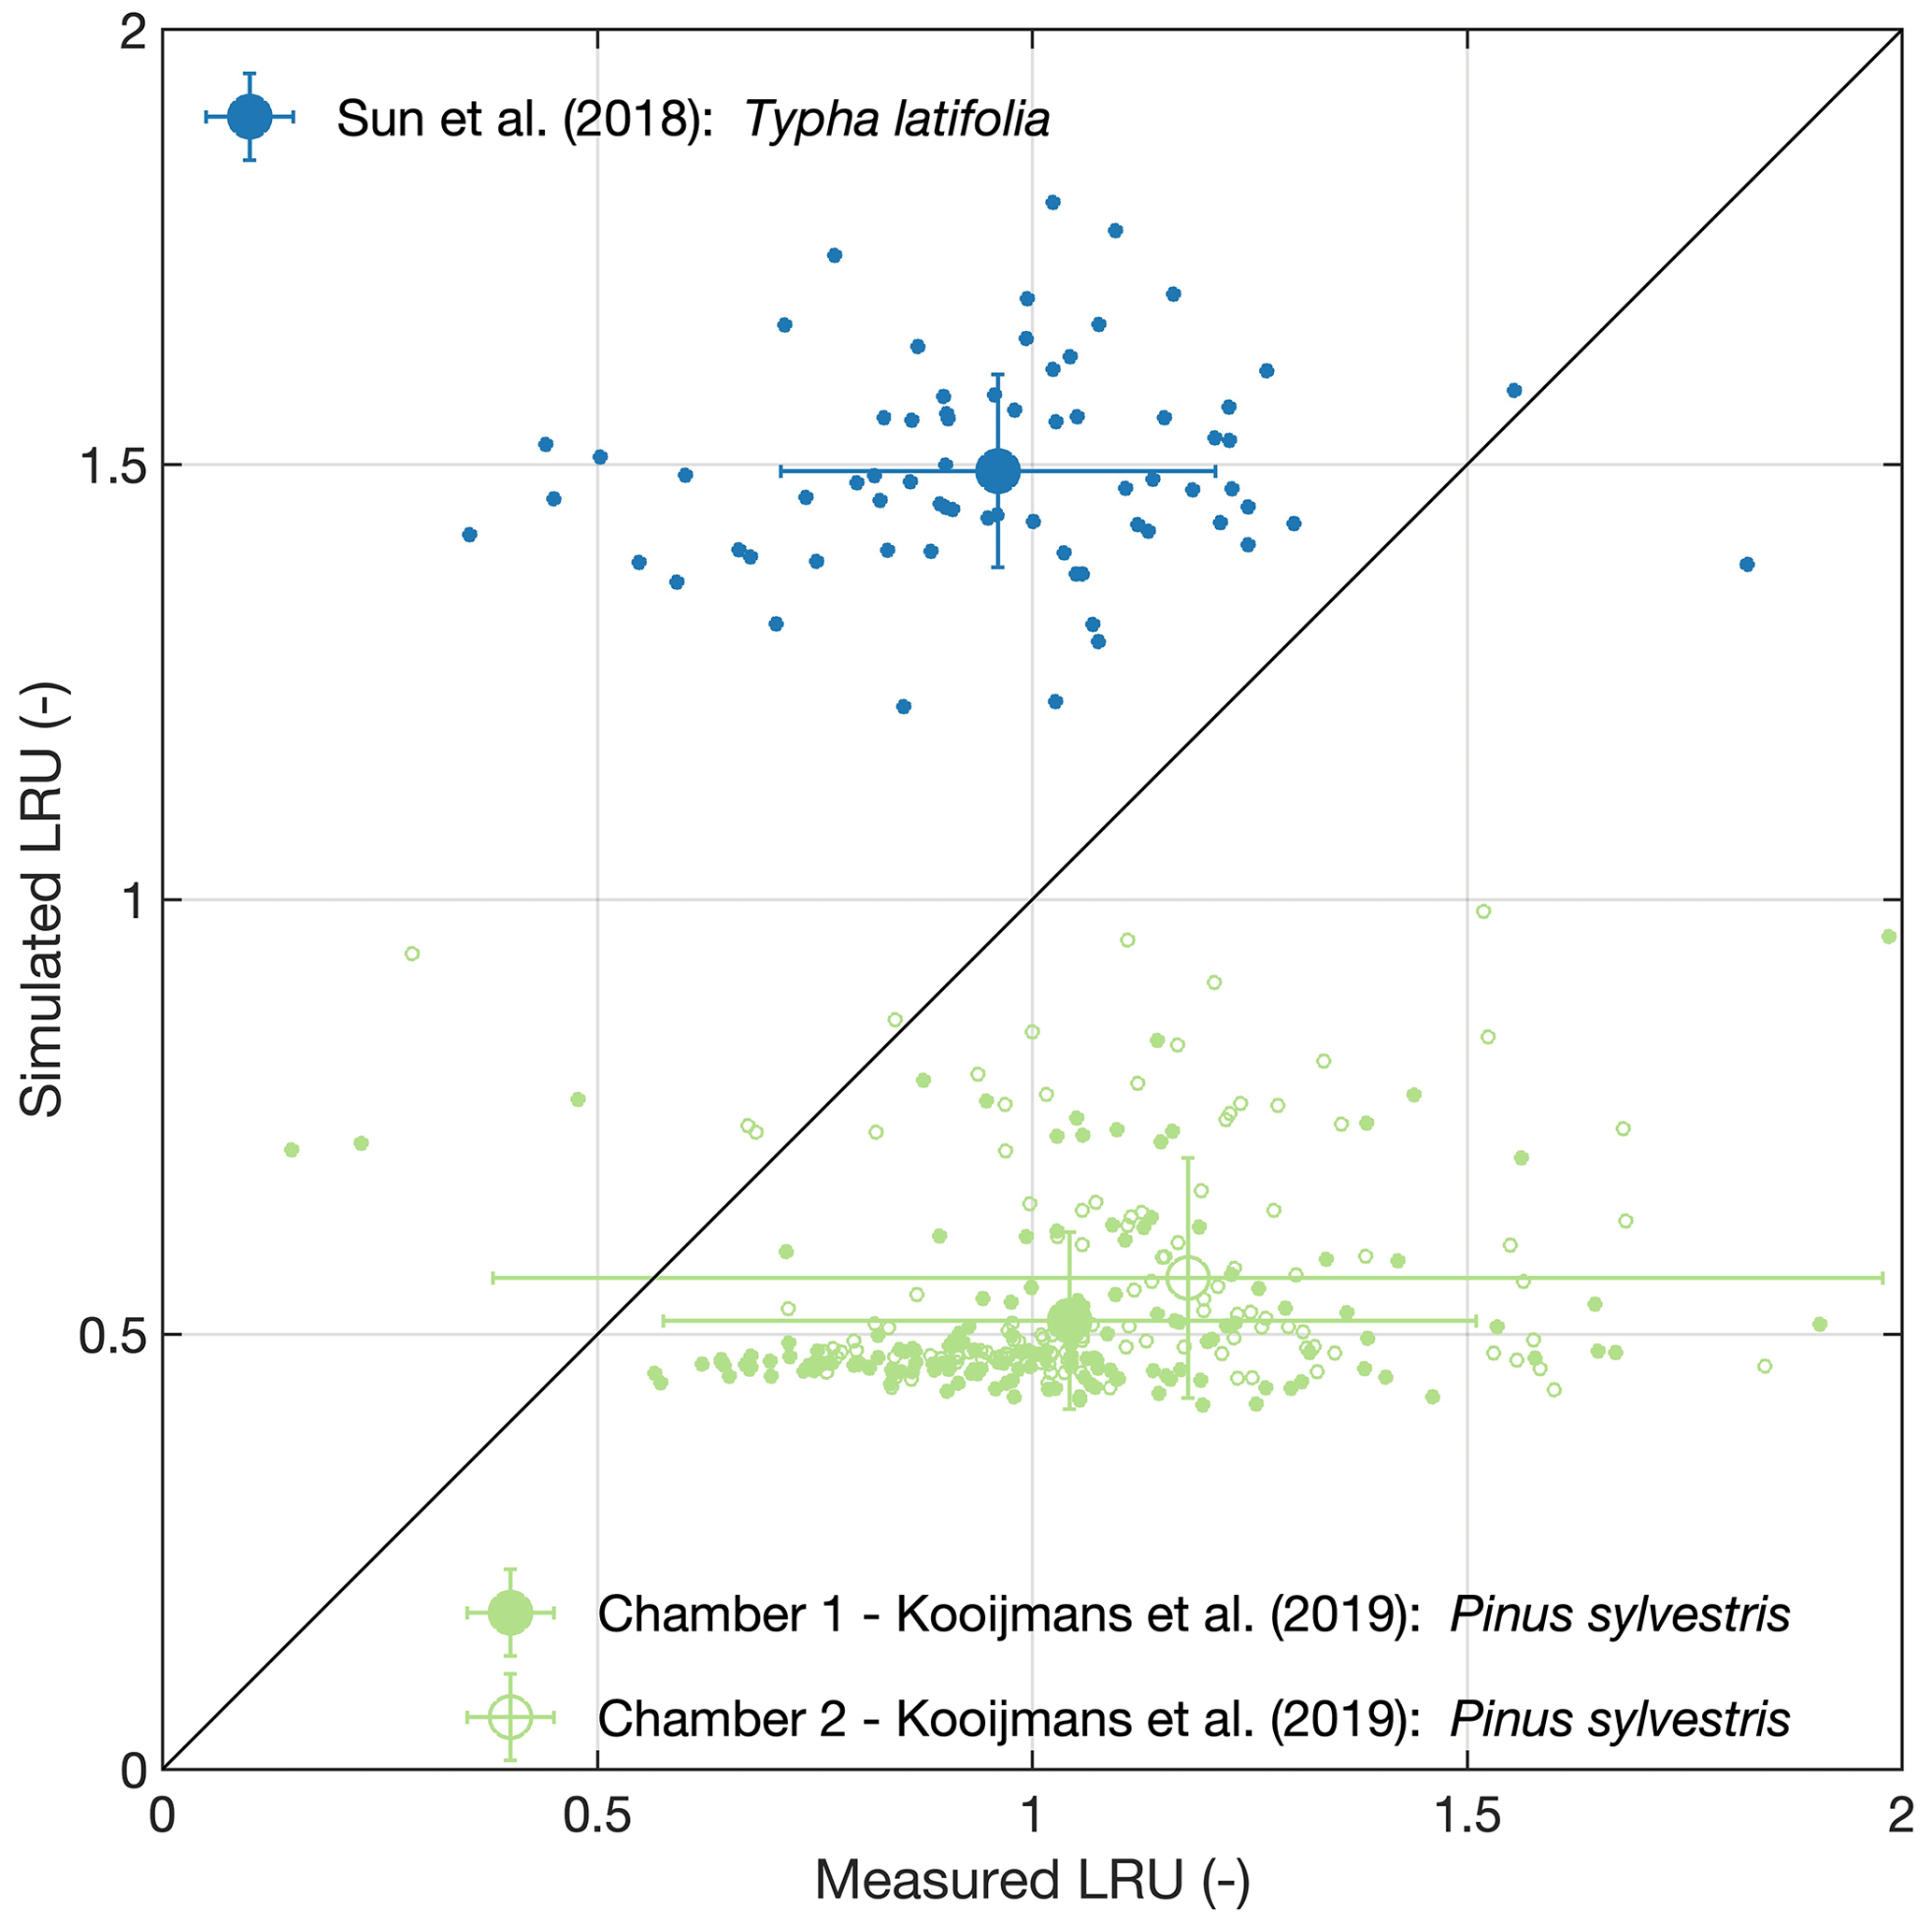
Figure 1Model validation. Large symbols and error bars represent means and their standard deviations, respectively, while small symbols refer to raw data.
For application at a global scale, we calculated monthly climatologies of all inputs for the period 2001–2010 at a 0.05∘ resolution, assuming that plants would fully acclimate to the environmental conditions at this timescale. By virtue of the coordination hypothesis (Maire et al., 2012), photosynthesis under these conditions is assumed to be co-limited by electron transport and the activity of RUBISCO and thus light-saturated. Air temperature and VPD were taken from the Chelsea repository (version 2.1; Karger et al., 2018, 2017), incident PAR from Ryu et al. (2018), ambient CO2 mole fractions from Cheng et al. (2022) and pressure was derived from a global digital elevation model included in the Chelsea repository using the equation implemented in the P model (Wang et al., 2017a).
LRU calculated with the P model is sensitive to two calibrated parameters, α and β in Eqs. (5) and (8), respectively. A sensitivity analysis was carried out by independently changing their default values (see above) by ± 1 standard deviation (see above) and averaging the resulting absolute differences to LRU calculated with the default value. The simulated LRU is not sensitive to c∗, the dimensionless cost factor for electron transport, which affects both VCmax and Jmax through Eqs. (6) and (7). Changes in these two parameters propagate to ; however, because the changes in VCmax and are proportional, the ratio of to and thus LRU (Eq. 3) are unaffected by changes in c∗.
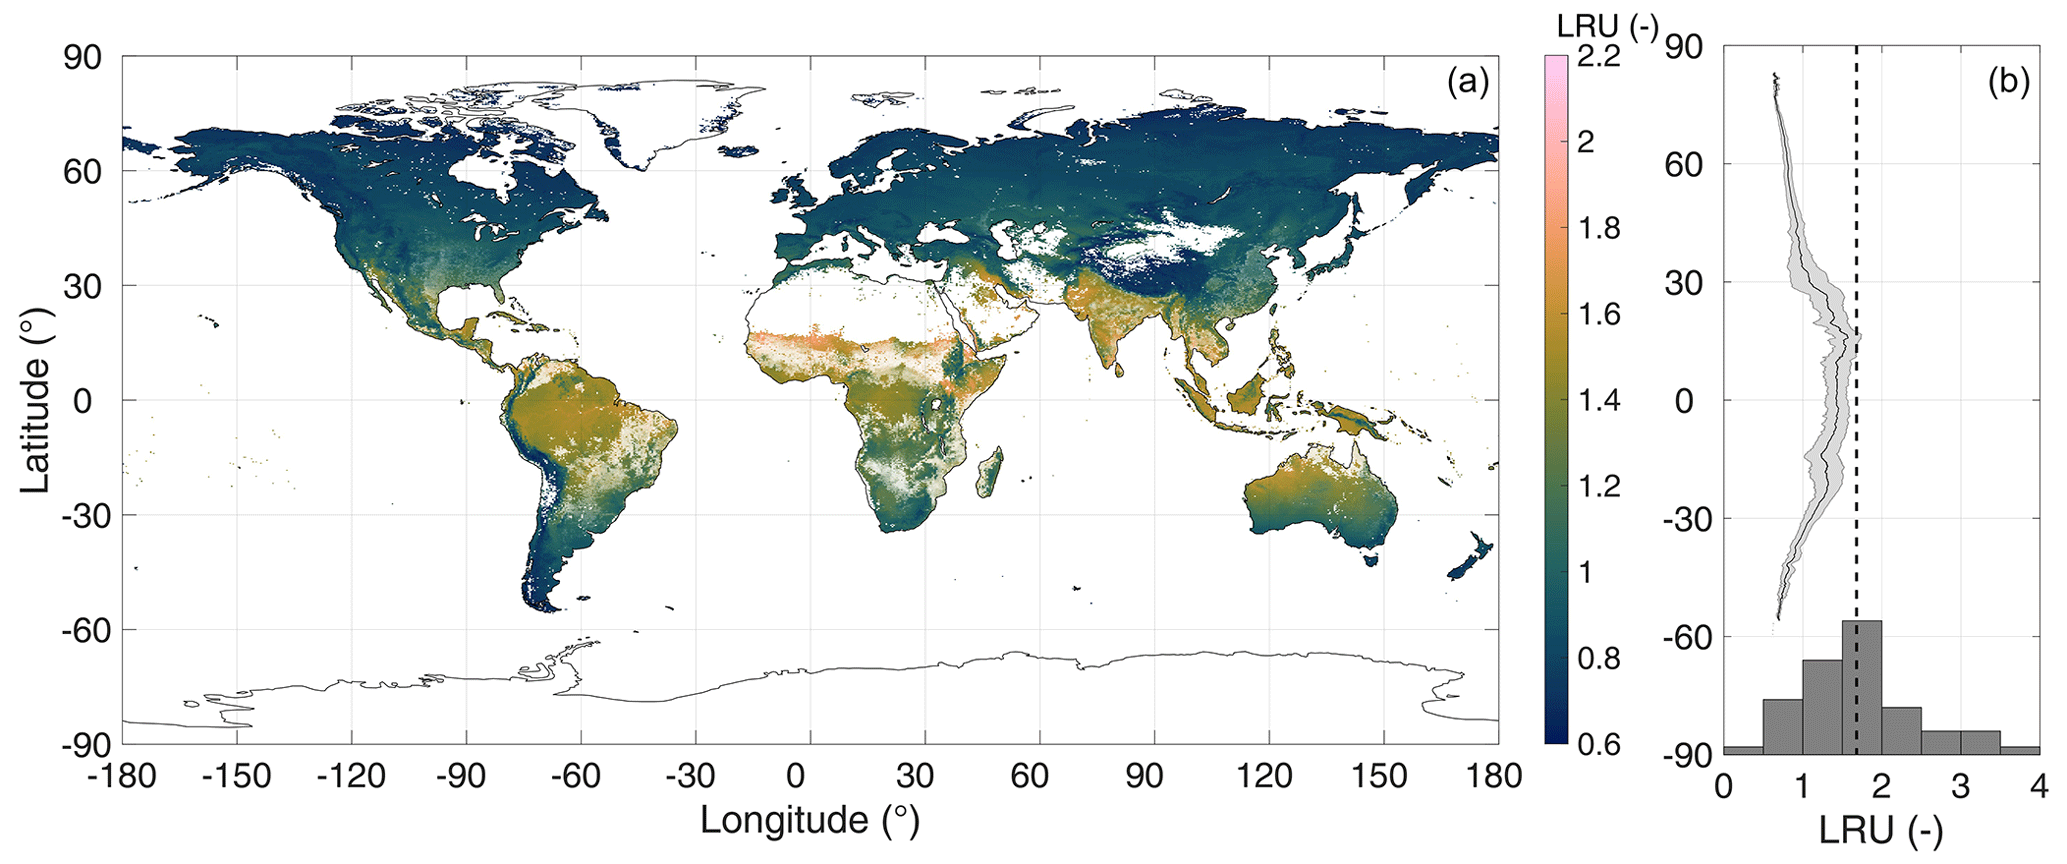
Figure 2Simulated growing season (monthly average air temperature above 0 ∘C) average global LRU (a) and longitudinal averages (b). The C4 plant cover fraction is indicated by the transparency level of the colour coding. In (b), the solid line and the shaded area represent longitudinal means and their standard deviations, respectively, omitting pixels where the C4 plant cover fraction exceeds 50 %. The histogram in (b) shows the data of C3 species from Fig. 2 in Whelan et al. (2018, omitting four data points with LRU>4); the dashed line represents the median (1.68) LRU of C3 species from Whelan et al. (2018).
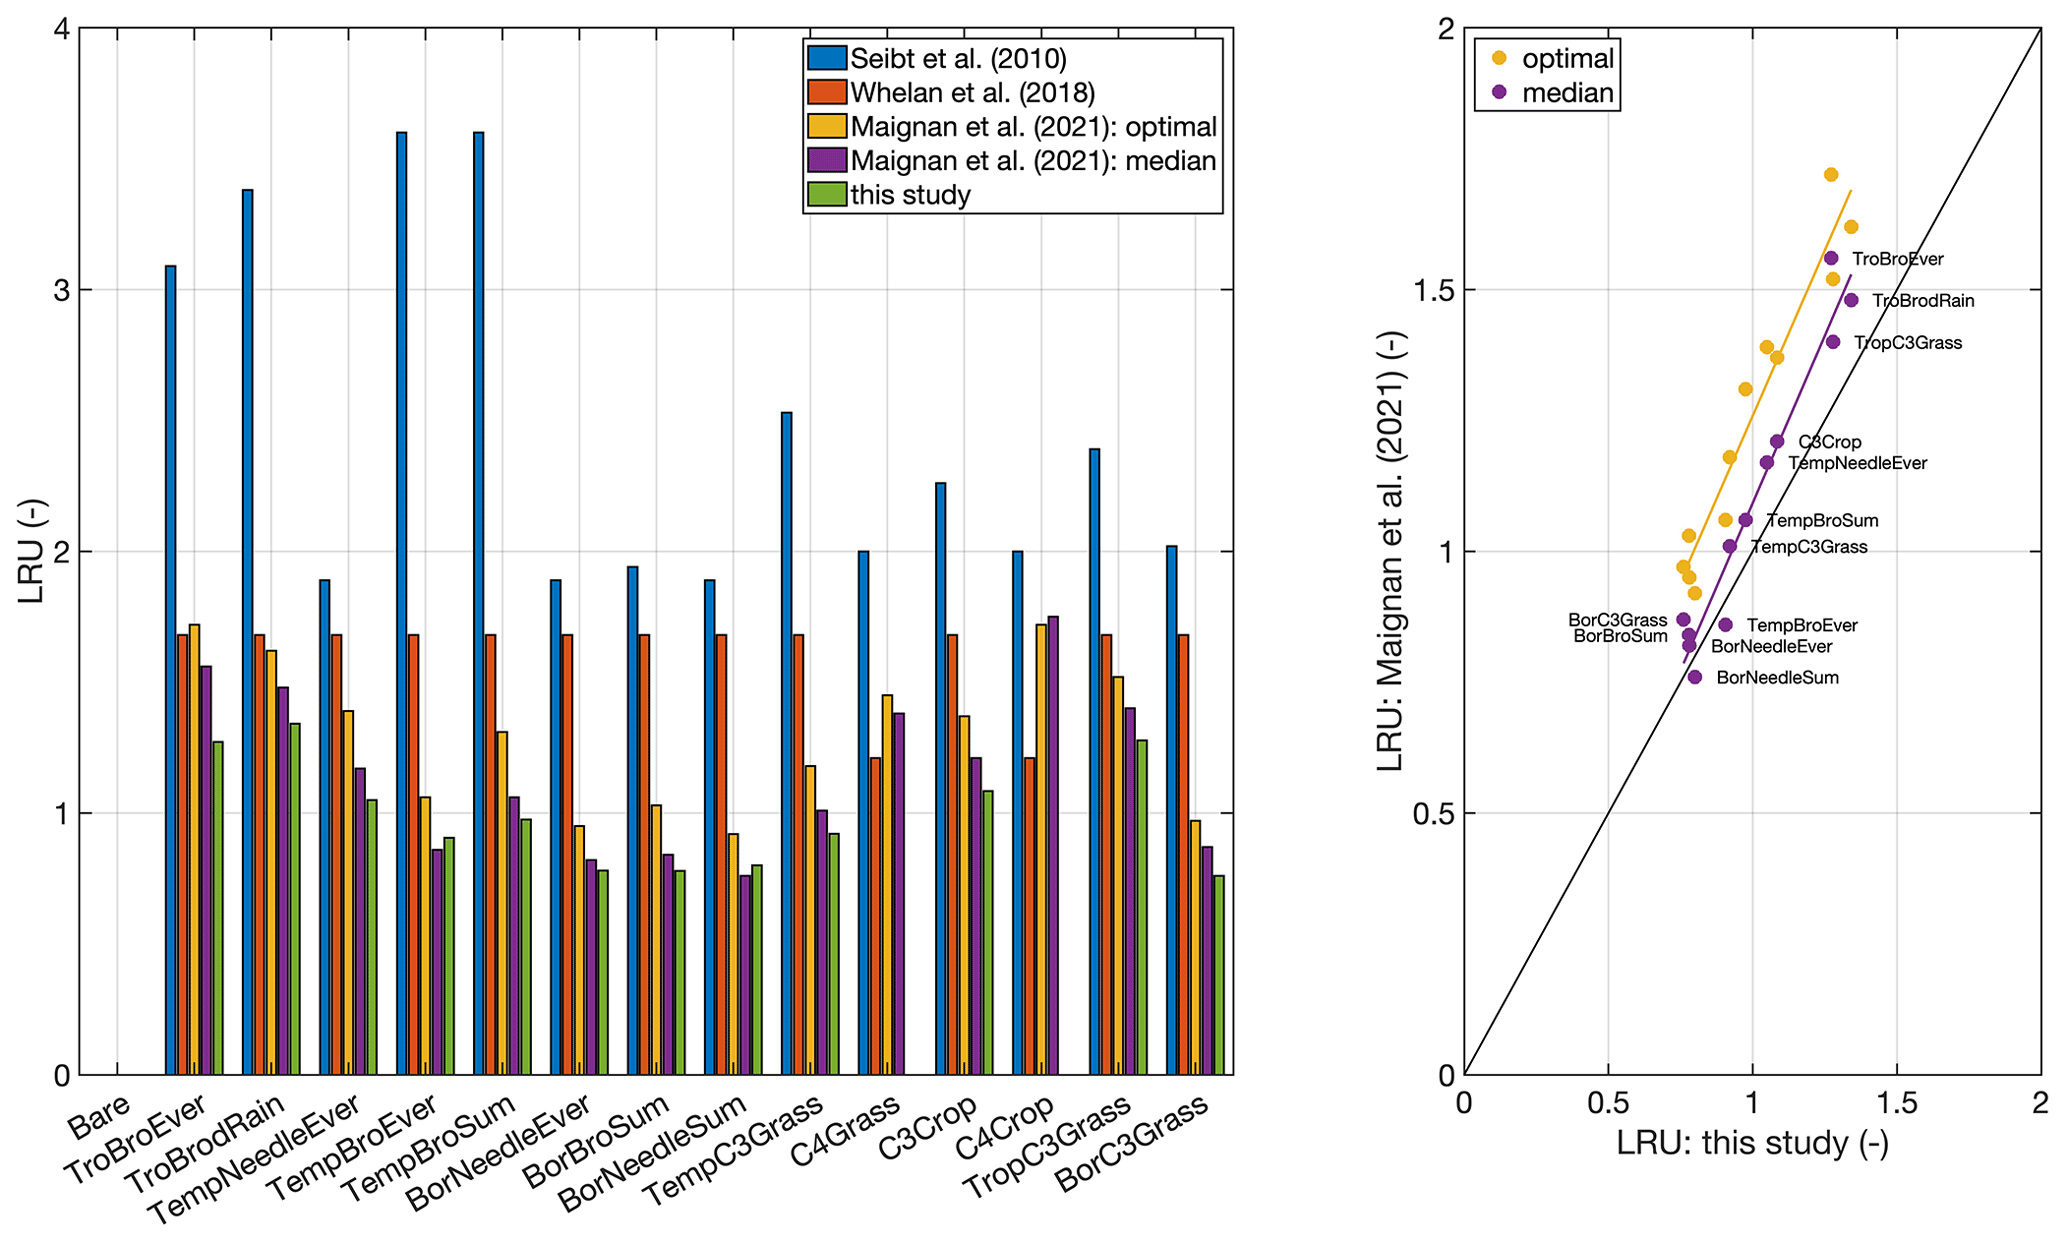
Figure 3Comparison to published global LRU values averaged by plant functional type. Published LRU values were taken from Table 1 in Maignan et al. (2021). The plant functional type classification corresponds to the one used in the ORCHIDEE model (Krinner et al., 2005). No values are given for the C4 grass and crop plant functional types, since the model is applicable to C3 species only. The right panel shows a scatter plot of LRUs from this study and the two versions reported by Maignan et al. (2021).
As shown in Fig. 1, Eq. (3) fed with inputs from the P model overestimates LRU of Typha latifolia (MBE: 0.53, RMSE: 0.59), while LRU of Pinus sylvestris is underestimated (MBE: −0.54 and −0.64 for chamber no. 1 and no. 2, respectively; RMSE: 0.72 and 1.03 for chamber no. 1 and no. 2, respectively). The model also underestimates the variability in measured LRU, resulting in poor R2 values (Typha latifolia: 0.01, Pinus sylvestris: 0.03 and 0.11 for chamber no. 1 and no. 2, respectively). While the P model, or its predecessors, has been successfully validated in terms of the ratio and VCmax (Smith et al., 2019; Wang et al., 2017b), validation of LRU thus remains inconclusive and points to the urgent need for more in situ leaf gas exchange measurements from the major biomes of the world in order to truly understand to what degree the model is capable of reproducing the global patterns of LRU.
In order to exemplify the application of the model at a global scale, Fig. 2 shows a global map of the growing-season-averaged LRU. Simulated LRUs, exclusive of pixels with a C4 fractional cover >50 %, reach low values around 0.62 in the higher latitudes and, with a longitudinal mean of 1.57, peak in the tropics. The global median LRU amounts to 0.90, with a 95 % range of 0.68–1.58, and is thus for the most part lower than the median value (1.68) compiled in the recent review by Whelan et al. (2018). Figure 3 shows that the LRU values of this study are lower than those compiled by Seibt et al. (2010) and Whelan et al. (2018) across all plant functional types (PFTs). These two studies however did not filter for high radiation, which may, because LRU increases at low PAR values (e.g. Kooijmans et al., 2019; Sun et al., 2018), at least partly explain the difference. Our values are also lower (by up to 26 %) across all PFTs, except the boreal needleleaf summergreen and the temperate broadleaf evergreen forest PFTs, compared to those reported recently by Maignan et al. (2021), who used the output of the process-based ORCHIDEE model to back-calculate global LRUs. In this comparison it should be noted that ORCHIDEE integrates LRU over the depth of the plant canopy. PAR availability, together with VPD, the major driver of short-term variability in LRU, typically decreases with canopy depth, and, since LRU is negatively related to PAR (e.g. Kooijmans et al., 2019; Kohonen et al., 2022), canopy-integrated LRU is expected to be larger than leaf-scale LRU at the top of the canopy (Sun et al., 2022). This in turn suggests the difference to the values by Maignan et al. (2021) to diminish if their values were expressed at leaf scale and the top-of-the-canopy environmental conditions. Possibly, this scaling effect may explain the increasing bias from boreal over temperate to tropical PFTs (Fig. 3). Despite this issue, LRUs by Maignan et al. (2021) and this study are highly correlated across PFTs (R2>0.93, Fig. 3), suggesting that both approaches reproduce similar patterns across the global bioclimatic space even though they use contrasting modelling approaches. Stomatal conductance in the ORCHIDEE model is prescribed to be linearly related to GPP based on Yin and Struik (2009); the P model, in contrast, employs an optimality approach (Mengoli et al., 2022). In addition, the ORCHIDEE model uses parameters specific to plant functional types, while P model parameters are globally invariant.
It remains to be seen whether our, compared to previous estimates, low LRU values are able to resolve the long-standing conundrum in the global atmospheric COS budget, which is that estimates of a large land COS sink require an upward tweak of the ocean source for the budget to close (Whelan et al., 2018). The magnitude of the required increases in the ocean source is however at odds with bottom-up estimates (Lennartz et al., 2017, 2021).
A sensitivity analysis of the two major model parameters, α and β, shown in Fig. 4, suggests that the simulated growing-season-averaged LRU is most sensitive to uncertainty in α, which scales to VCmax. A change in α by ± 1 standard deviation causes a change in LRU between 15 %–27 %, the largest changes occurring in the mid to high northern latitudes. This indicates an urgent need for more data in order to better constrain via Eq. (8) and also continuing efforts towards improving our process understanding of the drivers of , as Berry et al. (2013) noted that Eq. (8) is poorly constrained by data. In contrast, a change in β by ± 1 standard deviation causes a maximum change in LRU of 2 %, the largest effect being observed in the tropics.
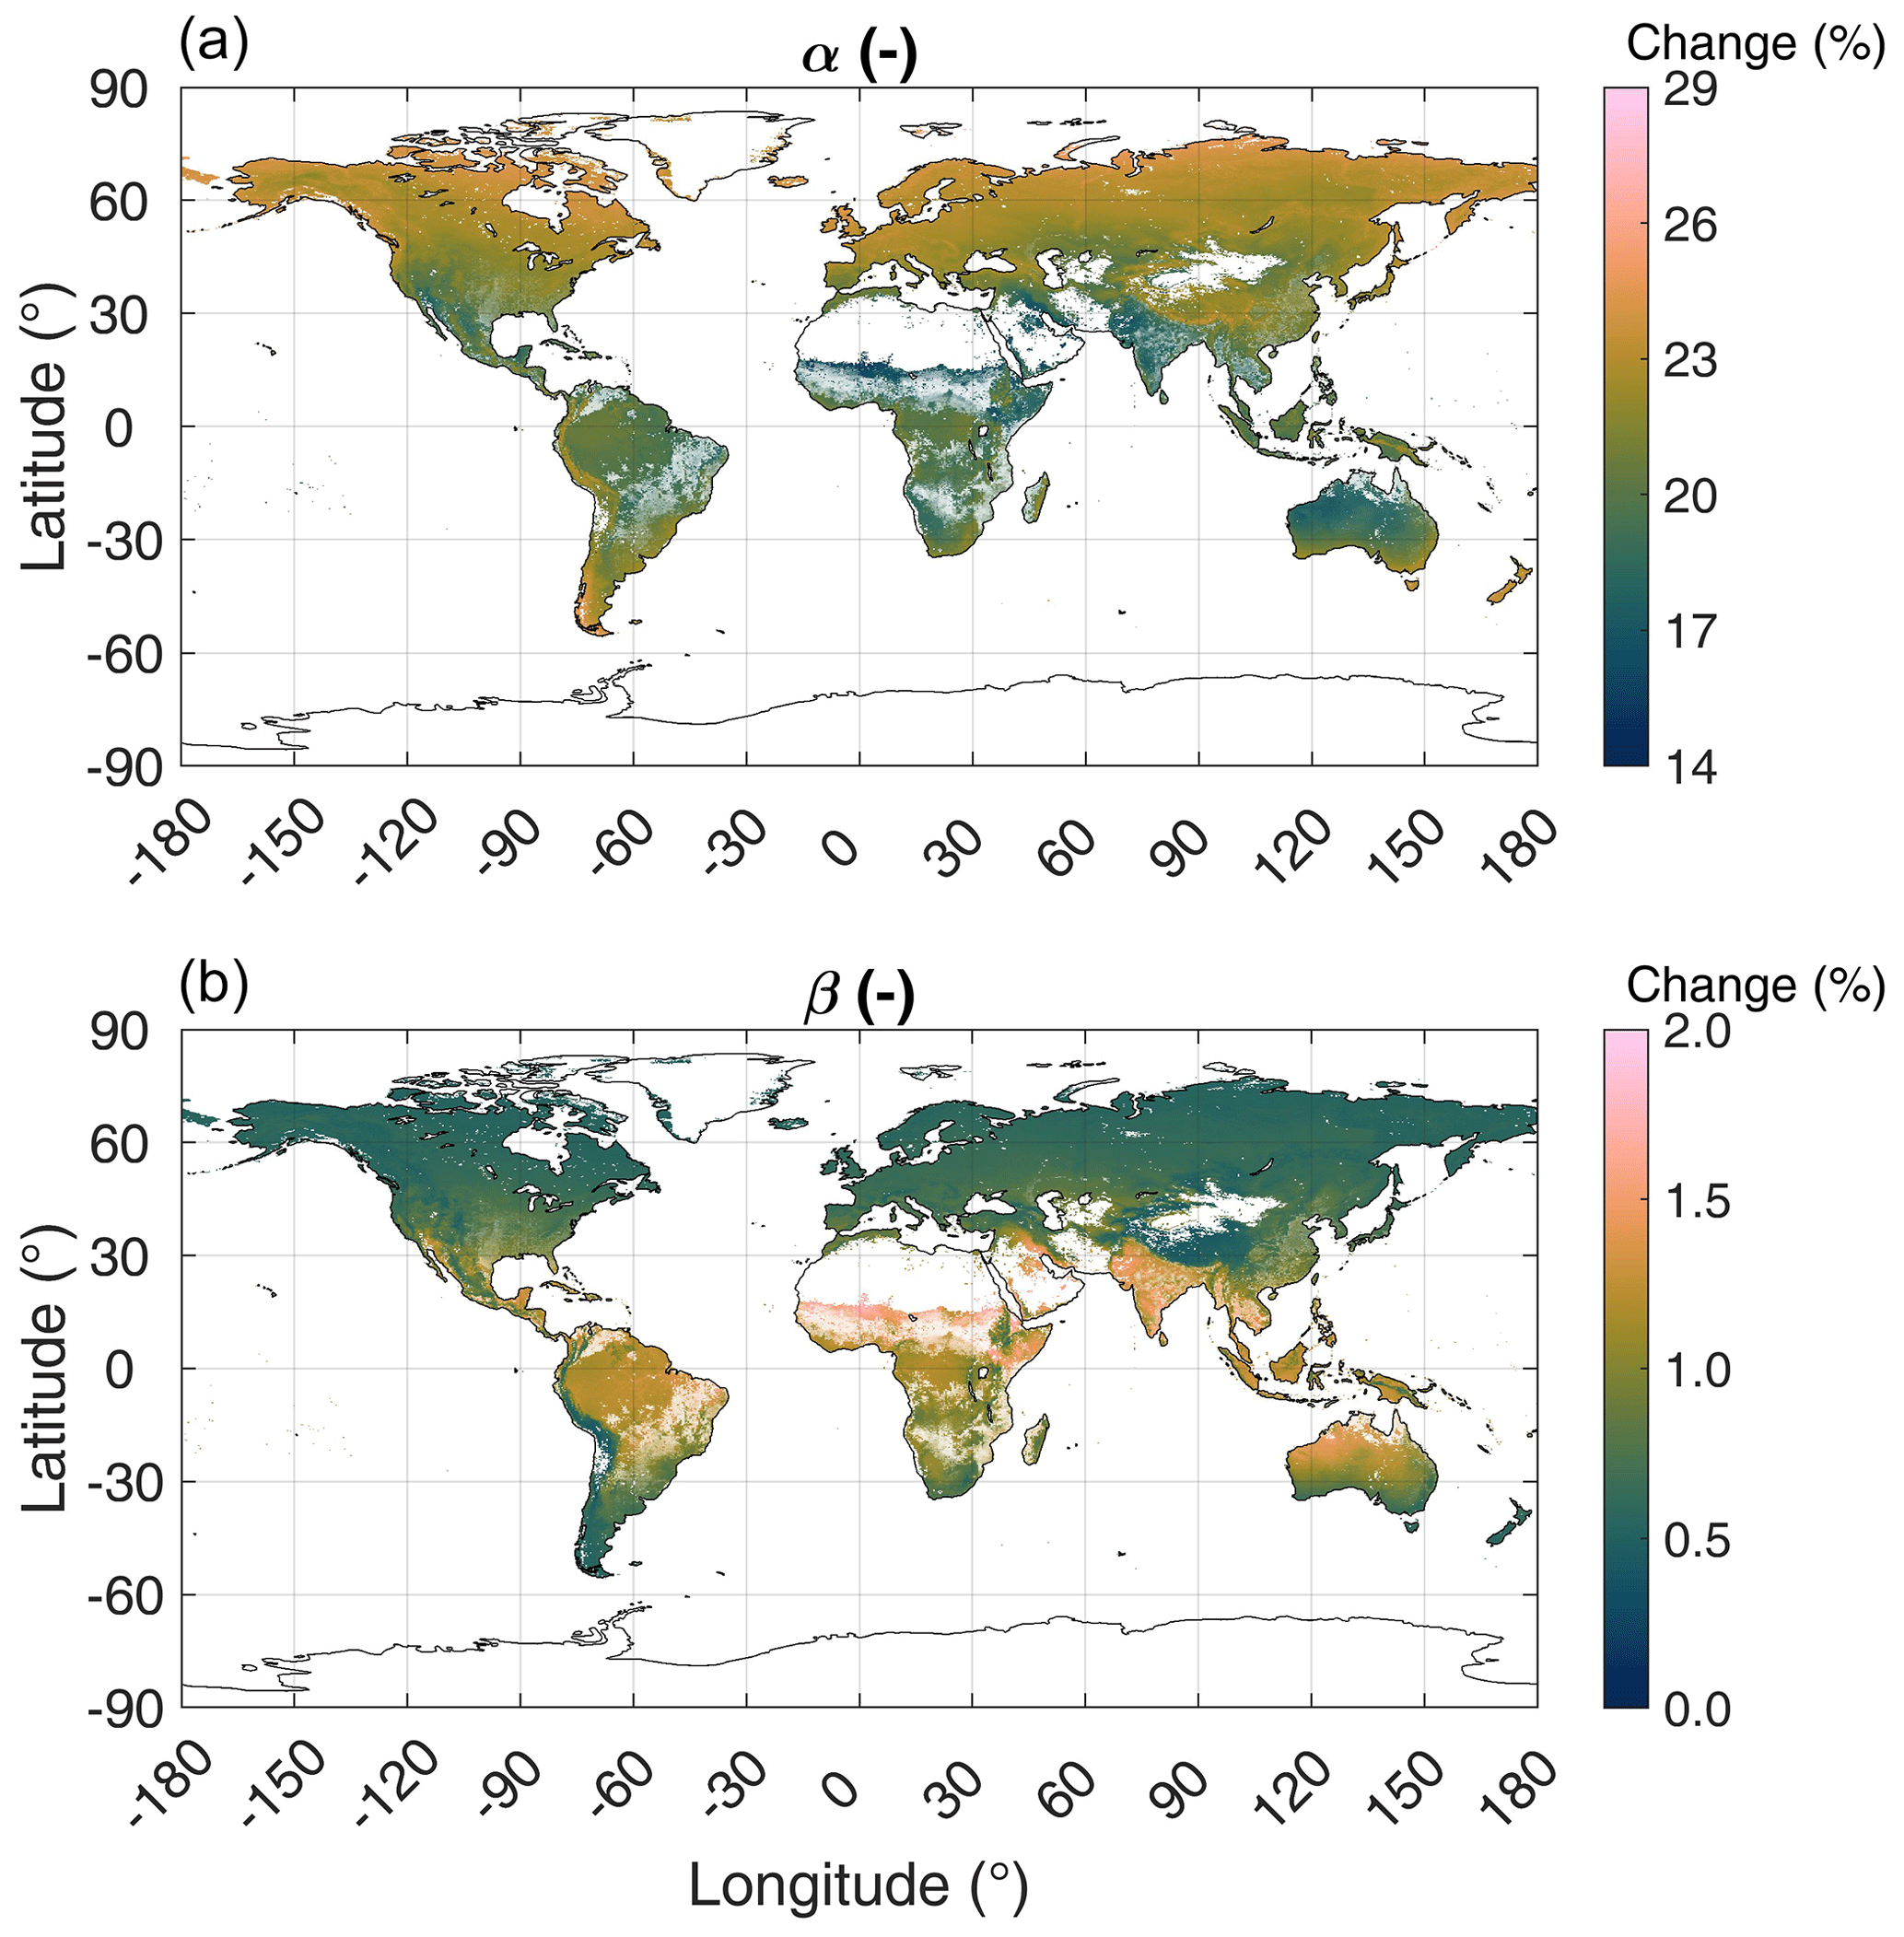
Figure 4Sensitivity of simulated growing-season-averaged (defined as monthly air temperature >0 ∘C) LRU to changing parameters α (a) and β (b) by ± 1 standard deviation. The C4 plant cover fraction is indicated by the transparency level of the colour coding.
Accurate knowledge of LRU is a prerequisite to using Eq. (2) for estimating GPP (Wohlfahrt et al., 2012). While earlier work suggested the LRU, under saturating light conditions, to be confined to ca. 1.6 (Stimler et al., 2011, 2010; Berkelhammer et al., 2014), current cumulative evidence suggests LRU to be more variable (Whelan et al., 2018), and Sun et al. (2022) recently concluded from a theoretical analysis that “there is no guarantee for LRU to converge to a narrow range across species”. Inspection of Eq. (3) shows that convergence to a universal value would require the and ratios to be constant or compensating changes between the two. At present we have no evidence to support either of these scenarios. Rather, our global simulations, based on plant optimality principles, suggest LRU to predictably vary (Fig. 2), reflecting spatial patterns in the ratio, and (Fig. S1 in the Supplement). We recognize that our values, in the range between 0.6 and 2.2, are low compared to those used in previous global assessments (Figs. 2 and 3). We thus advocate, until more empirical measurements become available for validating our simulations, for forward and inverse modellers to adopt our values and approach in order to examine whether these help to reconcile some of the long-standing inconsistencies in the global COS budget.
The datasets of Kooijmans et al. (2019) and Sun et al. (2018) are available from https://doi.org/10.5281/zenodo.1211481 (Kooijmans et al., 2018) and https://doi.org/10.15146/R37T00 (Sun et al., 2017), respectively. Air temperature, VPD and the digital elevation model were taken from https://chelsa-climate.org (CHELSA, 2023), incident PAR was taken from https://www.environment.snu.ac.kr/bess-rad (BESS-Rad, 2023) and CO2 mole fractions were taken from https://doi.org/10.5281/zenodo.5021361 (Cheng et al., 2021). All data and the MATLAB scripts used for processing these and creating the figures can be found at https://doi.org/10.5281/zenodo.7515519 (Wohlfahrt et al., 2023). For easy adoption of our global LRUs by modellers we provide these as monthly climatological means, averaged for the period 2001–2010, at 0.05∘ resolution (lru_pmodel_global_monthly_climatology_v02.nc).
The supplement related to this article is available online at: https://doi.org/10.5194/bg-20-589-2023-supplement.
GW conceived the study and conducted the simulations and analyses with the help of AH. All authors contributed to the writing of the manuscript.
The contact author has declared that none of the authors has any competing interests.
Publisher's note: Copernicus Publications remains neutral with regard to jurisdictional claims in published maps and institutional affiliations.
The authors thank Colin Prentice and Julia Mengoli for patiently answering questions regarding the P model. Fabienne Maignan and Camille Abadie are acknowledged for providing the ORCHIDEE plant functional type map. Figures 3 and 4, as well as Fig. S1 in the Supplement, use colour maps provided by Crameri (2018).
This research has been supported by the Austrian Science Fund (grant no. P35737).
This paper was edited by David McLagan and reviewed by two anonymous referees.
Asaf, D., Rotenberg, E., Tatarinov, F., Dicken, U., Montzka, S. A., and Yakir, D.: Ecosystem photosynthesis inferred from measurements of carbonyl sulphide flux, Nat. Geosci., 6, 186–190, https://doi.org/10.1038/ngeo1730, 2013.
Berkelhammer, M., Asaf, D., Still, C., Montzka, S., Noone, D., Gupta, M., Provencal, R., Chen, H., and Yakir, D.: Constraining surface carbon fluxes using in situ measurements of carbonyl sulfide and carbon dioxide, Global Biogeochem. Cy., 28, 161–179, https://doi.org/10.1002/2013GB004644, 2014.
Berry, J., Wolf, A., Campbell, J. E., Baker, I., Blake, N., Blake, D., Denning, A. S., Kawa, S. R., Montzka, S. A., Seibt, U., Stimler, K., Yakir, D., and Zhu, Z.: A coupled model of the global cycles of carbonyl sulfide and CO2: A possible new window on the carbon cycle, J. Geophys. Res.-Biogeo., 118, 842–852, https://doi.org/10.1002/jgrg.20068, 2013.
BESS-Rad: https://www.environment.snu.ac.kr/bess-rad [data set], last access: 1 Feburary 2023.
Campbell, J. E., Carmichael, G. R., Chai, T., Mena-Carrasco, M., Tang, Y., Blake, D. R., Blake, N. J., Vay, S. A., Collatz, G. J., Baker, I., Berry, J. A., Montzka, S. A., Sweeney, C., Schnoor, J. L., and Stanier, C. O.: Photosynthetic control of atmospheric carbonyl sulfide during the growing season, Science, 322, 1085–1088, https://doi.org/10.1126/science.1164015, 2008.
CHELSA: https://chelsa-climate.org/ [data set], last access: 1 February 2023.
Cheng, W., Dan, L., Deng, X., Feng, J., Wang, Y., Peng, J., Tian, J., Qi, W., Liu, Z., Zheng, X., Zhou, D., Jiang, S., Zhao, H., and Wang, X.: Global monthly distributions of atmospheric CO2 concentrations under the historical and future scenarios, Zenodo [data set], https://doi.org/10.5281/zenodo.5021361, 2021.
Cheng, W., Dan, L., Deng, X., Feng, J., Wang, Y., Peng, J., Tian, J., Qi, W., Liu, Z., Zheng, X., Zhou, D., Jiang, S., Zhao, H., and Wang, X.: Global monthly gridded atmospheric carbon dioxide concentrations under the historical and future scenarios, Scientific Data, 9, 83, https://doi.org/10.1038/s41597-022-01196-7, 2022.
Crameri, F.: Scientific colour maps [dataset], https://doi.org/10.5281/zenodo.1243862, 2018.
Farquhar, G. D., Caemmerer, S., and Berry, J. A.: A biochemical model of photosynthetic CO2 assimilation in leaves of C3 species, Planta, 149, 78–90, https://doi.org/10.1007/BF00386231, 1980.
Harrison, S. P., Cramer, W., Franklin, O., Prentice, I. C., Wang, H., Brännström, Å., de Boer, H., Dieckmann, U., Joshi, J., Keenan, T. F., Lavergne, A., Manzoni, S., Mengoli, G., Morfopoulos, C., Peñuelas, J., Pietsch, S., Rebel, K. T., Ryu, Y., Smith, N. G., Stocker, B. D., and Wright, I. J.: Eco-evolutionary optimality as a means to improve vegetation and land-surface models, New Phytol., 231, 2125–2141, https://doi.org/10.1111/nph.17558, 2021.
Karger, D. N., Conrad, O., Bohner, J., Kawohl, T., Kreft, H., Soria-Auza, R. W., Zimmermann, N. E., Linder, H. P., and Kessler, M.: Climatologies at high resolution for the earth's land surface areas, Scientific Data, 4, 170122, https://doi.org/10.1038/sdata.2017.122, 2017.
Karger, D. N., Conrad, O., Bohner, J., Kawohl, T., Kreft, H., Soria-Auza, R. W., Zimmermann, N. E., Linder, H. P., and Kessler, M.: Data from: Climatologies at high resolution for the earth's land surface areas, DRYAD [dataset], https://doi.org/10.5061/dryad.kd1d4, 2018.
Kohonen, K.-M., Dewar, R., Tramontana, G., Mauranen, A., Kolari, P., Kooijmans, L. M. J., Papale, D., Vesala, T., and Mammarella, I.: Intercomparison of methods to estimate gross primary production based on CO2 and COS flux measurements, Biogeosciences, 19, 4067–4088, https://doi.org/10.5194/bg-19-4067-2022, 2022.
Kooijmans, L. M. J., Sun, W., Aalto, J., Erkkilä, K.-M., Maseyk, K., Seibt, U., Vesala, T., Mammarella, I., and Chen, H.: Dataset for “Influences of light and humidity on carbonyl sulfide-based estimates of photosynthesis”, Zenodo [data set], https://doi.org/10.5281/zenodo.1211481, 2018.
Kooijmans, L. M. J., Sun, W., Aalto, J., Erkkila, K. M., Maseyk, K., Seibt, U., Vesala, T., Mammarella, I., and Chen, H.: Influences of light and humidity on carbonyl sulfide-based estimates of photosynthesis, P. Natl. Acad. Sci. USA, 116, 2470–2475, https://doi.org/10.1073/pnas.1807600116, 2019.
Kooijmans, L. M. J., Cho, A., Ma, J., Kaushik, A., Haynes, K. D., Baker, I., Luijkx, I. T., Groenink, M., Peters, W., Miller, J. B., Berry, J. A., Ogée, J., Meredith, L. K., Sun, W., Kohonen, K.-M., Vesala, T., Mammarella, I., Chen, H., Spielmann, F. M., Wohlfahrt, G., Berkelhammer, M., Whelan, M. E., Maseyk, K., Seibt, U., Commane, R., Wehr, R., and Krol, M.: Evaluation of carbonyl sulfide biosphere exchange in the Simple Biosphere Model (SiB4), Biogeosciences, 18, 6547–6565, https://doi.org/10.5194/bg-18-6547-2021, 2021.
Krinner, G., Viovy, N., de Noblet-Ducoudré, N., Ogée, J., Polcher, J., Friedlingstein, P., Ciais, P., Sitch, S., and Prentice, I. C.: A dynamic global vegetation model for studies of the coupled atmosphere-biosphere system, Global Biogeochem. Cy., 19, GB1015, https://doi.org/10.1029/2003GB002199, 2005.
Lennartz, S. T., Marandino, C. A., von Hobe, M., Cortes, P., Quack, B., Simo, R., Booge, D., Pozzer, A., Steinhoff, T., Arevalo-Martinez, D. L., Kloss, C., Bracher, A., Röttgers, R., Atlas, E., and Krüger, K.: Direct oceanic emissions unlikely to account for the missing source of atmospheric carbonyl sulfide, Atmos. Chem. Phys., 17, 385–402, https://doi.org/10.5194/acp-17-385-2017, 2017.
Lennartz, S. T., Gauss, M., von Hobe, M., and Marandino, C. A.: Monthly resolved modelled oceanic emissions of carbonyl sulphide and carbon disulphide for the period 2000–2019, Earth Syst. Sci. Data, 13, 2095–2110, https://doi.org/10.5194/essd-13-2095-2021, 2021.
Lloyd, J. and Farquhar, G.: 13C discrimination during CO2 assimilation by the terrestrial biosphere, Oecologia, 99, 201–215, https://doi.org/10.1007/BF00627732, 1994.
Maignan, F., Abadie, C., Remaud, M., Kooijmans, L. M. J., Kohonen, K.-M., Commane, R., Wehr, R., Campbell, J. E., Belviso, S., Montzka, S. A., Raoult, N., Seibt, U., Shiga, Y. P., Vuichard, N., Whelan, M. E., and Peylin, P.: Carbonyl sulfide: comparing a mechanistic representation of the vegetation uptake in a land surface model and the leaf relative uptake approach, Biogeosciences, 18, 2917–2955, https://doi.org/10.5194/bg-18-2917-2021, 2021.
Maire, V., Martre, P., Kattge, J., Gastal, F., Esser, G., Fontaine, S., and Soussana, J. F.: The coordination of leaf photosynthesis links C and N fluxes in C3 plant species, PLoS One, 7, e38345, https://doi.org/10.1371/journal.pone.0038345, 2012.
Mengoli, G., Agustí-Panareda, A., Boussetta, S., Harrison, S. P., Trotta, C., and Prentice, I. C.: Ecosystem Photosynthesis in Land-Surface Models: A First-Principles Approach Incorporating Acclimation, J. Adv. Model. Earth Sy., 14, e2021MS002767, https://doi.org/10.1029/2021ms002767, 2022.
Prentice, I. C., Dong, N., Gleason, S. M., Maire, V., and Wright, I. J.: Balancing the costs of carbon gain and water transport: testing a new theoretical framework for plant functional ecology, Ecol. Lett., 17, 82–91, https://doi.org/10.1111/ele.12211, 2014.
Ryu, Y., Jiang, C., Kobayashi, H., and Detto, M.: MODIS-derived global land products of shortwave radiation and diffuse and total photosynthetically active radiation at 5 km resolution from 2000, Remote Sens. Environ., 204, 812–825, https://doi.org/10.1016/j.rse.2017.09.021, 2018.
Sandoval-Soto, L., Stanimirov, M., von Hobe, M., Schmitt, V., Valdes, J., Wild, A., and Kesselmeier, J.: Global uptake of carbonyl sulfide (COS) by terrestrial vegetation: Estimates corrected by deposition velocities normalized to the uptake of carbon dioxide (CO2), Biogeosciences, 2, 125–132, https://doi.org/10.5194/bg-2-125-2005, 2005.
Seibt, U., Kesselmeier, J., Sandoval-Soto, L., Kuhn, U., and Berry, J. A.: A kinetic analysis of leaf uptake of COS and its relation to transpiration, photosynthesis and carbon isotope fractionation, Biogeosciences, 7, 333–341, https://doi.org/10.5194/bg-7-333-2010, 2010.
Smith, N. G., Keenan, T. F., Colin Prentice, I., Wang, H., Wright, I. J., Niinemets, U., Crous, K. Y., Domingues, T. F., Guerrieri, R., Yoko Ishida, F., Kattge, J., Kruger, E. L., Maire, V., Rogers, A., Serbin, S. P., Tarvainen, L., Togashi, H. F., Townsend, P. A., Wang, M., Weerasinghe, L. K., and Zhou, S. X.: Global photosynthetic capacity is optimized to the environment, Ecol. Lett., 22, 506–517, https://doi.org/10.1111/ele.13210, 2019.
Stimler, K., Montzka, S. A., Berry, J. A., Rudich, Y., and Yakir, D.: Relationships between carbonyl sulfide (COS) and CO2 during leaf gas exchange, New Phytol., 186, 869–878, https://doi.org/10.1111/j.1469-8137.2010.03218.x, 2010.
Stimler, K., Berry, J. A., Montzka, S. A., and Yakir, D.: Association between Carbonyl Sulfide Uptake and 18Δ during Gas Exchange in C3 and C4 Leaves, Plant Physiol., 157, 509–517, https://doi.org/10.1104/pp.111.176578, 2011.
Stocker, B. D., Wang, H., Smith, N. G., Harrison, S. P., Keenan, T. F., Sandoval, D., Davis, T., and Prentice, I. C.: P-model v1.0: an optimality-based light use efficiency model for simulating ecosystem gross primary production, Geosci. Model Dev., 13, 1545–1581, https://doi.org/10.5194/gmd-13-1545-2020, 2020.
Sun, W., Maseyk, K., Lett, C., and Seibt, U.: Dataset for “Stomatal control of leaf fluxes of carbonyl sulfide and CO2 in a Typha freshwater marsh”, Dryad [data set], https://doi.org/10.15146/R37T00, 2017.
Sun, W., Maseyk, K., Lett, C., and Seibt, U.: Stomatal control of leaf fluxes of carbonyl sulfide and CO2 in a Typha freshwater marsh, Biogeosciences, 15, 3277–3291, https://doi.org/10.5194/bg-15-3277-2018, 2018.
Sun, W., Berry, J. A., Yakir, D., and Seibt, U.: Leaf relative uptake of carbonyl sulfide to CO2 seen through the lens of stomatal conductance-photosynthesis coupling, New Phytol., 235, 1729–1742, https://doi.org/10.1111/nph.18178, 2022.
Wang, H., Prentice, I. C., Davis, T. W., Keenan, T. F., Wright, I. J., and Peng, C.: Photosynthetic responses to altitude: an explanation based on optimality principles, New Phytol., 213, 976–982, https://doi.org/10.1111/nph.14332, 2017a.
Wang, H., Prentice, I. C., Keenan, T. F., Davis, T. W., Wright, I. J., Cornwell, W. K., Evans, B. J., and Peng, C.: Towards a universal model for carbon dioxide uptake by plants, Nat. Plants, 3, 734–741, https://doi.org/10.1038/s41477-017-0006-8, 2017b.
Whelan, M. E., Lennartz, S. T., Gimeno, T. E., Wehr, R., Wohlfahrt, G., Wang, Y., Kooijmans, L. M. J., Hilton, T. W., Belviso, S., Peylin, P., Commane, R., Sun, W., Chen, H., Kuai, L., Mammarella, I., Maseyk, K., Berkelhammer, M., Li, K.-F., Yakir, D., Zumkehr, A., Katayama, Y., Ogée, J., Spielmann, F. M., Kitz, F., Rastogi, B., Kesselmeier, J., Marshall, J., Erkkilä, K.-M., Wingate, L., Meredith, L. K., He, W., Bunk, R., Launois, T., Vesala, T., Schmidt, J. A., Fichot, C. G., Seibt, U., Saleska, S., Saltzman, E. S., Montzka, S. A., Berry, J. A., and Campbell, J. E.: Reviews and syntheses: Carbonyl sulfide as a multi-scale tracer for carbon and water cycles, Biogeosciences, 15, 3625–3657, https://doi.org/10.5194/bg-15-3625-2018, 2018.
Wohlfahrt, G. and Gu, L.: The many meanings of gross photosynthesis and their implication for photosynthesis research from leaf to globe, Plant Cell Environ., 38, 2500–2507, https://doi.org/10.1111/pce.12569, 2015.
Wohlfahrt, G., Brilli, F., Hoertnagl, L., Xu, X., Bingemer, H., Hansel, A., and Loreto, F.: Carbonyl sulfide (COS) as a tracer for canopy photosynthesis, transpiration and stomatal conductance: potential and limitations, Plant Cell Environ., 35, 657–667, https://doi.org/10.1111/j.1365-3040.2011.02451.x, 2012.
Wohlfahrt, G., Hammerle, A., Spielmann, M. F., and Kitz, F.: Novel estimates of the leaf relative uptake rate of carbonyl sulfide from optimality theory (Version 2), Zenodo [data set], https://doi.org/10.5281/zenodo.7515519, 2023.
Yin, X. and Struik, P. C.: C3 and C4 photosynthesis models: An overview from the perspective of crop modelling, NJAS-Wagen. J. Life Sc., 57, 27–38, https://doi.org/10.1016/j.njas.2009.07.001, 2009.