the Creative Commons Attribution 4.0 License.
the Creative Commons Attribution 4.0 License.
 | 12 Mar 2024
Peatland evaporation across hemispheres: contrasting controls and sensitivity to climate warming driven by plant functional types
Leeza Speranskaya
David I. Campbell
Peter M. Lafleur
Elyn R. Humphreys
Peatlands store disproportionally large amounts of carbon per unit area, a function that is dependent on maintaining high and stable water tables. Climate change is likely to negatively impact carbon storage in peatlands, in part due to increases in vapour pressure deficit (VPD) driving higher evaporation (E) rates. However, the response of E to increasing VPD depends on the dominant vegetation type within peatlands. In this study, we used multiple years of eddy covariance (EC) measurements to compare E regimes at two peatlands with contrasting vegetation types – Kopuatai bog in Aotearoa / New Zealand, dominated by the vascular wire rush Empodisma robustum, and Mer Bleue bog in Canada, a “typical” shrub- and moss-dominated Northern Hemisphere peatland. We examined seasonal variability in E and equilibrium E (Eeq), energy balance partitioning, and the response of E, evaporative fraction (EF), and canopy conductance (gc) to VPD. Mean annual E was 45 % lower than mean annual Eeq at Kopuatai but only 16 % lower at Mer Bleue, demonstrating much greater limitations on E at Kopuatai. In addition, the mean midday (10:00–14:30 local standard time) dry-canopy Bowen ratio (β) at Kopuatai was 2.0 compared to 0.8 at Mer Bleue; therefore, the sensible heat flux (H) dominated over the latent heat flux (LE) at Kopuatai and vice versa at Mer Bleue. The responses of E, EF, and gc to increasing VPD at Kopuatai demonstrated stronger limitations on evaporative water loss for VPD > 0.7 kPa compared to Mer Bleue. The observed limitations at Kopuatai were attributed to strong stomatal control by E. robustum due to the rapid decrease in gc with increasing VPD; however, surface E could also be limited by its dense standing litter. At Mer Bleue, however, E was only weakly limited at VPD > 2 kPa, likely due to weak stomatal control over transpiration by the sparse shrub canopy and relatively large surface E from Sphagnum carpets. As such, the results of this study suggest that E. robustum drives a greater “hydrological resistance” to increasing VPD than the vegetation at Mer Bleue, leading to greater water retention at Kopuatai. This may enable greater resilience of the carbon sink function at Kopuatai to climatic warming and drying than at Mer Bleue.
- Article
(4275 KB) - Full-text XML
- BibTeX
- EndNote


Global peatlands have accumulated carbon (C) stocks of at least 500 Pg over thousands of years, resulting in a net cooling effect on the climate (Yu et al., 2010; Frolking and Roulet, 2007). This C stock is estimated to make up a third of global soil C (based on a median estimate of 1460.5 Pg), despite only occupying ∼3 % of Earth's land surface area (Scharlemann et al., 2014; Xu et al., 2018). Carbon accumulation as peat occurs in undisturbed peatlands when the rate of organic matter deposition exceeds decomposition due to limitations imposed on decomposition by waterlogged conditions and the presence of decay-resistant plant litter (Joosten and Clarke, 2002; Holden, 2005). Therefore, long-term C sequestration in peatlands depends on maintaining a high and stable water table (Kim et al., 2021; Ma et al., 2022).
Evaporation (E)1 is an important indirect influence on peat accumulation as it reduces available water and contributes to water table drawdown. Evaporation consists of three main components – transpiration, surface E (from either water, soil, or non-vascular plant surfaces), and interception loss from vegetation surfaces – and is influenced by a number of meteorological (solar radiation and vapour pressure deficit – VPD) and surface factors (vegetation type and water table depth – WTD; Takagi et al., 1999; Shimoyama et al., 2003; Wu et al., 2010). In bog ecosystems, where precipitation is the sole water input (Holden, 2005), conservation of water is particularly important; this occurs through limitations imposed on E by bog vegetation (Campbell and Williamson, 1997), as well as through limitations on lateral and vertical drainage by low hydraulic conductivity of the highly decomposed peat soils (Fraser et al., 2001). As such, vegetation type is often a major factor regulating water loss from bogs (Lafleur and Roulet, 1992; Takagi et al., 1999; Admiral et al., 2006).
The response of E to increasing atmospheric demand, i.e. increasing VPD, is of particular interest as climate-change-related warming has been predicted to elevate VPD (Ficklin and Novick, 2017; Fang et al., 2022). Plant responses to changing VPD are known to affect transpiration rates and CO2 uptake (Grossiord et al., 2020). With increasing VPD, contrasting E responses have been observed across different vegetation types (Takagi et al., 1999; Admiral et al., 2006; Massman et al., 2019) and ecosystems (Helbig et al., 2020). For example, using eddy covariance (EC) data from 95 boreal peatland and forest sites, Helbig et al. (2020) demonstrated that E rates were elevated by increasing VPD in both ecosystem types; however, E rates were 30 % higher in boreal peatlands than in boreal forests at high VPD. This suggests that the stability of peatland hydrological regimes and C stores may be at risk under future changes to the climate.
Kopuatai bog is a warm-temperate ombrotrophic peatland on Te Ika-a-Māui / North Island of Aotearoa / New Zealand. The vegetation at Kopuatai is dominated by the vascular plant Empodisma robustum, which has been implicated in severely restricting E (Campbell and Williamson, 1997). The hypothesised mechanisms for this are stomatal control of transpiration and limitation of surface E due to restricted water vapour diffusion from the substrate through the dense standing litter layer (Campbell and Williamson, 1997; Thompson et al., 1999). Carbon uptake at Kopuatai is greater than in analogous Northern Hemisphere peatlands and exhibits resilience to drought (i.e. high net annual ecosystem C balance despite drought disturbance in summer; Goodrich et al., 2017). This could be a result of the year-round growing conditions (Campbell et al., 2014), in contrast to the temperature-limited growing-season lengths in Northern Hemisphere peatlands which constrain C uptake (Roehm and Roulet, 2003; Lafleur et al., 2001; Helfter et al., 2015). However, high C uptake rates and drought resilience could also be indirectly attributed to the extremely low E, which maximises available water and maintains a high and stable water table. Therefore, the resilience of C uptake at Kopuatai could be due to resistance of the hydrological regime to environmental stressors through limitations on E (based on resistance and resilience definitions from Nimmo et al., 2015). As such, E limitation could be a very important self-regulation mechanism in this type of peatland ecosystem.
Like Kopuatai, many peatlands have formed in warm climates; however, the majority of the global peatland area occurs in boreal regions of the Northern Hemisphere (Vitt, 2006). One such peatland is Mer Bleue bog in Canada, a shrub- and Sphagnum-moss-dominated bog ecosystem located in a cool continental climate zone (Moore et al., 2002). As one of the most studied Northern Hemisphere peatlands, Mer Bleue has a long record of E measurements and of knowledge of E processes. Daily E rates at Mer Bleue are comparable to many other Northern Hemisphere peatlands and have been shown to be affected by water table depth (E is limited by deep water tables; Lafleur et al., 2005), available energy (drives increases in E), and VPD (the effect of which varies depending on the partitioning of E between vascular and non-vascular sources; Admiral et al., 2006). The average net annual C uptake at Mer Bleue is much lower than at Kopuatai, primarily due to net C losses during the winter period and to a shorter growing season (Roulet et al., 2007; Goodrich et al., 2017).
Knowledge of E at Kopuatai bog is limited to the results of two short-term studies (Campbell and Williamson, 1997; Thompson et al., 1999), so our understanding of the variability and mechanisms of E restriction by E. robustum is incomplete. In addition, it is not yet known how these limitations on E may affect the response of the ecosystem at Kopuatai to climate warming, including its C sink status. Therefore, the aim of this study is to compare the E regime at Kopuatai to that of Mer Bleue, as an example of a “typical” Northern Hemisphere peatland, to better understand the relative sensitivity of these systems to hydrological change under continued climate warming. Compared with previous studies, our study utilises multi-annual datasets at each site, thereby analysing E characteristics over a wide range of climate and weather conditions. The objectives of this study are to (1) compare seasonal variability in actual E and equilibrium E (Eeq) at Kopuatai and Mer Bleue; (2) investigate energy balance partitioning; and (3) examine the responses of E, evaporative fraction (EF), and canopy conductance (gc) to VPD at each site. Our hypothesis is that differences in seasonal E limitations, energy balance partitioning, and responses of E to VPD, such that more water is conserved at Kopuatai relative to Mer Bleue, can be attributed to differences in vegetation. If this hypothesis is correct, it is possible that the water-conserving traits of E. robustum will enable greater resistance of the hydrological regime, and hence greater resilience of the C stores, to climate warming compared to typical Northern Hemisphere peatlands.
2.1 Site descriptions
2.1.1 Kopuatai bog
Kopuatai bog is a 96 km2 ombrotrophic peatland located in a warm-temperate oceanic climate in the Waikato region of Aotearoa / New Zealand (37.388° S, 175.554° E). Kopuatai is Aotearoa's largest undisturbed bog, a remnant of formerly widespread and diverse lowland wetlands; these ecosystems have been reduced to 10 % of their previous extent due to widespread drainage, primarily for agriculture (McGlone, 2009; Dymond et al., 2021). Peat at Kopuatai has accumulated over the last 11 700 years at an average rate of 0.9 mm yr−1, with a maximum depth of 14 m (Newnham et al., 1995; Shearer, 1997). Probing at the research site showed a peat depth of 11 m.
The dominant peat-forming vegetation at Kopuatai is E. robustum (Wagstaff and Clarkson, 2012), a vascular evergreen-jointed rush-like plant that is part of the family Restionaceae (known as “restiads”; Wagstaff and Clarkson, 2012). At the field site, E. robustum has a mean leaf area index (LAI) of 1.32 (Goodrich et al., 2015) and a mean canopy height of 0.48 m. E. robustum forms a dense negatively geotropic surface root mat approximately 50 mm thick which can hold up to 15 times its dry weight in water (Campbell, 1964; Agnew et al., 1993; Clarkson et al., 2009). In addition, E. robustum has a dense standing litter layer (litter biomass–0.92 kg m−2, where total canopy biomass–1.80 kg m−2), which can restrict water vapour diffusion from the peat surface by limiting turbulent transport (Campbell and Williamson, 1997; Keyte Beattie, 2014). However, E. robustum can also restrict water loss via transpiration through strong stomatal control (Campbell and Williamson, 1997). The roots of E. robustum are the main material from which peat is formed; however, live mosses and decayed canopy litter are also bound by these roots and contribute to peat formation (Campbell, 1964; Agnew et al., 1993). Other vegetation types found at this site include sedges (Machaerina spp. and Schoenus brevifolius), isolated shrubs of Leptospermum scoparium (mānuka), and Epacris pauciflora, as well as small patches of Sporadanthus ferrugineus, another restiad plant.
2.1.2 Mer Bleue bog
Mer Bleue bog is a 28 km2 ombrotrophic peatland (45.411° N, −75.481° E) located near Ottawa, Canada, in a cool continental climate. Mer Bleue has many features in common with boreal peatlands but is located near the southern limit of the boreal climate zone (Hember et al., 2005). This peatland was initiated 8400 years ago as a fen, transitioning into a bog around 7100–6800 years ago (Roulet et al., 2007). At the research site, the bog is characterised by hummock–hollow microtopography and has peat depths of 5–6 m (Lafleur et al., 2005). The hummock height at Mer Bleue is 0.25 m, with a 70 % cover of hummocks. The dominant vegetation consists of evergreen ericaceous and deciduous shrubs (e.g. Chamaedaphne calyculata, Rhododendron groenlandicum, Kalmia angustifolium, Kalmia polifolia, and Vaccinium myrtilloides) with Sphagnum moss species as the dominant ground cover, including S. capillifolium, S. papillosum, and S. magellanicum (Bubier et al., 2006). The average shrub canopy height is 0.18 m (range 0.10–0.30 m; Bubier et al., 2006); shrub vegetation makes up 61 % of the total biomass on average, while Sphagnum capitula make up 30 % (Moore et al., 2002). The total biomass ranges between 0.147 and 1.011 kg m−2, while the LAI of dominant vascular species is 1.3 on average (Moore et al., 2002; Bubier et al., 2006).
2.2 Data collection and processing
2.2.1 Data collection
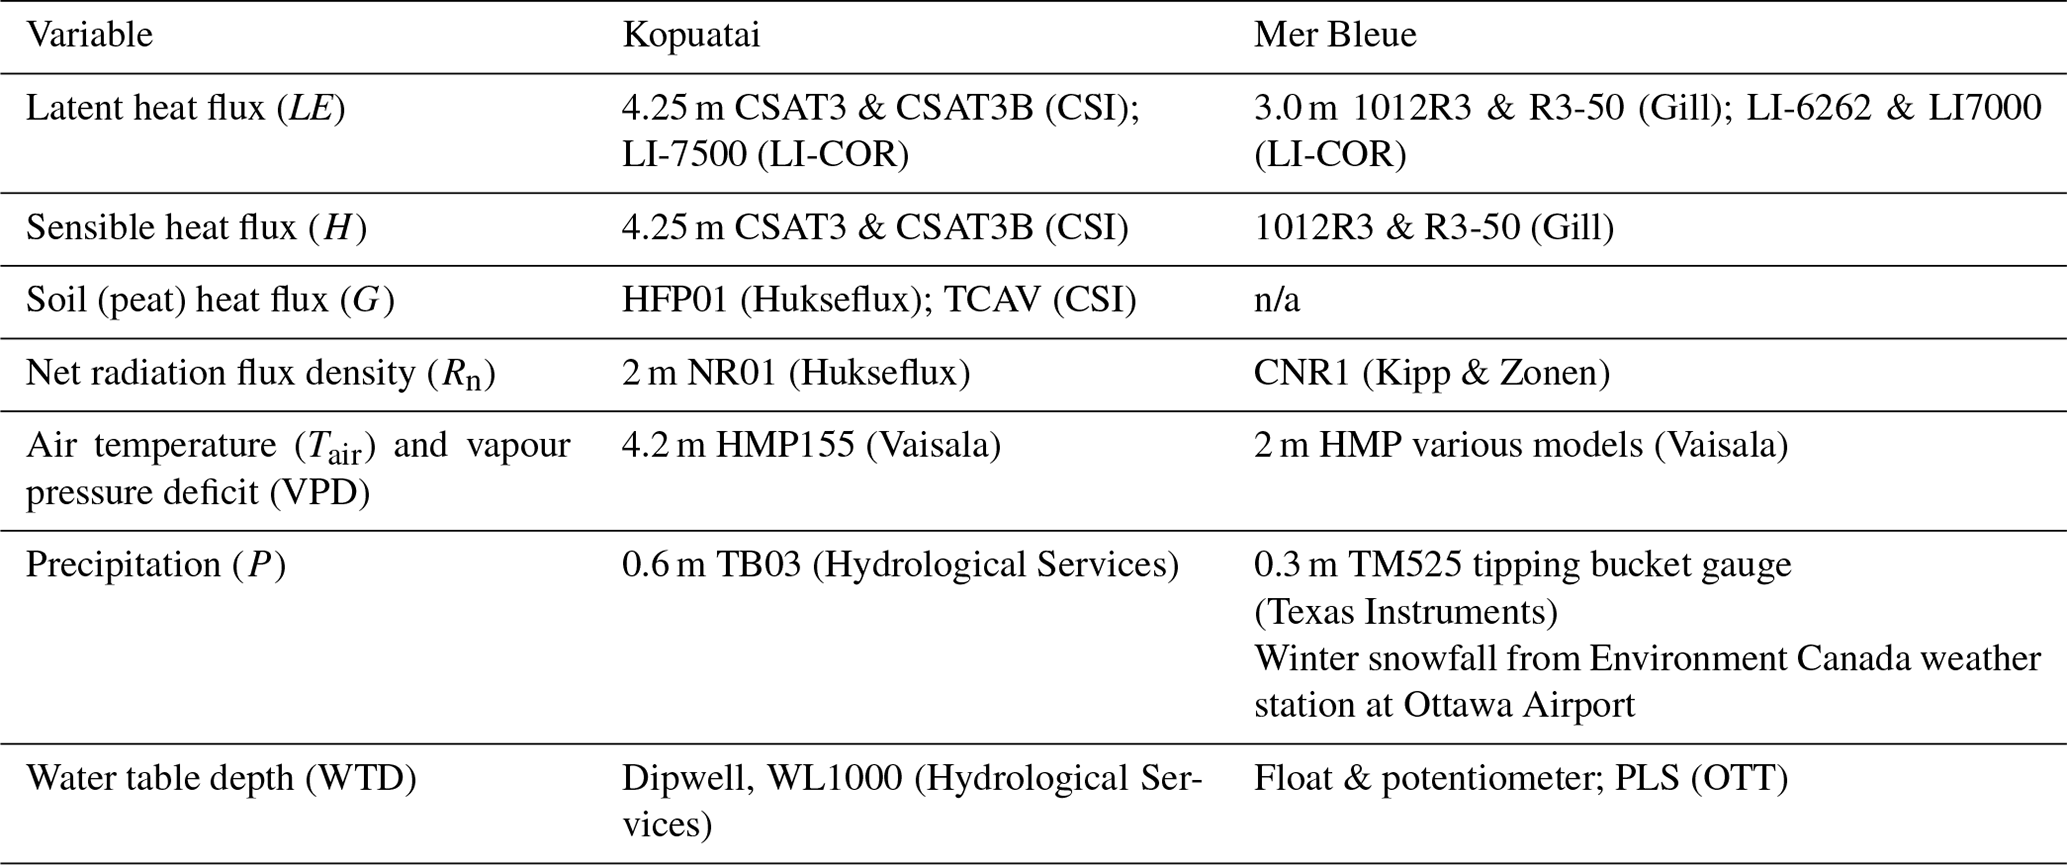
Flux tower and ancillary data have been collected at both sites for many years – in this study, data covering 1 January 2012 to 31 December 2022 at Kopuatai (11 years) and 1 January 1999 to 31 December 2018 at Mer Bleue (20 years) were used. At each site, 30 min fluxes of latent heat (LE), sensible heat (H), soil heat (G), and net radiation (Rn), along with 30 min data on environmental and weather variables including air temperature (Tair), vapour pressure deficit (VPD), precipitation (P), and water table depth (WTD; measured relative to the hummock surface at Mer Bleue, while the Kopuatai peat surface lacks hummocks and hollows) were collected. Latent and sensible heat fluxes were measured using the eddy covariance (EC) technique (Burba, 2022). The EC system at Kopuatai is an open-path system (Appendix A) situated at 4.25 m height, with uninterrupted fetch greater than 500 m in all directions (research site is shown in Fig. 1a). At Mer Bleue, a closed-path EC system is situated at 3.0 m height, with a fetch greater than 500 m in all directions except south, where it is 200–300 m (Fig. 1b).
Following collection, flux data were quality-controlled and gap-filled. For gap filling of LE and H at Kopuatai, separate daytime and nighttime neural network models used drivers of Rn, Tair, VPD, and modelled canopy wetness state (detailed below); further details on data processing, quality control, and gap filling are provided in Goodrich et al. (2017). At Mer Bleue, gap filling of LE was carried out by developing a linear relationship between available energy (Ra) and LE for summer and calculating a multiplier to adjust the estimated LE to observed LE over a moving-window period (the window width was 100 half-hours with available data moved in increments of 20 half-hours). Ra was calculated as Rn minus the rate of change in G (calculated using peat temperature profiles) and energy storage term (J). Gap-filled sensible heat fluxes were then calculated as the difference between Ra and LE. For both sites, gap-filled flux data were used for seasonal to annual E totals, while other analyses only used filtered measurements.
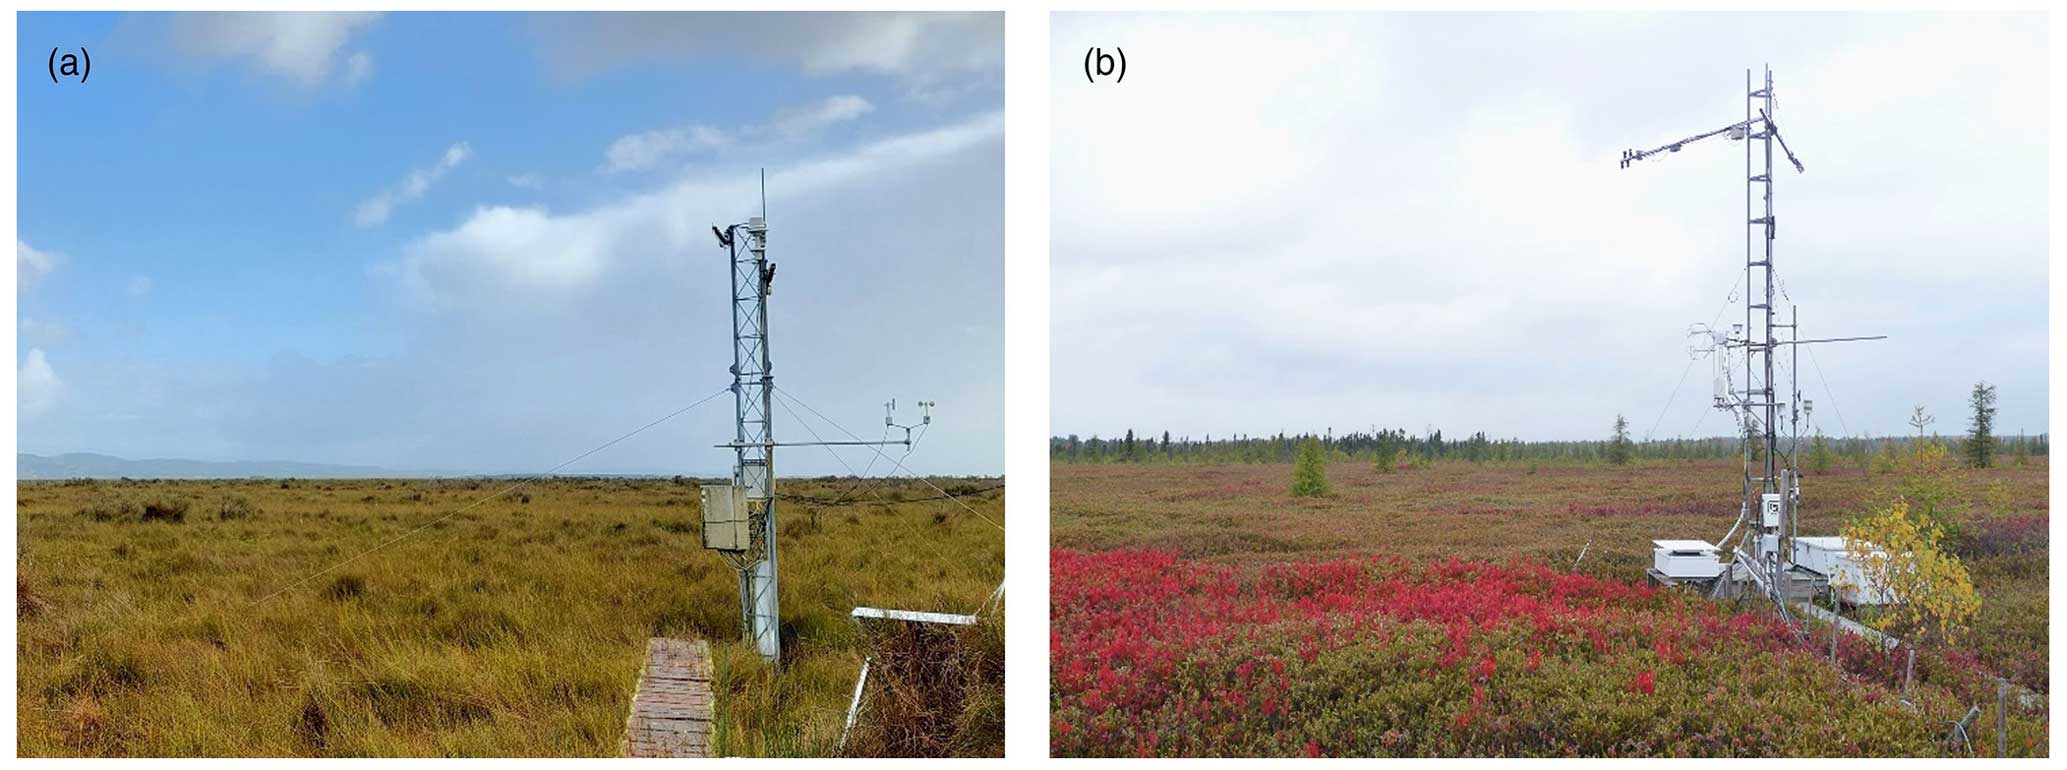
Figure 1Images of the two sites including eddy covariance towers at (a) Kopuatai and (b) Mer Bleue.
2.2.2 Equilibrium evaporation
To provide a reference E rate at each site, the equilibrium evaporation (Eeq) was calculated using 24 h mean data:
where s is the slope of the saturation vapour pressure versus air temperature curve, Lv is the latent heat of vaporisation (dependent on Tair), and γ is the psychrometric constant (0.066 kPa °C−1). G was assumed to be 0 W m−2 due to the use of 24 h mean data.
The ratio , i.e. the Priestley–Taylor α, was then calculated in order to be able to compare E regimes at the two sites despite differing climates. Gap-filled LE data were converted to for this analysis.
Equilibrium E was selected as a measure of potential E as it provides a more conservative estimate compared to other methods, such as the Penman equation (Granger, 1989). In addition, Eeq is less dependent on energy partitioning compared to Penman open-water E (Thompson et al., 1999). As explained by Thompson et al. (1999), due to the high ratio of sensible to latent heat flux (i.e. a high Bowen ratio, β) at Kopuatai, VPD is potentially larger than it would be above an extensive water surface in the same region, driving Penman open-water E to an unrealistic level. Due to the lack of a VPD term in the Eeq equation, this effect is mitigated.
2.2.3 Energy balance partitioning and VPD analysis
The analysis of energy balance partitioning and the relationships of E, EF, and gc with VPD involved the use of non-gap-filled E, Rn, LE, H, VPD, and wind speed data, pre-filtered through quality-control protocols. Further filtering was then carried out to obtain data for growing-season months (May–October at Mer Bleue and September–May at Kopuatai). In addition, all 30 min data from both sites were filtered to select only “middle-of-day” (MoD) conditions (10:00–14:30 local standard time), with an additional filter of Rn≥200 W m−2 applied to the VPD analysis. These 30 min data were also filtered by dry- or wet-canopy conditions, which were identified using an antecedent precipitation index (API; Appendix B); an API ≤ 0.2 signifies a dry canopy, while API ≥ 1 indicates fully wet-canopy conditions. These filtered 30 min data were then used to calculate MoD means of all variables. Days with fewer than five (50 %) acceptable 30 min data points for all variables were removed to ensure representative MoD means. Overall, this filtering resulted in 58 % and 66 % of MoD dry-canopy 30 min data being rejected for Kopuatai and Mer Bleue, respectively. However, for wet-canopy conditions, 90 % (Kopuatai) and 92 % (Mer Bleue) of MoD 30 min data were rejected. For the following analyses, 95 % confidence intervals were calculated for MoD means as the standard error multiplied by 1.96.
To analyse energy balance partitioning, filtered growing-season MoD mean LE and H data were binned by Rn (bin width 50 W m−2) for each site, taking the mean value of each bin. This was calculated separately for dry- and wet-canopy conditions. Seasonal energy balance partitioning was also investigated by calculating monthly means of MoD dry canopy LE, H, and Rn; however, no other filters were applied to the data for this particular component of the analysis.
To demonstrate the relationship between evaporative water loss and VPD, filtered dry-canopy growing-season MoD means of E, EF, and gc were binned by VPD (0.1 kPa intervals), following Helbig et al. (2020), taking the mean of each bin for all variables. Evaporative fraction was used to assess the change in energy balance partitioning into LE with increasing VPD and was calculated as follows:
The denominator LE+H was used rather than Rn to prevent incomplete energy balance closure (Appendix C) from affecting our results. In addition, β was calculated as follows:
Finally, gc was calculated following Campbell and Williamson (1997):
where ρ is air density (1.2 kg m−3), cp is the specific heat of air (1010 J kg−1 °C−1), and ra is aerodynamic resistance. Values of ra were also calculated using the method from Campbell and Williamson (1997), which first required calculation of the aerodynamic resistance to momentum transfer from the measurement height to the canopy (raM):
where u is the horizontal wind speed and u∗ is the friction velocity measured by the sonic anemometer.
Then, ra was calculated as follows:
where k is von Kármán's constant (0.4).
2.2.4 Energy balance closure
Energy balance closure was imperfect at both sites, with 84 % closure at Kopuatai and 89 % at Mer Bleue (Appendix C). This could be due to a number of factors, such as mismatch between EC footprint characteristics for the turbulent and non-turbulent energy balance terms or increasing uncertainty in surface soil heat flux measurements due to peat accumulation, which increases the depth of soil heat flux plates over time. Energy imbalances could also be a result of a lack of sustained turbulence at these sites (Anderson and Wang, 2014) or due to the use of MoD means of energy balance components rather than 24 h means (Leuning et al., 2012).
All analyses were carried out using MATLAB R2021b.
3.1 Climate and hydrology
Mean annual precipitation (P) was 1213 ± 147 mm (±95 % confidence interval) at Kopuatai (2012–2022) compared to 879 ± 58.1 mm at Mer Bleue (1999–2018). Mean monthly P ranged between 49–139 and 50–100 mm at Kopuatai and Mer Bleue, respectively, with the minimum monthly P occurring during the warm season at Kopuatai and the cool season at Mer Bleue (Fig. 2a). The mean monthly air temperature (Tair) range was much smaller at Kopuatai (9.3 to 19.0 °C) than at Mer Bleue (−10.0 to 20.2 °C) (Fig. 2b), with mean annual temperatures of 14.1 ± 0.27 °C and 6.2 ± 0.31 °C at the two sites, respectively. Mean annual VPD was 0.39 ± 0.013 kPa at Kopuatai and 0.38 ± 0.023 kPa at Mer Bleue, and monthly mean VPD ranged between 0.17–0.68 and 0.07–0.77 kPa (Fig. 2c). Mean annual WTD was −82.6 ± 14.4 mm at Kopuatai and −377 ± 19.8 mm at Mer Bleue. Monthly mean WTD had a narrower range and was shallower at Kopuatai than at Mer Bleue year-round; as a result, the WTD ranges at these sites did not overlap (−153 to −28 and −460 to −278 mm, respectively; Fig. 2d).
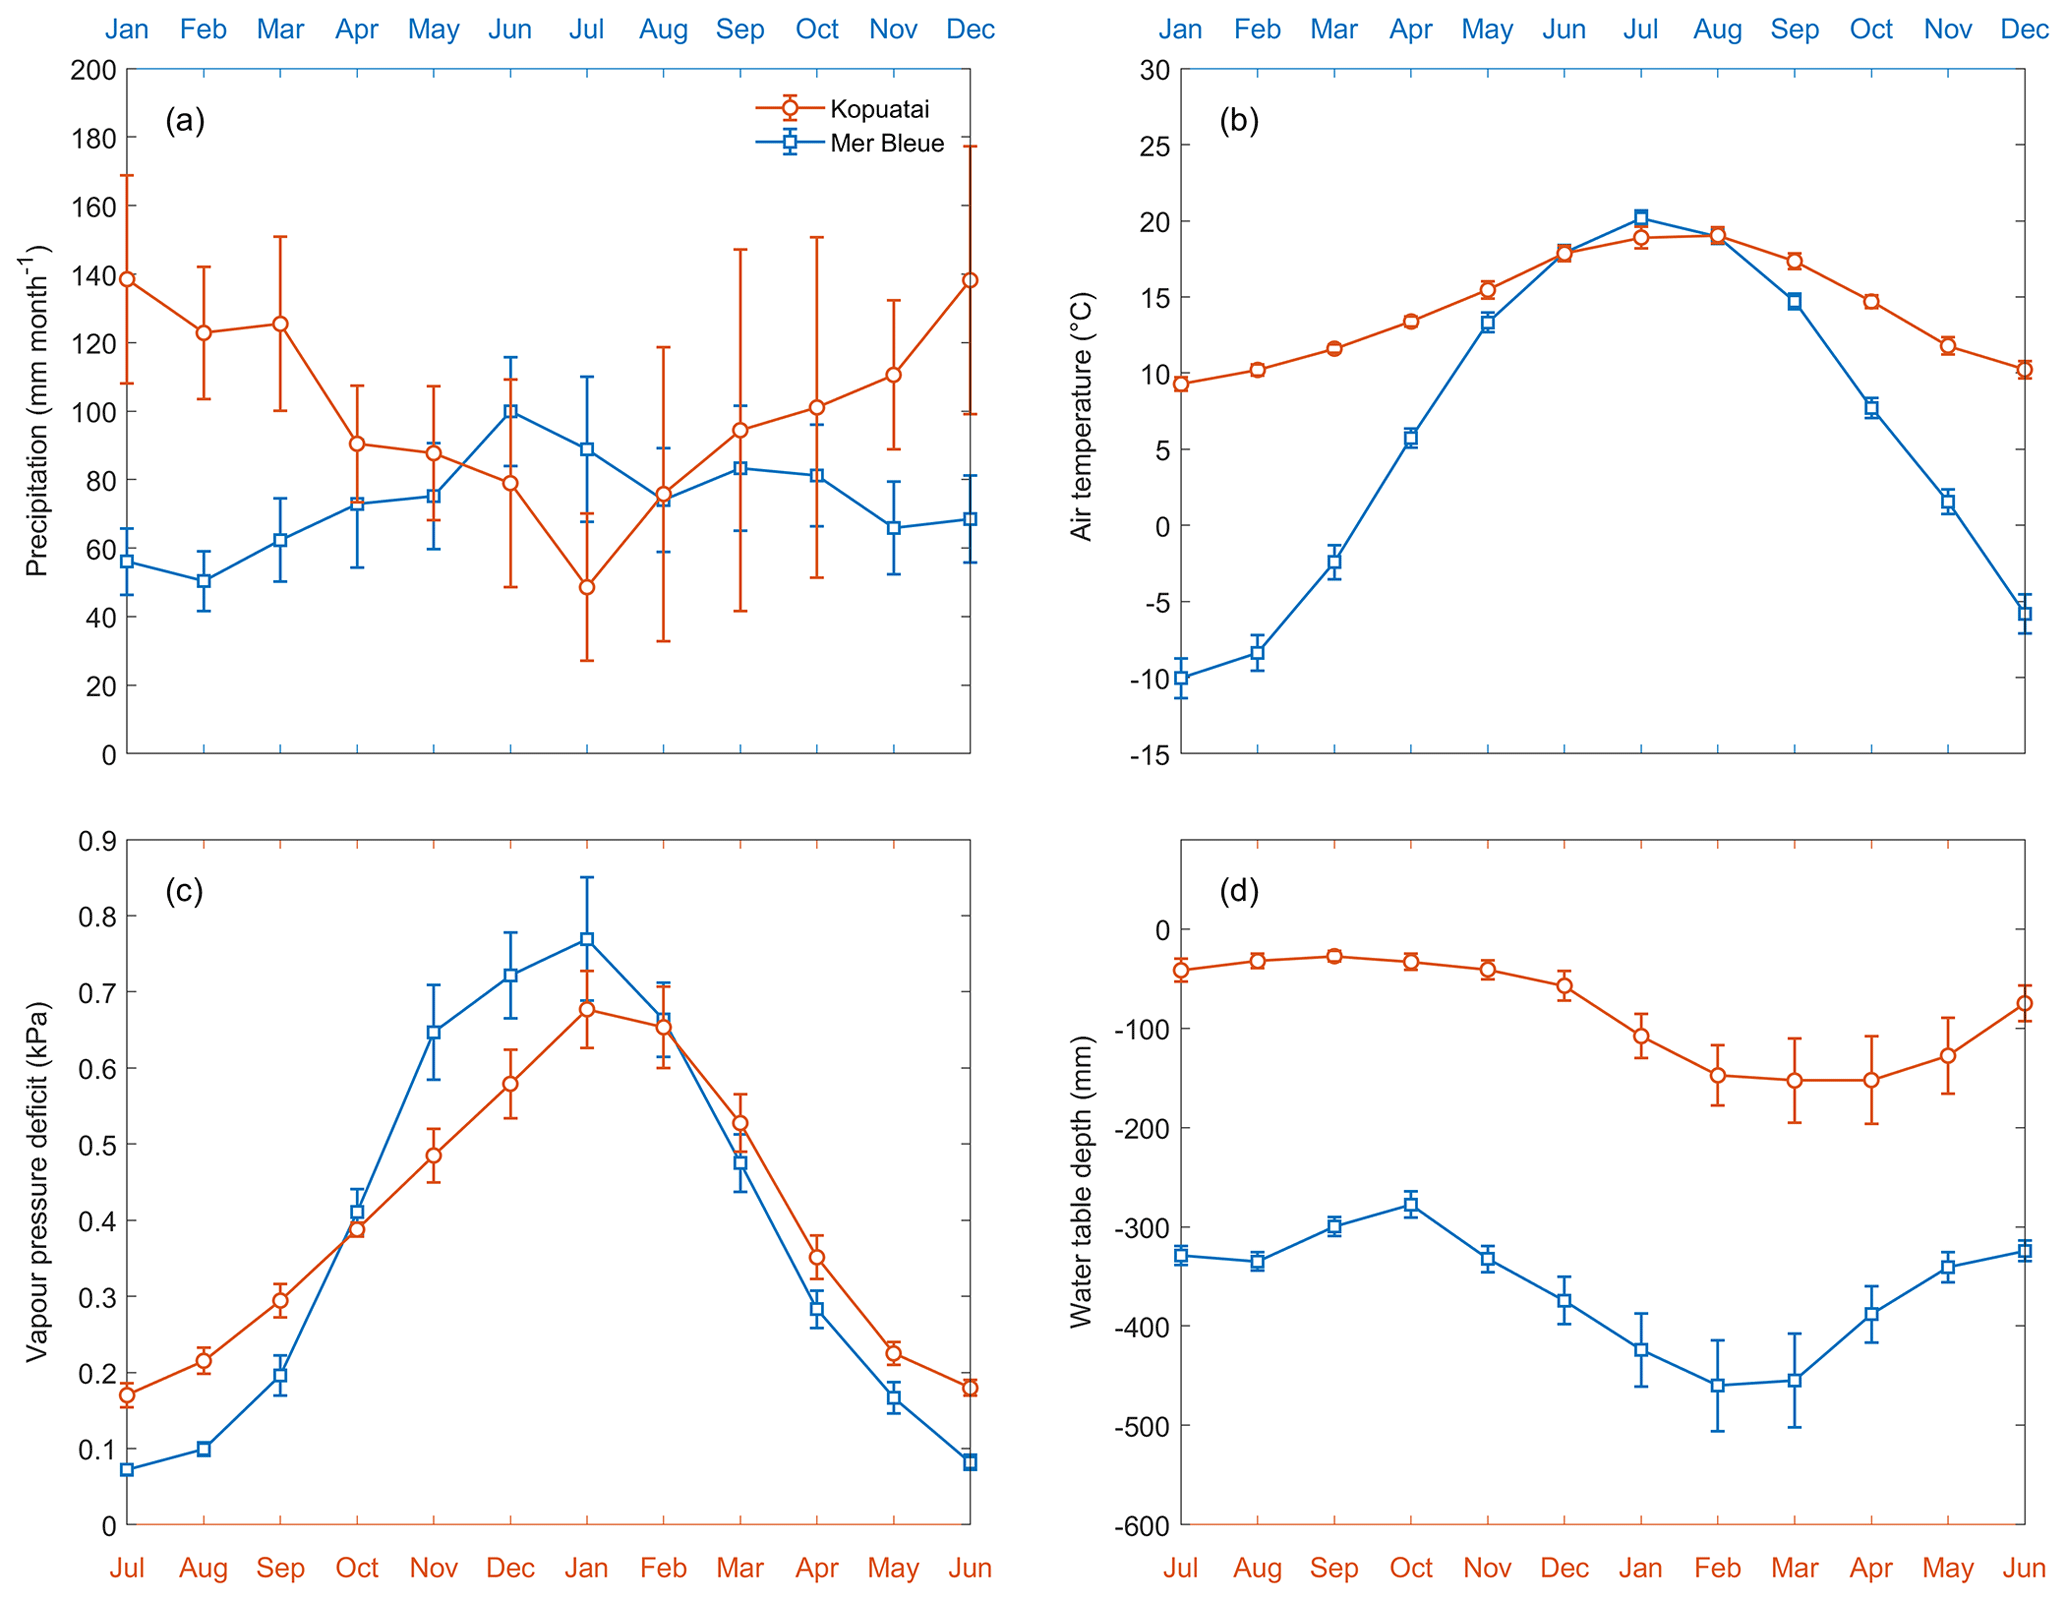
Figure 2Mean monthly (a) precipitation, (b) air temperature, (c) vapour pressure deficit, and (d) water table depth at Kopuatai (orange) and Mer Bleue (blue). These values were calculated using data between 2012–2022 (inclusive) at Kopuatai and 1999–2018 (inclusive) at Mer Bleue. Error bars are 95 % confidence intervals. Note that the Northern and Southern Hemisphere seasons have been aligned using separate x axes for each site (January–December for Mer Bleue and July–June for Kopuatai).
3.2 Evaporation and equilibrium evaporation
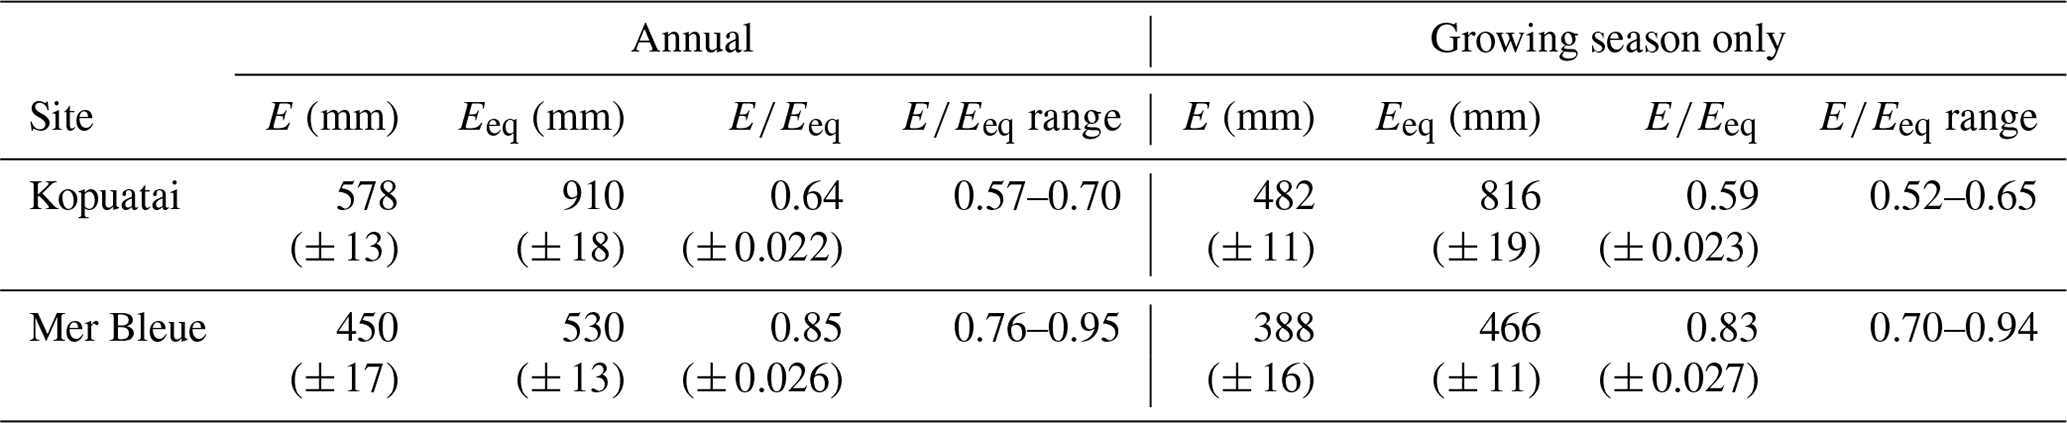
Mean annual E and Eeq were larger at Kopuatai compared to Mer Bleue; however, mean annual was lower at Kopuatai (Table 1). In addition, growing-season and year-round mean values were very similar at each respective site. At both sites, mean monthly E was less than Eeq, except during winter (Fig. 3). Both variables followed an expected seasonal pattern of low values in winter and high values in summer, mostly driven by the amount of radiation received. The difference between Eeq and E was larger at Kopuatai than at Mer Bleue in non-winter months; the maximum difference between monthly Eeq and E was 71 mm in January at Kopuatai but only 21 mm in May at Mer Bleue. Both E and Eeq were close to zero at Mer Bleue during winter (December–February), when Tair was below 0 °C and the bog was snow-covered, and both values were similar during spring (March) and autumn (October) months.
Table 1Mean annual ecosystem evaporation (E) and equilibrium evaporation (Eeq), with means and ranges of their ratios (i.e. Priestley–Taylor α) at each site (n=11 and 20 years for Kopuatai and Mer Bleue, respectively). These values are given for both year-round data and for the growing season only (September–May at Kopuatai and May–October at Mer Bleue). Values in parentheses are 95 % confidence intervals.
3.3 Dry-canopy energy balance partitioning
Seasonal energy balance partitioning was markedly different at each site. At Kopuatai, H was greater than LE in most months, with LE only comprising 21 % of annual Rn (Fig. 4). During autumn and winter (April to August), however, the difference between H and LE was smaller. In contrast, LE was a much larger component of the energy balance at Mer Bleue, representing 43 % of the annual Rn due to LE exceeding H throughout most of the growing season. During the rest of the year, however, LE was either less than or similar to H. There was also a difference in the seasonality of LE, H, and Rn between sites – at Kopuatai, all components of the energy balance reached a maximum during summer; LE and Rn peaked in midsummer (January), while H peaked a month earlier. At Mer Bleue, LE and Rn also peaked during summer (in June and July, respectively); however, H peaked in the middle of spring (April).
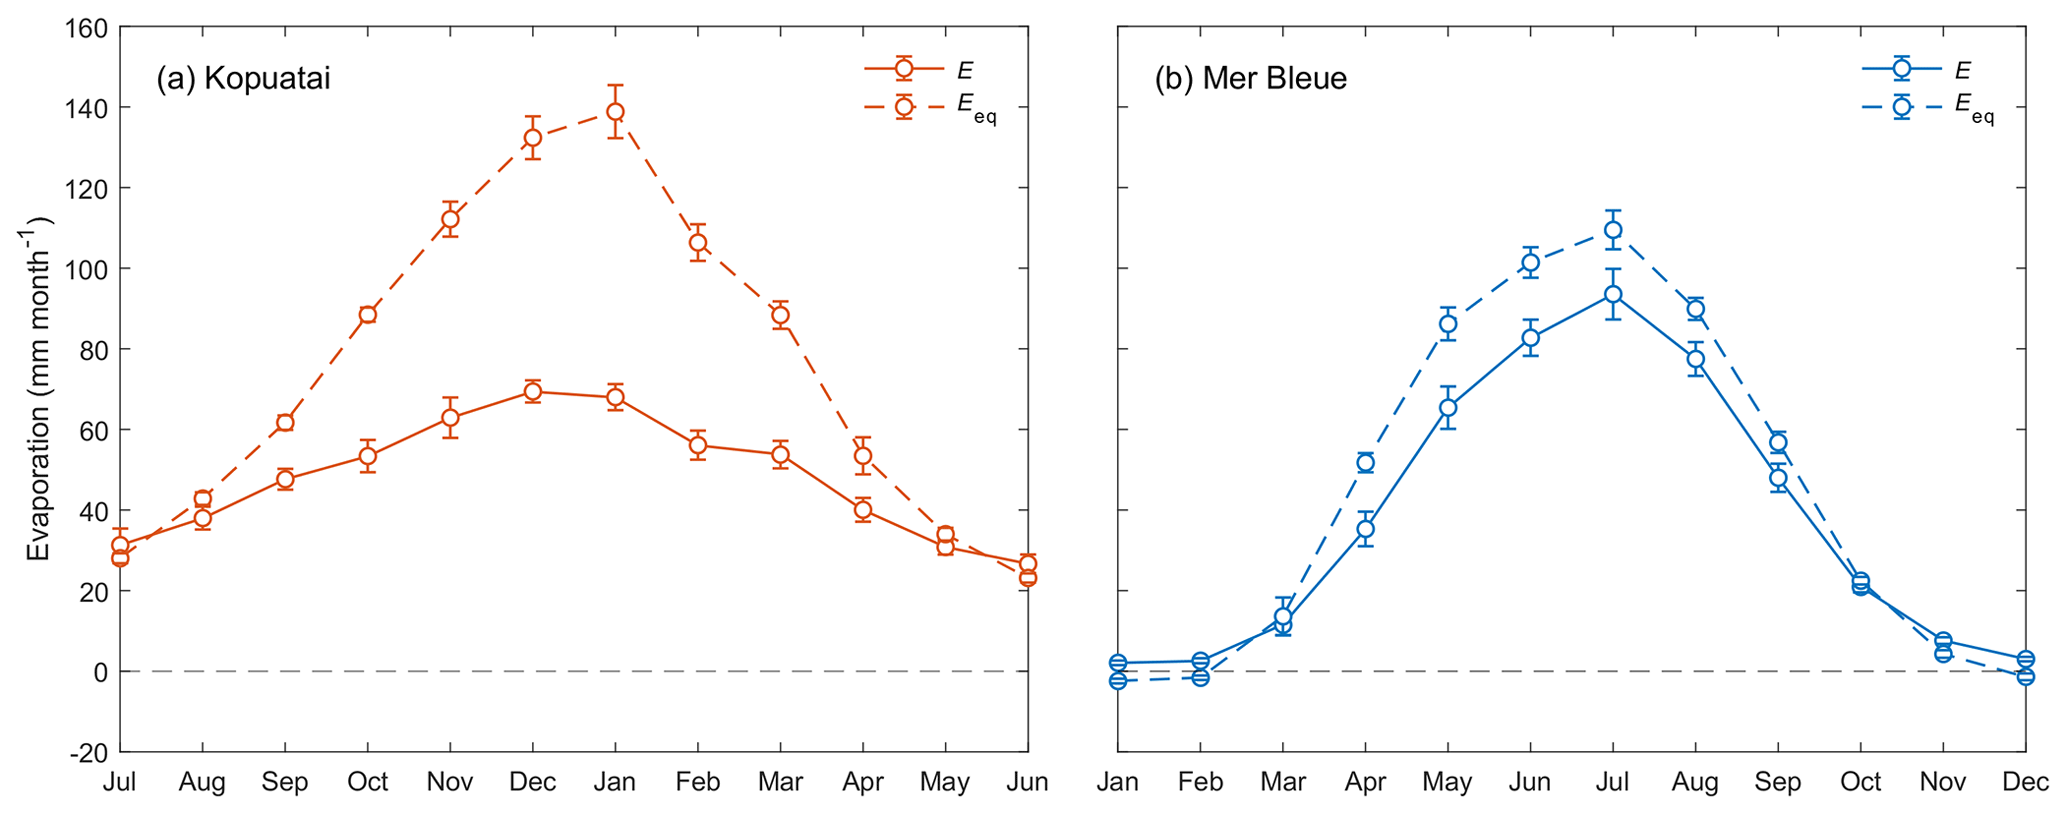
Figure 3Mean monthly evaporation (E) and equilibrium evaporation (Eeq) at (a) Kopuatai and (b) Mer Bleue. Error bars represent 95 % confidence intervals. Note that the x axis for Kopuatai in the Southern Hemisphere starts from July (a 6-month offset from the graph for Mer Bleue in the Northern Hemisphere).
Mean monthly LE increased substantially (monthly range–257 W m−2) towards summer at Mer Bleue, while at Kopuatai, there was less monthly variation in LE (range–79 W m−2). Although maximum monthly Rn (±95 % confidence interval) at Kopuatai was higher than at Mer Bleue (578 ± 26.0 and 480 ± 17.7 W m−2, respectively), maximum monthly LE at Kopuatai (124 ± 6.45 W m−2) was lower relative to Mer Bleue (264 ± 17.0 W m−2). Consequently, maximum monthly H was higher at Kopuatai than at Mer Bleue (304 ± 30.5 and 191 ± 7.57 W m−2, respectively). In addition, Rn was particularly low in winter at Mer Bleue due to snow cover increasing albedo and the lower solar radiation. During spring, Rn increased steeply (March and April) due to a decrease in albedo following snowmelt. In contrast, Kopuatai does not receive snow, and seasonal albedo of the evergreen plant canopy hardly varies (not shown).
Middle-of-day mean energy balance partitioning during dry-canopy conditions was also distinctly different between Kopuatai and Mer Bleue (Fig. 5). At Kopuatai, H was a much larger component of the energy balance than LE (Fig. 5a); Hwas greater than LE at Rn≥450 W m−2, which was reflected in a mean Bowen ratio (β) of 2.0 (β range based on binned H and LE values was 0.43–3.11). At Mer Bleue, however, LE was either similar to or greater than H (Fig. 5b). As a result, mean β was 0.80, with a range of 0.63–1.05.
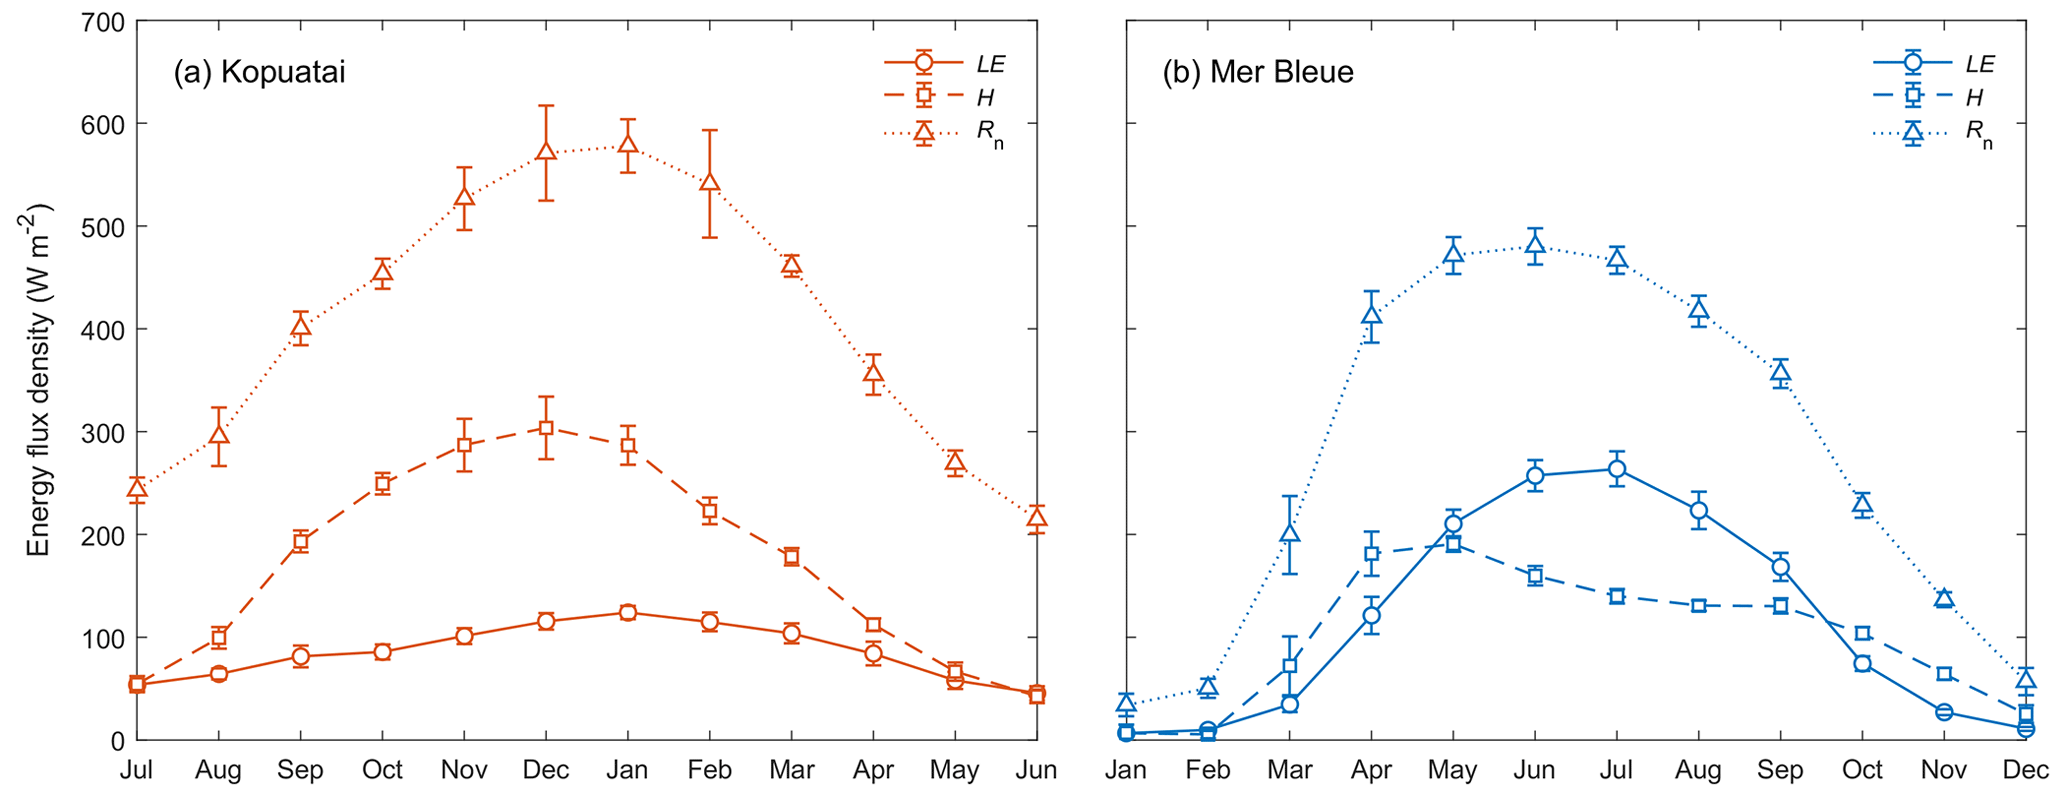
Figure 4Mean monthly energy balance partitioning (latent heat flux, LE, sensible heat flux, H, and net radiation, Rn) at (a) Kopuatai and (b) Mer Bleue for middle-of-day dry-canopy conditions. Error bars are 95 % confidence intervals. Note that the x axis for Kopuatai in the Southern Hemisphere starts from July (a 6-month offset from the graph for Mer Bleue in the Northern Hemisphere).
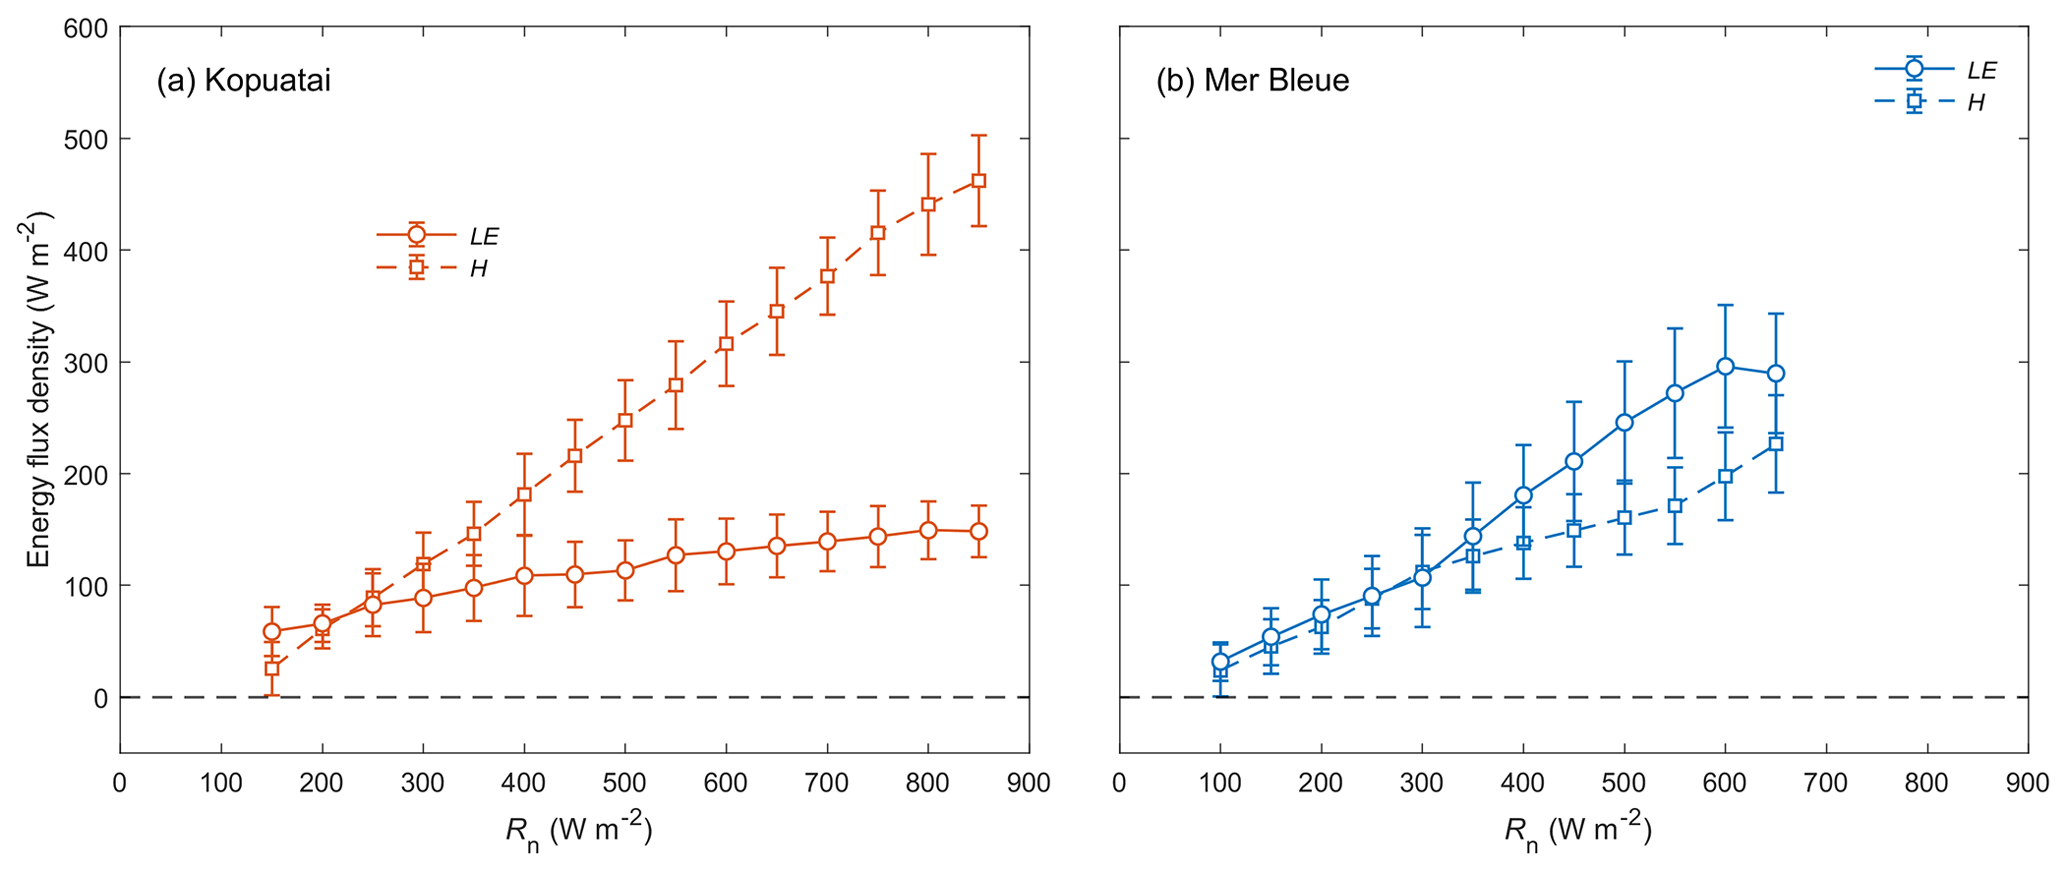
Figure 5Relationship between binned mean middle-of-day latent and sensible heat fluxes (LE and H) versus net radiation (Rn) for dry-canopy conditions at (a) Kopuatai and (b) Mer Bleue. Values are for the growing season only (September–May at Kopuatai and May–October at Mer Bleue). Error bars are standard deviations.
3.4 Wet-canopy energy balance partitioning
During wet-canopy conditions, the limitation on LE observed at Kopuatai under dry-canopy conditions was not apparent (Fig. 6a); LE was greater than H at both low and high Rn in these conditions (β ranged between 0.01–0.94, with a mean of 0.48). Both LE and H increased at approximately the same rate with increasing Rn. At Mer Bleue, the relationship between LE, H, and Rn under wet-canopy conditions appeared similar to that under dry-canopy conditions, with a lower mean β of 0.58 and a range of −0.37 to 0.85 (Fig. 6b).
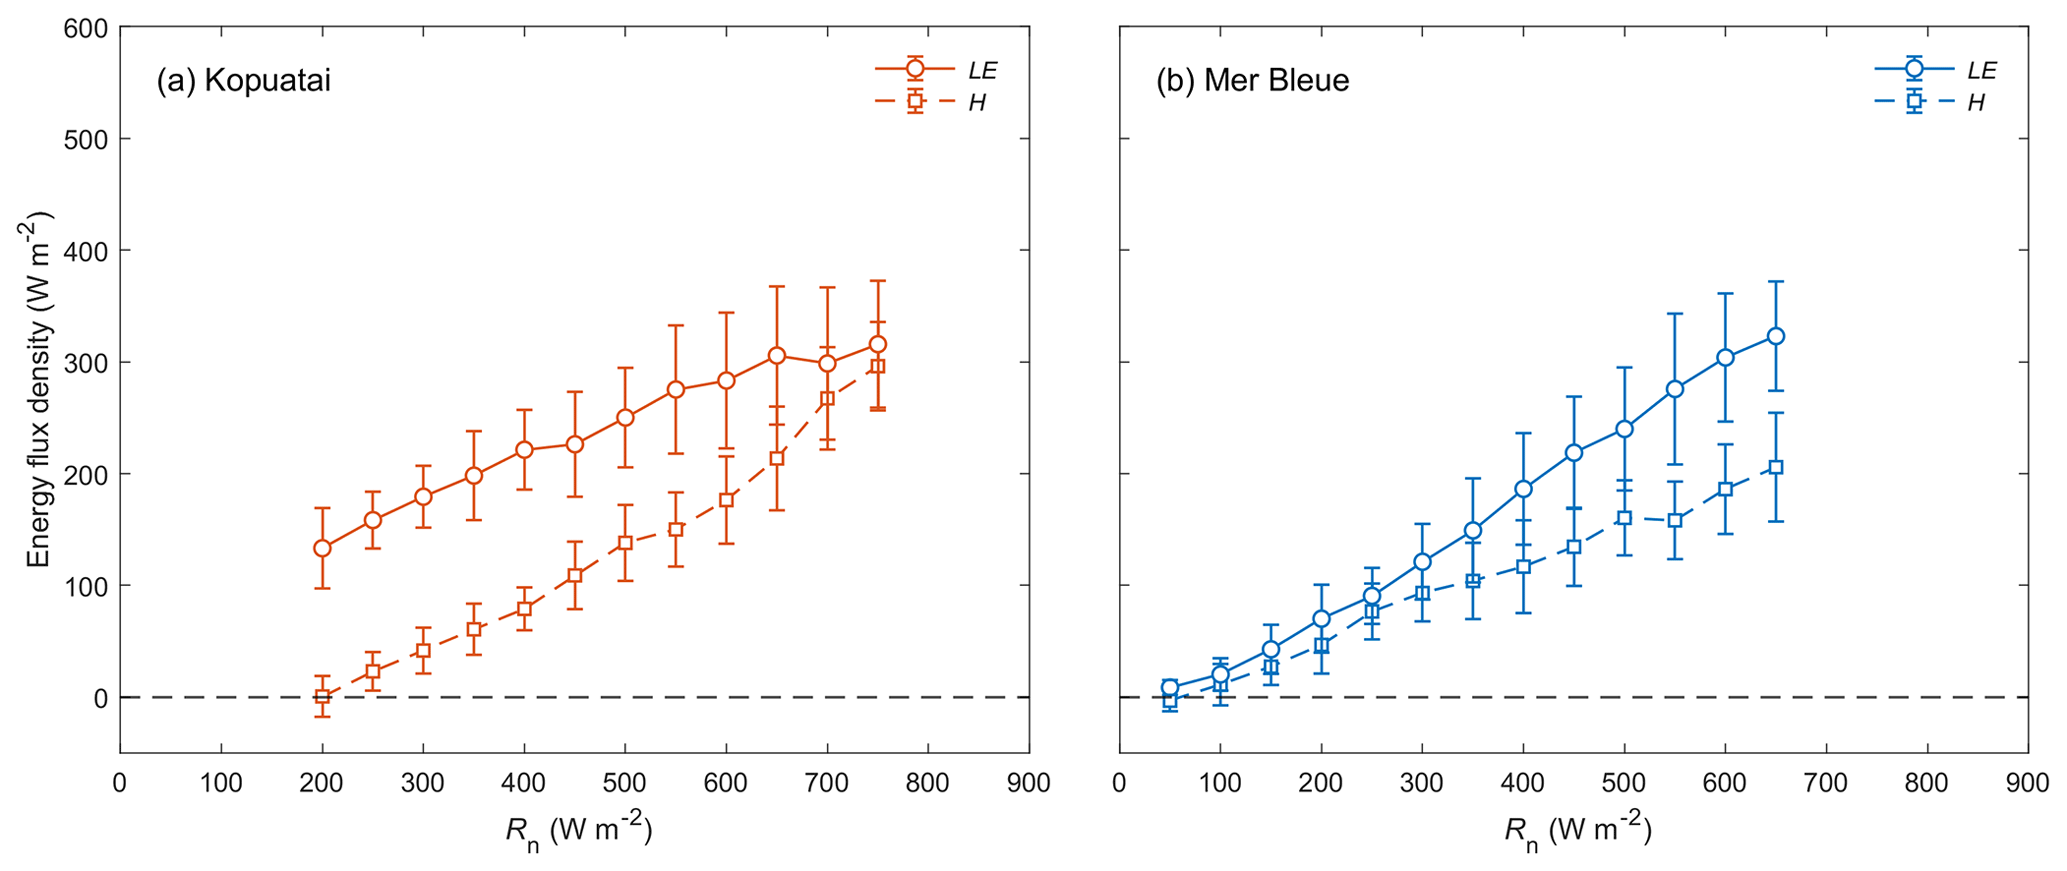
Figure 6Relationship between binned mean middle-of-day latent and sensible heat fluxes (LE and H) versus net radiation (Rn) for wet-canopy conditions at (a) Kopuatai and (b) Mer Bleue. Values are for the growing season only (September–May at Kopuatai and May–October at Mer Bleue). Error bars are standard deviations.
3.5 Response of E, EF, and gc to VPD
Dry-canopy E rates increased with increasing VPD at both sites; i.e. greater water loss occurred at high VPD (Fig. 7a). For VPD < 2.0 kPa, the rate of increase in E with increasing VPD was 3.4 times larger at Mer Bleue (0.217 mm h−1 kPa−1) than at Kopuatai (0.064 mm h−1 kPa−1). This resulted in a higher E rate of 0.44 mm h−1 at a VPD of 2.0 kPa at Mer Bleue compared to only 0.23 mm h−1 at the same VPD at Kopuatai. Beyond a VPD of 2.0 kPa, E showed little or no change with increasing VPD at both sites.
At Kopuatai, EF decreased in response to increasing VPD, while the opposite trend was observed at Mer Bleue (Fig. 7b). These contrasting responses of EF to increasing VPD were also evident in the 30 min data (Appendix D). At Kopuatai, mean daytime EF decreased from 0.43 at a VPD of 0.5 kPa to 0.28 at 2.7 kPa and increased from 0.32 at 0.4 kPa to 0.66 at 3.3 kPa at Mer Bleue. At both sites, the rate of increase or decrease in EF was reduced at VPD > 1.0 kPa.
There was a steep decline in gc with increasing VPD at Kopuatai (Fig. 7c); mean gc decreased from a maximum of 10.0 mm s−1 at a VPD of 0.5 kPa to a minimum of 2.55 mm s−1 at 2.7 kPa. In contrast, the pattern of declining gc with increasing VPD was weak at Mer Bleue, decreasing from 9.63 mm s−1 at 0.4 kPa to 6.20 mm s−1 at 3.3 kPa.
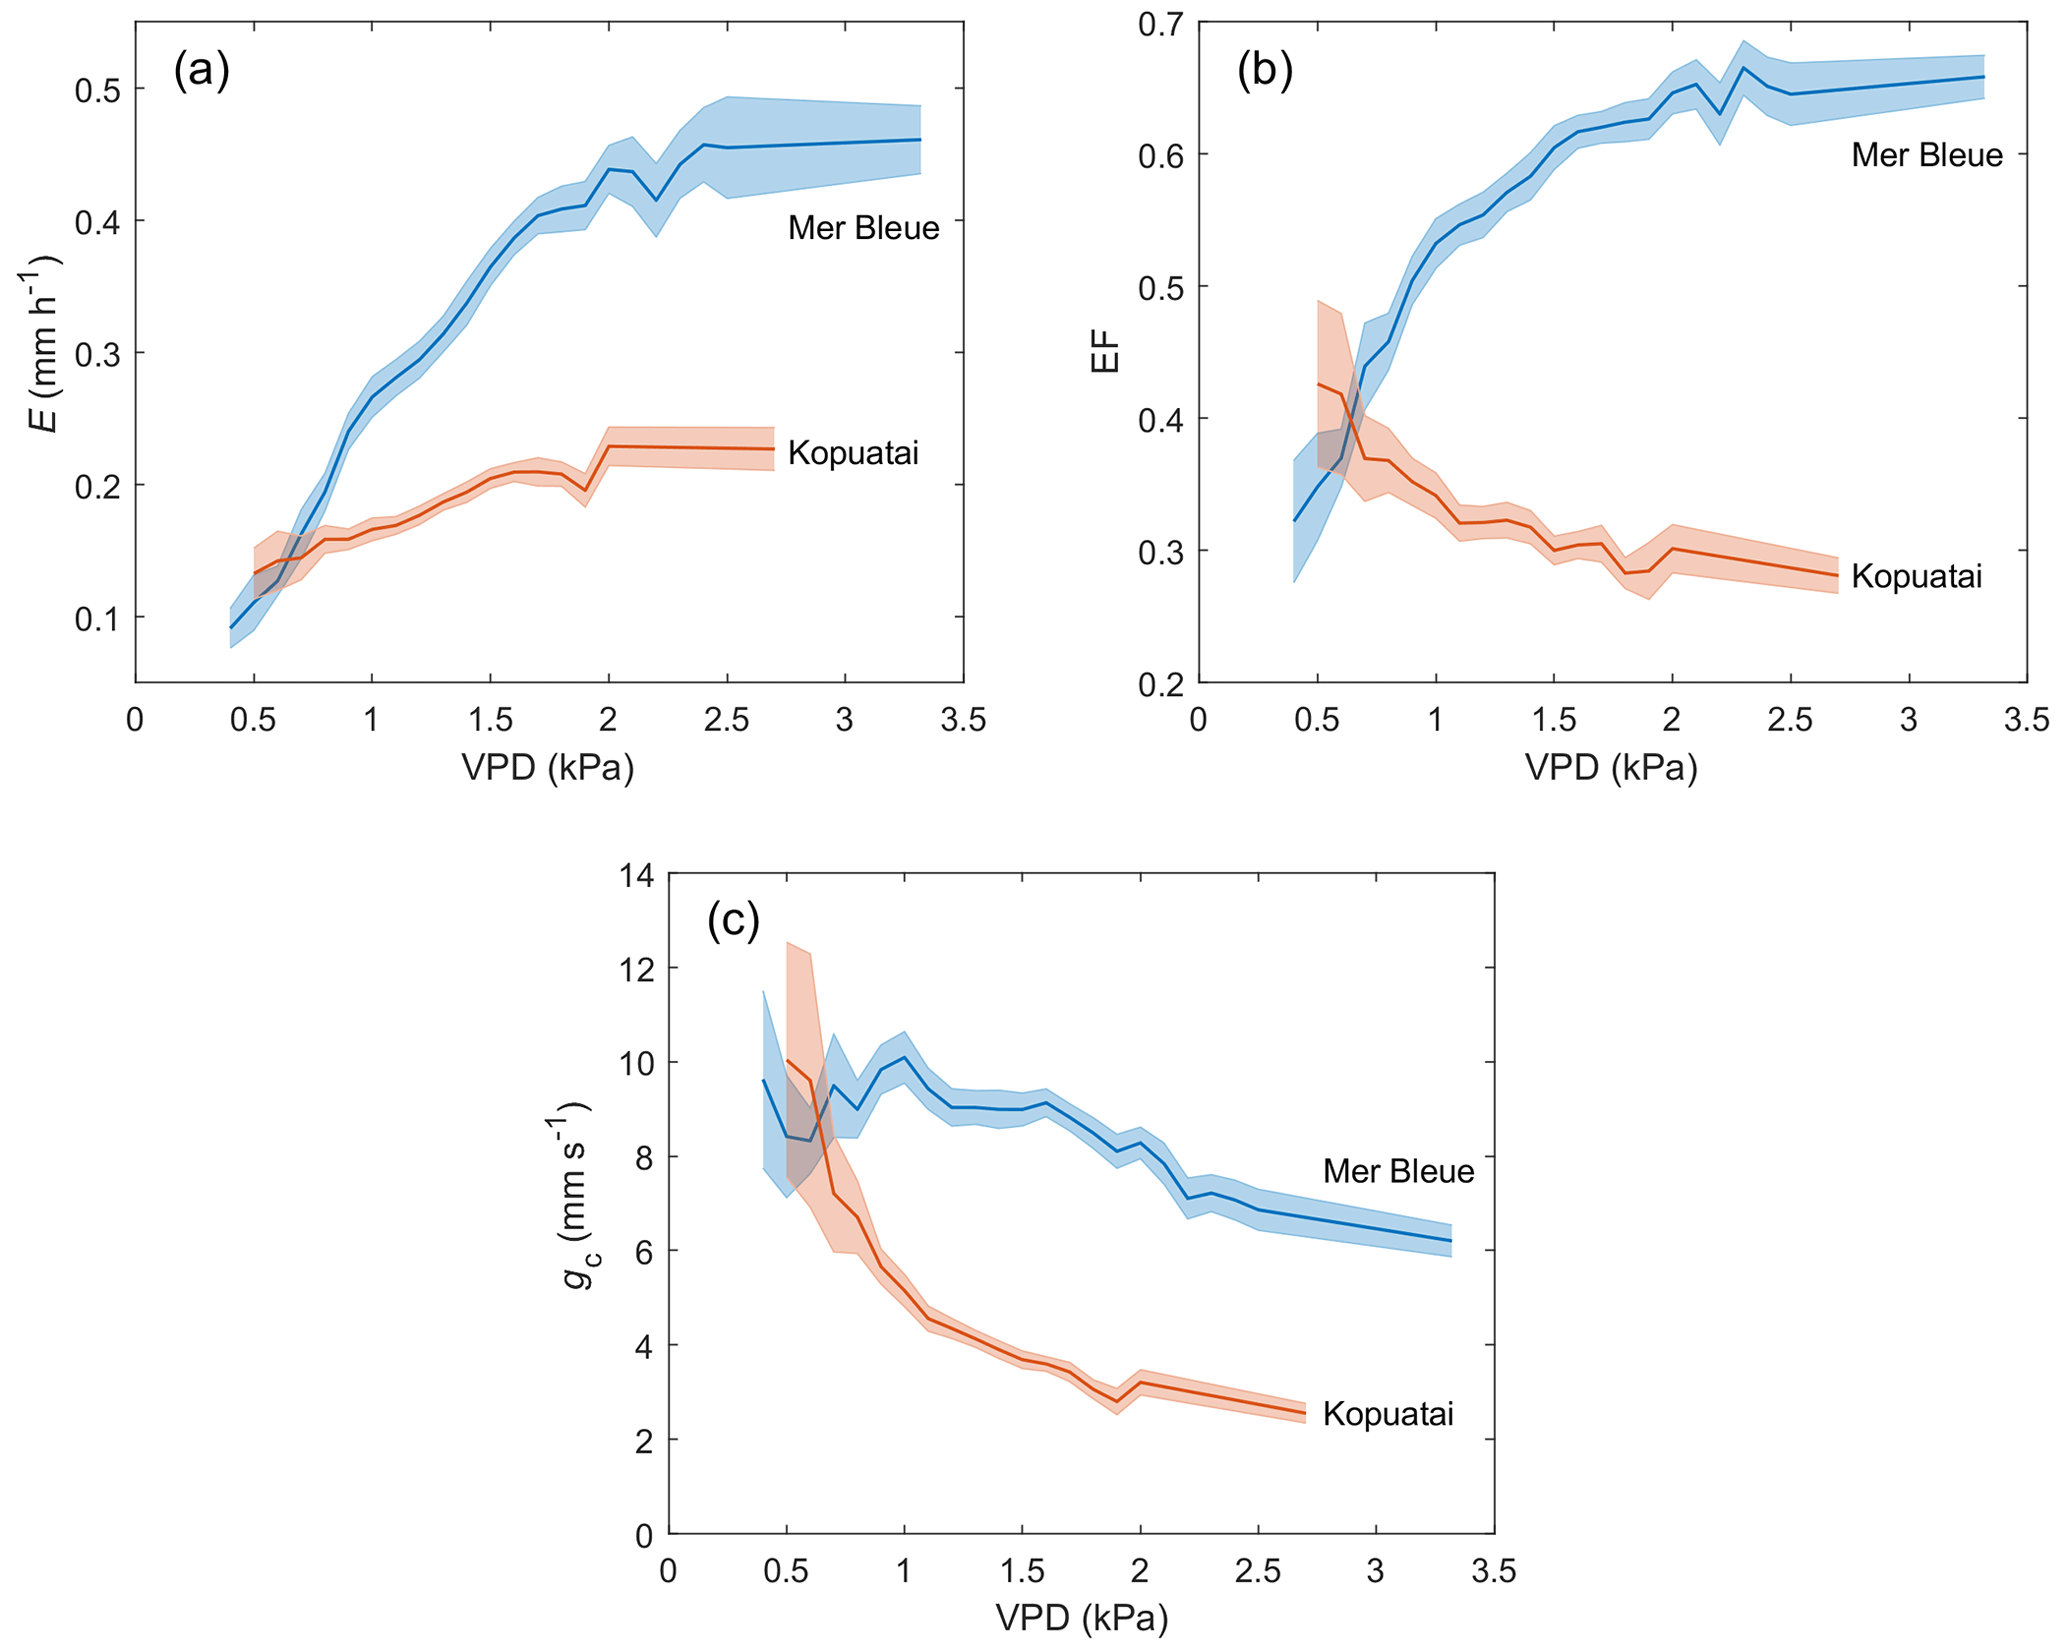
Figure 7Middle-of-day mean growing-season (a) evaporation (E), (b) evaporative fraction (EF), and (c) canopy conductance (gc) for 0.1 kPa bins of vapour pressure deficit (VPD) during dry-canopy conditions at Kopuatai and Mer Bleue. Shaded areas represent 95 % confidence intervals.
4.1 Evaporation regimes
Our study demonstrates the crucial importance of vegetation characteristics in controlling water losses from peatlands. Kopuatai and Mer Bleue, two ombrotrophic bogs with different vegetation communities, display strikingly different evaporation regimes; energy balance partitioning; and responses of E, EF, and gc to VPD. Despite being in a warmer climate zone with warm winters, the E regime at Kopuatai was more conservative than that at Mer Bleue. Although mean annual E and Eeq were 25 % and 53 % higher at Kopuatai than at Mer Bleue, mean annual was 28 % lower at Kopuatai. This occurred because mean annual E was 45 % lower than mean annual Eeq at Kopuatai, while at Mer Bleue there was only a 16 % difference. The large difference between E and Eeq at Kopuatai occurred due to conservative E and due to the relatively high Eeq resulting from higher Rn (due to latitudinal differences), a warmer climate, and longer growing season compared to Mer Bleue. These results indicate that greater surface limitations were imposed on E at Kopuatai relative to Mer Bleue. The difference in between the two sites is highly likely to be a result of differences in functional vegetation types as different vegetation communities, even at the same peatland, have been shown to result in contrasting E regimes (Takagi et al., 1999; Strilesky and Humphreys, 2012). As such, the substantial limitations on E observed at Kopuatai likely occurred due to the physiological and canopy structural features of the dominant vascular plant, E. robustum. However, some limitation on E was observed at Mer Bleue, as evidenced by the decrease in towards midsummer. It is possible that this occurred due to stomatal closure in the shrub vegetation in response to high VPD (Admiral et al., 2006). However, the impact of this limitation was weaker than at Kopuatai, likely due to high surface E from Sphagnum carpets at Mer Bleue (Admiral et al., 2006).
At Kopuatai, the entire range of values tended to be lower than at most Northern Hemisphere peatlands, while the range at Mer Bleue overlapped with the lower end of most of these ranges (Table 2; we could not find equivalent studies for Southern Hemisphere peatlands). However, there were some northern peatland sites with ranges that were closer to those of Kopuatai. For example, a tree-dominated peatland in Canada had a lower than at Kopuatai, which could be attributed to stomatal limitation of transpiration (Brümmer et al., 2012); i.e. the same mechanism of E limitation as was exhibited at Kopuatai but to a greater extent. Of interest is also the Fäjemyr bog in Sweden, which had lower growing-season values than most peatlands in Table 2 (but not Kopuatai), possibly due to a low water table and low surface conductance (Alekseychik et al., 2018). In addition, in an earlier study of E rates at Kopuatai, Thompson et al. (1999) reported lower values than those in this study; this likely occurred because measurements were made only during summer, when limitations on E are most prominent. Apart from these outliers, the values for Northern Hemisphere peatlands in Table 2 are generally much greater than those at Kopuatai bog, indicating that E. robustum may be more adept at restricting E than the vascular and non-vascular vegetation in most northern peatlands.
Table 2Summary of studies reporting the ratio of evaporation to equilibrium evaporation () for peatlands globally (including this study), with a description of the type of variability covered in the range of values and the time period for which they were calculated.
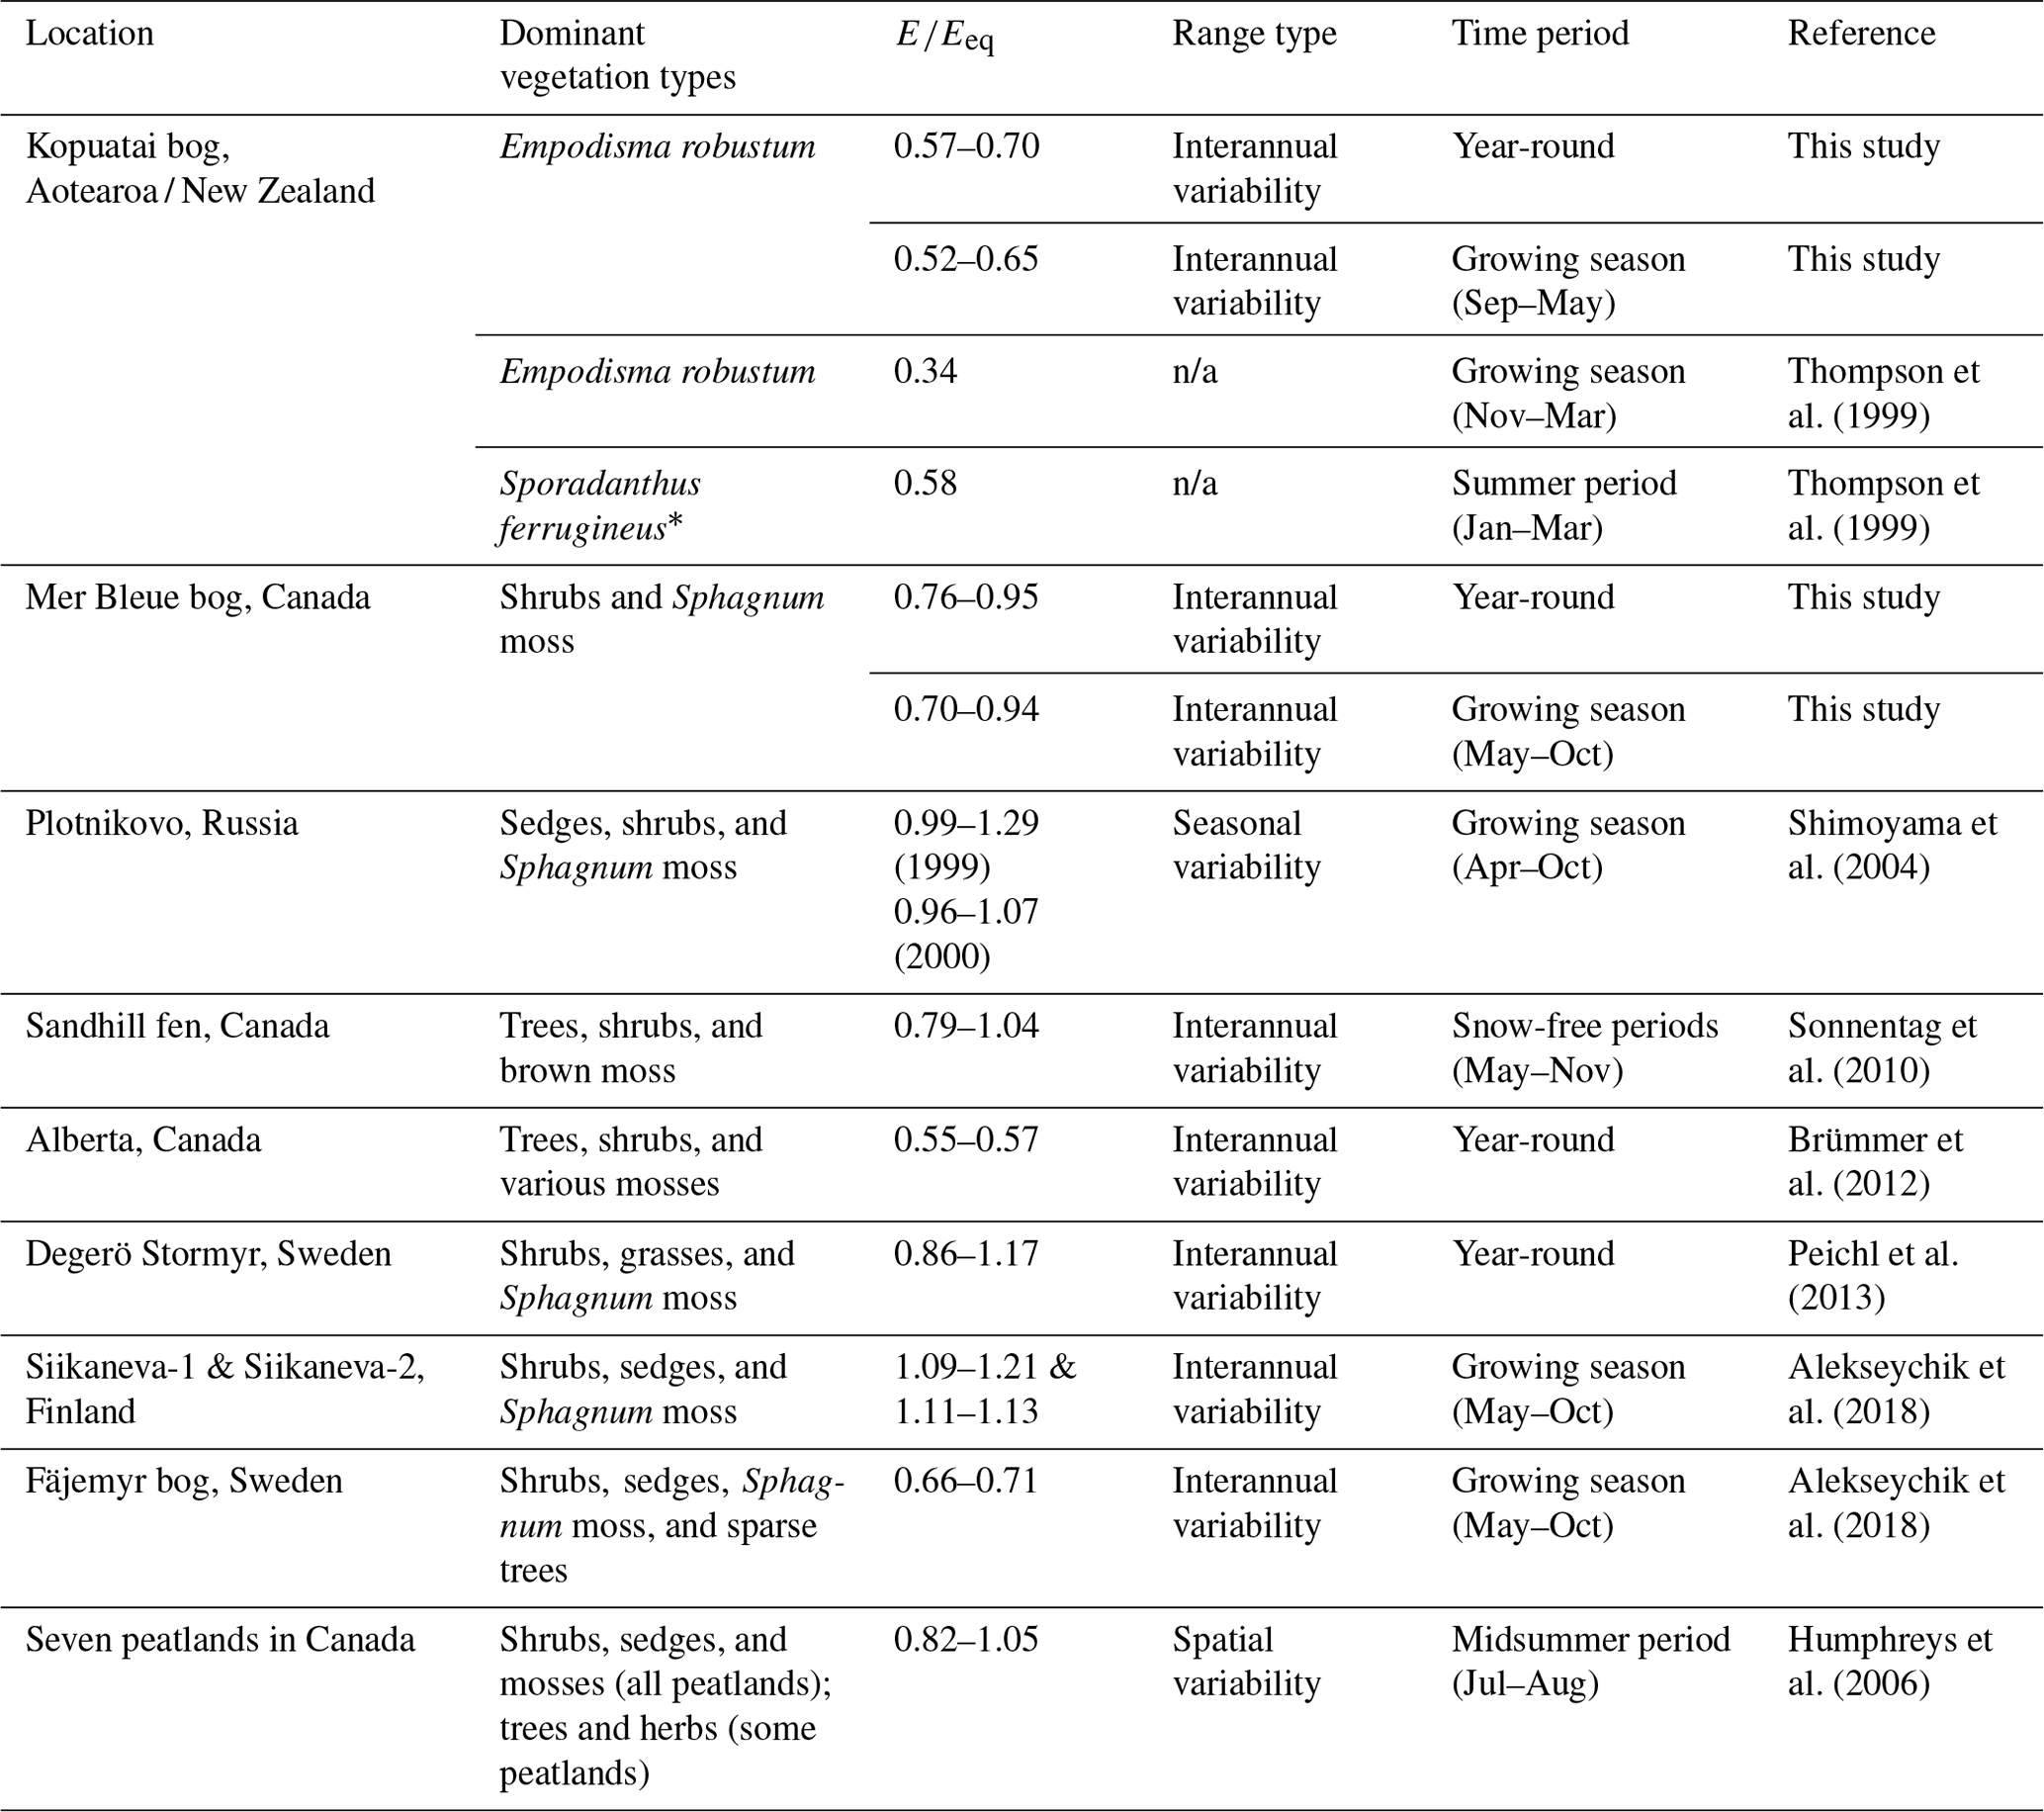
* A tall late-successional restiad plant that dominates portions of Kopuatai bog but is not present at the EC site. n/a – not applicable.
4.2 Controls on evaporation
Our analysis focused on VPD as the driver of changes in E, EF, and gc. However, VPD is strongly driven by Tair and humidity, with Tair, in turn, responding strongly to solar radiation via the surface radiation balance (Chang and Root, 1975; Grossiord et al., 2020). Disentangling the drivers of water vapour fluxes in vegetated environments is therefore challenging. At Kopuatai bog, Goodrich et al. (2015) used modified light-response models to disentangle the primary seasonal drivers of gross primary production (GPP) for the E. robustum canopy. Summertime GPP was strongly limited under high VPD conditions rather than under high Tair, which they concluded was due to VPD-induced stomatal closure, implying that the transpiration component of E would be affected by changes in VPD. This variable has also been observed to drive stomatal response in other wetland settings (Takagi et al., 1998; Aurela et al., 2007; Otieno et al., 2012).
The steep decline in EF with increasing VPD at Kopuatai suggests strong surface controls on E. A similar negative relationship between midsummer and VPD was shown by Takagi et al. (1999) at a section of a peatland invaded by vascular vegetation, which was attributed to stomatal closure. This is also likely to be the main factor limiting E from Kopuatai due to the non-linear decrease in canopy conductance (gc) with increasing VPD, a trend that has also been observed in other peatlands (Humphreys et al., 2006; Peichl et al., 2013; Runkle et al., 2014; Alekseychik et al., 2018). However, it has also been hypothesised that the standing litter layer formed by E. robustum reduces E (Campbell and Williamson, 1997); this canopy feature has been observed to limit E in marsh, restored wetland, and dryland ecosystems (Goulden et al., 2007; Villegas et al., 2010; Eichelmann et al., 2018). Standing litter restricts E by decoupling the subcanopy environment from atmospheric turbulence and by preventing solar radiation from reaching the surface, which minimises the variability in Tair and VPD below the litter layer (Goulden et al., 2007; Eichelmann et al., 2018). Although we cannot separate the effects of stomatal closure and standing litter on E, it is likely that both of these factors act in tandem to severely restrict E at Kopuatai.
At Mer Bleue, E rates were almost double those of Kopuatai at high VPD, and there was a greater absolute increase in dry-canopy LE with increasing Rn at Mer Bleue than at Kopuatai (an increase of 254 W m−2 compared to 93 W m−2, respectively), indicating weaker water loss restrictions at Mer Bleue. Weak restrictions likely occurred because of the large contribution of Sphagnum moss E during well-watered conditions as moss E is enhanced substantially by increasing VPD (Admiral and Lafleur, 2007). Since LE increased with increasing Rn, and E and EF increased with increasing VPD, both of these factors were important controls on E and energy partitioning at Mer Bleue. Similar positive correlations between LE and Rn (or available energy, Rn–G) at daily and monthly scales have previously been observed at other peatlands (Lafleur and Roulet, 1992; Kurbatova et al., 2002; Brümmer et al., 2012), in addition to positive relationships between daily E and VPD (Wu et al., 2010; Peichl et al., 2013; Wang et al., 2020).
There were also reduced rates of increase in E and EF with increasing VPD at Mer Bleue (i.e. a “saturating” effect; also observed in data presented by Peichl et al., 2013), which only became evident at high VPD (above ∼ 2.0 kPa for E and ∼ 1.0 kPa for EF; Fig. 7). This relatively weak E limitation was likely caused by stomatal control of transpiration by vascular vegetation (Admiral et al., 2006) as a slight decrease in gc was observed with increasing VPD. A similar relationship between surface conductance and VPD has previously been observed at Mer Bleue (Humphreys et al., 2006). It has also been suggested that E may become limited at high VPD if the transport rate of water through mosses is insufficient to meet the atmospheric demand (Liljedahl et al., 2011). While we cannot determine whether this occurred at Mer Bleue using the data available, it is possible that this may have been a contributing factor to limitations on E.
While there was almost no difference in energy balance partitioning between dry- and wet-canopy conditions at Mer Bleue, the canopy wetness state had a major effect at Kopuatai. During dry-canopy conditions, H was the dominant convective flux as the rate of increase in LE with increasing Rn was suppressed. However, LE became dominant over H during wet-canopy conditions, with a much greater rate of increase in LE with increasing Rn compared to dry-canopy conditions. A previous study at Kopuatai also reported dominance of LE over H when the canopy was rain-wetted, and vice versa during dry-canopy conditions (Campbell and Williamson, 1997). This contrast in energy partitioning likely occurred due to suppression of E from the moist peat surface by the dense standing litter layer of E. robustum during dry-canopy conditions.
The responses of E and EF to increasing VPD at Mer Bleue were consistent with previous findings by Helbig et al. (2020), which synthesised data from 35 boreal peatlands including Mer Bleue; however, the response at Kopuatai bog was closer to that of the boreal forests included in their study. As such, the response of E to VPD at Kopuatai bog is distinctive compared to boreal peatlands. This may be a critical adaptation that allows peat formation in a climate zone that is uncharacteristic for ombrotrophic peatlands (McGlone, 2009) due to the combination of moderate precipitation and a higher mean annual temperature than at Northern Hemisphere peatlands. Tropical peatlands also experience higher temperatures; however, annual precipitation tends to be much higher than at Kopuatai (>2500 mm in southeast Asia, for example; Page et al., 2006), which enables wet conditions to be maintained. Therefore, it is likely that the dominance of E. robustum at Kopuatai is crucial to the persistence of this peatland in an atypical peatland climate zone due to restrictions imposed on transpiration and sub-canopy E as these adaptations likely contribute to maintaining a shallow and stable water table.
4.3 Implications for future peatland water balances
Northern Hemisphere peatlands, such as Mer Bleue, may be at risk of increased evaporative water loss as VPD increases due to climate warming (Helbig et al., 2020). This could lead to more frequent low water tables and water deficits, which in turn may reduce net C uptake (Zhong et al., 2020; Kwon et al., 2022). The effect of low water tables on the C balance has previously been observed at Mer Bleue, where lowering of water levels at a beaver pond near the EC site caused a decrease in C uptake; further modelling also predicted that a beaver pond water table below ∼ 1.7 m would cause Mer Bleue to switch from a C sink to a source (He et al., 2023). Similar impacts were observed at Kopuatai during a severe drought in 2013, where monthly total ecosystem respiration increased in response to a slightly deeper water table, leading to a small reduction in the net annual C balance (Goodrich et al., 2017). At a drainage-affected bog near Kopuatai, multi-year data indicated that the water table was substantially lower year-round and caused lower C uptake rates compared to Kopuatai but likely remained a C sink due to the tolerance of E. robustum to a low and fluctuating water table (Ratcliffe et al., 2019). Therefore, C uptake at both Kopuatai and Mer Bleue could be impacted by decreased water tables; however, under increased VPD due to climate warming, it appears that Kopuatai may be able to retain more water than Northern Hemisphere peatlands through strong constraints on E. This greater water retention at Kopuatai could enable current high and stable annual net C uptake rates (Goodrich et al., 2017) to be maintained despite warmer and potentially drier conditions in the future (Lawrence et al., 2022). Therefore, we propose that the previously observed resilience of C uptake at Kopuatai to dry conditions (Goodrich et al., 2017) primarily results from “hydrological resistance” to increasing VPD driven by the water-conservative properties of the E. robustum canopy.
We compared ecosystem E regimes, energy balance partitioning, and the response of E to VPD at two peatlands – Kopuatai bog in Aotearoa / New Zealand and Mer Bleue bog in Canada. Our motivation was to determine whether regulation of water losses in these peatlands with different vegetation communities enables hydrological resistance to climatic drying. Our results demonstrated that the E regime was much more conservative at Kopuatai than at Mer Bleue at high VPD, likely due to restrictions imposed on gc by the dominant vegetation species, E. robustum. At Mer Bleue, E was only weakly limited at high VPD as the impacts of reduced shrub gc were likely offset by water loss from non-vascular moss surfaces. The greater limitations on E observed at Kopuatai indicate hydrological resistance of this vascular-plant-dominated ecosystem to hydro-climatic change. Importantly, this resistance likely contributes to resilience of the net C sink at Kopuatai, despite being located in a warm-temperate climate zone, and is thus a key self-regulation mechanism. As a result, it appears that Kopuatai may be better equipped to conserve water and maintain high net C uptake rates than Mer Bleue, and perhaps other Northern Hemisphere peatlands, in the face of climate-change-induced warming and drying. Further investigation of E partitioning into transpiration, interception loss, and peat surface E and the role of the dense standing litter layer for E regulation at Kopuatai may yield additional insights into this observed hydrological resistance.
Table A1Methods and instruments used for data collection at Kopuatai and Mer Bleue.
The antecedent precipitation index (API) is an exponential function used to predict the duration of canopy wetness after a rainfall event, with inputs of rainfall depth and time since rainfall (Keyte Beattie, 2014). Initially conceived by Woods and Rowe (1996) for predicting catchment moisture conditions prior to a rain event, the API function was then modified by Smith (2003) to estimate canopy wetness state:
where Pi is precipitation (mm) measured during the ith half-hour period before the current half hour and j is the moving-window size in half-hours (48 in this study). An example of modelled canopy drying using the API function is shown in Fig. B1. An API value of 0.2 units or less approximately represents a dry canopy, meaning that E is predominantly sourced from peat surface E and transpiration. When the API value is greater than or equal to 1, the vegetation canopy is wet and interception loss is the dominant source of E.
Predictions of canopy wetness using API have been shown to correspond reasonably well with leaf wetness sensor measurements at Kopuatai using an API period of 18 h for the upper canopy, 36 h for the standing litter layer, and 60 h for the lower canopy (Keyte Beattie, 2014). In this study, we defined wet-canopy periods as times when the upper canopy was saturated, i.e. when interception loss likely made up the majority of E, so an 18 h API period would likely be appropriate for this study. However, in order to conservatively identify periods with a dry upper canopy, i.e. for greater certainty that the canopy is dry when API ≤ 0.2, a slightly longer period of 24 h was used. While this approach has only been tested in the field at Kopuatai, for consistency we used the same function for separating wet- and dry-canopy measurements at Mer Bleue. Given the relatively sparse shrub canopy and absence of standing litter at Mer Bleue, API should provide conservative estimates of canopy dryness. The use of MoD data in this study was beneficial as it reduced the impact of early morning wetting from dew, therefore reducing the number of instances where API predicted canopy wetness incorrectly.
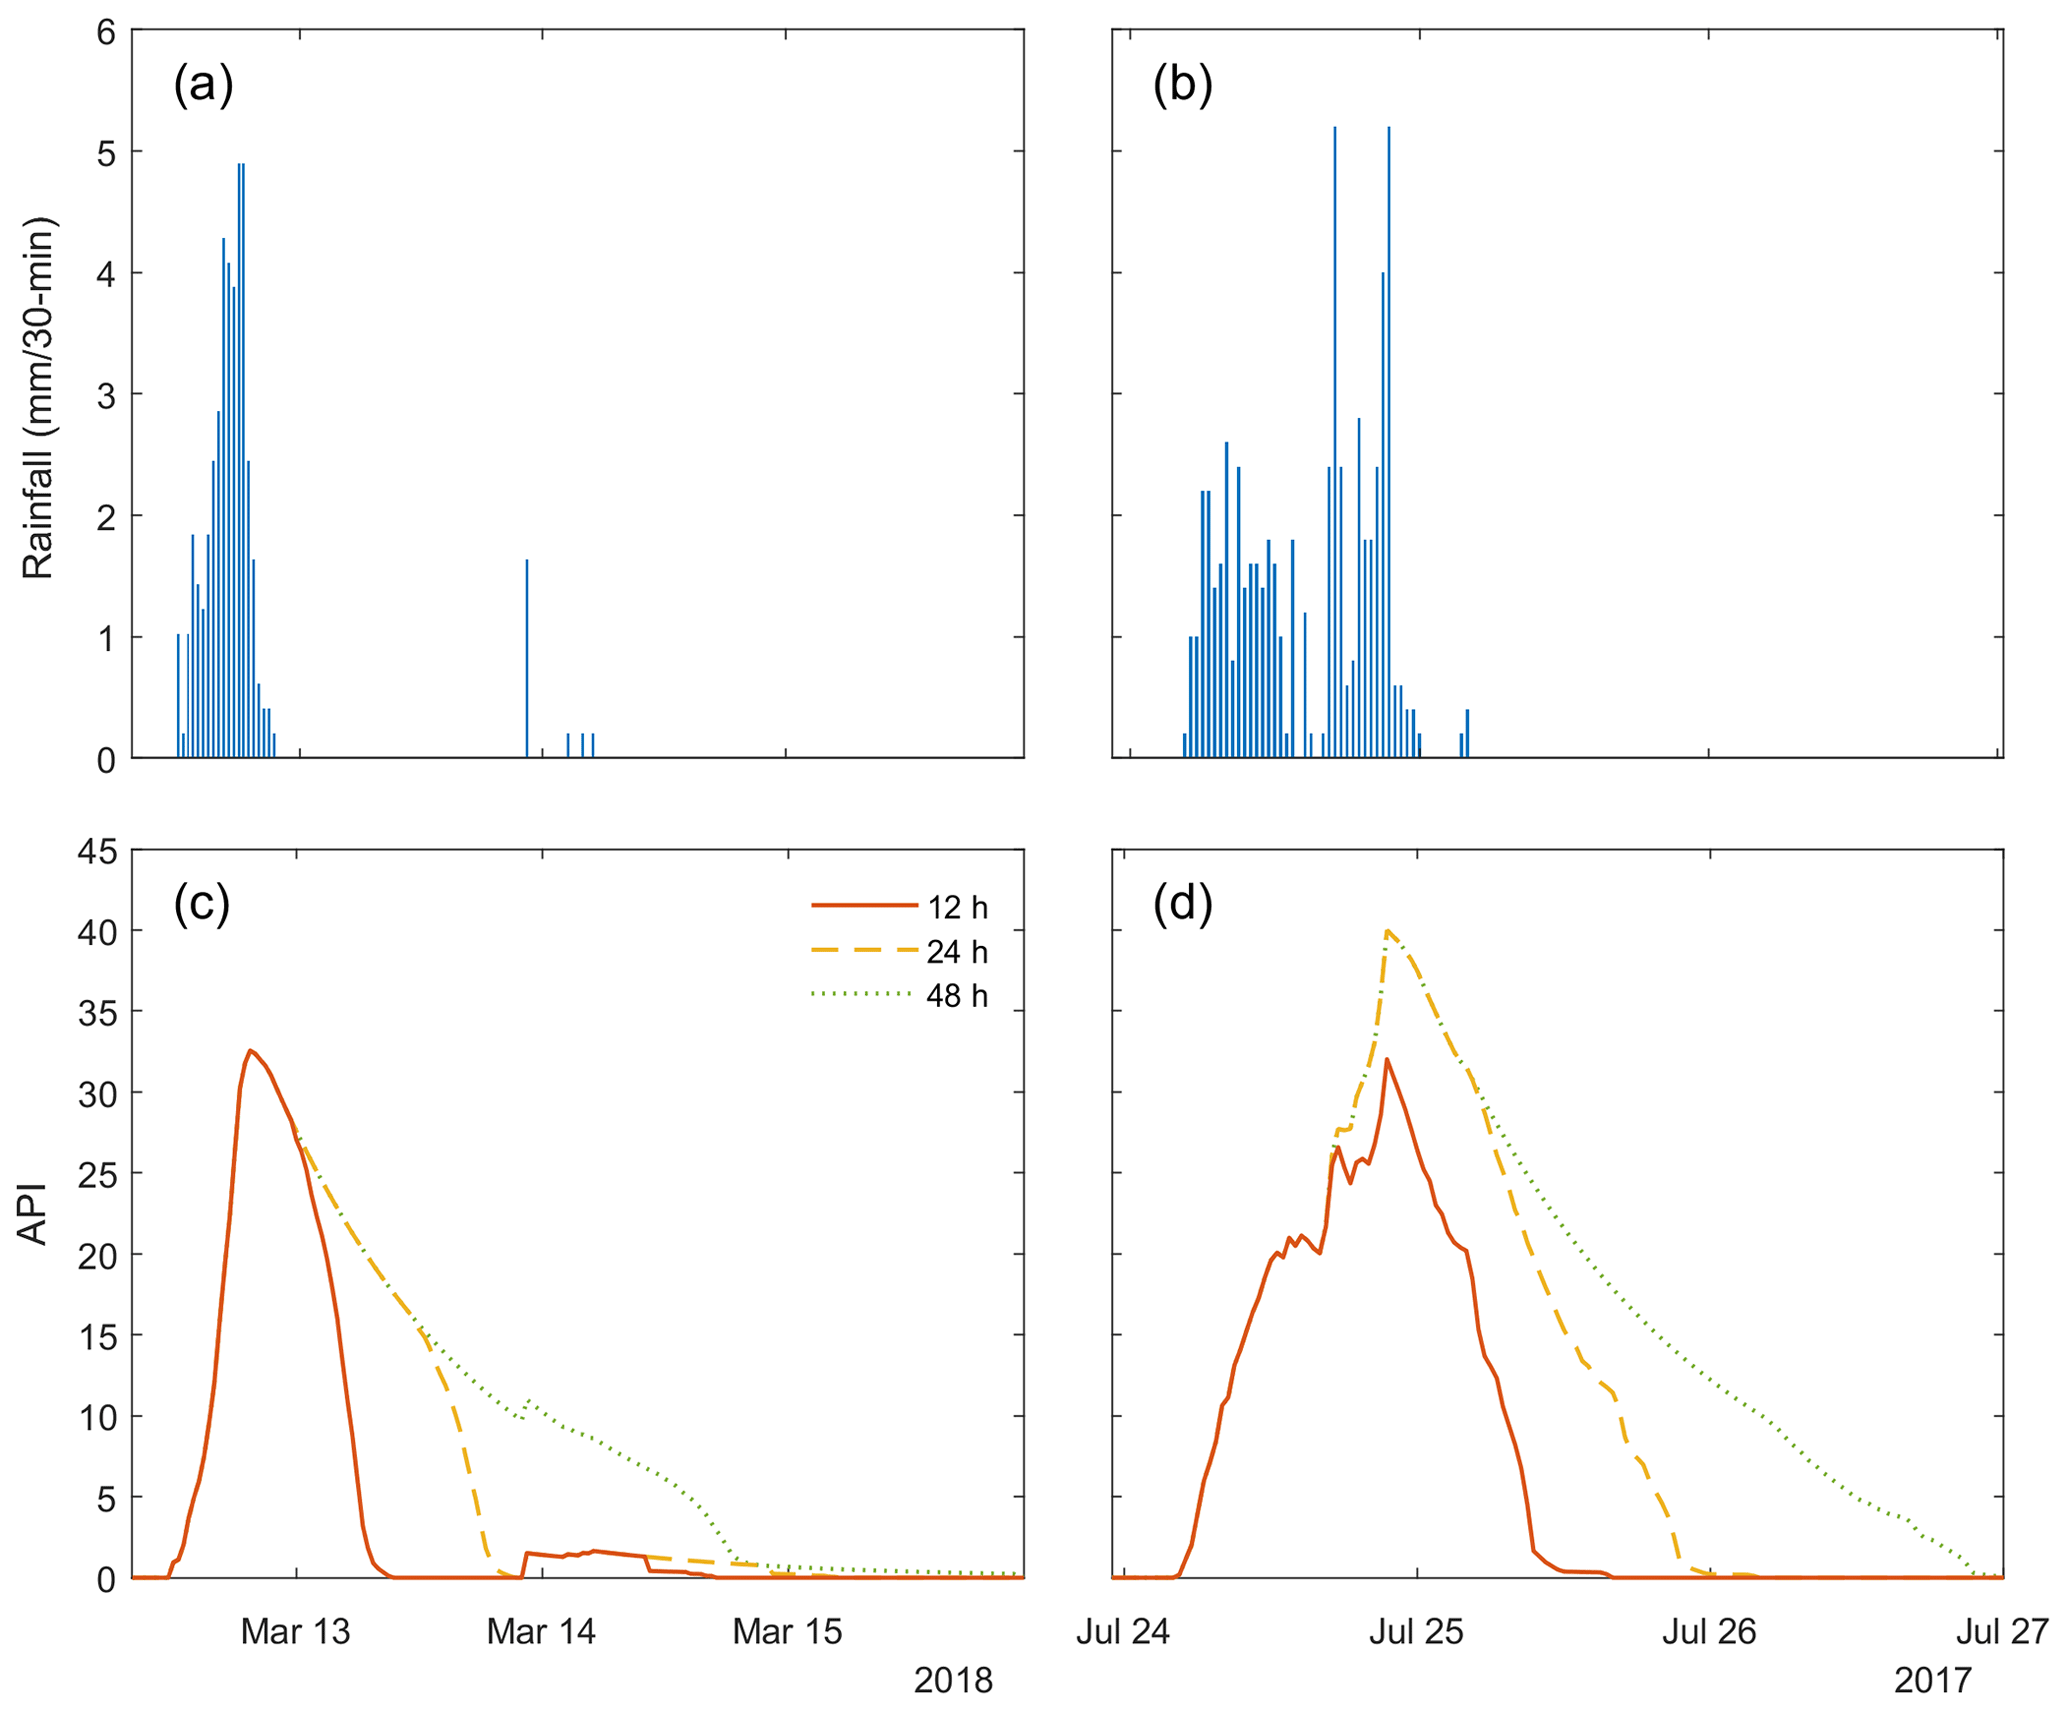
Figure B1Examples of predicted canopy drying after rainfall using the antecedent precipitation index (API) with 24, 48, and 96 half-hour time parameters. The rain event in (a) and (c) is from the Kopuatai dataset, while (b) and (d) consist of Mer Bleue data.
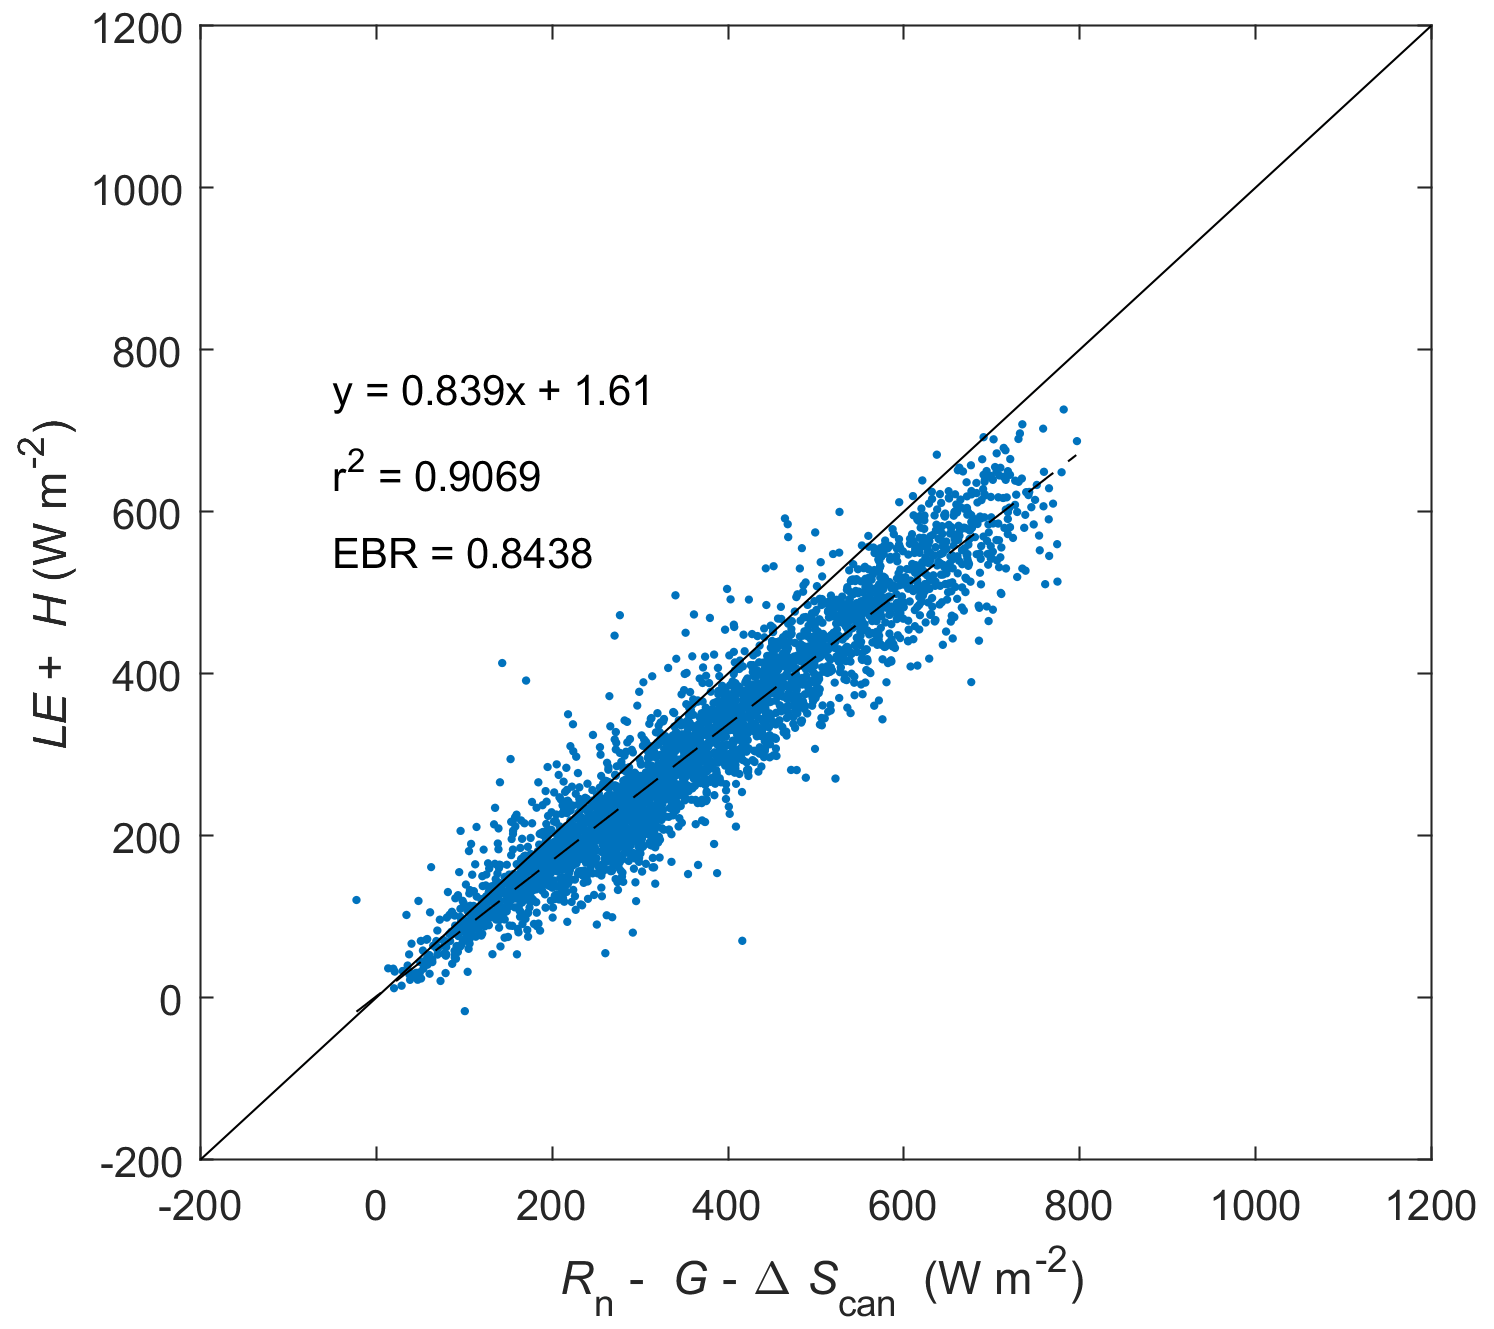
Figure C1Energy balance closure at Kopuatai for 2012–2022 (inclusive) based on middle-of-day means of energy balance components. LE: latent heat flux. H: sensible heat flux. G: soil heat flux. Rn: net radiation. ΔScan: canopy heat storage change. EBR is the energy balance ratio.
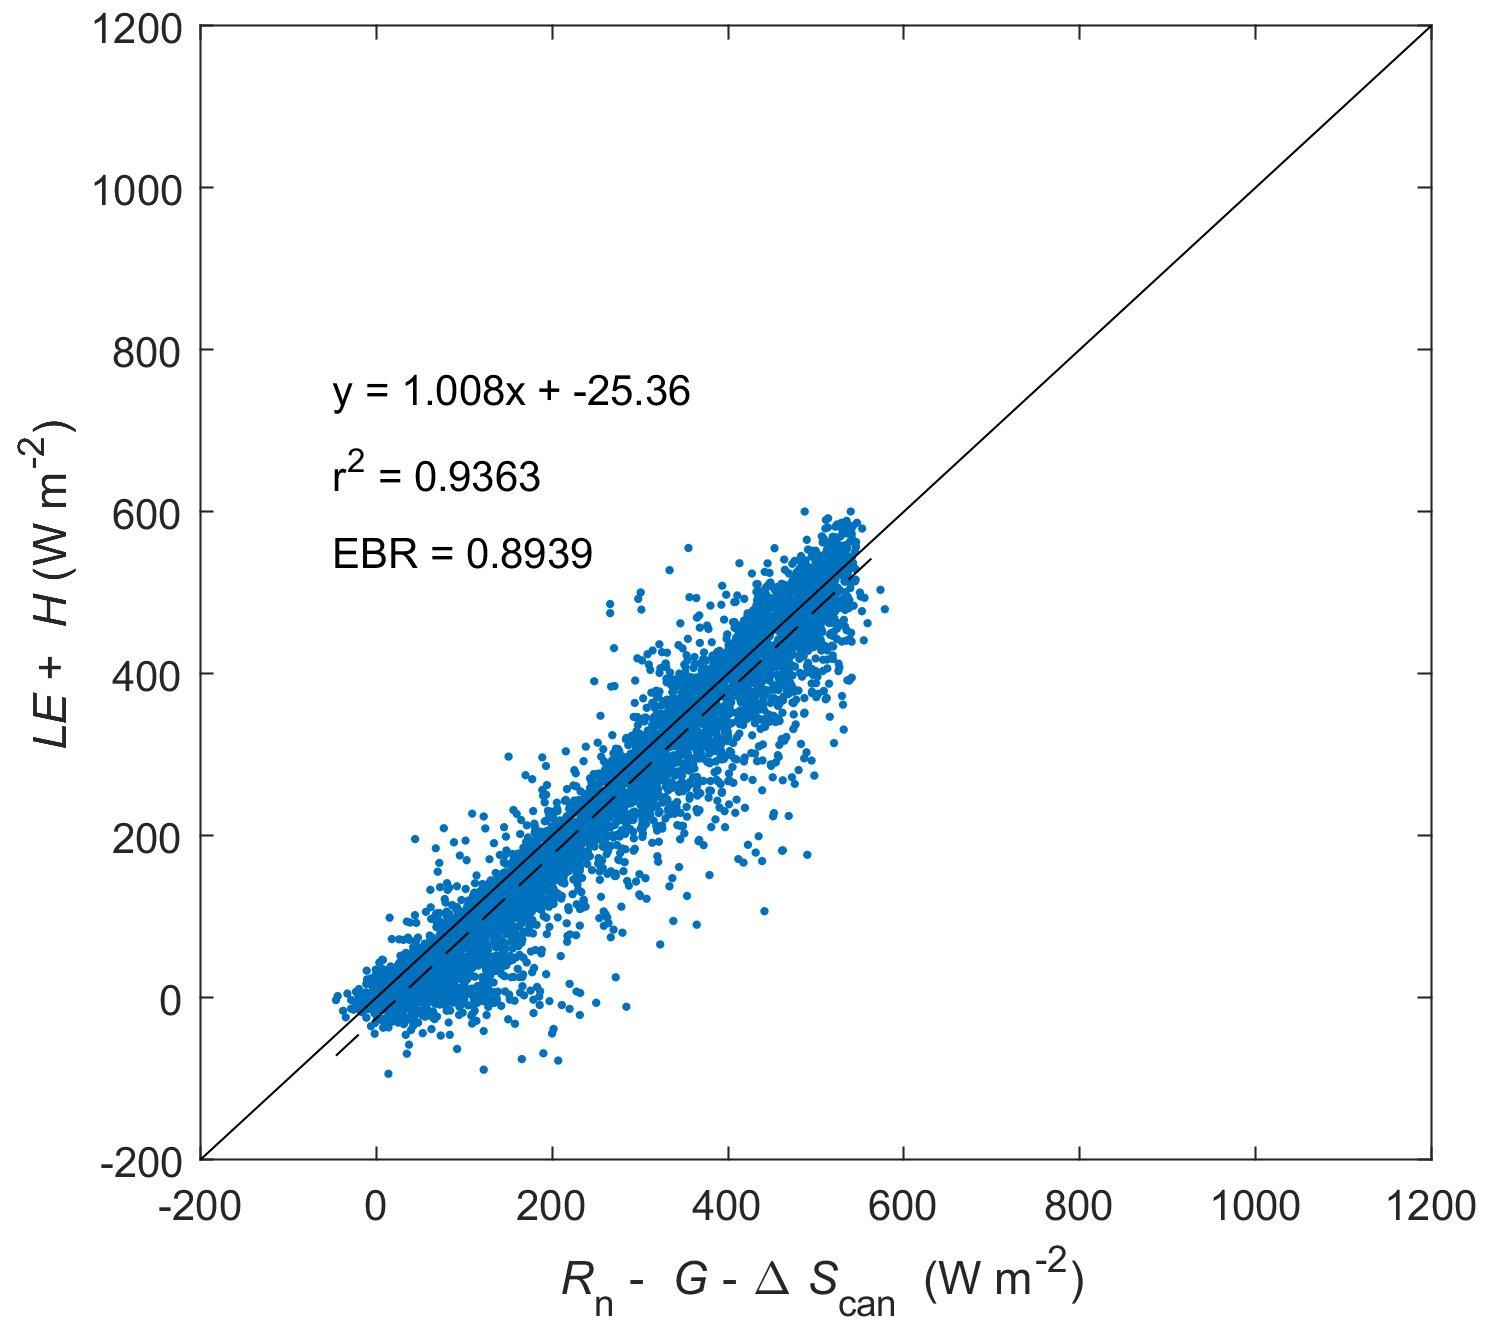
Figure C2Energy balance closure at Mer Bleue for 1999–2018 (inclusive) based on middle-of-day means of energy balance components. For term definitions, see Fig. C1. G is assumed to be 10 % of Rn, while ΔScan is assumed to be 3 % of Rn. EBR is the energy balance ratio.
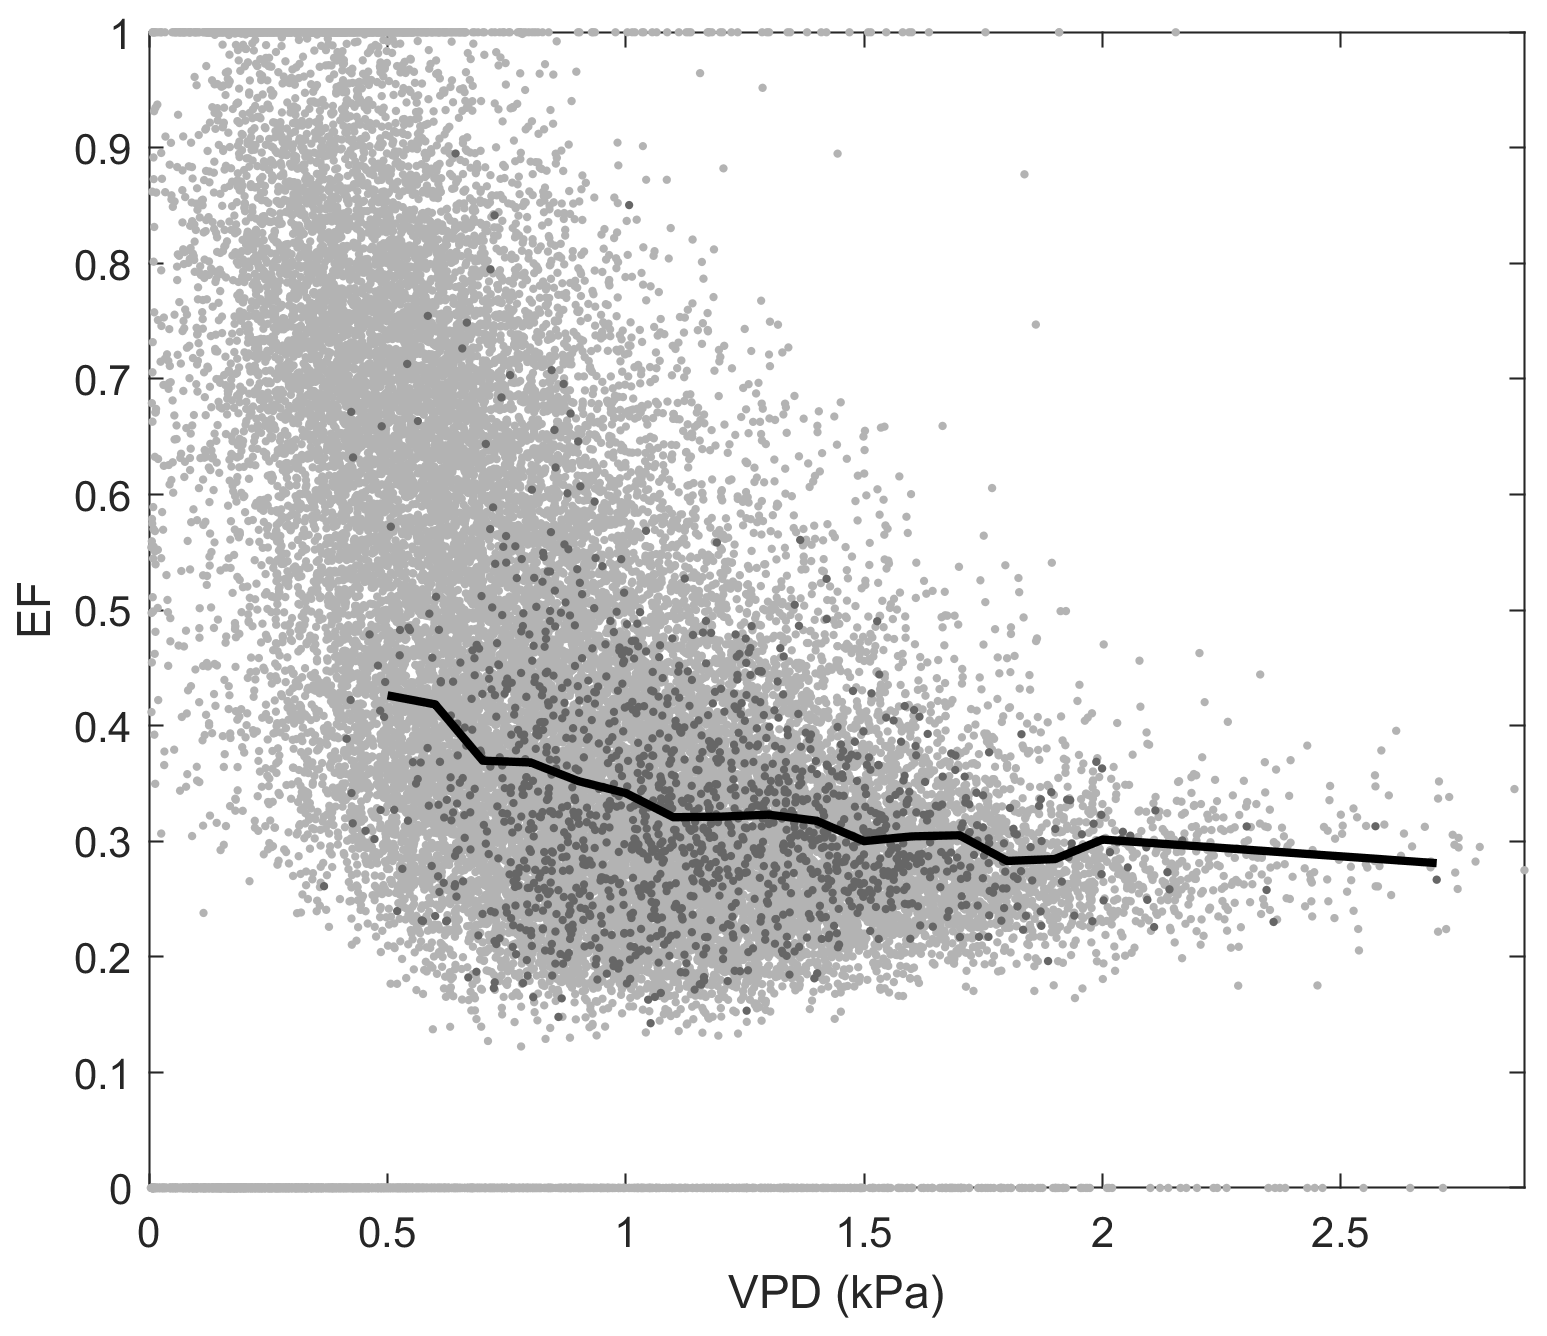
Figure D1Relationship between evaporative fraction (EF) and vapour pressure deficit (VPD) at Kopuatai bog. Light grey data points represent raw middle-of-day 30 min eddy covariance data, while dark grey data points show the growing-season (September–May) dry-canopy middle-of-day mean data used to calculate the binned means (black line).
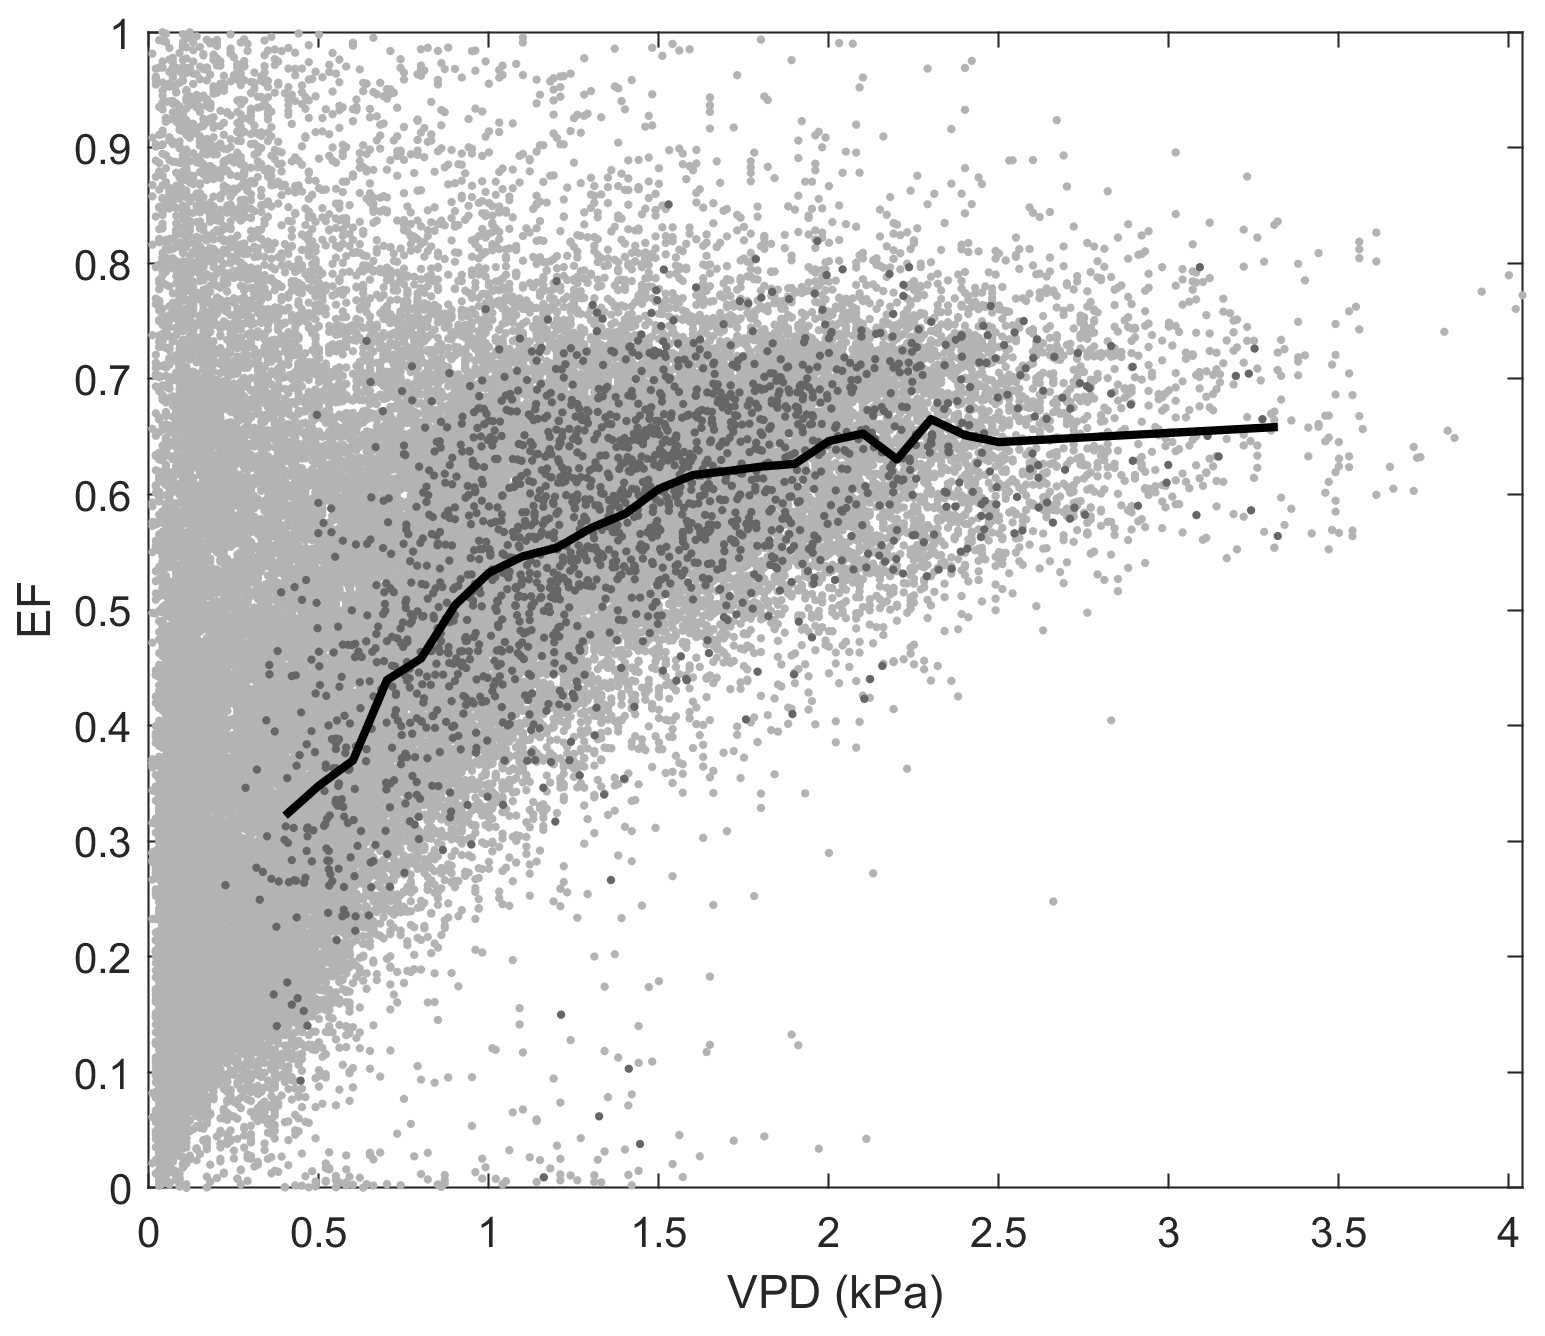
Figure D2Relationship between evaporative fraction (EF) and vapour pressure deficit (VPD) at Mer Bleue bog. Light grey data points represent raw middle-of-day 30 min eddy covariance data, while dark grey data points show the growing-season (May–October) dry-canopy middle-of-day mean data used to calculate the binned means (black line).
Datasets used in this paper are available on Zenodo at https://doi.org/10.5281/zenodo.8226862 (Speranskaya et al., 2024).
DIC and PML initiated the project and developed the methodology with LS. DIC collected and processed data from Kopuatai, and PML and ERH collected and processed data from Mer Bleue. LS analysed the data and wrote the manuscript draft. DIC, PML, and ERH contributed to the review and editing of the paper.
The contact author has declared that none of the authors has any competing interests.
Publisher’s note: Copernicus Publications remains neutral with regard to jurisdictional claims made in the text, published maps, institutional affiliations, or any other geographical representation in this paper. While Copernicus Publications makes every effort to include appropriate place names, the final responsibility lies with the authors.
This article is part of the special issue “Land surface–atmosphere interactions – from the microbial to the global scale”. It is a result of the iLEAPS – OzFlux joint 2023 Conference, Auckland, New Zealand, 31 January–3 February 2023.
Kopuatai bog (Aotearoa / New Zealand): Te Kupenga O Ngāti Hako and the Department of Conservation permitted us to access Kopuatai bog and supported our long-standing research presence there. Technical support at the University of Waikato was provided by Aaron Wall, Chris Morcom, and Georgie Glover-Clark. Access across farmland was facilitated by the Brewster family.
Mer Bleue bog (Canada): we are grateful to the National Capital Commission for access to the site and for continued support of our research.
Kopuatai bog: this research was supported through various grants from Manaaki Whenua Landcare Research and the University of Waikato, including a scholarship to Leeza Speranskaya. Mer Bleue bog: this research was supported through research grants to Peter M. Lafleur and Elyn R. Humphreys (and others) from the Natural Science and Engineering Research Council of Canada.
This paper was edited by Semeena Valiyaveetil Shamsudheen and reviewed by Joe Melton and one anonymous referee.
Admiral, S. W. and Lafleur, P. M.: Partitioning of latent heat flux at a northern peatland, Aquat. Bot., 86, 107–116, https://doi.org/10.1016/j.aquabot.2006.09.006, 2007.
Admiral, S. W., Lafleur, P. M., and Roulet, N. T.: Controls on latent heat flux and energy partitioning at a peat bog in eastern Canada, Agr. Forest Meteorol., 140, 308–321, https://doi.org/10.1016/j.agrformet.2006.03.017, 2006.
Agnew, A. D. Q., Rapson, G. L., Sykes, M. T., and Bastow Wilson, J.: The functional ecology of Empodisma minus (Hook, f.) Johnson & Cutler in New Zealand ombrotrophic mires, New Phytol., 124, 703–710, 1993.
Alekseychik, P., Mammarella, I., Lindroth, A., Lohila, A., Aurela, M., Laurila, T., Kasurinen, V., Lund, M., Rinne, J., Nilsson, M. B., Peichl, M., Minkkinen, K., Shurpali, N. J., Tuittila, E.-S., Martikainen, P. J., Tuovinen, J.-P., and Vesala, T.: Surface energy exchange in pristine and managed boreal peatlands, Mires Peat, 21, 1–26, https://doi.org/10.19189/MaP.2018.OMB.333, 2018.
Anderson, R. G. and Wang, D.: Energy budget closure observed in paired Eddy Covariance towers with increased and continuous daily turbulence, Agr. Forest Meteorol., 184, 204–209, https://doi.org/10.1016/j.agrformet.2013.09.012, 2014.
Aurela, M., Riutta, T., Laurila, T., Tuovinen, J.-P., Vesala, T., Tuittila, E.-S., Rinne, J., Haapanala, S., and Laine, J.: CO2 exchange of a sedge fen in southern Finland – the impact of a drought period, Tellus B, 59, 826–837, https://doi.org/10.1111/j.1600-0889.2007.00309.x, 2007.
Brümmer, C., Black, T. A., Jassal, R. S., Grant, N. J., Spittlehouse, D. L., Chen, B., Nesic, Z., Amiro, B. D., Arain, M. A., Barr, A. G., Bourque, C. P. A., Coursolle, C., Dunn, A. L., Flanagan, L. B., Humphreys, E. R., Lafleur, P. M., Margolis, H. A., McCaughey, J. H., and Wofsy, S. C.: How climate and vegetation type influence evapotranspiration and water use efficiency in Canadian forest, peatland and grassland ecosystems, Agr. Forest Meteorol., 153, 14–30, https://doi.org/10.1016/j.agrformet.2011.04.008, 2012.
Bubier, J. L., Moore, T. R., and Crosby, G.: Fine-scale vegetation distribution in a cool temperate peatland, Can. J. Botany, 84, 910–923, https://doi.org/10.1139/b06-044, 2006.
Burba, G.: Eddy Covariance Method for Scientific, Regulatory, and Commercial Applications, edited by: Miller, T., LI-COR Biosciences, Lincoln, Nebraska, USA, 702 pp., https://www.licor.com/env/products/eddy-covariance/ec-book/ (last access: 8 March 2024), 2022.
Campbell, E. O.: The restiad peat bogs at Motumaoho and Moanatuatua, Transactions of the Royal Society of New Zealand, Botany, Vol. 2, 14 February 1964, p. 219, https://paperspast.natlib.govt.nz/periodicals/TRSBOT19640214.2.2 (last access: 8 March 2024), 1964.
Campbell, D. I. and Williamson, J. L.: Evaporation from a raised peat bog, J. Hydrol., 193, 142–160, https://doi.org/10.1016/S0022-1694(96)03149-6, 1997.
Campbell, D. I., Smith, J., Goodrich, J. P., Wall, A. M., and Schipper, L. A.: Year-round growing conditions explains large CO2 sink strength in a New Zealand raised peat bog, Agr. Forest Meteorol., 192–193, 59–68, https://doi.org/10.1016/j.agrformet.2014.03.003, 2014.
Chang, J. and Root, B.: On the relationship between mean monthly global radiation and air temperature, Arch. Meteor. Geophy. B., 23, 13–30, https://doi.org/10.1007/BF02247305, 1975.
Clarkson, B. R., Schipper, L. A., and Silvester, W. B.: Nutritional niche separation in coexisting bog species demonstrated by 15N-enriched simulated rainfall, Austral. Ecol., 34, 377–385, https://doi.org/10.1111/j.1442-9993.2009.01939.x, 2009.
Dymond, J. R., Sabetizade, M., Newsome, P. F., Harmsworth, G. R., and Ausseil, A.: Revised extent of wetlands in New Zealand, New Zeal. J. Ecol., 45, 1–8, https://doi.org/10.20417/nzjecol.45.32, 2021.
Eichelmann, E., Hemes, K. S., Knox, S. H., Oikawa, P. Y., Chamberlain, S. D., Sturtevant, C., Verfaillie, J., and Baldocchi, D. D.: The effect of land cover type and structure on evapotranspiration from agricultural and wetland sites in the Sacramento–San Joaquin River Delta, California, Agr. Forest Meteorol., 256–257, 179–195, https://doi.org/10.1016/j.agrformet.2018.03.007, 2018.
Fang, Z., Zhang, W., Brandt, M., Abdi, A. M., and Fensholt, R.: Globally Increasing Atmospheric Aridity Over the 21st Century, Earth's Future, 10, e2022EF003019, https://doi.org/10.1029/2022ef003019, 2022.
Ficklin, D. L. and Novick, K. A.: Historic and projected changes in vapor pressure deficit suggest a continental-scale drying of the United States atmosphere, J. Geophys. Res.-Atmos., 122, 2061–2079, https://doi.org/10.1002/2016jd025855, 2017.
Fraser, C. D. J., Roulet, N. T., and Lafleur, P. M.: Groundwater flow patterns in a large peatland, J. Hydrol., 246, 142–154, https://doi.org/10.1016/S0022-1694(01)00362-6, 2001.
Frolking, S. and Roulet, N. T.: Holocene radiative forcing impact of northern peatland carbon accumulation and methane emissions, Glob. Change Biol., 13, 1079–1088, https://doi.org/10.1111/j.1365-2486.2007.01339.x, 2007.
Goodrich, J. P., Campbell, D. I., Clearwater, M. J., Rutledge, S., and Schipper, L. A.: High vapor pressure deficit constrains GPP and the light response of NEE at a Southern Hemisphere bog, Agr. Forest Meteorol., 203, 54–63, https://doi.org/10.1016/j.agrformet.2015.01.001, 2015.
Goodrich, J. P., Campbell, D. I., and Schipper, L. A.: Southern Hemisphere bog persists as a strong carbon sink during droughts, Biogeosciences, 14, 4563–4576, https://doi.org/10.5194/bg-14-4563-2017, 2017.
Goulden, M. L., Litvak, M., and Miller, S. D.: Factors that control Typha marsh evapotranspiration, Aquat. Bot., 86, 97–106, https://doi.org/10.1016/j.aquabot.2006.09.005, 2007.
Granger, R. J.: An examination of the concept of potential evaporation, J. Hydrol., 111, 9–19, https://doi.org/10.1016/0022-1694(89)90248-5, 1989.
Grossiord, C., Buckley, T. N., Cernusak, L. A., Novick, K. A., Poulter, B., Siegwolf, R. T. W., Sperry, J. S., and McDowell, N. G.: Plant responses to rising vapor pressure deficit, New Phytol., 226, 1550–1566, https://doi.org/10.1111/nph.16485, 2020.
He, H., Moore, T., Humphreys, E. R., Lafleur, P. M., and Roulet, N. T.: Water level variation at a beaver pond significantly impacts net CO2 uptake of a continental bog, Hydrol. Earth Syst. Sci., 27, 213–227, https://doi.org/10.5194/hess-27-213-2023, 2023.
Helbig, M., Waddington, J. M., Alekseychik, P., Amiro, B. D., Aurela, M., Barr, A. G., Black, T. A., Blanken, P. D., Carey, S. K., Chen, J., Chi, J., Desai, A. R., Dunn, A., Euskirchen, E. S., Flanagan, L. B., Forbrich, I., Friborg, T., Grelle, A., Harder, S., Heliasz, M., Humphreys, E. R., Ikawa, H., Isabelle, P.-E., Iwata, H., Jassal, R., Korkiakoski, M., Kurbatova, J., Kutzbach, L., Lindroth, A., Löfvenius, M. O., Lohila, A., Mammarella, I., Marsh, P., Maximov, T., Melton, J. R., Moore, P. A., Nadeau, D. F., Nicholls, E. M., Nilsson, M. B., Ohta, T., Peichl, M., Petrone, R. M., Petrov, R., Prokushkin, A., Quinton, W. L., Reed, D. E., Roulet, N. T., Runkle, B. R. K., Sonnentag, O., Strachan, I. B., Taillardat, P., Tuittila, E.-S., Tuovinen, J.-P., Turner, J., Ueyama, M., Varlagin, A., Wilmking, M., Wofsy, S. C., and Zyrianov, V.: Increasing contribution of peatlands to boreal evapotranspiration in a warming climate, Nat. Clim. Change, 10, 555–560, https://doi.org/10.1038/s41558-020-0763-7, 2020.
Helfter, C., Campbell, C., Dinsmore, K. J., Drewer, J., Coyle, M., Anderson, M., Skiba, U., Nemitz, E., Billett, M. F., and Sutton, M. A.: Drivers of long-term variability in CO2 net ecosystem exchange in a temperate peatland, Biogeosciences, 12, 1799–1811, https://doi.org/10.5194/bg-12-1799-2015, 2015.
Hember, R. A., Lafleur, P. M., and Cogley, J. G.: Synoptic controls on summer evapotranspiration from a bog peatland in southern Canada, Int. J. Climatol., 25, 793–809, https://doi.org/10.1002/joc.1154, 2005.
Holden, J.: Peatland hydrology and carbon release: why small-scale process matters, Philos. T. R. Soc. A, 363, 2891–2913, https://doi.org/10.1098/rsta.2005.1671, 2005.
Humphreys, E. R., Lafleur, P. M., Flanagan, L. B., Hedstrom, N., Syed, K. H., Glenn, A. J., and Granger, R.: Summer carbon dioxide and water vapor fluxes across a range of northern peatlands, J. Geophys. Res.-Biogeo., 111, https://doi.org/10.1029/2005jg000111, 2006.
Joosten, H. and Clarke, D.: Wise Use of Mires and Peatlands: Background and Principles Including a Framework for Decision-making, International Mire Conservation Group., 2002.
Keyte Beattie, A. M.: The role of Empodisma robustum litter in CO2 exchange at Kopuatai bog, University of Waikato, Hamilton, New Zealand, https://hdl.handle.net/10289/8695 (last access: 8 March 2024), 2014.
Kim, J., Rochefort, L., Hogue-Hugron, S., Alqulaiti, Z., Dunn, C., Pouliot, R., Jones, T. G., Freeman, C., and Kang, H.: Water Table Fluctuation in Peatlands Facilitates Fungal Proliferation, Impedes Sphagnum Growth and Accelerates Decomposition, Front. Earth Sci., 8, 579329, https://doi.org/10.3389/feart.2020.579329, 2021.
Kurbatova, J., Arneth, A., Vygodskaya, N. N., Kolle, O., Varlargin, A. V., Milyukova, I. M., Tchebakova, N. M., Schulze, E. D., and Lloyd, J.: Comparative ecosystem–atmosphere exchange of energy and mass in a European Russian and a central Siberian bog I. Interseasonal and interannual variability of energy and latent heat fluxes during the snowfree period, Tellus B, 54, 497–513, https://doi.org/10.3402/tellusb.v54i5.16683, 2002.
Kwon, M. J., Ballantyne, A., Ciais, P., Qiu, C., Salmon, E., Raoult, N., Guenet, B., Gockede, M., Euskirchen, E. S., Nykanen, H., Schuur, E. A. G., Turetsky, M. R., Dieleman, C. M., Kane, E. S., and Zona, D.: Lowering water table reduces carbon sink strength and carbon stocks in northern peatlands, Global Change Biol., 28, 6752–6770, https://doi.org/10.1111/gcb.16394, 2022.
Lafleur, P. M. and Roulet, N. T.: A comparison of evaporation rates from two fens of the Hudson Bay Lowland, Aquat. Bot., 44, 59–69, https://doi.org/10.1016/0304-3770(92)90081-S, 1992.
Lafleur, P. M., Roulet, N. T., and Admiral, S. W.: Annual cycle of CO2 exchange at a bog peatland, J. Geophys. Res.-Atmos., 106, 3071–3081, https://doi.org/10.1029/2000jd900588, 2001.
Lafleur, P. M., Hember, R. A., Admiral, S. W., and Roulet, N. T.: Annual and seasonal variability in evapotranspiration and water table at a shrub-covered bog in southern Ontario, Canada, Hydrol. Process., 19, 3533–3550, https://doi.org/10.1002/hyp.5842, 2005.
Lawrence, J., Mackey, B., Chiew, F., Costello, M. J., Hennessy, K., Lansbury, N., Nidumolu, U. B., Pecl, G., Rickards, L., Tapper, N., Woodward, A., and Wreford, A.: Contribution of Working Group II to the Sixth Assessment Report of the Intergovernmental Panel on Climate Change, in: Climate Change 2022: Impacts, Adaptation and Vulnerability, edited by: Pörtner, H.-O., Roberts, D. C., Tignor, M., Poloczanska, E. S., Mintenbeck, K., Alegría, A., Craig, M., Langsdorf, S., Löschke, S., Möller, V., Okem, A., and Rama, B., Cambridge University Press, Cambridge, UK and New York, NY, USA, 1581–1688, https://doi.org/10.1017/9781009325844.013, 2022.
Leuning, R., van Gorsel, E., Massman, W. J., and Isaac, P. R.: Reflections on the surface energy imbalance problem, Agr. Forest Meteorol., 156, 65–74, https://doi.org/10.1016/j.agrformet.2011.12.002, 2012.
Liljedahl, A. K., Hinzman, L. D., Harazono, Y., Zona, D., Tweedie, C. E., Hollister, R. D., Engstrom, R., and Oechel, W. C.: Nonlinear controls on evapotranspiration in arctic coastal wetlands, Biogeosciences, 8, 3375–3389, https://doi.org/10.5194/bg-8-3375-2011, 2011.
Ma, L., Zhu, G., Chen, B., Zhang, K., Niu, S., Wang, J., Ciais, P., and Zuo, H.: A globally robust relationship between water table decline, subsidence rate, and carbon release from peatlands, Commun. Earth Environ., 3, 254, https://doi.org/10.1038/s43247-022-00590-8, 2022.
Massmann, A., Gentine, P., and Lin, C.: When Does Vapor Pressure Deficit Drive or Reduce Evapotranspiration?, J. Adv. Model. Earth Sy., 11, 3305–3320, https://doi.org/10.1029/2019MS001790, 2019.
McGlone, M. S.: Postglacial history of New Zealand wetlands and implications for their conservation, New Zeal. J. Ecol., 33, 1–23, 2009.
Miralles, D. G., Brutsaert, W., Dolman, A. J., and Gash, J. H.: On the Use of the Term “Evapotranspiration”, Water Resour. Res., 56, e2020WR028055, https://doi.org/10.1029/2020WR028055, 2020.
Moore, T. R., Bubier, J. L., Frolking, S. E., Lafleur, P. M., and Roulet, N. T.: Plant biomass and production and CO2 exchange in an ombrotrophic bog, J. Ecol., 90, 25–36, https://doi.org/10.1046/j.0022-0477.2001.00633.x, 2002.
Newnham, R. N., de Lange, P. J., and Lowe, D. J.: Holocene vegetation, climate and history of a raised bog complex, northern New Zealand based on palynology, plant macrofossils and tephrochronology, Holocene, 5, 267–282, 1995.
Nimmo, D. G., Mac Nally, R., Cunningham, S. C., Haslem, A., and Bennett, A. F.: Vive la resistance: reviving resistance for 21st century conservation, Trends Ecol. Evol., 30, 516–523, https://doi.org/10.1016/j.tree.2015.07.008, 2015.
Otieno, D., Lindner, S., Muhr, J., and Borken, W.: Sensitivity of peatland herbaceous vegetation to vapor pressure deficit influences net ecosystem CO2 exchange, Wetlands, 32, 895–905, https://doi.org/10.1007/s13157-012-0322-8, 2012.
Page, S. E., Rieley, J. O., and Wüst, R.: Lowland tropical peatlands of Southeast Asia, in: Peatlands – Evolution and Records of Environmental and Climate Changes, edited by: Martini, I. P., Martinez Cortizas, A., and Chesworth, W., Elsevier, Amsterdam, the Netherlands, 145–172, https://doi.org/10.1016/s0928-2025(06)09007-9, 2006.
Peichl, M., Sagerfors, J., Lindroth, A., Buffam, I., Grelle, A., Klemedtsson, L., Laudon, H., and Nilsson, M. B.: Energy exchange and water budget partitioning in a boreal minerogenic mire, J. Geophys. Res.-Biogeo., 118, 1–13, https://doi.org/10.1029/2012jg002073, 2013.
Ratcliffe, J. L., Campbell, D. I., Clarkson, B. R., Wall, A. M., and Schipper, L. A.: Water table fluctuations control CO2 exchange in wet and dry bogs through different mechanisms, Sci. Total Environ., 655, 1037–1046, https://doi.org/10.1016/j.scitotenv.2018.11.151, 2019.
Roehm, C. L. and Roulet, N. T.: Seasonal contribution of CO2 fluxes in the annual C budget of a northern bog, Global Biogeochem. Cy., 17, 1029, https://doi.org/10.1029/2002gb001889, 2003.
Roulet, N. T., Lafleur, P. M., Richard, P. J. H., Moore, T. R., Humphreys, E. R., and Bubier, J.: Contemporary carbon balance and late Holocene carbon accumulation in a northern peatland, Glob. Change Biol., 13, 397–411, https://doi.org/10.1111/j.1365-2486.2006.01292.x, 2007.
Runkle, B. R. K., Wille, C., Gažovič, M., Wilmking, M., and Kutzbach, L.: The surface energy balance and its drivers in a boreal peatland fen of northwestern Russia, J. Hydrol., 511, 359–373, https://doi.org/10.1016/j.jhydrol.2014.01.056, 2014.
Scharlemann, J. P. W., Tanner, E. V. J., Hiederer, R., and Kapos, V.: Global soil carbon: understanding and managing the largest terrestrial carbon pool, Carbon Manag., 5, 81–91, https://doi.org/10.4155/cmt.13.77, 2014.
Shearer, J. C.: Natural and anthropogenic influences on peat development in Waikato/Hauraki Plains restiad bogs, J. Roy. Soc. New Zeal., 27, 295–313, https://doi.org/10.1080/03014223.1997.9517540, 1997.
Shimoyama, K., Hiyama, T., Fukushima, Y., and Inoue, G.: Seasonal and interannual variation in water vapor and heat fluxes in a West Siberian continental bog, J. Geophys. Res., 108, 4648, https://doi.org/10.1029/2003jd003485, 2003.
Shimoyama, K., Hiyama, T., Fukushima, Y., and Inoue, G.: Controls on evapotranspiration in a west Siberian bog, J. Geophys. Res., 109, D08111, https://doi.org/10.1029/2003jd004114, 2004.
Smith, J.: Fluxes of Carbon Dioxide and Water Vapour at a Waikato Peat Bog, The University of Waikato, Hamilton, New Zealand, https://hdl.handle.net/10289/13975 (last access: 8 March 2024), 2003.
Sonnentag, O., Van Der Kamp, G., Barr, A. G., and Chen, J. M.: On the relationship between water table depth and water vapor and carbon dioxide fluxes in a minerotrophic fen, Glob. Change Biol., 16, 1762–1776, https://doi.org/10.1111/j.1365-2486.2009.02032.x, 2010.
Speranskaya, L., Campbell, D. I., Lafleur, P. M., and Humphreys, E. R.: Datasets for “Peatland evaporation across hemispheres: contrasting controls and sensitivity to climate warming driven by plant functional types” – Version 2, Zenodo [data set], https://doi.org/10.5281/zenodo.8226862, 2024.
Strilesky, S. L. and Humphreys, E. R.: A comparison of the net ecosystem exchange of carbon dioxide and evapotranspiration for treed and open portions of a temperate peatland, Agr. Forest Meteorol., 153, 45–53, https://doi.org/10.1016/j.agrformet.2011.06.006, 2012.
Takagi, K., Tsuboya, T., and Takahashi, H.: Diurnal hystereses of stomatal and bulk surface conductances in relation to vapor pressure deficit in a cool-temperate wetland, Agr. Forest Meteorol., 91, 177–191, https://doi.org/10.1016/S0168-1923(98)00078-1, 1998.
Takagi, K., Tsuboya, T., Takahashi, H., and Inoue, T.: Effect of the invasion of vascular plants on heat and water balance in the Sarobetsu mire, northern Japan, Wetlands, 19, 246–254, https://doi.org/10.1007/BF03161754, 1999.
Thompson, M. A., Campbell, D. I., and Spronken-Smith, R. A.: Evaporation from natural and modified raised peat bogs in New Zealand, Agr. Forest Meteorol., 95, 85–98, https://doi.org/10.1016/S0168-1923(99)00027-1, 1999.
Villegas, J. C., Breshears, D. D., Zou, C. B., and Law, D. J.: Ecohydrological controls of soil evaporation in deciduous drylands: How the hierarchical effects of litter, patch and vegetation mosaic cover interact with phenology and season, J. Arid Environ., 74, 595–602, https://doi.org/10.1016/j.jaridenv.2009.09.028, 2010.
Vitt, D. H.: Functional Characteristics and Indicators of Boreal Peatlands, in: Boreal Peatland Ecosystems, edited by: Wieder, R. K., and Vitt, D. H., Springer-Verlag, Berlin, Germany, 9–24, https://doi.org/10.1007/978-3-540-31913-9_2, 2006.
Wagstaff, S. J. and Clarkson, B. R.: Systematics and ecology of the Australasian genus Empodisma (Restionaceae) and description of a new species from peatlands in northern New Zealand, PhytoKeys, 39–79, https://doi.org/10.3897/phytokeys.13.3259, 2012.
Wang, M., Wu, J., and Lafleur, P.: Comparison of energy fluxes between an undisturbed bog and an adjacent abandoned peatland pasture, Agr. Forest Meteorol., 291, 108086, https://doi.org/10.1016/j.agrformet.2020.108086, 2020.
Woods, R. and Rowe, L.: The changing spatial variability of subsurface flow across a hillside, J. Hydrol., 35, 49–84, 1996.
Wu, J., Kutzbach, L., Jager, D., Wille, C., and Wilmking, M.: Evapotranspiration dynamics in a boreal peatland and its impact on the water and energy balance, J. Geophys. Res., 115, G04038, https://doi.org/10.1029/2009jg001075, 2010.
Xu, J., Morris, P. J., Liu, J., and Holden, J.: PEATMAP: Refining estimates of global peatland distribution based on a meta-analysis, Catena, 160, 134–140, https://doi.org/10.1016/j.catena.2017.09.010, 2018.
Yu, Z., Loisel, J., Brosseau, D. P., Beilman, D. W., and Hunt, S. J.: Global peatland dynamics since the Last Glacial Maximum, Geophys. Res. Lett., 37, L13402, https://doi.org/10.1029/2010gl043584, 2010.
Zhong, Y., Jiang, M., and Middleton, B. A.: Effects of water level alteration on carbon cycling in peatlands, Ecosystem Health and Sustainability, 6, 1806113, https://doi.org/10.1080/20964129.2020.1806113, 2020.
“Evaporation” refers to the bulk flux of water vapour from land, including transpiration. We do not use the term “evapotranspiration” as both evaporation and transpiration involve the transformation of water from a liquid to a vapour (Miralles et al., 2020).