the Creative Commons Attribution 4.0 License.
the Creative Commons Attribution 4.0 License.
 | 13 Mar 2024
Electron backscatter diffraction analysis unveils foraminiferal calcite microstructure and processes of diagenetic alteration
Sandra Piazolo
Eleanor H. John
Richard Walshaw
Paul N. Pearson
Caroline H. Lear
Tracy Aze
Electron backscatter diffraction (EBSD) analysis enables a unique perspective of the internal microstructure of foraminiferal calcite. Specifically, EBSD provides crystallographic data from within the test, highlighting the highly organised “mesocrystal” structure of crystallographically aligned domains throughout the test, formed by sequential deposits of microgranular calcite. We compared EBSD maps across the test walls of both poorly preserved and well-preserved specimens of the planktonic foraminifera species Globigerinoides ruber and Morozovella crater. The EBSD maps, paired with information about intra-test distributions of ratios, allowed us to examine the effects of different diagenetic processes on the foraminifera test. In poorly preserved specimens EBSD data show extensive reorganisation of the biogenic crystal microstructure, indicating differing phases of dissolution, re-precipitation and overgrowth. The specimens with the greatest degree of microstructural reorganisation also show an absence of higher concentration magnesium bands, which are typical features of well-preserved specimens. These findings provide important insights into the extent of post-depositional changes, in both microstructure and geochemical signals that must be considered when utilising foraminifera to generate proxy archive data.
- Article
(10119 KB) - Full-text XML
- BibTeX
- EndNote


The fossilised shells (tests) of foraminifera provide some of the most widely used and invaluable climate proxy data available to the Earth and environmental sciences (e.g. Zachos et al., 2001, 2008; Westerhold et al., 2020), primarily because of their geographic extent and the unparalleled temporal resolution of their fossil record. Geochemical analysis of stable isotope ratios, such as carbon and oxygen, and trace element concentrations, such as the ratio of magnesium to calcium () in foraminiferal calcite, can provide reliable estimates of past global climates (e.g. Erez and Luz, 1983; Nürnberg et al., 1996; Lea et al., 2000; Leng, 2006; Ganssen et al., 2011; Pearson, 2012). Despite the widespread application of planktonic foraminifera in palaeoceanography and palaeoclimate reconstructions, the exact processes involved in the biomineralisation of their calcite tests are still uncertain (de Nooijer et al., 2014; Fehrenbacher et al., 2017; Arns et al., 2022; Lastam et al., 2023a, b). Restricted understanding of foraminiferal biomineralisation hinders our use of palaeoproxies; for example, Mg heterogeneity in foraminifera in the form of high and low Mg bands is believed to be biologically controlled, thus inducing uncertainty to the temperature proxy (e.g. Eggins et al., 2004; Spero et al., 2015; John et al., 2023). Also, post-depositional processes can modify test microstructure, and this may be accompanied by changes in the geochemistry of the test (Pearson et al., 2001; Sexton et al., 2006; Kozdon et al., 2013; Edgar et al., 2015; Staudigel et al., 2022; John et al., 2023). Not all fossil specimens are equally affected by diagenetic modifications, arguably because of differing depositional histories and environments (e.g. Parker and Berger, 1971) and original test structure and composition (e.g. Edgar et al., 2013). Previous work has demonstrated foraminifera that exhibit good (“glassy”) preservation show limited signs of test wall degradation and presumably original geochemistry signals (e.g. Norris and Wilson, 1998; Pearson et al., 2001; Wendler et al., 2013). Conversely, poorly preserved (“frosty”) specimens show significant test wall alteration and potentially significant impacts on geochemical proxy reliability (Pearson et al., 2001, 2007; Sexton et al., 2006; Pearson and Burgess, 2008). The exact relationship between microstructural alteration and geochemical change is still poorly understood. For example, Mg banding is preserved in some visibly altered foraminifera, suggesting that alteration might not necessarily preclude the use of some foraminifera for Mg thermometry (e.g. Staudigel et al., 2022). From SEM images alone, the test microstructure may look significantly altered, and thus these specimens would be excluded from use in geochemical proxy generation. On the contrary, some experimental studies suggest that even “pristine”-looking foraminifera tests may have undergone minor amounts of diagenetic ion exchange (Cisneros-Lazaro et al., 2022).
Electron backscatter diffraction analysis (EBSD) provides spatially defined, quantitative crystallographic orientation data that can be used to examine primary features of foraminifera test walls and therefore the degree of microstructural change associated with diagenesis. By comparing such characterisations with intra-test geochemical variations, we can obtain insights into the alteration processes at individual sites, and better understand the relationship between microstructural change and geochemical alteration. EBSD analysis quantifies the full crystallographic orientation of a crystalline sample, i.e. all crystallographic axes are determined (e.g. Prior et al., 1999). In recent years the resolution of the technique has improved, which has resulted in its application to investigate both benthic and planktonic foraminifera microstructures (e.g. Pabich et al., 2020; Yin et al., 2021; Lastam et al., 2023a, b). Foraminifera precipitate their calcite tests as biogenic microgranules that are typically submicron in size, which coalesce to form larger structures (Hemleben et al., 1989; Schiebel and Hemleben, 2017). These microgranules are not currently individually resolvable via EBSD mapping; instead, this technique maps “grains”, which represent areas of crystallographic alignment. In this article we define a grain as a domain of similar crystallographic orientation surrounded by a grain boundary with > 10° orientation change between adjacent grains. These grains are typically synonymous with previously identified “mesocrystals” (Yin et al., 2021; Arns et al., 2022), and are composed of numerous small crystals of similar size and shape (in this case, the sub-micron microgranules of biogenic foraminiferal calcite). Some of the key findings of previous EBSD investigations into biomineralisation processes include: (1) the “mesocrystal structure” of units of similarly oriented nanometre scale microgranules; (2) the preferred alignment of the calcite c-axis perpendicular to the test wall, which is thought to be induced by biopolymers of the primary organic sheet (POS); and (3) the presence of 60° twinning in test calcite (e.g. Pabich et al., 2020; Yin et al., 2021; Arns et al., 2022; Lastam et al., 2023a, b). So far, this quantitative microstructural work has been limited to a small number of foraminifera species, even though it is well documented that the test wall characteristics are highly variable across different species of planktonic foraminifera. To date, there has been no work that has taken advantage of EBSD as a tool to investigate the impact of diagenetic alteration on planktonic foraminifera test microstructure. In this study, we use EBSD to investigate the crystallographic microstructural characteristics of two species of planktonic foraminifera with different wall textures and different post-depositional histories. Specifically, we present data from Globigerinoides ruber, an extant species with a cancellate wall texture comprising an irregular honeycomb appearance on the surface where interpore ridges are present between pores on the surface of the test (Hembleben and Olsson, 2006). We also examine Morozovella crater, an extinct species with a muricate wall texture, characterised by surface projections called “muricae”, formed by upward deflection and mounding of successive layers of calcite in the test wall (Pearson et al., 2022). Both species are frequently used in the generation of geochemical palaeoclimate proxy records (e.g. Lea et al., 2000; Hines et al., 2017). We analysed specimens displaying both glassy and frosty preservation, as indicated by examination under scanning electron microscopy (SEM).
Our EBSD measurements are coupled with maps of ratios generated using electron microprobe analysis (EMPA), from the same specimens to examine the relationship between microstructural alterations and changes in geochemistry. We focus on ratios for the geochemical analysis as this proxy is commonly used in palaeoclimate reconstructions and is thought to be more robust to diagenetic changes than the oxygen isotope proxy (Kozdon et al., 2013; Staudigel et al., 2022). We aim to utilise these analytical techniques to illuminate the mechanisms involved in diagenetic alteration, and to evaluate the extent to which post-depositional history and foraminiferal wall texture may influence these processes.
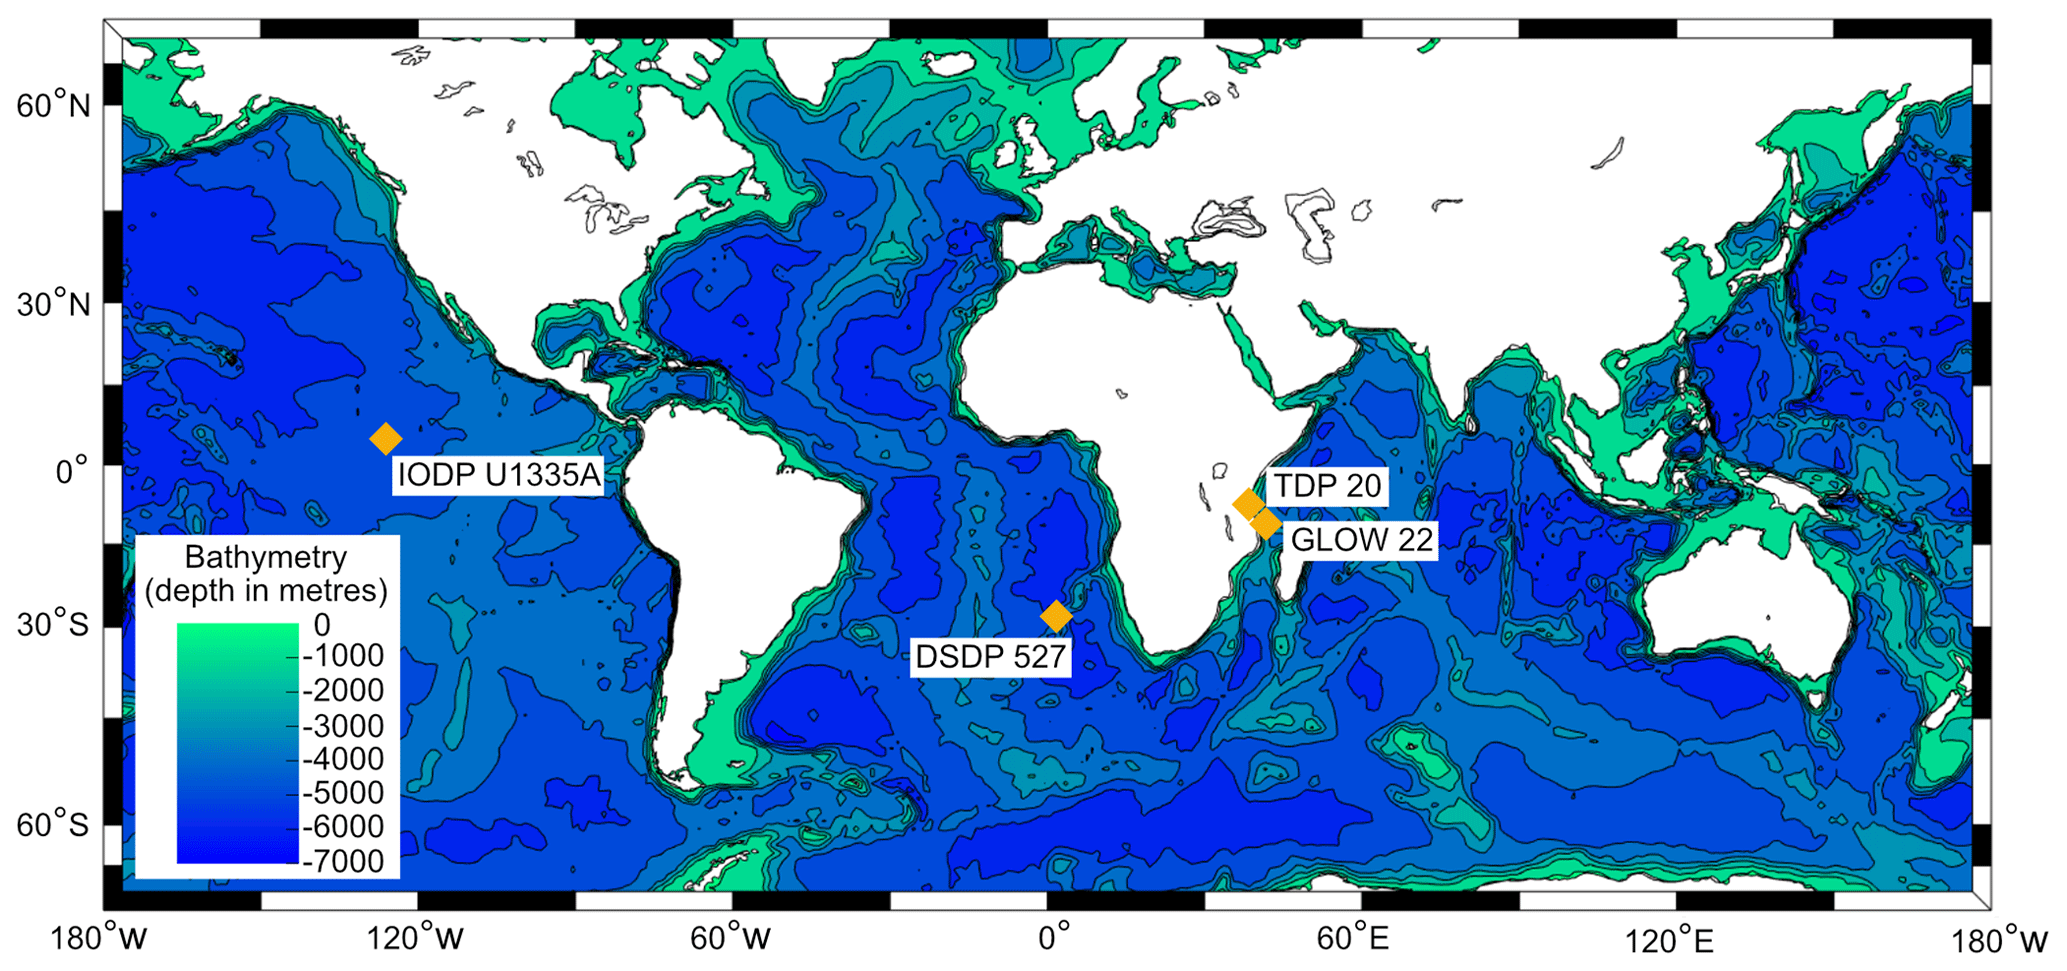
Figure 1Map showing the locality of sediment cores that provided specimens for analysis.
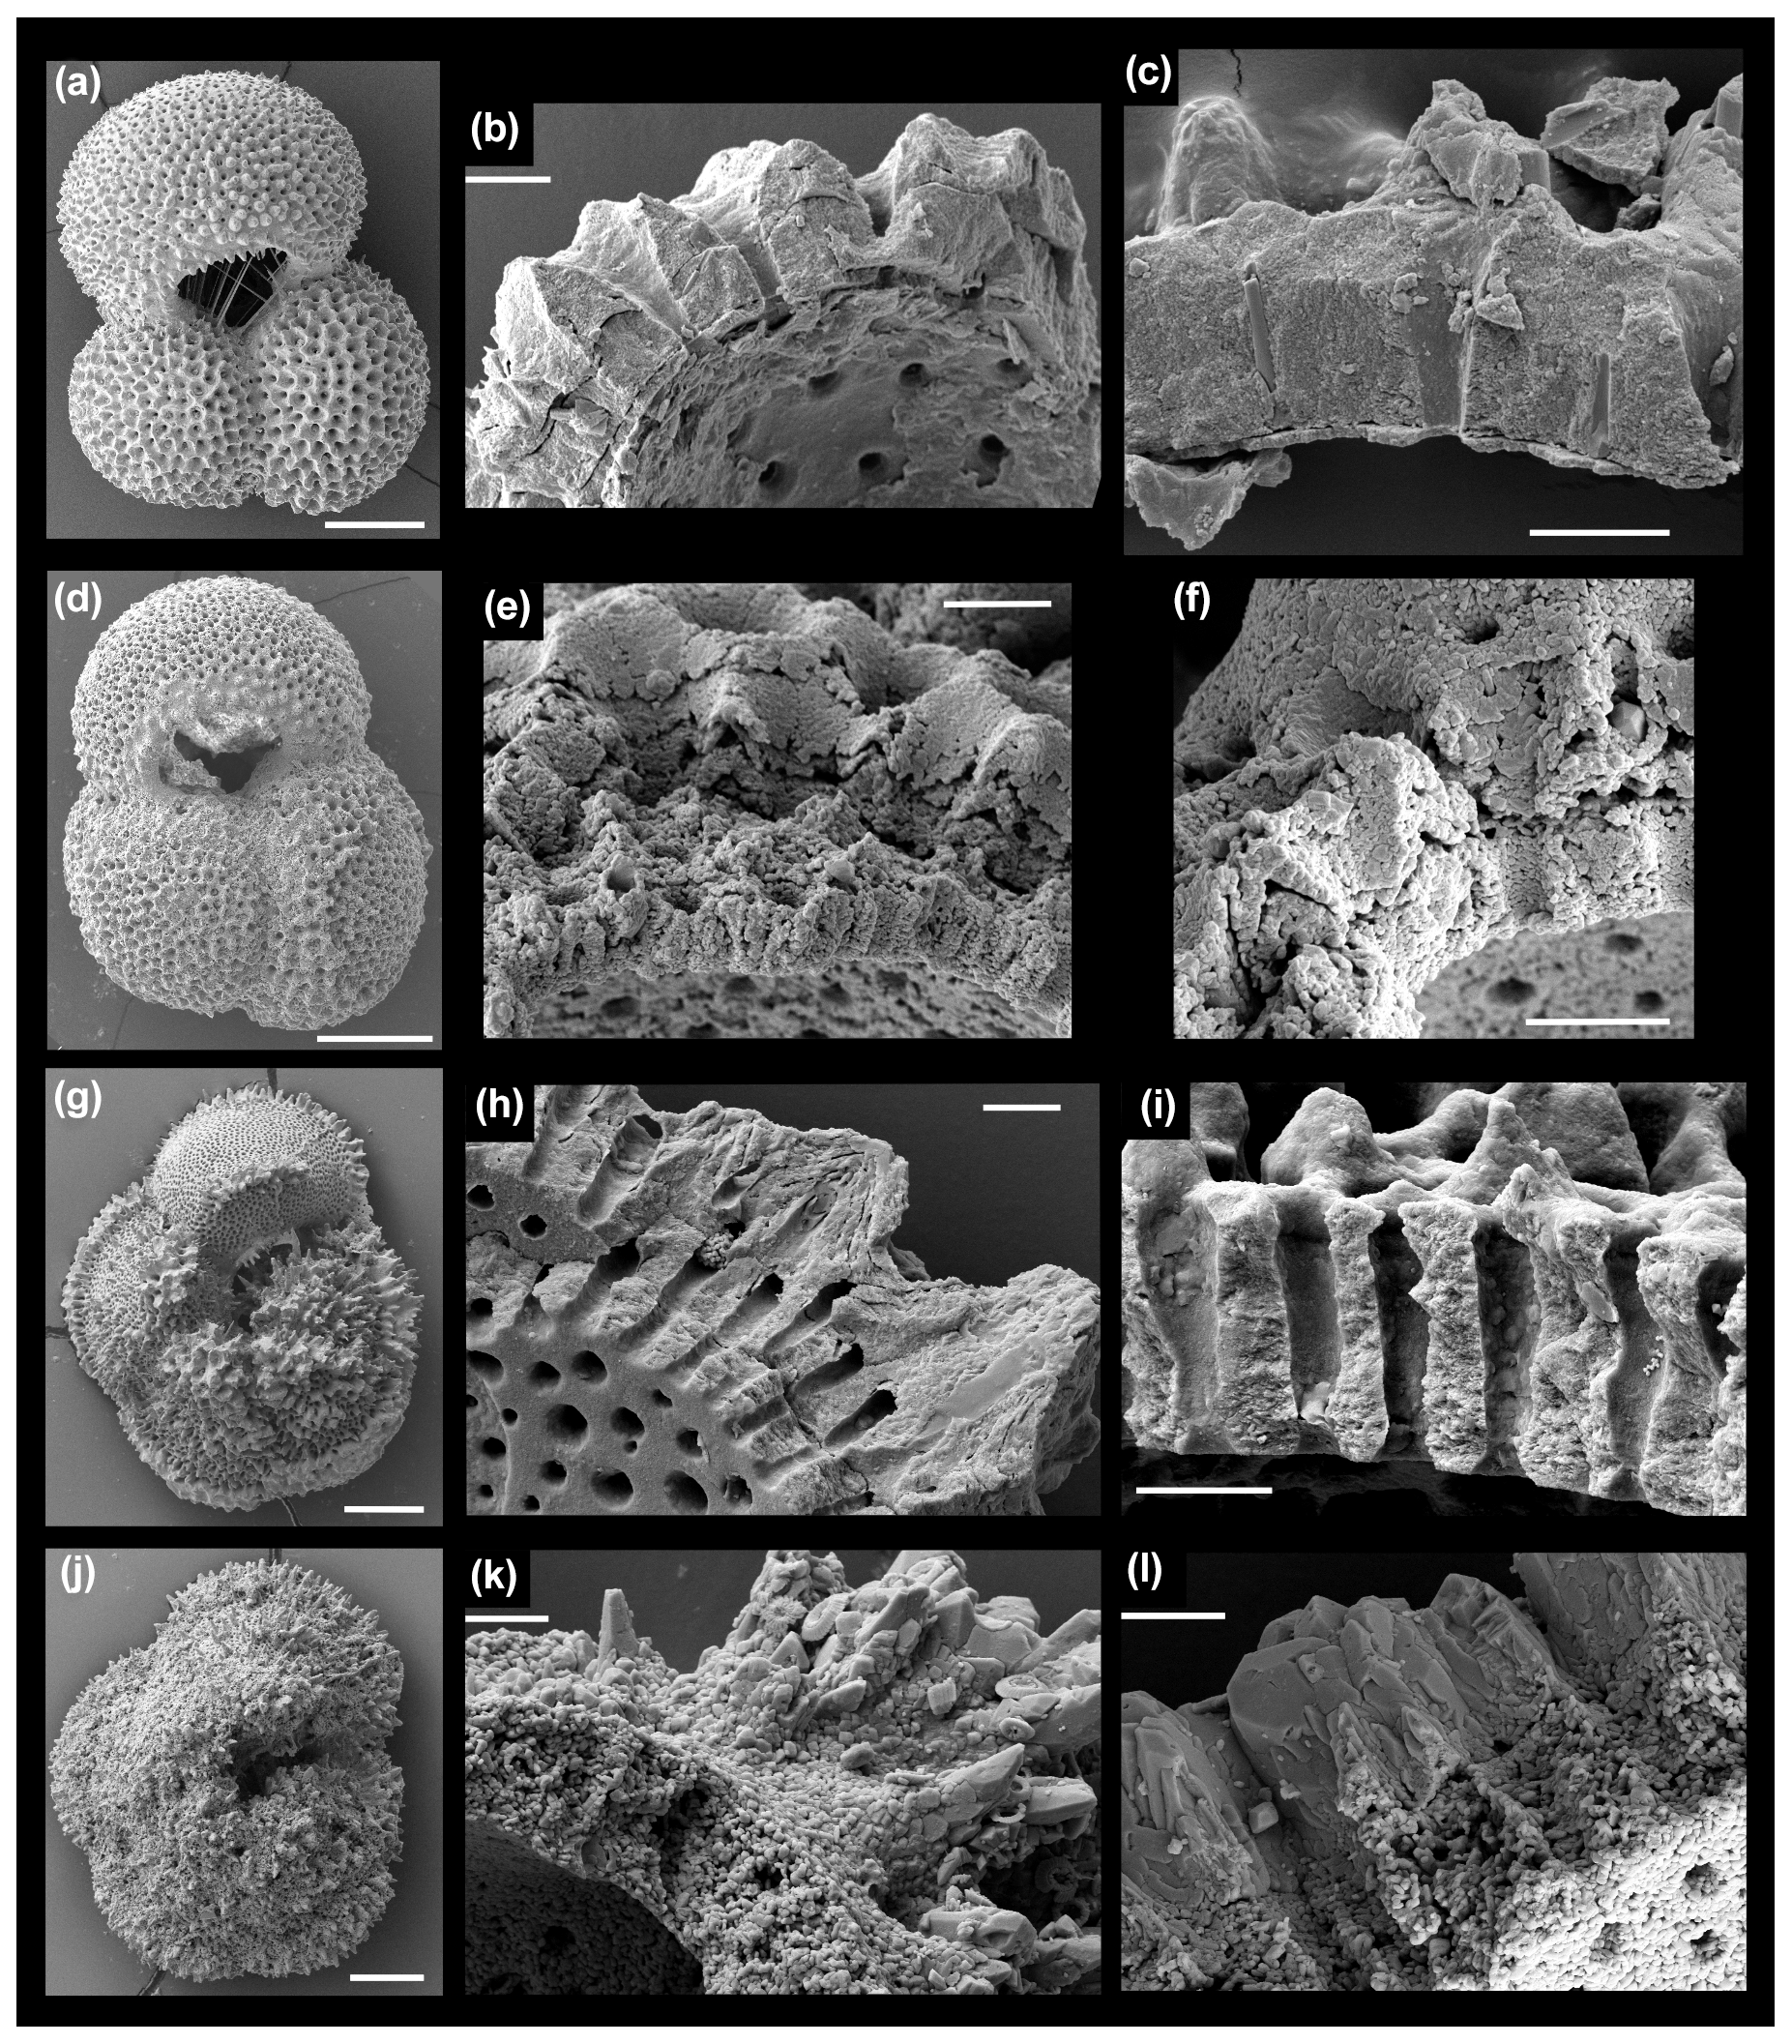
Figure 2Scanning electron micrographs of representative specimens from samples used in this study (a, b, c) glassy G. ruber from GLOW 22; (d, e, f) frosty G. ruber from IODP U1335A; (g, h, i) glassy M. crater from TDP 20; (j, k, l) frosty M. crater from DSDP 527. Scale bars for whole specimens (a, d, g, j) = 100 µm; scale bars in cross section micrographs (b, c, e, f, h, i, k, l) = 10 µm.
2.1 Sample material and preparation
We selected representative “glassy” and “frosty” specimens of each of the species G. ruber and M. crater. Both are taxa that lived in the surface mixed-layer of the open oceans and hosted algal photosymbionts (e.g. Aze et al., 2011). Globigerinoides ruber (0–15.12 Ma) (Lamyman, 2023) represents a Neogene to recent species with a cancellate wall texture and M. crater (43.57–54.06 Ma) (Lamyman, 2023) is a Paleogene species with a muricate wall texture. Foraminifera were recovered from core material known to contain foraminiferal specimens with differing degrees of preservation (Fig. 1; Table 1). The sediments from both Tanzanian cores, TDP 20 and GLOW 22, are rich in clay (GLOW Cruise Unpublished Site Survey Report), with the principle lithology of our section from TDP 20 comprising soft light olive grey clays with mottled yellowish orange sandy clay (Nicholas et al., 2006). On the contrary, our core samples from site U1335A and DSDP 527 are characterised by nannofossil ooze, with ∼ 60 % CaCO3 wt % in our section from U1335A (Pälike et al., 2010), and our DSDP section characterised by nannofossil ooze and nannofossil chalk, has a calcium carbonate content fluctuating around 90 % (Moore et al., 1984). Representative SEM images from each sample are presented in Fig. 2. Sediments were wet sieved over a 63 µm mesh, with residues then dried in an oven overnight at ∼ 40 °C. Individual specimens of differing preservation quality were identified by visual inspection under a Zeiss Axio Zoom V16 light microscope. The selected specimens were then ultrasonicated in DI water (and methanol for M. crater specimens, dependent on laboratory protocol) to remove any sediment residues. The preservation state of each sample was examined by SEM imaging of test fragments on an FEI Quanta 650 FEG ESEM (School of Earth and Environment, University of Leeds) and a Zeiss Sigma HD Field Emission Gun Analytical SEM (School of Earth and Environmental Sciences, Cardiff University). Four foraminiferal specimens (both species, glassy and frosty) were then embedded in EpoThin 2 epoxy resin using a 25 mm diameter mould. The resin block was ground gently using 1200 grit silicon carbide grinding discs (MetPrep), until the samples were exposed and the block face flat. The mounted sample was then polished using 6, 3, 1 and 0.25 µm diamond pastes (Struers Ltd), before a final polish for 8 min with 0.05 µm grade colloidal silica (MetPrep), creating a smooth surface at the equatorial plane of the specimens. Samples were carbon coated before SEM analysis and either carbon or silver coated for EMPA analyses, depending on the laboratory.
2.2 Quantitative orientation and microstructural analysis using electron backscatter diffraction analysis
Electron backscatter diffraction (EBSD) analysis was conducted on the FEI Quanta 650 FEG ESEM instrument, with the Oxford Instruments Symmetry detector (School of Earth and Environment, University of Leeds). The surface of the samples was inclined 70° to horizontal for analysis. Analyses were conducted at a voltage of 20 kV and a beam current of 8 nA. Comparable areas of the penultimate chamber of each specimen were indexed on a regular grid with a step size of 200 nm. Grains (crystallographically aligned domains) were mapped, delimited by a defined grain boundary misorientation of > 10° (where the difference in orientation between a grain and a neighbouring grain is greater than ten degrees). This paper focuses on these crystallographically aligned domains, or “mesocrystals”. The ability to resolve the intricate substructure was dictated by a precision of 0.3° in angular orientation of the EBSD analysis itself and a step size of 200 nm. If individual calcite structures were present within the shell, but were smaller than 200 nm, or differed in orientation from the neighbouring crystal by less than 0.3°, they would not have been resolved. Consequently, our study cannot inform on the presence and characteristics of such potential structures. Forescatter images were also taken using the forescatter detectors mounted on the EBSD detector (Prior et al., 1996).
2.3 Electron microprobe analysis (EMPA)
Elemental maps of the foraminifera tests were made for magnesium and calcium, using wavelength dispersive spectroscopy (WDS) to enable interpretation of chemical signal preservation. After EBSD analyses, in preparation for EMPA analyses, the sample blocks containing G. ruber were re-polished. Quantitative EMPA maps for G. ruber specimens were made at the University of Leeds on a JEOL JXA8230 Electron Probe Microanalyser, run at 15 kV and 20 nA with a focused beam. The dwell time was 3–4 s on peak, with a pixel size of 0.9 µm. Intensity measurements for the Mg Kα X-ray were collected simultaneously across three WDS spectrometers, with the counts from all three being aggregated to improve counting statistics. Calibrations for quantification were carried out for Ca on an in-house calcite standard and for Mg on an in-house dolomite standard. All WDS maps were background corrected and quantitative maps were produced using the software package Calcimage (Probe Software Inc., Eugene, OR, USA). Detection limits for Mg were 0.016 element wt % for an average of 4 pixels (or 0.031 element wt % for a single pixel). Analytical uncertainty expressed as SE ranged from 7 % to 13 % for an average of 4 pixels across the displayed range of Mg concentration. EMPA maps for M. crater were made at the University of Bristol (also published in John et al., 2023) using quantitative X-ray mapping on a JEOL 8530F field-emission electron microprobe, run at 15 kV and 80 nA using a focused beam, with a pixel size of 0.9 µm and a 500 ms dwell time. The detection limit for Mg for an average of 4 pixels was 0.015 wt % (or 0.031 wt % for a single pixel) to 3 standard deviations. Analytical uncertainty for an average of 4 pixels at 4 mmol mol−1 (close to the average map value) was ∼ 9.5 % SE; whereas 11 pixels need to be integrated at lower ratios of around 2 mmol mol−1 to achieve an error of 10 %. Maps of M. crater were quantified in the Probe for EPMA software (Probe Software Inc., Eugene, OR, USA). For all maps, data processing masked pixels with less than 35 wt % Ca, to remove pixels of non-pure calcium carbonate and to remove edge effects. ImageJ software was then used to present the maps in mmol mol−1. The original EMPA .tif files are available in Procter (2024) and John (2023).
2.4 Data treatment
Electron backscatter patterns were recorded with the Oxford Instruments Aztec software package and analysed within Oxford Instruments post-acquisition processing software Aztec Crystal (Version 2.1). The Aztec crystal files are available in Procter (2024). Maps show EBSD data (Figs. 3e–h, 4e–h). Grain maps depict individual grains (as previously defined) in random colours (Figs. 3e, f, 4e, f). Inverse pole figure colour maps showing crystallographic orientation in the y-direction (IPF-Y maps) show the crystal orientation at each analysis spot, colour coded according to the relative orientation of the crystallographic axes in relation to the sample y-direction (see colour key in Figs. 3h, 4h). A red colour denotes that the c-axis of the crystal is parallel to the sample's y-direction. As the colour moves away from red, as shown on the colour key, the orientation of that crystal has moved away from parallel. Grain orientations were also plotted on equal-area pole figures. These pole figures (Figs. 3i, j, 4i, j) are a 2D representation of a 3D feature; where a single point represents a line, here representing the specific axes of the individual grains. In our specimens the orientation space on the pole figure mimics the spatial distribution across the shell. 3D diagrams of individual calcite unit cells show the orientation of individual crystals in space, and three crystals across each shell are highlighted on the maps and pole figures and presented as unit-cell diagrams, to show how the crystal orientation changes across the curvature of the shell (Figs. 3g, h, 4g, h). As represented by the 3D diagram unit cells, the c-axis is the long axis. The crystallographic system of calcite (trigonal, hexagonal scalenohedral) dictates that there is only one c-axis, but three a- and m-axes (Nicolas and Poirier, 1976) each perpendicular to the c-axis in each crystal, which is why there are more points on the a- and m-axis pole figures. Owing to the tightly constrained orientation of many of the c-axes perpendicular to the growth surface, it is only possible to differentiate different grains by also taking the orientation data of the a- and m-axes into account, thus using the full crystallographic orientation data.
3.1 General wall texture
Scanning electron microscope (SEM) images (Fig. 2) show some preliminary differences between glassy and frosty specimens of both species. Glassy specimens display a microgranular calcite texture in cross section, with sub-micron microgranules not resolvable at this scale: a texture typical of good preservation. The texture differs in the frosty specimens, which possess blockier, larger (typically ∼ 1 µm in diameter), more equant calcite structures in the test wall cross sections that are more clearly visible in SEM. There are also even larger bladed crystals towards the outer edge of the frosty M. crater specimens. Forescatter electron (FSE) images show the different wall textures, and further indicate the degree of preservation in the two species (Figs. 3a–d, 4a–d). The G. ruber texture in the glassy specimen cross section shows the typical wall ultrastructure of a cancellate species with topographic lows and highs in the test wall indicating pores and inter-pore ridges. The outer test wall and pore channels are less distinct in the frosty G. ruber specimen. The finger-like projections characteristic of the muricate wall texture are clearly visible in the glassy M. crater (Fig. 4a) and are present but less clearly defined in the frosty M. crater (Fig. 4c). In both glassy G. ruber and M. crater, bands that run parallel to the surface of the test wall are visible, representing growth layers, and these bands are exceptionally clear in the glassy M. crater specimen. This growth structure is not visible in either frosty specimen. A major difference in the test structure of the two M. crater cross sections is the much thicker test wall in the frosty specimen (Fig. 4c) than in its glassy counterpart (Fig. 4a). Darker sections of the images indicate areas with increased porosity (Figs. 3a–d, 4a–d), with both G. ruber and M. crater frosty specimens more porous than their glassy counterparts. In both frosty specimens, the areas of greatest porosity are towards the inside of the test wall, approximately one third of the way up from the inner surface, with less porosity observed on the outermost sides.
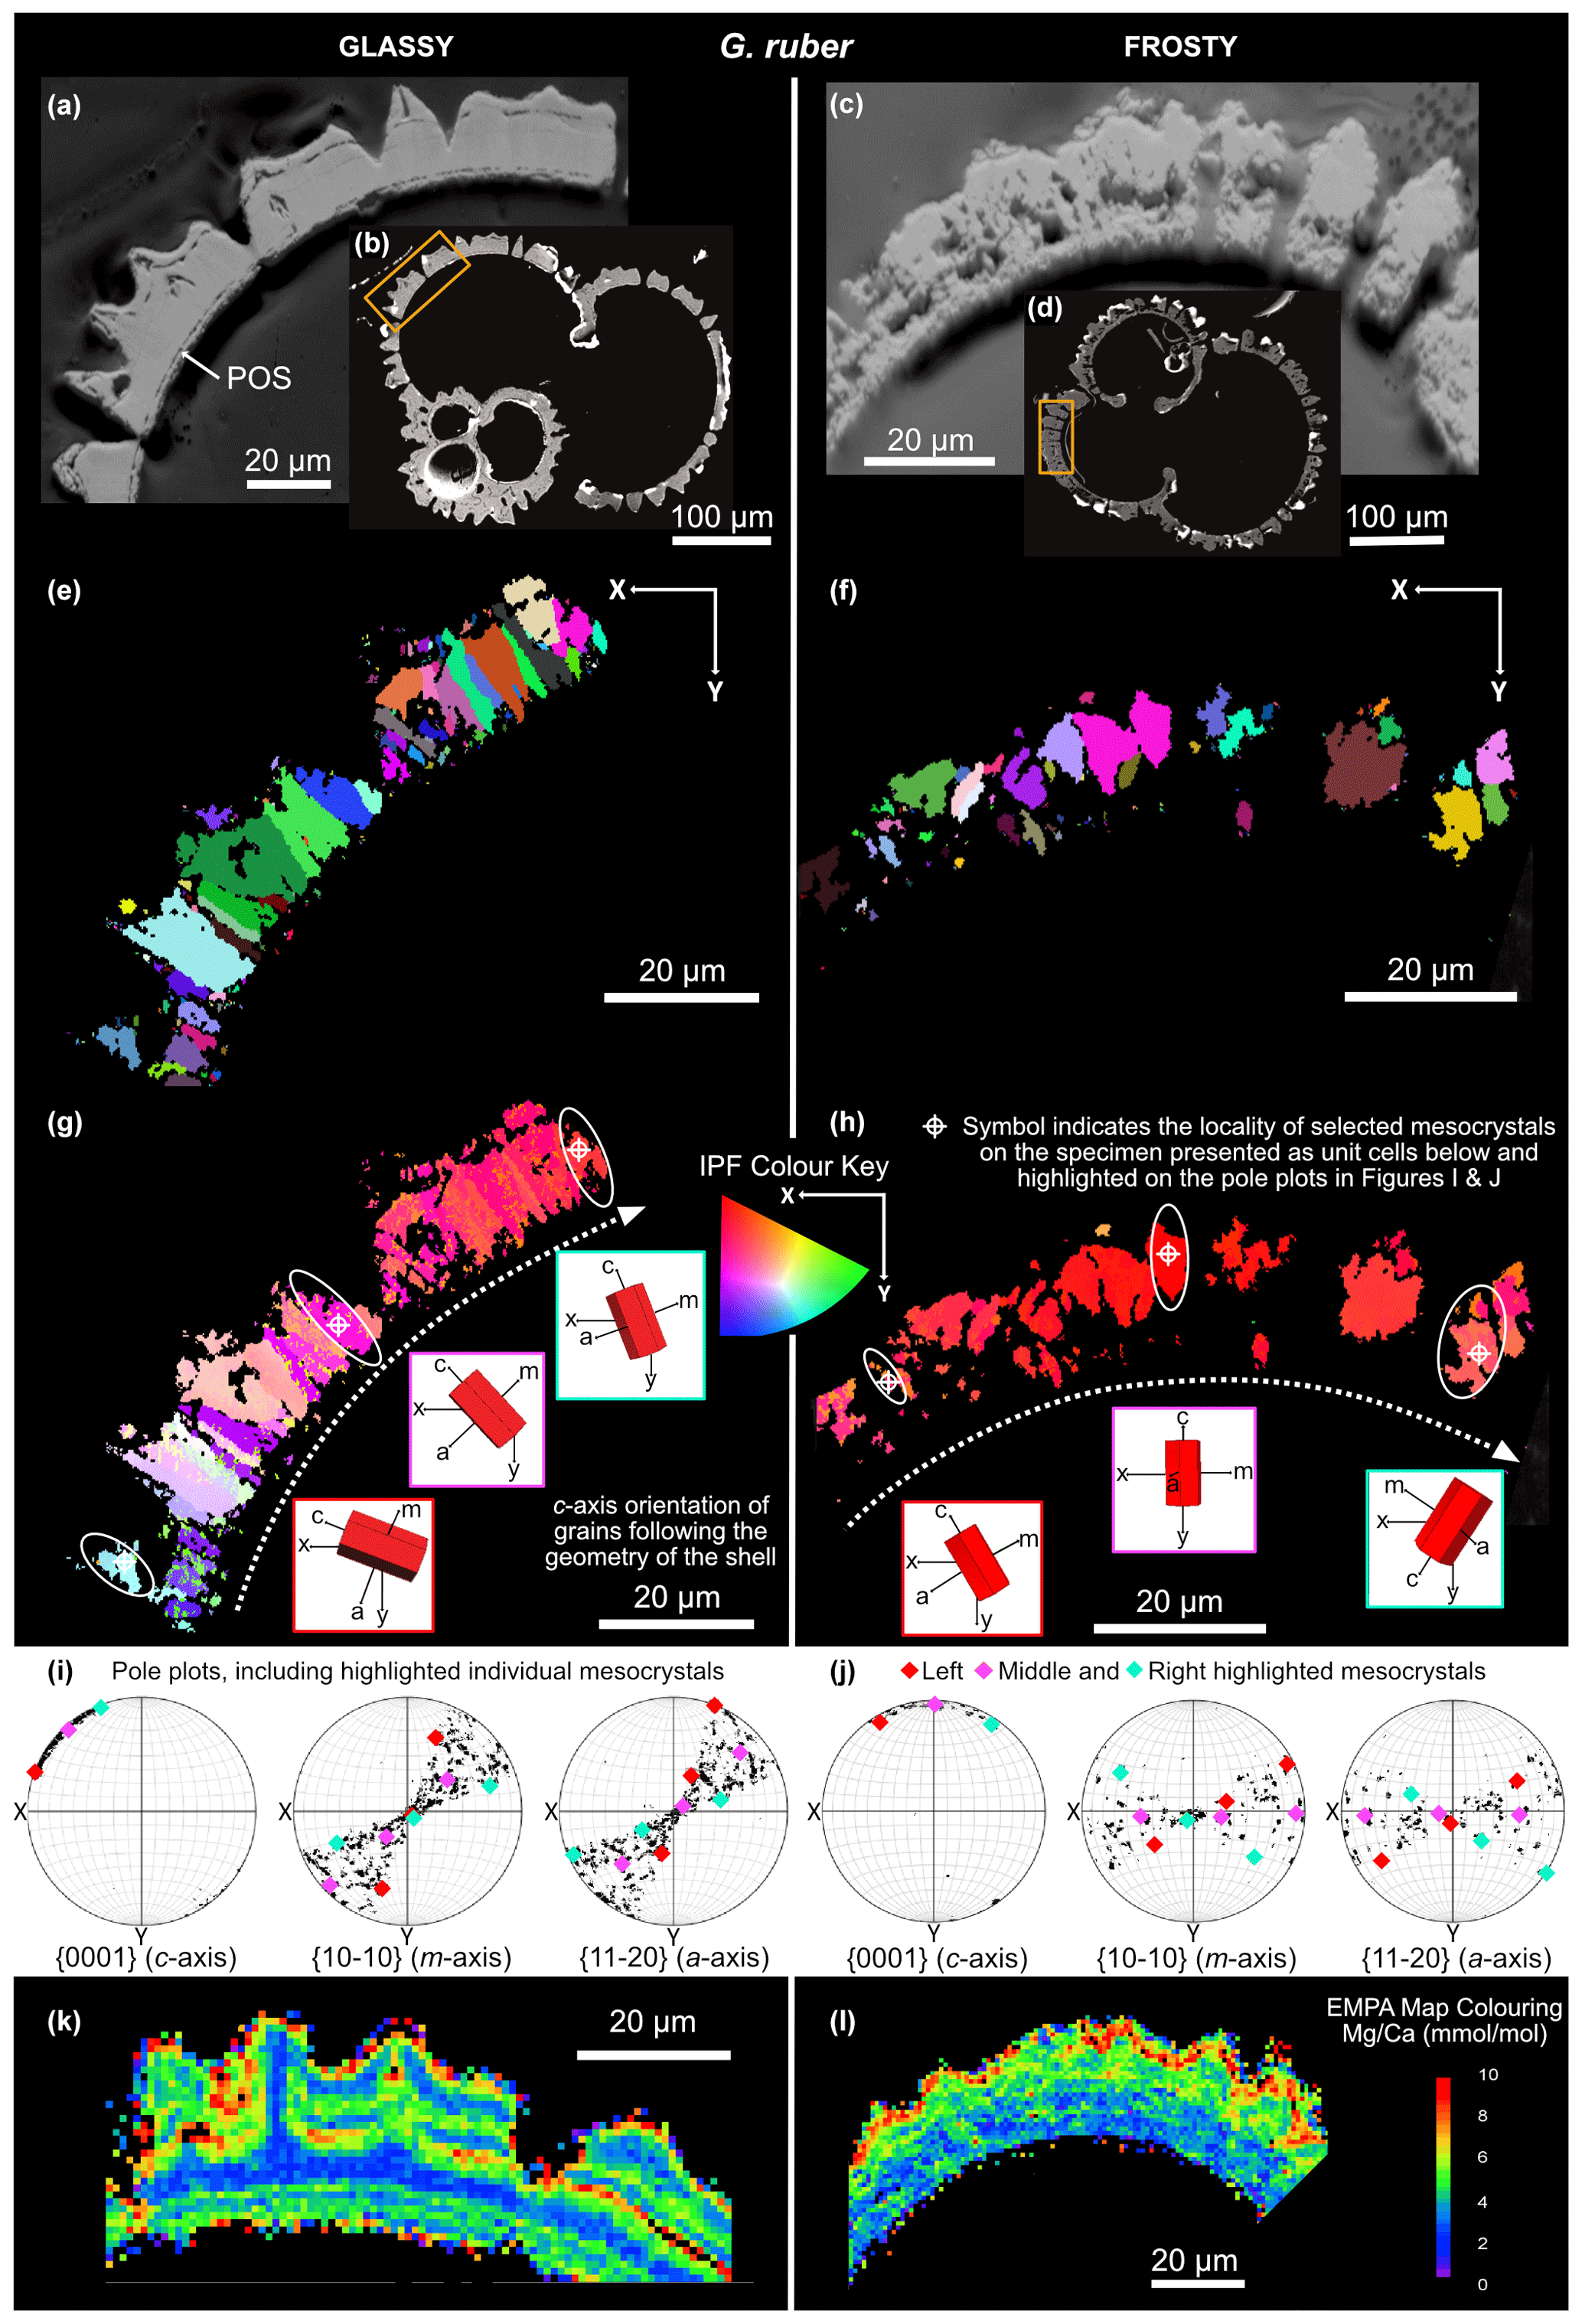
Figure 3Forescatter images of “glassy” (a, b) and “frosty” (c, d) G. ruber specimens, with the area analysed highlighted by the orange box (b, d). Microstructural crystal maps (e, f) with grains highlighted in random colours to show grain size, shape and position. IPF-Y coloured maps (g, h) showing the orientation of crystals with respect to the y-direction of the sample. Pole plots (i, j) showing the crystallographic orientation of the mapped area. Selected grains highlighted show the change in orientation with the geometry of the shell, with unit cell schematics (g, h). EMPA-derived maps are shown in (k) and (l).
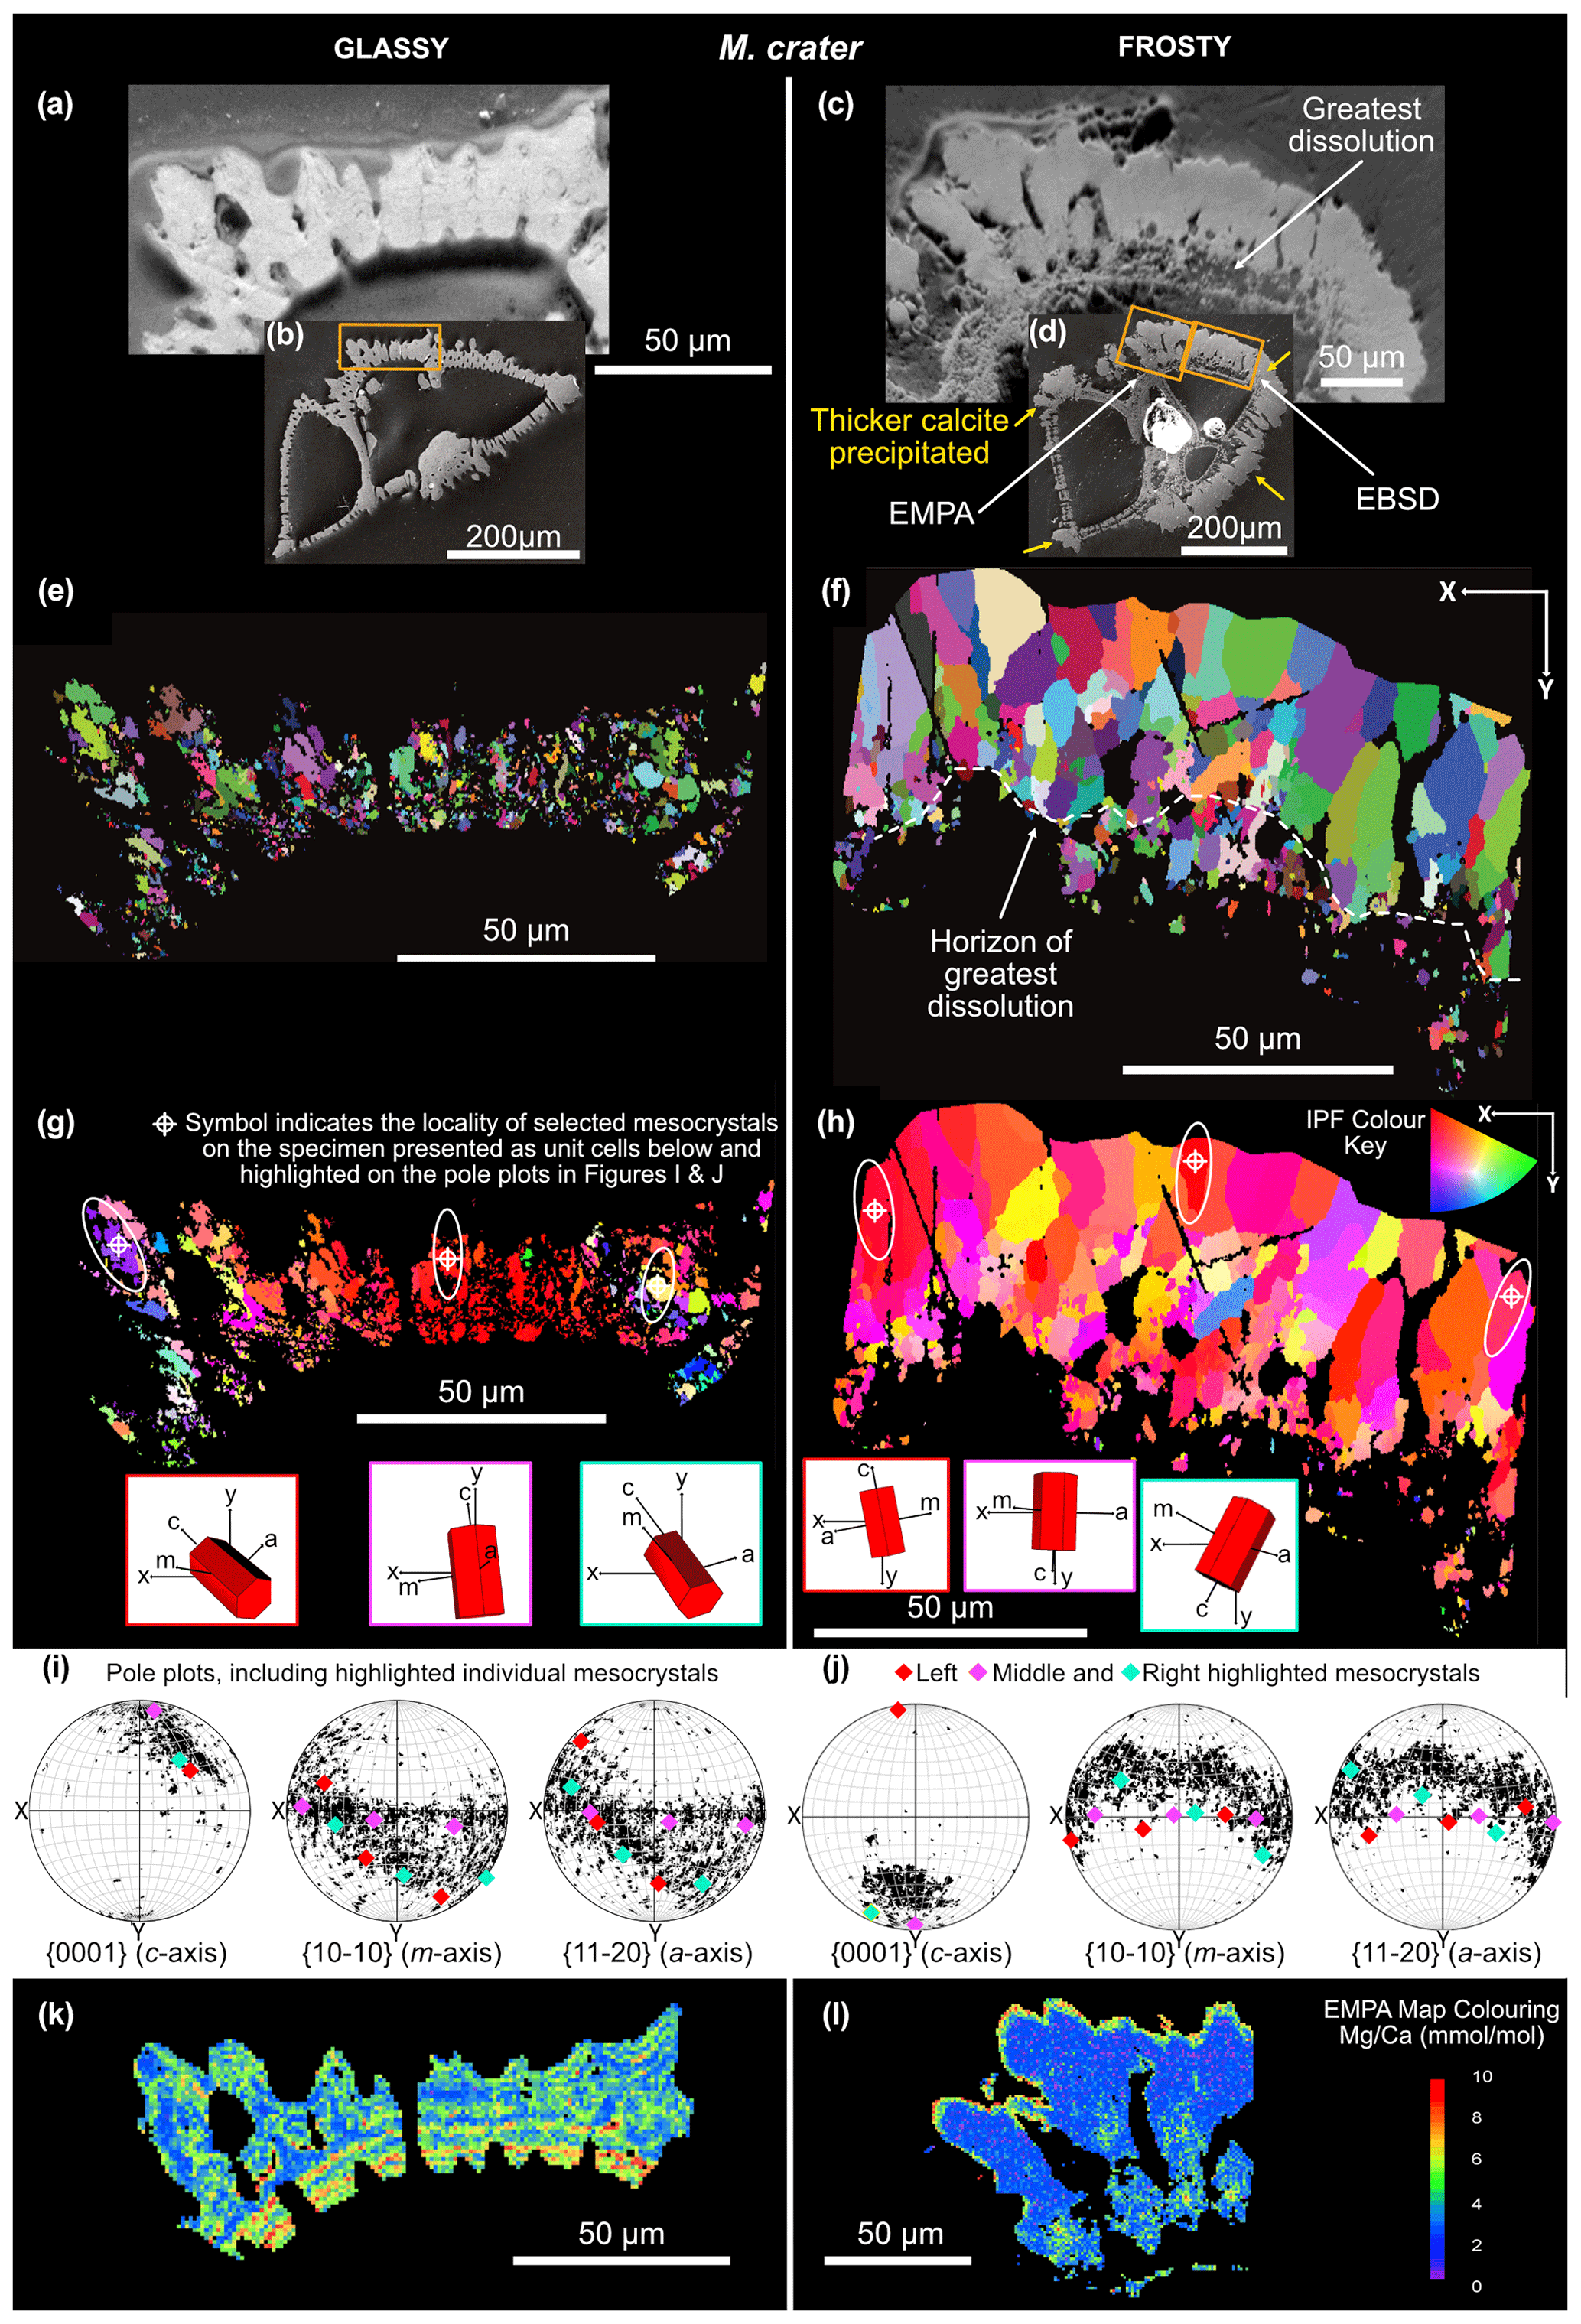
Figure 4Forescatter images of “glassy” (a, b) and “frosty” (c, d) M. crater specimens, with the area analysed highlighted by the orange box (b, d). Microstructural crystal maps (e, f) with grains highlighted in random colours to show grain size, shape and position. IPF-Y coloured maps (g, h) showing the orientation of crystals with respect to the y-direction of the sample. Pole plots (i, j) showing the crystallographic orientation of the mapped area. Selected grains highlighted show the change in orientation with the geometry of the shell, with unit cell schematics (g, h). EMPA-derived maps are shown in (k) and (l), previously published in John et al. (2023).
3.2 Grain geometry and microstructure
Electron backscatter diffraction grain maps show foraminiferal calcite to be arranged in crystallographically aligned domains, or “mesocrystals”. Grains are highlighted in randomly assigned colours, indicating the size and shape of these crystallographically aligned domains (Figs. 3e, f, 4e, f). These coloured microstructural maps are distinctly different in glassy and frosty specimens of both species. The glassy G. ruber has very well-organised, elongated mesocrystals projecting perpendicular to the interior test wall. The mesocrystals in the frosty G. ruber are less well-organised and less linear in shape, with more irregular-shaped grain boundaries between domains. Although there is little difference in the mean size of mesocrystals between frosty and glassy G. ruber (8.61 and 9.92 µm2 respectively), there is a notable difference in the size of the largest grains, with a maximum grain size in the frosty G. ruber specimen of 67.57 µm2, compared with a maximum grain size of 110.48 µm2 in the glassy G. ruber specimen. The shape and size of mesocrystals in glassy M. crater are decidedly different to those seen in glassy G. ruber. Mesocrystals are much smaller, with a mean grain size of 1.94 µm2 compared with the mean size of glassy G. ruber crystals of 9.92 µm2. These domains do not appear to be organised as linear structures. The crystal geometry in the glassy and frosty M. crater specimens is also distinctly different. The mean measured grain size in the frosty specimen is larger than in the glassy test (11.66 and 1.94 µm2 respectively), which is clearly visible in Fig. 4e, f, where the largest grains in the frosty M. crater specimen (231.08 µm2) are almost six times greater than the largest measured grain size in the glassy specimen (38.84 µm2). There is also much greater variation in the size of grains measured in the frosty M. crater than in the glassy counterpart, with standard deviations in grain size area of 26.04 and 3.63 µm2 respectively. This difference in grain size correlates with the position within the test wall, from smaller grains at the inside edge of the shell to much larger crystals towards the outer edge of the shell. The geometry and shape of these larger grains on the outer edge of frosty M. crater differ strikingly from the smaller grains. Large grains show “fanning” grain boundaries, with grains becoming wider towards the outer rim of the shell. These fanning grains are observed here to be associated with a lack of porosity (Fig. 4c, f, h).
Calcite twinning, defined as a 60° rotation around the c-axis, is present in both G. ruber and M. crater specimens, at a frequency much greater than would be expected by chance orientation (Appendix A). The glassy G. ruber exhibits twinning in 22 % of grains, whereas twinning is only displayed in 7 % of grains in the glassy M. crater. Both frosty specimens show less extensive twinning, with 9 % of G. ruber grains displaying twinning and just 2 % in the frosty M. crater (Appendix B).
3.3 Crystallographic orientation characteristics of mesocrystals
The mesocrystals in every specimen analysed (Figs. 3g, h, 4g, h) show a preferred crystallographic orientation of the c-axis (long axis) aligned perpendicular to the shell wall and the primary organic sheet (POS). The c-axis of crystals are most strongly clustered on the pole figures of glassy G. ruber, with strong alignment also present in frosty G. ruber, despite a greater spread in the orientation data of frosty G. ruber (Fig. 3i, j). In the G. ruber specimens in particular, the orientation of mesocrystals follows the geometry of the shell, as represented by the gradual change in colour on the IPF-Y coloured crystal maps (Fig. 3g, h). Individual unit cell schematics (red hexagonal prisms in Figs. 3g, h, 4g, h) show this grain orientation and how it changes with the curvature of the shell. Glassy M. crater also displays this general preferred c-axis orientation; however, the c-axis orientation appears to differ where larger muricae are present (on either side of the specimen cross section), as seen in the greater spread of data on the pole figures and the wider range of colours on the IPF-Y plots (Fig. 4g), with c-axis alignment deviating by up to 70° from perpendicular in these larger muricae. Although the frosty M. crater has largely retained a similar crystallographic orientation to the glassy specimen with c-axes typically aligned perpendicular to the shell wall, more randomly oriented grains are interspersed, shown by the presence of different colours in the IPF-Y plot (Fig. 4h). The spread of crystal orientation in M. crater specimens (Fig. 4i, j) is greater than that observed in G. ruber specimens. In all specimens, the orientations of a- and m-axes are more varied than c-axes.
3.4 Magnesium calcium geochemistry
Electron microprobe analyser (EMPA) maps show clear, several micron-wide bands of alternating low and elevated ratios in both glassy and frosty specimens of G. ruber (Fig. 3k, l). However, this banding is less well defined and generally more homogenised in the frosty specimen of G. ruber. Absolute ratios appear to be generally higher in the frosty specimen, with a clear band of high ratios (up to 10 mmol mol−1) towards the outside edge of the test (Fig. 3l). Alternating bands of higher and low ratios are exceptionally clear in the glassy M. crater specimen, where chemical banding is prevalent throughout. The ratios in the frosty specimen, however, are completely homogenised, consisting of low calcite, with no distinct interspersed bands of higher magnesium concentrations.
4.1 Microstructure and geochemistry of primary biogenic calcite
Glassy specimens are generally assumed to have been subject to negligible post-mortem modification (Sexton et al., 2006). As such, the microstructure of glassy specimens is taken as representative of the primary biogenic calcite microstructure for each species. Despite having different wall textures, the incremental addition of calcite layers, as evidenced by the internal banding shown in FSE images (Figs. 3a, 4a), is present in both G. ruber and M. crater. The fact that these intricate cross-sectional details are still visible confirms that these specimens have experienced little diagenetic alteration. We observe a mesocrystal structure in the well-preserved, glassy specimens of both species, although there are differences in the mesocrystal geometry of each wall texture. The predominant orientation of crystal c-axis oriented perpendicular to the test chamber surface for both G. ruber and M. crater is consistent with existing studies of foraminiferal calcite crystal orientation (Pabich et al., 2020; Arns et al., 2022; Lastam et al., 2023). The mesocrystals we observe are made up of microcrystallites, all oriented within 10° of each other. These crystallites are formed as layers of biogenic calcite (the previously noted internal banding), which are deposited over the whole test each time a foraminifer precipitates a new chamber (Fehrenbacher et al. 2017). These depositions propagate outwards from the POS, creating large elongated mesocrystals in G. ruber (Fig. 3e) and smaller, less elongated mesocrystals in M. crater, which may be a function of the spine-like projections of the muricate wall texture throughout the test wall (Fig. 4e) (Pearson et al. 2022). The mesocrystals of glassy G. ruber continue through the compositional banding (Fig. 3), suggesting that each successive layer of calcite might retain or template the same orientation as the crystals laid down before it. Lastam et al. (2023a) found that the inclusion of organic layers throughout the test (the darker layers highlighted by our FSE images) does not impede the addition of consistently oriented calcite growths after each chamber formation, and may even contribute to maintaining the consistent direction of growth by templating the orientation laid down before each additional chamber.
There is an apparent increase in twin boundary prevalence in the modern G. ruber species compared with the Paleogene M. crater. Previous work has identified calcite twinning as a strongly developed feature in three other modern perforate planktonic foraminifera species (G. sacculifer, O. universa and P. obliquiloculata), whereas twinned calcite, although present, is not a predominant structural characteristic in the two microperforate species studied (Lastam et al., 2023b). The apparent increase in twin prevalence we observe between the extinct Paleogene species M. crater and the extant species G. ruber may be reflective of an evolutionary biological development. Twinned crystal boundaries are structurally stronger (Lu, 2016) and it is possible that perforate planktonic foraminifera have developed an affinity for twinned crystal boundaries to develop a stronger biogenic structure. To test this hypothesis would require further investigation, widening the data set to a significantly higher number of specimens and species.
We observe alternating bands of high and low ratios in both well preserved G. ruber and M. crater specimens at high spatial resolution, as has been described in other studies (e.g. Sadekov et al., 2005; Fehrenbacher et al., 2017; John et al., 2023). The internal banding of differing calcite chemical composition is thought to be a result of biological processes, including chamber formation (Jonkers et al., 2016), the presence of organic membranes (e.g. Kunioka et al., 2006; Branson et al., 2016; Bonnin et al., 2019) and biomineralisation on a diurnal cycle after the deposition of the final chamber, during test thickening (e.g. Spero et al., 2015; Fehrenbacher et al., 2017). This lateral geochemical fabric gives credence to the lateral templating observed by consistent crystal orientation of subsequently deposited layers of calcite. The high resolution of alternating higher and low banding observed also implies that we are observing well-preserved specimens.
4.2 Impact of post-depositional modification on primary microstructure and geochemistry: signatures and processes
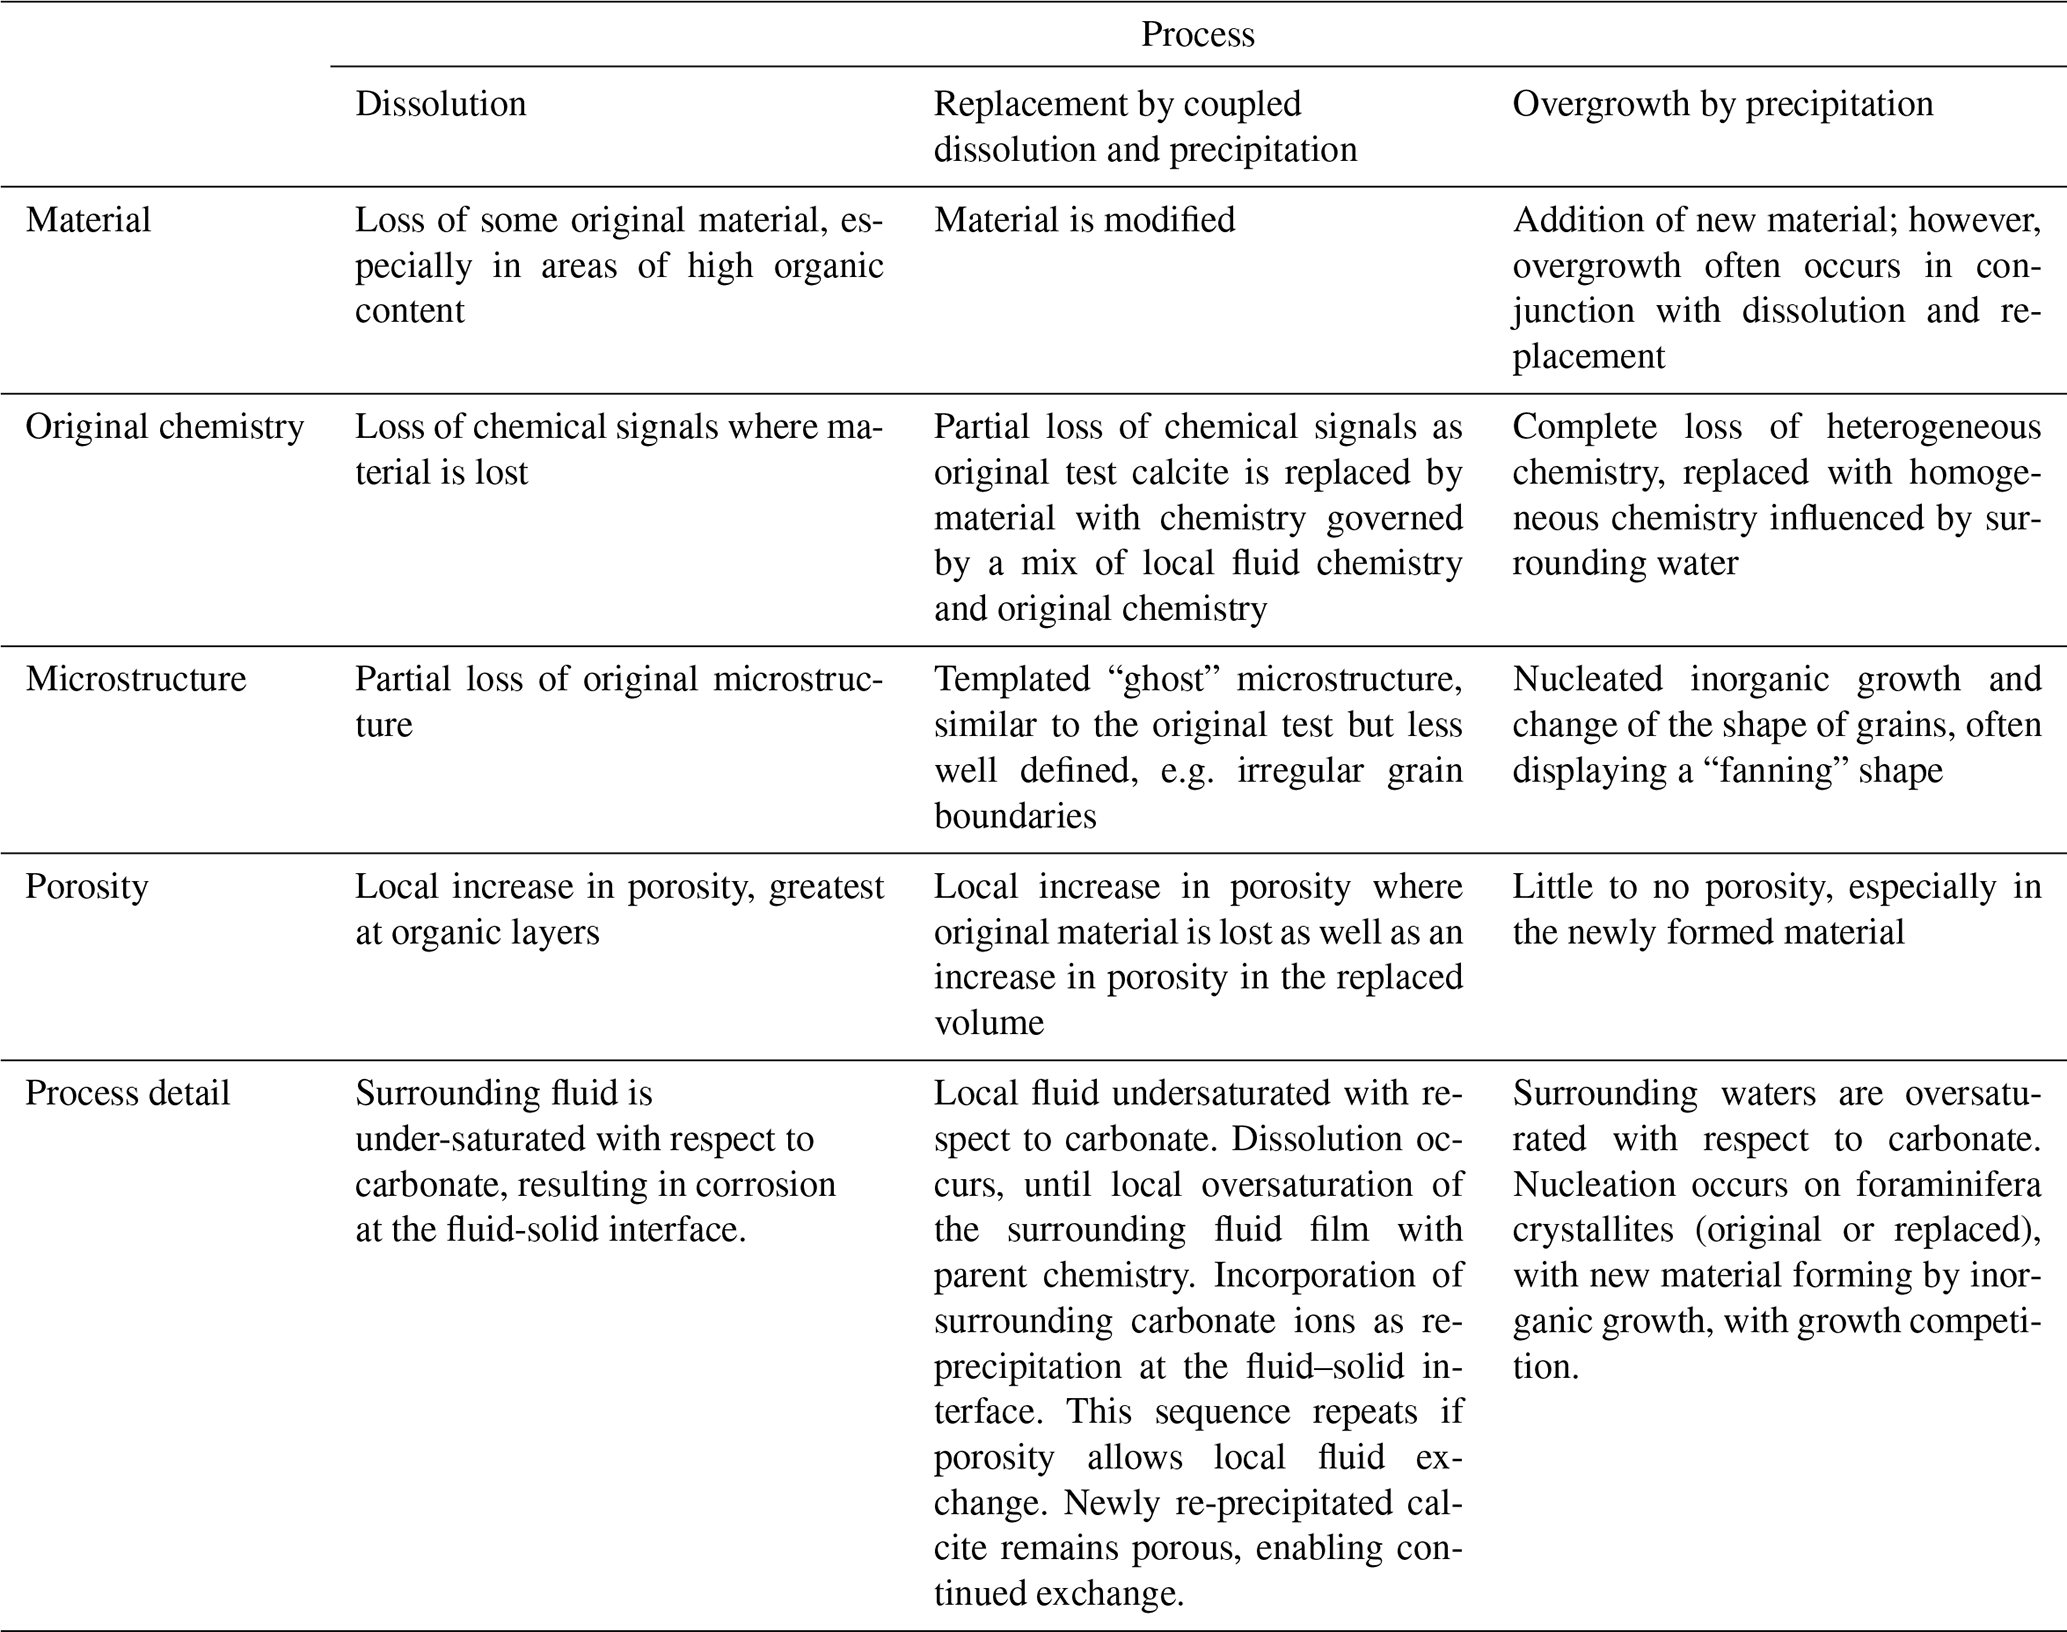
Assuming that the glassy specimens are the most representative of original unaltered foraminiferal calcite, comparing the microstructure of these specimens alongside frosty samples allows us to make inferences about post-mortem changes. In the following, we identify three main processes (namely: (i) dissolution; (ii) interface-coupled, fluid-mediated replacement reactions of dissolution and re-precipitation; and (iii) overgrowth), which we argue to be responsible for the observed range of changes, in both geochemistry and microstructure. A summary of these processes and their different effects on foraminiferal calcite are presented in Table 2 and schematically in Fig. 5.
Table 2Summary of post-depositional modification processes affecting test microstructure and geochemistry.
Frosty specimens of both species display increased porosity throughout the test wall (Figs. 3c, 4c) that is not present in either glassy specimen, suggesting that post-depositional modification might have occurred via dissolution of test calcite (Pearson et al., 2007; Pearson and Burgess, 2008; Johnstone et al., 2011). This dissolution is most observable on the innermost side of the test wall, permeating up to a third through the thickness of the test wall, starting roughly in line with the site of the POS. Dissolution occurs in corrosive waters under-saturated with respect to carbonate, resulting in a loss of test material (Fig. 5b, Table 2). Previous work has suggested that the POS and other organic linings might provide an opportunity for fluid flow within the test wall (Cisneros-Lazaro et al., 2022), and the concentration of dissolution effects near the site of the POS could indicate that corrosive water may indeed have exploited this susceptible area in the test walls of our frosty specimens. This is a significant observation, because calcite associated with the POS may be enriched in magnesium (Branson et al., 2016). Therefore, preferential dissolution of this region may contribute to the relationship between planktonic foraminiferal shell weight and mean test (e.g. Rosenthal and Lohmann, 2002).
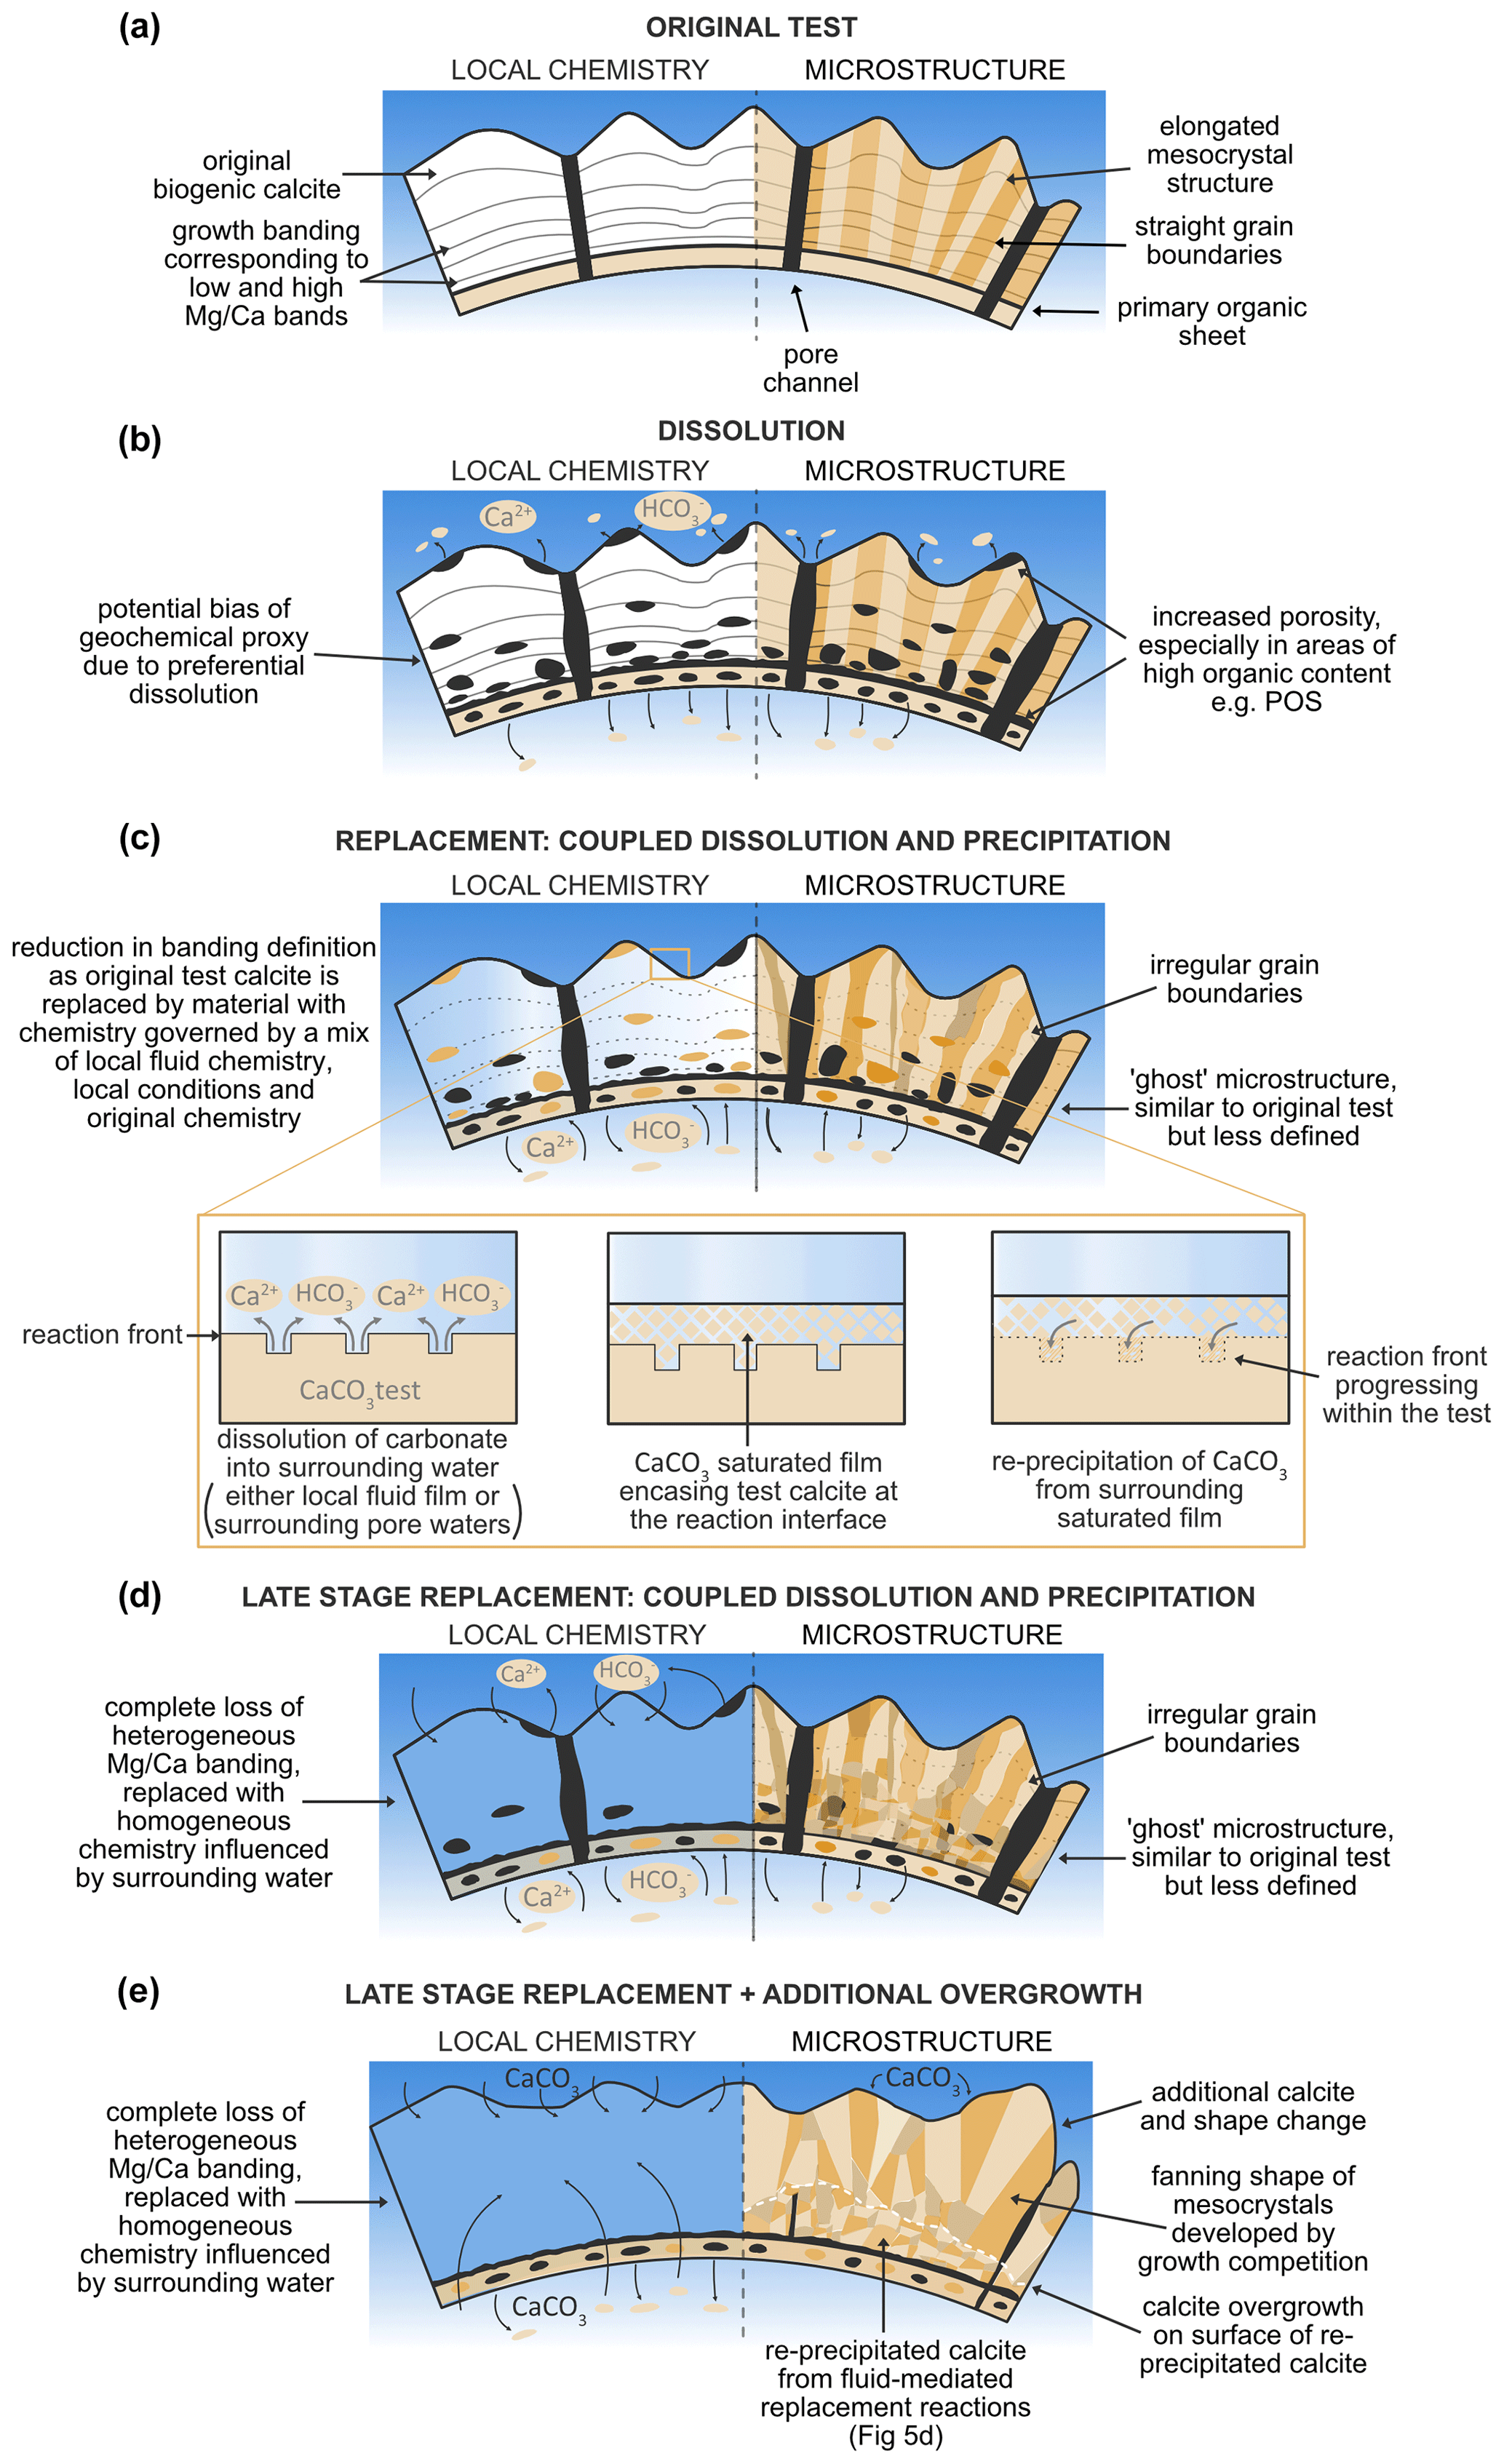
Figure 5Schematic diagram illustrating different post-depositional processes affecting foraminifera test chemistry and microstructure, (a) original test; (b) dissolution; (c) replacement: coupled dissolution and precipitation; (d) late-stage replacement; (e) overgrowth.
In addition to dissolution, our frosty G. ruber specimen displays evidence of interface-coupled, fluid-mediated replacement reactions (Putnis, 2009) (Fig. 5c, Table 2), commonly referred to as “recrystallisation”. In this work, we use the term interface-coupled, fluid-mediated replacement reactions, consisting of paired dissolution and re-precipitation to better unpack the specific processes associated with post-depositional modification of test calcite, instead of “recrystallisation”, which has previously been applied to encompass multiple forms of post-depositional change to foraminifera tests. In our frosty samples, increased porosity is combined with a limited change in grain shape, diagnostic features of paired dissolution–precipitation events (Sexton et al., 2006). Such fluid-mediated replacement reactions occur when the local fluid or surrounding waters (either within the test, as intra-test fluid films interacting with the test calcite, or pore waters surrounding foraminifera tests) are under-saturated with respect to carbonate, resulting in dissolution until a local oversaturation of the surrounding fluid film with carbonate ions, gained from the parent material (Fig. 5c). These surrounding carbonate ions are then re-incorporated into the test, forming new material, as it re-precipitates at the fluid–solid interface (Putnis, 2009). This sequence then repeats if calcite porosity allows local fluid exchange. Newly re-precipitated calcite remains porous, enabling this continued exchange. The non-linear shape of mesocrystals in both frosty specimens suggests that fluid-mediated replacement reactions might be occurring at intra-test grain boundaries, facilitated by extremely thin films of fluid between grain boundaries and is not occurring solely as a linear process from the outside of the test to within. Our results show that although re-precipitation is an inorganic post-depositional process, it is somewhat “templated” by the original biogenic structure, resulting in irregular grain boundaries and a change in crystal shape, but a retention of the general crystallographic orientation with relatively consistent orientation plotting of c-axes on the pole figures between glassy and frosty specimens, as observed in our frosty G. ruber. This observed templating of the original biogenic structure is a typical feature of products of coupled dissolution–precipitation reactions (Spruzeniece et al., 2017). This observation may shed some light on the mechanisms that alter foraminiferal test calcite, with implications for our understanding of the preservation of the test geochemistry of frosty foraminifera.
With interface-coupled, fluid-mediated replacement reactions, there is a partial loss of original geochemical signals, as the original test calcite is replaced by material with a chemistry governed by a mix of local fluid chemistry and original shell chemistry, which is reflected in the decrease in resolution of alternating bands of high and low ratios compared with the glassy specimen of G. ruber. The retention of some banding, however, reinforces the notion that banding can be preserved in recrystallised foraminifera tests, to a degree that may remain useful to geochemical proxy generation (Staudigel et al., 2022). The higher ratios observed in our frosty G. ruber compared with our glassy G. ruber are uncharacteristic of post-depositionally modified foraminiferal calcite (Regenberg et al., 2014). We note that both of our frosty foraminifera display a band of higher (∼ 8–10 mmol mol−1) towards the outer edge of the test wall, which potentially indicates the presence of an authigenic coating (Barker et al., 2003). Our samples were not chemically cleaned to remove coatings prior to analysis, so as to avoid loss of carbonate material and to avoid altering the structure of the test; therefore, we cannot comment on the implication of this for palaeoclimate reconstructions.
A simple model has been used to illustrate one possible reason why planktonic foraminiferal mean appears to be more robust to post-depositional modification than δ18O (Staudigel et al., 2022). In this model, the composition of the newly precipitated calcite depends on the temperature-dependent magnesium partition coefficient and the fluid chemistry (i.e. ). However, because the fluid is present as extremely thin films of fluid moving through the foraminiferal test, their composition soon evolves from the original pore water composition, with this evolution a function of the reaction and diffusion rates. In the case of , the system soon becomes “rock-buffered”, which limits the potential for major changes in intra-test mean , at least for early-stage alteration (Staudigel et al., 2022). This model proposes that during early-stage alteration, magnesium cations are primarily rearranged within the foraminiferal calcite lattice, smearing out the well-defined banding, but this is not associated with a major change in whole test , which is critical for the palaeothermometer. This geochemical preservation is in contrast to planktonic foraminiferal δ18O, which has much greater opportunity to be reset by the water films passing through the test. Our observations of the frosty G. ruber are consistent with model predictions for early-stage alteration (Staudigel et al., 2022). The diagenetic model suggests that ongoing modification processes might eventually destroy the banding, and the of the whole test might change as the calcite reaches equilibrium with the burial temperature and porewater chemistry. The lack of magnesium banding and generally low of the frosty M. crater specimen indicates that it has experienced a greater degree of diagenetic alteration. The extent to which the mean of this individual test has been shifted is currently impossible to determine; thus, a cautious approach would be to avoid using such a specimen for palaeoclimate reconstructions.
The frosty M. crater specimen shows evidence of yet another post-depositional modification process: overgrowth formation (Fig. 5e, Table 2) (Pearson et al., 2007; Pearson and Burgess, 2008; Kozdon et al., 2011). A striking difference between glassy and frosty M. crater specimens is the increased test thickness. This increase in thickness is associated with a change in microstructure, i.e. fanning of grains (Figs. 4f, h, 5e) and a loss of porosity in the same areas, which could in part be due to the ontogenetic build-up of calcite around the muricae, as is typical of species with this wall texture (Pearson et al., 2022). However, this thickness is not consistent across the entire surface of the test, with additional calcite precipitation present on the corners of chambers especially, and on some chamber walls to a greater extent than others (Fig. 4d, yellow arrows), which is not typically seen on well-preserved specimens. The microgranular structure typical of primary biogenic calcite, as observed in the glassy M. crater specimen, is absent in the frosty M. crater, which has a crystal geometry composed mostly of coarse crystals with straight grain boundaries and evidence of crystal fanning. This is not consistent throughout the entire thickness of the shell wall; the innermost side still possesses smaller calcite grains. The horizon where the grain sizes and shapes change from smaller, more random grains, to larger, more linear grains, appears to be at the site where the greatest dissolution has occurred (Fig. 4c, f, white stippled line). Based on the lack of porosity, the infill of previously present porosity and voids, and the fanning nature of the grains, we suggest that this test thickening might be the result of post-depositional overgrowth by inorganic calcite. Such overgrowth occurs when foraminifera are surrounded by fluid that is oversaturated with respect to carbonate, and new crystal growth occurs using the remaining shell structure as nucleation sites. Inorganic overgrowth is typically seen in experiments with clear late-stage oversaturation (e.g. Perdikouri et al., 2013). The fanning nature observed of the coarse grains is typical for so-called growth competition during crystal growth, where several grains compete, and is known from inorganic crystal growth into an oversaturated fluid (e.g. Bons et al. 2012). The grain size coarsening we observe towards the outer edge of the test wall (Figs. 4c, 5e) is also indicative of extensive “recrystallisation” (Pabich et al., 2020) or, more precisely, post-depositional modification by overgrowth. Some of the largest grains we observe on the outer edge of the test wall are likely to be representative of individual large crystals, as opposed to mesocrystals of well-aligned microgranules, as observed in the glassy specimen. The smaller grains we observe nearer to the M. crater internal test wall may not have been subject to the same level of post-depositional overprinting. Lastam et al. (2023b) observe different calcite microstructure on either side of the POS in tests of Pulleniatina obliquiloculata, with blocky crystals on the inner side and fractal-dendritic mesocrystals from the POS to the outer side. Although clear differences in test crystallographic structure are observed in our EBSD maps of frosty M. crater (also visible in cross-sectional SEM (Fig. 2l)), our data for well-preserved M. crater do not suggest the presence of different crystal structures within this wall type. Such a difference if present could explain the significant difference in crystal size from the innermost side to the outer edge of the test in our altered M. crater specimen; however, we attribute this feature to be most likely due to differential effects of post-depositional modification across the test wall, with dissolution and re-precipitation at the inner side and overgrowth characterising the outer edge of the test. The general crystallographic orientation of the overgrowth observed in frosty M. crater indicates a retention of the original grain orientation (Fig. 4h, j) consistent with nucleation of inorganic calcite on the original grains, hence retaining the original preferred orientation. This type of growth is referred to in the crystallographic literature of vein growth (i.e. crystal growth into free space in fluid-filled rock cracks) as syntaxial growth (Bons et al., 2012).
Alternating high and low bands are absent in the frosty M. crater specimen, with test chemistry now highly influenced by the chemistry of surrounding waters (Fig. 5d, e). The loss of high ratio bands during dissolution lowers the bulk ratio of the test, a common observation in foraminiferal calcite that has undergone dissolution (Regenberg et al., 2014). The composition of the calcite overgrowth observed in the frosty M. crater appears to be the same composition as the underlying re-precipitated material. This is an unexpected observation, as the inorganic overgrowth was unlikely to form at the exact same time as the re-precipitated material below, and raises the question as to whether calcite composition, potentially as a function of calcite microstructure, could be templated in overgrowth formation. The presence of magnesium in calcite is known to influence microstructure (Folk, 1974). High Mg in calcite facilitates vertical alignment of crystals, with “Mg-poisoning” (the addition of Mg2+ ions to the side of a growing crystal, causing surrounding CO sheets to scrunch together to accommodate such Mg2+ ions) inhibiting sideward growth (Folk, 1974). This is supported in our data, most especially with the strict vertical alignment of mesocrystals in our glassy G. ruber specimen (Figs. 3e, g, 5a). On the contrary, low Mg calcite enables rapid sideward growth (Folk, 1974). The preferential removal of higher Mg calcite during dissolution may therefore facilitate the production of less linear, wider and more equant crystals, as observed in our frosty M. crater specimen (Figs. 4f, h, 5d, e), with Mg poisoning no longer limiting calcite growth during re-precipitation and overgrowth formation. The difference in chemical heterogeneity preservation between G. ruber and M. crater reflects how the frosty specimens of these species have been subject to differing degrees and processes of post-depositional modification. Although the proxy is thought to be more robust to the effects of diagenesis than the δ18O proxy (Kozdon et al., 2013; Staudigel et al., 2022), our EBSD data support the idea that pervasive microstructural alteration may ultimately result in the loss of Mg banding and the alteration of original bulk values during late-stage post-depositional modification.
The processes described here ((i) dissolution, (ii) fluid-mediated replacement reactions of paired dissolution-precipitation and (iii) overgrowth) (Table 2, Fig. 5) may occur in combination, as observed in the frosty M. crater specimen. The terms “recrystallisation” and “diagenetic alteration”, frequently used in foraminiferal research, are descriptive terms that are commonly used to encompass these specific processes, which, as demonstrated, can modify test microstructure and geochemistry to differing degrees. Across just a few specimens we have demonstrated a range of effects of diagenetic alteration of foraminiferal calcite and how EBSD can be implemented as a technique to analyse such processes and effects. Owing to the experimental nature of this work exploring this novel application of EBSD, the scope of this study was limited to a small number of specimens. Accordingly, the interpretations of our data may not be fully representative of the species we selected, and some degree of caution should be applied in extrapolating these interpretations to the wider planktonic foraminiferal community. The glassy specimens chosen for this study were first identified as exceptionally well-preserved by visual inspection using light microscopy and SEM, as is typical of foraminifera preservation assessment. As such, these specimens are assumed to be good representatives of the species we studied and provide a baseline for comparisons to be made with less well-preserved specimens. Following the successful application of this technique, we hope that future work will expand on this data suite to include replicates, additional species and additional depositional settings to further understand test microstructure and preservation in planktonic foraminifera.
4.3 The importance of post-depositional history for modification of original test textures and chemistry
Glassy specimens from sites known to host well-preserved planktonic foraminifera have been targeted to minimise the potential effects of diagenetic alteration (Nicholas et al., 2006; Bown et al., 2008; Birch et al., 2013). The sites selected to provide glassy specimens were both above the lysocline (palaeowater depths < 2000 m) (GLOW Cruise Unpublished Site Survey Report; Nicholas et al., 2006) with bottom waters oversaturated with respect to pure calcite (Δ[CO]> 0 µmol kg−1, Ω> 1) (Regenberg et al., 2014), preventing severe dissolution of foraminifera tests. Additionally, these sites consist predominantly of impermeable clay-rich sediments, which rapidly encase foraminifera tests upon deposition, protecting them from future pore-water interactions. Our post-depositional model (Fig. 6) highlights these key factors contributing to excellent preservation potential, namely, waters supersaturated with respect to calcite and clay-rich sediments (Berger, 1970, 1979; Schiebel et al., 2007; Bown et al., 2008; Pearson and Burgess, 2008). Following our analyses, both glassy specimens from sites that meet these criteria do indeed show little to no evidence of diagenetic alteration, either microstructurally or geochemically. These sites offer preferential criteria for geochemical proxy generation and for studies on the original biogenic growth of foraminifera. By contrast, the sample materials that were selected for collection of our frosty specimens were deposited below the lysocline (palaeowater depths ∼ 4000 m) with corrosive bottom waters presumably undersaturated with respect to CaCO3. They were also deposited in open ocean settings, with little terrigenous clay input, and the predominant sediment encasing these tests after deposition was pelagic carbonate ooze, a relatively permeable sediment type offering little protection from corrosive pore water infiltration. Despite deposition in similar oceanographic settings, below the lysocline and within carbonate ooze, the frosty M. crater appears to have undergone more extensive post-depositional modification than the frosty G. ruber, as described above. Our frosty G. ruber specimen shows evidence of interface-coupled, fluid-mediated replacement reactions of paired dissolution and re-precipitation, whereas the frosty M. crater specimen displays evidence of dissolution, interface-coupled, fluid-mediated replacement and additional calcite overgrowth. These processes occur during interaction of the foraminifera shells with corrosive bottom waters of the seafloor and corrosive pore waters in the sediment stack. Although this interaction occurred for both frosty G. ruber and M. crater, M. crater likely experienced a greater degree of pore water interaction than G. ruber because of the longer period that the shell has been within the porous sediment stack, more than 30 million years longer than G. ruber. The longer time spent in this calcareous sediment likely contributed to the formation of the calcite overgrowth by increased exposure to mobile carbonate ions and associated chemical oversaturation owing to the high concentration of carbonate in the sediment. Although time is a contributing factor to the preservation quality of these samples, the preservation of our glassy M. crater individual, of a similar age to the frosty M. crater specimen, suggests that porewater chemistry and sediment composition must be at least, if not more, important contributing factors.
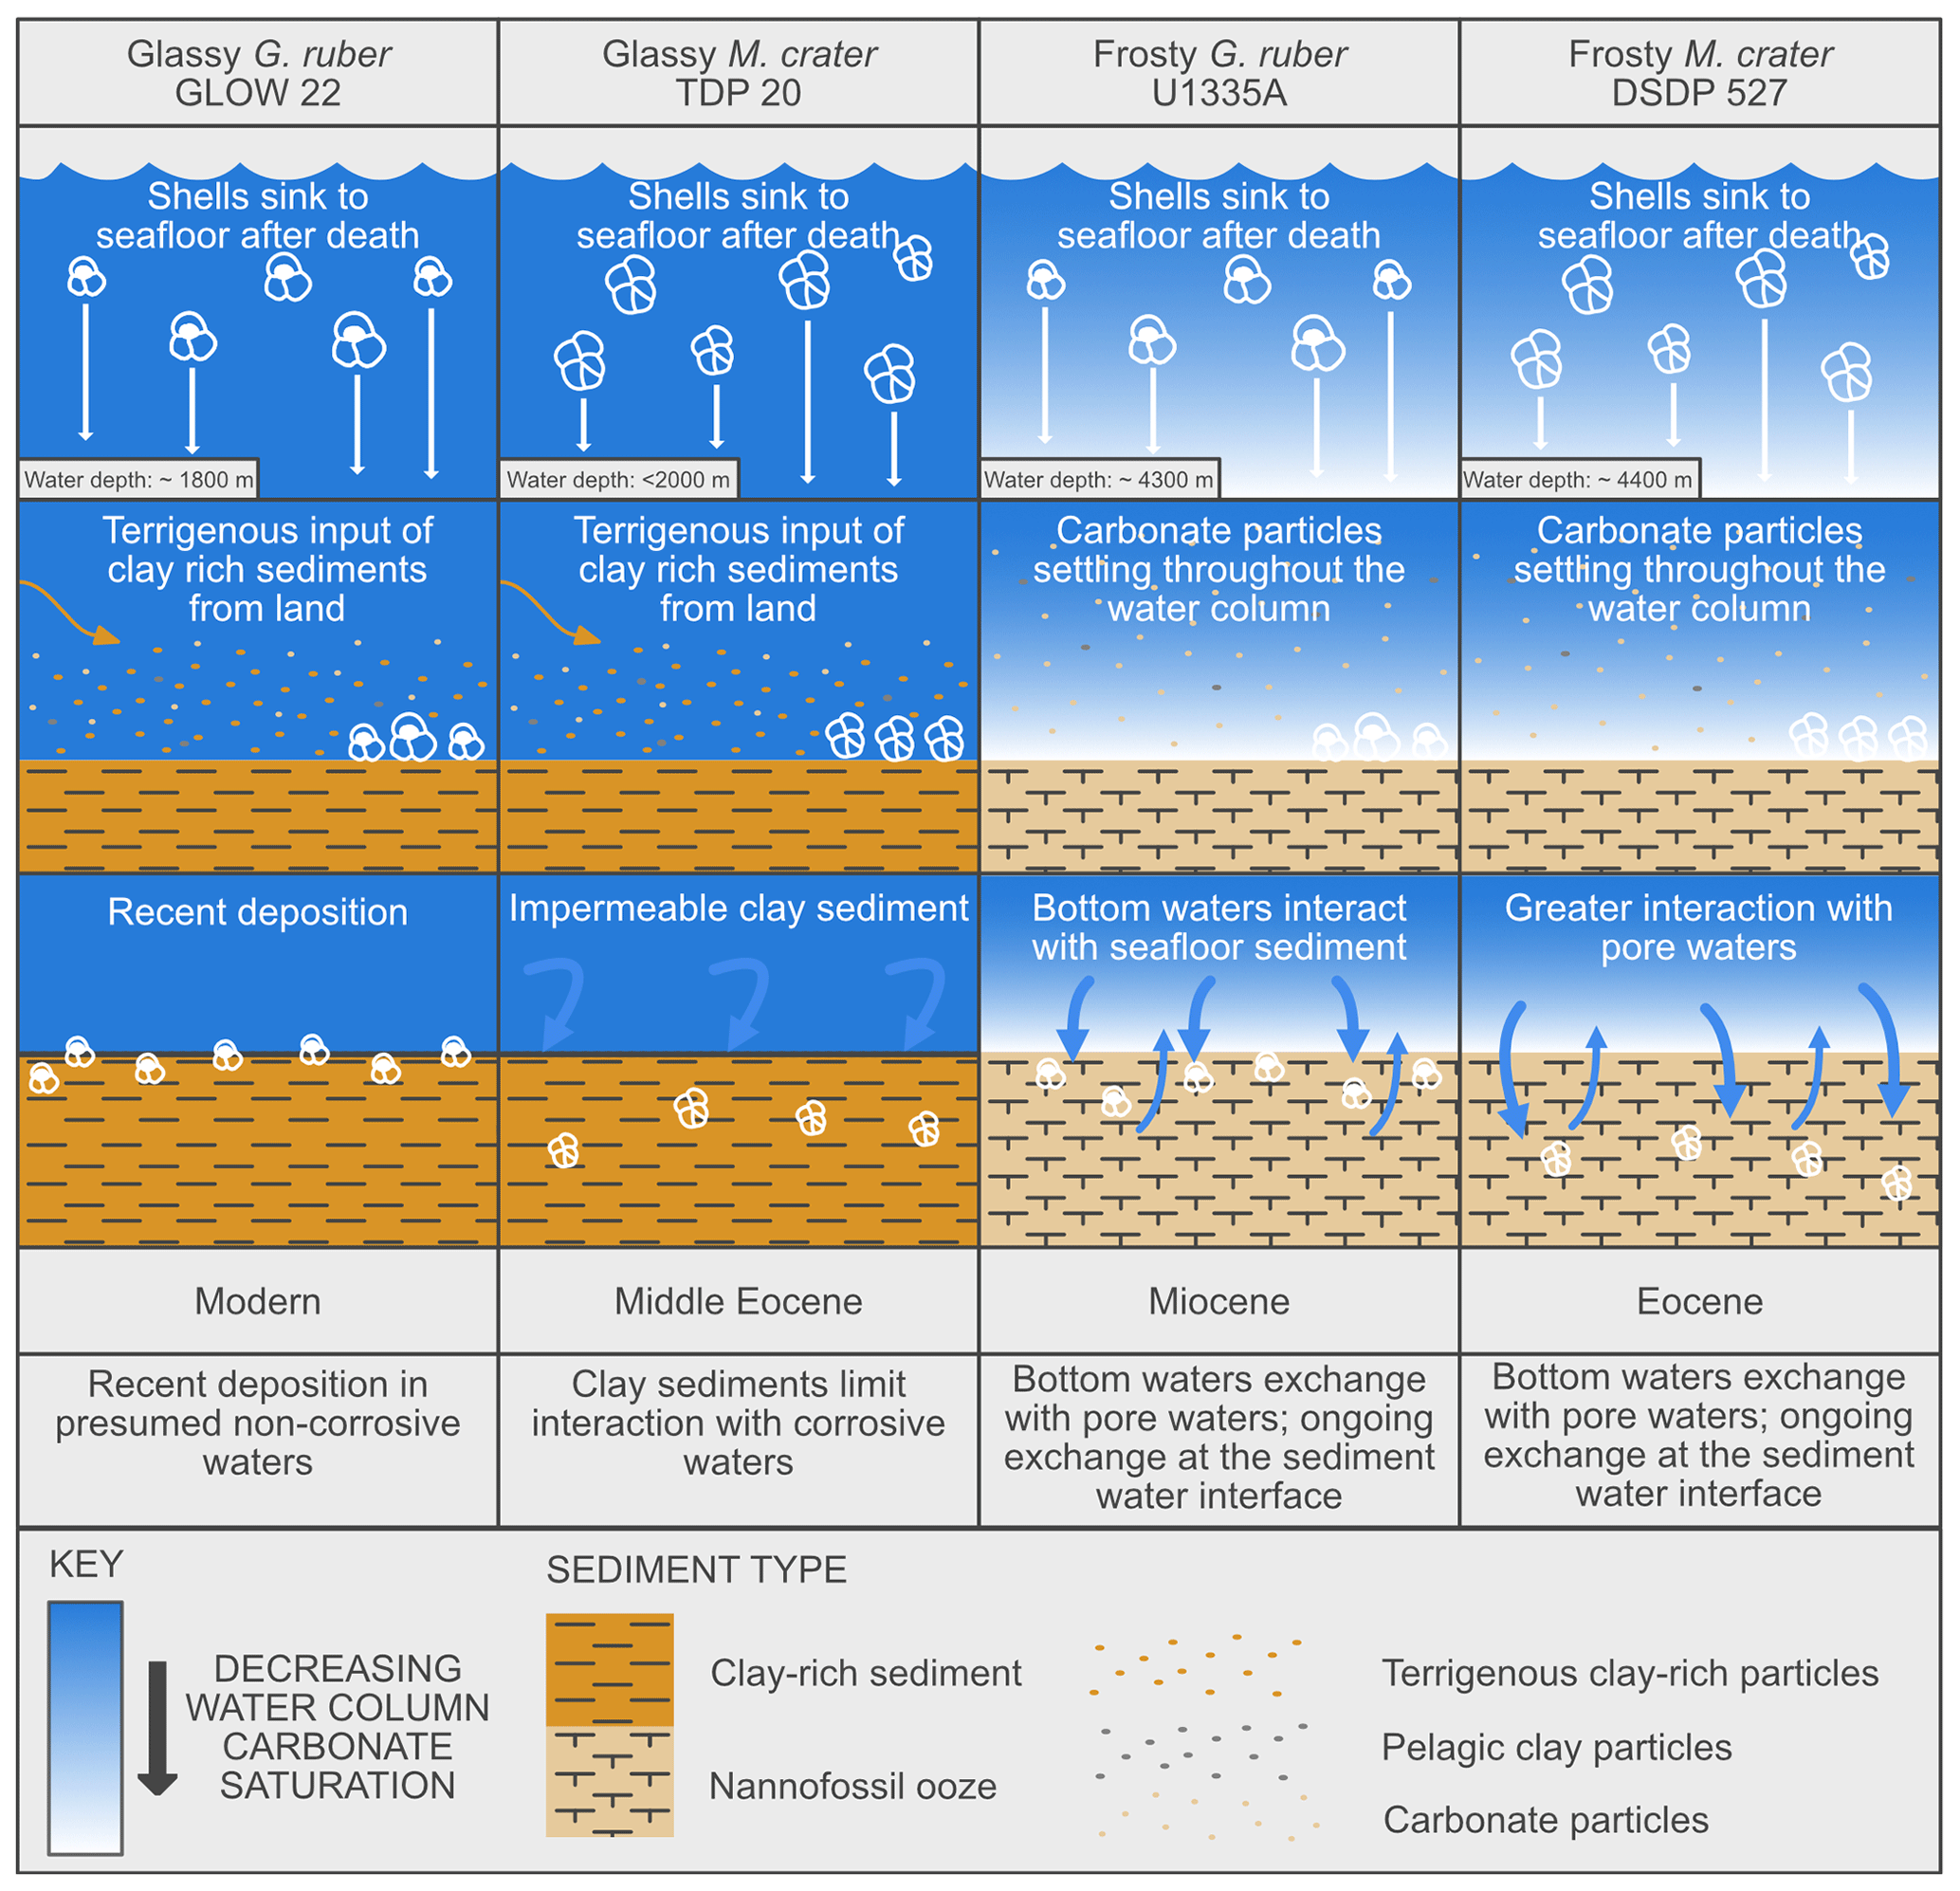
Figure 6Post-depositional model, representing the depositional environments of each of the specimens studied.
It is also possible that the muricae present on the wall surface of M. crater specimens provided structural focal points for calcite overgrowth (Sexton et al. 2006; Kozdon et al., 2011). On our EBSD maps we do not see the same overgrowth pattern in our frosty G. ruber specimen; as such our data suggest that species' wall texture may be a contributing factor as to how foraminifera are affected by different diagenetic processes. It has also been suggested previously that some portions of a test, for example, the base of muricae, that have low porosity, may be protected from major post-depositional modification and geochemical alteration (Kozdon et al., 2011), supporting this hypothesis. Additional specimens of differing wall textures should be analysed to truly test this hypothesis. Our depositional model (Fig. 6) captures the key factors contributing to degraded preservation potential, namely, waters undersaturated with respect to pure calcite and the absence of clay-rich sediments. Following our analyses, both frosty specimens from sites that were deposited in pelagic carbonate oozes below the lysocline show extensive evidence of post-depositional modification, both microstructurally and geochemically. We recommend caution, particularly when interpreting microstructural details and environmental proxy information, when working on materials from such sites.
Electron backscatter diffraction analysis (EBSD) enables the visualisation and quantification of foraminiferal test microstructure on the crystallographic scale, providing insight into biomineralisation processes as well as specific processes of post-depositional modification. Our EBSD mapping highlights how the processes of dissolution, interface-coupled, fluid-mediated replacement reactions of dissolution and re-precipitation, and inorganic overgrowth can differentially affect test microstructure. Pairing these microstructural data with EMPA maps of concentrations correlates impacts on test microstructure with changes in test geochemistry. In glassy specimens, we observe a mesocrystal structure of crystallographically aligned domains made up of smaller units of microgranular calcite, all similarly aligned, with a generally preferred orientation of mesocrystal c-axes aligned perpendicular to the test wall. Our data show when post-depositional inorganic calcite forms, either by fluid-mediated replacement reactions or by overgrowth, this orientation of original biogenic calcite is generally maintained, with c-axes aligned perpendicular to the test surface, producing a pervasive new crystalline structure, despite some change in size and shape of mesocrystals. Our frosty G. ruber specimen contains relic magnesium banding that cuts across the mosaic of granular mesocrystals, which supports the suggestion that fluid-mediated replacement reactions might be relatively “rock-buffered”, or contained, thus protecting some geochemical proxies such as palaeothermometry. However, our frosty specimens display different degrees of post-depositional modification, both microstructurally and geochemically, which underscores the importance of a detailed preservation assessment before sites are targeted for palaeoclimate reconstructions. Our frosty M. crater displays large bladed calcite overgrowths growing from the muricae. These large inorganic crystals are not seen in our frosty G. ruber specimen, implying that in addition to the depositional environment, the structure of the primary test may also influence diagenetic susceptibility. Providing novel insights into the extent of test modification, EBSD can be used to unpack post-depositional modification processes and it can inform the utility of individual microfossil samples in geochemical research.
Disorientation angle distribution charts showing the “Neighbour Pair Distribution” (plotting the misorientation data between neighbouring points on the map), alongside the “Random Pair Distribution” (plotting misorientation data between randomly chosen points in the data set) and the “Theoretical (Mackenzie-Plot)” (showing the theoretical distribution that would be expected from a random set of orientations). This shows that twin boundaries (neighbouring pairs of points with a misorientation of ∼ 60°) occur at a significantly higher frequency than would be expected by theoretical chance occurrence.
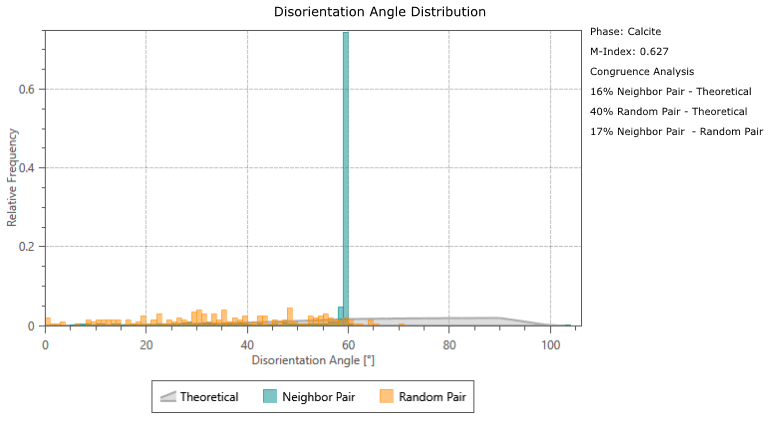
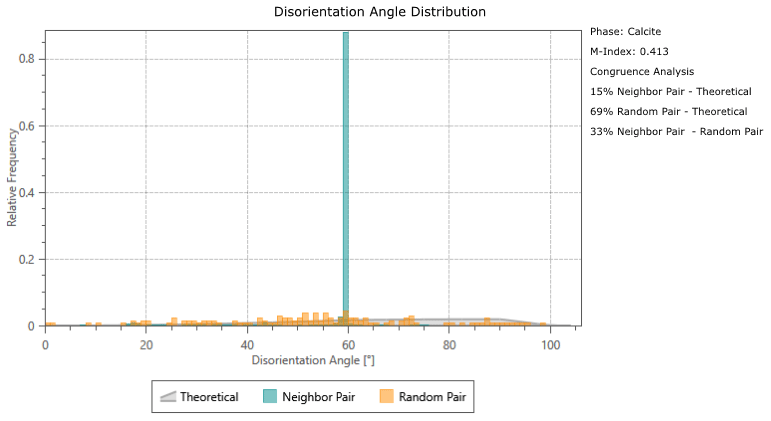
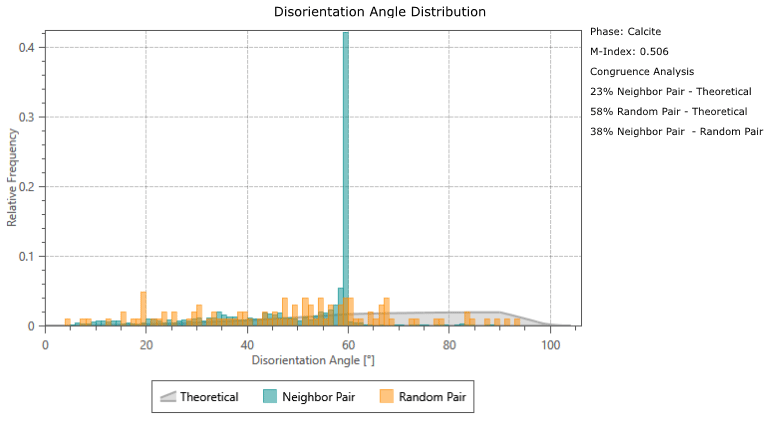
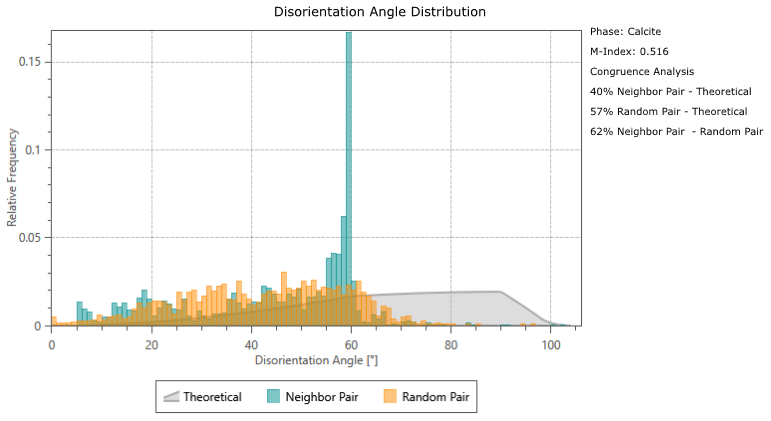
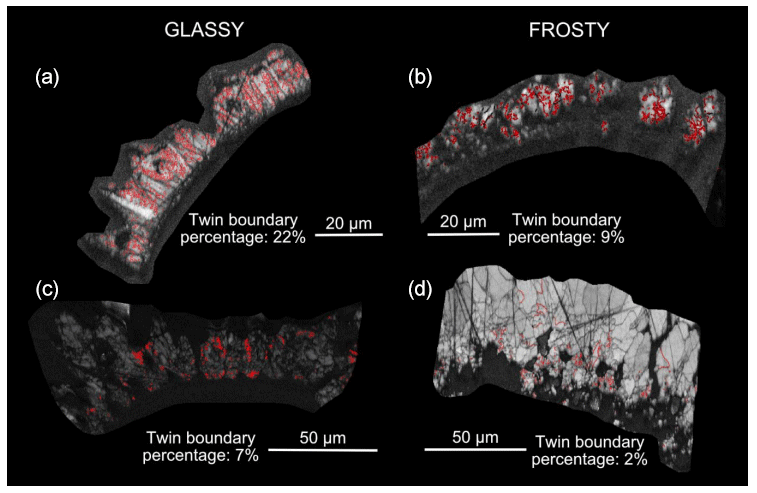
Figure B1Analysis results showing abundance of twinning in the four specimens studied; band contrast (pattern quality) maps with twin boundaries (60° rotation around c-axis) shown in red. (a) Glassy G. ruber, 22 %; (b) frosty G. ruber, 9 %; (c) glassy M. crater, 7 %; (d) frosty M. crater, 2 %. Numbers refer to the proportion of calcite grains that have twin boundaries.
Aztec Crystal files of EBSD data for all specimens, along with EMPA .tif files for G. Ruber specimens, are available at https://doi.org/10.5281/zenodo.10784878 (Procter, 2024). EMPA .tif files for M. Crater are available at https://doi.org/10.5281/zenodo.7817320 (John, 2023).
Conceptualisation: FAP, SP, TA. Methodology: FAP, SP, EHJ, RW. Investigation: FAP, SP, EHJ, RW. Visualisation: FAP, EHJ. Supervision: FAP, SP, TA. Writing – original draft: FAP. Writing – review and editing: TA, SP, EHJ, PNP, CHL, RW.
The contact author has declared that none of the authors has any competing interests.
Publisher’s note: Copernicus Publications remains neutral with regard to jurisdictional claims made in the text, published maps, institutional affiliations, or any other geographical representation in this paper. While Copernicus Publications makes every effort to include appropriate place names, the final responsibility lies with the authors.
This work was supported by the Natural Environmental Research Council (Studentship grant NE/S007458/1) and the Natural Environment Research Council grant NE/P019102/1 to Caroline H. Lear. The research uses samples supplied by the International Ocean Discovery Program. Acquisition of glassy foraminifera from the GLOW cruise was funded through NERC grant NE/F523293/1 to Paul N. Pearson and from TDP 20 through NERC grant NE/B503225/1 to Paul N. Pearson. We thank the Tanzania Commission for Science and Technology and the Tanzania Petroleum Development Corporation for their assistance in this work, John (Harri) Wyn Williams (University of Leeds, UK) and Ben Buse (University of Bristol, UK) for their invaluable technical support.
This research has been supported by the Natural Environment Research Council (grant nos. NE/S007458/1, NE/P019102/1, NE/F523293/1 and NE/B503225/1).
This paper was edited by Chiara Borrelli and reviewed by Chiara Consolaro and Adriane Lam.
Arns, A. I., Evans, D., Schiebel, R., Fink, L., Mezger, M., Alig, E., Linckens, J., Jochum, K. P., Schmidt, M. U., Jantschke, A., and Haug, G. H.: Mesocrystalline Architecture in Hyaline Foraminifer Shells Indicates a Non-Classical Crystallisation Pathway, Geochem. Geophy. Geosy., 23, e2022GC010445, https://doi.org/10.1029/2022gc010445, 2022.
Aze, T., Ezard, T. H. G., Purvis, A., Coxall, H. K., Stewart, D. R. M., Wade, B. S., and Pearson, P. N.: A phylogeny of Cenozoic macroperforate planktonic foraminifera from fossil data, Biol. Rev., 86, 900–927, https://doi.org/10.1111/j.1469-185x.2011.00178.x, 2011.
Barker, S., Greaves, M., and Elderfield, H.: A study of cleaning procedures used for foraminiferal paleothermometry, Geochem. Geophy. Geosy., 4, 8407, https://doi.org/10.1029/2003gc000559, 2003.
Berger, W.: Preservation of Foraminifera, in: Foraminiferal Ecology and Paleoecology, SEPM Society for Sedimentary Geology, https://doi.org/10.2110/scn.79.06.0105, 1979.
Berger, W. H.: Planktonic foraminifera: selective solution and the lysocline, Mar. Geol., 8, 111–138, 1970.
Birch, H., Coxall, H. K., Pearson, P. N., Kroon, D., and O'Regan, M.: Planktonic foraminifera stable isotopes and water column structure: Disentangling ecological signals, Mar. Micropaleontol., 101, 127–145, https://doi.org/10.1016/j.marmicro.2013.02.002, 2013.
Bonnin, E. A., Zhu, Z., Fehrenbacher, J. S., Russell, A. D., Hönisch, B., Spero, H. J., and Gagnon, A. C.: Submicron sodium banding in cultured planktic foraminifera shells, Geochim. Cosmochim. Ac., 253, 127–141, 2019.
Bons, P. D., Elburg, M. A., and Gomez-Rivas, E.: A review of the formation of tectonic veins and their microstructures, J. Struct. Geol., 43, 33–62, 2012.
Bown, P. R., Jones, T. D., Lees, J. A., Randell, R. D., Mizzi, J. A., Pearson, P. N., Coxall, H. K., Young, J. R., Nicholas, C. J., Karega, A., Singano, J., and Wade, B. S.: A Paleogene calcareous microfossil Konservat-Lagerstatte from the Kilwa Group of coastal Tanzania, Geol. Soc. Am. Bull., 120, 3–12, https://doi.org/10.1130/b26261.1, 2008.
Branson, O., Bonnin, E. A., Perea, D. E., Spero, H. J., Zhu, Z., Winters, M., Hönisch, B., Russell, A. D., Fehrenbacher, J. S., and Gagnon, A. C.: Nanometer-Scale Chemistry of a Calcite Biomineralization Template: Implications for Skeletal Composition and Nucleation, P. Natl. Acad. Sci. USA, 113, 12934–12939, https://doi.org/10.1073/pnas.1522864113, 2016.
Cisneros-Lazaro, D., Adams, A., Guo, J., Bernard, S., Baumgartner, L. P., Daval, D., Baronnet, A., Grauby, O., Vennemann, T., Stolarski, J., Escrig, S., and Meibom, A.: Fast and pervasive diagenetic isotope exchange in foraminifera tests is species-dependent, Nat. Commun., 13, 113, https://doi.org/10.1038/s41467-021-27782-8, 2022.
de Nooijer, L. J., Spero, H. J., Erez, J., Bijma, J., and Reichart, G. J.: Biomineralization in perforate foraminifera, Earth-Sci. Rev., 135, 48–58, https://doi.org/10.1016/j.earscirev.2014.03.013, 2014.
Edgar, K. M., Anagnostou, E., Pearson, P. N., and Foster, G. L.: Assessing the impact of diagenesis on δ11B, δ13C, δ18O, and values in fossil planktic foraminiferal calcite, Geochim. Cosmochim. Ac., 166, 189–209, https://doi.org/10.1016/j.gca.2015.06.018, 2015.
Edgar, K. M., Pälike, H., and Wilson, P. A.: Testing the impact of diagenesis on the δ18O and δ13C of benthic foraminiferal calcite from a sediment burial depth transect in the equatorial Pacific, Paleoceanography, 28, 468-480, https://doi.org/10.1002/palo.20045, 2013.
Eggins, S., Sadekov, A., and Dedeckker, P.: Modulation and daily banding of in tests by symbiont photosynthesis and respiration: a complication for seawater thermometry?, Earth Planet. Sc. Lett., 225, 411–419, https://doi.org/10.1016/j.epsl.2004.06.019, 2004.
Erez, J. and Luz, B.: Experimental paleotemperature equation for planktonic foraminifera, Geochim. Cosmochim. Ac., 47, 1025–1031, https://doi.org/10.1016/0016-7037(83)90232-6, 1983.
Fehrenbacher, J. S., Russell, A. D., Davis, C. V., Gagnon, A. C., Spero, H. J., Cliff, J. B., Zhu, Z., and Martin, P.: Link between light-triggered Mg-banding and chamber formation in the planktic foraminifera Neogloboquadrina dutertrei, Nat. Commun., 8, 15441, https://doi.org/10.1038/ncomms15441, 2017.
Folk, R. L.: The natural history of crystalline calcium carbonate; effect of magnesium content and salinity, J. Sediment. Res., 44, 40–53, https://doi.org/10.1306/74D72973-2B21-11D7-8648000102C1865D, 1974.
Ganssen, G. M., Peeters, F. J. C., Metcalfe, B., Anand, P., Jung, S. J. A., Kroon, D., and Brummer, G.-J. A.: Quantifying sea surface temperature ranges of the Arabian Sea for the past 20 000 years, Clim. Past, 7, 1337–1349, https://doi.org/10.5194/cp-7-1337-2011, 2011.
Hemleben, C., Spindler, M., and Anderson, O. R.: Modern Planktonic Foraminifera, Springer New York, NY, 363 pp., https://doi.org/10.1007/978-1-4612-3544-6, 1989.
Hines, B. R., Hollis, C. J., Atkins, C. B., Baker, J. A., Morgans, H. E., and Strong, P. C.: Reduction of oceanic temperature gradients in the early Eocene Southwest Pacific Ocean, Palaeogeogr. Palaeocl., 475, 41–54, 2017.
John, E. H.: Supplementary files for John et al. (2023), Zenodo [data set], https://doi.org/10.5281/zenodo.8228690, 2023.
John, E. H., Staudigel, P. T., Buse, B., Lear, C. H., Pearson, P. N., and Slater, S. M.: Revealing their true stripes: banding in the Paleogene planktonic foraminifera genus Morozovella and implications for paleothermometry, Paleoceanogr. Paleocl., 38, e2023PA004652, https://doi.org/10.1029/2023PA004652, 2023.
Johnstone, H. J. H., Yu, J., Elderfield, H., and Schulz, M.: Improving temperature estimates derived from of planktonic foraminifera using X-ray computed tomography–based dissolution index, XDX, Paleoceanography, 26, PA1215, https://doi.org/10.1029/2009pa001902, 2011.
Jonkers, L., Buse, B., Brummer, G.-J. A., and Hall, I. R.: Chamber formation leads to banding in the planktonic foraminifer Neogloboquadrina pachyderma, Earth Planet. Sc. Lett., 451, 177–184, https://doi.org/10.1016/j.epsl.2016.07.030, 2016.
Kozdon, R., Kelly, D. C., Kita, N. T., Fournelle, J. H., and Valley, J. W.: Planktonic foraminiferal oxygen isotope analysis by ion microprobe technique suggests warm tropical sea surface temperatures during the Early Paleogene, Paleoceanography, 26, PA3206, https://doi.org/10.1029/2010pa002056, 2011.
Kozdon, R., Kelly, D. C., Kitajima, K., Strickland, A., Fournelle, J. H., and Valley, J. W.: In situ δ18O and analyses of diagenetic and planktic foraminiferal calcite preserved in a deep-sea record of the Paleocene-Eocene thermal maximum, Paleoceanography, 28, 517–528, https://doi.org/10.1002/palo.20048, 2013.
Kunioka, D., Shirai, K., Takahata, N., Sano, Y., Toyofuku, T., and Ujiie, Y.: Microdistribution of , , and ratios inPulleniatina obliquiloculatatest by using a NanoSIMS: Implication for the vital effect mechanism, Geochem. Geophy. Geosy., 7, Q12P20, https://doi.org/10.1029/2006gc001280, 2006.
Lamyman, G. S.: Micro and macroevolution of Cenozoic planktonic foraminifera, Ph.D. thesis, University of Leeds, UK, https://etheses.whiterose.ac.uk/33775/ (last access: 17 January 2024), 2023.
Lastam, J., Griesshaber, E., Yin, X., Rupp, U., Sánchez-Almazo, I., Heß, M., Walther, P., Checa, A., and Schmahl, W.: Patterns of crystal organization and calcite twin formation in planktonic, rotaliid, foraminifera shells and spines, J. Struct. Biol., 215, 107898, https://doi.org/10.1016/j.jsb.2022.107898, 2023a.
Lastam, J., Griesshaber, E., Yin, X., Rupp, U., Sánchez-Almazo, I., Heß, M., Walther, P., Checa, A., and Schmahl, W.: The unique fibrilar to platy nano-and microstructure of twinned rotaliid foraminiferal shell calcite, Sci. Rep., 13, 2189, https://doi.org/10.1038/s41598-022-25082-9, 2023b.
Lea, D. W., Pak, D. K., and Spero, H. J.: Climate impact of late Quaternary equatorial Pacific sea surface temperature variations, Science, 289, 1719–1724, 2000.
Leng, M. J.: Isotopes in palaeoenvironmental research, Springer, Springer Dordrecht, 307 pp., https://doi.org/10.1007/1-4020-2504-1, 2006.
Lu, K.: Stabilizing nanostructures in metals using grain and twin boundary architectures, Nat. Rev. Mater., 1, 1–13, 2016.
Moore, T. C., Jr., Rabinowitz, P. D., Boersma, A., Borella, P. E., Chave, A. D., Duée, G., Fütterer, D. K., Jiang, M.-J., Kleinert, K., Lever, A., Manivit, H., O'Connell, S., Richardson, S. H., and Shackleton, N. J.: Site 527, Affiliation (analytic): Univ. R.I., Grad. Sch. Oceanogr., Vol. 74, Washington, U.S. Govt. Printing Office, https://doi.org/10.2973/dsdp.proc.74.104.1984, 1984.
Nicholas, C. J., Pearson, P. N., Bown, P. R., Jones, T. D., Huber, B. T., Karega, A., Lees, J. A., McMillan, I. K., O'Halloran, A., and Singano, J. M.: Stratigraphy and sedimentology of the Upper Cretaceous to Paleogene Kilwa Group, southern coastal Tanzania, J. Afr. Earth Sci., 45, 431–466, 2006.
Nicolas, A. and Poirier, J. P.: Crystalline plasticity and solid state flow in metamorphic rocks, Wiley, London; New York, 444 pp., 1976.
Norris, R. D. and Wilson, P. A.: Low-latitude sea-surface temperatures for the mid-Cretaceous and the evolution of planktic foraminifera, Geology, 26, 823–826, 1998.
Nürnberg, D., Bijma, J., and Hemleben, C.: Assessing the reliability of magnesium in foraminiferal calcite as a proxy for water mass temperatures, Geochim. Cosmochim. Ac., 60, 803–814, 1996.
Pabich, S., Vollmer, C., and Gussone, N.: Investigating crystal orientation patterns of foraminiferal tests by electron backscatter diffraction analysis, Eur. J. Mineral., 32, 613–622, https://doi.org/10.5194/ejm-32-613-2020, 2020.
Pälike, H. and Shipboard Scientific Party: Expedition 320/321 summary, Proceedings of the Integrated Ocean Drilling Program, https://doi.org/10.2204/iodp.proc.320321.107.2010, 2010.
Parker, F. L. and Berger, W. H.: Faunal and solution patterns of planktonic Foraminifera in surface sediments of the South Pacific, Deep-Sea Res. Ocean. Abstr., 18, 73–107, https://doi.org/10.1016/0011-7471(71)90017-9, 1971.
Pearson, P. N.: Oxygen isotopes in foraminifera: Overview and historical review, Paleontol. Soc. Papers, 18, 1–38, 2012.
Pearson, P. N. and Burgess, C. E.: Foraminifer test preservation and diagenesis: comparison of high latitude Eocene sites, Geol. Soc. Lond. Spec. Publ., 303, 59–72, 2008.
Pearson, P. N., Ditchfield, P. W., Singano, J., Harcourt-Brown, K. G., Nicholas, C. J., Olsson, R. K., Shackleton, N. J., and Hall, M. A.: Warm tropical sea surface temperatures in the Late Cretaceous and Eocene epochs, Nature, 413, 481–487, https://doi.org/10.1038/35097000, 2001.
Pearson, P. N., van Dongen, B. E., Nicholas, C. J., Pancost, R. D., Schouten, S., Singano, J. M., and Wade, B. S.: Stable warm tropical climate through the Eocene Epoch, Geology, 35, 211–214, 2007.
Pearson, P. N., John, E., Wade, B. S., D'haenens, S., and Lear, C. H.: Spine-like structures in Paleogene muricate planktonic foraminifera, J. Micropalaeontol., 41, 107–127, https://doi.org/10.5194/jm-41-107-2022, 2022.
Perdikouri, C., Piazolo, S., Kasioptas, A., Schmidt, B. C., and Putnis, A.: Hydrothermal replacement of aragonite by calcite: interplay between replacement, fracturing and growth, Eur. J. Mineral., 25, 123–136, 2013.
Prior, D. J., Trimby, P. W., Weber, U. D., and Dingley, D. J.: Orientation contrast imaging of microstructures in rocks using forescatter detectors in the scanning electron microscope, Mineral. Mag., 60, 859–869, 1996.
Prior, D. J., Boyle, A. P., Brenker, F., Cheadle, M. C., Day, A., Lopez, G., Peruzzi, L., Potts, G., Reddy, S., and Spiess, R.: The application of electron backscatter diffraction and orientation contrast imaging in the SEM to textural problems in rocks, Am. Mineral., 84, 1741–1759, 1999.
Procter, F. A.: Supplementary files for Procter et al. (2024), Zenodo [data set], https://doi.org/10.5281/zenodo.10784879, 2024.
Putnis, A.: Mineral replacement reactions, Rev. Mineral. Geochem., 70, 87–124, 2009.
Regenberg, M., Regenberg, A., Garbe-Schönberg, D., and Lea, D. W.: Global dissolution effects on planktonic foraminiferal ratios controlled by the calcite-saturation state of bottom waters, Paleoceanography, 29, 127–142, https://doi.org/10.1002/2013pa002492, 2014.
Rosenthal, Y. and Lohmann, G. P.: Accurate estimation of sea surface temperatures using dissolution-corrected calibrations for paleothermometry, Paleoceanography, 17, 16-1–16-6, https://doi.org/10.1029/2001PA000749, 2002.
Sadekov, A. Y., Eggins, S. M., and De Deckker, P.: Characterization of distributions in planktonic foraminifera species by electron microprobe mapping, Geochem. Geophy. Geosy., 6, Q12P06, https://doi.org/10.1029/2005gc000973, 2005.
Schiebel, R. and Hemleben, C.: Planktic foraminifers in the modern ocean, Springer Berlin, Heidelberg, https://doi.org/10.1007/978-3-662-50297-6, 2017.
Schiebel, R., Barker, S., Lendt, R., Thomas, H., and Bollmann, J.: Planktic foraminiferal dissolution in the twilight zone, Deep-Sea Res. Pt. II, 54, 676–686, 2007.
Sexton, P. F., Wilson, P. A., and Pearson, P. N.: Microstructural and geochemical perspectives on planktic foraminiferal preservation: “Glassy” versus “Frosty”, Geochem. Geophy. Geosy., 7, https://doi.org/10.1029/2006GC001291, 2006.
Spero, H. J., Eggins, S. M., Russell, A. D., Vetter, L., Kilburn, M. R., and Hönisch, B.: Timing and mechanism for intratest variability in a living planktic foraminifer, Earth Plane. Sc. Lett., 409, 32–42, https://doi.org/10.1016/j.epsl.2014.10.030, 2015.
Spruzeniece, L., Piazolo, S., and Maynard-Casely, H. E.: Deformation-resembling microstructure created by fluid-mediated dissolution–precipitation reactions, Nat. Commun., 8, 14032, https://doi.org/10.1038/ncomms14032, 2017.
Staudigel, P. T., John, E. H., Buse, B., Pearson, P. N., and Lear, C. H.: Apparent preservation of primary foraminiferal ratios and Mg-banding in recrystallized foraminifera, Geology, 50, 760–764, 2022.
Wendler, I.: A critical evaluation of carbon isotope stratigraphy and biostratigraphic implications for Late Cretaceous global correlation, Earth-Sci. Rev., 126, 116–146, 2013.
Westerhold, T., Marwan, N., Drury, A. J., Liebrand, D., Agnini, C., Anagnostou, E., Barnet, J. S., Bohaty, S. M., De Vleeschouwer, D., and Florindo, F.: An astronomically dated record of Earth's climate and its predictability over the last 66 million years, Science, 369, 1383–1387, 2020.
Yin, X., Griesshaber, E., Checa, A., Nindiyasari-Behal, F., Sánchez-Almazo, I., Ziegler, A., and Schmahl, W. W.: Calcite crystal orientation patterns in the bilayers of laminated shells of benthic rotaliid foraminifera, J. Struct. Biol., 213, 107707, https://doi.org/10.1016/j.jsb.2021.107707, 2021.
Zachos, J., Pagani, M., Sloan, L., Thomas, E., and Billups, K.: Trends, rhythms, and aberrations in global climate 65 Ma to present, Science, 292, 686–693, 2001.
Zachos, J. C., Dickens, G. R., and Zeebe, R. E.: An early Cenozoic perspective on greenhouse warming and carbon-cycle dynamics, Nature, 451, 279–283, 2008.