the Creative Commons Attribution 4.0 License.
the Creative Commons Attribution 4.0 License.
 | 13 Mar 2024
Unusual Hemiaulus bloom influences ocean productivity in Northeastern US Shelf waters
S. Alejandra Castillo Cieza
Rachel H. R. Stanley
Pierre Marrec
Diana N. Fontaine
E. Taylor Crockford
Dennis J. McGillicuddy Jr.
Arshia Mehta
Susanne Menden-Deuer
Emily E. Peacock
Tatiana A. Rynearson
Zoe O. Sandwith
Weifeng Zhang
Heidi M. Sosik
Because of its temperate location, high dynamic range of environmental conditions, and extensive human activity, the long-term ecological research site in the coastal Northeastern US Shelf (NES) of the northwestern Atlantic Ocean offers an ideal opportunity to understand how productivity shifts in response to changes in planktonic community composition. Ocean production and trophic transfer rates, including net community production (NCP), net primary production (NPP), gross oxygen production (GOP), and microzooplankton grazing rates, are key metrics for understanding marine ecosystem dynamics and associated impacts on biogeochemical cycles. Although small phytoplankton usually dominate phytoplankton community composition and Chl a concentration in the NES waters during the summer, in August 2019, a bloom of the large diatom genus Hemiaulus, with N2-fixing symbionts, was observed in the mid-shelf region. NCP was 2.5 to 9 times higher when Hemiaulus dominated phytoplankton carbon compared to NCP throughout the same geographic area during the summers of 2020–2022. The Hemiaulus bloom in summer 2019 also coincided with higher trophic transfer efficiency from phytoplankton to microzooplankton and higher GOP and NPP than in the summers 2020–2022. This study suggests that the dominance of an atypical phytoplankton community that alters the typical size distribution of primary producers can significantly influence productivity and trophic transfer, highlighting the dynamic nature of the coastal ocean. Notably, summer 2018 NCP levels were also high, although the size distribution of Chl a was typical and an atypical phytoplankton community was not observed. A better understanding of the dynamics of the NES in terms of biological productivity is of primary importance, especially in the context of changing environmental conditions due to climate processes.
- Article
(4968 KB) - Full-text XML
-
Supplement
(4368 KB) - BibTeX
- EndNote


Oceans regulate atmospheric carbon dioxide (CO2) concentrations and support life on Earth via several mechanisms (Friedlingstein et al., 2022). One of these mechanisms is the biological pump, which involves biological, physical, and chemical processes that aid in transporting and sequestering organic carbon from CO2 (Boyd et al., 2019). As the main primary producers in the ocean, phytoplankton play a major role in the biological pump (Field et al., 1998). Diatoms, a type of photosynthetic algae, are believed to account for nearly half of net marine primary productivity globally and are important contributors to the biological pump (Jin et al., 2006). Diatoms characteristically thrive in nutrient-rich surface layers and turbulent conditions and are thus typically found at high latitudes and in coastal upwelling regions (Armbrust, 2009). However, new technology (e.g., molecular biology and imaging) has revealed that diatoms may be more prevalent in low-nutrient, oligotrophic systems than traditionally considered (Malviya et al., 2016), likely due to unique metabolic capabilities involving nutrient acquisition strategies that enable their survival in low-nutrient regimes (Margalef, 1978).
One specific metabolic capability within diatoms is the ability to form a symbiosis with nitrogen-fixing cyanobacteria. This symbiosis, known as a diatom–diazotroph association, has been observed around the globe, mostly in oligotrophic regions (Foster and Zehr, 2019), but also in temperate continental shelf waters (Wang et al., 2021). Furthermore, some diatom–diazotroph associations have the capability to grow very quickly, forming localized blooms (Villareal et al., 2011). Diatom–diazotroph blooms, specifically involving the diatom genus Hemiaulus and the symbiont Richelia, have been found in warm, stratified waters in various regions around the globe and have been associated with high carbon export observed via a combination of modern oceanographic measurements and paleo-flux case studies. Examples include blooms in the eastern equatorial Atlantic (Foster and Zehr, 2006), tropical North Atlantic (Carpenter et al., 1999; Subramaniam et al., 2008), North Pacific Subtropical Gyre (Dore et al., 2008; Villareal et al., 2011), and South China Sea (Grosse et al., 2010). Furthermore, at the ALOHA site in the Pacific Ocean north of Hawaii, blooms of the Hemiaulus–Richelia association can last as long as 30 d and contribute significantly (20 %) to annual carbon flux in this region (Kemp and Villareal, 2018; Karl et al., 2012). Diatoms with nitrogen-fixing symbionts are thus important contributors to primary productivity and carbon export, especially at times when surface waters are depleted of dissolved inorganic nitrogen (Tang et al., 2020).
An intense bloom of Hemiaulus and its symbiont Richelia was observed in summer 2019 in temperate Northeastern US Shelf (NES) surface waters. The NES region in the northwestern Atlantic Ocean is particularly productive, favoring enhanced inorganic carbon sequestration by the biological pump, and supports an ecologically and economically important ecosystem (Townsend et al., 2006). Like other marine regions, the NES food web is fueled by phytoplankton, the main primary producers, which play a fundamental role in the ecosystem (e.g., Mouw and Yoder, 2005; O'Reilly and Zetlin, 1998; Yoder et al., 2002). Productivity is heavily influenced by abiotic factors in the NES region. For instance, strong seasonal variations in water temperature, stratification, and cross-shelf advection on the NES affect nutrient supply and lead to seasonal shifts in phytoplankton productivity and species composition (Li et al., 2015; Oliver et al., 2022; Zhang et al., 2023). Furthermore, the water temperature of the NES is rising faster than the global average (Chen et al., 2020; Karmalkar and Horton, 2021; Shearman and Lentz, 2010), leading to unknown consequences for phytoplankton community composition and productivity within this important and dynamic coastal region.
To further understand phytoplankton population dynamics and their influence on the ocean's biological pump, the NES Long-Term Ecological Research (NES-LTER, https://nes-lter.whoi.edu/, last access: 21 December 2023) project investigates primary productivity, food web structure, and ecosystem dynamics with a focus on southern New England coastal waters. As part of the NES-LTER project, phytoplankton and zooplankton community composition, phytoplankton growth rates, microzooplankton grazing rates, and productivity rates are determined on week-long research cruises which have occurred quarter-annually since 2018. To quantify productivity, several different rates are estimated from data collected on these cruises, including gross oxygen production (GOP), net primary production (NPP), net community production (NCP), and export efficiency ratios (). GOP is similar to gross primary production; it represents total photosynthesis in oxygen units and also includes photoprocesses that produce oxygen (Juranek and Quay, 2013). NPP is photosynthetic production minus autotrophic respiration and thus represents the net production activity of the phytoplankton community. NCP is the balance of photosynthesis and community respiration (autotrophic plus heterotrophic) and is equal, on long enough spatial and temporal scales, to the amount of carbon exported out of the surface of the ocean (Emerson, 2014). The ratio, analogous to the f ratio (Dugdale and Goering, 1967), is indicative of export efficiency, with a high ratio implying that the community is exporting most of the carbon (organic matter) produced and thus recycling only a little (Juranek and Quay, 2013).
The composition and size structure of the phytoplankton community in the NES-LTER study are investigated concurrently from automated imaging and size-fractionated chlorophyll a (Chl a). In winter, the NES waters tend to be nutrient-rich due to enhanced vertical mixing and input of river and estuary waters that promote high levels of surface Chl a, with a dominance of large phytoplankton cells that grow slowly (Marrec et al., 2021). Conversely, during a typical summer, nutrients become depleted in the surface mixed layer, leading to low Chl a concentrations dominated by fast-growing small phytoplankton cells (Marrec et al., 2021; O'Reilly and Zetlin, 1998).
To complement production estimates and phytoplankton community structure observations, the flow of carbon from primary producers to higher trophic levels on the NES has also been investigated. Microzooplankton, protists smaller than 200 µm, are a crucial link between primary producers and higher trophic levels because they often consume 60 %–70 % of daily primary production (Landry and Calbet, 2004; Schmoker et al., 2013). In the NES, while phytoplankton grow faster during the summer than in winter, microzooplankton grazing rates tend to stay relatively constant across seasons (Marrec et al., 2021). Thus, during winter, phytoplankton growth rates and microzooplankton grazing rates are typically well-coupled and show a close 1:1 ratio, with microzooplankton consuming most of the primary production (Marrec et al., 2021). During the summer, phytoplankton growth and microzooplankton grazing rates are typically decoupled, leading to less than 50 % of the primary production consumed by microzooplankton. The degree of coupling between microzooplankton grazing and phytoplankton growth rates is associated with phytoplankton size structure (Marrec et al., 2021) and likely species composition, and it is an important indicator of the trophic transfer efficiency from phytoplankton to microzooplankton at the base of the planktonic food web.
Here, we examined the association between productivity, phytoplankton composition, and microzooplankton grazing, key components of trophic transfer efficiency and ecosystem function. During a NES-LTER cruise in summer 2019, we observed an anomalous relationship between growth and grazing rates, as well as dramatically different productivity rates and community composition compared to other summer cruises in the NES region. We thus investigated how a diatom bloom of Hemiaulus, with diazotrophic symbionts, affected metrics of productivity and grazing on the NES during the summer of 2019. Our results provide insights into the effects of community composition on productivity rates.
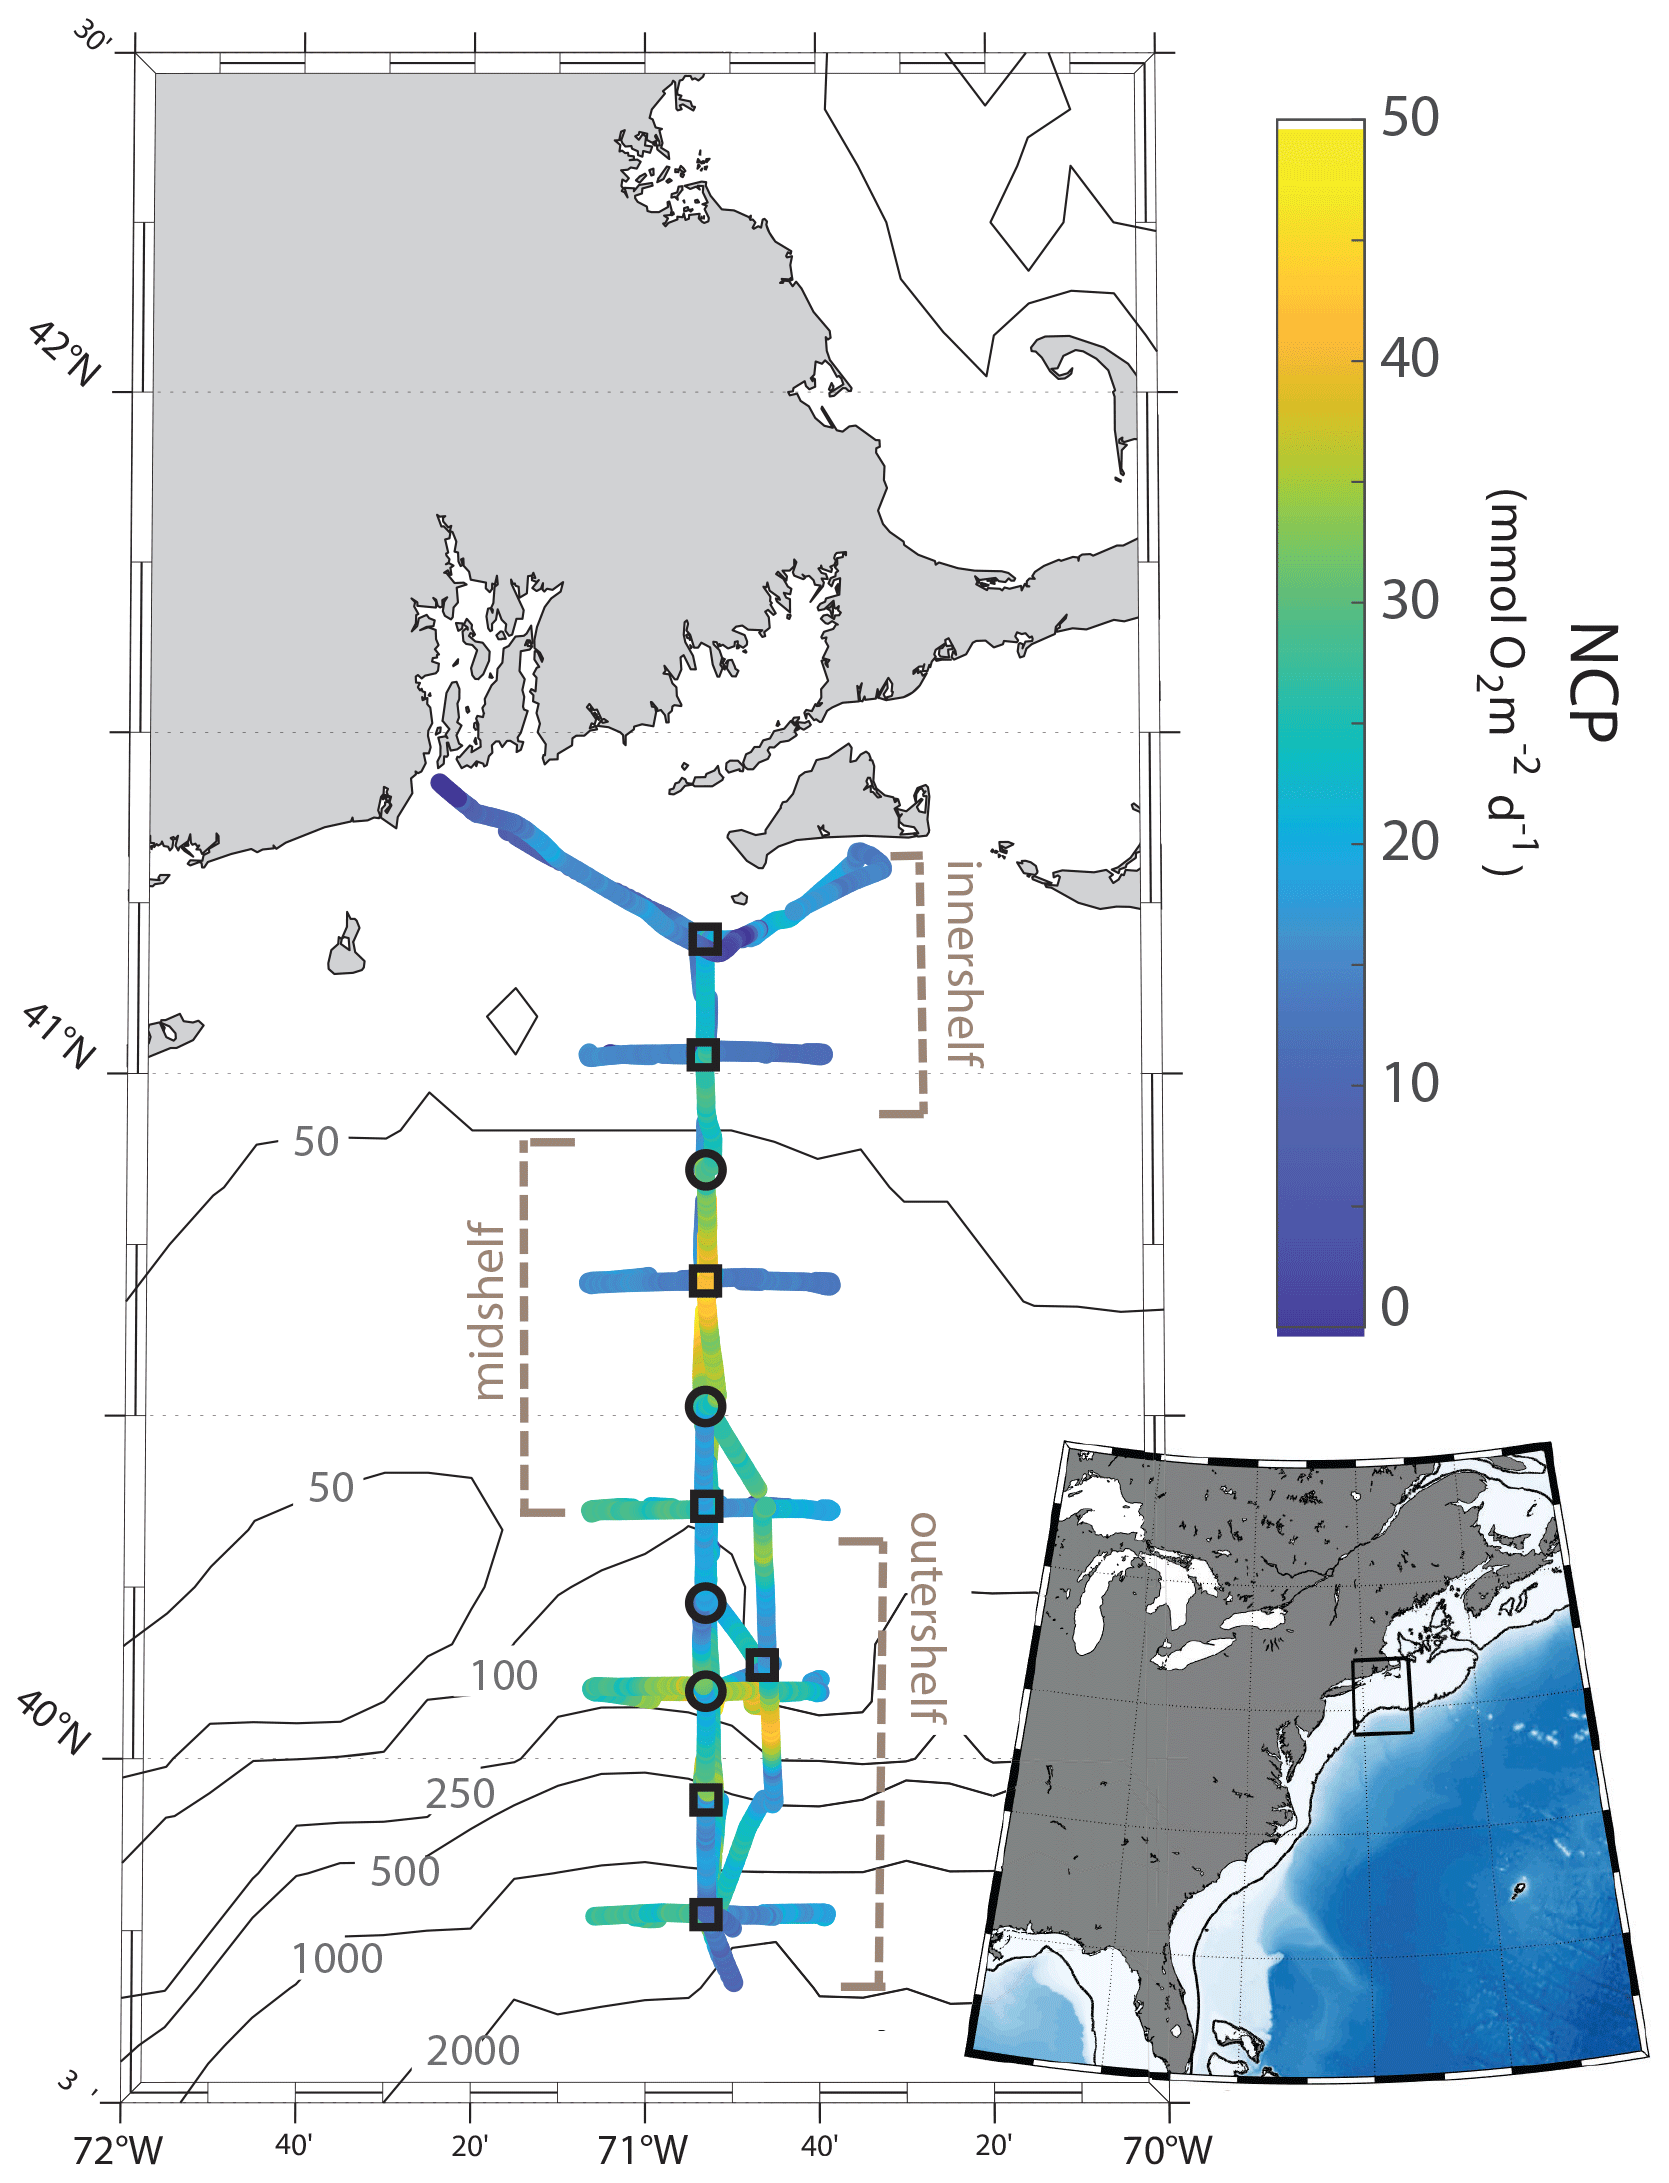
Figure 1Maps of the NES-LTER August 2019 cruise track, colored according to rates of NCP for the second half of the cruise, as measured continuously by an at-sea mass spectrometer. Station locations are marked with circles or squares and are ∼ 19 km apart. Rates of NCP, GOP, and phytoplankton community composition were quantified at all stations. Grazing rates and NPP in 2019 to 2022 were calculated only at stations marked by squares. Other NES-LTER cruises have a similar track, although issues such as weather sometimes change the track slightly and in 2018. The inset shows the location of the cruise (rectangular box) in the context of the east coast of the United States.
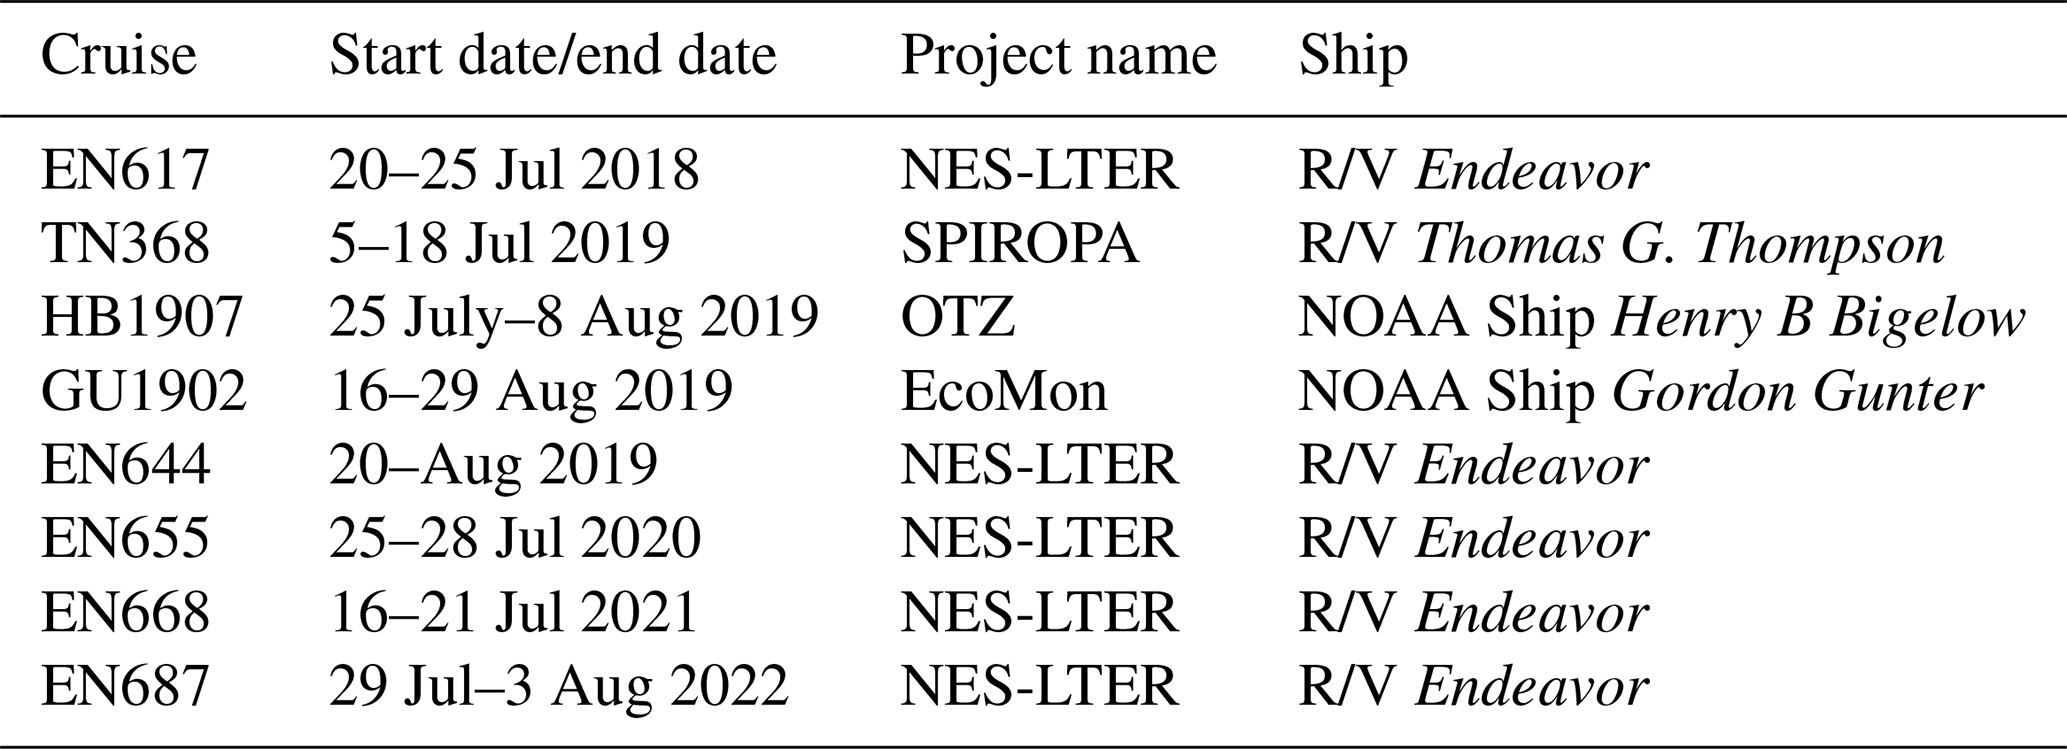
Measurements of environmental conditions, chemical and biological stocks, and productivity and grazing rates were conducted on multiple cruises within the framework of the NES-LTER program (Table 1). Measurements from three other cruises from different projects on the NES were also included in this analysis for comparison (project names in Table 1) and Hemiaulus abundances were further compared to an additional 26 cruises in the NES (Table S1). From the time series, we were able to better understand an event that was observed on the 2019 NES-LTER summer cruise (EN644) which occurred from 20 to 25 August (Table 1). Some data during that event, such as surface seawater temperature (SST), salinity (SSS), NCP rates, and phytoplankton composition, were collected continuously from the underway system (every 0.1 to 6 km depending on the measurement type and ship speed), while other parameters (e.g., NPP, grazing rates, Chl a, nutrients) were measured discretely at the NES-LTER stations (Fig. 1, Table S2). Main stations were located with ∼ 19 km spacing on a north-to-south transect primarily along 70.883° W. Figure 1 shows the cruise track for the August 2019 NES-LTER cruise, but all the other NES-LTER cruises had a nearly identical cruise track. In particular, the mid-shelf region, which is where the Hemiaulus bloom primarily occurred, corresponds to 50–100 m water depth and was bounded by latitudes 40.980 to 40.327° N. The mid-shelf region contains four stations. Exact locations and dates of when the mid-shelf stations were occupied is provided in Table S2.
Table 1Dates of the summer cruises, as well as project and ship names along with cruise numbers, that are presented in this paper. Project name abbreviations are as follows: OTZ – ocean twilight zone, SPIROPA – Shelf-break Productivity Interdisciplinary Research Operation at the Pioneer Array (Oliver et al., 2021), and EcoMon – Ecosystem Monitoring program run by the National Oceanic and Atmospheric Administration. Cruise tracks for the NES-LTER transects are shown in Fig. 1. The SPIROPA and OTZ cruises followed the same longitude of 70.883° W when in the mid-shelf region and thus data used from those cruises are collocated with the NES-LTER data.
At each station, water was collected via Niskin bottles mounted on a CTD rosette (conductivity–temperature–depth, Sea-Bird SBE32 Carousel Water Sampler). The CTD–rosette system consisted of a 24-bottle rosette frame with 10 L Niskin bottles. Depth, temperature, and salinity were collected with an SBE911 CTD (Sea-Bird Electronics) equipped with additional sensors for chlorophyll fluorescence (WET Labs ECO-AFL/FL), photosynthetically active radiation (PAR, Biospherical Instruments® QSP2000), and beam attenuation (WET Labs C-Star 25 cm transmissometer). The Niskin bottles were closed at various depths ranging from the surface to near bottom based on the depths of the mixed layer, euphotic zone, and Chl a maximum. Mixed layer depths were calculated from the temperature and salinity data from the CTD with the threshold method where the mixed layer was taken to be the depth where the density difference between the surface and bottom of the mixed layer was greater than Δσθ=0.125 kg m−3 (de Boyer Montegut et al., 2004). Mixed layer depths were confirmed to be similar when a gradient criterion with a difference of 0.0125 kg m−3 was used instead (Kara et al., 2000). The euphotic zone was taken to be the depth at which light was 1 % of the surface value. Chl a max was chosen based on the depth with maximum fluorescence observed in the CTD cast. Water from the Niskins was used to quantify a number of parameters as described in Sect. 2.2 through 2.5.
The underway system consisted of continuous surface seawater pumped throughout the ship by an impeller pump and a diaphragm pump located near the ship's bow. Using water from the impeller pump, continuous measurements of surface temperature and salinity were obtained from a Sea-Bird SBE38 (temperature) sensor installed at the water intake and by a Sea-Bird SBE45 sensor (temperature and salinity) located further away in the underway system. Because the diaphragm pump is less likely to damage plankton (Cetinic et al., 2016), its underway flow was used for measurements to quantify NCP (Sect. 2.1), GOP (Sect. 2.2), and phytoplankton community composition (Sect. 2.8). The ship steamed both south and north along the longitude 70.883° W, and thus over the 6 d cruise, the underway data sampled the same locations at multiple points in time. Stations were only occupied at one time per cruise.
2.1 Net community production
Net community production rates were calculated from ratios measured by an at-sea equilibrator inlet mass spectrometer (EIMS) (Cassar et al., 2009) analyzing water from the ship's underway system and from discrete samples collected from both CTD Niskin bottles and from the underway system. The EIMS was used to collect continuous data on ratios via the diaphragm pump of the underway system that, on the R/V Endeavor, pumped seawater from a depth of 5 m. The underway system seawater flowed through a debubbler into a bucket at a constant rate that allowed for continuous overflow for consistent head pressure. Water was then pumped from the bucket at ∼ 1.1 L min−1 by a gear pump through two filters: a bag with a 25 µm pore size and a two-layered sock with a 5 µm inner and 100 µm outer pore size. The gear pump then pushed the water through an equilibrator membrane contactor cartridge (Liqui-Cel Extra-Flow 2.5×8 model G540). The equilibrated headspace gas from the cartridge was then dried by flowing through the desiccants Nafion and Drierite and then passed via a fused silica capillary into a Hiden residual gas analyzer (RGA) (HAL 7) quadrupole mass spectrometer. Details of the equilibration method can be found in Manning et al. (2016) but in this instance were modified to not use SAES getters as they would have removed the O2. The EIMS was operated throughout the whole cruise (starting 1 h after the ship left port and ending a few hours before return to port). To calibrate the mass spectrometer, the capillary was switched to an air inlet for 20 min approximately every 6 h as the ratio of in air is stable and well-known. Additionally, bottle samples were collected from the underway system at least once per day and were subsequently measured on an isotope ratio mass spectrometer at Woods Hole Oceanographic Institution (see Sect. 2.2). These bottle samples were used to provide additional calibration as necessary – such additional corrections changed the ratios by at most 0.67 %.
The ratios were then used to calculate NCP (Hendricks et al., 2004; Juranek and Quay, 2005; Stanley et al., 2010). With data from the EIMS and the bottle samples, the biological oxygen saturation Δ() was calculated via the equation below:
where ()smpl represents the ratio of O2 to Ar ion currents detected by the EIMS after being calibrated with bottle data, and ()eq represents the ratio of equilibrium concentrations of the gases determined from the gases' solubility (Garcia and Gordon, 1992; Hamme and Emerson, 2004) at the seawater temperature and salinity.
The NCP integrated over the mixed layer, in units of millimoles of O2 m−2 d−1, is calculated as
where [O2]eq represents the equilibrium concentration of O2 at the relevant temperature and salinity (mmol kg−1), k is the weighted gas transfer velocity (m d−1), and ρ is the density of seawater (kg m−3) (Millero and Poisson, 1981). The weighted gas transfer velocity is a time-weighted average from over the past 30 d calculated as described in Reuer et al. (2007), with the gas exchange parameterization of Stanley et al. (2009) and wind speeds from NCEP Reanalysis (Kalnay et al., 1996; Kistler et al., 2001). Many physical considerations altering O2 saturations, such as changes in temperature and bubble injection, do not need to be considered due to the inclusion of Ar, which has similar solubility and diffusivity as O2; however, a few assumptions were made for these calculations. Firstly, this equation assumes steady state within the mixed layer, i.e., no change in in the ocean with time. While was likely changing in actuality, assuming steady state simply means that the rates calculated reflect an exponentially weighted average of NCP over the past few residence times of oxygen (residence time equals a few days in these conditions) (Teeter et al., 2018). Thus, the assumption of steady state does not majorly impact our conclusions. We were not able to calculate the time rate of change term in (Manning et al., 2017b) because the cruise was not Lagrangian, and even though the ship returned to the same geographic location, the water at that location changed due to ocean currents. To check the assumption that there is negligible respiration within the ship's lines (Juranek et al., 2010), bottle samples were collected in duplicate from Niskins at the same time as samples were collected from the underway system several times during every cruise; gas concentrations in the bottle samples from the underway and Niskin were identical within measurement errors, confirming that there was no detectable respiration in the ship's line.
2.2 Gross oxygen production
Discrete samples of triple oxygen isotopes (TOIs) were collected from the surface Niskin bottles on the CTD–rosette system at all stations as well as from the underway system between stations. Samples from the CTD–rosette system were also collected from bottles fired at ∼ 5 m below the mixed layer and often one greater depth to provide information for assessing whether vertical corrections to ratios were significant. Samples were collected in custom-made ∼ 500 mL sample bottles which were pre-poisoned with 100 µL of saturated mercuric chloride solution and filled with around 300 mL of seawater from the underway system or from the Niskin at each station (Stanley et al., 2015). Samples were brought to Woods Hole Oceanographic Institution where they were analyzed for TOI with a custom-made processing line and a Thermo Fisher MAT 253 isotope ratio mass spectrometer as detailed in Stanley et al. (2015). The same samples were also analyzed for , which yielded rates of NCP from discrete data as well as an independent method for calibrating the EIMS (see above). Corrections for the effect of argon on the triple oxygen isotope ratio and the effect of varying sizes of the sample vs. reference standard were made for every sample. Reproducibility from duplicate samples collected on these cruises ranged from 4 to 8 per meg for 17Δ, 0.008 to 0.03 ‰ for δ17O, and 0.008 to 0.05 ‰ for δ18O depending on the cruise.
From these samples, GOP is calculated in units of millimoles of O2 m−2 d−1 following Prokopenko et al. (2011) according to
where k again represents the time-weighted gas transfer velocity (m d−1), Oeq represents the equilibrium concentration of oxygen, λ represents the respiration slope factor of 0.5179, represents the ratio of isotopes (*) dissolved in the sample, represents the ratio of isotopes (*) dissolved in seawater equilibrated with the atmosphere, and stands for the ratio of isotopes (*) in oxygen that was produced via photosynthesis. The photosynthetic end member used was the average of the phytoplankton value determined by Barkan and Luz (2011); Vienna Standard Mean Ocean Water (VSMOW) was used for the isotopic composition of oxygen in H2O. The actual isotopic composition of H2O was measured in a subset of samples to see if corrections needed to be made (Manning et al., 2017a). It was found to be very similar to VSMOW, leading to an error of less than 10 % in GOP due to isotopic water variations.
Confirmation that the water from the underway system was representative of the oceanic TOI signature of dissolved oxygen was obtained by comparing samples collected from the underway system to those collected concurrently from the surface Niskin bottle. All cruises, other than 2019, showed that there was statistically no difference in TOI between water from the underway system and the CTD and thus that the water from the underway system was representative of the mixed layer at that location and time. During the summer of 2019, the water from the underway system had TOI values 4.1 per meg lower than that from the CTD – this is within measurement errors but since it might have led to systematic biases, we corrected for this offset before calculating GOP from the data. The GOP rates, along with the NCP rates, represent productivity integrated throughout the mixed layer.
2.3 Net primary productivity
Water samples for NPP were collected at four to seven stations (cruise-dependent) from three to four depths (station-dependent) from the Niskins on the CTD–rosette system during the summers of 2019–2022. During collection, water was pre-filtered through 200 µm mesh (to remove mesozooplankton) into acid-washed 2 L polycarbonate bottles. Water collection and associated incubation occurred in triplicate for surface samples at each station. Bottles were spiked with a solution of 99 % NaH13CO3 (Cambridge Isotope Lab, Tewksbury, MA) for a final 10 % enrichment of the dissolved inorganic carbon (DIC) pool and placed in various mesh bags to simulate in situ light levels. Bottles were incubated for 24 h in clear deck-board incubators with flow-through seawater, and Onset HOBO data loggers monitored tank water temperature. At each station, the natural 13C in the water was determined from an un-spiked sample and dark carbon assimilation was determined from a spiked dark bottle sample. Dark carbon assimilation was negligible (< 1 %) so no correction for dark carbon assimilation was applied to this dataset.
The corresponding light levels at collection depths were determined using either PAR or beam attenuation from the CTD cast for each station. When PAR data were not available (e.g., nighttime casts), a relationship was established (Eq. 4) with previous daytime cast information between beam attenuation (c, measured by transmissometer, m−1) and the light extinction coefficient (Kd, m−1) for each cruise. During nighttime casts, Kd was estimated from the average c in the upper 10 m during the cast with the slope (m) and intercept (b) from the daytime plot according to Eq. (4).
The appropriate shading in incubations (% PAR) for each depth of sample collection (z) was estimated as
At the end of each incubation, bottles were filtered under low vacuum (5–10 in. Hg) over pre-combusted Whatman GF/F filters (450 °C; 6 h). Filters were stored at −20 °C until further analysis onshore. NPP rates were quantified by measuring the incorporation of isotopically heavy carbon into phytoplankton biomass. Prior to measuring 13C in the samples, filters were acid-fumigated with concentrated HCl in a desiccator overnight to remove inorganic carbon. They were dried in an oven at 60 °C for 24 h, individually wrapped in tin capsules, and analyzed on a Carlo Erba NC2500 elemental analyzer interfaced with a Thermo Delta V+ isotope ratio mass spectrometer. The δ13C values were reported relative to the international standard Vienna PeeDee Belemnite (Coplen, 1995) and converted to atom percent values.
NPP rates were calculated from atom percent values with the equation from Hama et al. (1983):
where NPP is the net primary production rate (µg L−1 d−1), POC is the particulate organic carbon, (µg L−1), t is the incubation time (h), ais is the atom % of 13C in the incubated sample, ans is the atom % of 13C in the natural sample (un-spiked sample described above), and aic mis the atom % of 13C in the total DIC pool. POC measurements were blank-corrected with the mean value of triplicate combusted filter blanks. The DIC concentration was determined from salinity (S) according to the following equation from Parsons et al. (1984).
NPP rates were integrated to the depth of the mixed layer (Table S3) to align with NCP and GOP integrated rate calculations. In summer, NPP rates below 16 m (deepest mixed layer depth) were not used in this study.
No discrete measurements of net primary productivity (NPP) were conducted during the summer of 2018. However, we were able to estimate 2018 NPP rates as follows: for each summer, we computed phytoplankton biomass production (PP, mg C m−3 d−1) based on surface discrete Chl a concentration as well as growth and grazing rates, following the methodology outlined by Landry et al. (2003). Chl a concentrations were transformed into biomass using a constant C : Chl a ratio of 50. In the summers from 2019 to 2022, where discrete NPP data were available, we averaged surface PP and surface NPP by region (inner shelf, mid-shelf, and outer shelf) and conducted a linear regression between these average PP and NPP rates (p<0.05; R2=0.68; n=15). The linear regression coefficient obtained from this correlation was used to convert PP derived from growth and grazing rates in the summer of 2018 into NPP (mg C m−3 d−1). Subsequently, we integrated NPP over the mixed layer to obtain integrated NPP (mg C m−2 d−1) at each station where surface growth and grazing rates were available. While the C : Chl ratios in coastal systems exhibit high seasonal variability (Jakobsen and Markager, 2016), we used a constant C : Chl ratio when converting Chl a into phytoplankton biomass. Since our comparison of derived PP was limited to the summer season, it is reasonable to assume that C : Chl ratios remained within a similar range. Additionally, the same C : Chl ratio was used when deriving the linear relationship and when applying it, and thus the estimated NPP rates are insensitive to the choice of C : Chl ratio. It is important to note that C : Chl ratios were not utilized in the calculation of NPP rates for any other year.
2.4 Autotrophic and heterotrophic respiration
Assuming a photosynthetic quotient (O:C ratio) of 1.4, respiration rates were calculated from the productivity values (GOP, NPP, and NCP) and following the relationships below:
where RA is autotrophic respiration and RH is heterotrophic respiration.
2.5 Growth rates and grazing rates
Rates of phytoplankton growth and protistan grazing were quantified with a two-point modification of the dilution method (Landry et al., 2008; Chen, 2015; Morison et al., 2020) following methods in Marrec et al. (2021). Briefly, surface samples were collected at four to seven stations throughout the cruise. For each sample, whole seawater (WSW) from the Niskin bottles was transferred into a 10 L polycarbonate carboy through a 200 µm mesh filter to remove mesozooplankton predators. Diluent was prepared by gravity filtration through a 0.2 µm membrane filter capsule (PALL®) from the Niskin to the carboys and mixed with WSW to obtain a 20 % WSW dilution. A total of six bottles per experiment were prepared: two bottles with nutrient-amended 20 % WSW, two bottles with nutrient-amended WSW, and two bottles with unamended WSW to assess nutrient limitation. Incubations took place for 24 h in a clear, 1 m3 deck-board incubator. Paired bottles were placed into mesh bags that simulated the effective light availability in the surface mixed layer, which corresponded to 65 % of sea surface irradiance. Phytoplankton growth and grazing mortality rates were then estimated from changes in Chl a over the 24 h incubation. For dilution experiments, Chl a concentrations were obtained from triplicate 150 mL subsamples filtered on GF/F filters, after a 12 h dark extraction period at room temperature in 95 % ethanol, and measured on a calibrated Turner 10 AU fluorometer. The full extraction method is detailed in Marrec et al. (2021).
2.6 Discrete chlorophyll a sample collection and processing
Samples for Chl a analysis were collected into brown amber bottles from Niskins on the CTD–rosette system. A known sample volume (250–500 mL) was filtered at low pressure (5–10 in. Hg) through either a GF/F filter or a 20 µm polycarbonate Sterlitech filter. Filters were transferred to either tissue capsules (GF/F) or cryogenic vials (20 µm) and then flash-frozen in liquid nitrogen until extraction. Later, filters were extracted in 5 mL of 90 % acetone for 24 h in a dark refrigerator; then tubes were vortexed and centrifuged (only GF/F filters), and the solution was measured on a calibrated Turner Designs Handheld Aquaflor fluorometer, acidified with two drops of 10 % hydrochloric acid, and measured again. Chl a concentrations for different size fractions were calculated by difference. Note that in this study we consider large phytoplankton to be > 20 µm.
2.7 Satellite and radar data
To look at variability in SST and surface Chl a, a proxy for phytoplankton biomass, throughout the summers over multiple years on a wider spatial and temporal scale than the at-sea chlorophyll data permitted, SST and surface Chl a concentrations from remote sensing sources were retrieved and analyzed. In particular, both snapshots and monthly averages of MODIS (Moderate Resolution Imaging Spectroradiometer) SST and chlorophyll data with a horizontal resolution of 1 km were used to examine the spatial coverage of the Hemiaulus bloom in summer 2019 (when it dominated phytoplankton biomass) and compare the surface temperature and chlorophyll in the NES region in the summers of 2018–2022.
To examine possible origins of the bloom water, backward particle trajectory simulations were carried out with the OceanParcels Python package https://oceanparcels.org/index.html, last access: 14 December 2022 (Lange and Van Sebille, 2017). High-frequency (HF) radar-measured sea surface velocity data in the NES region in July–August 2019 with 6 km spatial resolution and hourly temporal resolution were used as the background flow. Particles were released at mid-shelf sites along the NES-LTER transect on 21 August 2019 and advected backward for 30 d until 22 July 2019.
2.8 Imaging FlowCytobot
Composition of the phytoplankton community was assessed with Imaging FlowCytobots (IFCB; McLane Research Laboratories, Inc.). IFCB uses a combination of video and flow cytometry technology to capture images of plankton and other particles in the size range ∼ 5–150 µm (Olson and Sosik, 2007). During the cruises reported here, IFCB instruments were configured to record images of particles with laser-based chlorophyll fluorescence or light-scattering signals above trigger thresholds and samples were pre-screened with 150 µm Nitex. IFCB instruments were operated two ways. First, on all cruises, an IFCB was configured to sample 5 mL automatically from the ship's underway system every 25 min. Second, at stations occupied on the NES-LTER and SPIROPA cruises, IFCB instruments were used to analyze depth profiles from discrete samples collected with Niskin bottles. Typically, three 5 mL subsamples were measured for each depth. The fraction of each 5 mL sample imaged by IFCB decreases with increasing trigger rate but is recorded precisely during sample acquisition, enabling calculation of concentrations. IFCB image data were automatically analyzed following approaches developed for the IFCB time series at the Martha's Vineyard Coastal Observatory (MVCO) (Brownlee et al., 2016). In particular, cell biovolume was estimated from IFCB images (Moberg and Sosik, 2012) and converted to cell carbon following the relationships described by Menden-Deuer and Lessard (2000). IFCB images were classified with a convolutional neural network (CNN) (Catlett et al., 2023) trained to separate 155 categories of plankton and other particles observed at MVCO and across the NES region. We used the Inception v3 (Szegedy et al., 2016) CNN architecture as implemented in PyTorch, pre-trained with ImageNet (Russakovsky et al., 2015), and fine-tuned with an NES IFCB training set (97 026 images, 155 classes, 80–20 split for training and validation). In addition, an independent test set of manually annotated images in 51 IFCB samples from EcoMon cruises was used to evaluate Hemiaulus quantification as a function of classifier score threshold. From this independent analysis, classifier predictions with scores above 0.9 performed very well for Hemiaulus (class-specific F1 score 0.936; CNN count vs. manual count: r2=0.999, slope 0.915; intercept 0.005).
2.9 Nutrients
Dissolved inorganic nutrient concentrations (ammonium, phosphate, silicate, and nitrate + nitrite) were obtained from CTD bottle samples with duplicates. Seawater was passed through an EMD Millipore sterile Sterivex 0.22 µm filter with filtrate collected into acid-washed 20 mL scintillation vials (after triplicate rinses), which were then stored at −20 °C until analysis. Samples were processed at Woods Hole Oceanographic Institution's Nutrient Analytical Facility with a four-channel segmented-flow SEAL AA3 HR autoanalyzer. Detection levels are as follows: 0.01 µmol L−1 for silicate, 0.03 µmol L−1 for phosphate, 0.04 µmol L−1 for nitrate + nitrite, and 0.03 µmol L−1 for ammonium.
3.1 Hemiaulus distribution and chlorophyll
During the NES-LTER summer 2019 cruise, through automated image classification and analysis and through visual microscopic confirmation, a bloom of the diatom genus Hemiaulus was observed in the surface waters of the mid-shelf region (Fig. 2a). These images also showed N2-fixing symbionts, namely Richelia, inside or next to the Hemiaulus cells (Fig. 2b). Additionally, Hemiaulus carbon was highest in the mid-shelf waters between latitudes of 40.1 and 41.1° N, a span of 111 km (Fig. 3a), with concentrations ranging from 6.8 to 68.3 µg L−1. This bloom was only observed in the surface waters of the mid-shelf region, as can be seen by discrete IFCB measurements from Niskin samples (Fig. 3b). Hemiaulus carbon concentrations observed in other years on NES-LTER transect cruises never reached values above 0.30 µg L−1, so approximately 2 orders of magnitude smaller than was observed on the 2019 cruise. Furthermore, IFCB-based observations made on a broader scale from the Mid-Atlantic Bight to the Gulf of Maine in the period from 2013 to 2023 show that only in August 2019 is Hemiaulus present in large quantities (Fig. S1), confirming the extraordinary nature of the 2019 bloom.
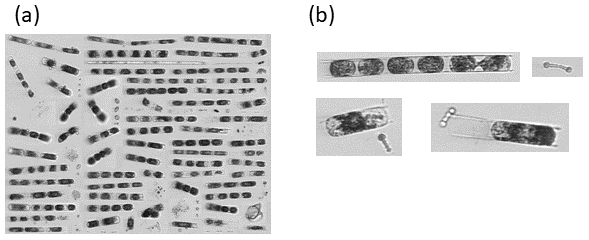
Figure 2IFCB images of the (a) phytoplankton community during the summer 2019 NES-LTER cruise and (b) closer-up individual Hemiaulus cells found with the nitrogen-fixing symbiont Richelia.
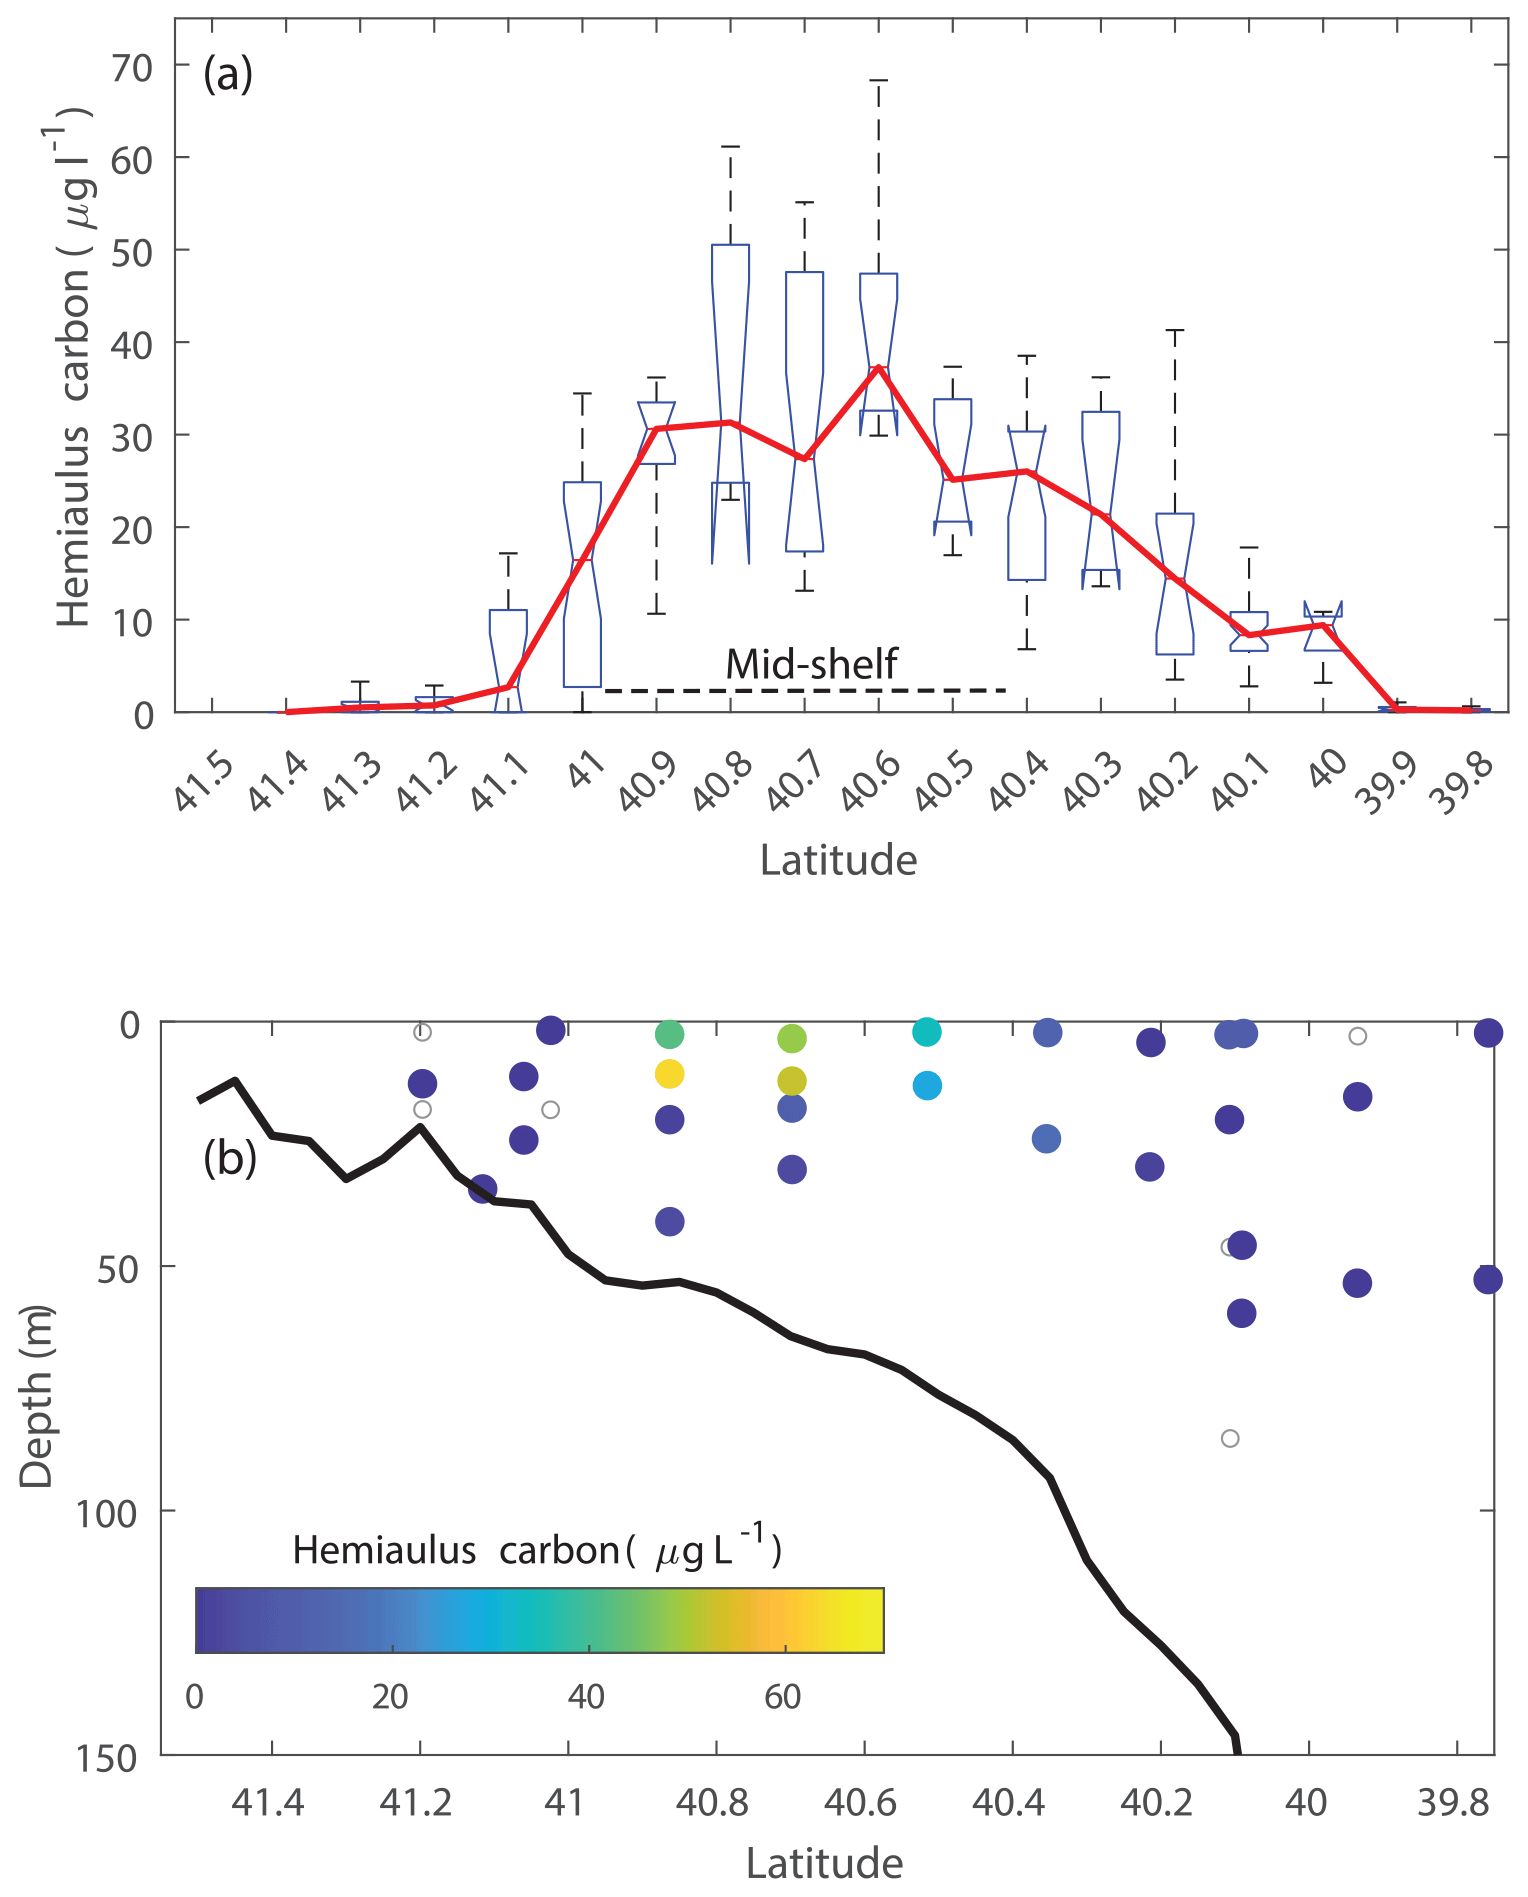
Figure 3Cross-shelf distribution of Hemiaulus carbon concentration in August 2019 showing the mixed layer bloom in the mid-shelf region. Results are derived from IFCB observations in (a) surface waters and (b) discrete samples from depth profiles with symbols color-coded by Hemiaulus carbon concentration (open symbols indicate samples where Hemiaulus was not detected).
The presence of the diatom bloom was consistent with the size-fractionated Chl a data. Surface Chl a concentrations in the mid-shelf region in summer are typically low (< 0.50 µg L−1, Fig. 4a) and progressively decrease with decreasing latitude. During the NES-LTER in summer 2019, however, Chl a concentrations were as high as 3.50 µg L−1 in the surface waters of the mid-shelf (mean Chl a of 1.97 µg L−1, Table 2) with up to 80 % of the Chl a associated with the > 20 µm fraction (Fig. 4c). This is in contrast to other summers when most of the Chl a was associated with the < 20 µm fraction (Fig. 4b, d–f). Concentrations of Chl a in the > 20 µm size fraction and concentrations of Hemiaulus carbon in the NES-LTER summer 2019 cruise were larger at collocated sampling locations at the beginning of the cruise than at the end, suggesting that the bloom may have peaked before the cruise started and was thus in decline during the cruise period.
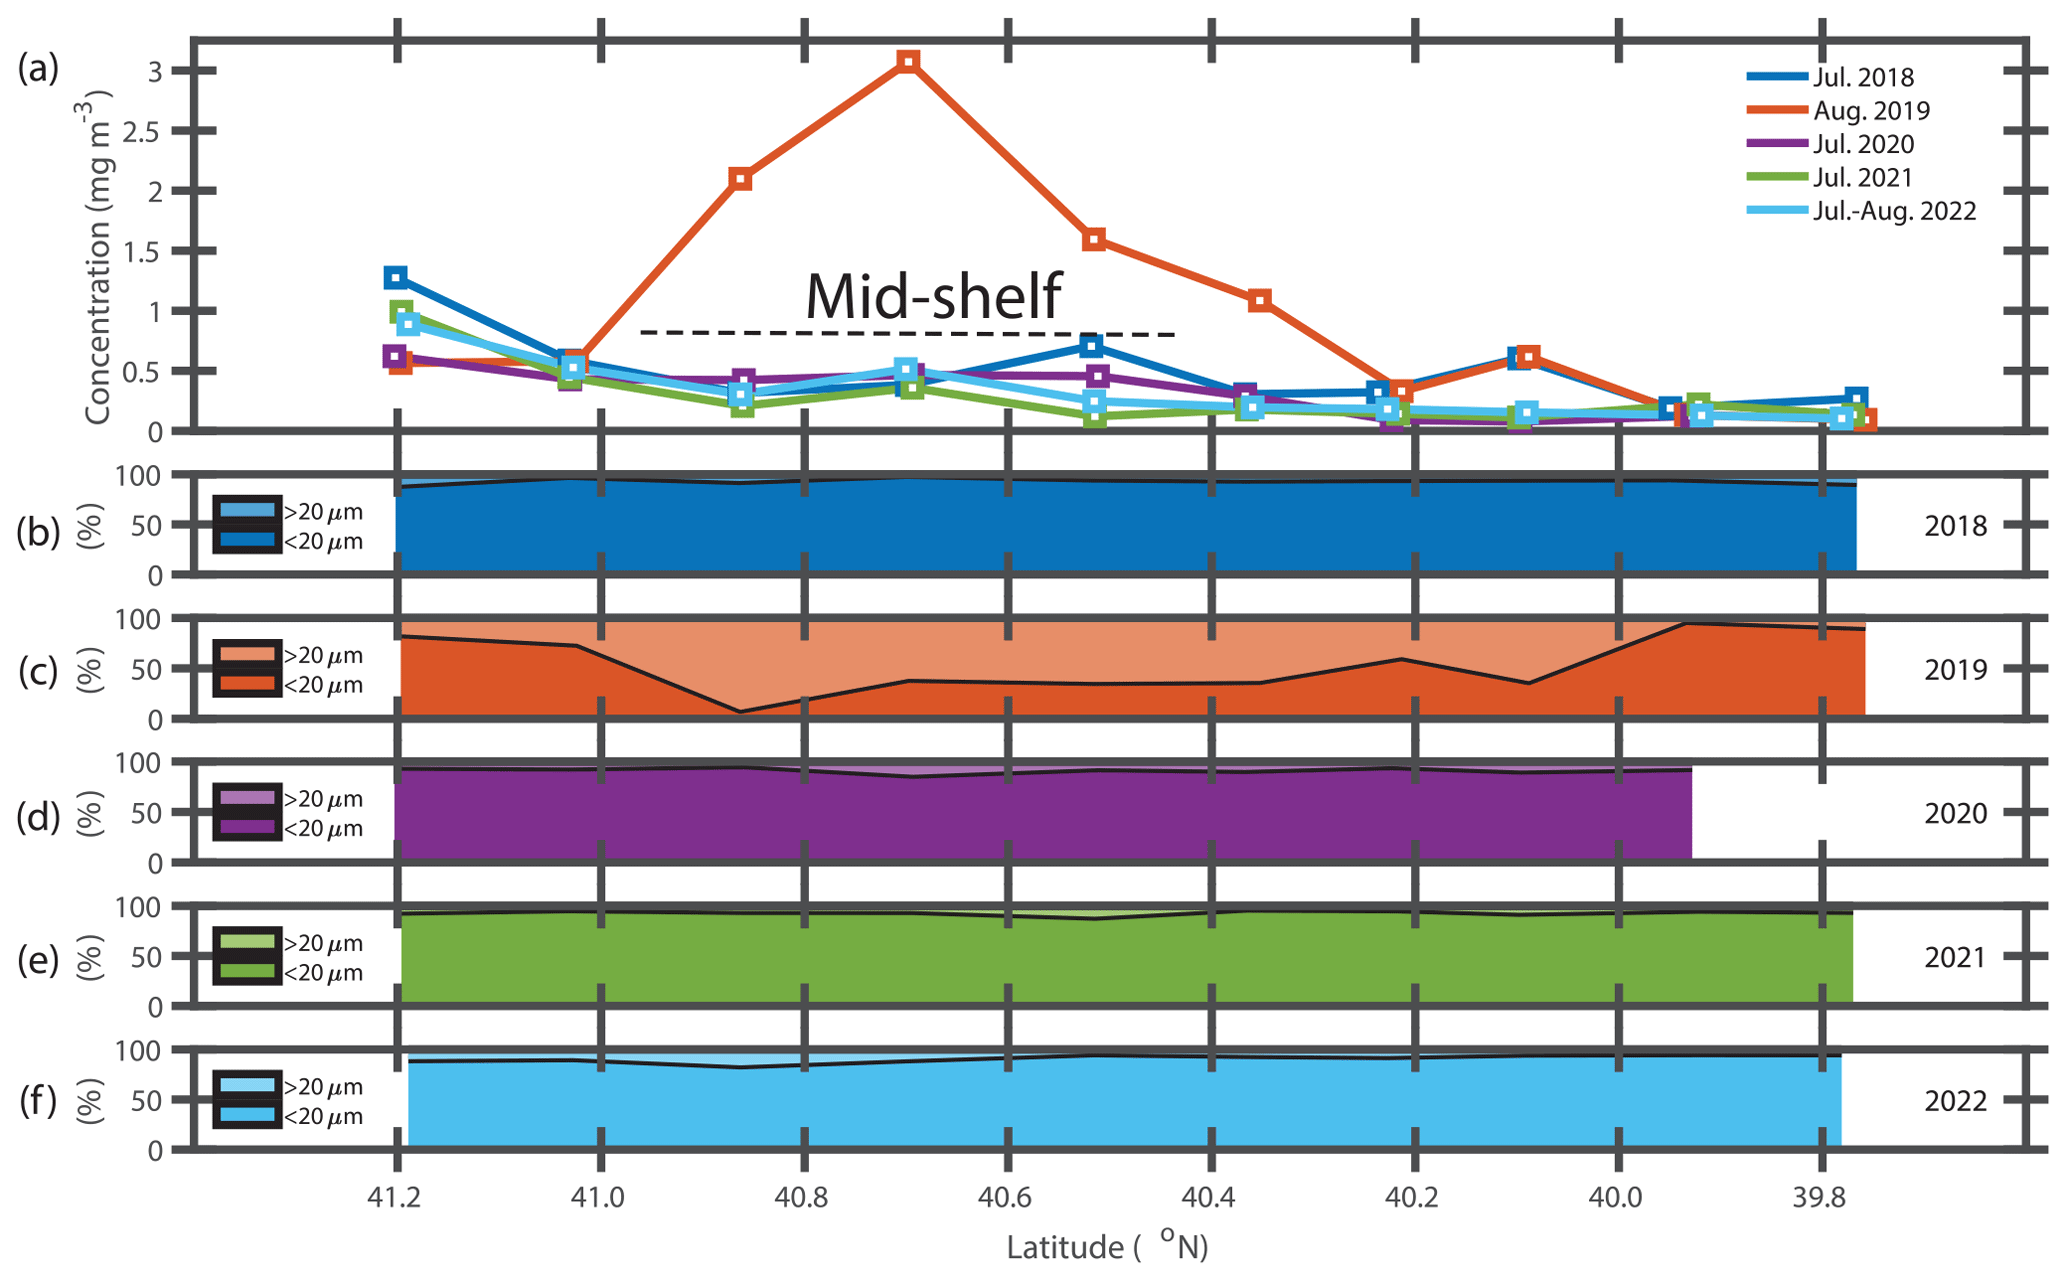
Figure 4(a) Surface Chl a concentration versus latitude for NES-LTER summer cruises in 2018–2022. (b–f) Percentages of surface Chl a associated with the > 20 µm phytoplankton (lighter shade) and < 20 µm phytoplankton (darker shade) versus latitude for each year. Note that the August 2019 cruise had the largest surface Chl a concentrations and also the largest fractions associated with the > 20 µm fraction.
Monthly mean surface Chl a concentrations from remote sensing were used to investigate if the observed differences in Chl a and productivity between the summers were related to differences in the timing of the cruise as opposed to differences in community composition (Fig. S2). In many of the summers (2018, 2021, and 2022), Chl a in July was actually higher than in August, suggesting that the timing of the 2019 cruise (middle to end of August instead of end of July) was not a factor in explaining the anomalously high productivity observed in August 2019. If anything, the change in timing of the 2019 NES-LTER cruise would lead us to expect the Chl a to be lower in August than in July, and thus the high Chl a observed in August 2019 is even more startling. Satellite data cannot be used to confirm the presence or absence of Hemiaulus. However, IFCB data from NES broad-scale NOAA EcoMon surveys from summer 2013 to 2023, many of which occurred in August, always showed minimal presence of Hemiaulus, suggesting that the observed bloom in August 2019 was indeed extraordinary and not simply related to the timing of the 2019 LTER cruise (Fig. S1).
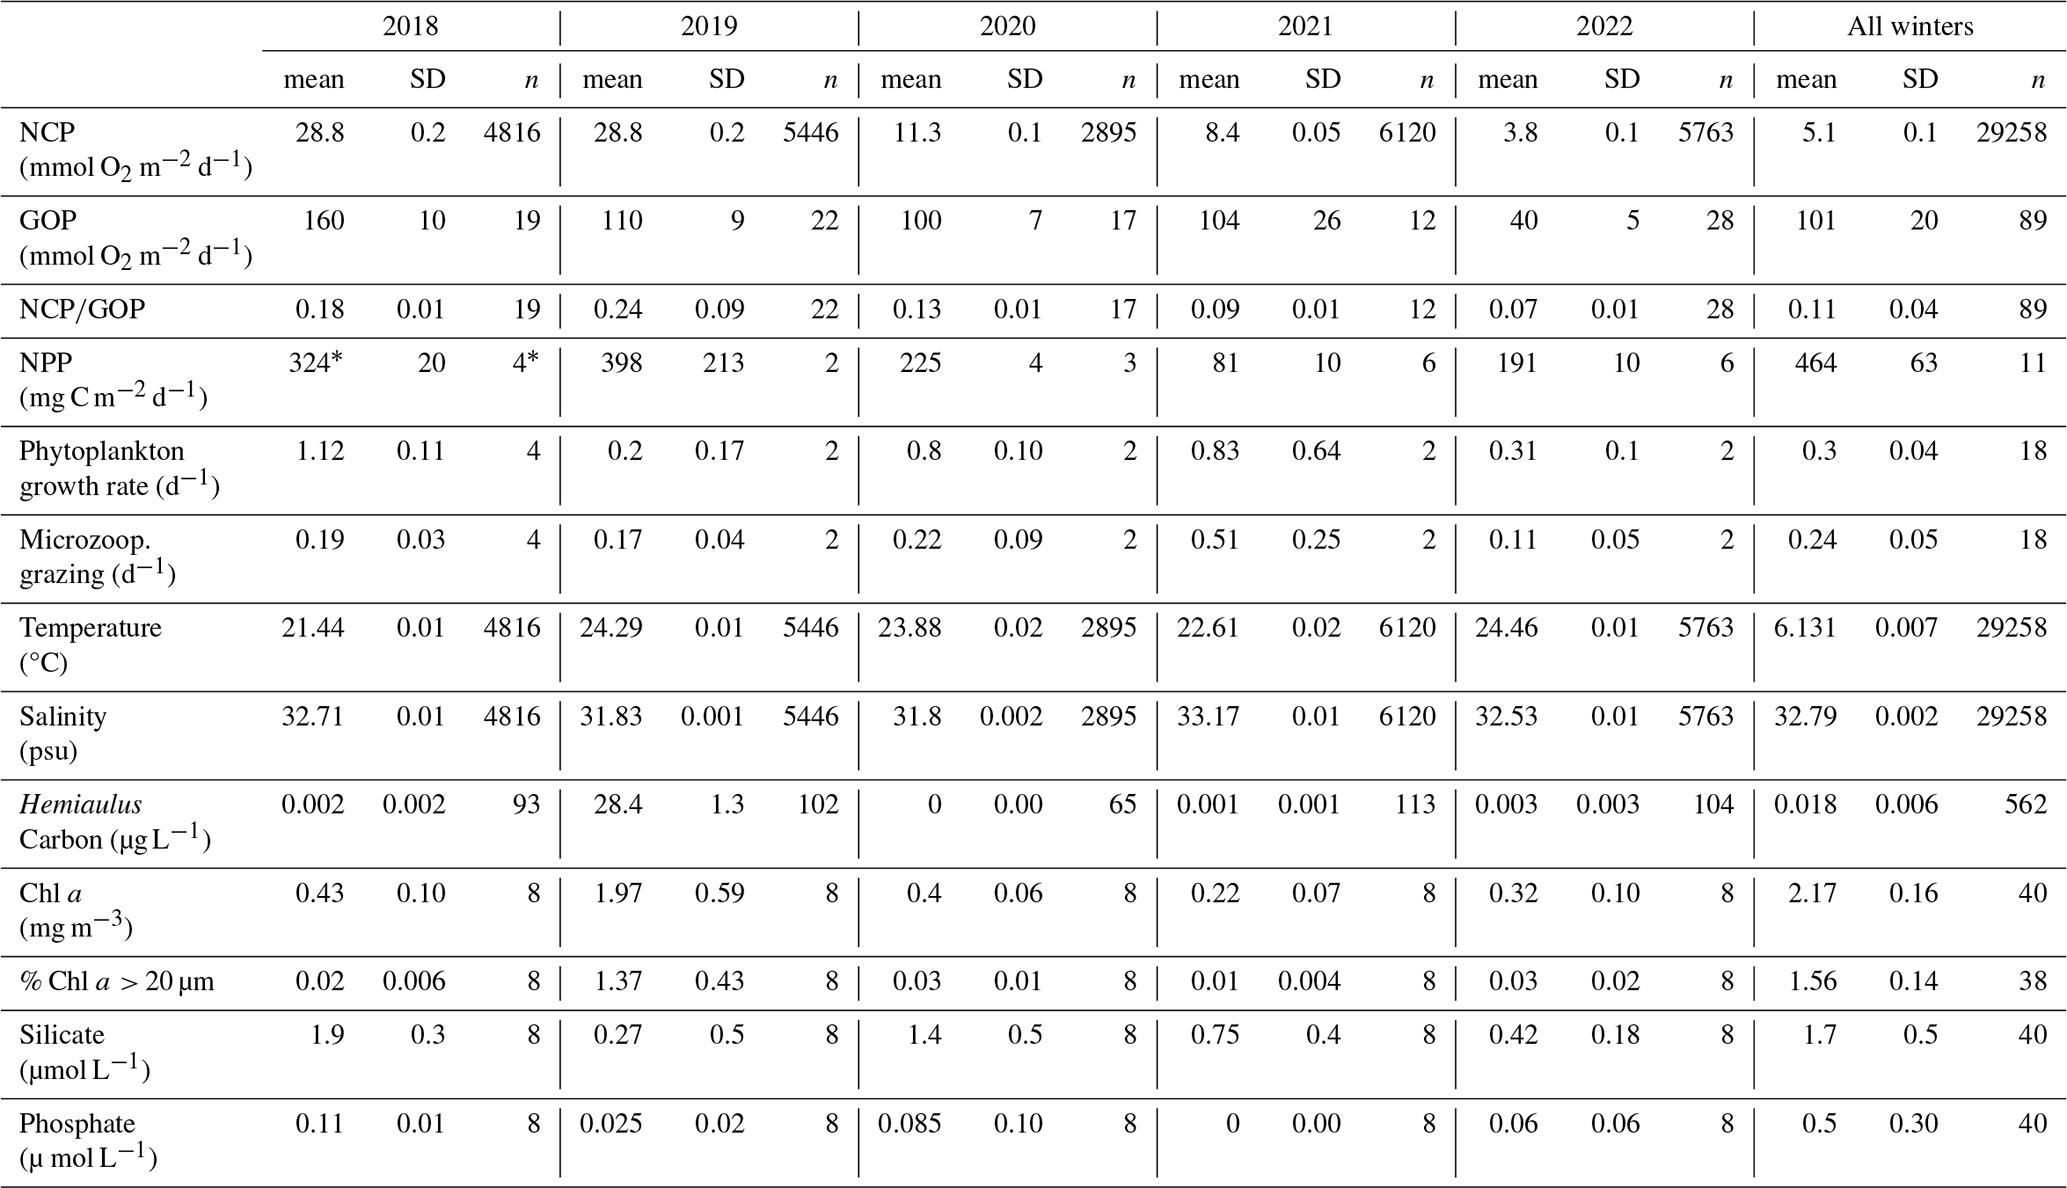
Table 2Averages, standard errors, and number of measurements (n) of surface mixed layer characteristics (productivity values integrated through the surface mixed layer; physical conditions, nutrients, and Chl a concentrations from the surface) in the mid-shelf region (70.883° W, 40.437–40.980° N, water depth 50 to 100 m) measured during NES-LTER summer cruises for each year. The last columns show the mean data for winter NES-LTER cruises in 2018–2022 in the same mid-shelf region. The NPP average in 2018 (*) was calculated based on the phytoplankton growth rate since direct NPP measurements were not available for this year – see text for details.
3.2 Physical properties
During the NES-LTER summer 2019 cruise, SST in the mid-shelf region was only slightly higher than during most of the other summer cruises (Table 2, Figs. 5, 6a). In contrast, SST in summer 2019 on the outer-shelf region in particular was substantially higher than on any other summer cruise (Fig. 6a). Notably, the 2019 cruise occurred later in the summer season (August) than the NES-LTER cruises in other years (July). Along the NES-LTER transect specifically, SST in July 2019 was lower than in August 2019 and was similar to other years. In general, monthly averaged satellite SST data in the broader NES region usually showed lower SST values in July compared to August (2018, 2020–2022) (Fig. S3). Interestingly, however, in summer 2019, the monthly averaged satellite data actually showed higher SST in July because of impingement of a Gulf Stream warm-core ring on the shelf edge (Zhang et al., 2023) and the subsequent onshore intrusion of the ring water in July 2019. The fact that monthly averaged satellite SST was higher in July than August but the local NES-LTER transect data had higher temperature in August than July suggests that the high SST observed during late August 2019 reflected an ephemeral event and not a mean condition during that month. Despite the occurrence of the NES-LTER summer 2019 cruise during a specific week of August and conditions that suggest an ephemeral event, for simplicity, we will refer to it as August 2019 in this paper. During the NES-LTER August 2019 cruise, surface salinity was lower than on the 2018, 2021, and 2022 summer cruises but similar to surface salinity during the July 2020 cruise (Figs. 5, 6b) and to salinities observed in July 2019 along the NES-LTER transect.
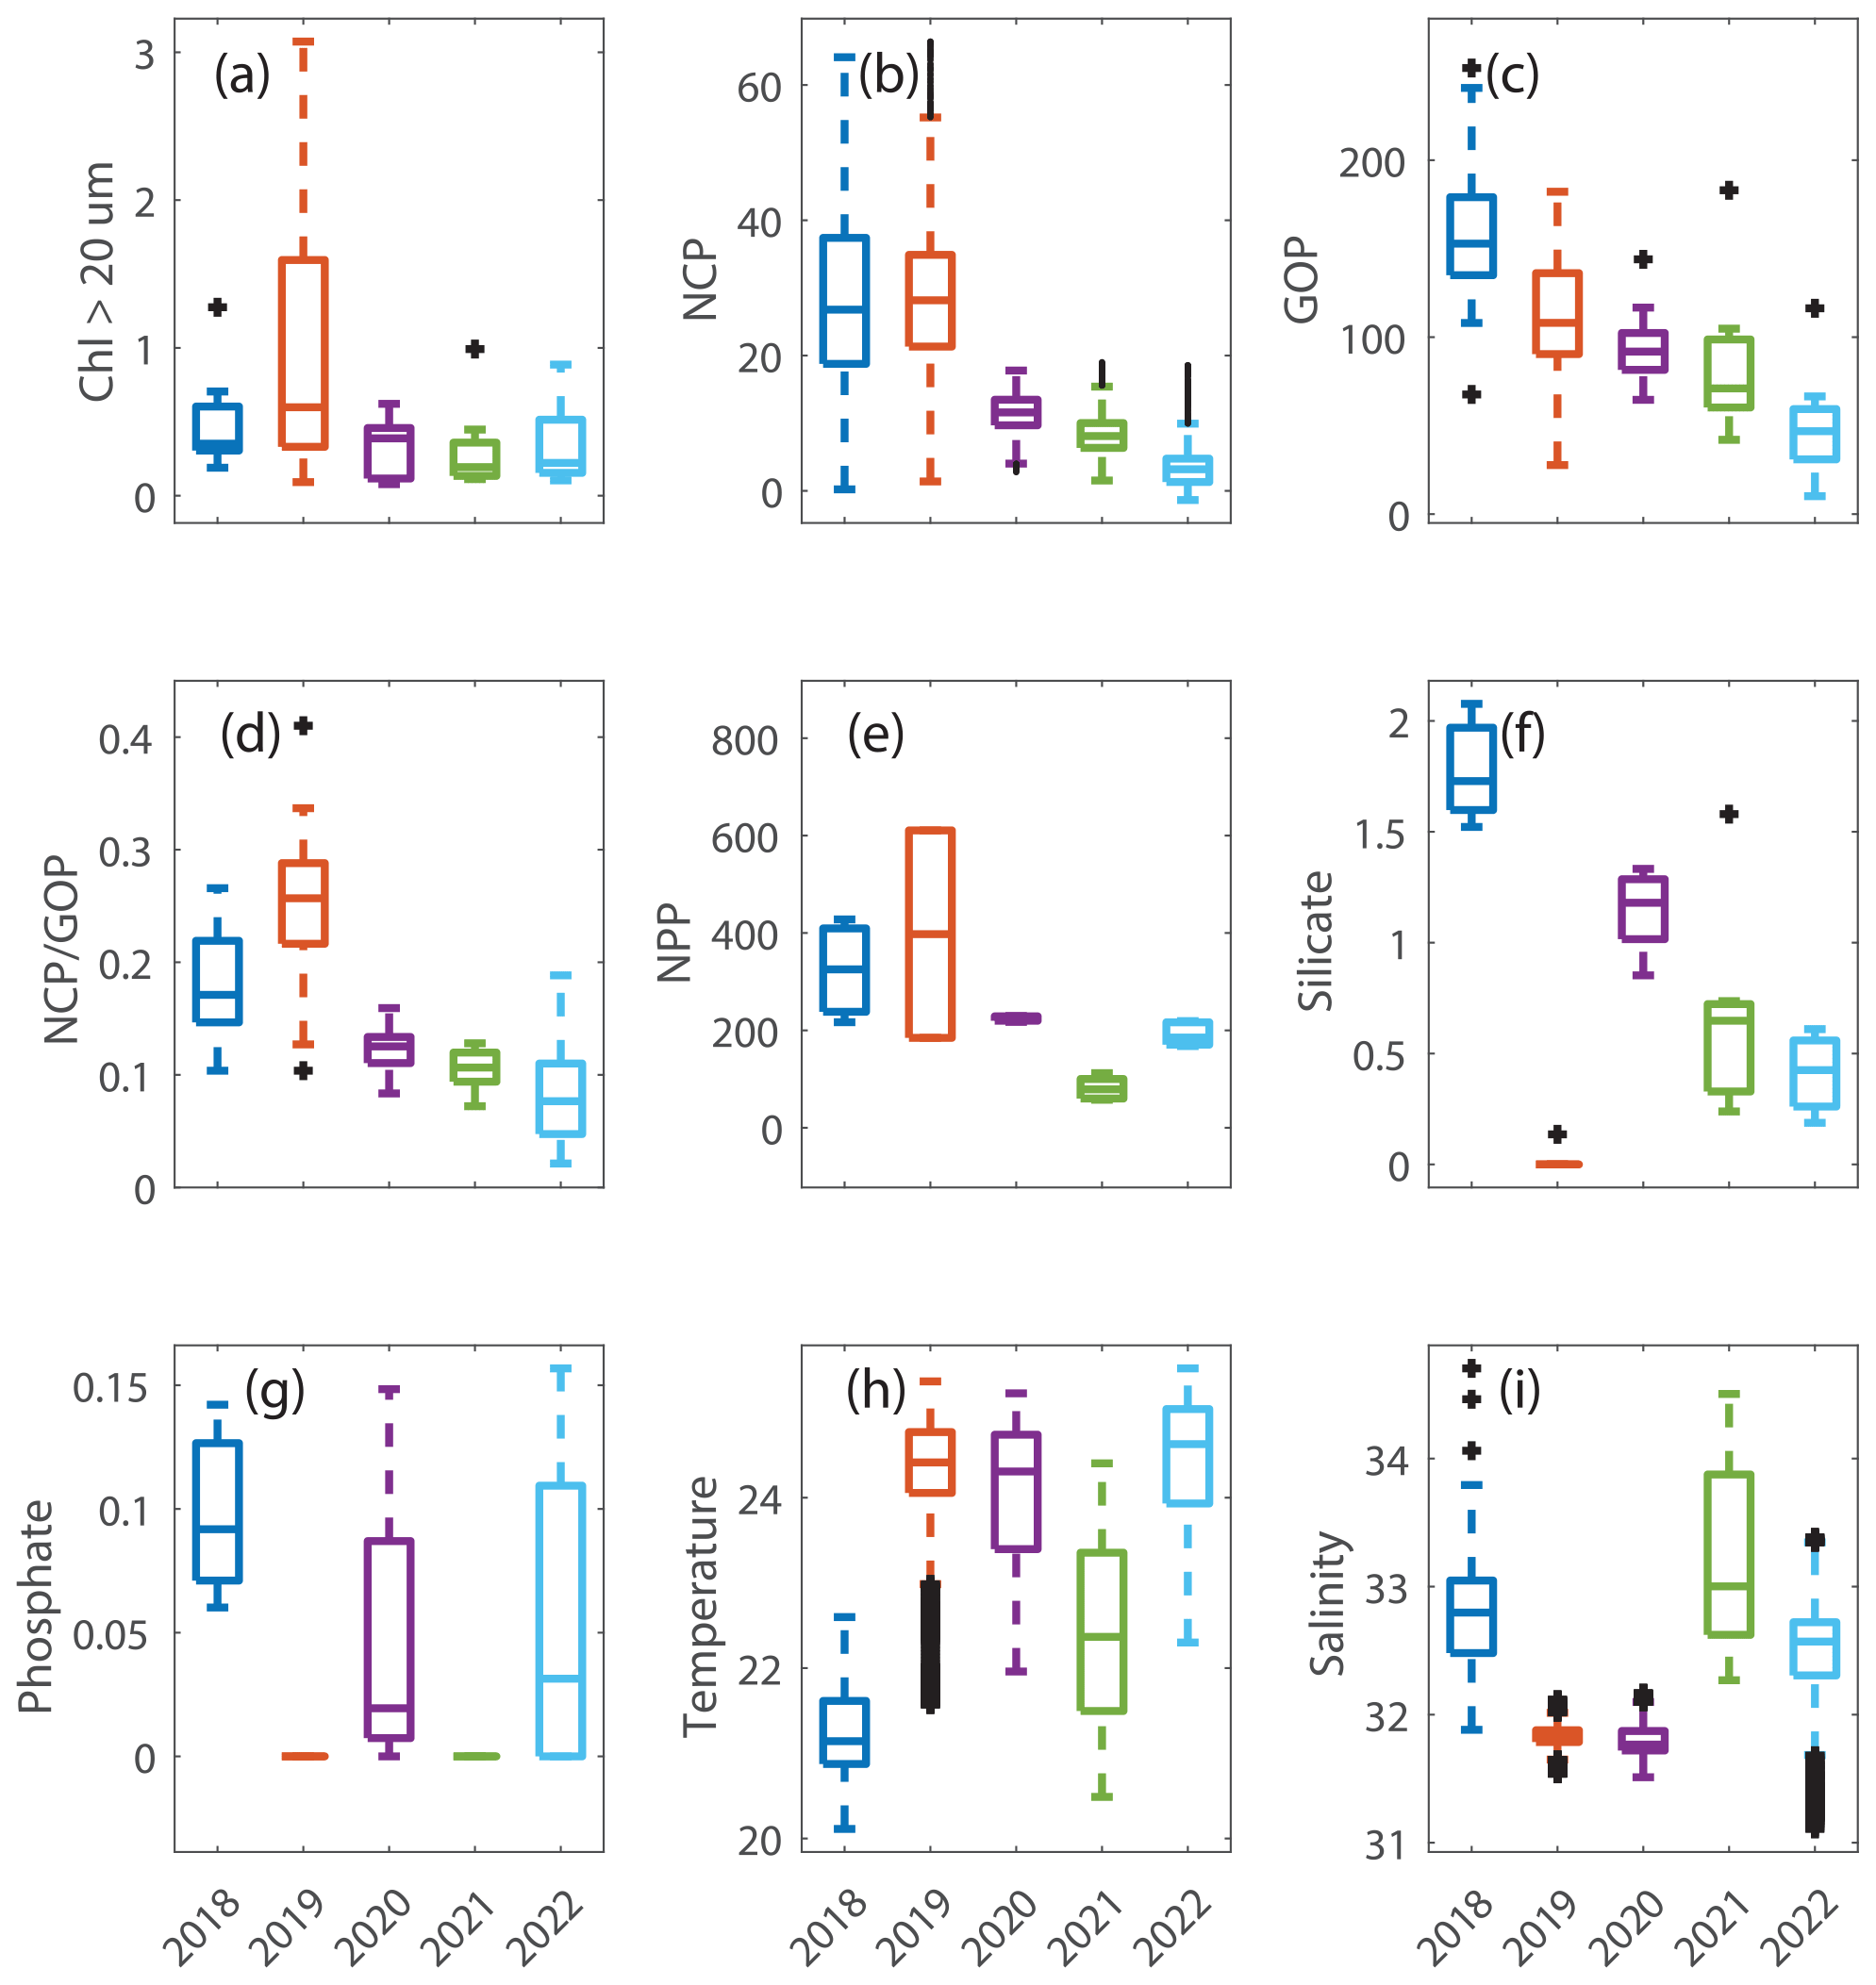
Figure 5Box plots of data in the summer in the mid-shelf region for (a) chlorophyll associated with cells > 20 µm in units of mg m−3. (b) Net community production (NCP) and (c) gross oxygen production (GOP), both in units of mmol O2 m−2 d−1. (d) (unitless), which is a measure of export efficiency. (e) Net primary production (NPP) in units of mg C m−2 d−1. (f) Silicate and (g) phosphate, both in units of µmol L−1. (h) Sea surface temperature in degrees Celsius and (i) salinity in psu. These plots show the differences in the plotted variables that occurred in August 2019 (orange box in each plot), a year when Hemiaulus carbon equaled 28.4 µg L−1, compared to the data from the other summers, all of which had Hemiaulus carbon < 0.02 µg L−1.
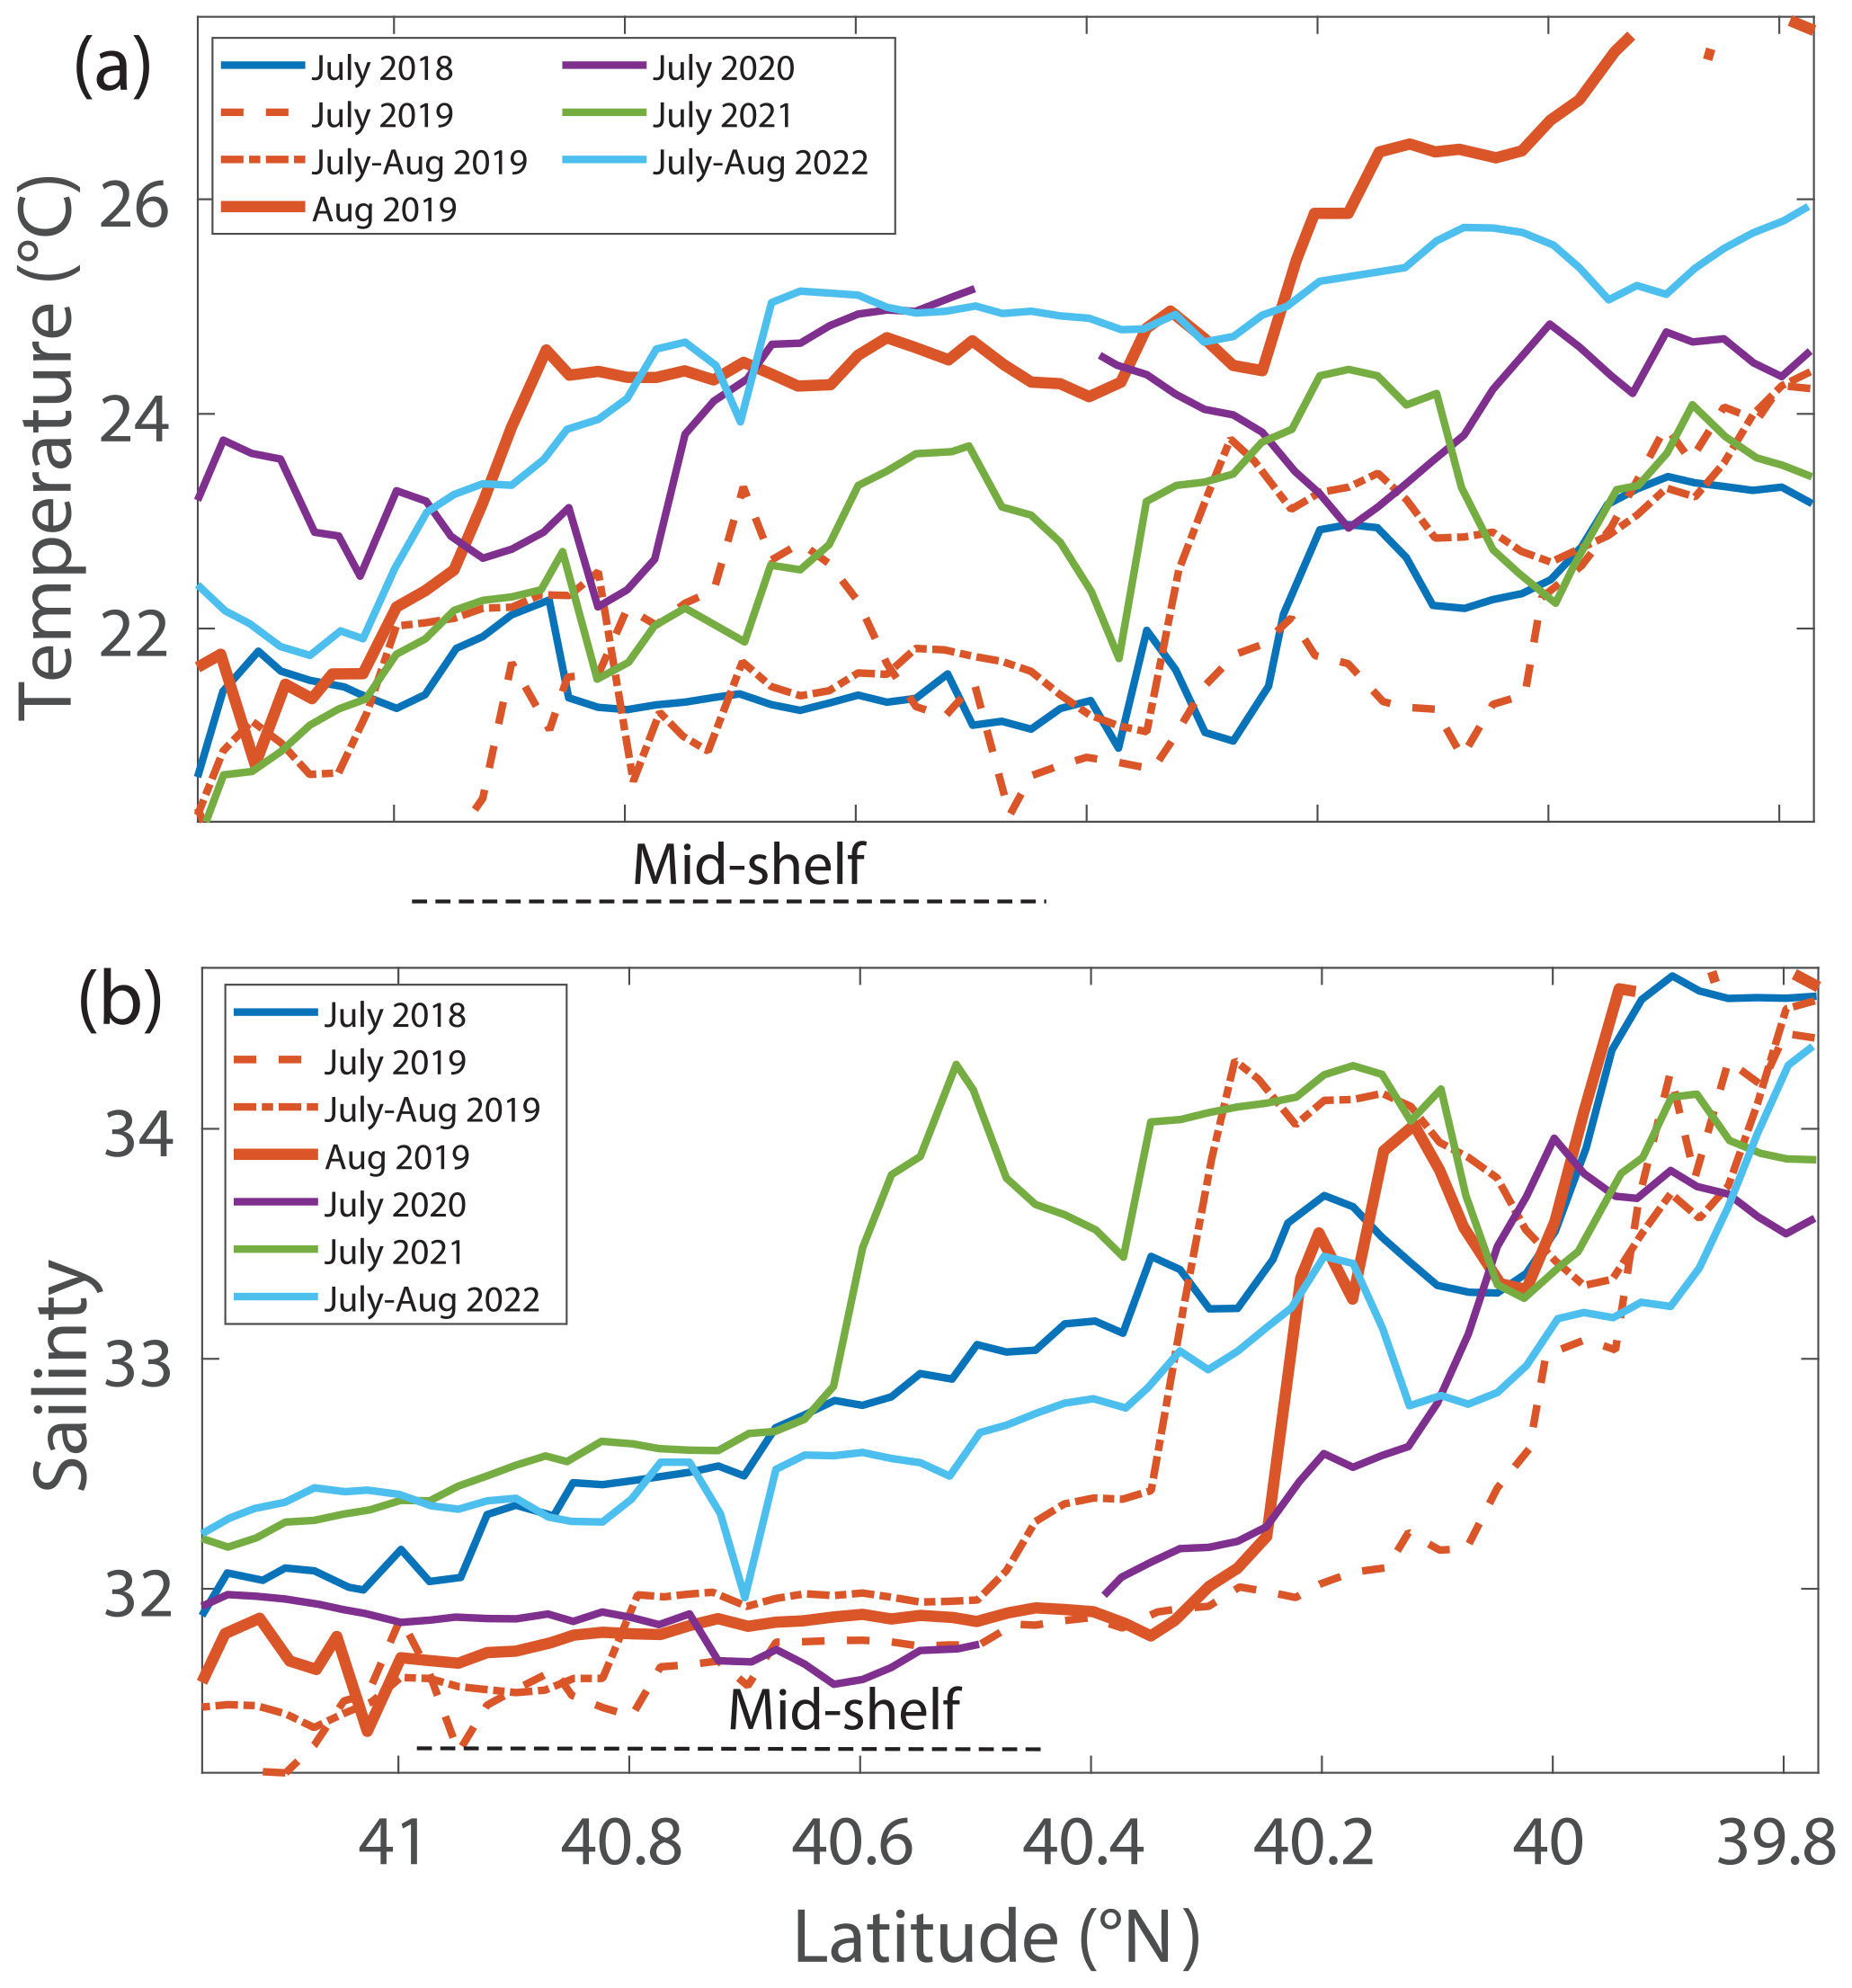
Figure 6(a) Temperature and (b) salinity 5 m below the surface versus latitude for NES-LTER summer cruises (2018–2022) and the SPIROPA and OTZ summer 2019 cruises. For clarity, the values are averaged in 0.025° latitude bands when there were multiple occupations of the same region. The mid-shelf region is denoted by a dashed black line.
3.3 Nutrients
Nutrient concentrations differed between the August 2019 cruise and other summer cruises. Specifically, phosphate and silicate concentrations in surface waters were lower in August 2019 compared to most other summers (Table 2, Figs. 5, 7). In other summers, silicate decreased with distance from shore, but in 2019, silicate was depleted between 41 and 40.4 ° N (Fig. 7a) coincident with the location of the Hemiaulus bloom. Additionally, higher levels of silicate were found around depths of 50 to 140 m in August 2019 than during other summer NES-LTER cruises (Fig. S4), which may be associated with diatoms that had sunk and were starting to be remineralized, releasing silicate back into the water column. Surface water phosphate concentrations in August 2019 were depleted south of 41° N (Fig. 7b). However, low concentrations of phosphate were also found in summer of 2021. Lastly, while nitrate + nitrite was measured on the same samples as phosphate and silicate, nitrate + nitrite concentrations were close to the detection level in the surface samples for all summer cruises except a few stations in 2018 and are thus not shown here. Ammonium levels are not discussed because the samples were frozen at sea and thus may not be reliable; additionally, ammonium levels showed no clear relationship over the transect cruises.
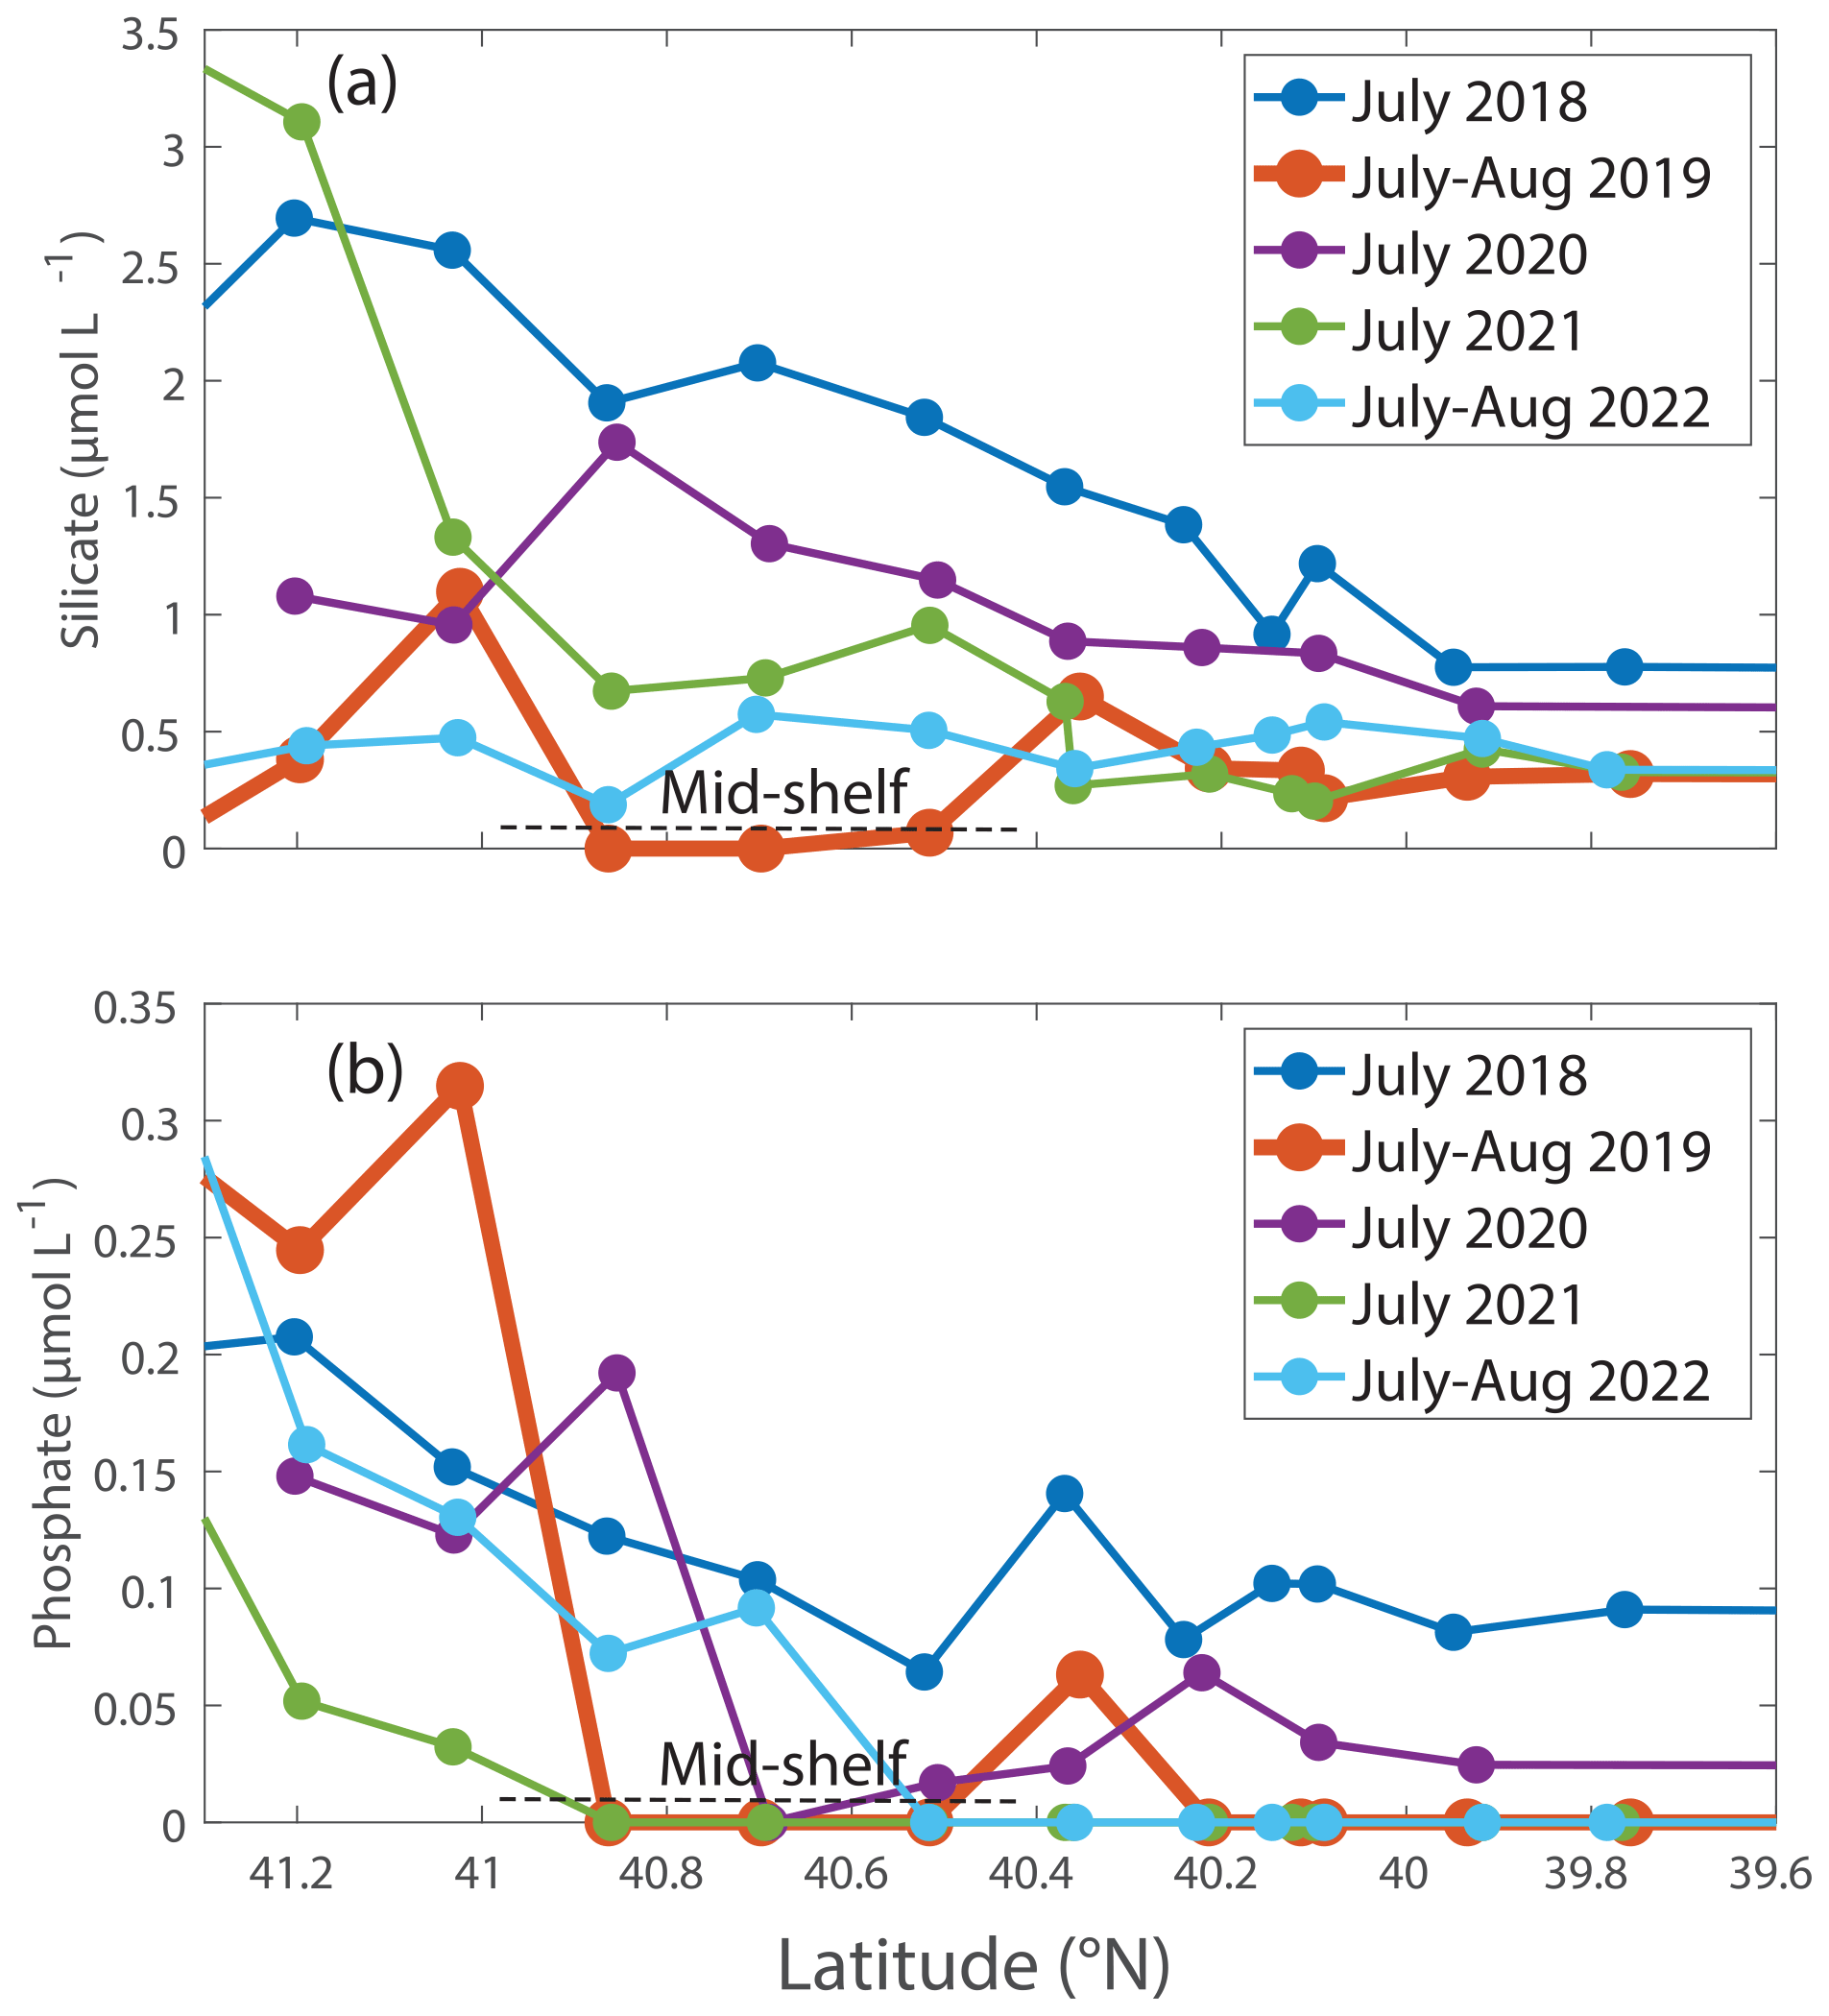
Figure 7(a) Silicate and (b) phosphate concentrations (in µmol L−1) in the upper 12 m of the water column for NES-LTER summer cruises (2018–2022). The mid-shelf region is denoted by a dashed line.
3.4 Productivity and grazing rates
In August 2018 NCP was elevated in the mid-shelf waters, coincident with the location of the Hemiaulus bloom (Fig. 1). NCP peaked in the first half of the cruise and decreased during the second half, supporting the earlier supposition that the Hemiaulus bloom was likely in decline (Fig. S5). Additionally, the area of maximum NCP moved shoreward in the second half of the cruise. The high NCP was primarily constrained to the main longitude sampling line and usually did not extend, at least at those points in time, spatially off the main transect.
During August 2019, waters with high carbon concentrations of Hemiaulus showed higher rates of NCP (Fig. 8a), (Fig. 8b), GOP (Fig. 8c), and NPP (Fig. 8d) compared to these rates in mid-shelf waters in most other years (Fig. 5). More specifically, the mid-shelf waters where Hemiaulus was present in August 2019 displayed NCP values approximately 2.5 to 9 times larger than in the same mid-shelf latitudes in summers of 2020–2022 (Table 2). Furthermore, we observed a correlation between NCP and Hemiaulus carbon between 21 and 23 August (Fig. 9; R2=0.54, p<0.001). The patchiness of the diatom bloom corresponded to the patchiness in NCP. Additionally, cooler shelf water was associated with higher abundances of Hemiaulus than the warmer slope water (Fig. 9), suggesting a water mass dependence on the location of the Hemiaulus bloom and that the patchiness in the bloom and NCP is likely a result of the ship crossing different water masses.
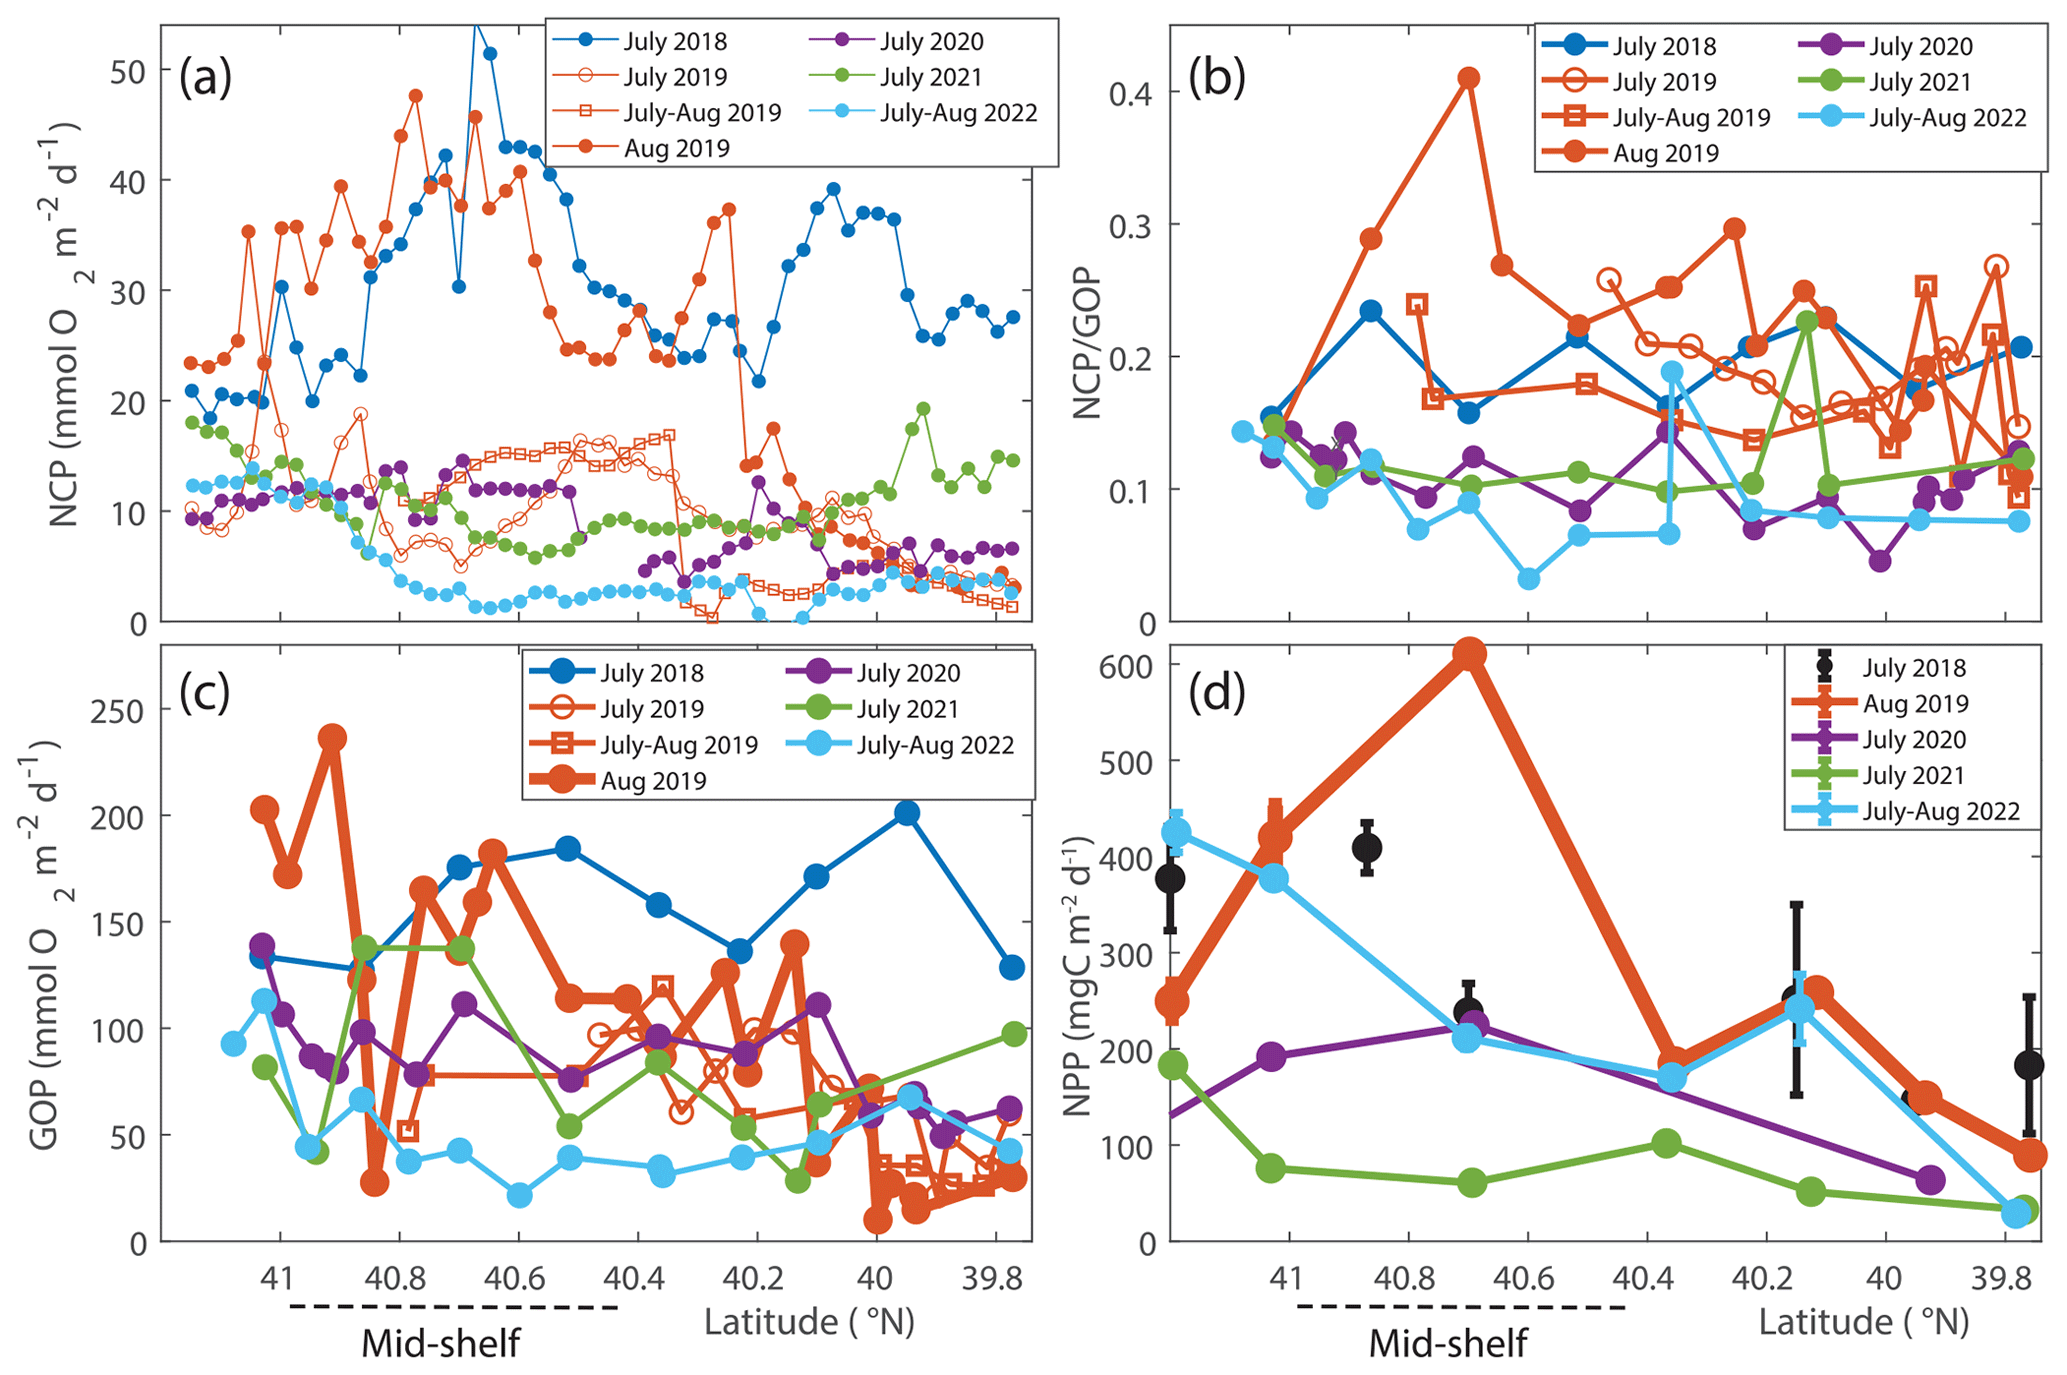
Figure 8(a) NCP, (b) , and (c) GOP rates integrated throughout the mixed layer for NES-LTER summer cruises (2018–2022) and SPIROPA and OTZ summer 2019 cruises. Values are averaged in 0.025° latitude bands to average multiple occupations of the same region. The same overall patterns are seen with and without the averaging within these latitude bands. (d) Average NPP values integrated to the bottom of the mixed layer for NES-LTER summer cruises (2019–2021) with error bars reflecting the standard deviation of triplicate surface water incubations. NPP values were not directly measured for summer 2018 but were instead estimated from phytoplankton growth rate in the grazing incubation experiments (black circles). The mid-shelf region is denoted by a dashed line.
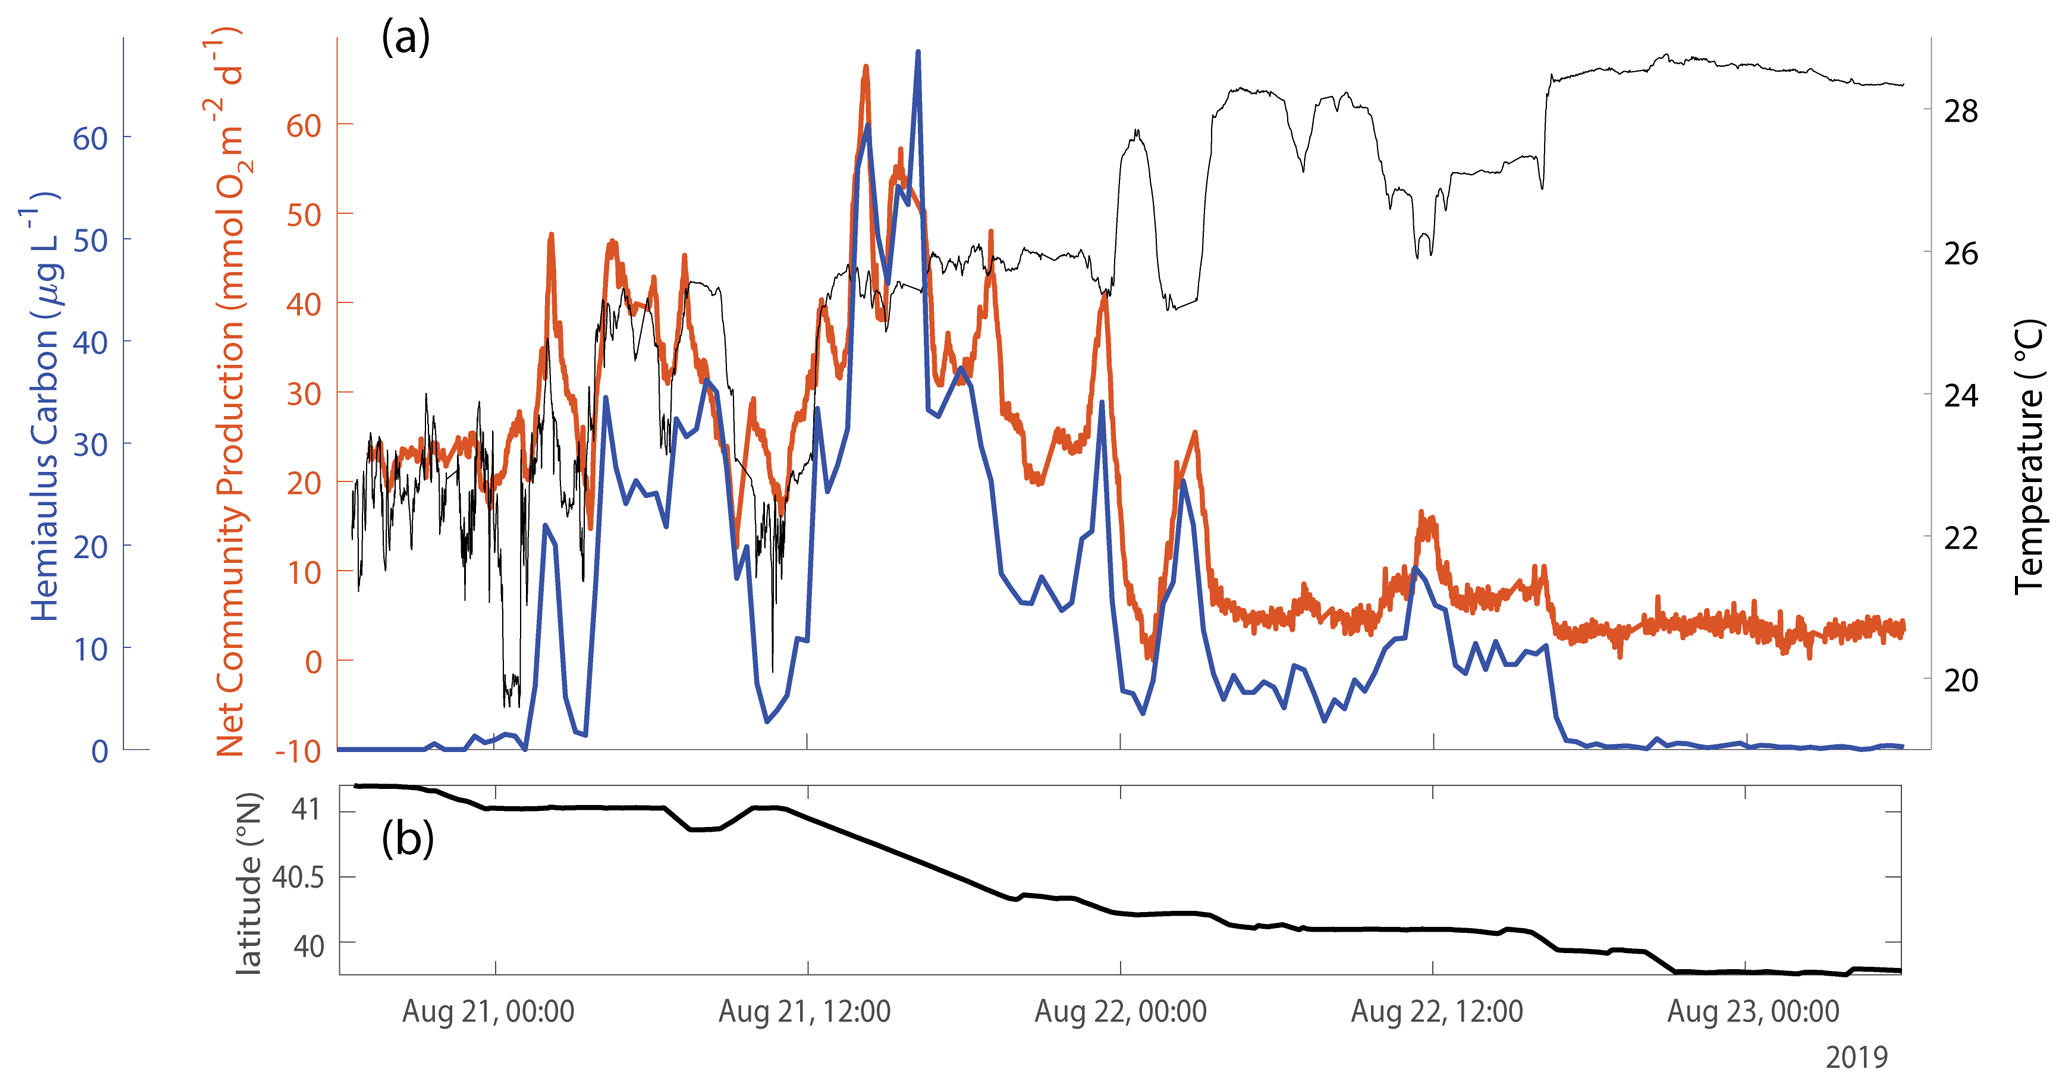
Figure 9(a) Hemiaulus carbon concentration (blue), as estimated from IFCB data, showing a strong positive correspondence with NCP (orange) (R2=0.54, p<0.001) and a weak negative correlation with SST (black) (R2=0.07, p=0.002) during one of the times during the August 2019 NES-LTER cruise that the ship was transiting the mid-shelf region. (b) The latitude of the ship during the time period reflected in panel (a).
GOP rates were only slightly higher in summer 2019 than in other summers (Figs. 5 and 8c). In particular, GOP rates were higher by a factor of 1.1 in waters with the Hemiaulus bloom in 2019 than during the summers of 2020–2021; GOP rates were much higher in August 2019 than in summer of 2022 by a factor of 2.75. Notably, NCP, GOP, and rates in summer 2018 were comparable to these rates in August 2019 (discussed below in Sect. 4.1).
Additionally, within the region that directly corresponds to the location of the Hemiaulus bloom, NPP rates in 2019 were ∼ 1.5–2.5 times higher than NPP rates during other summer cruises (Fig. 8d; Table 2). More specifically, NPP at 40.7° N was approximately double the NPP measured in 2020 and more than double the rate measured in 2021. Furthermore, at 40.4° N, NPP in 2019 was about 40 % higher than in 2021 (no data for this station in 2020) (Fig. 8d).
A larger difference between NCP in the various summers than between GOP in the summers suggests that the increase in NCP in August 2019 was due to both increased photosynthesis and decreased community respiration. In a rough approximation, we calculated autotrophic respiration and heterotrophic respiration to show that autotrophic respiration was lower than average in August 2019 (RA=308 mg C m−2 d−1 in August 2019 versus 496 mg C m−2 d−1 average for the other summers). This approach also showed that heterotrophic respiration was higher than average in August 2019 (431 mg C m−2 d−1 in August 2019 versus 247 mg C m−2 d−1 average for the other summers). Note that this estimation is highly uncertain due to the different timescales and spatial scales associated with the gas tracers used to quantify NCP and GOP and the incubation techniques used for NPP.
Since the summer 2019 NES-LTER cruise occurred in the middle of August rather than in middle to late July as was typical for most other summers, the physical conditions were inherently different in 2019. We compared NCP and GOP data (NPP not available) from two earlier cruises in summer 2019 (cruise details in Table 1) whose cruise track in the mid-shelf region overlapped with those of the LTER cruise, i.e., followed the same longitude of 70.883° W. These cruises occurred before the Hemiaulus bloom and while their IFCB records showed a detection of Hemiaulus, the abundance of this diatom was very low (< 1 µgC L−1). These two July 2019 cruises had much lower NCP rates compared to August 2019 and specifically had rates similar to those observed in summer 2020–2022 NES-LTER transect cruises (Fig. 8a, b). Together, these data suggest that higher production rates in 2019 were uniquely tied to the presence of Hemiaulus rather than representing deviations in timing or environmental conditions.
The ratio of protistan grazing to phytoplankton growth rates provides an estimate of the percent of primary production (% PP) consumed by microzooplankton (Fig. 10). In contrast to typical summer conditions (> 0.6 d−1, Table 2), during August 2019, phytoplankton growth rates during the Hemiaulus bloom were low (< 0.2 d−1, Table 2) compared to other summers, with most of the primary production consumed by microzooplankton (% PP = 84 %, Table 2). Notably, these low phytoplankton growth rates are in the same range as other diatoms with Richelia symbionts, namely 0.3 d−1 for Rhizosolenia–Richelia cultured at a similar temperature (Villareal, 1990) . Thus in August 2019, phytoplankton growth and microzooplankton grazing were well-coupled (though only in the part of the transect where Hemiaulus bloomed), like typical winter conditions, when the phytoplankton community structure is dominated by large cells, instead of the decoupling typically observed in most summer conditions dominated by picoplankton (Marrec et al., 2021). We note that coupling between phytoplankton growth and microzooplankton grazing was occasionally observed during other summer cruises, but mostly in inner-shelf waters (except one mid-shelf station in July 2021). Overall, most of the primary production during the Hemiaulus bloom was grazed by microzooplankton, indicating high trophic transfer efficiency from phytoplankton to microzooplankton.
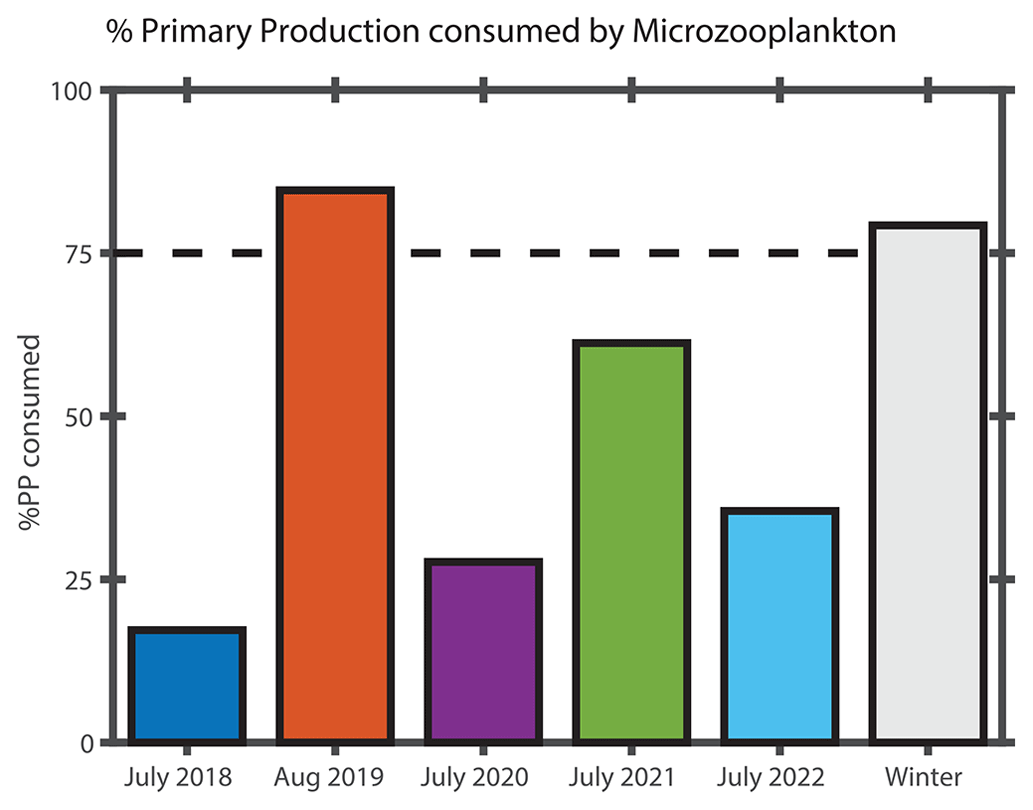
Figure 10Percentage of primary production (% PP) consumed by microzooplankton in surface waters in the mid-shelf region during NES-LTER cruises for each summer and the overall average from NES-LTER winter cruises in 2018–2022. % PP consumed by microzooplankton is calculated as the ratio of microzooplankton grazing rate (d−1) to phytoplankton growth rate (d−1).
4.1 Change in community composition altering biological rates
A bloom of Hemiaulus has not been observed on any previous NES-LTER cruise and to our knowledge has not been reported in the broader NES region before. Additionally, only in August 2019, compared to summers of 2018 and 2020–2022, was most of the Chl a associated with the >4 20 µm size fraction. Thus, the presence of the diatom bloom found in August 2019 was a major change in phytoplankton composition observed in this region of the NES that likely led to the observed large changes in productivity rates and coupling between phytoplankton growth and grazing.
It is likely that the nitrogen-fixing symbionts in Hemiaulus allowed the diatom to thrive in the stratified, low-nutrient surface waters of the summer shelf. This is supported by phosphate drawdown to levels below detection in August 2019; the nitrogen-fixing symbionts in the Hemiaulus likely made phosphate a limiting factor for growth (Tang et al., 2020) in August 2019, whereas nitrate limitation is typical for NES summer conditions. While the summer of 2021 also had very low phosphate, summer 2021 was different in that it also had low productivity rates and more typical levels of silicate, suggesting that the low phosphate occurred for fundamentally different reasons in 2019 and 2021.
Silicate is especially important for diatoms because it is required for formation of their cell frustules. Moreover, previous studies show that the availability of dissolved silica seems to be an important control for many diatom–diazotroph blooms by affecting the growth rate and size of the diatom's frustules (Kemp and Villareal, 2013; Spitzer, 2015). The observed depletion of silicate and phosphate in surface waters during the August 2019 cruise suggests that, at the time of the cruise, the Hemiaulus bloom may have been in decline. The low phytoplankton growth rates of 0.2 d−1 support the idea that the bloom had peaked, particularly given the fact that with sufficient phosphate, silicate, and light, Hemiaulus diatom diazotroph association can achieve growth rates of 0.7–0.9 d−1 in laboratory cultures (Pyle et al., 2020). Low growth rates could also be attributed to the inverse relationship between phytoplankton cell size and growth rate. The Hemiaulus population could have been limited by phosphate, silicate, or both. The higher levels of silicate observed at depth in August 2019 (Fig. S4) are likely due to Hemiaulus sinking out of the euphotic zone and frustule remineralization at depth, which would release the silicate – and other nutrients – back into the water (Twining et al., 2014).
The strong coherence between the high-spatial-resolution data on Hemiaulus carbon concentrations and NCP (Fig. 9), as well as the other data presented here, plus a clear potential mechanism, strongly supports the idea that the high productivity rates observed in August 2019 are directly due to the presence of Hemiaulus. In particular, the high NCP rates observed during the August 2019 NES-LTER cruise and their overlap with the location of the diatom bloom suggest that a high-export ecosystem developed due to the Hemiaulus influence on productivity and biological rates. Here, we define export as a flux away from the local biological production compartment, which can include losses of carbon (or oxygen) to depth or transfer to higher trophic levels. While the Hemiaulus bloom slightly increased total photosynthesis, as seen from the GOP rates, the bloom presence affected NCP and thus by extension export production to a higher degree, potentially due to the large size of Hemiaulus cells and chains. The ratio in August 2019 was double the ratio observed in the summers of 2020–2022 (Table 2, Fig. 5). Other studies have shown links between variations in and changes in planktonic community composition (Palevsky et al., 2016). Bigger phytoplankton cells sink faster than small ones, making them less likely to be grazed before sinking out of the euphotic zone, allowing for a higher export efficiency. Additionally, higher trophic transfer efficiency (see next paragraph) would also lead to a larger ratio. Hence, the NES-LTER summer 2019 cruise appears to have represented a system with high carbon export efficiency.
Not only did NCP and GOP rates change because of the Hemiaulus bloom, but so did NPP, phytoplankton growth rates, Chl a concentrations, and the trophic transfer efficiency within the planktonic food web. The presence of Hemiaulus in the mid-shelf region likely led to the observed higher NPP rates during August 2019 compared to all other observed summers in the mid-shelf region of the NES (Figs. 5 and 8). High NPP rates associated with diatom blooms have been observed in other systems such as on the eastern Bering Shelf (Lomas et al., 2012) and in the Gulf of California (Puigcorbe et al., 2015), including during blooms of diatom–diazotroph associations such as Hemiaulus–Richelia (Gaysina et al., 2019). For example, Tang et al. (2020) reported a high contribution of nitrogen fixation to NPP off the coast of New Jersey during their 2015–2016 survey in the western North Atlantic. Even though high NPP was associated with the location of the Hemiaulus bloom in our study, phytoplankton growth rates were low (< 0.2 d−1). This decoupling between NPP and growth was likely due to the order-of-magnitude higher Chl a concentrations observed during August 2019 (1.37 µg L−1) compared to other summers (0.01–0.03 µg L−1; Table 2) since NPP is roughly the product of phytoplankton growth and biomass (Marchetti et al., 2009). Thus, although the growth rate was low, biomass was so high that NPP was also high. Furthermore, most of the primary production was directly consumed by microzooplankton, which we have not observed during any other summer NES-LTER cruise, suggesting that the presence of Hemiaulus led to more efficient trophic transfer during August 2019. While conditions with high NCP (i.e., low community respiration) and high grazing pressure, as observed in August 2019, may seem counterintuitive, they are not contradictory since grazing cannot be equated with respiration. First, much of respiration is bacterial and therefore not reflected by the grazing rates (Robinson and Williams, 2005). Second, it has been observed that after starvation, protozoan grazers increase their organic matter production by accumulating lipids and increasing their cell size (Anderson and Menden-Deuer, 2017; Morison et al., 2020). Thus, high grazing could suggest a buildup of organic matter through secondary production, which is consistent with the higher than average microzooplankton biomass and would be reflected as large NCP. Third, microzooplankton can produce fecal pellets (Buck and Newton, 1995), which removes carbon from the system without respiration and leads to high NCP. The dominant presence, and slow growth, of large Hemiaulus cells within the phytoplankton community was likely a main factor promoting the higher trophic transfer efficiency from phytoplankton to microzooplankton, as is typical during winter (Marrec et al., 2021).
Interestingly, NCP and GOP values in summer 2018 were similar to those in August 2019 (Table 2, Figs. 5 and 8) and also much higher than during subsequent summers (2020–2022), in spite of no Hemiaulus being present in summer 2018. Additionally, the ratio of in summer of 2018 was also significantly larger than in 2020–2022 (Figs. 5 and 8). Remote sensing shows an elevated Chl a patch (less concentrated than the patch in August 2019) in summer 2018 west of the transect that could be the driving factor behind the high NCP and GOP values (Fig. S2). The summer of 2018 was dominated by small phytoplankton similar to observations in summers of 2020 and 2021, although the summer of 2018 had a particularly high concentration of dinoflagellates over parts of the shelf. The summer 2018 data did not show an increase in trophic transfer efficiency due to coupled microzooplankton grazing and phytoplankton growth. High NCP rates in summer 2018 could be due to a variety of environmental (biotic and abiotic) factors that were different from other cruises. For example, in the summer of 2018, saline waters from offshore intruded much farther inshore than during most of the other summers and these high-salinity mid-shelf waters were particularly productive (Mehta, 2022). Additionally, correspondence was seen between NCP and dinoflagellate biomass in summer 2018, although this correlation was not as significant as that between Hemiaulus and NCP in 2019 (Aldrett, 2021). Thus, this study shows that a change in community composition, such as the Hemiaulus bloom in August 2019, can dramatically change the productivity rates of the ecosystem even though a very different phytoplankton community structure can sometimes lead to similarly high productivity.
4.2 Aggregate vs. compositional variability
The changes in community composition, productivity rates, and chlorophyll in August 2019 compared to the other summers shed interesting light on the question of synchrony or compensation between aggregate and compositional variability at the NES-LTER site (Micheli et al., 1999; Shoemaker et al., 2022). The resilience of an ecosystem may be related to the compensation or synchrony between different types of variability (Lindegren et al., 2016). During August 2019, the phytoplankton composition in the NES changed dramatically due to the bloom of the diatom Hemiaulus. This change was associated with increases in Chl a, higher productivity rates, tighter coupling between microzooplankton grazing and phytoplankton growth, and increases in export efficiency. These latter terms are all metrics of aggregate properties and thus this bloom event exhibited high compositional and high aggregate variability compared to the ecosystem in July of 2020–2022. Thus, during this event, a metric associated with compositional variability (e.g., the change in phytoplankton community composition) was synchronous with metrics associated with aggregate variability. However, when NCP rates are compared from the summer 2018 to summer 2019, the composition is still quite different (Hemiaulus in 2019 compared to mostly small phytoplankton in 2018), and thus there is still large compositional variability but the aggregate properties in terms of NCP are similar in both years, showing that sometimes compensation occurs in which the community composition changes but the aggregate productivity does not. This concurrent investigation of plankton community composition and production rates within a well-studied ecosystem highlights how shifts in community size distribution can greatly affect productivity. However, it also shows that multiple factors change from year to year, leading to different effects.
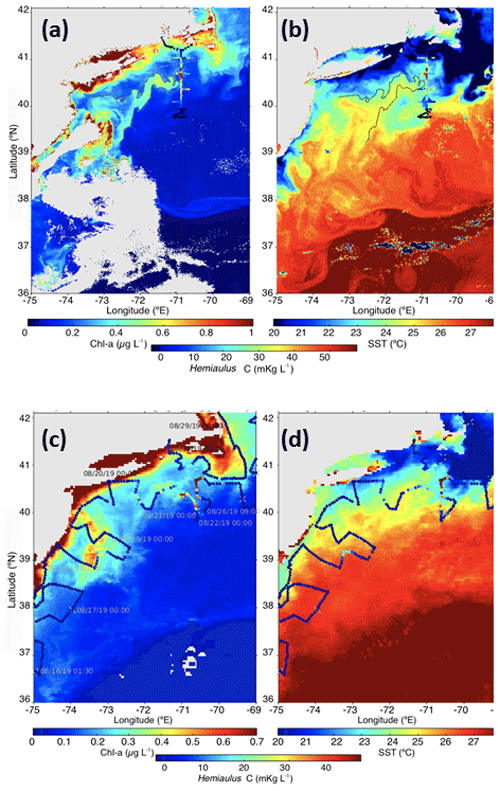
Figure 11Snapshots of satellite-measured (a) Chl a and (b) SST on 11 August 2019. The 0.5 µg L−1 chlorophyll contour is plotted as a solid line. Hemiaulus carbon from underway surface samples during the NES-LTER August 2019 cruise is overlaid with colored dots. The monthly composite (c) Chl a and (d) SST for August 2019. Hemiaulus carbon from underway surface samples during EcoMon cruise GU1902 is overlaid with colored dots. Daily ship positions are indicated in the left panel.
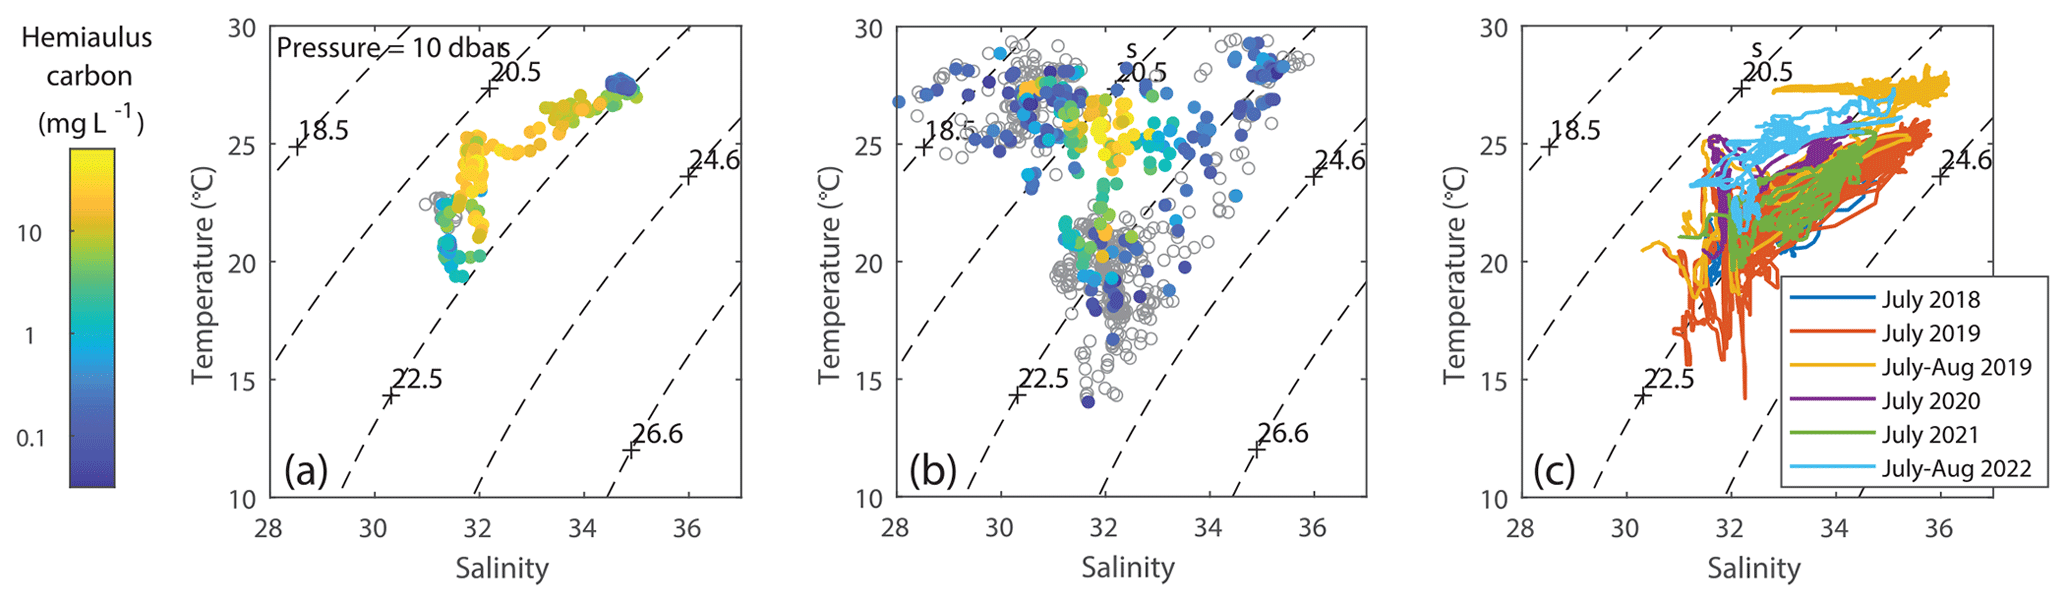
Figure 12T–S plots, colored according to Hemiaulus carbon, suggesting that the highest Hemiaulus abundances were associated with a “sweet spot” in T–S space that was found during (a) the 2019 summer NES-LTER cruise in August and (b) the EcoMon August 2019 cruise. Empty circles represent locations where Hemiaulus was not detected. (c) T–S plots from other years, colored according to cruise, show that a few of the other summer cruises from 2018–2022 have the same sweet spot in physical conditions even though they did not have detectable Hemiaulus.
4.3 Origin of bloom
The Hemiaulus bloom was likely more widespread than what was observed in the NES-LTER 2019 summer cruise. For example, satellite imagery from 11 August shows a filament of warm, high-Chl a waters oriented southwest–northeast and ending in the region where Hemiaulus was abundant (Fig. 11a, b); the advective continuity of the filament with the Hemiaulus patch suggests that the filament may have had high Hemiaulus as well. Direct support for a widespread bloom comes from IFCB data collected on the NOAA EcoMon cruise (GU1902) that occurred at a similar time as the August 2019 NES-LTER transect cruise. The IFCB data show that Hemiaulus was present both farther east and to the southwest of where it was observed on the LTER transect cruise and that some of the points in the high-chlorophyll filament observed from satellite chlorophyll contained Hemiaulus (Fig. 11c).
Backward particle trajectory analysis based on HF-radar-measured sea surface velocities show that the water with high Hemiaulus biomass during the August 2019 transect cruise could have been advected from the inner shelf around Narragansett Bay and Georges Bank rather than from the mid-shelf further south (Fig. S6). In particular, coastal upwelling probably brought the inner-shelf water into the mid-shelf transect area where it was observed to have high Hemiaulus. The salinity of the water with the high Hemiaulus biomass is consistent with the water having originated from the shelf. The water with high amounts of Hemiaulus carbon was associated with salinity ranging from 31.6 to 34 psu and temperatures of 22 to 27 °C (Fig. 12a, b). T–S plots of data from other years (Fig. 12c) suggest that several other summers also had similarly warm, low-salinity water (in particular July of 2020 and especially 2022), but interestingly Hemiaulus was not observed on those cruises.
Although multiple lines of evidence suggest that the water containing the high biomass of Hemiaulus initially originated from the inner shelf, Hemiaulus is typically found in warm, low-nutrient water – characteristics that are not present on the inner shelf, where water is instead colder and nutrient-rich. In this case, the inner-shelf water warmed as it was transported offshore and thus reached temperatures warm enough for Hemiaulus to thrive by the time it reached the mid-shelf (the timing of warming is not known). But how did this inner-shelf water acquire Hemiaulus as it was transported offshore in August 2019? One possibility is that it was seeded by the warmer low-nutrient surface slope and ring waters; in particular, these slope and ring waters were observed earlier in the summer of 2019 to have a small population of Hemiaulus that could have served as a seed population (Oliver et al., 2021). However, there is no evidence of surface transport from slope water to the Hemiaulus patch. Another possibility is that Hemiaulus was already present in the deeper coastal water and then thrived as the deep water was mixed upward, warmed, and reached the higher-light surface waters. However, the vertical distributions of Hemiaulus (Fig. 3) do not support this hypothesis, since a deeper population was not observed. Finally, the modeled backward particle trajectories suggesting an inner-shelf origin may be inaccurate as shelf water circulation is complex, as seen by the conflicting origins of the Hemiaulus water to both the east and west of the transect and an inconsistency between conclusions from the particle trajectory analysis and the high-Chl a, high-temperature filament observed in the satellite imagery. Thus, the reason Hemiaulus bloomed in 2019 and not in other years remains a topic for future research and continued speculation. Future years of the NES-LTER program may shed light on the variable effects of disturbances, such as this Hemiaulus bloom, as more factors that lead to high or low export in summer are determined and explored.
An unusual bloom of the diatom genus Hemiaulus with nitrogen-fixing symbionts in the mid-shelf region of the Northeastern US Shelf in August 2019 was observed concomitant with increases in NCP, GOP, NPP, higher export efficiency, and higher trophic transfer efficiency from phytoplankton to microzooplankton. Very tight coupling observed between kilometer-scale changes in NCP and the carbon biomass of Hemiaulus showed a substantial effect from the Hemiaulus bloom on important biogeochemical rates and stocks of the Northeastern US Shelf. While the source of the Hemiaulus on the inner shelf remains unknown, the bloom was associated with warmer temperatures than usually observed on the shelf, which may have been an important factor that facilitated the bloom when it was transported from the inner shelf.
The Hemiaulus bloom, which was observed at a time when there were warmer sea surface temperatures, especially in the outer-shelf region, was intriguing in that it led to unusually high productivity rates, increases in Chl a concentrations, and tighter food web coupling. While the warm SST may have contributed to the Hemiaulus bloom, the summer cruise of 2022 showed nearly as high water temperature as 2019 in the outer shelf, and the summers of both 2020 and 2022 had similarly high water temperatures as 2019 in the mid-shelf region. However, summers in 2020 and 2022 had relatively low (i.e., average summer) productivity rates and Chl a. So, summers in 2020 and 2022 had fairly similar physical conditions to that of 2019, but no significant bloom was observed, and no high-carbon-export system was present. Thus, higher temperatures are not enough to explain higher productivity rates; a shift in community composition is also necessary. A mixture of the right physical conditions and community composition, like this special case of 2019, are needed for a high-carbon-export system to be supported on the mid-shelf during summer.
With climate change, the oceans are warming at a rapid rate and are likely moving towards warmer more stratified conditions (e.g., lower nitrate stock in surface waters) (Li et al., 2020), which may lead to less productivity and thus lower export efficiencies. However, these conditions may also lead to unusual phytoplankton composition as species distribution shifts. The results presented here show that unusual events can lead to large locally and episodically enhanced productivity and export; despite a commonly nitrate-limited ecosystem during the summer season, an intense phytoplankton bloom in summer occurred due to a symbiotic diatom–diazotroph relationship. These observations lead to further questions about how the NES ecosystem is responding to the effects of climate change such as enhanced stratification. Monitoring future disturbances and their effects will provide new insights into relationships, mechanisms, and patterns of composition and productivity that may be only occasionally occurring now but will likely be more prevalent in the future.
All in situ data are available via the EDI data repository at https://portal.edirepository.org/nis/browseServlet?searchValue=NES, last access: 21 December 2023. In particular, the raw gas tracer data used for calculating NCP and GOP are available at https://portal.edirepository.org/nis/mapbrowse?packageid=knb-lter-nes.6.3 (Stanley et al., 2024a). The calculated rates of NCP data are accessible at https://portal.edirepository.org/nis/mapbrowse?packageid=knb-lter-nes.13.3 (Stanley et al., 2024b), https://portal.edirepository.org/nis/mapbrowse?packageid=knb-lter-nes.14.3 (Stanley et al., 2024c), https://portal.edirepository.org/nis/mapbrowse?packageid=knb-lter-nes.30.1 (Stanley et al., 2024d), https://portal.edirepository.org/nis/mapbrowse?packageid=knb-lter-nes.31.1 (Stanley et al., 2024e), and https://portal.edirepository.org/nis/mapbrowse?packageid=knb-lter-nes.32.1 (Stanley et al., 2024f). NPP data are available at https://portal.edirepository.org/nis/metadataviewer?packageid=knb-lter-nes.16.4 (Fontaine and Rynearson, 2023). Grazing rate data are available at https://portal.edirepository.org/nis/mapbrowse?packageid=knb-lter-nes.5.2 (Menden-Deuer and Marrec, 2023). Chlorophyll data are available at https://portal.edirepository.org/nis/mapbrowse?packageid=knb-lter-nes.8.2 (Sosik et al., 2023a). Abundances and biomass of Hemiaulus data are available at https://portal.edirepository.org/nis/mapbrowse?packageid=knb-lter-nes.33.1 (Sosik et al., 2024), and images are available on the IFCB dashboard at https://ifcb-data.whoi.edu/timeline?dataset=NESLTER_transect (Sosik et al., 2023b) and https://ifcb-data.whoi.edu/timeline?dataset=NESLTER_broadscale (Sosik et al., 2023c).
The MODIS SST and chlorophyll snapshot data were produced by NASA Goddard Space Flight Center, Ocean Ecology Laboratory, Ocean Biology Processing Group, and the data are publicly available at https://oceancolor.gsfc.nasa.gov/, last access: 24 January 2023. The 8 d composite data were retrieved from the publicly accessible University of Delaware ERDDAP server (https://basin.ceoe.udel.edu//erddap/index.html, last access: 24 January 2023) maintained by the Ocean Exploration, Remote Sensing and Biogeography Laboratory led by Matthew Oliver at the University of Delaware. The HF-radar-measured sea surface velocity data in July–August 2019 were obtained from the publicly accessible Rutgers University Center for Ocean Observing Leadership ERDDAP server (http://hfr.marine.rutgers.edu/erddap/griddap/, last access: 14 December 2022).
The supplement related to this article is available online at: https://doi.org/10.5194/bg-21-1235-2024-supplement.
SACC, RHRS, ZOS, and AM measured and calculated rates of productivity from gas tracers. SMD and PM measured grazing rates. TAR and DNF measured and calculated rates of net primary productivity from bottle incubations. HMS, ETC, and EEP imaged and quantified phytoplankton abundances. DJM and WGZ analyzed remote sensing data. Everyone participated in study design. SACC and RHRS prepared the paper with contributions from all co-authors.
The contact author has declared that none of the authors has any competing interests.
Publisher's note: Copernicus Publications remains neutral with regard to jurisdictional claims made in the text, published maps, institutional affiliations, or any other geographical representation in this paper. While Copernicus Publications makes every effort to include appropriate place names, the final responsibility lies with the authors.
We are thankful for the scientific input, discussions, and help from the entire NES-LTER science team. We are grateful to the captain and crew of the R/V Endeavor. We thank Harvey Walsh, Jerome Prezioso, Audy Peoples, and Tamara Holzwarth-Davis for their cooperation and enthusiasm for IFCB operations on NOAA survey cruises. We recognize the contributions of Kevin Cahill (WHOI), who ran some of the samples for triple oxygen isotope measurement, Elizabeth Lambert (Wellesley College) and Helene Alt (Wellesley College), who helped collect some of the EIMS data, and Danielle Aldrett (Wellesley College) for doing some initial analysis on connections between the IFCB and NCP data. We thank NES-LTER data managers Stace Beaulieu and Kate Morkeski (WHOI) for their help in data management. We thank URI-GSO undergraduate and graduate students and postdocs who helped collect samples and conduct experiments to obtain Chl a concentrations, as well as phytoplankton growth and microzooplankton grazing rates. We thank Sam Setta for pointing out Richelia in IFCB images during the 2019 summer cruise. DJM gratefully acknowledges NSF support from the SPIROPA program and technical assistance by Olga Kosnyrev in satellite data analysis and visualization.
This research has been supported by the National Science Foundation (grant nos. LTER-1655686, OCE-1657489, OCE-1657803, and OCE-2227425) and the Simons Foundation (561126 to Heidi M. Sosik). S. Alejandra Castillo Cieza was supported by the Clara Boothe Luce Fellowship program at Wellesley College.
This paper was edited by Emilio Marañón and reviewed by two anonymous referees.
Aldrett, D.: Understanding the relationship between photosynthetic organisms and oceanic productivity in the Northeast U.S. Shelf, undergraduate thesis, Chemistry, Wellesley College, Wellesley, MA USA, 58 pp., 2021.
Anderson, S. R. and Menden-Deuer, S.: Growth, Grazing, and Starvation Survival in Three Heterotrophic Dinoflagellate Species, J. Eukaryot. Microbiol., 64, 213–225, https://doi.org/10.1111/jeu.12353, 2017.
Armbrust, E. V.: The life of diatoms in the world's oceans, Nature, 459, 185–192, https://doi.org/10.1038/nature08057, 2009.
Barkan, E. and Luz, B.: The relationships among the three stable isotopes of oxygen in air, seawater and marine photosynthesis, Rapid Commun. Mass Sp., 25, 2367–2369, https://doi.org/10.1002/rcm.5125, 2011.
Boyd, P. W., Claustre, H., Levy, M., Siegel, D. A., and Weber, T.: Multi-faceted particle pumps drive carbon sequestration in the ocean, Nature, 568, 327–335, https://doi.org/10.1038/s41586-019-1098-2, 2019.
Brownlee, E. F., Olson, R. J., and Sosik, H. M.: Microzooplankton community structure investigated with imaging flow cytometry and automated live-cell staining, Mar. Ecol. Prog. Ser., 550, 65–81, https://doi.org/10.3354/meps11687, 2016.
Buck, K. R. and Newton, J.: Fecal Pellet Flux In Dabob Bay During A Diatom Bloom – Contribution Of Microzooplankton, Limnol. Oceanogr., 40, 306–315, https://doi.org/10.4319/lo.1995.40.2.0306, 1995.
Carpenter, E. J., Montoya, J. P., Burns, J., Mulholland, M. R., Subramaniam, A., and Capone, D. G.: Extensive bloom of a N-2-fixing diatom/cyanobacterial association in the tropical Atlantic Ocean, Mar. Ecol. Prog. Ser., 185, 273–283, https://doi.org/10.3354/meps185273, 1999.
Cassar, N., Barnett, B. A., Bender, M. L., Kaiser, J., Hamme, R. C., and Tilbrook, B.: Continuous High-Frequency Dissolved Measurements by Equilibrator Inlet Mass Spectrometry, Anal. Chem., 81, 1855–1864, 2009.
Catlett, D., Peacock, E. E., Crockford, E. T., Futrelle, J., Batchelder, S., Stevens, B. L. F., Gast, R., Zhang, W. G., and Sosik, H. M.: Temperature dependence of parasitoid infection and abundance of a diatom revealed by automated imaging and classification, P. Natl. Acad. Sci. USA, 120, e2303356120, https://doi.org/10.1073/pnas.2303356120, 2023.
Cetinic, I., Poulton, N., and Slade, W. H.: Characterizing the phytoplankton soup: pump and plumbing effects on the particle assemblage in underway optical seawater systems, Opt. Express, 24, 20703–20715, https://doi.org/10.1364/oe.24.020703, 2016.
Chen, B. Z.: Assessing the accuracy of the “two-point” dilution technique, Limnol. Oceanogr. Meth., 13, 521–526, https://doi.org/10.1002/lom3.10044, 2015.
Chen, Z. M., Kwon, Y. O., Chen, K., Fratantoni, P., Gawarkiewicz, G., and Joyce, T. M.: Long-Term SST Variability on the Northwest Atlantic Continental Shelf and Slope, Geophys. Res. Lett., 47, e2019GL085455, https://doi.org/10.1029/2019gl085455, 2020.
Coplen, T. B.: Reporting of stable hydrogen, carbon, and oxygen isotopic abundances – (Technical report), Geothermics, 24, 708–712, 1995.
de Boyer Montegut, C., Madec, G., Fischer, A. S., Lazar, A., and Iudicone, D.: Mixed layer depth over the global ocean: An examination of profile data and a profile-based climatology, J. Geophys. Res.-Ocean., 109, C12003, https://doi.org/10.1029/2004jc002378, 2004.
Dore, J. E., Letelier, R. M., Church, M. J., Lukas, R., and Karl, D. M.: Summer phytoplankton blooms in the oligotrophic North Pacific Subtropical Gyre: Historical perspective and recent observations, Prog. Oceanogr., 76, 2–38, https://doi.org/10.1016/j.pocean.2007.10.002, 2008.
Dugdale, R. C. and Goering, J. J.: Uptake of new and regenerated forms of nitrogen in primary productivity, Limnol. Oceanogr., 12, 196–206, 1967.
Emerson, S.: Annual net community production and the biological carbon flux in the ocean, Global Biogeochem. Cy., 28, 14–28, https://doi.org/10.1002/2013gb004680, 2014.
Field, C. B., Behrenfeld, M. J., Randerson, J. T., and Falkowski, P.: Primary production of the biosphere: Integrating terrestrial and oceanic components, Science, 281, 237–240, https://doi.org/10.1126/science.281.5374.237, 1998.
Fontaine, D. N. and Rynearson, T. A.: Size-fractionated net primary productivity (NPP) estimates based on 13C uptake during cruises along the Northeast U.S. Shelf Long Term Ecological Research (NES-LTER) Transect, ongoing since 2019 version 4, Environmental Data Initiative [data set], https://doi.org/10.6073/pasta/95dde1f0c5bb3da0cac9bc47be2526b0, 2023.
Foster, R. A. and Zehr, J. P.: Characterization of diatom-cyanobacteria symbioses on the basis of nifH, hetR and 16S rRNA sequences, Environ. Microbiol., 8, 1913–1925, https://doi.org/10.1111/j.1462-2920.2006.01068.x, 2006.
Foster, R. A. and Zehr, J. P.: Diversity, Genomics, and Distribution of Phytoplankton- Cyanobacterium Single-Cell Symbiotic Associations, in: Annual Review of Microbiology, Vol. 73, edited by: Gottesman, S., Ann. Rev. Microbiol., 73, 435–456, https://doi.org/10.1146/annurev-micro-090817-062650, 2019.
Friedlingstein, P., Jones, M. W., O'Sullivan, M., Andrew, R. M., Bakker, D. C. E., Hauck, J., Le Quere, C., Peters, G. P., Peters, W., Pongratz, J., Sitch, S., Canadell, J. G., Ciais, P., Jackson, R. B., Alin, S. R., Anthoni, P., Bates, N. R., Becker, M., Bellouin, N., Bopp, L., Chau, T. T. T., Chevallier, F., Chini, L. P., Cronin, M., Currie, K. I., Decharme, B., Djeutchouang, L. M., Dou, X. Y., Evans, W., Feely, R. A., Feng, L., Gasser, T., Gilfillan, D., Gkritzalis, T., Grassi, G., Gregor, L., Gruber, N., Gurses, O., Harris, I., Houghton, R. A., Hurtt, G. C., Iida, Y., Ilyina, T., Luijkx, I. T., Jain, A., Jones, S. D., Kato, E., Kennedy, D., Goldewijk, K. K., Knauer, J., Korsbakken, J. I., Kortzinger, A., Landschutzer, P., Lauvset, S. K., Lefevre, N., Lienert, S., Liu, J. J., Marland, G., McGuire, P. C., Melton, J. R., Munro, D. R., Nabel, J., Nakaoka, S. I., Niwa, Y., Ono, T., Pierrot, D., Poulter, B., Rehder, G., Resplandy, L., Robertson, E., Rodenbeck, C., Rosan, T. M., Schwinger, J., Schwingshackl, C., Seferian, R., Sutton, A. J., Sweeney, C., Tanhua, T., Tans, P. P., Tian, H. Q., Tilbrook, B., Tubiello, F., van der Werf, G. R., Vuichard, N., Wada, C., Wanninkhof, R., Watson, A. J., Willis, D., Wiltshire, A. J., Yuan, W. P., Yue, C., Yue, X., Zaehle, S., and Zeng, J. Y.: Global Carbon Budget 2021, Earth Syst. Sci. Data, 14, 1917–2005, https://doi.org/10.5194/essd-14-1917-2022, 2022.
Garcia, H. E. and Gordon, L. I.: Oxygen solubility in water: better fitting equations, Limnol. Oceanogr., 37, 1307–1312, 1992.
Gaysina, L. A., Saraf, A., and Singh, P.: Chap. 1 – Cyanobacteria in Diverse Habitats, in: Cyanobacteria, edited by: Mishra, A. K., Tiwari, D. N., and Rai, A. N., Academic Press, 2019, 1–28, https://doi.org/10.1016/B978-0-12-814667-5.00001-5, 2019.
Grosse, J., Bombar, D., Hai, N. D., Lam, N. N., and Voss, M.: The Mekong River plume fuels nitrogen fixation and determines phytoplankton species distribution in the South China Sea during low- and high-discharge season, Limnol. Oceanogr., 55, 1668–1680, https://doi.org/10.4319/lo.2010.55.4.1668, 2010.
Hama, T., Miyazaki, T., Ogawa, Y., Iwakuma, T., Takahashi, M., Otsuki, A., and Ichimura, S.: Measurement of photosynthetic production of a marine phytoplankton population using a stable 13C isotope, Mar. Biol., 73, 31–36, https://doi.org/10.1007/BF00396282, 1983.
Hamme, R. C. and Emerson, S.: The solubility of neon, nitrogen and argon in distilled water and seawater, Deep-Sea Res. Pt. I, 51, 1517–1528, 2004.
Hendricks, M. B., Bender, M. L., and Barnett, B. A.: Net and gross O-2 production in the Southern Ocean from measurements of biological O-2 saturation and its triple isotope composition, Deep-Sea Res. Pt. I, 51, 1541–1561, 2004.
Jakobsen, H. H. and Markager, S.: Carbon to chlorophyll ratio for phytoplankton in temperate coastal waters: Seasonal pattersna dn relationship to nutrients, Limnol. Oceanogr., 61, 1853–1868, https://doi.org/10.1002/lno.10338, 2016.
Jin, X., Gruber, N., Dunne, J. P., Sarmiento, J. L., and Armstrong, R. A.: Diagnosing the contribution of phytoplankton functional groups to the production and export of particulate organic carbon, CaCO3, and opal from global nutrient and alkalinity distributions, Global Biogeochem. Cy., 20, GB2015, https://doi.org/10.1029/2005gb002532, 2006.
Juranek, L. W. and Quay, P. D.: In vitro and in situ gross primary and net community production in the North Pacific Subtropical Gyre using labeled and natural abundance isotopes of dissolved O-2, Global Biogeochem. Cy., 19, GB3009, https://doi.org/10.1029/2004GB002384, 2005.
Juranek, L. W. and Quay, P. D.: Using Triple Isotopes of Dissolved Oxygen to Evaluate Global Marine Productivity, in: Annual Review of Marine Science, Vol. 5, edited by: Carlson, C. A., and Giovannoni, S. J., Ann. Rev. Mar. Sci., 5, 503–524, https://doi.org/10.1146/annurev-marine-121211-172430, 2013.
Juranek, L. W., Hamme, R. C., Kaiser, J., Wanninkhof, R., and Quay, P. D.: Evidence of O-2 consumption in underway seawater lines: Implications for air-sea O-2 and CO2 fluxes, Geophys. Res. Lett., 37, L01601, https://doi.org/10.1029/2009GL040423, 2010.
Kalnay, E., Kanamitsu, M., Kistler, R., Collins, W., Deaven, D., Gandin, L., Iredell, M., Saha, S., White, G., Woollen, J., Zhu, Y., Chelliah, M., Ebisuzaki, W., Higgins, W., Janowiak, J., Mo, K. C., Ropelewski, C., Wang, J., Leetmaa, A., Reynolds, R., Jenne, R., and Joseph, D.: The NCEP/NCAR 40-year reanalysis project, Bull. Am. Meteorol. Soc., 77, 437–471, https://doi.org/10.1175/1520-0477(1996)077<0437:TNYRP>2.0.CO;2, 1996.
Kara, A. B., Rochford, P. A., and Hurlburt, H. E.: An optimal definition for ocean mixed layer depth, J. Geophys. Res.-Ocean., 105, 16803–16821, https://doi.org/10.1029/2000jc900072, 2000.
Karl, D. M., Church, M. J., Dore, J. E., Letelier, R. M., and Mahaffey, C.: Predictable and efficient carbon sequestration in the North Pacific Ocean supported by symbiotic nitrogen fixation, P. Natl. Acad. Sci. USA, 109, 1842–1849, https://doi.org/10.1073/pnas.1120312109, 2012.
Karmalkar, A. V. and Horton, R. M.: Drivers of exceptional coastal warming in the northeastern United States, Nat. Clim. Change, 11, 854–860, https://doi.org/10.1038/s41558-021-01159-7, 2021.
Kemp, A. E. S. and Villareal, T. A.: High diatom production and export in stratified waters – A potential negative feedback to global warming, Prog. Oceanogr., 119, 4–23, https://doi.org/10.1016/j.pocean.2013.06.004, 2013.
Kemp, A. E. S. and Villareal, T. A.: The case of the diatoms and the muddled mandalas: Time to recognize diatom adaptations to stratified waters, Prog. Oceanogr., 167, 138–149, https://doi.org/10.1016/j.pocean.2018.08.002, 2018.
Kistler, R., Kalnay, E., Collins, W., Saha, S., White, G., Woollen, J., Chelliah, M., Ebisuzaki, W., Kanamitsu, M., Kousky, V., van den Dool, H., Jenne, R., and Fiorino, M.: The NCEP-NCAR 50-year reanalysis: Monthly means CD-ROM and documentation, Bull. Am. Meteorol. Soc., 82, 247–267, 2001.
Landry, M. R. and Calbet, A.: Microzooplankton production in the oceans, ICES J. Mar. Sci., 61, 501–507, https://doi.org/10.1016/j.icesjms.2004.03.011, 2004.
Landry, M. R., Brown, S. L., Neveux, J., Dupouy, C., J., B., Christensen, S., and Bidigare, R. R.: Phytoplankton growth and microzooplankton grazing in high-nutrient, low-chlorophyll waters of the equatorial Pacific: Community and taxon-specific rate assessments from pigment and flow cytometric analyses, J. Geophys. Res.-Ocean., 108, 8142, https://doi.org/10.1029/2000JC000744, 2003.
Landry, M. R., Brown, S. L., Rii, Y. M., Selph, K. E., Bidigare, R. R., Yang, E. J., and Simmons, M. P.: Depth-stratified phytoplankton dynamics in Cyclone Opal, a subtropical mesoscale eddy, Deep-Sea Res. Pt. I, 55, 1348–1359, https://doi.org/10.1016/j.dsr2.2008.02.001, 2008.
Lange, M. and van Sebille, E.: Parcels v0.9: prototyping a Lagrangian ocean analysis framework for the petascale age, Geosci. Model Dev., 10, 4175–4186, https://doi.org/10.5194/gmd-10-4175-2017, 2017.
Li, G. C., Cheng, L. J., Zhu, J., Trenberth, K. E., Mann, M. E., and Abraham, J. P.: Increasing ocean stratification over the past half-century, Nat. Clim. Change, 10, 1116–1123, https://doi.org/10.1038/s41558-020-00918-2, 2020.
Li, Y., Fratantoni, P. S., Chen, C. S., Hare, J. A., Sun, Y. F., Beardsley, R. C., and Ji, R. B.: Spatio-temporal patterns of stratification on the Northwest Atlantic shelf, Prog. Oceanogr., 134, 123–137, https://doi.org/10.1016/j.pocean.2015.01.003, 2015.
Lindegren, M., Checkley, D. M., Ohman, M. D., Koslow, J. A., and Goericke, R.: Resilience and stability of a pelagic marine ecosystem, P. Roy. Soc. B, 283, https://doi.org/10.1098/rspb.2015.1931, 2016.
Lomas, M. W., Moran, S. B., Casey, J. R., Bell, D. W., Tiahlo, M., Whitefield, J., Kelly, R. P., Mathis, J. T., and Cokelet, E. D.: Spatial and seasonal variability of primary production on the Eastern Bering Sea shelf, Deep-Sea Res. Pt. II, 65–70, 126–140, https://doi.org/10.1016/j.dsr2.2012.02.010, 2012.
Malviya, S., Scalco, E., Audic, S., Vincenta, F., Veluchamy, A., Poulain, J., Wincker, P., Iudicone, D., de Vargas, C., Bittner, L., Zingone, A., and Bowler, C.: Insights into global diatom distribution and diversity in the world's ocean, P. Natl. Acad. Sci. USA, 113, E1516–E1525, https://doi.org/10.1073/pnas.1509523113, 2016.
Manning, C., Stanley, R. H. R., and Lott III, D. E.: Continuous Measurements of Dissolved Ne, Ar, Kr, and Xe Ratios with a Field-deployable Gas Equilibration Mass Spectrometer, Anal. Chem., 88, 3040–3048, https://doi.org/10.1021/acs.analchem.5b03102, 2016.
Manning, C. C., Howard, E. M., Nicholson, D. P., Ji, B. Y., Sandwith, Z. O., and Stanley, R. H. R.: Revising estimates of aquatic gross oxygen production by the triple oxygen isotope method to incorporate the local isotopic composition of water, Geophys. Res. Lett., 44, 10511–10519, https://doi.org/10.1002/2017GL074375, 2017a.
Manning, C. C., Stanley, R. H. R., Nicholson, D. P., Smith, J. M., Pennington, J. T., Fewings, M. R., Squibb, M. E., and Chavez, F. P.: Impact of recently upwelled water on productvity investigated using in situ and incubation-based methods in Monterey Bay, J. Geophys. Res.-Ocean., 122, 1901–1926, https://doi.org/10.1002/2016JC012306, 2017b.
Marchetti, A. and Cassar, N.: Diatom elemental and morphological changes in response to iron limitation: a brief review with potential paleoceanographic applications, Geobiology, 7, 419–431, https://doi.org/10.1111/j.1472-4669.2009.00207.x, 2009.
Margalef, R.: Life-forms of phytoplankton as survival alternatives in an unstable environment, Oceanol. Ac., 1, 493–509, 1978.
Marrec, P., McNair, H., Franze, G., Morison, F., Strock, J. P., and Menden-Deuer, S.: Seasonal variability in planktonic food web structure and function of the Northeast US Shelf, Limnol. Oceanogr., 66, 1440–1458, https://doi.org/10.1002/lno.11696, 2021.
Mehta, A.: Spatial and Temporal Heterogeneity in Net Community Production in the Crossshelf Direction of the Atlantic Northeastern Shelf, undergraduate thesis, Chemistry, Wellesley College, Wellesley, MA USA, 86 pp., 2022.
Menden-Deuer, S. and Lessard, E.: Menden-Deuer S, Lessard EJ.. Carbon to volume relationships for dinoflagellates, diatoms, and other protest plankton, Limnol. Oceanogr. 45, 569–579, https://doi.org/10.4319/lo.2000.45.3.0569, 2000.
Menden-Deuer, S. and Marrec, P.: Phytoplankton growth and microzooplankton grazing rates from NES-LTER transect cruises, ongoing since 2018, Environmental Data Initiative [data set], https://doi.org/10.6073/pasta/b3366, 2023.
Micheli, F., Cottingham, K. L., Bascompte, J., Bjornstad, O. N., Eckert, G. L., Fischer, J. M., Keitt, T. H., Kendall, B. E., Klug, J. L., and Rusak, J. A.: The dual nature of community variability, Oikos, 85, 161–169, https://doi.org/10.2307/3546802, 1999.
Millero, F. J. and Poisson, A.: International One-Atmosphere Equation of State of Seawater, Deep-Sea Res. Pt. A, 28, 625–629, 1981.
Moberg, E. A. and Sosik, H. M.: Distance maps to estimate cell volume from two-dimensional plankton images, Limnol. Oceanogr. Meth., 10, 278–288, https://doi.org/10.4319/lom.2012.10.278, 2012.
Morison, F., Franzè, G., Harvey, E., and Menden-Deuer, S.: Light fluctuations are key in modulating plankton trophic dynamics and their impact on primary production, Limnol. Oceanogr. Lett., 5, 346–353, https://doi.org/10.1002/lol2.10156, 2020.
Mouw, C. B. and Yoder, J. A.: Primary production calculations in the Mid-Atlantic Bight, including effects of phytoplankton community size structure, Limnol. Oceanogr., 50, 1232–1243, 2005.
O'Reilly, J. E. and Zetlin, C.: Seasonal, horizontal and vertical distribution of phytoplankton chlorophyll a in the Northeast U.S., Cont. Shelf Ecosyst., NOAA technical report NMFS, 0892-8908, 126 pp., 1998.
Oliver, H., Zhang, W. G., Archibald, K. M., Hirzel, A. J., Smith, W. O., Sosik, H. M., Stanley, R. H. R., and McGillicuddy, D. J.: Ephemeral Surface Chlorophyll Enhancement at the New England Shelf Break Driven by Ekman Restratification, J. Geophys. Res.-Ocean., 127, e2021JC017715, https://doi.org/10.1029/2021jc017715, 2022.
Oliver, H., Zhang, W. F., Smith, W. O., Alatalo, P., Chappell, P. D., Hirzel, A. J., Selden, C. R., Sosik, H. M., Stanley, R. H. R., Zhu, Y. F., and McGillicuddy, D. J.: Diatom Hotspots Driven by Western Boundary Current Instability, Geophys. Res. Lett., 48, e2020GL091943, https://doi.org/10.1029/2020gl091943, 2021.
Olson, R. J. and Sosik, H. M.: A submersible imaging-in-flow instrument to analyze nano-and microplankton: Imaging FlowCytobot, Limnol. Oceanogr. Meth., 5, 195–203, https://doi.org/10.4319/lom.2007.5.195, 2007.
Palevsky, H. I., Quay, P. D., Lockwood, D. E., and Nicholson, D. P.: The annual cycle of gross primary product ion, net community production, and export efficiency across the North Pacific Ocean, Global Biogeochem. Cy., 30, 361–380, https://doi.org/10.1002/2015GB005318, 2016.
Parsons, T. R., Maita, Y., and Lalli, C. M.: A Manual of Chemical & Biological Methods for Seawater Analysis, Pergamon, 142–149, https://doi.org/10.1016/C2009-0-07774-5, 1984.
Prokopenko, M. G., Pauluis, O. M., Granger, J., and Yeung, L. Y.: Exact evaluation of gross photosynthetic production from the oxygen triple-isotope composition of O2: Implications for the net-to-gross primary production ratios, Geophys. Res. Lett., 38, L1460310, https://doi.org/10.1029/2011GL047652, 2011.
Puigcorbe, V., Benitez-Nelson, C. R., Masque, P., Verdeny, E., White, A. E., Popp, B. N., Prahl, F. G., and Lam, P. J.: Small phytoplankton drive high summertime carbon and nutrient export in the Gulf of California and Eastern Tropical North Pacific, Global Biogeochem. Cy., 29, 1309–1332, https://doi.org/10.1002/2015gb005134, 2015.
Pyle, A. E., Johnson, A. M., and Villareal, T. A.: Isolation, growth, and nitrogen fixation rates of the Hemiaulus-Richelia (diatom-cyanobacterium) symbiosis in culture, Peerj, 8, e10115, https://doi.org/10.7717/peerj.10115, 2020.
Reuer, M. K., Barnett, B. A., Bender, M. L., Falkowski, P. G., and Hendricks, M. B.: New estimates of Southern Ocean biological production rates from ratios and the triple isotope composition of O-2, Deep-Sea Res. Pt. I, 54, 951–974, 2007.
Robinson, C. and Williams, P. J. l. B.: Respiration and its measurement in surface marine waters, in: Respiration in Aquatic Ecosystems, edited by: del Giorgio, P. and Williams, P., Oxford, Oxford Academic, https://doi.org/10.1093/acprof:oso/9780198527084.003.0009, 2005.
Russakovsky, O., Deng, J., Su, H., Krause, J., Satheesh, S., Ma, S., Huang, Z. H., Karpathy, A., Khosla, A., Bernstein, M., Berg, A. C., and Fei-Fei, L.: ImageNet Large Scale Visual Recognition Challenge, Int. J. Comput. Vision, 115, 211–252, https://doi.org/10.1007/s11263-015-0816-y, 2015.
Schmoker, C., Hernandez-Leon, S., and Calbet, A.: Microzooplankton grazing in the oceans: impacts, data variability, knowledge gaps and future directions, J. Plankton Res., 35, 691–706, https://doi.org/10.1093/plankt/fbt023, 2013.
Shearman, R. K. and Lentz, S. J.: Long-Term Sea Surface Temperature Variability along the US East Coast, J. Phys. Oceanogr., 40, 1004–1017, https://doi.org/10.1175/2009jpo4300.1, 2010.
Shoemaker, L. G., Hallett, L. M., Zhao, L., Reuman, D. C., Wang, S. P., Cottingham, K. L., Hobbs, R. J., Castorani, M. C. N., Downing, A. L., Dudney, J. C., Fey, S. B., Gherardi, L. A., Lany, N., Portales-Reyes, C., Rypel, A. L., Sheppard, L. W., Walter, J. A., and Suding, K. N.: The long and the short of it: Mechanisms of synchronous and compensatory dynamics across temporal scales, Ecology, 103, e3650, https://doi.org/10.1002/ecy.3650, 2022.
Sosik, H. M., Crockford, E. T., Peacock, E., Rynearson, T., Fontaine, D., Menden-Deuer, S., Marrec, P., and OOI CGSN Data Team: Size-fractionated chlorophyll from water column bottle samples collected during NES-LTER Transect cruises, ongoing since 2017, Environmental Data Initiative [data set], https://doi.org/10.6073/pasta/a8170, 2023a.
Sosik, H. M., Futrelle, J., Peacock, E. E., and Crockford, E. T.: IFCB Dashboard NES-LTER Transect, IFCB [data set], https://ifcb-data.whoi.edu/timeline?dataset=NESLTER_transect, last access: 21 December 2023b.
Sosik, H. M., Futrelle, J., Peacock, E. E., and Crockford, E. T.: IFCB Dashboard NES-LTER Broadscale, IFCB [data set], https://ifcb-data.whoi.edu/timeline?dataset=NESLTER_broadscale, last access: 21 December 2023c.
Sosik, H. M., Peacock, E. E., and Crockford, E. T.: Abundance and biomass of Hemiaulus on the Northeast U.S. Shelf from 2013 to 2023 determined by Imaging FlowCytobot, Environmental Data Initiative [data set], https://doi.org/10.6073/pasta/295ae, 2024.
Spitzer, S.: An Analysis of Diatom Growth Rate and the Implications for the Biodiesel Industry, Occum's Razor, 5, 6, https://cedar.wwu.edu/orwwu/vol5/iss1/6 (last access: 21 December 2023), 2015.
Stanley, R. H. R., Sandwith, Z. O., and Williams, W. J.: Rates of summertime biological productivity in the Beaufort Gyre: A comparison between the low and record-low ice conditions of August 2011 and 2012, J. Mar. Syst., 147, 29–44, 2015.
Stanley, R. H. R., Jenkins, W. J., Doney, S. C., and Lott III, D. E.: Noble Gas Constraints on Air-Sea Gas Exchange and Bubble Fluxes, J. Geophys. Res.-Ocean., 114, C11020, https://doi.org/10.1029/2009JC005396, 2009.
Stanley, R. H. R., Kirkpatrick, J. B., Barnett, B., Cassar, N., and Bender, M. L.: Net community production and gross production rates in the Western Equatorial Pacific, Global Biogeochem. Cy., 24, GB4001, https://doi.org/10.1029/2009GB003651, 2010.
Stanley, R. H., Cahill, K., and Sandwith, Z. O.: Oxygen-argon dissolved gas ratios using Equilibrator Inlet Mass Spectrometry (EIMS) and triple oxygen isotopes (TOI) from NES-LTER Transect cruises, ongoing since 2018, Environmental Data Initiative [data set], https://doi.org/10.6073/pasta/97962, 2024a.
Stanley, R. H., Sandwith, Z. O., Mehta, A., and Aldrett, D.: Net community production (NCP) and gross oxygen production (GOP), based on oxygen-argon ratios and triple oxygen isotopes, from seasonal NES-LTER Transect cruises in 2018, Environmental Data Initiative [data set], https://doi.org/10.6073/pasta/9a87e, 2024b.
Stanley, R. H., Aldrett, D., Castillo Cieza, S., Mehta, A., Sandwith, Z. O., and Shrives, R.: Net community production (NCP) and gross oxygen production (GOP), based on oxygen-argon ratios and triple oxygen isotopes, from seasonal NES-LTER Transect cruises in 2019, Environmental Data Initiative [data set], https://doi.org/10.6073/pasta/4245ab, 2024c.
Stanley, R. H., Aldrett, D., Cahill, K., Castillo Cieza, S., and Shrives, R.: Net community production (NCP) and gross oxygen production (GOP), based on oxygen-argon ratios and triple oxygen isotopes, from seasonal NES-LTER Transect cruises in 2020, Environmental Data Initiative [data set], https://doi.org/10.6073/pasta/bfb4460, 2024d.
Stanley, R. H., Cahill, K., Castillo Cieza, S., Mehta, A., and Shrives, R.: Net community production (NCP) and gross oxygen production (GOP), based on oxygen-argon ratios and triple oxygen isotopes, from seasonal NES-LTER Transect cruises in 2021, Environmental Data Initiative [data set], https://doi.org/10.6073/pasta/3a05fe, 2024e.
Stanley, R. H., Cahill, K., Castillo Cieza, S., and Shigihara, F.: Net community production (NCP) and gross oxygen production (GOP), based on oxygen-argon ratios and triple oxygen isotopes, from seasonal NES-LTER Transect cruises in 2022, Environmental Data Initiative [data set], https://doi.org/10.6073/pasta/12d7cb, 2024f.
Subramaniam, A., Yager, P. L., Carpenter, E. J., Mahaffey, C., Bjorkman, K., Cooley, S., Kustka, A. B., Montoya, J. P., Sanudo-Wilhelmy, S. A., Shipe, R., and Capone, D. G.: Amazon River enhances diazotrophy and carbon sequestration in the tropical North Atlantic Ocean, P. Natl. Acad. Sci. USA, 105, 10460–10465, https://doi.org/10.1073/pnas.0710279105, 2008.
Szegedy, C., Vanhoucke, V., Ioffe, S., Shlens, J., and Wojna, Z.: Rethinking the Inception Architecture for Computer Vision, 2016 IEEE Conference on Computer Vision and Pattern Recognition (CVPR), 27–30 June 2016, 2818–2826, https://doi.org/10.1109/CVPR.2016.308, 2016.
Tang, W. Y., Cerdan-Garcia, E., Berthelot, H., Polyviou, D., Wang, S. V., Baylay, A., Whitby, H., Planquette, H., Mowlem, M., Robidart, J., and Cassar, N.: New insights into the distributions of nitrogen fixation and diazotrophs revealed by high-resolution sensing and sampling methods, Isme J., 14, 2514–2526, https://doi.org/10.1038/s41396-020-0703-6, 2020.
Teeter, L., Hamme, R. C., Ianson, D., and Bianucci, L.: Accurate estimation of net community production from measurements, Global Biogeochem. Cy., 32, 1163–1181, https://doi.org/10.1029/2017GB005874, 2018.
Townsend, D. W., Thomas, A. C., Mayer, L. M., Thomas, A. J., and Quinlan, J. A.: Oceanography of the Northwest Atlantic continenetal shelf, in: The Sea, edited by: Robinson, A. R. and Brink, K. H., Harvard University Press, 119–167, 2006.
Twining, B. S., Nodder, S. D., King, A. L., Hutchins, D. A., LeCleir, G. R., DeBruyn, J. M., Maas, E. W., Vogt, S., Wilhelm, S. W., and Boyd, P. W.: Differential remineralization of major and trace elements in sinking diatoms, Limnol. Oceanogr., 59, 689–704, https://doi.org/10.4319/lo.2014.59.3.0689, 2014.
Villareal, T. A.: Laboratory culture and preliminary characterization of the nitrogen-fixing Rhizosolenia-Richelia symbiosis, Mar. Ecol., 11, 117–132, 1990.
Villareal, T. A., Adornato, L., Wilson, C., and Schoenbaechler, C. A.: Summer blooms of diatom-diazotroph assemblages and surface chlorophyll in the North Pacific gyre: A disconnect, J. Geophys. Res.-Ocean., 116, C03001, https://doi.org/10.1029/2010jc006268, 2011.
Wang, S., Tang, W. Y., Delage, E., Gifford, S., Whitby, H., Gonzalez, A. G., Eveillard, D., Planquette, H., and Cassar, N.: Investigating the microbial ecology of coastal hotspots of marine nitrogen fixation in the western North Atlantic, Sci. Rep., 11, 5508, https://doi.org/10.1038/s41598-021-84969-1, 2021.
Yoder, J. A., Schollaert, S. E., and O'Reilly, J. E.: Climatological phytoplankton chlorophyll and sea surface temperature patterns in continental shelf and slope waters off the northeast US coast, Limnol. Oceanogr., 47, 672–682, 2002.
Zhang, W. F., Alatalo, P., Crockford, T., Hirzel, A. J., Meyer, M. G., Oliver, H., Peacock, E., Petitpas, C. M., Sandwith, Z., Smith, W. O., Sosik, H. M., Stanley, R. H. R., Stevens, B. L. F., Turner, J. T., and McGillicuddy, D. J.: Cross-shelf exchange associated with a shelf-water streamer at the Mid-Atlantic Bight shelf edge, Prog. Oceanogr., 210, 102931, https://doi.org/10.1016/j.pocean.2022.102931, 2023.