the Creative Commons Attribution 4.0 License.
the Creative Commons Attribution 4.0 License.
 | 08 Jan 2024
Root distributions predict shrub–steppe responses to precipitation intensity
Andrew Kulmatiski
Martin C. Holdrege
Cristina Chirvasă
Karen H. Beard
Precipitation events are becoming more intense around the world, changing the way water moves through soils and plants. Plant rooting strategies that sustain water uptake under these conditions are likely to become more abundant (e.g., shrub encroachment). Yet, it remains difficult to predict species responses to climate change because we typically do not know where active roots are located or how much water they absorb. Here, we applied a water tracer experiment to describe forb, grass, and shrub root distributions. These measurements were made in 8 m by 8 m field shelters with low or high precipitation intensity. We used tracer uptake data in a soil water flow model to estimate how much water respective plant root tissues absorb over time. In low-precipitation-intensity plots, deep shrub roots were estimated to absorb the most water (93 mm yr−1) and shrubs had the greatest aboveground cover (27 %). Grass root distributions were estimated to absorb an intermediate amount of water (80 mm yr−1) and grasses had intermediate aboveground cover (18 %). Forb root distributions were estimated to absorb the least water (79 mm yr−1) and had the least aboveground cover (12 %). In high-precipitation-intensity plots, shrub and forb root distributions changed in ways that increased their water uptake relative to grasses, predicting the increased aboveground growth of shrubs and forbs in these plots. In short, water uptake caused by different rooting distributions predicted plant aboveground cover. Our results suggest that detailed descriptions of active plant root distributions can predict plant growth responses to climate change in arid and semi-arid ecosystems.
- Article
(3741 KB) - Full-text XML
-
Supplement
(1588 KB) - BibTeX
- EndNote


Changes in precipitation patterns are an important component of climate change (Humphrey et al., 2021; Jiao et al., 2021; J. Liu et al., 2020). Precipitation intensification, in particular, has been predicted and observed around the world (J. Liu et al., 2020; Giorgi et al., 2011). Precipitation intensification is predicted to continue because warmer air can hold more moisture (i.e., roughly 7 ) resulting in fewer, but larger precipitation events (O'Gorman and Muller, 2010; Trenberth et al., 2003).
The implications of precipitation intensification for vegetation remain unclear (Good and Caylor, 2011; Knapp et al., 2008; Liu et al., 2018). In arid and semi-arid areas, small (∼ 1–5 mm) events are common and often evaporate before reaching the rooting zone (Lauenroth and Bradford, 2009). With larger precipitation events (∼ 5–20 mm), less water is lost to evaporation and water percolates deeper into the soil (Sala et al., 2015). In arid systems, decreased evaporation is likely to increase growth of shallow-rooted plants (e.g., grasses; Post and Knapp, 2021). In semi-arid systems, deeper percolation is likely to increase growth of deeper-rooted species (e.g., shrubs; Gherardi and Sala, 2015; Xu et al., 2015; Holdrege et al., 2021). In subhumid and humid systems, however, increasing event size may increase runoff and percolation below the rooting zone, resulting in little change to plant productivity and/or tree encroachment (Jones et al., 2016; Slette et al., 2022; Berry and Kulmatiski, 2017; Knapp et al., 2008).
Thus, predicting whether different plants will grow more or less in response to precipitation intensification requires an understanding of both soil water flow and rooting distributions (D'Onofrio et al., 2019; Schreiner-McGraw et al., 2020; Slette et al., 2022; Xu et al., 2015). Soil water flow models have become very effective at describing water movement through the soil profile and into plant roots (Šimůnek et al., 2016). It is fairly easy to parameterize and validate these models in plant monocultures or at the ecosystem level. It is much more difficult to understand how plant communities will respond to climate change because it is difficult to tell roots apart or measure how much water roots absorb (Case et al., 2020; Smithwick et al., 2014; Erktan et al., 2018).
Root biomass is different than water uptake. Root biomass distributions have long been used to infer the timing and extent of water uptake (Silvertown et al., 2015). However, there are many reasons why root biomass may not be correlated with water uptake (Cai et al., 2018). Many roots are structural and do not actively absorb water (Zarebanadkouki et al., 2019). Even fine roots that do absorb water cannot absorb water from dry soils (Šimůnek et al., 2016). Further, root water potential, aquaporin density or activity, and stem conductance can all affect water uptake rates (Dybzinski et al., 2019; Zarebanadkouki et al., 2019). Consequently, root biomass may not be a good indicator of water uptake.
Natural abundance stable isotope techniques provide a clearer picture of water uptake than root biomass, but they typically only distinguish “shallow” from “deep” root distributions (Dubbert and Werner, 2019; Rothfuss and Javaux, 2017). This is a problem because small differences in root distributions can have large effects on water uptake (Kulmatiski et al., 2020b). Depth-controlled tracer techniques can provide more detailed descriptions of active root distributions, but they are more difficult to perform (Rothfuss and Javaux, 2017; Rasmussen and Kulmatiski, 2021). Neither of these techniques, however, estimate the total amount of water moving through plant roots (McMurtrie and Näsholm, 2018; Rasmussen and Kulmatiski, 2021). Estimates of total water uptake require other techniques, such as stemflow measurements or the use of soil water flow models to estimate water uptake over time (Cai et al., 2018; Schymanski et al., 2008). Yet, few studies measure active rooting distributions, let alone the amount of water absorbed by these distributions (Dybzinski et al., 2019). One recent study that did estimate water uptake found that, contrary to long held assumptions, deep roots typically absorb more water than shallow roots (Kulmatiski and Beard, 2022).
One important additional complexity in understanding root water uptake is that root distributions change over time (Barberon et al., 2016; Guderle et al., 2018; Schymanski et al., 2008). Thus, it is important to measure root activity over time and as resource availability changes (L. Liu et al., 2020). Plants that can adapt to changes in resource availability are more likely to have positive growth responses than plants with fixed rooting patterns (Berry and Kulmatiski, 2017; Zhou et al., 2019).
Our goal was to test if root distributions could predict plant growth and responses to precipitation intensity. To do this, (1) we measured tracer uptake by forbs, grasses, and shrubs in the fifth year of a 6-year field experiment with low- and high-precipitation-intensity plots; (2) we used a soil water flow model to estimate water uptake by these different root distributions under low- and high-precipitation intensity conditions; and (3) we compared our estimates of water uptake to plant growth in the field experiment. We performed this research in an experimental setting where a previous paper reported that 3 years of treatment with larger precipitation events “pushed” water deeper into the soil and increased shrub growth (Holdrege et al., 2021). Here, we add to findings from that paper by reporting vegetation responses for an additional 2 treatment years and 1 post-treatment year and, more importantly, by using a tracer experiment to measure forb, grass, and shrub root distributions in experimentally manipulated plots. Broadly, this approach allowed us to describe the hydrological niches of forbs, grasses, and shrubs. It also allowed us to test if the amount of water these niches could absorb predicted plant growth observed in a field experiment. To be clear, we estimate the amount of water that forb, grass, and shrub root distributions can be expected to absorb assuming that each rooting distribution has the same transpiration demand. This approach isolates the effects of root distributions from other effects such as leaf area, stomatal conductance, or aerodynamic resistance. We predicted that shrubs dominate in this semi-arid ecosystem because their deeper roots provide access to a larger soil water pool than shallower grass or forb roots. We also predicted that larger precipitation events would push water deeper into the soil, providing an advantage to plants with deeper and more flexible rooting patterns (i.e., shrubs and forbs).
2.1 Study area
We conducted this research at the Hardware Ranch Wildlife Management Area (41∘36′53′′ N, 111∘34′1′′ W; 1760 m), Utah, USA. Mean annual precipitation is 468 mm, with 170 mm (36 %) falling as snow, primarily between December and March (Global Historical Climatology Network – Daily (GHCN-Daily), Version 3, Menne et al., 2012). During the experiment, 2016 and 2017 were notably wet (620 and 663 mm precipitation), 2020 was notably dry (313 mm precipitation), and the remaining years received between 420 and 481 mm of precipitation. Mean monthly temperatures range from −4 ∘C in January to 23 ∘C in July (Menne et al., 2012). Soils are derived from quartzite and sandstone and are in the Yeates Hollow series (well-drained, cobbly silty clay loam; Soil Survey Staff, 2018).
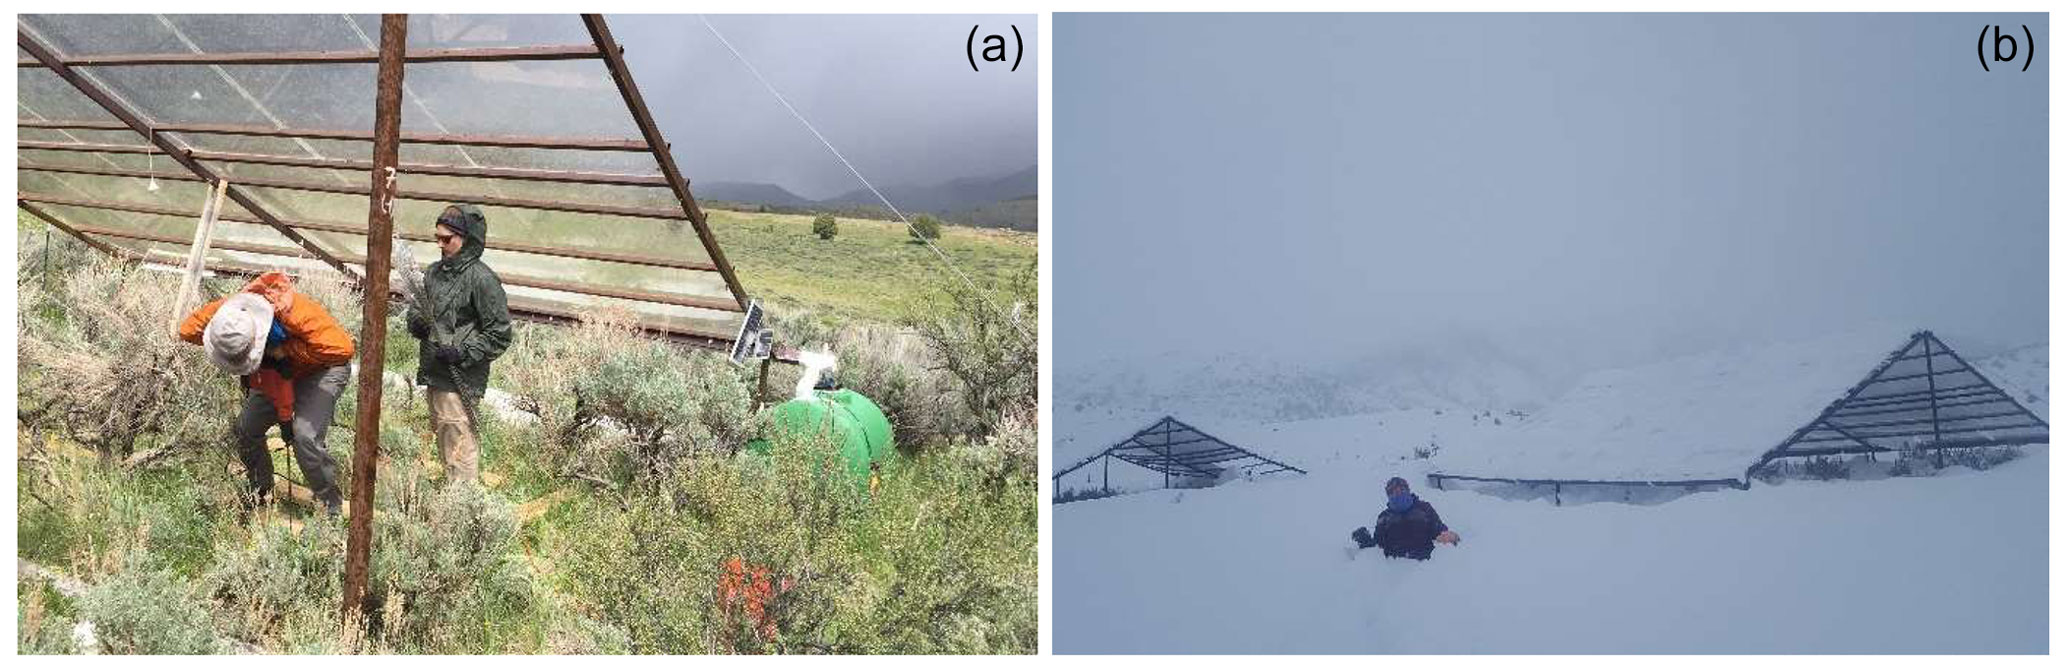
Figure 1Photographs of precipitation manipulation shelters on site. Eleven precipitation manipulation shelters (8 m × 8 m) with plastic roofs collected and redeposited precipitation through as sprinkler system (a) and shoveling (b) as fewer, larger events. Tracer injections (a) were performed in plots to describe active root distributions of forbs, grasses, and shrubs. Treatments were applied between January 2016 and September 2020 and vegetation growth measurements continued through 2021, 1 year after treatment removal.
Common plant species in this sagebrush-dominated rangeland include shrubs, i.e., big sagebrush (Artemisia tridentata Nutt. ssp. vaseyana [Rydb.] Beetle; 25 % cover), bitterbrush (Purshia tridentata [Pursh] DC.; 4 % cover), and rabbitbrush (Chrysothamnus viscidiflorus [Hook.] Nutt.; 2 % cover); forbs, i.e., Aster (Aster kingii; 3 % cover), western yarrow (Achillea millefolium; 3 % cover), and violet (viola species; 2 % cover); and grasses, i.e., meadow brome (Bromus commutatus Schrad.; 10 % cover), bluebunch wheatgrass (Pseudoroegneria spicata [Pursh] Á. Löve; 6 % cover), and prairie Junegrass (Koeleria macrantha [Ledeb.] Schult.; 1 % cover). Aboveground net primary productivity at the site is approximately 145 (Holdrege et al., 2021). Cattle were excluded during the experiment, but livestock have grazed the site for over 100 years. Native ungulates (elk and deer), rabbits, and rodents are common and accessed the plots.
2.2 Experimental treatments
In June 2015, we established 14 plots (8 m × 8 m each) in a grid with at least 15 m between plots. Three plots were shelter-free controls. We covered the remaining 11 plots with a clear Plexiglass® acrylic (6.35 mm thick) roof (Fig. 1). We collected rainwater from roofs in two holding tanks per shelter. Float switches and water pumps sprayed collected water through six sprinkler heads (1 m height) at a rate that is in the upper quartile of precipitation intensity for the site (26 mm h−1; Holdrege et al., 2021). We manipulated precipitation between January 2016 and September 2020 (five growing seasons), when shelters were removed. Soil and vegetation responses from the first three growing seasons (2016, 2017, 2018) are reported elsewhere (Holdrege et al., 2021). Here we report vegetation responses for two additional treatment seasons (2019 and 2020) and for one post-treatment season (2021). We also conducted a depth-controlled tracer experiment to measure active root distributions in the last treatment season (2020).
We designed treatments to create precipitation event sizes expected with temperature changes from −1 to +10 ∘C relative to current temperatures. Consistent with the Clausius–Clapeyron relationship, we designed event sizes to increase by 7 % per 1 ∘C of warming (O'Gorman and Muller, 2010; Holdrege et al., 2021; Supplement). Thus, temperature increases of 1, 2, 3, 5, and 10 ∘C resulted in minimum precipitation event sizes of 2, 3, 4, 8 and 18 mm. Minimum event sizes were deposited over roughly 5 to 15 min at an intensity that is in the upper 5 % of observed mm min−1 rainfall intensities. The distributions of precipitation events and the coefficient of variation in precipitation events are described in the Supplement. To expand our inference, we added a treatment associated with −1 ∘C temperature change. In this treatment, we manually triggered irrigation multiple times during each growing season to deposit additional 1 mm events (hereafter referred to as the 1 mm treatment). Because storms often resulted in more than one minimum event per day, the mean daily event sizes associated with treatments were 4.8, 5.3, 6.2, 7.2, 8.4, 10.8, and 19.4 mm for the 1, control, 2, 3, 4, 8, and 18 mm treatments (Holdrege et al., 2021).
We based snow addition frequencies on the historical distribution of snow events > 4 cm (Menne et al., 2012). We estimated that each 1 ∘C would result in a 7 % change in precipitation event size which meant there would be a median of 14, 13, 11, 10, 8, 7, and 4 snow events per year for the 1, control, 2, 3, 4, 8, and 18 mm treatments. In control plots, we removed snow (> 4 cm) from the roofs and immediately shoveled it back onto the plot. For treatments to receive fewer larger snow events, we removed snow off the shelter roofs and allowed it to accumulate on plastic sheeting adjacent to plots before shoveling it back onto the plots. As with rain, all treatments received the same amount of total snow, and only differed in the timing and magnitude of the events. We established the experiment using a regression design with a range of precipitation intensities, but here we group data into high- (18, 8, 4, 4, and 4) and low-precipitation-intensity (1, control, control, control, 2, and 3 mm) treatments.
2.3 Abiotic treatment responses
Shelters caused 0.6 ∘C warming but decreased wind speed and increased relative humidity, which resulted in little change in evapotranspiration demand inside and outside of plots (Holdrege et al., 2021). During the first 3 years (2016–2018), high-intensity treatments pushed soil water deeper into the soil and increased soil water availability (presumably by decreasing evaporative losses from small precipitation events; Holdrege et al., 2022). Here we report soil moisture data from 2019 and 2020 (sensors became unreliable or non-functional in 2021). We measured soil moisture using heat dissipation sensors located at six depths in one treated and one control plot (229L heat dissipation sensors, Campbell Scientific, Logan, UT, USA; Flint et al., 2002). We converted water potential data to volumetric water content using site-specific soil characteristic curves for shallow (0–30 cm) and deep (30–100 cm) soils. Because soil moisture data are from one plot and lack spatial inference, we report values but do not perform statistical tests for treatment differences.
2.4 Active root distributions: tracer uptake
We used a depth-controlled hydrologic tracer experiment to describe the vertical distribution of tracer uptake by forbs, grasses, and shrubs in low- and high-intensity precipitation plots (Kulmatiski et al., 2010). We performed tracer injections in four low-precipitation treatment plots (1, control, control, 2 mm) and four high-precipitation plots (4, 4, 4, and 18 mm change). Four circular subplots (1.5 m diameter) were located near the center of each of the four quadrants in each 8 m by 8 m plot so that the edge of each subplot was separated by 2.7 m. Previous studies indicated that little to no tracer will be absorbed from 2.7 m away during the 2 d sampling period (Holdrege et al., 2021; Kulmatiski et al., 2010; Berry and Kulmatiski, 2017). We randomly assigned each subplot to a target depth (10, 20, 45, and 75 cm). We drilled 68 pilot holes in a 15 cm by 15 cm grid pattern to the target depth using a 10 mm drill bit and a hammer drill (TE-60, Hilti North America, Texas). In each pilot hole, we injected 1 mL of 70 % deuterium oxide (D2O). To rinse the syringe and prevent contamination in the injection hole, we then injected 2 mL of rinse water. Though injections certainly increased water availability at the point of injection, the 204 mL of tracer and rinse water injected to each 1.8 m2 plot was equivalent to a trivial 0.1 mm of precipitation event and was expected to act as a tracer and not a resource pulse. We performed these injections early and late in the growing season (May and July 2020).
Two days following injections, we clipped non-transpiring tissues from dominant species in each plot with triple-rinsed clippers and placed them in custom-made 19 mm wide, medium-walled borosilicate tubes, sealed with Parafilm and placed on ice. We often composited samples from multiple individuals of the same species into a single sample tube. We collected replicate composite samples from each species when possible. We brought samples to freezer storage within a few hours. We extracted sample water using batch cryogenic distillation. D2O concentrations were measured using cavity ring-down spectrometry (Picarro L2120-i; CA). Recent studies demonstrating fractionation by plant species and tissues and cryogenic distillation in natural abundance isotope studies are not relevant to this experiment because tracer concentrations were orders of magnitude greater than potential fractionation by these sources.
2.5 Estimated water uptake
We used tracer uptake to describe the distribution of active roots by depth. To estimate water flow into active roots over time, we used the water flow model Hydrus 1D (Šimůnek, van Genuchten and Šejna, 2016; Mazzacavallo and Kulmatiski, 2015). We first parameterized this model with community-level root data reported in Holdrege et al. (2021). We executed the model for low- and high-precipitation-intensity conditions. We used ambient observed precipitation for low-precipitation-intensity simulations and a tipping-bucket model that “collected and redeposited” only 8 mm precipitation events to create precipitation for the high-intensity precipitation simulation. We selected the 8 mm precipitation event treatment because it represented a mean precipitation event size among the plots where tracers were applied. This reduced the number of model simulations needed, but we expected it to provide reasonable representation of water flow through soils with small or large precipitation events. These simulations estimate total plant community transpiration. We partitioned this community-level water uptake into forb, grass, and shrub components using the proportion of tracer uptake by depth by different plant growth forms (i.e., assuming symmetric root competition; Cahill and Casper, 2000; Kulmatiski and Beard, 2022). To be clear, leaf area was not included in these estimates; rather, we isolated the effect of root distributions on water uptake.
More specifically, we performed an “initialization” model simulation run to identify soil hydraulic parameters and to produce estimates of soil moisture over time that could be validated against observed soil moisture. This initialization run used initially observed soil moisture, new root area, soil texture, soil bulk density, and microclimate data (Holdrege et al., 2021). We used the neural network predictions within Hydrus 1D to select hydraulic parameters. Within Hydrus 1D, the Penman–Monteith sub-model estimated evapotranspiration, the van Genuchten–Mualem water flow sub-model simulated unsaturated soil hydraulic properties, and the Feddez sub-model for alfalfa simulated root water uptake. We assumed plant height to be 60 cm, and leaf area was calculated by Hydrus 1D from plant height associated with an alfalfa crop. We used a critical stress index of 1.0 because we measured root distributions directly (Kulmatiski et al., 2020b). Again, we held plant height and critical stress values constant for forb, grass, and shrub root distributions so that we could isolate the effects of root distributions from the effects of other factors, such as aerodynamic resistance, stomatal conductance, leaf area, leaf water potential, etc. A previous study including these effects (Mazzacavallo and Kulmatiski, 2015) found that root distributions were the dominant factor determining water uptake.
Following the initialization run, we conducted a 5-year simulation of community-level water uptake using climate data from 2016–2020. We then multiplied these values by the proportion of forb, grass, and shrub tracer uptake to separate total water uptake into forb, grass, and shrub components. For example, if tracer data indicated that 2 %, 2 %, and 4 % of forb, grass, and shrub tracer uptake occurred at 25–26 cm depths, then we estimated that shrubs absorbed 50 % (i.e., 4 %(2 % + 2 % + 4 %)) of total water uptake at that depth (Kulmatiski et al., 2020b). Early-season community-level water uptake (i.e., Hydrus simulation) values were multiplied by early-season tracer uptake proportions by depth, and late-season community-level water uptake was multiplied by late-season tracer uptake. This approach produces estimates of water uptake that are consistent with ecosystem-level water flow and correlated with plant landscape abundance (Mazzacavallo and Kulmatiski, 2015; Kulmatiski et al., 2020a). The final product of this approach was estimates of the amount of water forb, grass, and shrub roots can be expected to absorb from different soil depths over time. We repeated this process with precipitation patterns that reflected our high-intensity treatment (Holdrege et al., 2021). Essentially, we used a tipping-bucket model that collected observed precipitation and deposited it only as 8 mm events. We partitioned these water uptake values into forb, grass, and shrub components using the tracer uptake data collected from the high-precipitation-intensity plots.
2.6 Biotic treatment responses
Every June (peak growing season), we determined percent cover by plant species using visual estimation in nine, permanent 1 m × 1 m subplots in each plot. We measured shrub stem radius on the main stems of the three Artemisia tridentata closest to the center of the plot using point dendrometers mounted 10 cm from the ground (spring return linear position sensor BEI 9605, BEI Sensors, Thousand Oaks, CA, USA; Wang and Sammis 2008). To limit damage caused by mounting sensors onto stems, we only used stems with a radius > 3.5 cm. We recorded stem radial growth hourly to 0.1 mm (CR10X; Campbell Scientific, Logan, Utah, USA).
2.7 Statistical analysis
We conducted all analyses using R version 3.4.05 (R Core Team, 2018). Broadly, we analyzed repeated measures of data taken in all plots using generalized additive mixed effect models (GAMMs; mgcv package in R; Wood, 2004). For example, tracer uptake by depth was analyzed using GAMMs. Analyses were performed separately for early-season tracer uptake in low-intensity treatments, early-season tracer uptake in high-intensity treatments, late-season tracer uptake in low-intensity treatments, and late-season tracer uptake in high-intensity treatments. In each case, a null model where a single spline was fit to depth (no treatments distinguished) was compared to a model that grouped vegetation into plant functional types with three levels (forb, grass, shrub; Wood, 2004). We also analyzed shrub stem radius over time using GAMMs. We fit two GAMMs that contained the fixed effect of date and random effect of plot: (1) a null model where a single spline was fit to date (no treatments distinguished) and (2) a model that grouped treatments into two levels, low intensity (1 mm, control, 2, and 3 mm treatments) and high intensity (4, 8, and 18 mm treatments). Data smoothing to remove spurious values was performed using a moving 10th percentile or 90th percentile window and a 24 h wide bin. Vegetation cover determined by visual estimation in nine fixed quadrats in each plot was similarly analyzed. Top models were those with the lowest Akaike's information criterion (AIC), and we considered models similar if ΔAIC < 2 (Burnham and Anderson, 2002).
We report daily soil water content measurements made in one control and one treated plot, but we did not statistically compare them due to a lack of spatial replication. Similarly, we did not perform statistical analyses on the water uptake estimates because they are the product of a deterministic model.
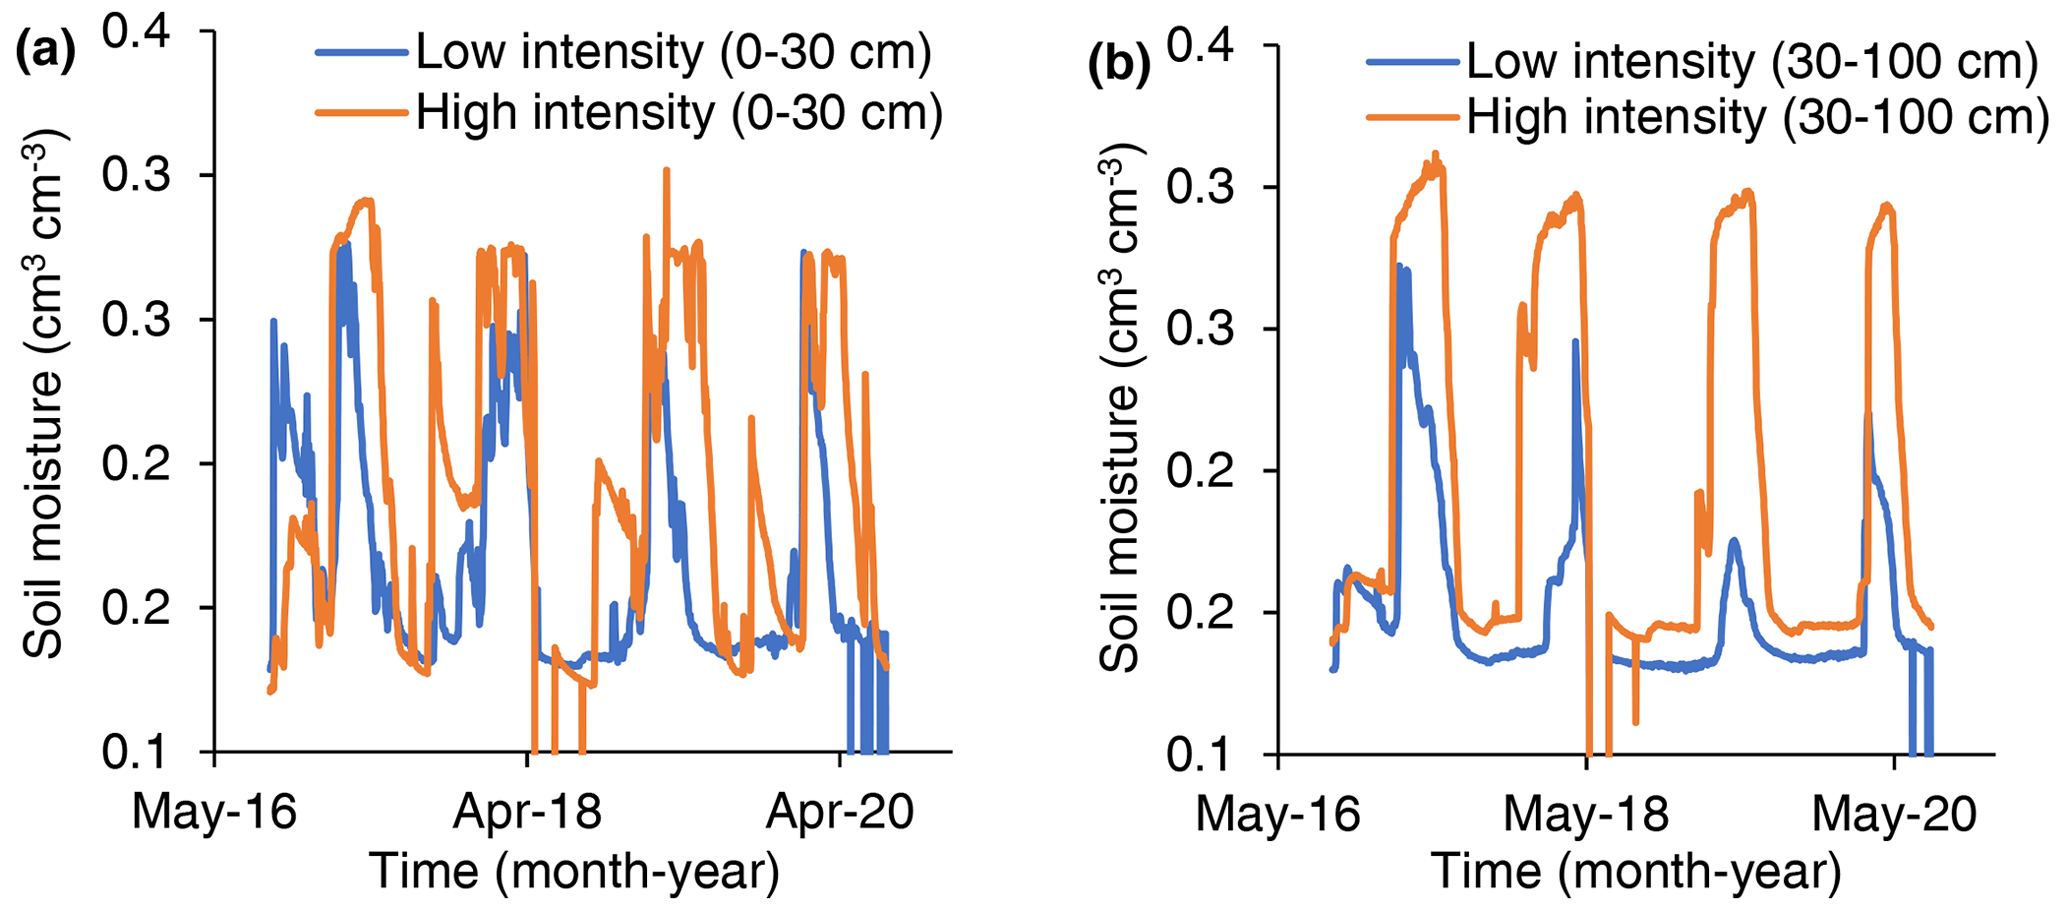
Figure 2Soil volumetric moisture content in low-precipitation-intensity and high-precipitation-intensity plots. Data recorded every 20 min at six depths in one low-precipitation-intensity plot and one high-precipitation-intensity plot.
3.1 Abiotic responses
In both shallow (0–30 cm) and deep (30–100 cm) soils, soil moisture was greater in high-precipitation-intensity treatments than low-precipitation-intensity treatments (Fig. 2).
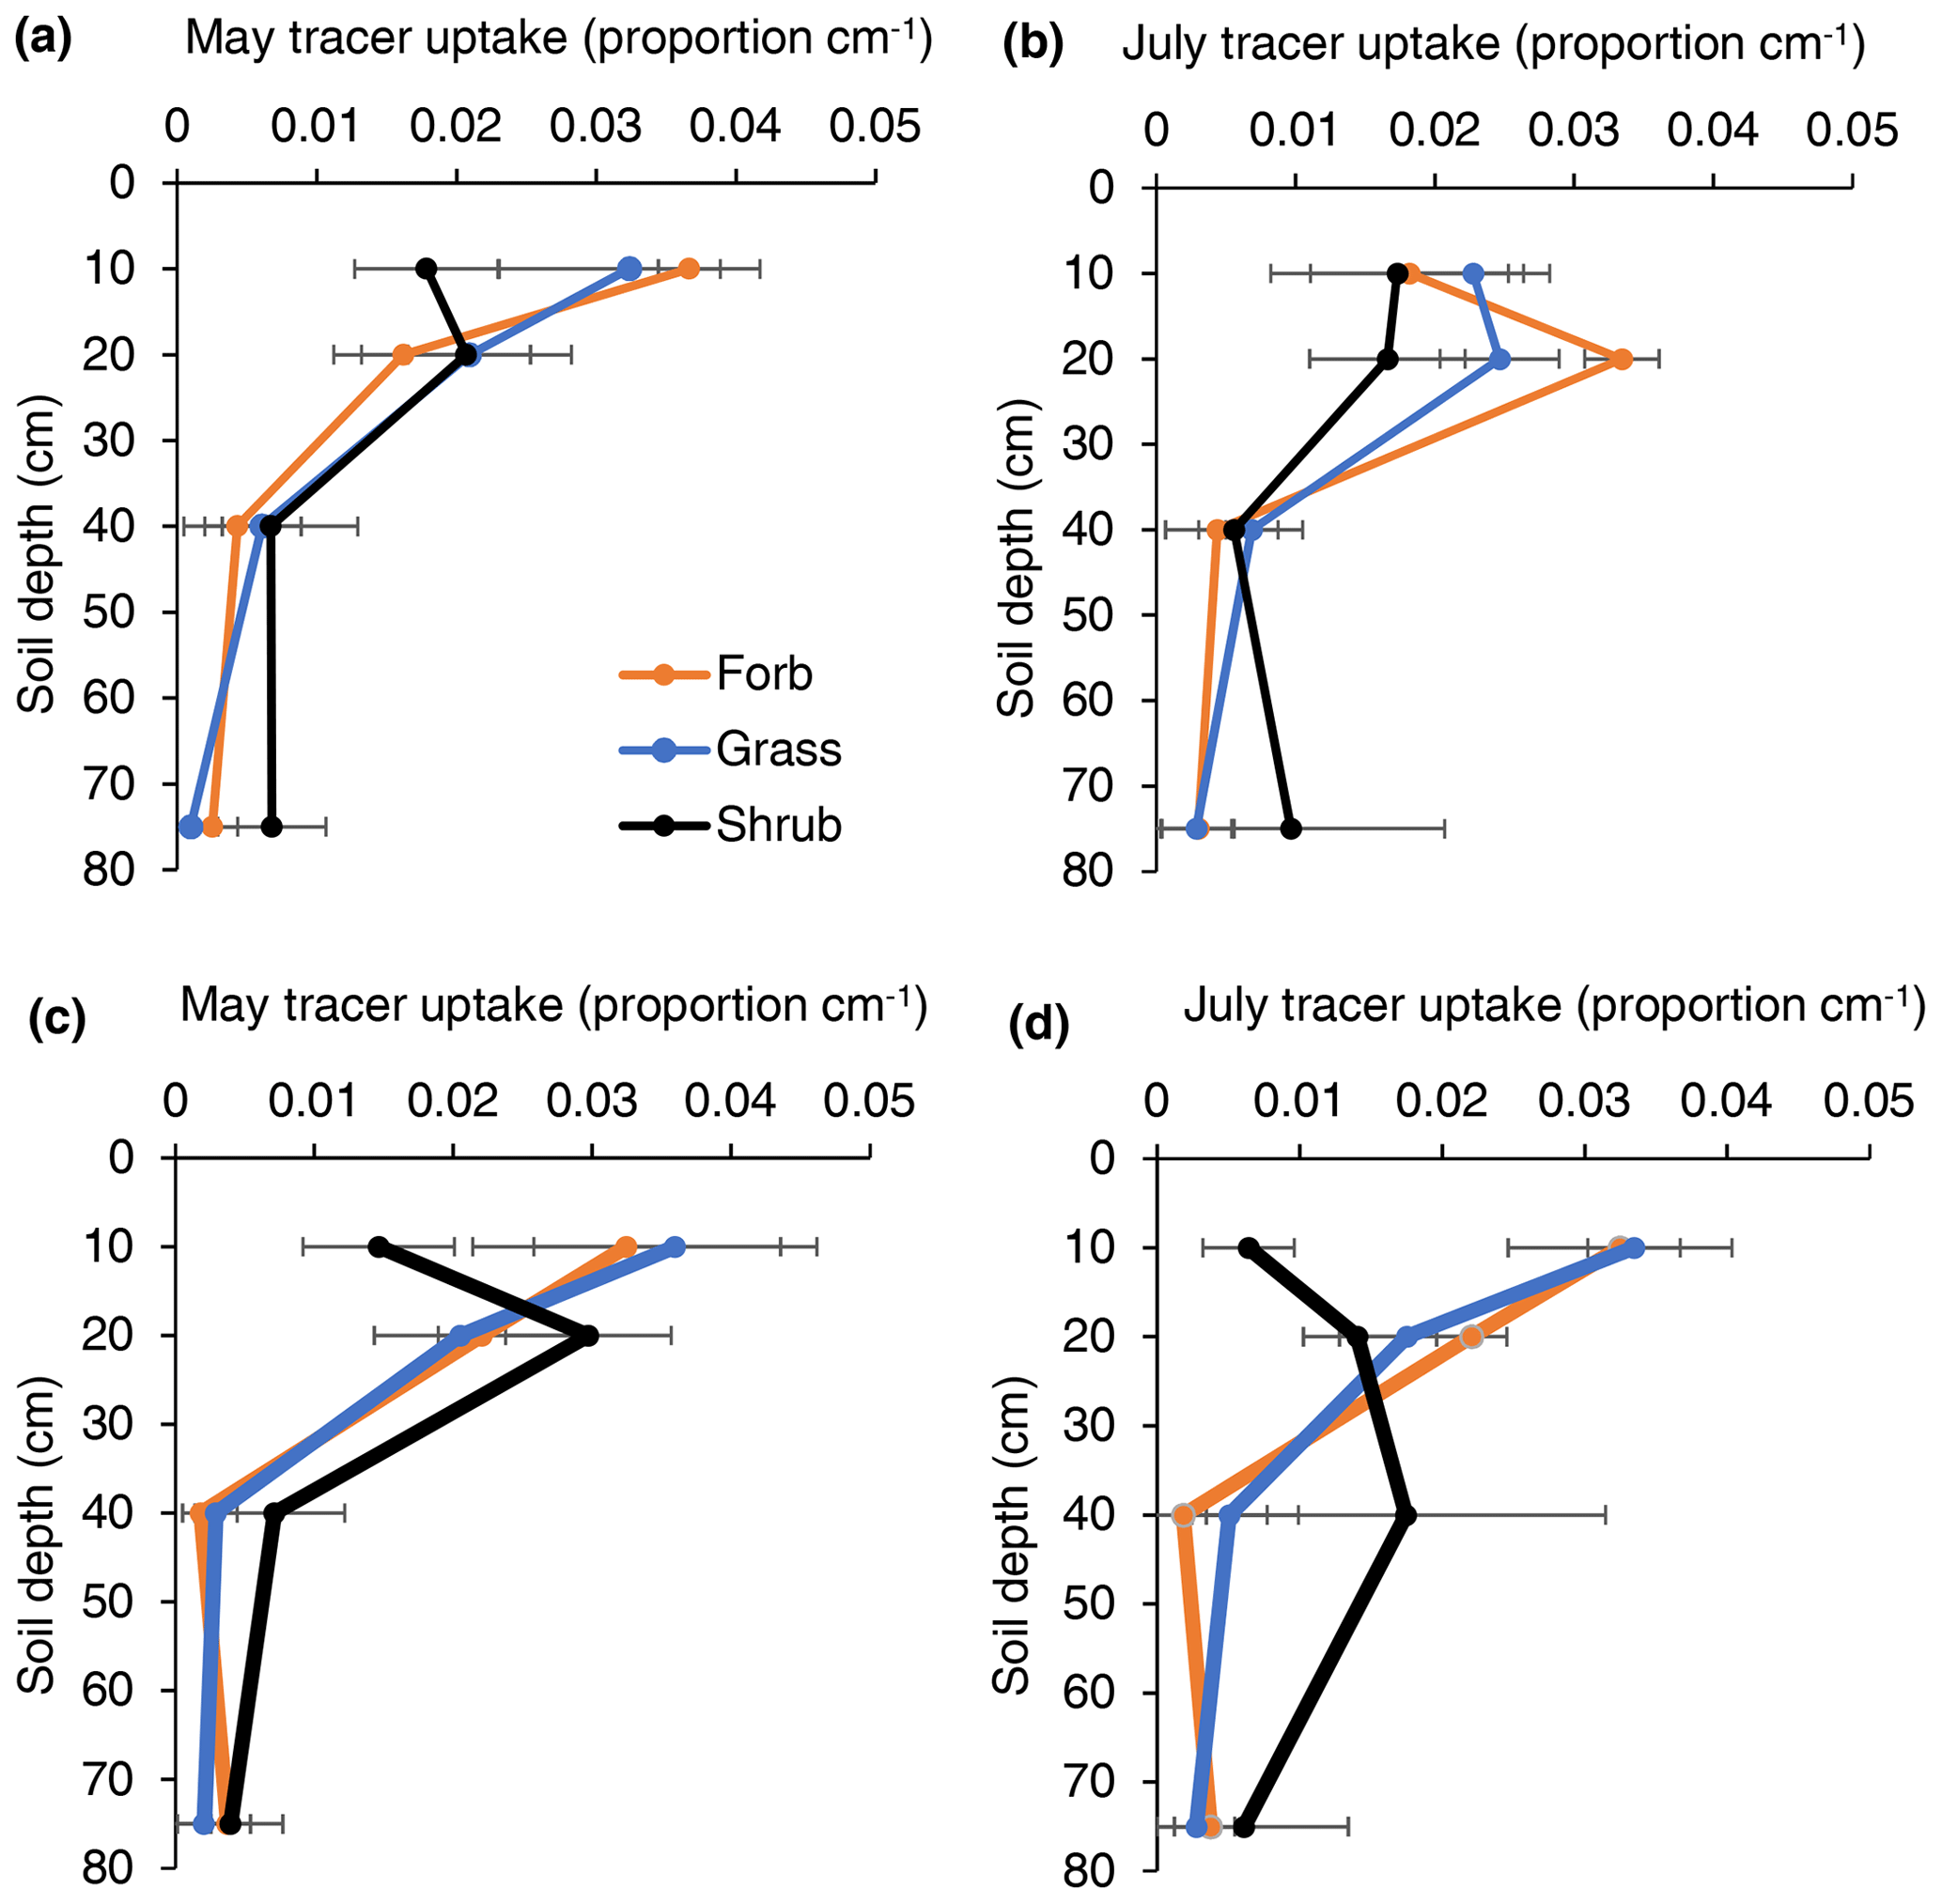
Figure 3The proportion of tracer uptake by soil depth for forbs, grasses, and shrubs in either low- or high-intensity precipitation manipulation plots during early-season (May) and late-season (July) samplings. Each point represents the mean uptake value from four different plots. Error represents variation among four experimental plots. These values were used to inform the rooting profiles in a soil water flow model.
3.2 Tracer and water uptake
The mean depth of tracer uptake often provides a good index of rooting distribution depths (Fig. 3; Kulmatiski, Adler and Foley, 2020). Broadly, this index revealed that (1) shrub roots were deeper than forb or grass roots, (2) root distributions were deeper later in the season, and (3) root distributions were shallower in response to greater precipitation intensity. More specifically, early in the season, the mean tracer uptake depth was deeper for shrubs (25 cm) than for forbs (17 cm) or grasses (14 cm). Later in the season, the mean tracer uptake depth was 58, 21, and 21 cm for shrubs, forbs, and grasses, respectively. With the exception of forbs in May, the mean depth of tracer uptake was deeper (4 to 15 cm) in low- compared to high-precipitation-intensity plots.
There was similar or more support for models that separated tracer uptake by plant type than for models that grouped uptake profiles (Fig. 3; Table 1). The only exception was early-season, high-intensity plots, where there was more support for the model that grouped uptake profiles. In other words, plant functional groups demonstrated different tracer uptake patterns, except when soil water availability was large.
Table 1AIC table for models of tracer uptake by depth for a factorial combination of season (early or late) and precipitation intensity (low intensity or high intensity). For the “All together” model, measurements from the three measured plant functional groups (forbs, grasses, and shrubs) were not distinguished. For the “All separate” model, measurements were associated with forbs, grasses, or shrubs.
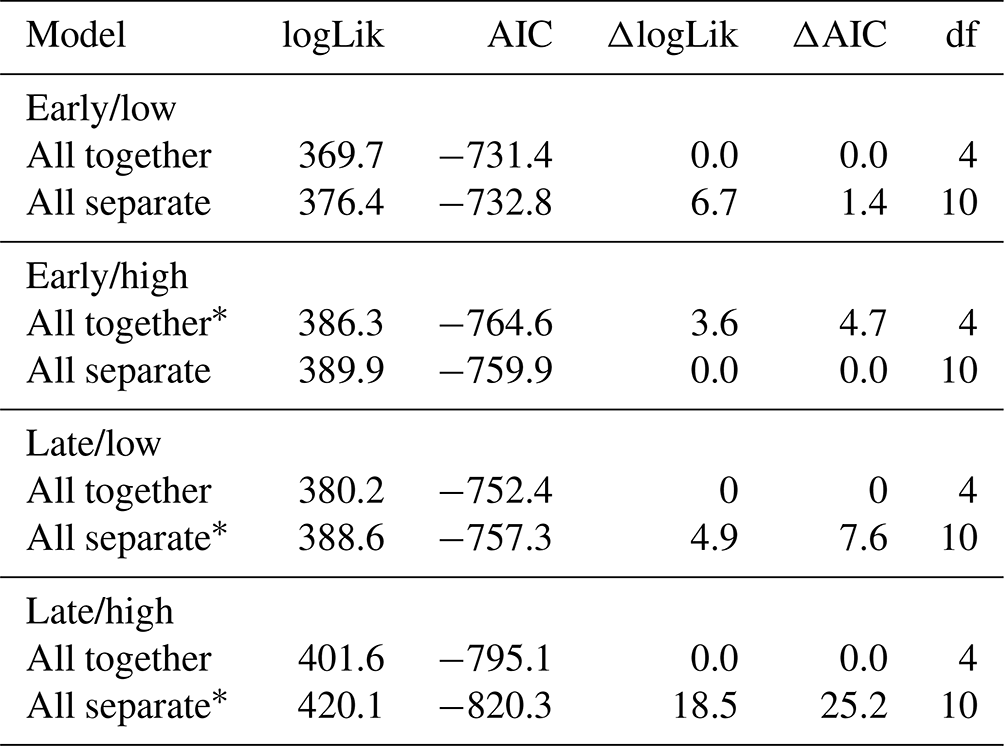
Abbreviations: logLik, log likelihood; AIC, Akaike's information criterion; df, degrees of freedom. ∗ Indicates top model based on ΔAIC < 2 criterion.
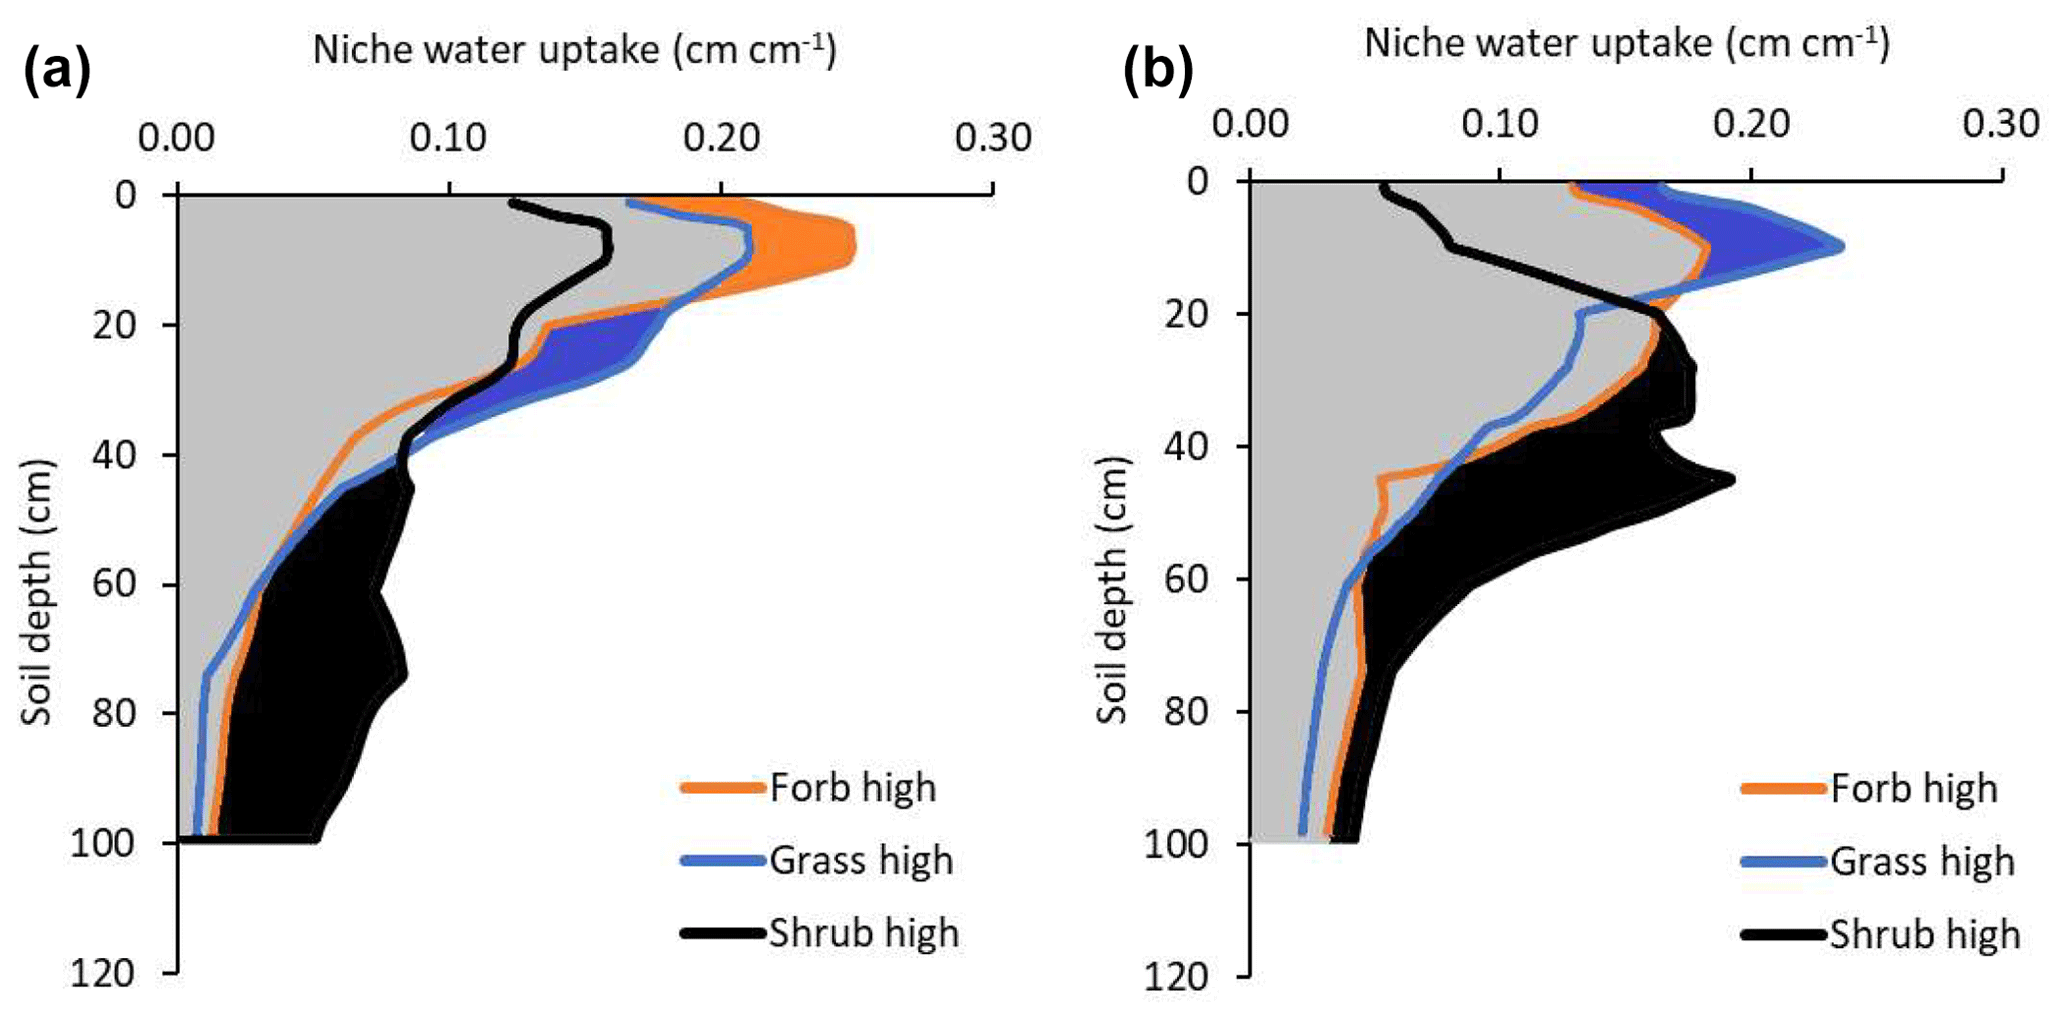
Figure 4Water uptake by forbs, grasses, and shrubs by soil depth in low-precipitation-intensity treatment plots (a) and high-precipitation-intensity treatment plots (b). Data represent the average annual amount of water each rooting distribution were estimated to absorb if each rooting distribution was attached to a similar plant canopy (i.e., same leaf area and stomatal conductance). Color-filled areas highlight water uptake for which the indicated plant type has a competitive advantage for water uptake. For example, the black area between 40 and 100 cm in panel (a) indicates that shrubs have a competitive advantage for water uptake at these depths in the low-precipitation plots. Gray areas indicate shared soil water. The sum of water uptake across the profile in low-precipitation-intensity conditions was 79, 80, and 93 mm for forbs, grasses, and shrubs, respectively. The sum of water uptake in high-precipitation-intensity plots was 88, 85, and 105 mm for forbs, grasses, and shrubs, respectively.
Tracer uptake indicated the depth of active roots, but water uptake indicated how much water flowed into those active roots. The mean depth of soil water uptake (estimated by the soil water flow model) was generally deeper than the mean depth of tracer uptake because shallow soils would dry and provide little water (Fig. 4). Across the year, the mean depth for forb, grass, and shrub water uptake was 18, 21, and 37 cm in low-precipitation-intensity plots. In contrast to tracer uptake, the mean depth of water uptake was deeper in high- than low-precipitation-intensity plots (27, 23, and 39 cm for forbs, grasses, and shrubs, respectively; Fig. 4). This occurred because high-precipitation-intensity treatments decreased evaporation (from 13 to 8 cm yr−1) and increased percolation (from 28 to 32 cm yr−1), resulting in increased deep soil water availability (Fig. 2). We did not perform statistical tests on water uptake because they are the product of tracer uptake and a deterministic water flow model.
3.3 Biotic responses
Shrub stem diameter growth showed a response to treatments, not measured in forbs or grasses. Shrub stem diameter was greater in high-intensity than low-intensity plots (Fig. 5), and there was more support for the model separating data from high- and low-precipitation-intensity treatments (AIC = 1209.7) than for a model that grouped all data (AIC = 2291.9). Shrub stem diameter growth was 30 % higher in high-intensity than low-intensity plots. Although, this effect was not detected with visual estimation of shrub cover (Fig. 6), suggesting that stem diameter was more sensitive to treatments, where there was more support for the model grouping shrub cover data from high- and low-intensity plots (AIC = 397.6) than for a model that separated shrub cover data (AIC = 401.4). Across years, shrub cover was 26.9 % across all plots.
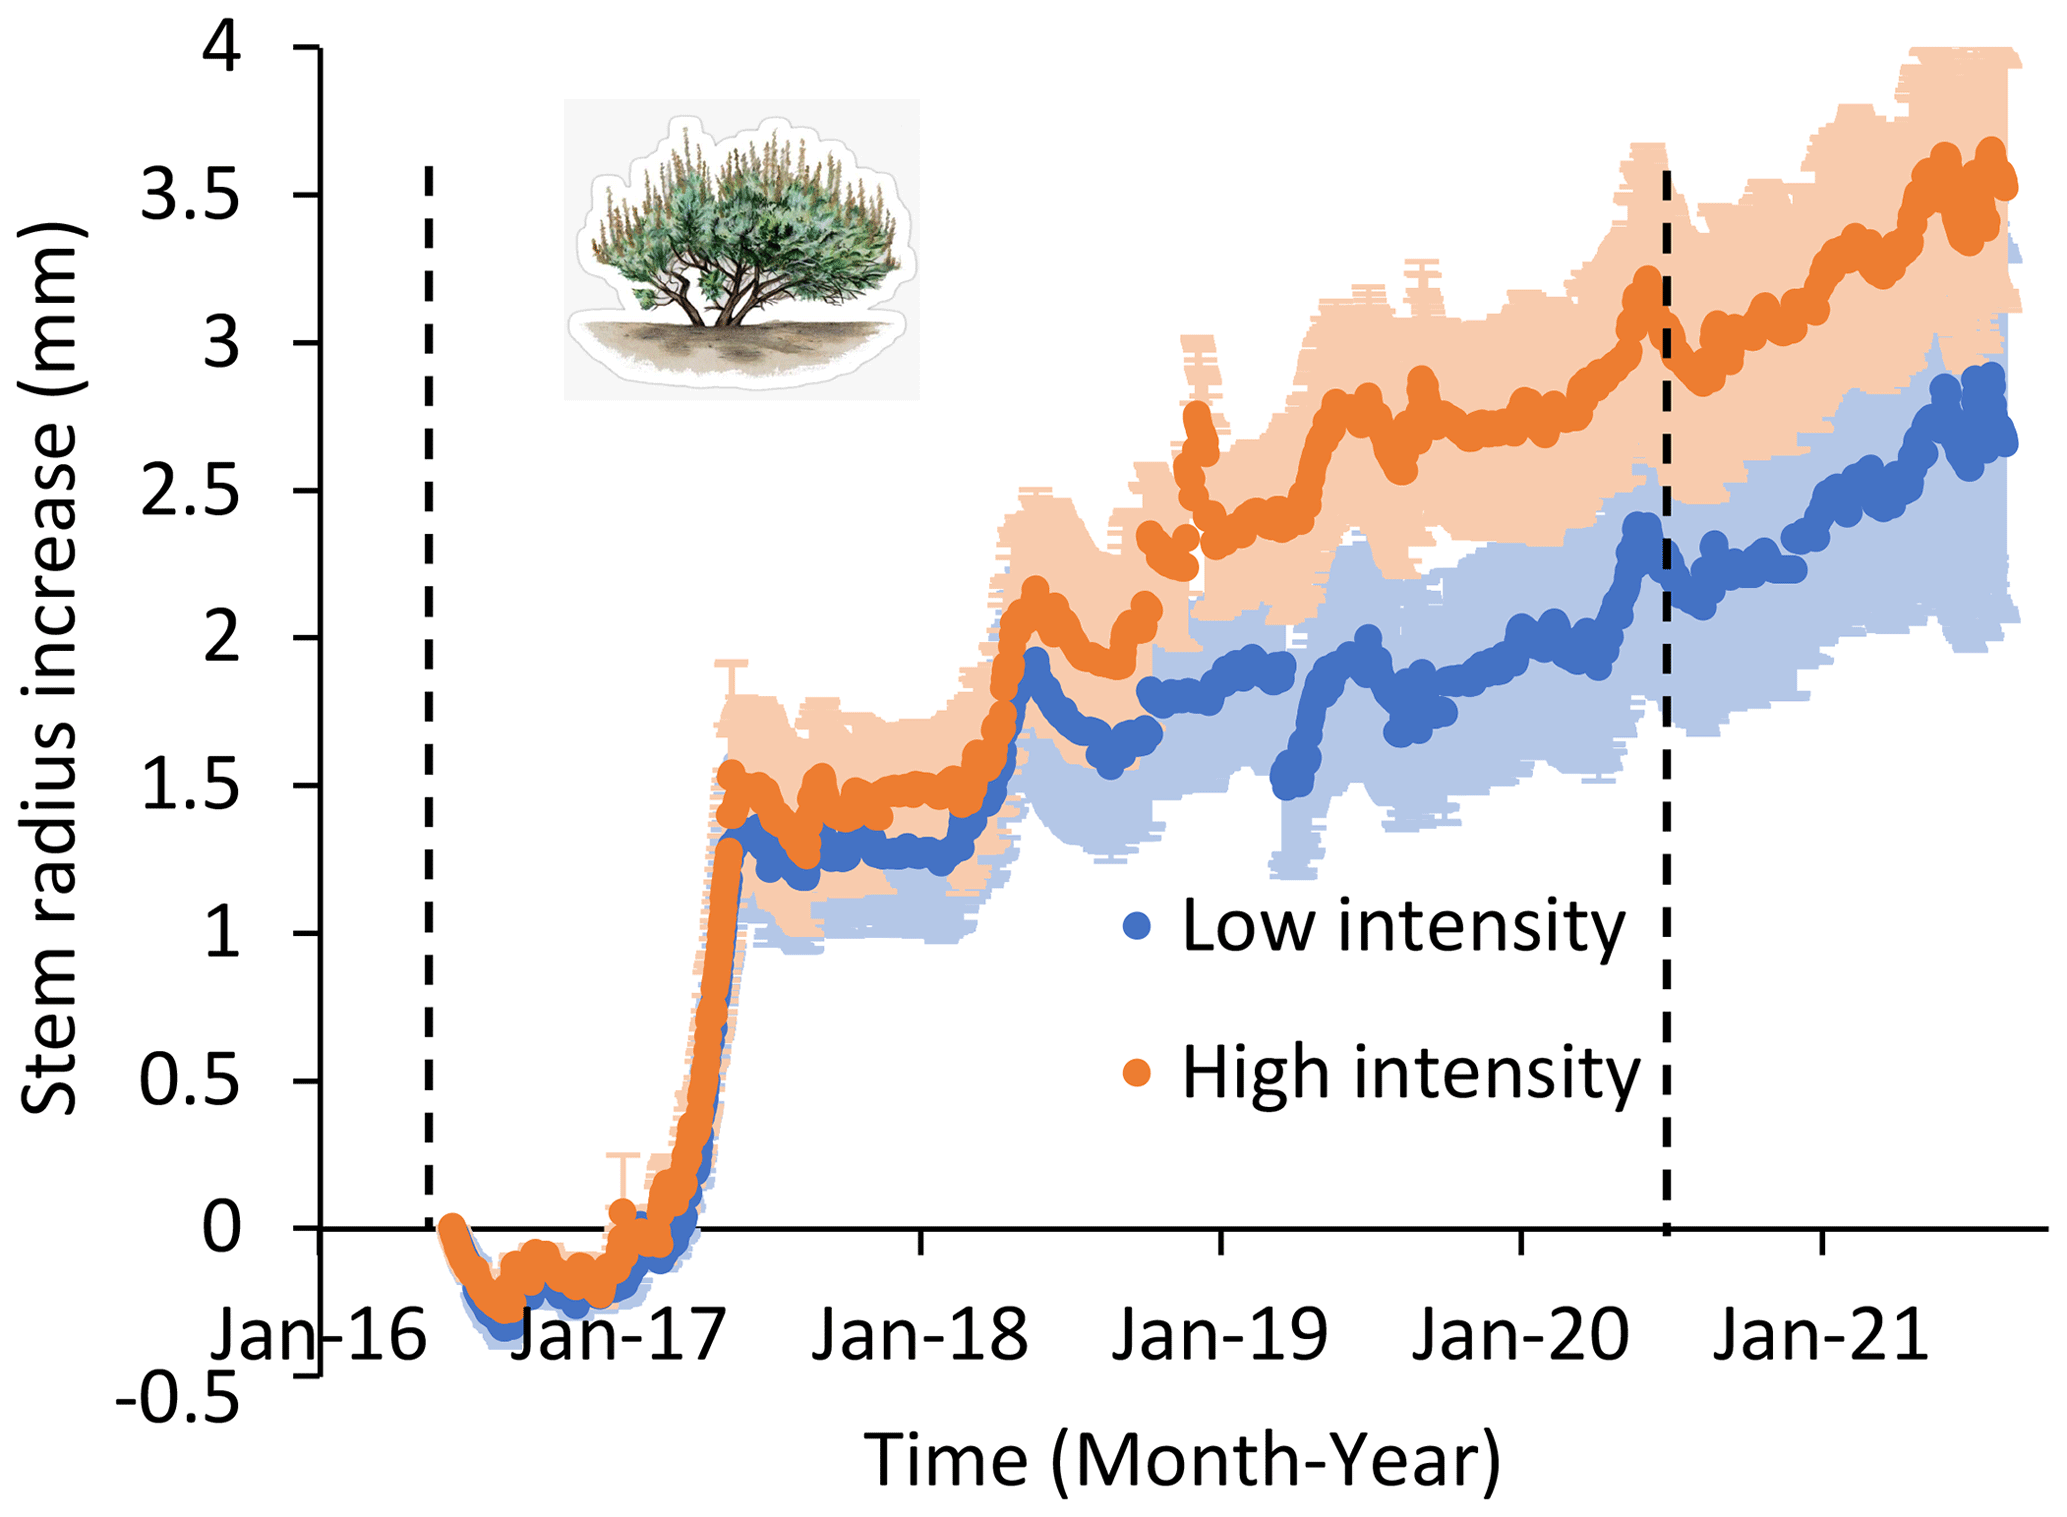
Figure 5Shrub stem radius (± 1 SE) over time in low- and high-precipitation-intensity plots over 5 years. Stem diameter recorded hourly on three shrubs in six low-precipitation-intensity plots and five high-precipitation-intensity plots. All plots received the same total annual precipitation. Precipitation treatments began in January 2016 and continued until September 2020 as indicated by vertical dashed lines. There was more support for models that separated treatments than for a model that combined treatments, both during and after treatment applications (ΔAIC = 1082 and 2047, respectively).
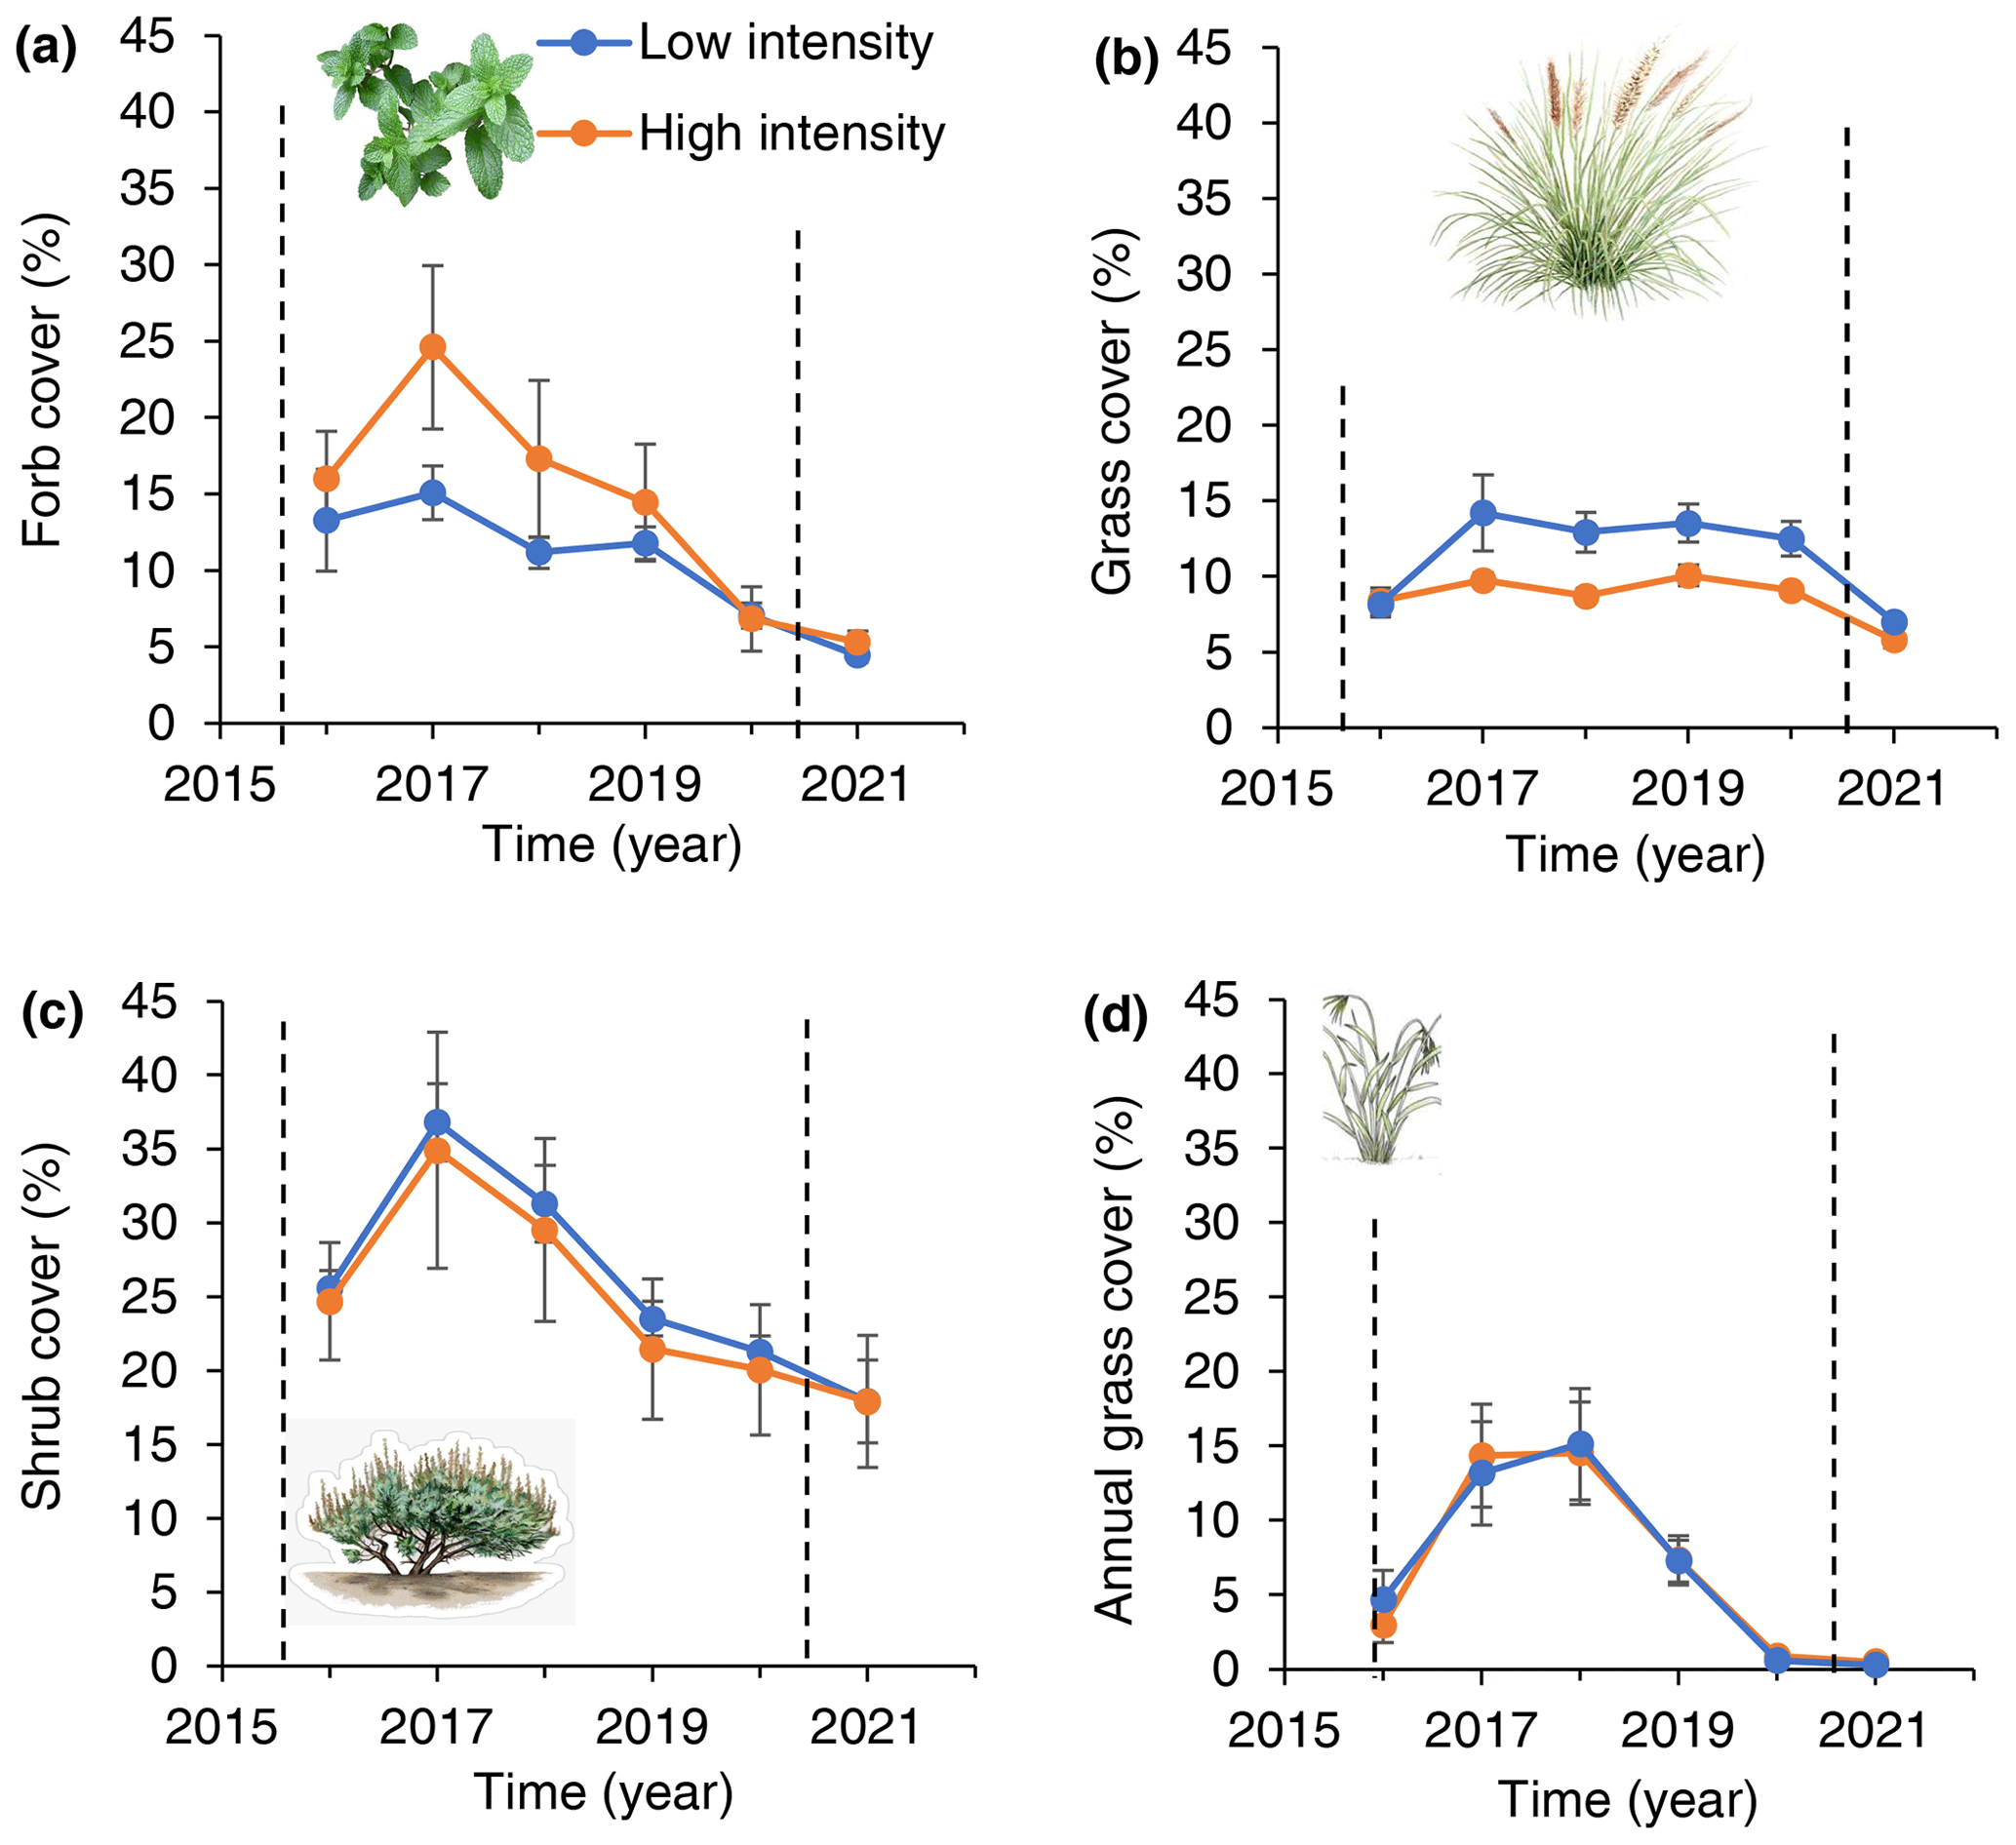
Figure 6Forb (a), shrub (b), annual grass (c) and perennial grass (d) ground cover response to low- and high-intensity precipitation treatments over time. Dashed vertical lines indicate the beginning and end of treatment application. Error derived from variation among six low-precipitation-intensity plots and five high-precipitation-intensity plots. All plots received the same total annual precipitation.
Forb cover was greater in high-intensity (15.8 %) than low-intensity (11.6 %) precipitation treatments (Fig. 6): there was equal support for models that grouped or separated forb cover data from high- and low-intensity plots (AIC = 375.8 and 377.4, respectively). In contrast to forbs, perennial grass cover was greater in low- (11.4 %) than high-precipitation-intensity (8.6 %) treatments: there was equal support for models that grouped or separated perennial grass cover (AIC = 645.1 and 643.6 for grouped and split models, respectively). For annual grasses, there was more support for the model that grouped annual grass cover (AIC = 774.6) than for a model that split annual grass cover by treatment (AIC = 798.3).
In the post-treatment year (2021), there were no differences in forb, grass, or shrub cover between low-intensity and high-intensity plots (P > 0.). Shrub stem diameter remained greater in high than low-precipitation-intensity plots during the post-treatment year: there was more support for a model separating treatments than for the model grouping treatments (ΔAIC = 2047).
Across treatments, the percent cover of each plant type each year was correlated with root water uptake estimated by root distributions alone (cover(%) = −24 + 2.5 ⋅ water uptake (mm); F1,28 = 12.42, P = 0.002, R2 = 0.31).
Consistent with our predictions, we found that plant root distributions helped predict plant growth under low- and high-precipitation-intensity conditions. We predicted that shrubs dominate in this semi-arid ecosystem because their deeper roots provide access to a larger soil water pool than shallower grass or forb roots. Aboveground, shrubs were the dominant life-form (27 % cover) with grasses (18 % cover) and forbs (12 % cover) less abundant. Shrubs had the deepest rooting distributions (Figs. 3 and 4), and when we assumed that the three plant types had the same water demand (leaf area, stomatal conductance, etc.), shrub roots were estimated to absorb 93 mm yr−1 which was more than grass (80 mm yr−1) or forb (79 mm yr−1) rooting distributions. Therefore, root distributions predicted that shrubs could absorb the most water followed by grasses and forbs, which correctly predicted the rank order abundance of aboveground plant cover. Shrub roots absorbed the most water because shrub roots had a greater relative abundance across a larger soil water pool.
We also predicted that larger precipitation events would push water deeper into the soil, providing an advantage to plants with deeper and more flexible rooting patterns (i.e., shrubs and forbs). Consistent with this prediction, aboveground growth of shrubs and forbs increased in response to precipitation intensity treatments, while aboveground growth of grasses decreased or remained unchanged. Larger precipitation events increased soil water availability by decreasing evaporation and increasing percolation (Holdrege et al., 2021). Shrub root distributions changed to depths that increased estimated water uptake 12 mm (from 93 to 105 mm yr−1) and forb roots increased estimated water uptake 9 mm (from 79 to 88 mm yr−1), while the increase in grass uptake was only 5 mm (from 80 to 85 mm yr−1; Figs. 3 and 4). Thus, shrub roots increased their competitive advantage for water uptake, which correctly predicted a positive aboveground growth response by shrubs in high-precipitation-intensity plots (Figs. 3 and 4). Similarly, forb root distributions changed to depths that provided a competitive advantage for water relative to grass roots, and this predicted the positive aboveground growth response of forbs to treatments. Grass roots were also estimated to absorb more water (because more soil water was available), but grass roots lost their competitive advantage for water uptake to forbs, helping explain grass treatment responses. In short, (a) rooting distributions affected the amount of water a plant could absorb, and (b) the amount of water a plant could absorb predicted plant abundance under ambient and manipulated precipitation conditions. These results are consistent with two previous studies that used the same techniques and found that root distributions could be used to predict plant landscape abundances (Kulmatiski and Beard, 2022; Kulmatiski et al., 2020a).
Shrub roots were estimated to provide more water than forb or grass root distributions, but our approach indicates several reasons that shrubs are not expected to competitively exclude forbs and grasses. First, shallow forb and grass roots have priority access to water as it enters the soil. This shallow rooting strategy by forbs and grasses did not provide the largest amount of water, but it did provide priority access to some water as it entered the soil (Kulmatiski and Beard 2022). Second, each rooting distribution demonstrated a competitive advantage for water uptake at some soil depth (i.e., the color-filled areas in Fig. 4). We suggest that the competitive advantage these roots have at certain depths allow a plant to grow when rare (Ward et al., 2013; Kulmatiski et al., 2020a). Similarly, our calculations of water uptake assume that plants can absorb water at every soil depth in proportion to their relative abundance at that depth. In other words, we assume that plants can absorb water even when rare (in proportion to their relative abundance). The fact that we measured tracer uptake by all plants at all depths supports this assumption. Further, this assumption is consistent with studies demonstrating symmetric root competition (Cahill and Casper, 2000; Raynaud and Leadley, 2005). We suggest the direct plus opportunity carbon costs of fully competitively excluding all other roots from all soil depths are too large, allowing different plants to access some water from most soil depths (Cabal et al., 2020; Cai et al., 2018). For example, a shrub would have to produce a large amount of very shallow roots to compete with dense grass root mats. This would come at a large direct carbon cost. At the same time, this direct carbon cost would come at a large opportunity cost of producing deep roots that provide more water that would allow a shrub to compete with other shrubs. Further, the fact that water percolates deeply into the soil indicates that roots do not intercept all soil water. Consequently, there are likely to be precipitation pulses when water is not limiting during which all plants can absorb soil water.
It is important to understand the extent to which plant root distributions change in response to changing climate conditions (i.e., root plasticity; Guderle et al., 2018; Liu et al., 2018; Zhou et al., 2019). Do some species move their roots in response to soil water availability while others maintain rigid rooting patterns (Berry and Kulmatiski, 2017)? Consistent with results from a similar study in a sub-tropical savanna, we observed that shrub root distributions changed in response to treatments in ways that increased their water uptake (Berry and Kulmatiski, 2017; Kulmatiski and Beard, 2013). Results support the idea that the shrub encroachment observed around the globe over the past 50 years is caused at least in part by the ability of woody plants to produce deep and flexible rooting patterns that can absorb more water as precipitation events become larger (Stevens et al., 2017; Venter et al., 2018). We also found that forb root distributions changed in ways that increased water uptake in high-precipitation-intensity treatments. This provides a potential explanation for the increased forb growth observed in this and other experiments testing the effects of increased precipitation intensity (Jones et al., 2016). Predicting plant responses to climate change, therefore, is likely to require an understanding of how root distributions respond to changing soil resource availability.
It is interesting to note that plants absorbed more deep soil water in high-precipitation-intensity plots even though root distributions were shallower. This occurred because more deep soil water was available in high-precipitation-intensity plots, so even a small number of deep roots could absorb a large amount of water. That root distributions became shallower in the soil profile in response to increased deep soil water availability is a counterintuitive response that highlights the need for more direct measurements of root activity and water uptake to better understand root responses to climate change. This response is, however, consistent with the “shallowest” rooting depth hypothesis (Schenk, 2008).
Tracer uptake indicated that root distributions changed over time and in response to increased precipitation intensity, but it does not indicate how plants cause these changes. Plants can grow new roots at specific depths, senesce roots at some depths more than others, or change aquaporin abundance or activity (Dybzinski et al., 2019; Zarebanadkouki et al., 2019). Similarly, a plant functional group could demonstrate deeper roots later in the season because all plants grow new deep roots or because some shallow-rooted species senesce early in the season. Our measurements did not distinguish these different mechanisms, but they may have important consequences for species carbon budgets or long-term growth and coexistence.
The shelters used in this experiment caused a small amount of warming (0.6 ∘C) but had little effect on potential evapotranspiration due to lower wind speeds and higher relative humidity (Holdrege et al., 2021). A recent modeling study indicated that warming can have a larger effect than anticipated changes in precipitation event intensity (Holdrege et al., 2022, but see J. Liu et al., 2020; Volenec and Belovsky, 2018). Further research will be needed to better understand the combined effects of larger precipitation events and warmer temperatures (Giorgi et al., 2011; Jiao et al., 2021; Liu et al., 2018).
This study focused on the effects of vertical root distributions. There are many other factors that may improve understanding of plant responses to climate change. Grass stem conductance has been suggested to be larger than shrub stem conductance, but this adjustment alone would increase estimates of grass growth which would not improve our predictions (Holdo and Nippert, 2022). Aerodynamic properties of the canopy may improve predictions because shrubs and grasses tend to be taller and more exposed to air turbulence and low relative humidity that would decrease their water use efficiency and growth (Mazzacavallo and Kulmatiski, 2015). Whole plant water use efficiency may also have large effects on the eventual translation of water uptake into plant cover and biomass, but data on whole plant water use efficiency are lacking and mixed (Hai et al., 2022; Toft et al., 1989; Golluscio and Oesterheld, 2007). These measurements will be needed for future efforts to convert estimates of root water uptake to plant growth (Holdo and Nippert, 2022).
The fact that water uptake was correlated with plant growth has the important implication that root distributions are a primary determinant of plant growth that is not masked by factors such as water use efficiency, competitive exclusion, herbivory, dispersal limitation, or fire sensitivity. The links between root distributions, water uptake, and plant growth have been demonstrated in plant monocultures and for whole communities, but demonstrating these effects for components of the plant community remains uncommon (Knapp et al., 2008; Holdo and Nippert, 2022; Lauenroth and Bradford, 2009; Sala et al., 2015). This is an important knowledge gap because understanding how plant types use water is critical for predicting how plant types will respond to climate change or different species compositions (e.g., shrub encroachment or species invasions).
Shrub encroachment has been observed around the world, but the mechanisms explaining this pattern remain poorly resolved. Consistent with previous experiments, we found that precipitation intensification can cause increases in shrub and forb growth and decreases in grass growth (Wilcox et al., 2018; Gherardi and Sala, 2015; Holdrege et al., 2022; Jones et al., 2016). Here, we demonstrated a potential mechanism for this response: differences in active root distributions cause differences in water uptake that can explain forb, grass, and shrub growth under both low and high precipitation intensity. More specifically, deep roots provided shrubs with the most water and shrubs dominated on the landscape. Forbs and shrubs were able to change their active root distributions in response to increased precipitation intensity in ways that increased their water uptake relative to grasses. As active rooting distribution data become more available, it should be possible to use these data in soil water flow models to predict how much water different plants can absorb under future climate conditions (Holdrege et al., 2022). Inasmuch, it should be possible to forecast forb, grass, and shrub growth over time with obvious implications for forecasting forage production, shrub encroachment, the consequences of shrub control, primary productivity, and water cycling.
Code and data from this study are publicly available at https://doi.org/10.26078/ad1d-7c7f (Kulmatiski and Beard, 2023).
The supplement related to this article is available online at: https://doi.org/10.5194/bg-21-131-2024-supplement.
AK conceived and performed the experiment, analyzed data, and wrote the paper. MCH performed the experiment and analyses and edited the paper. CC performed the experiment and analyzed data. KHB conceived the experiment and edited the paper.
The contact author has declared that none of the authors has any competing interests.
Publisher's note: Copernicus Publications remains neutral with regard to jurisdictional claims made in the text, published maps, institutional affiliations, or any other geographical representation in this paper. While Copernicus Publications makes every effort to include appropriate place names, the final responsibility lies with the authors.
This article is part of the special issue “Ecosystem experiments as a window to future carbon, water, and nutrient cycling in terrestrial ecosystems”. It is not associated with a conference.
This research was supported by the Utah Agricultural Experiment Station and approved as journal paper no. 9631, Utah State University, and the Utah State University Ecology Center. We thank Annalisa Crow, Brooks Gunderson, Stephanie Hall, Lucas Henzler, Nick Macriss, Sydney Sprouse, Cole Walton, Tiana Wiese, and Wade Wilson for field assistance; Susan Durham for statistical advice; and Brad Hunt of the Hardware Ranch Wildlife Management Area.
This research has been supported by the Utah Agricultural Experiment Station (Project 1404).
This paper was edited by Karin Rebel and reviewed by two anonymous referees.
Barberon, M., Vermeer, J. E. M., De Bellis, D., Wang, P., Naseer, S., Andersen, T. G., Humbel, B. M., Nawrath, C., Takano, J., Salt, D. E., and Geldner, N.: Adaptation of Root Function by Nutrient-Induced Plasticity of Endodermal Differentiation, Cell, 164, 447–459, https://doi.org/10.1016/j.cell.2015.12.021, 2016.
Berry, R. S. and Kulmatiski, A.: A savanna response to precipitation intensity, PLOS ONE, 12, e0175402, https://doi.org/10.1371/journal.pone.0175402, 2017.
Burnham, K. P. and Anderson, D. R.: Model selection and inference: A practical information-theoretic approach, 2nd edn., Springer, New York, 2002.
Cabal, C., Martínez-García, R., de Castro Aguilar, A., Valladares, F., and Pacala, S. W.: The exploitative segregation of plant roots, Science, 370, 1197–1199, https://doi.org/10.1126/science.aba9877, 2020.
Cahill Jr., J. F. and Casper, B. B.: Investigating the relationship between neighbor root biomass and belowground competition: field evidence for symmetric competition belowground, Oikos, 90, 311–320, https://doi.org/10.1034/j.1600-0706.2000.900211.x, 2000.
Cai, G., Vanderborght, J., Couvreur, V., Mboh, C. M., and Vereecken, H.: Parameterization of Root Water Uptake Models Considering Dynamic Root Distributions and Water Uptake Compensation, Vadose Zone J., 17, 160125, https://doi.org/10.2136/vzj2016.12.0125, 2018.
Case, M. F., Nippert, J. B., Holdo, R. M., and Staver, A. C.: Root-niche separation between savanna trees and grasses is greater on sandier soils, J. Ecol., 108, 2298–2308, https://doi.org/10.1111/1365-2745.13475, 2020.
D'Onofrio, D., Sweeney, L., von Hardenberg, J., and Baudena, M.: Grass and tree cover responses to intra-seasonal rainfall variability vary along a rainfall gradient in African tropical grassy biomes, Sci. Rep.-UK, 9, 2334, https://doi.org/10.1038/s41598-019-38933-9, 2019.
Dubbert, M. and Werner, C.: Water fluxes mediated by vegetation: emerging isotopic insights at the soil and atmosphere interfaces, New Phytol., 221, 1754–1763, https://doi.org/10.1111/nph.15547, 2019.
Dybzinski, R., Kelvakis, A., McCabe, J., Panock, S., Anuchitlertchon, K., Vasarhelyi, L., McCormack, M. L., McNickle, G. G., Poorter, H., Trinder, C., and Farrior, C. E.: How are nitrogen availability, fine-root mass, and nitrogen uptake related empirically? Implications for models and theory, Glob. Change Biol., 25, 885–899, https://doi.org/10.1111/gcb.14541, 2019.
Erktan, A., McCormack, M. L., and Roumet, C.: Frontiers in root ecology: recent advances and future challenges, Plant Soil, 424, 1–9, https://doi.org/10.1007/s11104-018-3618-5, 2018.
Flint, A. L., Campbell, G. S., Ellett, K. M., and Calissendorff, C.: Calibration and Temperature Correction of Heat Dissipation Matric Potential Sensors, Soil Sci. Soc. Am. J., 66, 1439–1445, https://doi.org/10.2136/sssaj2002.1439, 2002.
Gherardi, L. A. and Sala, O. E.: Enhanced precipitation variability decreases grass- and increases shrub-productivity, P. Natl. Acad. Sci. USA, 112, 12735–12740, https://doi.org/10.1073/pnas.1506433112, 2015.
Giorgi, F., Im, E.-S., Coppola, E., Diffenbaugh, N. S., Gao, X. J., Mariotti, L., and Shi, Y.: Higher Hydroclimatic Intensity with Global Warming, J. Climate, 24, 5309–5324, https://doi.org/10.1175/2011JCLI3979.1, 2011.
Golluscio, R. A. and Oesterheld, M.: Water use efficiency of twenty-five co-existing Patagonian species growing under different soil water availability, Oecologia, 154, 207–217, https://doi.org/10.1007/s00442-007-0800-5, 2007.
Good, S. P. and Caylor, K. K.: Climatological determinants of woody cover in Africa, P. Natl. Acad. Sci. USA, 108, 4902–4907, https://doi.org/10.1073/pnas.1013100108, 2011.
Guderle, M., Bachmann, D., Milcu, A., Gockele, A., Bechmann, M., Fischer, C., Roscher, C., Landais, D., Ravel, O., Devidal, S., Roy, J., Gessler, A., Buchmann, N., Weigelt, A., and Hildebrandt, A.: Dynamic niche partitioning in root water uptake facilitates efficient water use in more diverse grassland plant communities, Funct. Ecol., 32, 214–227, https://doi.org/10.1111/1365-2435.12948, 2018.
Hai, X., Li, J., Li, J., Liu, Y., Dong, L., Wang, X., Lv, W., Hu, Z., Shangguan, Z., and Deng, L.: Variations in Plant Water Use Efficiency Response to Manipulated Precipitation in a Temperate Grassland., Front. Plant Sci., 13, 881282, https://doi.org/10.3389/fpls.2022.881282, 2022.
Holdo, R. M. and Nippert, J. B.: Linking resource- and disturbance-based models to explain tree-grass coexistence in savannas, New Phytol., 237, 1966–1979, https://doi.org/10.1111/nph.18648, 2022.
Holdrege, M. C., Beard, K. H., and Kulmatiski, A.: Woody plant growth increases with precipitation intensity in a cold semiarid system, Ecology, 102, e03212, https://doi.org/10.1002/ecy.3212, 2021.
Holdrege, M. C., Kulmatiski, A., Beard, K. H., and Palmquist, K. A.: Precipitation Intensification Increases Shrub Dominance in Arid, Not Mesic, Ecosystems, Ecosystems, 26, 568–584, https://doi.org/10.1007/s10021-022-00778-1, 2022.
Humphrey, V., Berg, A., Ciais, P., Gentine, P., Jung, M., Reichstein, M., Seneviratne, S. I., and Frankenberg, C.: Soil moisture–atmosphere feedback dominates land carbon uptake variability, Nature, 592, 65–69, https://doi.org/10.1038/s41586-021-03325-5, 2021.
Jiao, W., Wang, L., Smith, W. K., Chang, Q., Wang, H., and D'Odorico, P.: Observed increasing water constraint on vegetation growth over the last three decades, Nat. Commun., 12, 3777, https://doi.org/10.1038/s41467-021-24016-9, 2021.
Jones, S. K., Collins, S. L., Blair, J. M., Smith, M. D., and Knapp, A. K.: Altered rainfall patterns increase forb abundance and richness in native tallgrass prairie, Sci. Rep.-UK, 6, 20120, https://doi.org/10.1038/srep20120, 2016.
Knapp, A. K., Beier, C., Briske, D. D., Classen, A. T., Luo, Y., Reichstein, M., Smith, M. D., Smith, S. D., Bell, J. E., Fay, P. A., Heisler, J. L., Leavitt, S. W., Sherry, R., Smith, B., and Weng, E.: Consequences of More Extreme Precipitation Regimes for Terrestrial Ecosystems, Bioscience, 58, 811–821, https://doi.org/10.1641/B580908, 2008.
Kulmatiski, A. and Beard, K. H.: Woody plant encroachment facilitated by increased precipitation intensity, Nat. Clim. Change, 3, 833–837, https://doi.org/10.1038/nclimate1904, 2013.
Kulmatiski, A. and Beard, K. H.: A modern two-layer hypothesis helps resolve the “savanna problem”, Ecol. Lett., 25, 1952–1960, https://doi.org/10.1111/ele.14067, 2022.
Kulmatiski, A. and Beard, K. H.: Data From: Root Distributions Predict Shrub-Steppe Responses to Precipitation Intensity, Digital Commons [code, data set], https://doi.org/10.26078/ad1d-7c7f, 2023.
Kulmatiski, A., Beard, K. H., Verweij, R. J. T., and February, E. C.: A depth-controlled tracer technique measures vertical, horizontal and temporal patterns of water use by trees and grasses in a subtropical savanna, New Phytol., 188, 199–209, https://doi.org/10.1111/j.1469-8137.2010.03338.x, 2010.
Kulmatiski, A., Adler, P. B., and Foley, K. M.: Hydrologic niches explain species coexistence and abundance in a shrub–steppe system, J. Ecol., 1–11, https://doi.org/10.1111/1365-2745.13324, 2020a.
Kulmatiski, A., Beard, K. H., Holdrege, M. C., and February, E. C.: Small differences in root distributions allow resource niche partitioning, Ecol. Evol., 10, 9776–9787, https://doi.org/10.1002/ece3.6612, 2020b.
Lauenroth, W. K. and Bradford, J. B.: Ecohydrology of dry regions of the United States: precipitation pulses and intraseasonal drought, Ecohydrology, 2, 173–181, https://doi.org/10.1002/eco.53, 2009.
Liu, H., Mi, Z., Lin, L., Wang, Y., Zhang, Z., Zhang, F., Wang, H., Liu, L., Zhu, B., Cao, G., Zhao, X., Sanders, N. J., Classen, A. T., Reich, P. B., and He, J.-S.: Shifting plant species composition in response to climate change stabilizes grassland primary production, P. Natl. Acad. Sci. USA, 115, 4051–4056, https://doi.org/10.1073/pnas.1700299114, 2018.
Liu, J., Ma, X., Duan, Z., Jiang, J., Reichstein, M., and Jung, M.: Impact of temporal precipitation variability on ecosystem productivity, WIREs Water, 7, e1481, https://doi.org/10.1002/wat2.1481, 2020.
Liu, L., Gudmundsson, L., Hauser, M., Qin, D., Li, S., and Seneviratne, S. I.: Soil moisture dominates dryness stress on ecosystem production globally, Nat. Commun., 11, 4892, https://doi.org/10.1038/s41467-020-18631-1, 2020.
Mazzacavallo, M. G. and Kulmatiski, A.: Modelling Water Uptake Provides a New Perspective on Grass and Tree Coexistence, PLOS ONE, 10, e0144300, https://doi.org/10.1371/journal.pone.0144300, 2015.
McMurtrie, R. E. and Näsholm, T.: Quantifying the contribution of mass flow to nitrogen acquisition by an individual plant root, New Phytol., 218, 119–130, https://doi.org/10.1111/nph.14927, 2018.
Menne, M. J., Durre, I., Korzeniewski, B., McNeal, S., Thomas, K., Yin, X., Anthony, S., Ray, R., Vose, R. S., Gleason, B. E., and Houston, T. G.: Global historical climatology network-daily (GHCN-Daily), Version 3, NOAA National Climatic Data Center, 10(10.7289), V5D21VHZ, 2012.
O'Gorman, P. A. and Muller, C. J.: How closely do changes in surface and column water vapor follow Clausius-Clapeyron scaling in climate change simulations?, Environ. Res. Lett., 5, 025207, https://doi.org/10.1088/1748-9326/5/2/025207, 2010.
Post, A. K. and Knapp, A. K.: How big is big enough? Surprising responses of a semiarid grassland to increasing deluge size, Glob. Change Biol., 27, 1157–1169, https://doi.org/10.1111/gcb.15479, 2021.
R Core Team: R: A language and environment for statistical computing, R Foundation for Statistical Computing, Vienna, Austria, 2018.
Rasmussen, C. R. and Kulmatiski, A.: Improving Inferences from Hydrological Isotope Techniques, Trends Plant Sci., 26, 206–209, https://doi.org/10.1016/j.tplants.2020.12.013, 2021.
Raynaud, X. and Leadley, P. W.: Symmetry of belowground competition in a spatially explicit model of nutrient competition, Ecol. Modell., 189, 447–453, https://doi.org/10.1016/j.ecolmodel.2005.03.008, 2005.
Rothfuss, Y. and Javaux, M.: Reviews and syntheses: Isotopic approaches to quantify root water uptake: a review and comparison of methods, Biogeosciences, 14, 2199–2224, https://doi.org/10.5194/bg-14-2199-2017, 2017.
Sala, O. E., Gherardi, L. A., and Peters, D. P. C.: Enhanced precipitation variability effects on water losses and ecosystem functioning: differential response of arid and mesic regions, Clim. Change, 131, 213–227, https://doi.org/10.1007/s10584-015-1389-z, 2015.
Schenk, H. J.: The Shallowest Possible Water Extraction Profile: A Null Model for Global Root Distributions, Vadose Zone J., 7, 1119–1124, https://doi.org/10.2136/vzj2007.0119, 2008.
Schreiner-McGraw, A. P., Vivoni, E. R., Ajami, H., Sala, O. E., Throop, H. L., and Peters, D. P. C.: Woody Plant Encroachment has a Larger Impact than Climate Change on Dryland Water Budgets, Sci. Rep.-UK, 10, 8112, https://doi.org/10.1038/s41598-020-65094-x, 2020.
Schymanski, S. J., Sivapalan, M., Roderick, M. L., Beringer, J., and Hutley, L. B.: An optimality-based model of the coupled soil moisture and root dynamics, Hydrol. Earth Syst. Sci., 12, 913–932, https://doi.org/10.5194/hess-12-913-2008, 2008.
Silvertown, J., Araya, Y., and Gowing, D.: Hydrological niches in terrestrial plant communities: A review, J. Ecol., 103, 93–108, https://doi.org/10.1111/1365-2745.12332, 2015.
Šimůnek, J., van Genuchten, M. T., and Šejna, M.: Recent Developments and Applications of the HYDRUS Computer Software Packages, Vadose Zone J., 15, vzj2016.04.0033, https://doi.org/10.2136/vzj2016.04.0033, 2016.
Slette, I. J., Blair, J. M., Fay, P. A., Smith, M. D., and Knapp, A. K.: Effects of Compounded Precipitation Pattern Intensification and Drought Occur Belowground in a Mesic Grassland, Ecosystems, 25, 1265–1278, https://doi.org/10.1007/s10021-021-00714-9, 2022.
Smithwick, E. A. H., Lucash, M. S., McCormack, M. L., and Sivandran, G.: Improving the representation of roots in terrestrial models, Ecol. Modell., 291, 193–204, https://doi.org/10.1016/j.ecolmodel.2014.07.023, 2014.
Soil Survey Staff: Natural Resources Conservation Service, United States Department of Agriculture, Web Soil Survey, https://websoilsurvey.sc.egov.usda.gov/ (last access: 4 January 2024), 2018.
Stevens, N., Lehmann, C. E. R., Murphy, B. P., and Durigan, G.: Savanna woody encroachment is widespread across three continents, Glob. Change Biol., 23, 235–244, https://doi.org/10.1111/gcb.13409, 2017.
Toft, N. L., Anderson, J. E., and Nowak, R. S.: Water use efficiency and carbon isotope composition of plants in a cold desert environment, Oecologia, 80, 11–18, https://doi.org/10.1007/BF00789925, 1989.
Trenberth, K. E., Dai, A., Rasmussen, R. M., and Parsons, D. B.: The Changing Character of Precipitation, B. Am. Meteorol. Soc., 84, 1205–1218, https://doi.org/10.1175/BAMS-84-9-1205, 2003.
Venter, Z. S., Cramer, M. D., and Hawkins, H.-J.: Drivers of woody plant encroachment over Africa, Nat. Commun., 9, 2272, https://doi.org/10.1038/s41467-018-04616-8, 2018.
Volenec, Z. M. and Belovsky, G. E.: The interaction of temperature and precipitation determines productivity and diversity in a bunchgrass prairie ecosystem, Oecologia, 188, 913–920, https://doi.org/10.1007/s00442-018-4247-7, 2018.
Wang, J. and Sammis, T. W.: New automatic band and point dendrometers for measuring stem diameter growth, Appl. Eng. Agric., 24, 731–742, 2008.
Ward, D., Wiegand, K., and Getzin, S.: Walter's two-layer hypothesis revisited: back to the roots!, Oecologia, 172, 617–630, https://doi.org/10.1007/s00442-012-2538-y, 2013.
Wilcox, B. P., Birt, A., Fuhlendorf, S. D., and Archer, S. R.: Emerging frameworks for understanding and mitigating woody plant encroachment in grassy biomes, Curr. Opin. Environ. Sust., 32, 46–52, https://doi.org/10.1016/j.cosust.2018.04.005, 2018.
Wood, S. N.: Stable and Efficient Multiple Smoothing Parameter Estimation for Generalized Additive Models, J. Am. Stat. Assoc., 99, 673–686, https://doi.org/10.1198/016214504000000980, 2004.
Xu, X., Medvigy, D., and Rodriguez-Iturbe, I.: Relation between rainfall intensity and savanna tree abundance explained by water use strategies, P. Natl. Acad. Sci. USA, 112, 12992–12996, https://doi.org/10.1073/pnas.1517382112, 2015.
Zarebanadkouki, M., Trtik, P., Hayat, F., Carminati, A., and Kaestner, A.: Root water uptake and its pathways across the root: quantification at the cellular scale, Sci. Rep.-UK, 9, 12979, https://doi.org/10.1038/s41598-019-49528-9, 2019.
Zhou, M., Wang, J., Bai, W., Zhang, Y., and Zhang, W.-H.: The response of root traits to precipitation change of herbaceous species in temperate steppes, Funct. Ecol., 33, 2030–2041, https://doi.org/10.1111/1365-2435.13420, 2019.