the Creative Commons Attribution 4.0 License.
the Creative Commons Attribution 4.0 License.
 | 08 Apr 2024
A critical trade-off between nitrogen quota and growth allows Coccolithus braarudii life cycle phases to exploit varying environment
Joost de Vries
Fanny Monteiro
Gerald Langer
Colin Brownlee
Glen Wheeler
Coccolithophores have a distinct haplo-diplontic life cycle, which allows them to grow and divide into two different life cycle phases (haploid and diploid). These life cycle phases vary significantly in inorganic carbon content and morphology and inhabit distinct niches, with haploids generally preferring low-nitrogen and high-temperature and high-light environments in situ. This niche contrast indicates different physiology of the life cycle phases, which is considered here in the context of a trait trade-off framework, in which a particular set of traits comes with both costs and benefits. However, coccolithophore's phase trade-offs are not fully identified, limiting our understanding of the functionality of the coccolithophore life cycle. Here, we investigate the response of the two life cycle phases of the coccolithophore Coccolithus braarudii to key environmental drivers: light, temperature, and nitrogen, using laboratory experiments. With these data, we identify the main trade-offs of each life cycle phase and use models to test the role of such trade-offs under different environmental conditions.
The lab experiments show the life cycle phases have similar cell size, minimum nitrogen quotas, uptake rates, and temperature and light optima. However, we find that they have different coccosphere sizes, maximum growth rates, and maximum nitrogen quotas. We also observe a trade-off between maximum growth rate and maximum nitrogen quota, with higher growth rates and low maximum nitrogen quotas in the haploid phase and vice versa in the diploid phase.
Testing these phase characteristics in a numerical chemostat model, we find that the growth–quota trade-off allows C. braarudii to exploit variable nitrogen conditions more efficiently. Because the diploid ability to store more nitrogen is advantageous when the nitrogen supply is intermittent, the higher haploid growth rate is advantageous when the nitrogen supply is constant.
Although the ecological drivers of C. braarudii life cycle fitness are likely multi-faceted, spanning both top-down and bottom-up trait trade-offs, our results suggest that a trade-off between nitrogen storage and maximum growth rate is an essential bottom-up control on the distribution of C. braarudii life cycle phases.
- Article
(3869 KB) - Full-text XML
- BibTeX
- EndNote


Coccolithophores are important contributors to the carbon cycle. Their influence stems from their impact on the organic carbon pump through photosynthesis and the inorganic carbon pump through calcium carbonate production (Zeebe, 2012; Passow and Carlson, 2012; Boyd et al., 2019). Although both carbon pumps influence the global ocean carbon cycle, they have opposing effects. While the organic carbon pump sequesters carbon, the inorganic carbon pump releases carbon back into the atmosphere on short timescales (less than 104 years) (Zeebe, 2012).
Coccolithophores utilise a haplo-diplontic life cycle, which makes them distinct from other phytoplankton and allows them to grow and divide into both the haploid and diploid life cycle phases (Dassow and Montresor, 2011; Frada et al., 2018). These two life cycle phases have different inorganic and organic carbon contents (the PIC : POC ratio), with the diploid life cycle phase generally more heavily calcified (Cros et al., 2000; Young et al., 2003; Daniels et al., 2016; Fiorini et al., 2011a, b; Frada et al., 2018). The two life cycle phases furthermore tend to have distinct niches, with the haploid cells found in lower nutrients and higher temperature and light environments (de Vries et al., 2021). These distinct niches and differences in PIC : POC ratios imply coccolithophore life cycle phases impact the organic and inorganic carbon pump differently. Nonetheless, the differential impact of coccolithophore life cycle phases is poorly understood, partly because we lack a quantitative understanding of the drivers behind the haploid and diploid distribution.
Physiology drives the growth response of phytoplankton to the environment. Understanding the physiological differences between coccolithophore life cycle phases and the subsequent impact on growth rate is thus key to understanding coccolithophore life cycle distribution. Here, we investigate the physiological differences of the coccolithophore C. braarudii within a trait-based framework to contextualise our results. In this framework, each trait is considered to have both costs and benefits, thus presenting trade-offs for organisms utilising such traits (Kiørboe et al., 2018). Since trait-based approaches focus on traits rather than individual species, these results can be applied to other coccolithophore species.
Coccolithus braarudii is a key coccolithophore species in the Arctic Ocean, where it dominates coccolithophore calcium carbonate production because of its much larger size and calcium carbonate content than Emiliania huxleyi, which numerically dominates this region (Daniels et al., 2014). The life cycle phases of Coccolithus braarudii are morphologically distinct, with the haploid life cycle phase utilising a holococcolith (HOL) morphology and the diploid life cycle phase utilising a heterococcolith (HET) morphology (Houdan et al., 2004). Most lab work on C. braarudii has focused on the HET phase, with research on the HOL life cycle phase much more limited (Houdan et al., 2006; Langer et al., 2022).
The distribution of Coccolithus braarudii varies in the ocean with C. braarudii HET dominating high-nitrogen and turbulent regions, while C. braarudii HOL is primarily found in lower-nitrogen and more stratified regions (Malinverno et al., 2009; D'Amario et al., 2017). While some previous work suggests that differential response to turbulence (Houdan et al., 2004) and light (Langer et al., 2022) could drive this distribution difference, open questions remain about how physiology differs between the two life cycle phases.
For our experiments on C. braarudii, we focus on cell size, coccosphere size, nitrogen uptake rates, nitrogen quotas, and photosynthetic response (Fig. A1 in the Appendix). These traits have been shown to influence phytoplankton distribution and can be defined in deterministic modelling frameworks (Hansen, 1994; Hansen et al., 1997; Ward et al., 2018; Litchman et al., 2007; Follows et al., 2007; Dutkiewicz et al., 2015). For instance, cell size influences nitrogen uptake rates (Ward et al., 2018; Litchman et al., 2007), while coccosphere size influences grazing dynamics by increasing the coccolithophore diameter (Hansen, 1994; Hansen et al., 1997). Nitrogen quota influences nitrogen requirement (Litchman et al., 2007) and storage (Falkowski and Oliver, 2007; Grover, 1991). Photosynthetic response influences light optima and has previously been suggested to be a key driver in Coccolithus braarudii life cycle distribution (Langer et al., 2022). We also investigated differences in temperature optima, as this is a major driver of coccolithophore life cycle phases in situ (de Vries et al., 2021).
We compare changes in coccolithophore traits for three C. braarudii HET and three C. braarudii HOL life cycle phases in response to light, nitrogen, and temperature. In addition, we measure their nitrogen and DNA contents. Finally, we contextualise our results with a mechanistic model to investigate whether the trait differences provide any competitive advantage to each of the life cycle phases.
This research elucidates what fundamentally separates the two life cycle phases from a bottom-up perspective and lays the groundwork for incorporating the coccolithophore life cycle into ecosystem models.
2.1 Strains and culture conditions
The Coccolithus braarudii strains utilised in our study are the HET strains PLY182g, RCC6535, and RCC1200 and the HOL strains RCC1203, RCC3777, and RCC3779. PLY182g was obtained from the Marine Biological Association (MBA) culture collection, while we obtained the rest of the cultures from the Roscoff Culture Collection (RCC). All strains were maintained using K/2 media (Probert and Houdan, 2004), which we prepared using water from the L1 station in the Plymouth Sound (Smyth et al., 2010). All cultures were maintained at 15 °C in a temperature-controlled room, at 50 µE m−2 s−1 under a 12:12 L : D cycle. During the experiments, all cultures were maintained in 50 mL tissue culture flasks with 20 mL of media. Each experiment was conducted in triplicate and in a temperature-controlled room.
Most strains were isolated near coastal regions in Europe (Fig. 1), except RCC1200, which was isolated off the coast of Namibia and RCC6535, which was isolated in New Zealand. All HOL strains were collected during the winter, while the HET strains RC6535 and RC1200 were collected in the summer. The collection date of PLY182g is unknown, but as this species tends to only occur in Plymouth during the winter (Widdicombe et al., 2010), it was likely collected during this period.
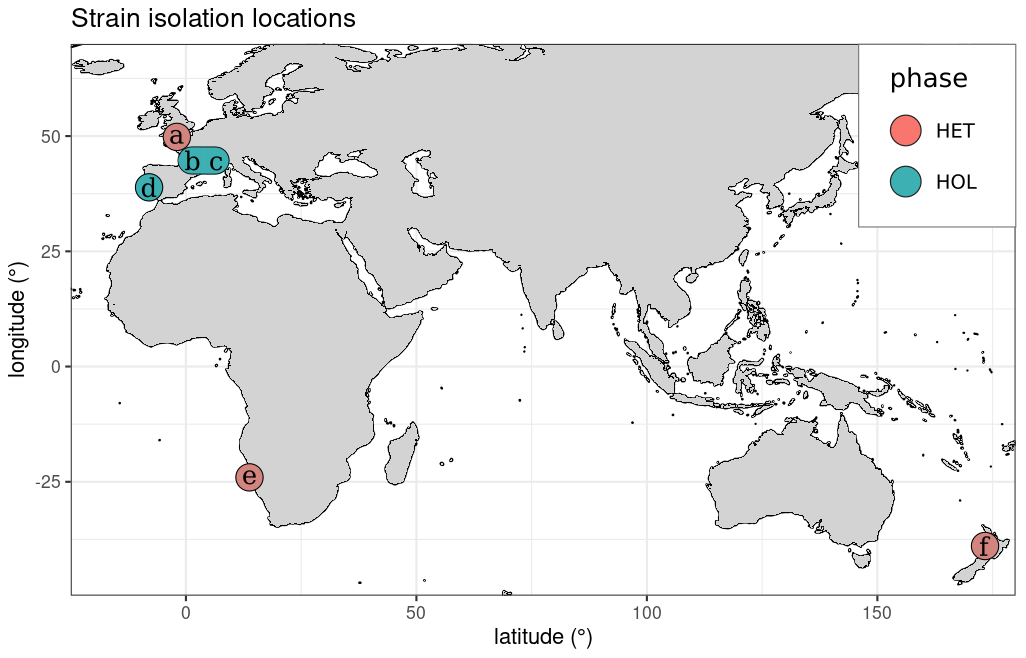
Figure 1Isolation locations of the strains utilised in this study. The six strains investigated were (a) PLY182g (HET), (b) RCC1203 (HOL), (c) RCC3777 (HOL), (d) RCC3779 (HOL), (e) RCC1200 (HET), and (f) RCC6535 (HET).
2.2 Nitrogen limitation experiments
Nitrogen limitation experiments were conducted by modifying the K/2 media from an initial NO3 concentration of 220.5 µM down to 20 µM. At this nitrogen concentration, final cell counts reached approximately 20 000 cells mL−1, a cell density high enough for carbon and nitrogen analysis but low enough that we did not observe the effects of unbalanced carbonate chemistry (Langer et al., 2022). All nitrogen limitation experiments were conducted once the cells reached the stationary phase, assuming that the cells had drawn down all nitrogen in the media – but not other nutrients such as phosphate and trace elements.
2.3 Cell size
We measured cell size by imaging cells using a Leica DMi8 inverted microscope and analysed them using the Python package scikit-image (van der Walt et al., 2014). For each measurement, at least 100 cells were counted per strain. Specifically, we segmented the images using scikit-image Sobel segmentation (Sobel and Feldman, 1968) and then manually sorted regions of interest by removing out-of-focus images, clusters, and detritus. Assuming spherical cells, we estimated cell volume based on the mean of the longest diameters of each image.
Cell size was measured for each strain in both nutrient-replete and nutrient-depleted cultures. Microscopy images were taken at the same time of day (11:00 GMT) to minimise the influence of cell divisions on cell size across strains (Kottmeier et al., 2020). Before imaging, the HET and HOL strains were decalcified by exposing the cultures to 1 M HCL to decrease the pH to 3 and then adding 1 M NaOH to restore the pH. HOL cultures were treated for 1 min and HET coccolithophores for 5 min, as we found these to be the shortest durations that decalcify the cells.
2.4 Growth rates
For replete experiments, growth rates were estimated using change in cell abundance over time as estimated using a fluorescence plate (BMG LABTECH) with chlorophyll fluorescence excitation at 420 nm and at 680 nm – which were calibrated against manual Sedgewick Rafter counter (SRC) counts. For nitrogen-replete cultures, this method worked well, with R2 values above 0.95 for all calibrations. Growth rates for nitrogen-deplete experiments were estimated using only SRC counts, as fluorescence was found to be a poor proxy (R2<0.8), likely due to an influence of nitrogen depletion on chlorophyll concentrations and, subsequently, fluorescence.
For each experiment, cultures were inoculated at approximately 500 cells mL−1 and grown until approximately 10 000–20 000 cells mL−1. This initial concentration was chosen as this is near the detection limit of the fluorescence plate reader. Cell density was measured daily. The growth rate was then estimated by fitting a linear model to log-transformed counts, including only points exhibiting exponential growth and removing counts in the stationary phase.
2.5 Temperature optima
To measure the temperature response of the different strains, each strain was grown in triplicate under nitrogen-replete conditions under 50 µE m−2 s−1 of light at 14, 15, 18, and 20 °C and a 12 : 12 L : D light cycle. The cultures were acclimated for five generations before performing the temperature growth rate experiments. The growth rate for each temperature was measured using fluorescence with the BMG plate reader by inoculating cultures at 500 cells mL−1 and then measuring fluorescence daily until the cellular concentration of approximately 20 000 cells mL−1 was reached.
2.6 Light optima
For the light experiment, we tested seven light intensities (20, 50, 70, 100, 110, 140 µE m−2 s−1). All light sensitivity experiments were conducted at 18 °C as this was found to be the optimal temperature for all strains in our temperature-sensitivity experiments. Prior to the light sensitivity experiments, the cultures were acclimated for five generations. These acclimated cultures were then used to create new fluorescence-to-count calibration curves for the growth rate experiments. For the experiment, a full-spectrum Kessil A360W LED with 380 and 400 nm UV bands was used, which was kept on its whitest setting and a 12 : 12 L : D cycle. PAR for each treatment was determined using an LI-250A photometer (LI-COR).
Nitrogen limitation and quotas
We estimated the minimum and maximum nitrogen quotas for all five strains, called Qmin and Qmax. For Qmax, the maximum nitrogen content of a cell, nitrogen analysis of replete cells under exponential growth was used. This analysis was conducted by filtering the samples onto glass GF/F filters, freeze drying, and then combusting the samples in a CN elemental analyser, which was conducted by OEA Laboratories Limited (Exeter, UK). These values were then divided by cell counts to estimate cellular nitrogen concentrations.
The minimum nitrogen quota (Qmin) was estimated by dividing the absolute nitrogen concentration at the start of the experiment by the number of cells present once the cultures reached the stationary phase as described in Perrin et al. (2016):
where Ninit is the initial nitrogen concentration and cellsfin is the cell count at stationary phase.
2.6.1 Response of photosynthetic efficiency to nitrogen limitation
Photosynthetic efficiency () and electron transport rates (ETRs) (Maxwell and Johnson, 2000) were measured using pulse-amplitude modulation (PAM) for both nitrogen-replete and nitrogen-depleted cultures, which was conducted using a Walz WATER-PAM.
is a measurement of maximal photochemical yield of photosystem II and is conducted by exposing dark acclimated cells to a saturation pulse of light. Changes in values can represent both photodamage or enhanced radiative energy loss (a form of photoprotection). However, in practice, is generally interpreted as a proxy of algal health, with non-stressed and well-acclimated photosynthetic individuals boasting higher values than stressed individuals (Maxwell and Johnson, 2000). ETR is also a measure of photosynthetic yield but is measured in light-adapted cells and is a direct measurement of the quantum yield of photochemical energy conversion. Like it is commonly used as a measure of stress for photosynthetic organisms (Maxwell and Johnson, 2000). and ETR are computed rather than measured and thus are subject to assumptions such as equal distribution of energy across photosystem I and II and that the energy absorption is constant (Maxwell and Johnson, 2000). In theory, both of these parameters could change between the different life cycle phases, as well as under nutrient limitation (e.g. which could provoke a shift in the ratio of photosystem I to photosystem II). Thus, changes in ETR could also reflect some changes in these parameters (as well as changes in the actual electron transport rate) (Gorbunov and Falkowski, 2021).
For the nitrogen-replete experiment, cultures were grown under 220 µM NO3, and and ETR were measured during the exponential growth phase. For the nitrogen-depleted experimental cultures, cell growth was measured daily using cell counts, and and ETR were measured once cells ceased to divide. Before the and ETR measurements, cells were dark acclimated for 1 h under temperature-controlled conditions. For the measurements, was taken before measuring ETR response to PAR. Measurements were taken for only PLY182g, RCC6535, RCC3777, and RCC1203. RCC1200 and RCC3779 died before the Fv/FM, and ETR measurements were conducted.
In addition to ETR and measurements, we also conducted ETR rapid light curve (RLC) measurements. During this experiment, samples were exposed to actinic light at 5 s intervals with increasing intensity covering 30, 100, 150, 235, 350, 530, 785, 1100, and 1500 µE m−2 s−1, where ETR was determined at the end of each illumination period. RLC measurements provide insight into the physiological flexibility of the cells' photosynthetic apparatus to rapid changes in light intensity.
2.6.2 DNA extraction
DNA content for each strain was measured following methods described by Liefer et al. (2019). In brief, the cultures were grown under nitrogen-replete conditions in triplicate and harvested around 20 000 cells mL−1. The DNA was then extracted using N-laurylsarcosine as the surfactant in the extraction protocol. It was then stained with SYBR Green II (Thermo Fisher S7564) and quantified using a fluorescence-based microplate analysis at 490 nm, which was calibrated against known DNA content stocks (Sigma, D4522-1MG). DNA was measured only for replete cultures.
2.7 Statistical analysis
To determine if HOL and HET cell size, coccosphere size, growth rates, DNA content, nitrogen quotas, and nitrogen uptake rates were significantly different, we conducted a two-sample t test for each parameter. The influence of the life cycle phase on temperature and light optima was determined by fitting a generalised additive model (GAM), which included the life cycle phase as a predictor, where, if the phase was found not to have a significant influence on model fit (p<0.05), the environmental response was interpreted as not being specific to the life cycle phase.
Analysis was conducted in R, and the t test was conducted with the “stats” package (R Core Team, 2022), while the GAM analysis was done with the “mgcv” package (Wood, 2011). Before fitting each GAM, growth data were minimum–maximum normalised for each species individually to remove the influence of ploidy-specific maximum growth rate differences.
2.8 Modelling
Nitrogen uptake experiments are tedious and expensive using reactor experiments. We thus follow an alternative strategy as proposed by Perrin et al. (2016) fitting models to batch culture experiments to derive the parameters. Our modelling strategy in this article is thus twofold: first, we fit a model to experimental data to derive nitrogen uptake parameters. We then use these data for a second model, simulating resource competition of the two life cycle phases under different nitrogen conditions and physiological parameterisations (so-called “sensitivity experiments”).
2.8.1 Model for nitrogen uptake estimations
Mechanistic modelling relies on our understanding of cellular physiology to represent cell growth and nitrogen limitation processes. This can be done with varying degrees of complexity ranging from simple models such as the Monod model, which assumes a direct relationship between nitrogen concentrations and growth rates (Monod, 1949), to very complex models such as that by Inomura et al. (2020), which represent individual cellular processes such as nitrogen storage, transfer, and reorganisation of cellular machinery. Here we utilise an internal quota cellular model, an intermediate-complexity mechanistic model, which accounts for cellular nitrogen storage but does not trace individual cellular processes. Such models can take several forms, including Droop and linear models as described in detail in Flynn (2008). Here we employ the normalised rectangular hyperbolic (RH) model as proposed by Flynn (2002), which includes a response variable, which modulates the relationship between nitrogen quota and growth.
Conceptually, the RH internal nitrogen model regulates growth rates based on the available internal nitrogen, which depends on the nitrogen uptake rate and the concentration of external nitrogen (Eqs. 3–7). The model traces environmental nitrogen concentration (N, µMol L−1), the cellular concentration (P, cells L−1), and the internal nitrogen quota (Q, µmol cell−1) using the following three differentials:
where μ is the growth rate (d−1) and V is the nitrogen uptake rate (µmol cell−1 d−1).
The modelled growth rate μ depends on the nitrogen quota, which we define here following the RH formulation of Flynn (2002):
where μmax (d−1) is the maximum growth rate under nitrogen-replete conditions, Qmin (pgN cell−1) is the minimum cellular nitrogen quota, Qmax (pgN cell−1) is the maximum cellular nitrogen quota, and KQ is a dimensionless parameter that determines the relationship between the internal nitrogen quota and growth rate.
We estimate KQ based on Qmin and Qmax as defined by Flynn (2008):
In this equation, strains with a small ratio of minimum to maximum nitrogen quotas have a strong linear relationship between growth rate and nitrogen quota. At the same time, strains with a large minimum to maximum nitrogen quota ratio exhibit a non-linear relationship between nitrogen quota and growth (Flynn, 2008).
The cellular nitrogen quota (Q) is replenished based on the cellular nitrogen uptake rate, which we define here using Michaelis–Menten uptake kinetics while also limiting uptake when the cellular nitrogen quota is full:
where Vmax is the per cellular nitrogen uptake rate (in µMolR cell−1 d−1) and KN is the Michaelis–Menten half-saturation constant (in µMol L−1).
2.8.2 Estimating nitrogen uptake rate using the internal storage model
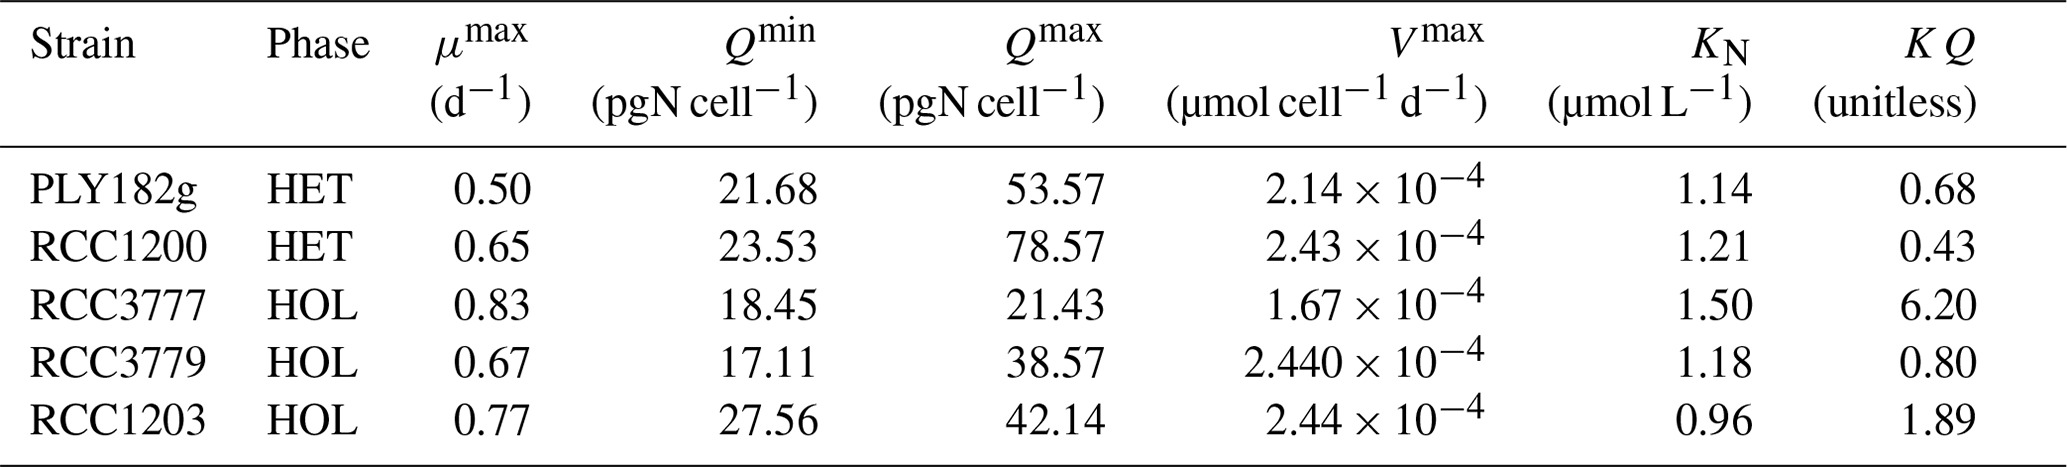
The internal store model used in our study includes six key parameters (see Eqs. 3–7): μmax, Vmax, Qmin, Qmax, KN, and KQ (Table 1). We empirically measured and estimated Qmin and Qmax from our lab experiments (see Sect. 2.6.1). The other parameters were estimated through previously described relationships or fitting models to our lab data, as this approach is cost and time-effective and works well (Perrin et al., 2016). We calculated KQ using Eq. (6) and approximated μmax, Vmax and KN using the models described below.
Maximum growth rate
We estimated the maximum growth rate (μmax) by fitting the sigmoidal function described by Zwietering et al. (1990) and Ward et al. (2018) to our nitrogen limitation experiment data.
where A is the log of the maximum cell density (cells mL−1) observed in the experiment, λ is the lag time (d−1) defined as the time the tangent to the curve at its inflection point equals 0.
Maximum nitrogen uptake rate
We estimated the maximum nitrogen uptake rate (Vmax) for each strain by simplifying the equation proposed in Verdy et al. (2009):
Assuming that the realised maximum growth rate (μmax) approximates the theoretical maximum growth rate (μ∞) as proposed by Ward et al. (2018) for cells >10 µm and re-arranging Eq. (9) for Vmax leads to the following equation:
Maximum nitrogen uptake rate
For the remaining unknown parameter, the half-saturation constant for nitrogen uptake (KN), we used a non-linear least squares fitting procedure to fit the internal nitrogen store model to our laboratory data. This fitting was conducted by minimising error through “basin-hopping” of mean squared errors calculated for each set of parameter estimations (Wales and Doye, 1997). Basin-hopping was conducted with the “basinhopping” function in Python from the scipy.optimise library (Virtanen et al., 2020).
We constrained KN to be positive as, empirically, the half-saturation constant for growth cannot be negative. This was done by forcing the mean squared error value to infinity if bounds were not met (a high mean squared error value indicates a bad fit). Bounds for KN were defined the same for all strains and set to be between 1e−99 and 1e99. Initial fitting KN estimates were based on Emiliania huxleyi data from Perrin et al. (2016) and set to values of 0.35 µMol L−1.
2.8.3 Chemostat model
To better visualise and interpret the impact of the different nitrogen dynamics of the different coccolithophore strains, we developed a numerical “chemostat” model. This model simulates resource competition between the HET and HOL strains, differentiated by their maximum growth rates and nitrogen storage, as observed in the lab experiments.
For our chemostat model, we forced fluxes of nitrogen concentration using a pulse wave, which we define using a Fourier series expansion:
where A is the pulse amplitude (µm), τ is the pulse length (d−1), T is the pulse period (d−1), t is time (d), and n (unitless) is the integer multiple (which determines the “squareness” and is set as 100).
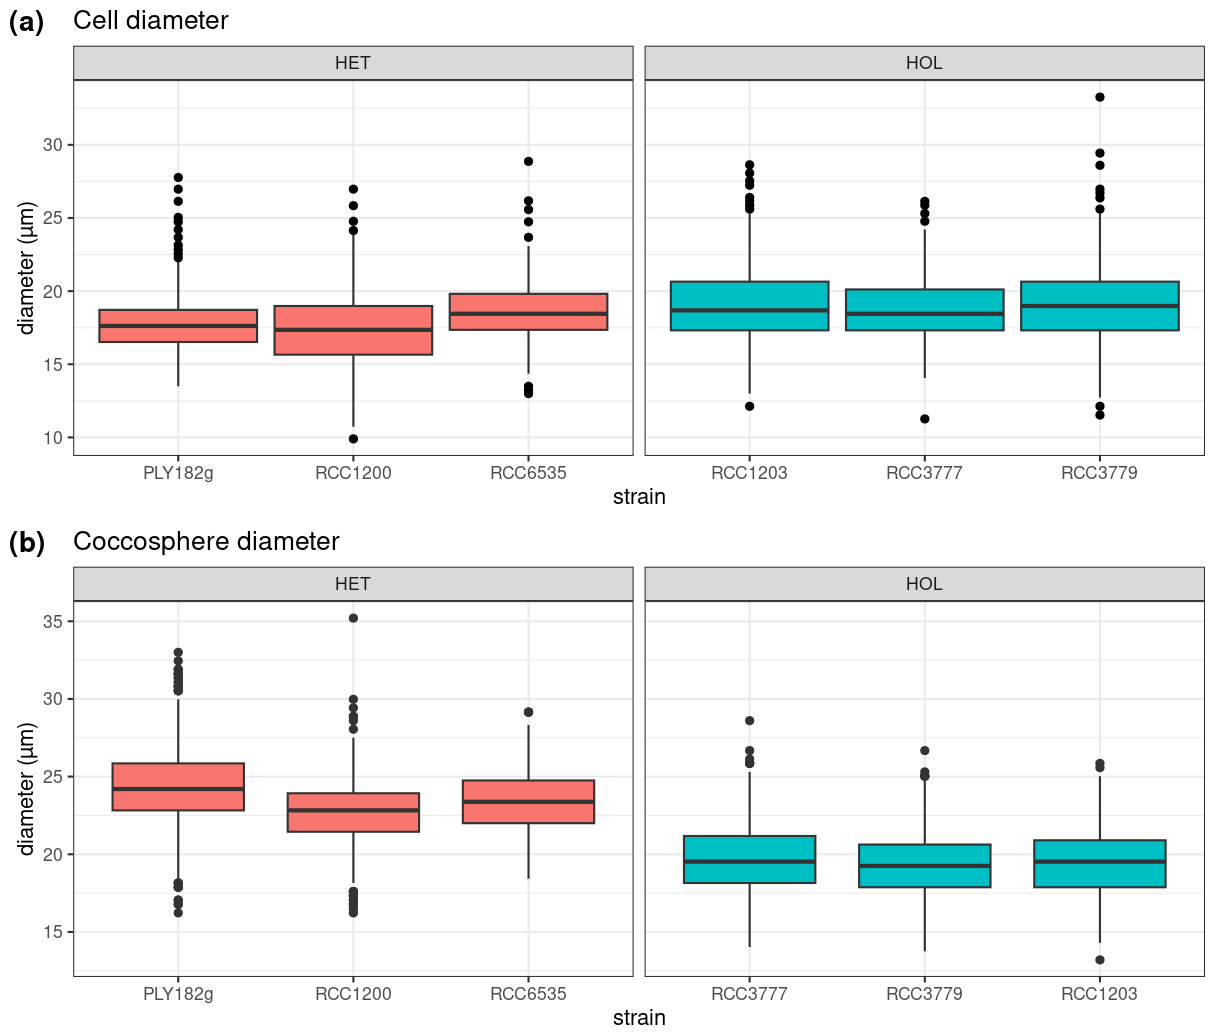
Figure 2Comparison of cell and coccosphere sizes in cultured C. braarudii strains (N=100). Diameters of (a) cells and (b) coccospheres (µm) as measured by light microscopy imaging.
To model phytoplankton abundance of both HET and HOL strains in our model, we follow the equations described in Follows et al. (2018). However, we imposed a quadratic mortality term m (d−1) to represent viral lysis, grazing pressure, and sinking as this is proposed to be more realistic (Steele and Henderson, 1992). We also included a chemostat turn-over term κ (d−1). In this model cell concentration of a given phytoplankton i is
The growth rate (μi) in this model follows the Flynn (2002) internal nitrogen model as described in Eq. (4).
Following Follows et al. (2018), we modelled the internal nitrogen quota for a given phytoplankton i as a function of nitrogen uptake rate and growth with a quadratic mortality term:
where Vi is limited as the quota approaches the maximum value to prevent excess nitrogen accumulation following Eq. (6).
For all our numerical experiments, we used the Python SciPy “solve_ivp” function to integrate the system of ordinary differential equations using the RK45 algorithm described by Dormand and Prince (1980).
2.8.4 Sensitivity experiment
Using the chemostat model, we explored the sensitivity of the maximum nitrogen quota (Qmax), as this is the main trait difference observed between the HET and HOL strains across our temperature, light, and nutrient experiments.
Mechanistically, a high Qmax relates directly to nitrogen storage and, in theory, benefits the organism when nitrogen supply is intermittent. Following the trait-based theory, Qmax should also have a cost; otherwise, it would lead to the evolution of “superorganisms” out-competing everything else (Follows and Dutkiewicz, 2011). Among the potential costs of nitrogen storage, the metabolic cost seems the most compelling cost since Qmax is inversely related to maximum growth in our lab results, and as specified by previous literature (Grover, 1991).
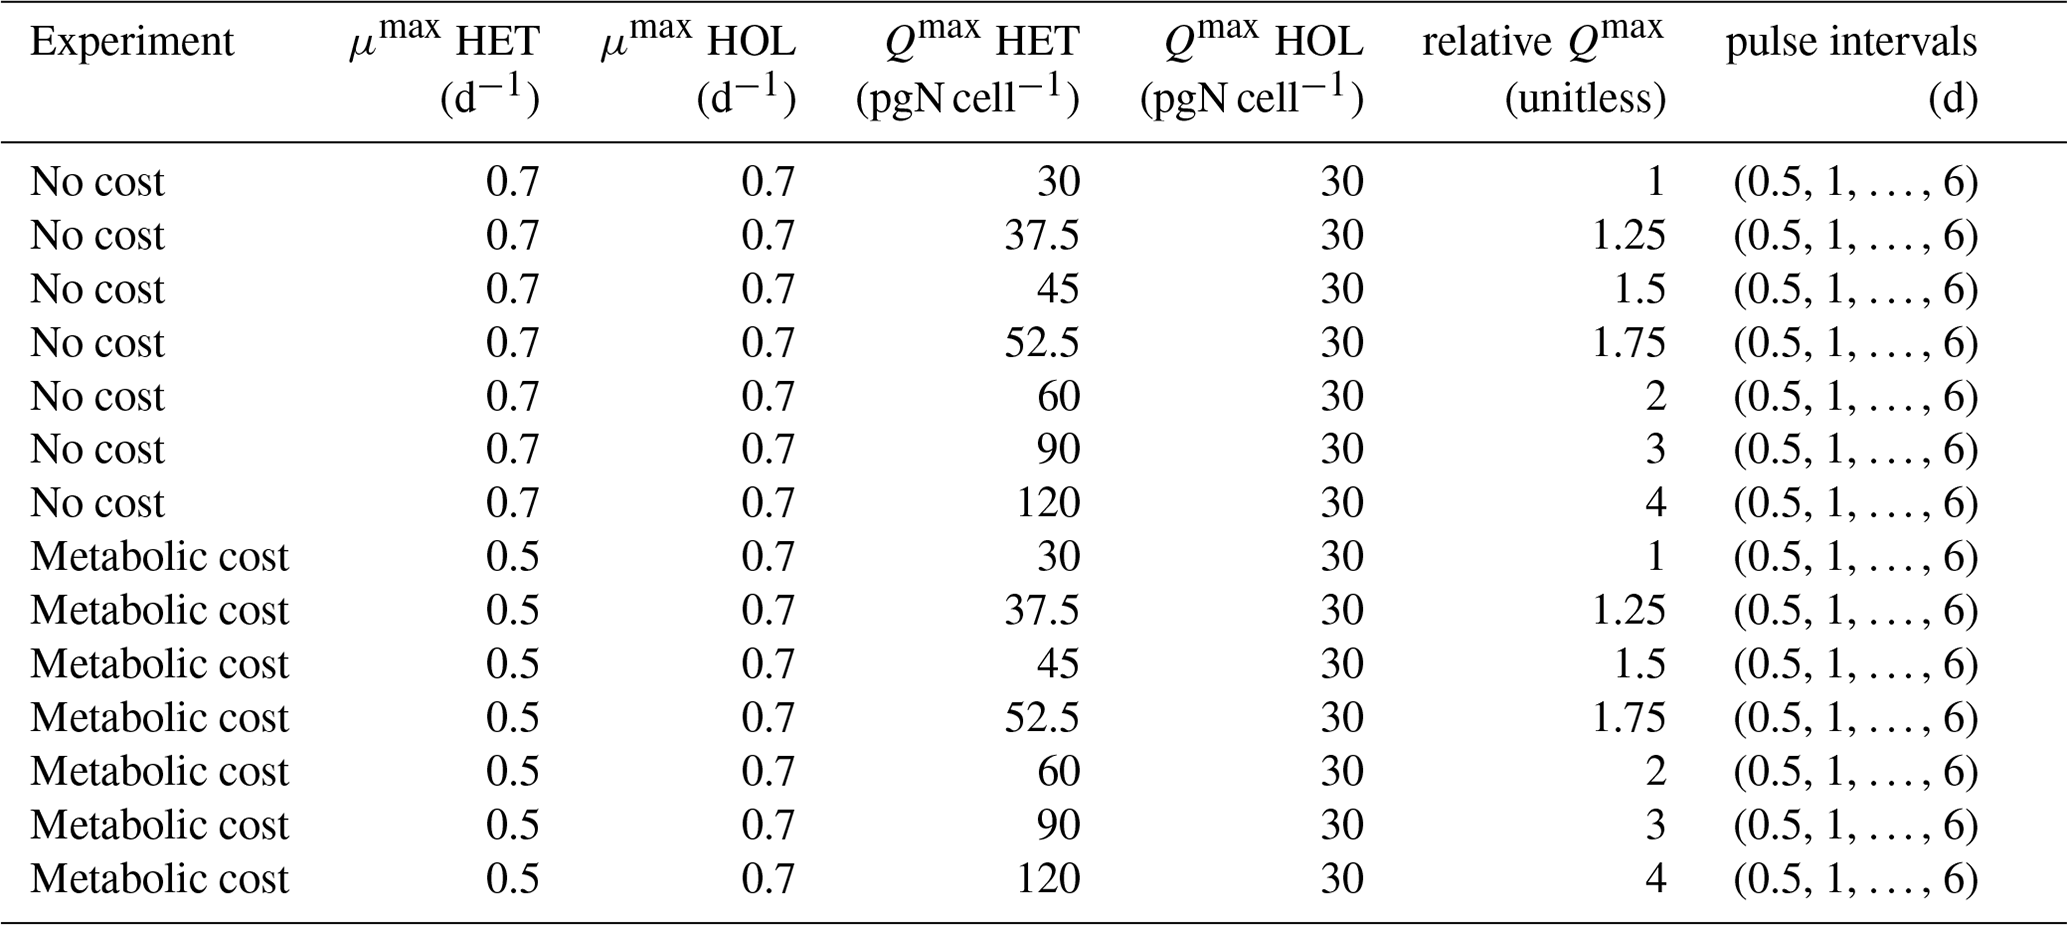
We thus explored the competitive advantage of a higher Qmax under different nitrogen intermittence input regimes, testing nitrogen concentrations ranging from steady states to inputs only once every 4 d. We did this by comparing relative HET and HOL abundances under different input scenarios with and without a metabolic cost of nitrogen storage (Table A2). Metabolic cost was implemented as a reduced maximum growth rate for HET strains, which have a higher Qmax value. Reduced growth rate values for the metabolic cost experiment were chosen based on those observed in our experiments with HET cells assigned a maximum growth rate of 0.5 d−1, while the HOL cells were assigned a maximum growth rate of 0.7 d−1. Each competition experiment was run until relative abundances reached a steady state. Nitrogen concentration was kept constant and above saturation – although the exact nitrogen concentration did not impact relative abundances since KN and Vmax values were defined to be the same for both life cycle phases.
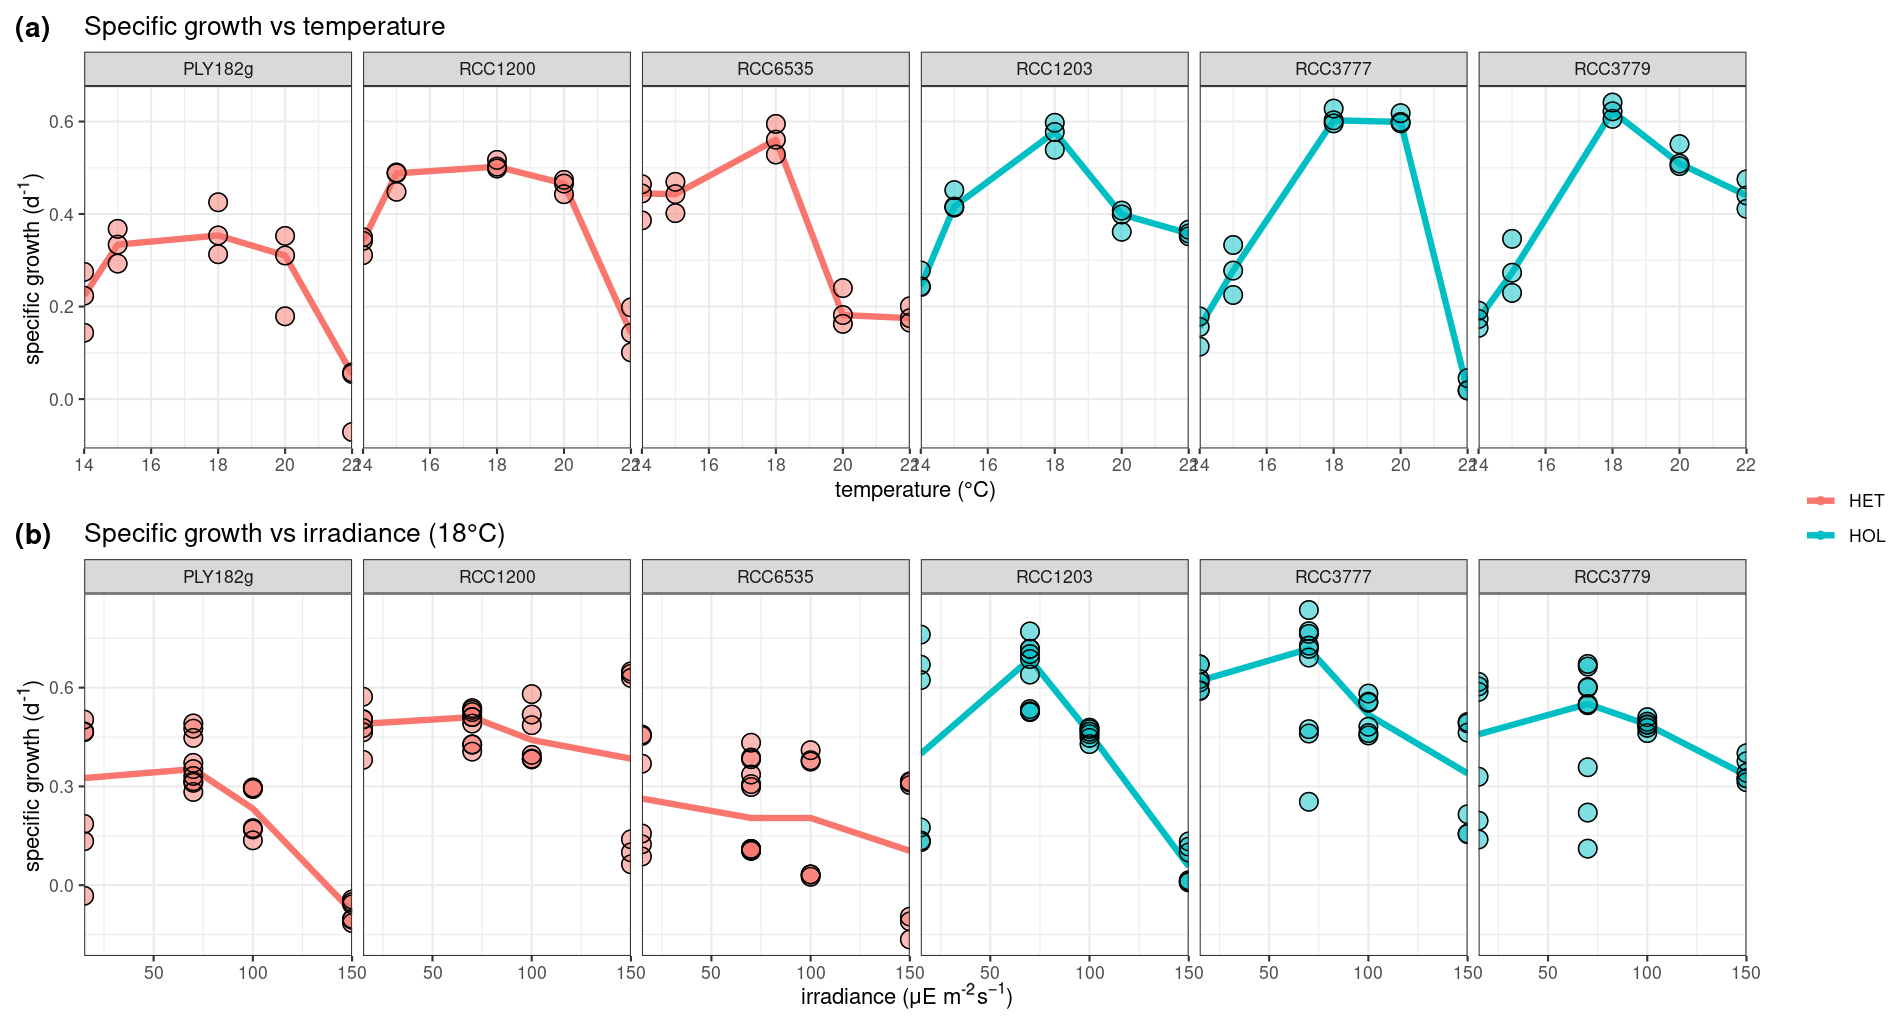
Figure 3Temperature and irradiance optima of C. braarudii HET and HOL strains. Optima for (a) temperature and (b) irradiance. N=3 for each boxplot.
3.1 Cell and coccosphere size
Under maintenance conditions (15 °C, µE m−2 s−1), all C. braarudii strains have a similar cell diameter (with a mean diameter of 18.2 ± 0.8 µM) (Fig. 2a) with no significant difference between HOL and HET strains (p value = 0.195). However, a significantly larger coccosphere size is observed for the HET strains (23.8 ± 2.4 µM) compared to the HOL strains (19.5 ± 2.2 µM, p value < 0.001) (Fig. 2b).
3.2 Light and temperature optima
Our lab experiments showed that all strains have a temperature optimum at 18 °C with a steep decline in growth at higher and lower temperatures (Fig. 3a). There is no significant difference in temperature optima between the two life cycle phases, as shown in our generalised additive model (p value = 0.061).
Response to light was found to be strain-specific (Fig. 3b), with no significant differences between the different life cycle phases (p value = 0.383). For example, only HET PLY182g and HOL RCC1203 display growth inhibition at 150 µE m−2 s−1, while the other strains do not. We note that our tested irradiance values are much lower than potentially experienced in situ, which can reach over 1000 µE m−2 s−1 in surface waters (Laliberté et al., 2016).
3.3 Maximum specific growth rates
Our light and temperature optima experiments suggest that overall HOL maximum growth rates (0.73 ± 0.07 d−1) are significantly higher than HET maximum growth rates (0.56 ± 0.07 d−1, p value < 0.001; Fig. 4).
3.4 Photosynthesis and nitrogen limitation
To test the response of nitrogen limitation on photosynthetic response, we measured HET and HOL cultures under nitrogen-replete and nitrogen-depleted conditions under maintenance conditions (15 °C, µE m−2 s−1). During the nitrogen repletion experiments, HET and HOL cells displayed similar maximal photosynthetic efficiency () (p value = 0.056) and higher electron transport rates (ETRs; p value = 0.004). When nitrogen-limited, both HET and HOL strains exhibit a reduced (Fig. 5). However, this inhibition is significantly higher during the nitrogen-depleted conditions for the HOL strains than for the HET strains (p value < 0.001). Furthermore, the HOL phases show highly reduced ETR during photosynthesis, especially when exposed to high light. These results suggest that the HOL life cycle phase allocates fewer resources towards its photosynthetic machinery when nitrogen-limited, reducing its photosynthetic efficiency and increasing its light inhibition sensitivity. This contrasts with the HET strains, which can maintain high photosynthetic efficiency when nitrogen-depleted.
3.5 Nitrogen and genome content
We find that the HET life cycle phase contains twice the DNA content of HOL (Fig. A2), indicating that all strains have a similar genome size and ploidy drives the variations in genome content for the HET and HOL strains investigated in this study. Under nitrogen-replete conditions (Fig. 6a), the genome content accounts for 5 %–15 % (10.7 ± 5.8 %) of the nitrogen budget, varying with the strains and with no significant difference between the phases (Fig. 6b). This percentage is similar to what is observed in diatoms, other algae, and cyanobacteria (Liefer et al., 2019; Geider and Roche, 2002). Notably, however, the minimum nitrogen quotas of the HET and HOL coccolithophore strains are very similar under nitrogen-depleted conditions, with no significant difference between the observed HET and HOL cells (p value = 0.985). Thus for HET to maintain a similar nitrogen quota under nitrogen-depleted conditions, they must restrict other cellular resources. However, what part of the nitrogen demand HET strains reduce is not clear.
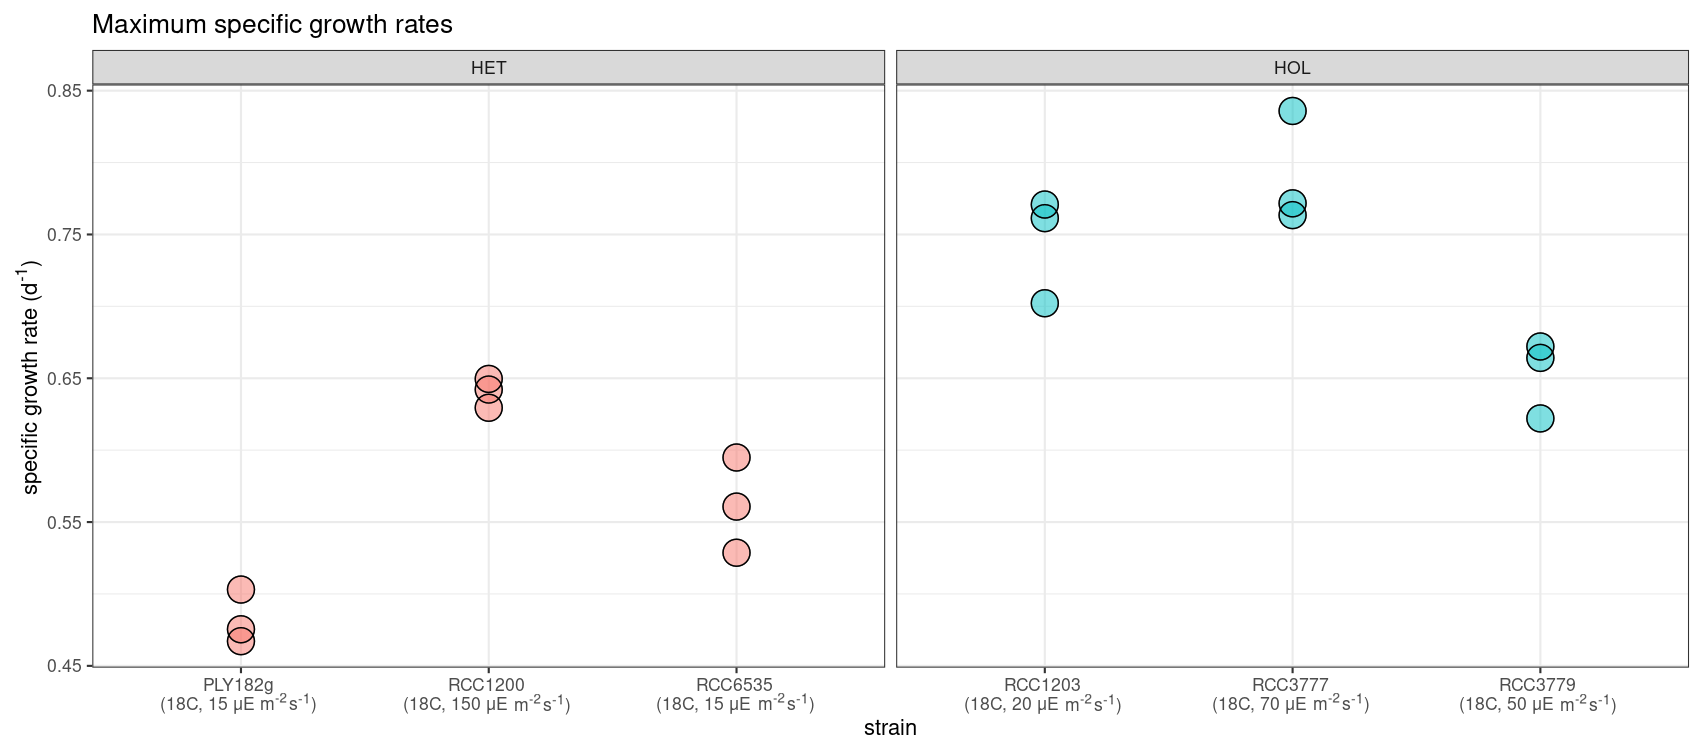
Figure 4Maximum specific growth rates (d−1) of C. braarudii strains at their respective temperature and light optima (N=3). Note that higher maximum specific growth rates are observed for HOL strains.
3.6 Nitrogen uptake rates and half-saturation constants
All strains show similar half-saturation constants (KN), maximum nitrogen uptake rates (Vmax), maximum growth rates (μmax), and minimum nitrogen quotas (Qmin) (Table 1, Fig. A1). Furthermore, there is no apparent difference between the HET and HOL life cycle phases (Fig. A2).
The only noticeable difference observed in our nitrogen parameter estimates is maximum nitrogen quotas (Qmax), which was significantly higher for HET strains (34.0 ± 11.1 pgN cell−1) compared to HOL strains (66.1 ± 17.7 pgN cell−1, p value < 0.001).
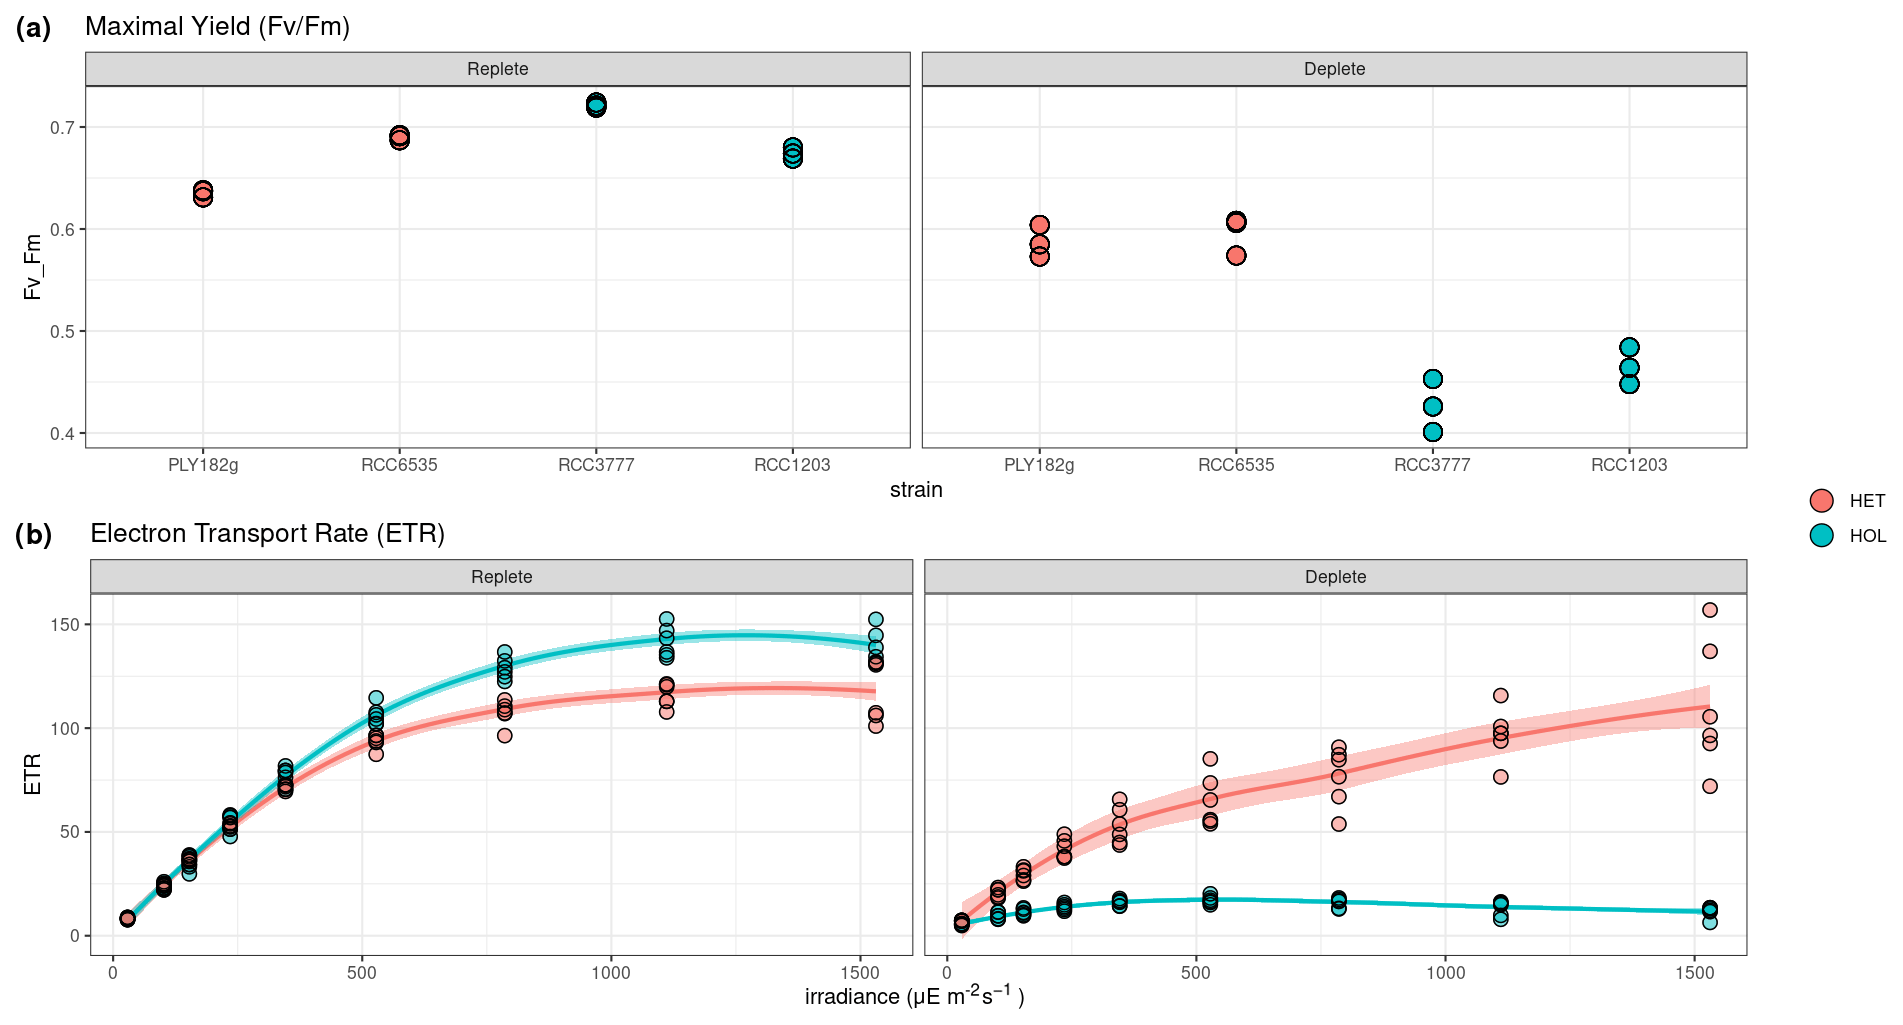
Figure 5Response of photosynthetic machinery to nitrogen limitation measured by pulse amplitude measurements (PAM). (a–b) Maximal yield () and (c–d) electron transport rate (ETR) in response to PAR. ETR results show the average values of the HET and HOL strains.
Table 1Model parameters for the five strains tested. Maximum growth rate (μmax), minimum nitrogen quota (Qmin), maximum nitrogen quota (Qmax), maximum nitrogen uptake rate (Vmax), nitrogen half saturation constant (KN), and ratio between minimum and maximum nitrogen quota (KQ).
3.7 Trait trade-offs
Overall, the only significant differences we observe between the HET and HOL strains are the coccosphere size, the maximum nitrogen quota (Qmax), and the maximum growth rate (μmax). Following trait-based approaches, we argue that the trait trade-offs for C. braarudii likely relate to those three trait characteristics. Of these traits, both trade-offs between calcification status and growth and maximum nitrogen quota and growth are plausible (Grover, 1991; Monteiro et al., 2016). However, as the influence of calcification status on growth is not noted in previous literature (Houdan et al., 2005), and we do not have PIC estimates of the HOL cells due to difficulties of making such estimates (Langer et al., 2022), we focus here on the implication of a maximum nitrogen quota and growth rate trade-off.
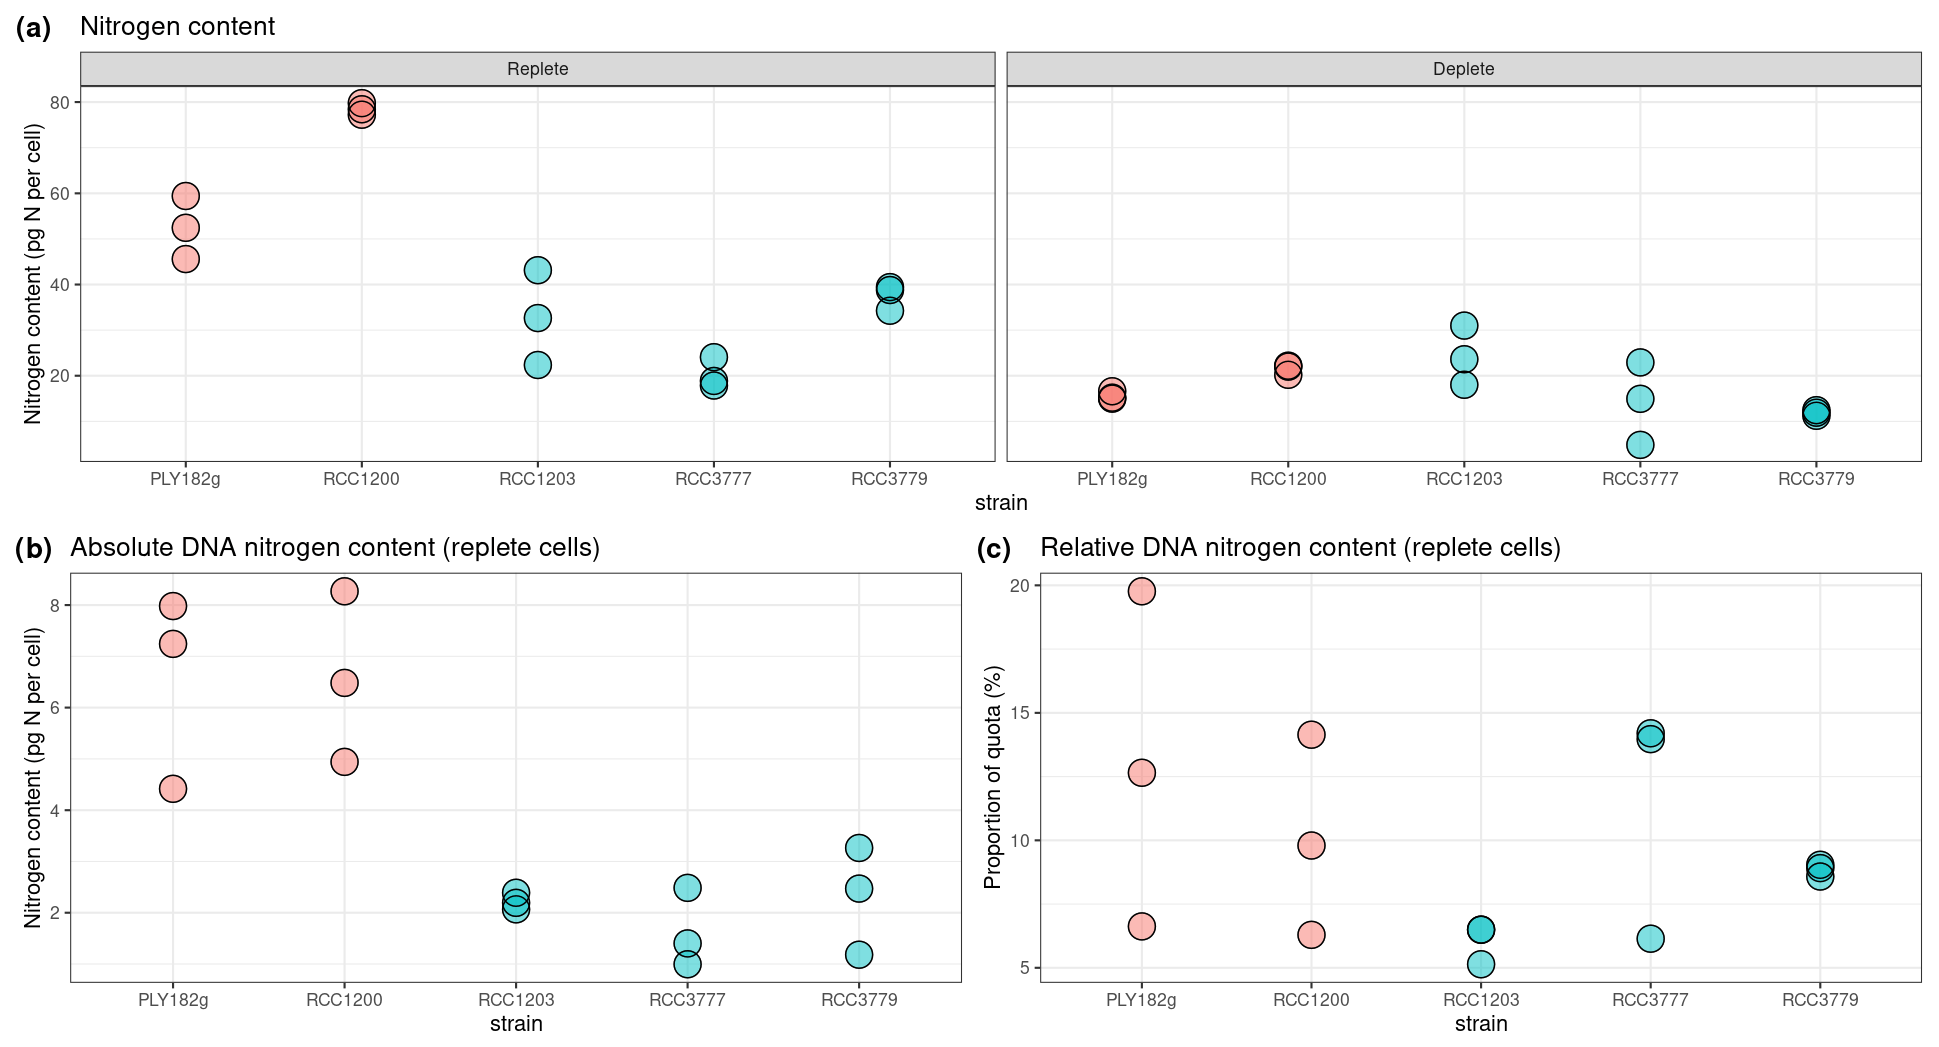
Figure 6Nitrogen and genome content per strain under replete and depleted nitrogen conditions. (a) Cellular nitrogen quota, where replete quota is equal to Qmax and depleted quota is equal to Qmin; (b) DNA content relative to nitrogen content.
3.8 Numerical simulation experiments
Our numerical simulations compared the ratio between HET and HOL cells due to different relative maximum nitrogen quota (Qmax) values as measured in our lab experiments (Fig. 7). Where HET cells contributed a higher proportion, this was interpreted as a higher competitive advantage of nutrient storage. We test the advantage of a higher nutrient storage (Qmax) with no cost (Fig. 7a) and with a reduced growth rate (0.5 and 0.7 d−1 for the HET and HOL cells, respectively).
Both sensitivity model experiments show a clear advantage of having high Qmax with intermittent nitrogen supply with and without a growth rate cost (relative Qmax; Fig. 7). However, this advantage decreases when nitrogen input is close to constant or when the relative Qmax is low and nitrogen input is intermittent (Fig. 7b).
With a relative Qmax between HET and HOL of C. braarudii of around 2 as measured in our lab study, the model shows that HET cells can be more competitive under nitrogen intermittent regimes despite their lower observed growth rates.
Our results generally agree with previous measurements made of C. braarudii. For our Qmax estimates of PLY182g, we observe a particulate organic nitrogen (PON) of 54 pgN cell−1, compared to a PON value of 40.6 pgN cell−1 reported in Villiot et al. (2021). For RCC1200, we observe a PON of 78.57 pgN cell−1, compared to a value of 94.8 pgN cell−1 in Gerecht et al. (2014). While there is no direct comparison for KN, the KN value of 1.06 µM reported by Cermeño et al. (2011) for strain RCC1201 is similar to our estimates of 1.14 and 1.21 µM for PLY182g and RCC1200, respectively. In terms of response to irradiance, compared to the work by (Langer et al., 2022), we notice stronger growth inhibition from 150 µE m−2 s−1 for the strain PLY182g. This difference could be due to experimental temperature differences, with our experiment conducted at 18 °C instead of 15 °C. The difference could also be due to the difference in light sources used in the two experiments, as we used an LED light with a UV band (390 to 400 nm) instead of the fluorescent light source with no UV used in Langer et al. (2022). Nonetheless, the trends in our study for the two strains are similar to those reported by Langer et al. (2022), with PLY182g HET showing a more potent light inhibition than RCC3777 HOL. Here, by analysing a series of strains, we find this difference is strain- and not ploidy-specific, as both HET and HOL life cycle phases exhibit differences in response to irradiance. Finally, our maximum growth rates of 0.5 for HOL and 0.7 for HET also agree well with Langer et al. (2022), who report maximum growth rates of 0.5 and 0.9 for PLY182g HET and RCC3777 HOL, respectively.
While our study expands on previous work considering only single strains, we are nonetheless limited by the strains utilised in this study, in particular, because the HET and HOL life cycle phases used are not from the same strain and are collected at different sampling locations. Furthermore, all strains were collected at coastal areas, with none in open-ocean locations. Follow-up experiments conducted with HET and HOL life cycle phases of the same strain and studies on strains collected in the open ocean would thus be very informative in further elucidating the differences we observe here.
Nonetheless, by utilising multiple strains and considering multiple traits in parallel, we expand on previous literature by showing that higher nitrogen quotas and the ability to deal with varying pulsed nitrogen regimes may be a main bottom-up control of the distribution of C. braarudii life cycle phases, with diploid C. braarudii investing more into nitrogen storage at the cost of lower growth rates but with the benefit of being able to deal with more intermittent nitrogen supplies. This result suggests that lower nitrogen intermittence during summer stratification rather than differences in nitrogen concentration could cause the in situ seasonal variation in HET and HOL coccolithophores observed in situ (de Vries et al., 2021), including C. braarudii (Malinverno et al., 2009; D'Amario et al., 2017).
Furthermore, previous studies also identified nutrient storage as an important driver of phytoplankton distribution in the modern ocean (Falkowski and Oliver, 2007; Grover, 1991), with turbulence affecting nutrient inputs (Falkowski and Oliver, 2007; Grover, 1991; Tozzi et al., 2004). While turbulence and nutrient input are not strictly the same process, they are generally considered as such in previous modelling experiments and literature (Falkowski and Oliver, 2007; Grover, 1991; Tozzi et al., 2004) and are used interchangeably here.
Besides, nutrient storage relates to functional types, with a succession of nutrient storage ability observed for diatoms, coccolithophores, and dinoflagellates (Margalef, 1978). For example, diatoms boast highly specialised nutrient storage vacuoles compared to dinoflagellates (Lomas and Glibert, 2000), which allows diatoms to exploit intermittent nutrient regimes better. Furthermore, differences in nutrient storage may influence the evolution and distribution of diatoms and coccolithophores on geological timescales (Tozzi et al., 2004). For instance, the early Panthalassa (250–190 Ma) and associated lower global turbulence seem to have favoured coccolithophores, while in the modern day, greater turbulence globally favours diatoms (Tozzi et al., 2004).
The potential role nutrient storage and turbulence play in determining phytoplankton distribution across geological timescales is interesting when contextualised with the idea that the haplo-diplontic life cycle of coccolithophores allows single species to expand their niche in the modern ocean (de Vries et al., 2021). This concept suggests that the coccolithophore life cycle might also prevent extinction across geological timescales, allowing adaptation toward a larger range of nutrient regimes. Differences in turbulence preference are also notable in the context of coccolithophore success during anthropogenic climate change, as climate models predict increased stratification in our near-future oceans (Fu et al., 2016).
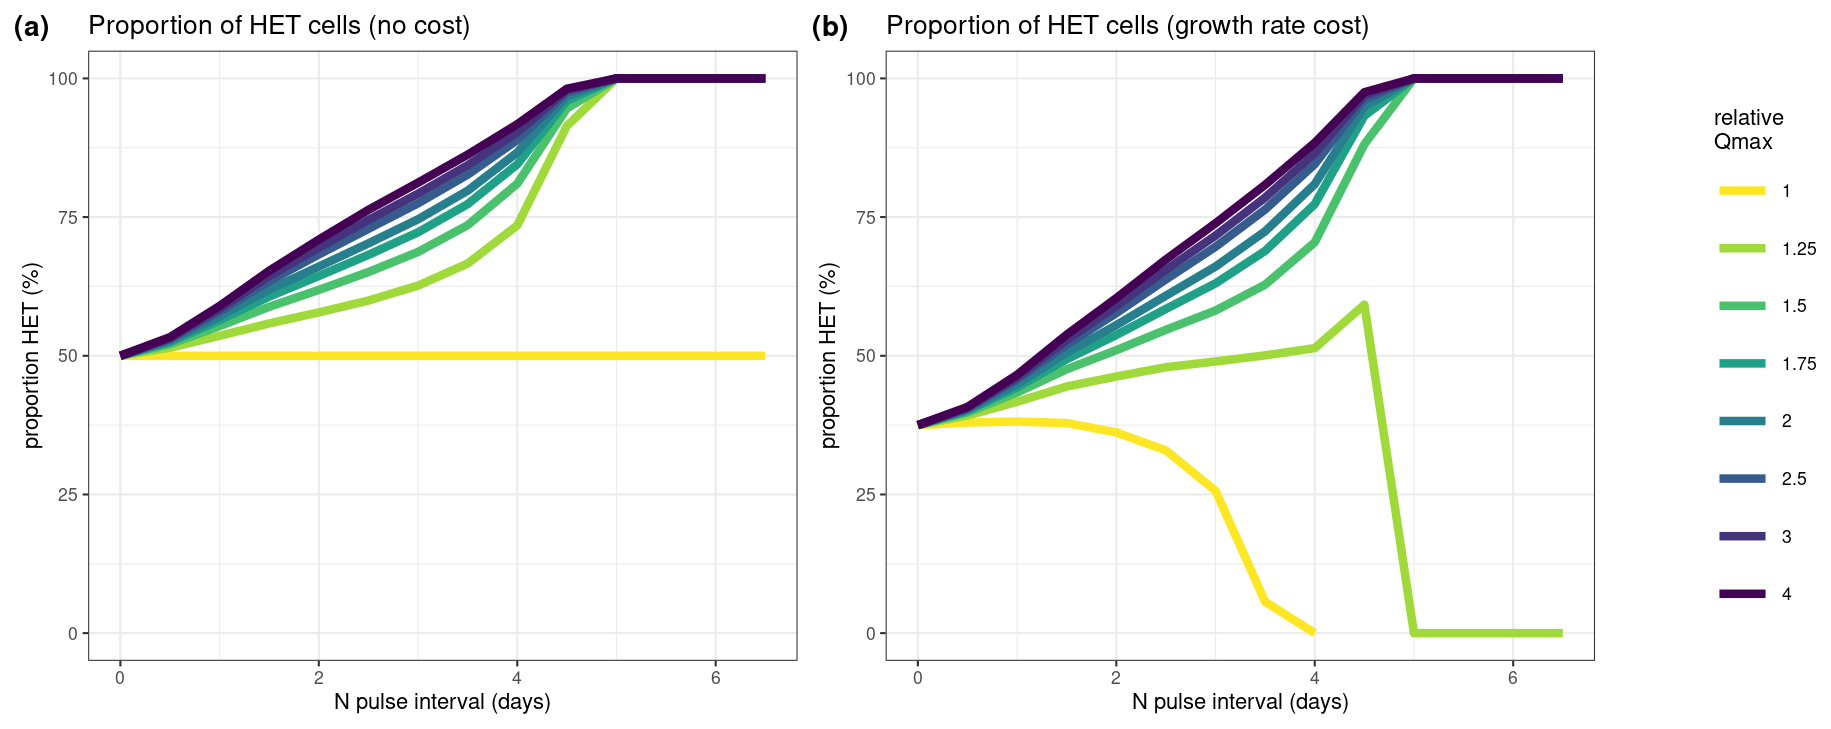
Figure 7Results of our numerical simulation experiments. Here we test how different values of maximum nitrogen quotas (Qmax) affect competition of HET and HOL cells under varying nitrogen pulses (N pulse interval). (a) Assuming no cost of a higher nitrogen quota (equal growth rates, μmax); (b) assuming a cost on growth rate where HET cells have a lower maximum growth rate (μmax=0.5 d−1) and HOL cells have a higher maximum growth rate (μmax=0.7 d−1). Different ratios of maximum nitrogen quotas were tested for each scenario, where relative Qmax is the ratio between HET and HOL Qmax. For example, a value of 2 denotes a HET Qmax twice the size of the HOL Qmax. The y axis in both plots denotes the proportion of diploid cells relative to the number of haploid cells.
The advantage of higher nutrient quotas comes from the ability to withstand more extended periods without nutrients and longer periods at which maximum uptake rate (Vmax) is sustained, as it takes longer for the quota to be satiated. Previous works by Verdy et al. (2009) and Grover (1991) suggest that a positive relationship between maximum uptake rates and higher nutrient quotas primarily drives this. However, here we illustrate that this effect occurs even when Vmax is similar, as even with the same Vmax values, it takes longer for the quota to reach maximum values if Qmax is high.
Besides HET's higher nitrogen storage ability, we furthermore observe significantly reduced photosynthetic ability for HOL cells in nitrogen-depleted conditions compared to HET cells. Although we do not explicitly model this effect, this could further differentiate the competitiveness of HOL coccolithophores when experiencing intermittent nitrogen supplies.
Finally, while we observe similar cell sizes of HET and HOL life cycle phases, a larger coccosphere size for HET life cycle phases is observed. The similarity in cell diameter but not in coccosphere size between the two life cycle phases suggests that the phases have the same size trait trade-off from a nitrogen perspective but a different trait trade-off regarding grazing susceptibility. The coccosphere volume does not impact nitrogen uptake dynamics on the first order since it does not increase the cell surface area but may impact grazing dynamics. Higher grazing protection of more heavily calcified HET life cycle phases might also be closely related to turbulence, as highly turbulent regimes are associated with higher predator encounters (Kiørboe, 1997). Furthermore, higher sinking rates associated with higher calcification states (Bach et al., 2012) might be unfavourable in highly stratified regions.
While our work focuses on nitrogen storage and the subsequent ability to deal with different nitrogen-input regimes, other trait differences, such as calcification, and traits not considered in this study, such as motility (Frada et al., 2018) and phagotrophy (Rokitta et al., 2011; Avrahami and Frada, 2020), mean the full trait-trade-off space of C. braarudii is difficult to constrain. Further model-based sensitivity analysis of such trait trade-offs in more complex ecosystem models could thus be useful in determining the role some of these other traits play. For example, in the context of our lab results, the impact of coccosphere size on grazing susceptibility without accounting for additional predator–prey effects could already be very informative in determining the role this might play on distribution dynamics.
Our study shows that the genome content of HET cells is twice that of HOL cells, but that, nonetheless, the nitrogen quotas of both phases are similar when nitrogen deplete, which suggests that the presence of other trade-offs not considered here might be essential in sustaining similar minimum nitrogen quotas for HET and HOL cells. While the nitrogen contribution of the genome is small, previous work has shown that for another coccolithophore species, E. huxleyi, genome content is a selective pressure in oligotrophic environments (Dassow et al., 2015). In such regions, multiple environmental isolates of this species have lost genes associated with the HOL life cycle phase and are therefore stuck in the HET phase (Dassow et al., 2015). However, a more thorough macromolecular analysis is necessary to elucidate which budgets diploid cells are reducing to make up for a higher nitrogen cost of the diploid genome. For this, proteomics would be particularly useful as it constitutes most of the nitrogen budget of phytoplankton (Liefer et al., 2019).
Furthermore, our research focuses primarily on nitrogen storage and uptake dynamics, but phosphate is also critical in regulating global phytoplankton distribution (Tyrrell, 1999). The role of phosphate storage plays in HET–HOL competitive dynamics thus also warrants further research, particularly as, unlike nitrogen, phytoplankton cells utilise phosphate-specific storage bodies in the form of polyphosphate (Liefer et al., 2019), which for coccolithophores is tied to calcium storage (Sviben et al., 2016; Gal et al., 2018).
Using an integrated approach featuring both laboratory experiments and numerical simulations, we find that C. braarudii life cycle phases have different nitrogen storage and maximum growth rates but similar light preference, nitrogen uptake rates, and temperature optima. The maximum growth is inversely related to nitrogen storage, with HOL having higher growth rates and lower nitrogen storage and HET having lower growth rates and higher nitrogen storage. This result indicates a potential trade-off between growth and nitrogen storage, which could be a primary bottom-up control of C. braarudii life cycle phase distribution (Fig. 8).
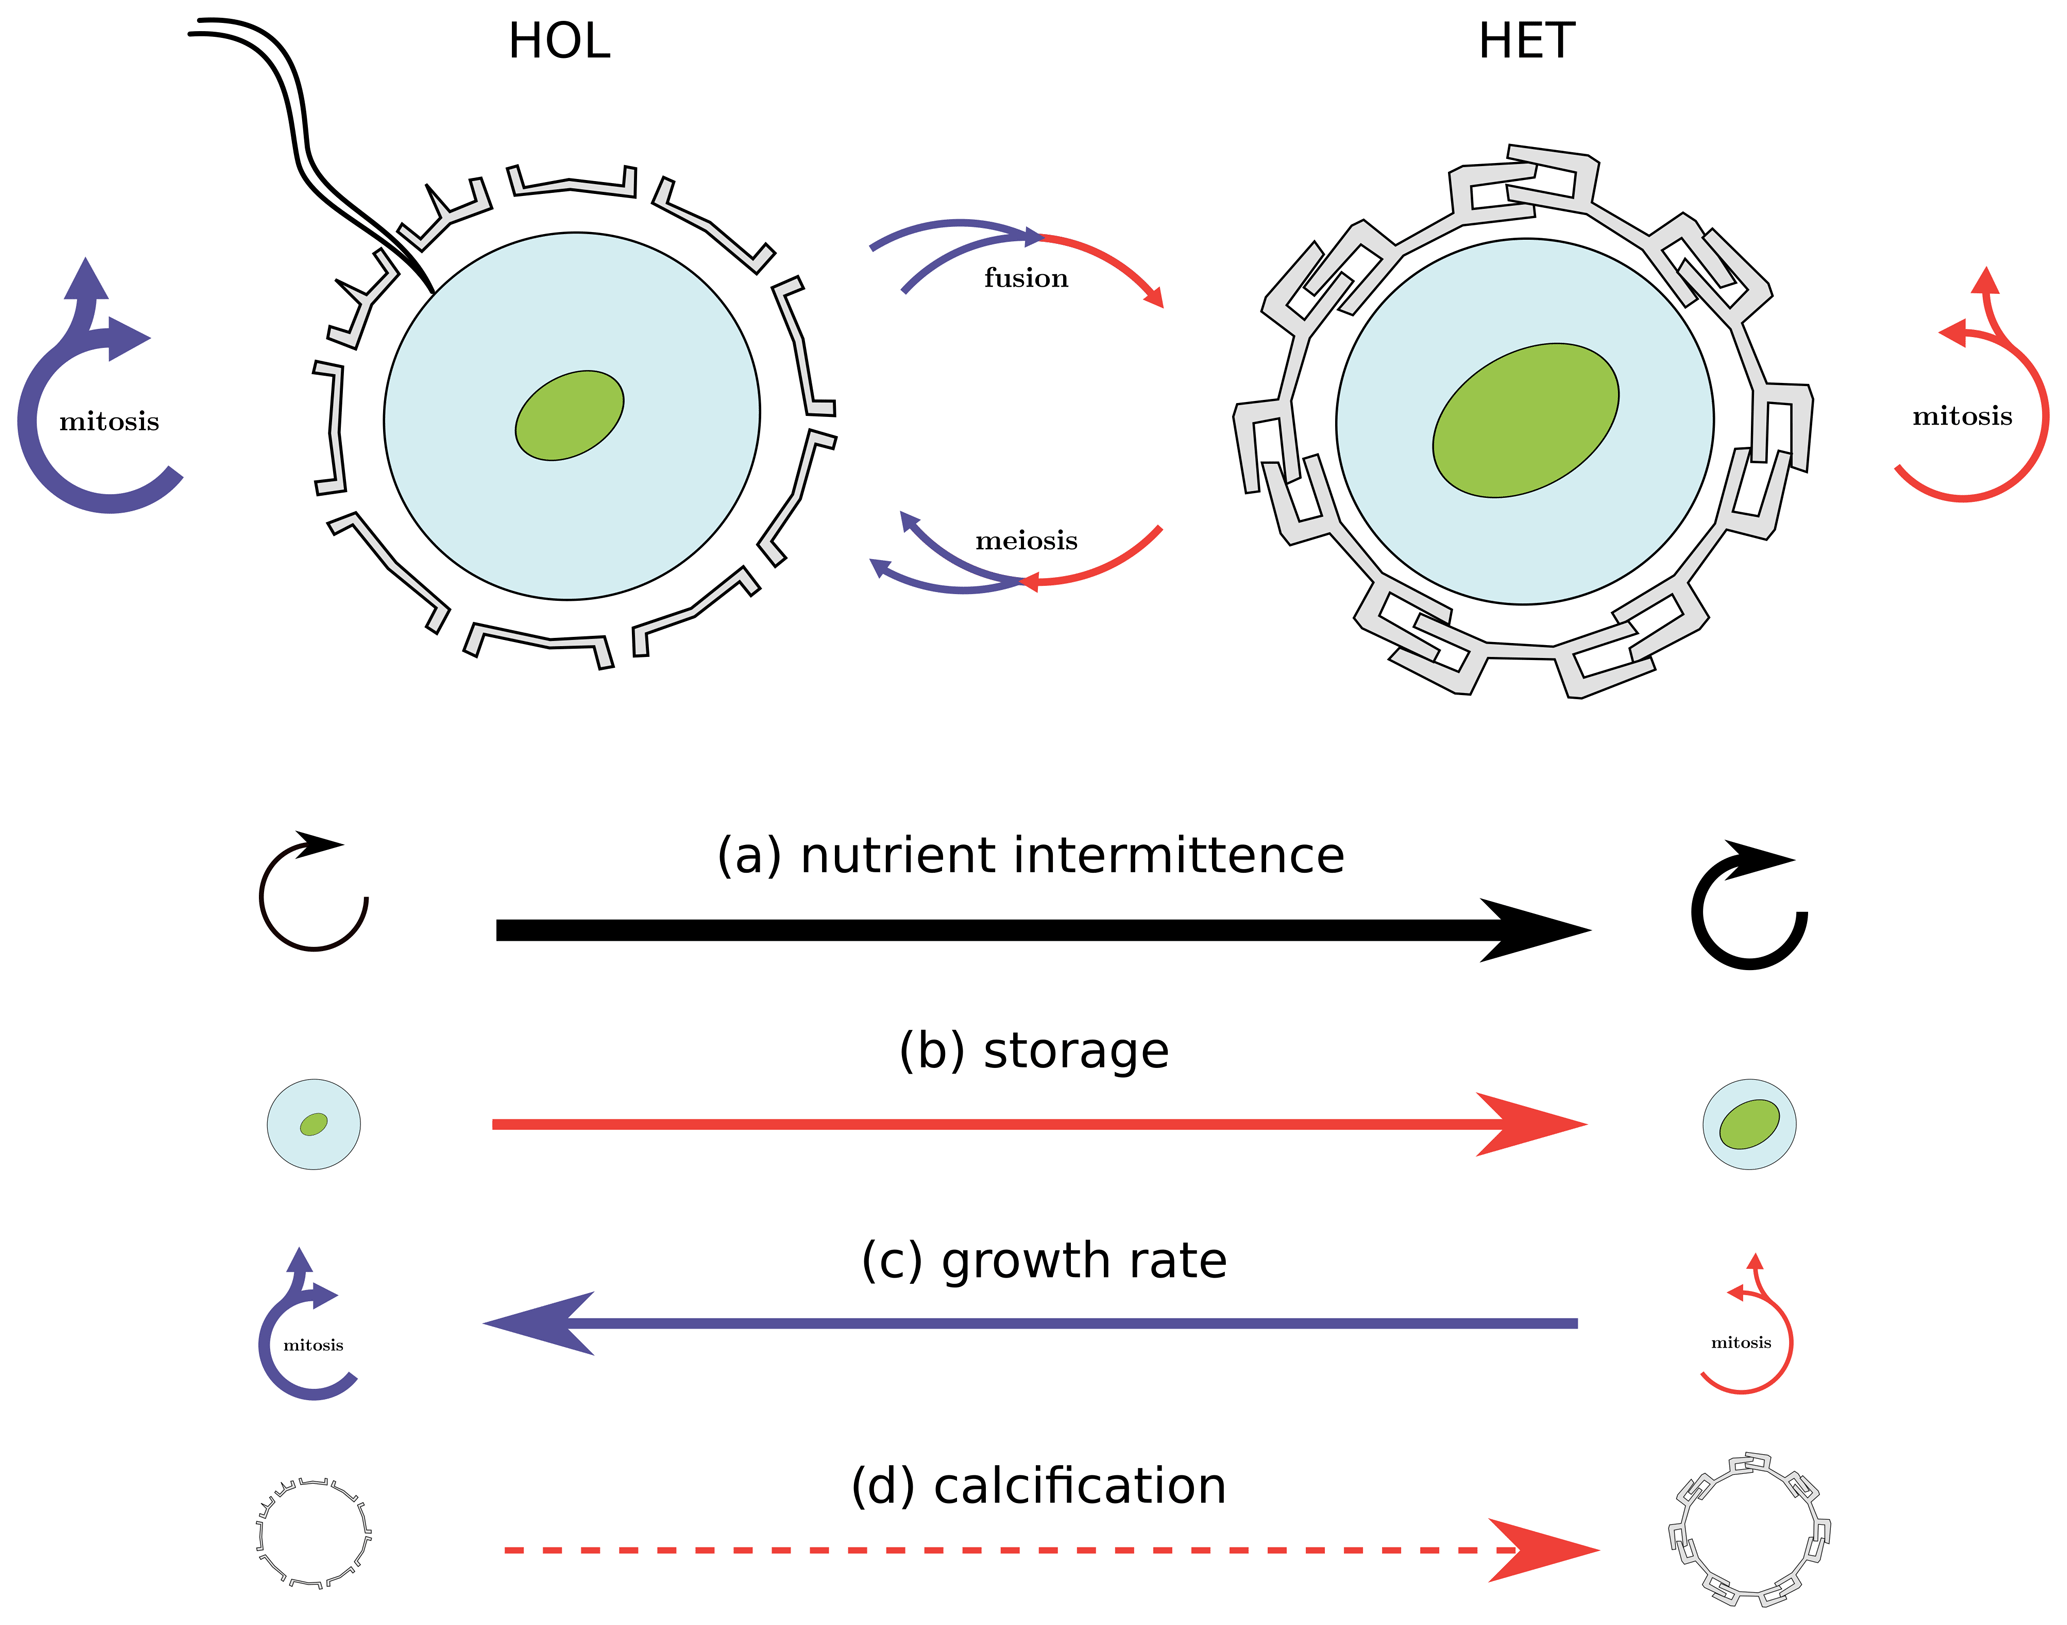
Figure 8Nitrogen intermittence trait trade-offs of the C. braarudii life cycle. This study identifies a nitrogen quota and growth trade-off as a key driver for differences in HET and HOL C. braarudii distribution. While the investment of HET cells into comparatively higher nitrogen storage comes at the cost of lower growth rates, this disadvantage is overcome when nitrogen supply is intermittent. Likewise, HOL cells out-compete HET cells when the nitrogen supply is constant due to higher growth rates but are out-competed when the nitrogen supply becomes intermittent. Other potential but theoretical competitive advantages under different nitrogen regimes not considered in our model includes calcification state (d), which also varies between HET and HOL C. braarudii cells.
Higher nitrogen storage allows HET coccolithophores to better exploit regimes of intermittent nitrogen supply, such as highly turbulent regions. This benefit comes at the cost of a lower competitive ability due to a lower maximum growth rate when turbulence is low, and nitrogen supply is constant.
The C. braarudii HET life cycle phase's ability to better store nitrogen is also associated with high photosynthetic efficiency when the cell experiences nitrogen depletion, further suggesting an important role of photosynthesis during nitrogen depletion. We found that genome content plays a minor role in the nitrogen budget of nitrogen-replete cells but that the absolute DNA content is higher for HET cells. Notably, this higher genome content does not correlate with higher minimum nitrogen quotas for HET cells, suggesting that HET cells reduce other cellular components to maintain similar minimum nitrogen quotas. However, as we cannot infer such budget cuts, our work highlights that more thorough macromolecular investigations of the HET–HOL life cycle phases are warranted.
Overall, our work shows the advantage of studying the coccolithophore life cycle in a trait-based framework. By comparing differences in traits between the different life cycle phases, we identify the key traits that determine the distribution of coccolithophore phases. This work furthermore provides parameterisations needed for more in-depth numerical simulations and analysis, which provides an exciting avenue for future coccolithophore life cycle research.
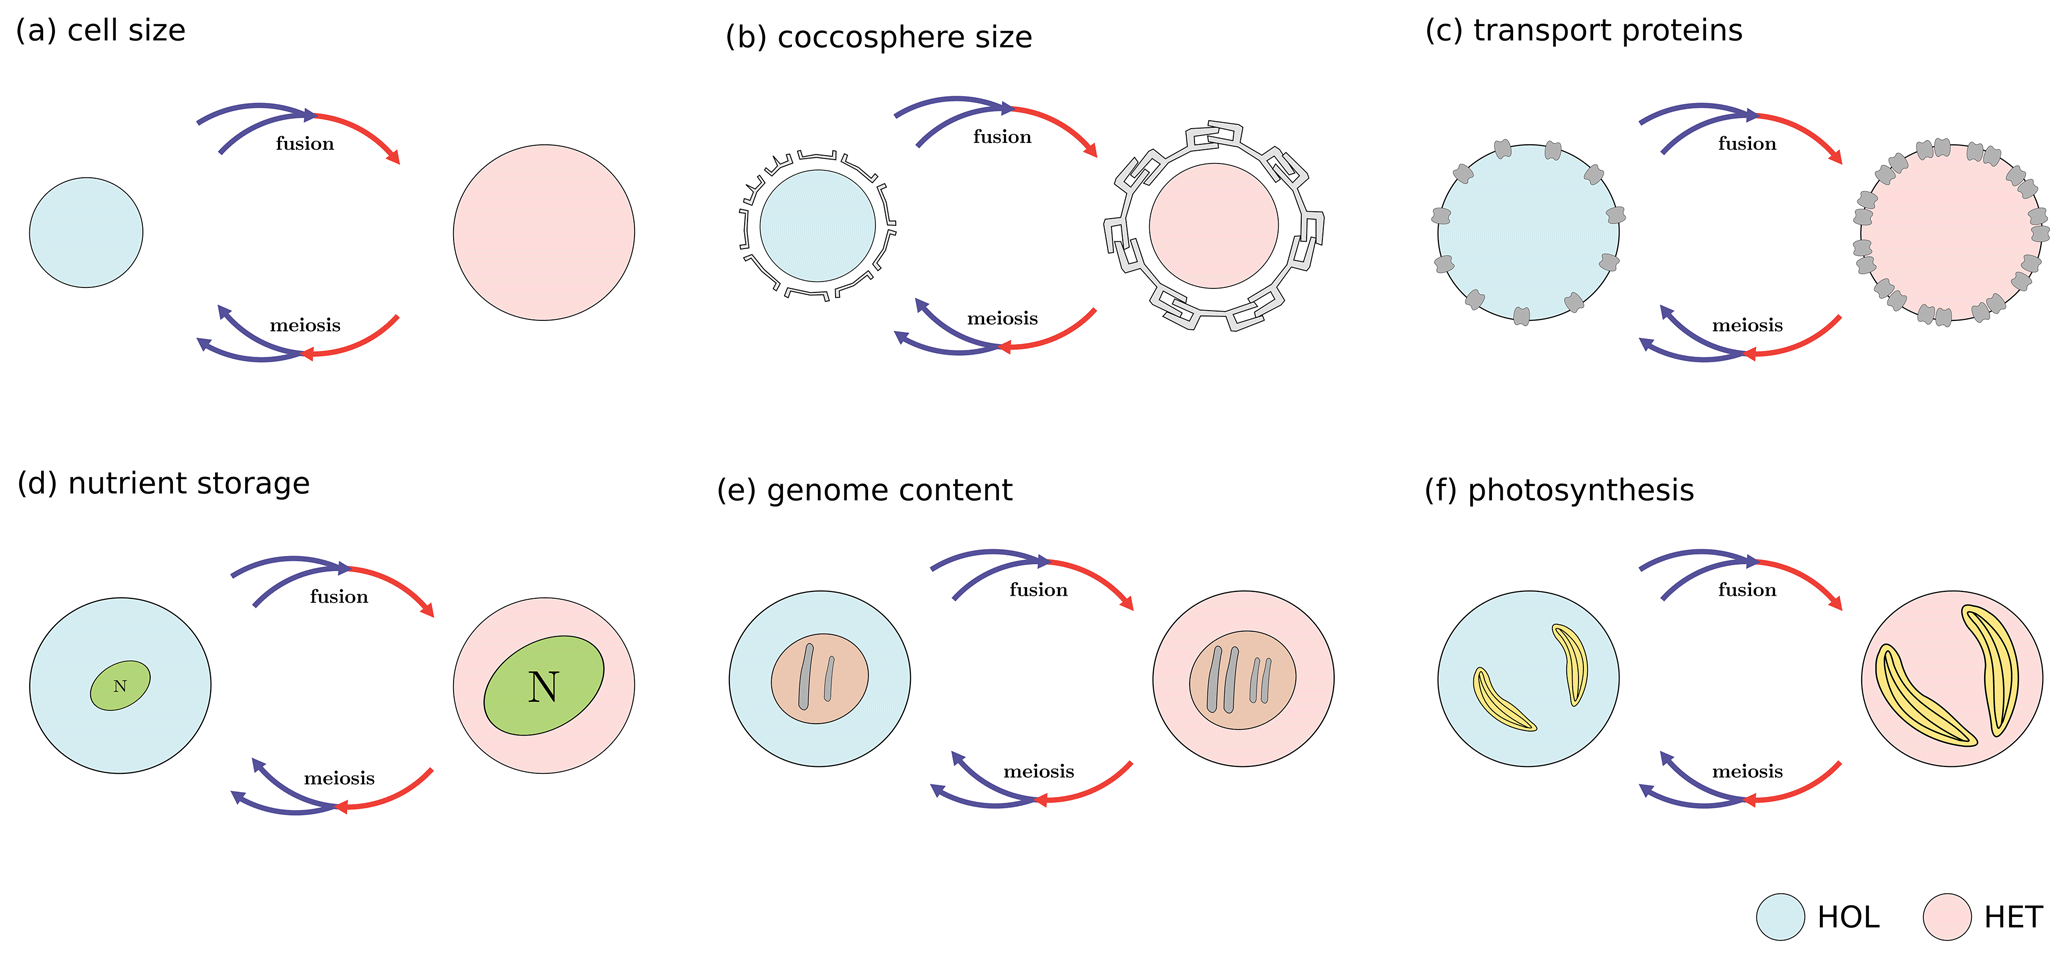
Figure A1Main coccolithophore traits investigated in this study: (a) cell size, (b) coccosphere size, (c) transport proteins (nitrogen uptake rate), (d) nitrogen storage (maximum nitrogen quota), (e) genome content (nitrogen quota), and (f) photosynthesis. Note that these are proposed trade-offs, and some trait differences were not observed in our study.
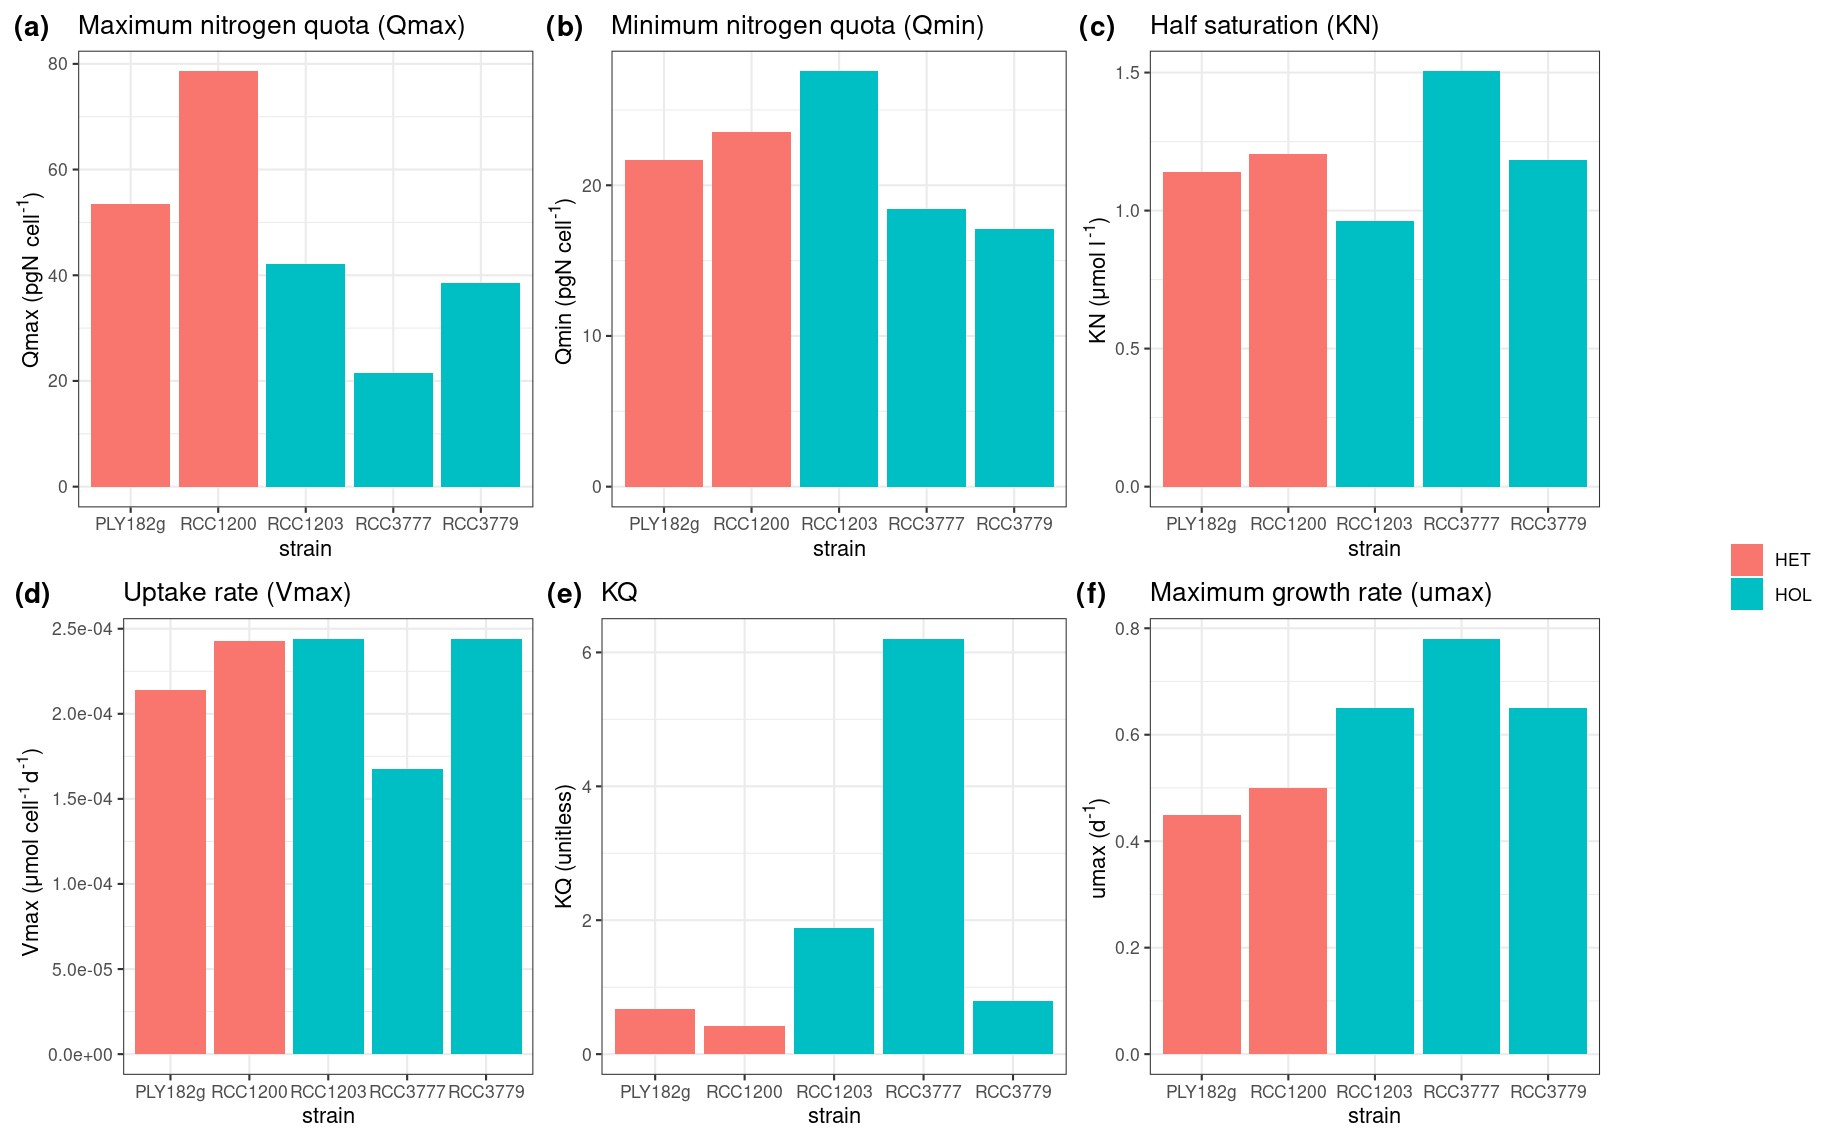
Figure A2Estimated and measured model parameters: (a) maximum nitrogen quota (Qmax), (b) minimum nitrogen quota (Qmin), (c) half saturation constant (KN), (d) uptake rate (Vmax), (e) KQ, and (f) maximum growth rate (μmax).
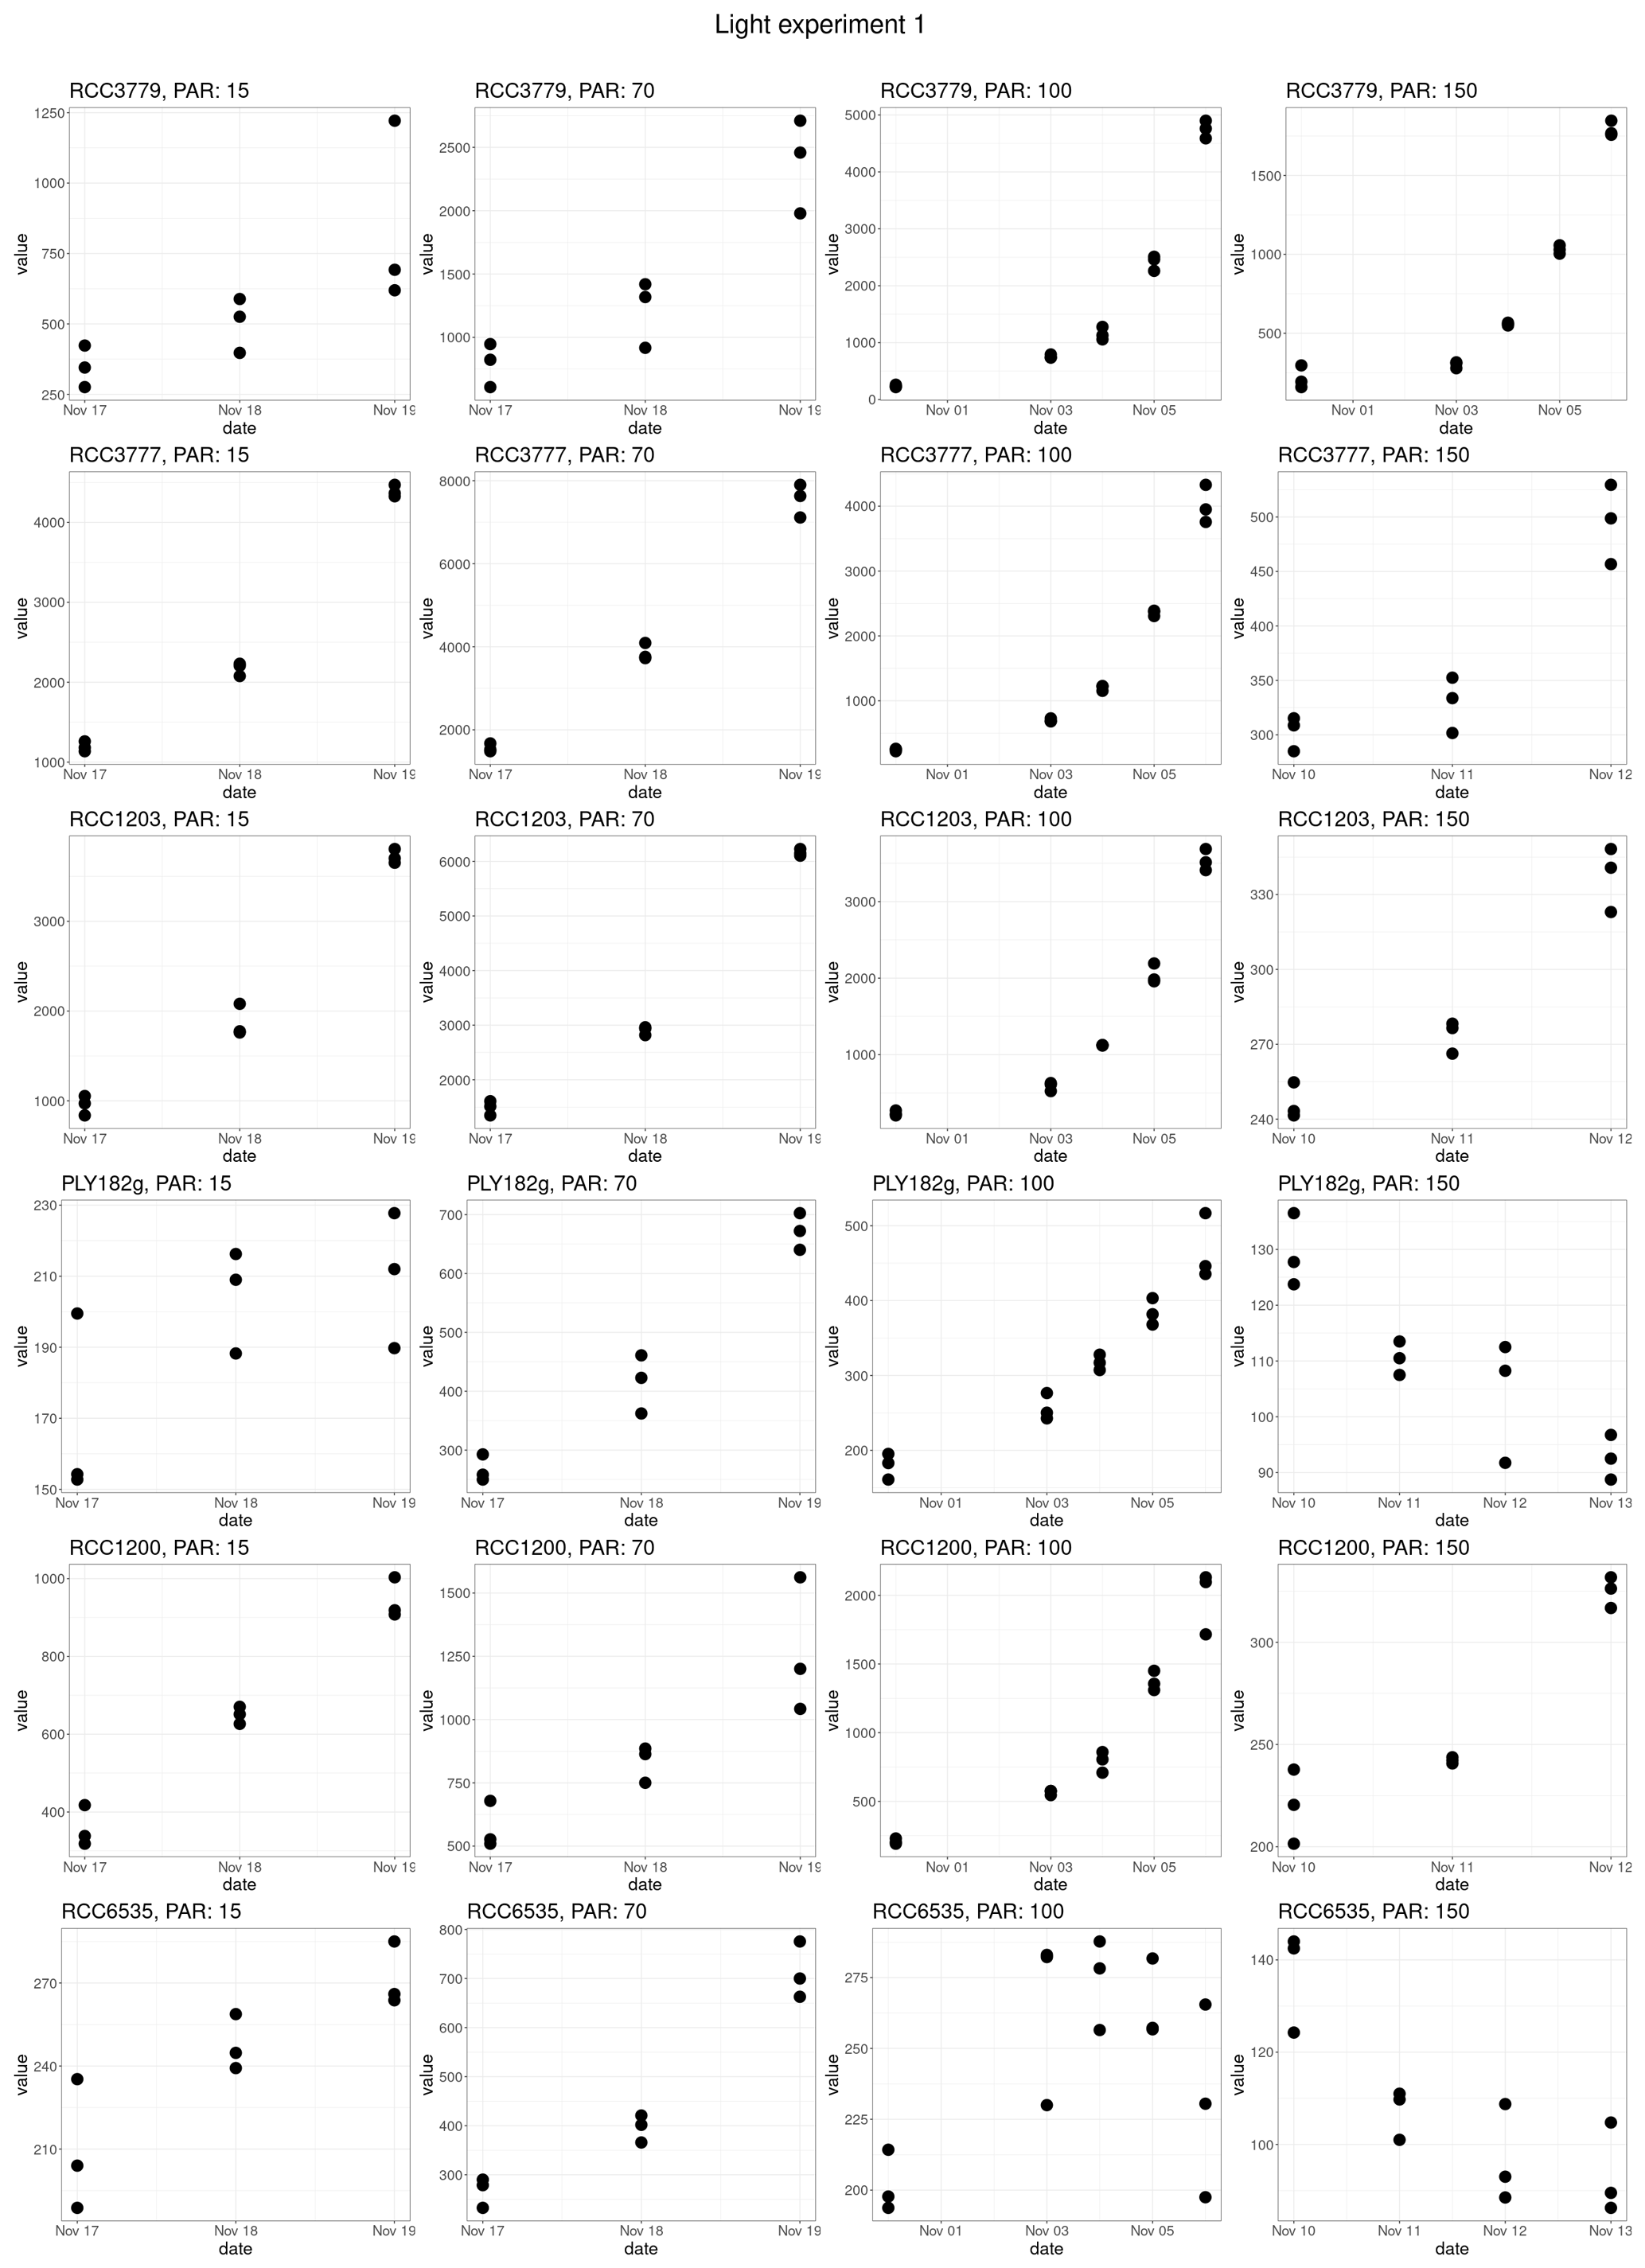
Figure A4Fluorescence data of the first set of light experiments used to estimate growth rates.
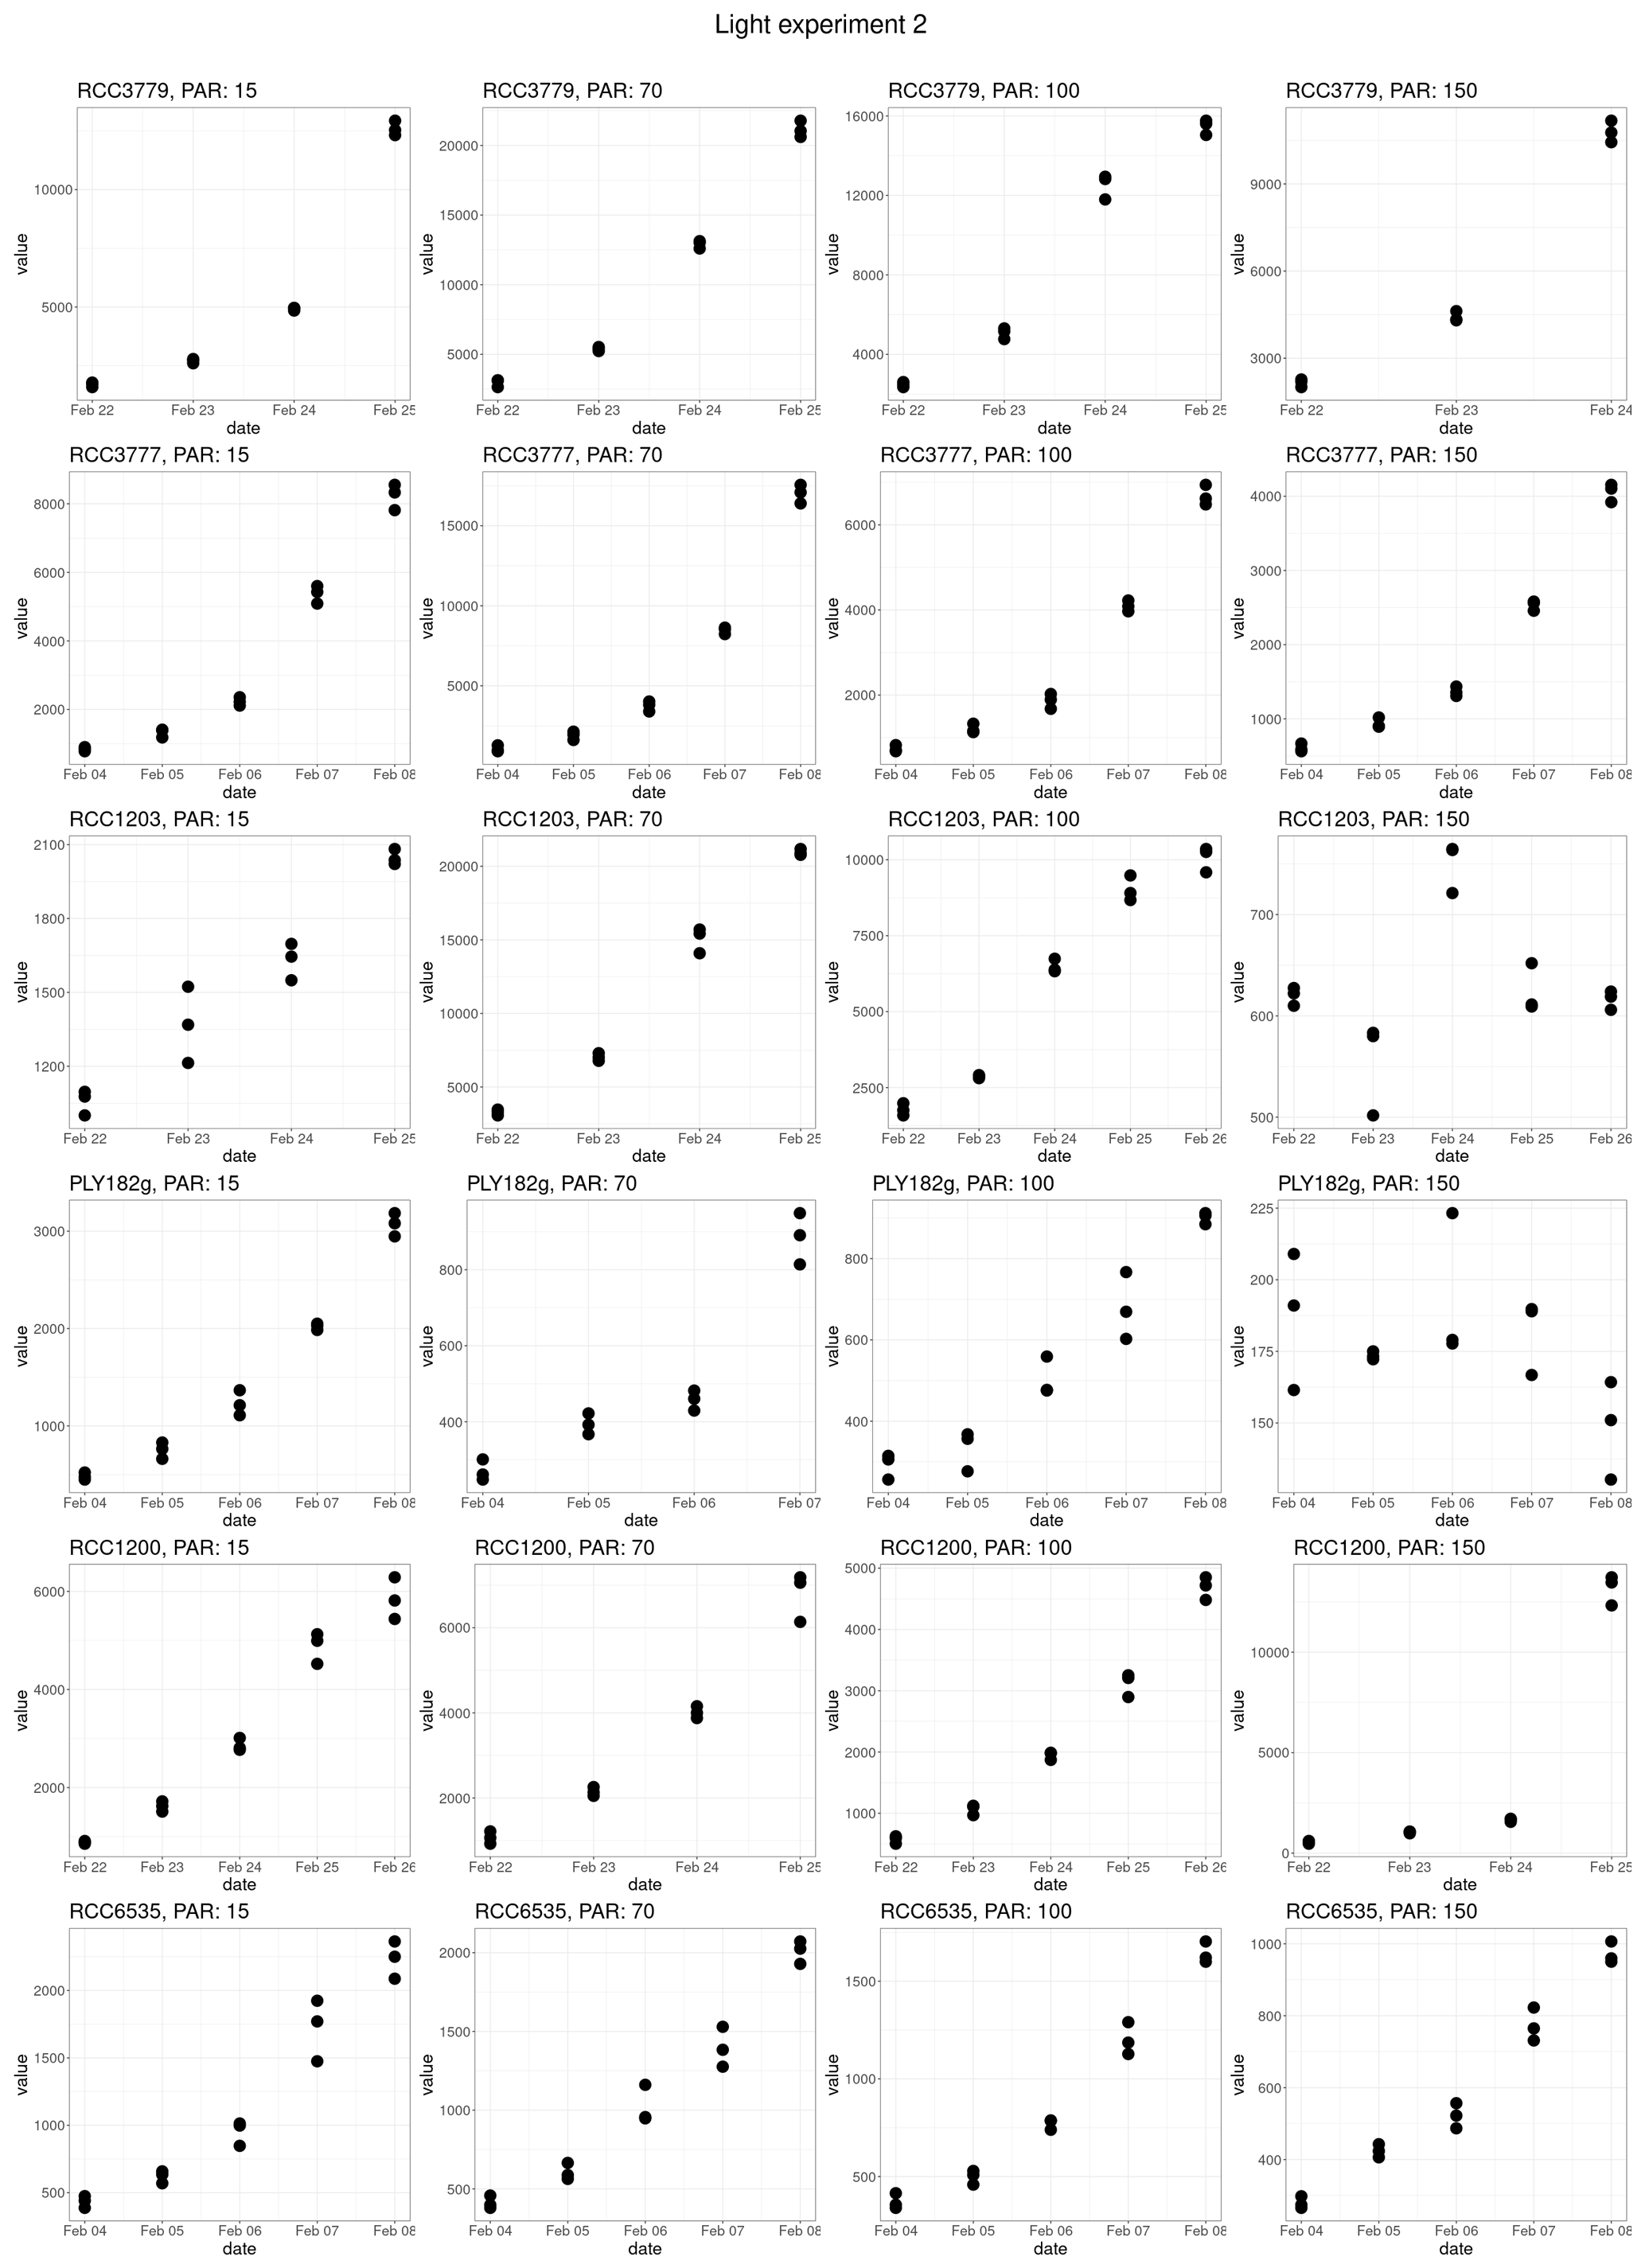
Figure A5Fluorescence data of the second set of light experiments used to estimate growth rates.
Table A1Competition model experiments. Competition between HET and HOL cells was simulated with and without a metabolic cost (reduced μmax). For each nutrient pulse interval, different ratios of HET and HOL Qmax (relative Qmax) were tested.
The HET–HOL competition model is available on figshare: https://doi.org/10.6084/m9.figshare.22717873.v1 (de Vries, 2023).
The data presented in this paper can be found on Zenodo at https://doi.org/10.5281/zenodo.10866148 (de Vries, 2024).
JdV, GW, and FM conceptualised the manuscript. JdV, GW, and GL conceptualised the lab experiments. JdV and FM conceptualised the numerical simulations. JdV performed the lab experiments, developed the competition model, conducted the formal analysis, and visualised the results. JdV, GW, FM, GL, and CB interpreted the results. JdV, GW, and FM prepared the manuscript with contributions from all co-authors.
The contact author has declared that none of the authors has any competing interests.
Publisher’s note: Copernicus Publications remains neutral with regard to jurisdictional claims made in the text, published maps, institutional affiliations, or any other geographical representation in this paper. While Copernicus Publications makes every effort to include appropriate place names, the final responsibility lies with the authors.
This research has been supported by the Natural Environment Research Council (grant nos. NE/X001261/1, NE/L002434/1, and NE/N011708/1) and the European Research Council, H2020 European Research Council (grant no. 670390).
This paper was edited by Jack Middelburg and reviewed by Nicole Travis and one anonymous referee.
Avrahami, Y. and Frada, M. J.: Detection of Phagotrophy in the Marine Phytoplankton Group of the Coccolithophores (Calcihaptophycidae, Haptophyta) During Nutrient-replete and Phosphate-limited Growth, J. Phycol., 56, 1103–1108, https://doi.org/10.1111/jpy.12997, 2020. a
Bach, L. T., Bauke, C., Meier, K. J. S., Riebesell, U., and Schulz, K. G.: Influence of changing carbonate chemistry on morphology and weight of coccoliths formed by Emiliania huxleyi, Biogeosciences, 9, 3449–3463, https://doi.org/10.5194/bg-9-3449-2012, 2012. a
Boyd, P. W., Claustre, H., Levy, M., Siegel, D. A., and Weber, T.: Multi-faceted particle pumps drive carbon sequestration in the ocean, Nature, 568, 327–335, https://doi.org/10.1038/s41586-019-1098-2, 2019. a
Cermeño, P., Lee, J. B., Wyman, K., Schofield, O., and Falkowski, P. G.: Competitive dynamics in two species of marine phytoplankton under non-equilibrium conditions, Mar. Ecol. Prog. Ser., 429, 19–28, https://doi.org/10.3354/meps09088, 2011. a
Cros, L., Kleijne, A., Zeltner, A., Billard, C., and Young, J. R.: New examples of holococcolith–heterococcolith combination coccospheres and their implications for coccolithophorid biology, Mar. Micropaleontol., 39, 1–3439, 2000. a
D'Amario, B., Ziveri, P., Grelaud, M., Oviedo, A., and Kralj, M.: Coccolithophore haploid and diploid distribution patterns in the Mediterranean Sea: Can a haplo-diploid life cycle be advantageous under climate change?, J. Plankt. Res., 39, 781–794, https://doi.org/10.1093/plankt/fbx044, 2017. a, b
Daniels, C. J., Tyrrell, T., Poulton, A. J., and Young, J. R.: A mixed life-cycle stage bloom of Syracosphaera bannockii (Borsetti and Cati, 1976) Cros et al. 2000 (Bay of Biscay, April 2010), J. Nannoplank. Res., 34, 31–35, 2014. a
Daniels, C. J., Poulton, A. J., Young, J. R., Esposito, M., Humphreys, M. P., Ribas-Ribas, M., Tynan, E., and Tyrrell, T.: Species-specific calcite production reveals Coccolithus pelagicus as the key calcifier in the Arctic Ocean, Mar. Ecol. Prog. Ser., 555, 29–47, https://doi.org/10.3354/meps11820, 2016. a
Dassow, P. V. and Montresor, M.: Unveiling the mysteries of phytoplankton life cycles: Patterns and opportunities behind complexity, J. Plankt. Res., 33, 3–12, https://doi.org/10.1093/plankt/fbq137, 2011. a
Dassow, P. V., John, U., Ogata, H., Probert, I., Bendif, E. M., Kegel, J. U., Audic, S., Wincker, P., Silva, C. D., Claverie, J. M., Doney, S., Glover, D. M., Flores, D. M., Herrera, Y., Lescot, M., Garet-Delmas, M. J., and Vargas, C. D.: Life-cycle modification in open oceans accounts for genome variability in a cosmopolitan phytoplankton, ISME J., 9, 1365–1377, https://doi.org/10.1038/ismej.2014.221, 2015. a, b
de Vries, J.: HET-HOL competition model, figshare [code], https://doi.org/10.6084/m9.figshare.22717873.v1, 2023. a
de Vries, J.: Coccolithus braarudii life cycle phases laboratory data (EGUSPHERE-2023-880 supplement), Version v1, Zenodo [data set], https://doi.org/10.5281/zenodo.10866148, 2024. a
de Vries, J., Monteiro, F., Wheeler, G., Poulton, A., Godrijan, J., Cerino, F., Malinverno, E., Langer, G., and Brownlee, C.: Haplo-diplontic life cycle expands coccolithophore niche, Biogeosciences, 18, 1161–1184, https://doi.org/10.5194/bg-18-1161-2021, 2021. a, b, c, d
Dormand, J. R. and Prince, P. J.: A family of embedded Runge-Kutta formulae, J. Comput. Appl. Math., 6, 19–26, https://doi.org/10.1016/0377-0427(86)90027-0, 1980. a
Dutkiewicz, S., Morris, J. J., Follows, M. J., Scott, J., Levitan, O., Dyhrman, S. T., and Berman-Frank, I.: Impact of ocean acidification on the structure of future phytoplankton communities, Nat. Clim. Change, 5, 1002–1006, https://doi.org/10.1038/nclimate2722, 2015. a
Falkowski, P. G. and Oliver, M. J.: Mix and match: How climate selects phytoplankton, Nat. Rev. Microbiol., 5, 813–819, https://doi.org/10.1038/nrmicro1751, 2007. a, b, c, d
Fiorini, S., Middelburg, J. J., and Gattuso, J. P.: Effects of elevated CO2 partial pressure and temperature on the coccolithophore Syracosphaera pulchra, Aquat. Microb. Ecol., 64, 221–232, https://doi.org/10.3354/ame01520, 2011a. a
Fiorini, S., Middelburg, J. J., and Gattuso, J. P.: Testing the effects of elevated pCO2 on coccolithophores (prymnesiophyceae): Comparison between haploid and diploid life stages, J. Phycol., 47, 1281–1291, https://doi.org/10.1111/j.1529-8817.2011.01080.x, 2011b. a
Flynn, K. J.: How critical is the critical N:P ratio?, J. Phycol., 38, 961–970, https://doi.org/10.1046/j.1529-8817.2002.t01-1-01235.x, 2002. a, b, c
Flynn, K. J.: The importance of the form of the quota curve and control of non-limiting nutrient transport in phytoplankton models, J. Plankt. Res., 30, 423–438, https://doi.org/10.1093/plankt/fbn007, 2008. a, b, c
Follows, M. J. and Dutkiewicz, S.: Modeling diverse communities of marine microbes, Annu. Rev. Mar. Sci., 3, 427–451, https://doi.org/10.1146/annurev-marine-120709-142848, 2011. a
Follows, M. J., Dutkiewicz, S., Grant, S., and Chisholm, S. W.: Emergent biogeography of microbial communities in a model ocean, Science, 315, 1843–1846, https://doi.org/10.1126/science.1138544, 2007. a
Follows, M. J., Dutkiewicz, S., Ward, B. A., and Follett, C. N.: Theoretical interpretations of subtropical plankton biogeography, in: Microbial Ecology of the Oceans, edited by: Kirchman, D. L. and Gasol, J. M., John Wiley & Sons, https://doi.org/10.1002/9780470281840, 2018. a, b
Frada, M. J., Bendif, E. M., Keuter, S., and Probert, I.: The private life of coccolithophores, Perspectives in Phycology, 6, 1–20, https://doi.org/10.1127/pip/2018/0083, 2018. a, b, c
Fu, W., Randerson, J. T., and Moore, J. K.: Climate change impacts on net primary production (NPP) and export production (EP) regulated by increasing stratification and phytoplankton community structure in the CMIP5 models, Biogeosciences, 13, 5151–5170, https://doi.org/10.5194/bg-13-5151-2016, 2016. a
Gal, A., Sorrentino, A., Kahil, K., Pereiro, E., Faivre, D., and Scheffel, A.: Native-state imaging of calcifying and noncalcifying microalgae reveals similarities in their calcium storage organelles, P. Natl. Acad. Sci. USA, 115, 11000–11005, https://doi.org/10.1073/pnas.1804139115, 2018. a
Geider, R. J. and Roche, J. L.: Redfield revisited: Variability of in marine microalgae and its biochemical basis, Europ. J. Phycol., 37, 1–17, https://doi.org/10.1017/S0967026201003456, 2002. a
Gerecht, A. C., Šupraha, L., Edvardsen, B., Probert, I., and Henderiks, J.: High temperature decreases the PIC POC ratio and increases phosphorus requirements in Coccolithus pelagicus (Haptophyta), Biogeosciences, 11, 3531–3545, https://doi.org/10.5194/bg-11-3531-2014, 2014. a
Gorbunov, M. Y. and Falkowski, P. G.: Using chlorophyll fluorescence kinetics to determine photosynthesis in aquatic ecosystems, Limnol. Oceanogr., 66, 1–13, 2021. a
Grover, J. P.: Resource Competition in a Variable Environment: Phytoplankton Growing According to Monod's Model, Am. Natural., 138, 811–835, 1991. a, b, c, d, e, f, g
Hansen, P. J.: The size ratio between planktonic predators and their prey, Limnol. Oceanogr., 39, 395–403, 1994. a, b
Hansen, P. J., Bjørnsen, P. K., and Hansen, B. W.: Zooplankton grazing and growth: Scaling within the 2–2000 µm body size range, Limnol. Oceanogr., 42, 687–704, https://doi.org/10.4319/lo.1997.42.4.0687, 1997. a, b
Houdan, A., Billard, C., Marie, D., Not, F., Sâez, A. G., Young, J. R., and Probert, I.: Holococcolithophore- heterococcolithophore (Haptophyta) life cycles: Flow cytometric analysis of relative ploidy levels, Syst. Biodivers., 1, 453–465, https://doi.org/10.1017/S1477200003001270, 2004. a, b
Houdan, A., Probert, I., Lenning, K. V., and Lefebvre, S.: Comparison of photosynthetic responses in diploid and haploid life-cycle phases of Emiliania huxleyi (Prymnesiophyceae), Mar. Ecol. Prog. Ser., 292, 139–146, https://doi.org/10.3354/meps292139, 2005. a
Houdan, A., Probert, I., Zatylny, C., Véron, B., and Billard, C.: Ecology of oceanic coccolithophores, I. Nutritional preferences of the two stages in the life cycle of Coccolithus braarudii and Calcidiscus leptoporus, Aquat. Microb. Ecol., 44, 291–301, https://doi.org/10.3354/ame044291, 2006. a
Inomura, K., Omta, A. W., Talmy, D., Bragg, J., Deutsch, C., and Follows, M. J.: A Mechanistic Model of Macromolecular Allocation, Elemental Stoichiometry, and Growth Rate in Phytoplankton, Front. Microbiol., 11, 1–22, https://doi.org/10.3389/fmicb.2020.00086, 2020. a
Kiørboe, T.: Small-scale turbulence, marine snow formation, and planktivorous feeding, Sci. Marina, 61, 141–158, 1997. a
Kiørboe, T., Visser, A., Andersen, K. H., and Browman, H.: A trait-based approach to ocean ecology, ICES J. Mar. Sci., 75, 1849–1863, https://doi.org/10.1093/icesjms/fsy090, 2018. a
Kottmeier, D. M., Terbrüggen, A., Wolf-Gladrow, D. A., and Thoms, S.: Diel variations in cell division and biomass production of Emiliania huxleyi—Consequences for the calculation of physiological cell parameters, Limnol. Oceanogr., 65, 1781–1800, https://doi.org/10.1002/lno.11418, 2020. a
Laliberté, J., Bélanger, S., and Frouin, R.: Evaluation of satellite-based algorithms to estimate photosynthetically available radiation (PAR) reaching the ocean surface at high northern latitudes, Remote Sens. Environ., 184, 199–211, 2016. a
Langer, G., Jie, V. W., Kottmeier, D., Flori, S., Sturm, D., de Vries, J., Harper, G. M., Brownlee, C., and Wheeler, G.: Distinct physiological responses of Coccolithus braarudii life cycle phases to light intensity and nutrient availability, Europ. J. Phycol., 58, 1–14, https://doi.org/10.1080/09670262.2022.2056925, 2022. a, b, c, d, e, f, g, h, i
Liefer, J. D., Garg, A., Fyfe, M. H., Irwin, A. J., Benner, I., Brown, C. M., Follows, M. J., Omta, A. W., and Finkel, Z. V.: The macromolecular basis of phytoplankton under nitrogen starvation, Front. Microbiol., 10, 1–16, https://doi.org/10.3389/fmicb.2019.00763, 2019. a, b, c, d
Litchman, E., Klausmeier, C. A., Schofield, O. M., and Falkowski, P. G.: The role of functional traits and trade-offs in structuring phytoplankton communities: Scaling from cellular to ecosystem level, Ecol. Lett., 10, 1170–1181, https://doi.org/10.1111/j.1461-0248.2007.01117.x, 2007. a, b, c
Lomas, M. W. and Glibert, P. M.: Comparison of nitrate uptake, storage, and reduction in marine diatoms and flagellates, J. Phycol., 913, 903–913, 2000. a
Malinverno, E., Triantaphyllou, M. V., Stavrakakis, S., Ziveri, P., and Lykousis, V.: Seasonal and spatial variability of coccolithophore export production at the South-Western margin of Crete (Eastern Mediterranean), Mar. Micropaleontol., 71, 131–147, https://doi.org/10.1016/j.marmicro.2009.02.002, 2009. a, b
Margalef, R.: Life-forms of phytoplankton as survival alternatives in an unstable environment, Oceanol. Ac., 1, 493–509, https://doi.org/10.1007/BF00202661, 1978. a
Maxwell, K. and Johnson, G. N.: Chlorophyll Fluorescence – a Practical Guide, J. Exp. Bot., 51, 659–668, 2000. a, b, c, d
Monod, J.: The growth of bacterial cultures, Annu. Rev. 3, 371–394, 1949. a
Monteiro, F. M., Bach, L. T., Brownlee, C., Bown, P., Rickaby, R. E., Poulton, A. J., Tyrrell, T., Beaufort, L., Dutkiewicz, S., Gibbs, S., Gutowska, M. A., Lee, R., Riebesell, U., Young, J., and Ridgwell, A.: Why marine phytoplankton calcify, Sci. Adv., 2,e1501822, https://doi.org/10.1126/sciadv.1501822, 2016. a
Passow, U. and Carlson, C. A.: The biological pump in a high CO2 world, Mar. Ecol. Prog. Ser., 470, 249–271, https://doi.org/10.3354/meps09985, 2012. a
Perrin, L., Probert, I., Langer, G., and Aloisi, G.: Growth of the coccolithophore Emiliania huxleyi in light- and nutrient-limited batch reactors: relevance for the BIOSOPE deep ecological niche of coccolithophores, Biogeosciences, 13, 5983–6001, https://doi.org/10.5194/bg-13-5983-2016, 2016. a, b, c, d
Probert, I. and Houdan, A.: The Laboratory Culture of Coccolithophores, https://doi.org/10.1007/978-3-662-06278-4, 2004. a
R Core Team: R: A Language and Environment for Statistical Computing, R Foundation for Statistical Computing, Vienna, Austria, https://www.R-project.org/ (last access: November 2023), 2022. a
Rokitta, S. D., de Nooijer, L. J., Trimborn, S., de Vargas, C., Rost, B., and John, U.: Transcriptome analyses reveal differential gene expression patterns between the life-cycle stages of Emiliania huxleyi (haptophyta) and reflect specialization to different ecological niches, J. Phycol., 47, 829–838, https://doi.org/10.1111/j.1529-8817.2011.01014.x, 2011. a
Smyth, T. J., Fishwick, J. R., Al-Moosawi, L., Cummings, D. G., Harris, C., Kitidis, V., Rees, A., Martinez-Vicente, V., and Woodward, E. M.: A broad spatio-temporal view of the Western English Channel observatory, J. Plankt. Res., 32, 585–601, https://doi.org/10.1093/plankt/fbp128, 2010. a
Sobel, I. and Feldman, G.: A 3 × 3 isotropic gradient operator for image processing, Stanford Artificial Project, 271–272, 1968. a
Steele, J. H. and Henderson, E. W.: The role of predation in plankton models, J. Plankt. Res., 14, 157–172, https://doi.org/10.1093/plankt/14.1.157, 1992. a
Sviben, S., Gal, A., Hood, M. A., Bertinetti, L., Politi, Y., Bennet, M., Krishnamoorthy, P., Schertel, A., Wirth, R., Sorrentino, A., Pereiro, E., Faivre, D., and Scheffel, A.: A vacuole-like compartment concentrates a disordered calcium phase in a key coccolithophorid alga, Nat. Commun., 7, 11228, https://doi.org/10.1038/ncomms11228, 2016. a
Tozzi, S., Schofield, O., and Falkowski, P.: Historical climate change and ocean turbulence as selective agents for two key phytoplankton functional groups, Mar. Ecol. Prog. Ser., 274, 123–132, https://doi.org/10.3354/meps274123, 2004. a, b, c, d
Tyrrell, T.: The relative influences of nitrogen and phosphorus on oceanic primary production, Nature, 400, 525–531, 1999. a
van der Walt, S., Schönberger, J. L., Nunez-Iglesias, J., Boulogne, F., Warner, J. D., Yager, N., Gouillart, E., Yu, T., and the scikit-image contributors: scikit-image: image processing in {P}ython, Peer J., 2, e453, https://doi.org/10.7717/peerj.453, 2014. a
Verdy, A., Follows, M., and Flierl, G.: Optimal phytoplankton cell size in an allometric model, Mar. Ecol. Prog. Ser., 379, 1–12, https://doi.org/10.3354/meps07909, 2009. a, b
Villiot, N., Poulton, A. J., Butcher, E. T., Daniels, L. R., and Coggins, A.: Allometry of carbon and nitrogen content and growth rate in a diverse range of coccolithophores, J. Plankt. Res., 43, 511–526, https://doi.org/10.1093/plankt/fbab038, 2021. a
Virtanen, P., Gommers, R., Oliphant, T. E., Haberland, M., Reddy, T., Cournapeau, D., Burovski, E., Peterson, P., Weckesser, W., Bright, J., van der Walt, S. J., Brett, M., Wilson, J., Millman, K. J., Mayorov, N., Nelson, A. R. J., Jones, E., Kern, R., Larson, E., Carey, C. J., Polat, I., Feng, Y., Moore, E. W., VanderPlas, J., Laxalde, D., Perktold, J., Cimrman, R., Henriksen, I., Quintero, E. A., Harris, C. R., Archibald, A. M., Ribeiro, A. H., Pedregosa, F., van Mulbregt, P., and Contributors, S..: {SciPy} 1.0: Fundamental Algorithms for Scientific Computing in Python, Nat. Meth., 17, 261–272, https://doi.org/10.1038/s41592-019-0686-2, 2020. a
Wales, D. J. and Doye, J. P.: Global optimization by basin-hopping and the lowest energy structures of Lennard-Jones clusters containing up to 110 atoms, J. Phys. Chem. A, 101, 5111–5116, https://doi.org/10.1021/jp970984n, 1997. a
Ward, B. A., Wilson, J. D., Death, R. M., Monteiro, F. M., Yool, A., and Ridgwell, A.: EcoGEnIE 1.0: plankton ecology in the cGEnIE Earth system model, Geosci. Model Dev., 11, 4241–4267, https://doi.org/10.5194/gmd-11-4241-2018, 2018. a, b, c, d
Widdicombe, C. E., Eloire, D., Harbour, D., Harris, R. P., and Somerfield, P. J.: Long-term phytoplankton community dynamics in the Western English Channel, J. Plankt. Res., 32, 643–655, https://doi.org/10.1093/plankt/fbp127, 2010. a
Wood, S. N.: Fast stable restricted maximum likelihood and marginal likelihood estimation of semiparametric generalized linear models, J. Roy. Stat. Soc. B, 73, 3–36, 2011. a
Young, J. R., Geisen, M., Cros, L., Kleijne, A., Sprengel, C., Probert, I., and Østergaard, J.: A guide to extant coccolithophore taxonomy, Journal of Nannoplankton Research, Special Issue 1, 132 pp., ISSN 1210-8049, 2003. a
Zeebe, R. E.: LOSCAR: Long-term Ocean-atmosphere-Sediment CArbon cycle Reservoir Model v2.0.4, Geosci. Model Dev., 5, 149–166, https://doi.org/10.5194/gmd-5-149-2012, 2012. a, b
Zwietering, M. H., Jongenburger, I., Rombouts, F. M., and van't Riet, K.: Modeling of the Bacterial Growth Curve, Appl. Environ. Microbiol., 56, 1875–1881, https://doi.org/10.1016/j.fm.2004.01.007, 1990. a