the Creative Commons Attribution 4.0 License.
the Creative Commons Attribution 4.0 License.
 | 09 Apr 2024
Contrasting carbon cycling in the benthic food webs between a river-fed, high-energy canyon and an upper continental slope
Chueh-Chen Tung
Yu-Shih Lin
Jian-Xiang Liao
Tzu-Hsuan Tu
James T. Liu
Li-Hung Lin
Pei-Ling Wang
Chih-Lin Wei
The Gaoping Submarine Canyon (GPSC) off southwest Taiwan has been extensively studied due to its unique geology, its role in transferring terrestrial material to the deep sea, and its diverse biological communities. However, there is a lack of understanding of carbon cycling across the sediment–water interface in the canyon. This study aims to fill the gap by utilizing the field data collected between 2014 and 2020 and a linear inverse model (LIM) to reconstruct the benthic food web (i.e., carbon flows through different stocks) in the head of GPSC and the upper Gaoping slope (GS). The biotic and abiotic organic carbon (OC) stocks were significantly higher on the slope than in the canyon, except for the bacteria stock. The sediment oxygen utilization was similar between the two habitats, but the magnitude and distribution of the OC flow in the food web were distinctively different. Despite a significant input flux of ∼ 2020 mg C m−2 d−1 in the canyon, 84 % of the carbon flux exited the system, while 12 % was buried. On the slope, 84 % of the OC input (∼ 109 mg C m−2 d−1) was buried, and only 7 % exited the system. Bacteria processes play a major role in the carbon fluxes within the canyon. In contrast, the food web in the upper slope exhibited stronger interactions among metazoans, indicated by higher fluxes between meiofauna and macrofauna compartments. Network indices based on the LIM outputs showed that the canyon head had higher total system throughput () and total system throughflow (TST), indicating greater energy flowing through the system. In contrast, the slope had a significantly higher Finn cycling index (FCI), average mutual information (AMI), and longer OC turnover time, suggesting a relatively more stable ecosystem with higher energy recycling. Due to sampling limitations, the present study only represents the benthic food web during the “dry” period. By integrating the field data into a food web model, this study provides valuable insight into the fates of OC cycling in an active submarine canyon, focusing on the often overlooked benthic communities. Future studies should include “wet” period sampling to reveal the effects of typhoons and monsoon rainfalls on OC cycling.
- Article
(3889 KB) - Full-text XML
- BibTeX
- EndNote


Submarine canyons are V-shaped valleys with steep walls carved into continental margins (Shepard, 1981). These canyons are crucial in transporting sediments and organic matter from the continental shelves to the deep ocean basins (Vetter and Dayton, 1999; Nittrouer and Wright, 1994; Epping et al., 2002; Liu et al., 2013). Turbidity currents (Shepard, 1981) and mass failures (Walsh et al., 2007) are critical factors contributing to the canyon development. Therefore, the shorter the distance between the canyon head and the shore, the more efficiently terrestrial sediment and organic carbon (OC) are transported to the deep ocean, keeping the canyon more active (Covault et al., 2007; Galy et al., 2007). However, globally, only a tiny percentage of canyons (i.e., less than 4 %) are connected to the shore (Bernhardt and Schwanghart, 2021). Among the 5849 submarine canyons in the world, only 2.79 % are river-fed (Harris and Whiteway, 2011). They are more prevalent along the active margins with narrow shelves and onshore river catchments, likely promoting the canyon incisions through water discharges and coarse-grained bedload erosions (Bernhardt and Schwanghart, 2021). Although globally rare, the shore and river-connected canyons dominate Taiwan's continental margin (7 out of the 13 submarine canyons; Chiang and Yu, 2022). Among them, the Gaoping Submarine Canyon (GPSC) is the largest and the only river-fed canyon in the southwestern (SW) Taiwan margin (i.e., among Penghu, Shoushan, Kaohsiung, Gaoping, and Fangliao canyons, as well as Hongtsi sea valley, Chiang et al., 2020), providing a unique opportunity to investigate the shore- and river-connected canyon ecosystem.
The GPSC is deeply incised into the Gaoping shelf. The canyon head is ∼ 1 km away from the Gaoping River (GPR), a small mountainous river (SMR). The GPR drainage basin has steep elevation changes (Liu et al., 2016) and is frequently disturbed by earthquakes and typhoons (Liu et al., 2009). As a result, the GPR discharges a substantial amount of sediment to the GPSC each year (45.6 to 110 Mt; Taiwan Water Resources Agency), approximately 30 % to 80 % of the Mississippi River's yearly export (Meade and Moody, 2010). The frequent earthquakes and typhoons also lead to turbidity currents and gravity flows, causing continuous erosion of the canyon floor and sediment mobilizations (Gavey et al., 2017; Ikehara et al., 2020; Chiang et al., 2020).
The riverine carbon fluxes in the GPR–GPSC system vary with wet and dry seasons. The wet season occurs from summer to early autumn due to the impact of monsoons and typhoons, contributing about 78 % of the yearly charge of the river (Liu et al., 2002) and up to ∼ 46 times more particulate organic carbon (POC) transport than in the dry season (Liu et al., 2016). Hsu et al. (2014) showed that the sedimentary OC accumulation rates in the Gaoping shelf and slope area account for less than 13 % of the riverine POC load, suggesting that most POC likely exits the GPSC and is buried in the deep South China Sea (SCS) (Hsu et al., 2014; Kao et al., 2014; Liu et al., 2013, 2016). However, these earlier studies did not consider the impact of benthic organisms, which play a quantitatively important role in oxidizing sedimentary OC through feeding, respiration, burrowing, and predation activities. Therefore, OC cycling and budgets of the source-to-sink system cannot be accurately reconstructed without including benthic organisms (Snelgrove et al., 2018).
Submarine canyons are known to transport a greater quantity and quality of sedimentary OC than sloping environments at a similar depth (Garcia et al., 2007; Pusceddu et al., 2010; Vetter and Dayton, 1999), thereby enhancing carbon oxidation rates (Epping et al., 2002; Rabouille et al., 2009), benthic standing stocks (Ingels et al., 2009), and deposit feeding (Amaro et al., 2009; De Leo et al., 2010; Vetter and Dayton, 1999). These processes indicate intensified carbon cycling in the canyon benthic community. However, only a few studies have adopted the food web modeling approach to identify the key benthic size classes responsible for OC oxidation as well as the magnitude, turnover, and structure of carbon stocks and flow in the submarine canyons (Rowe et al., 2008; van Oevelen et al., 2011). It is noted that these observations were made based on studies of submarine canyons on passive margins.
For submarine canyons on active margins, our previous work showed that strong physical disturbance in the shore-connected GPSC had significant negative impacts on benthic community structure and function, resulting in lower abundance, diversity, biomass, growth, and respiration, as well as distinctly different composition compared to the nearby slope ecosystem (Liao et al., 2017, 2020; Tung et al., 2023). However, the carbon flows within the canyon's benthic food web in active margins, including that of the GPSC, remain underexplored. To address this gap, we applied linear inverse models (LIMs) to reconstruct and compare the carbon flows within the food webs of the head of GPSC and the nearby Gaoping slope (GS). We analyzed the food web characteristics, quantified the carbon flow, and discussed how the unique biological communities in the high-energy GPSC affect carbon cycling and budget. We hope to close the knowledge gap on the carbon flow in a dynamic submarine canyon setting on an active margin.
2.1 Characteristics of Gaoping Submarine Canyon and Gaoping slope
The upper GS (about 200–300 m water depth) experiences relatively high sediment accumulation (Hsu et al., 2014), while the GPSC is susceptible to surface sediment erosion triggered by turbidity currents (Mulder et al., 2001), gravity flows (Liu et al., 2013), and powerful internal tides originating from the Luzon and southeastern Taiwan Strait (Chiou et al., 2011; Jan et al., 2008; Lee at al., 2009a, b). The convergence of internal waves into beam patterns along the canyon thalweg generates bottom-intensified currents (Wang et al., 2008), whereas the presence of isopycnal surfaces from Gaoping River plumes within the canyon head facilitates the generation and propagation of internal tides (Lee et al., 2009a; Liu et al., 2002; Wang et al., 2008). Consequently, the upper GPSC (about 200–400 m water depth) seafloor features a benthic nepheloid layer (BNL) with a thickness exceeding 100 m and a suspended-sediment concentration surpassing 30 mg L−1, sustained by current-induced resuspension related to internal tides (Liu et al., 2002, 2010; Liu and Lin, 2004). The impacts of the physical disturbance on the sedimentary OC and benthos in the canyon include (i) the removal of fine particles containing higher total organic carbon (TOC) content, resulting in diminished food supplies and subsequently lower meiofaunal and macrofaunal abundance, biomass, and diversity in the canyon compared to the adjacent slope (Liao et al., 2017, 2020; Tung et al., 2023), and (ii) a significant negative impact on the nematode functional and trophic diversity, as well as community maturity (Liao et al., 2020), affecting various aspects of the benthic ecosystem functions, such as size structure, community growth, and respiration (Tung et al., 2023).
2.2 Sampling
Between 2014 and 2020, the sampling stations at the upper GPSC and GS (abbreviated as GC1 and GS1) were repeatedly surveyed by the National Taiwan University's RV Ocean Researcher 1 and New Ocean Researcher 1 (Fig. 1). During each visit, we used a CTD/rosette for the hydrographic survey and either a USNEL box corer (Hessler and Jumars, 1974) or an OSIL megacorer for sediment sampling. Seawater temperature and salinity were measured with a CTD recorder (Sea-Bird SBE 911). For the box core operation, five transparent polycarbonate tubes (i.d. = 68 mm) were inserted into the sediments to take subsamples. For the megacorer operations, a maximum of 12 polycarbonate tubes (i.d. = 105 mm) were recovered to obtain replicate samples. The cruise details, sampling sites, and sampling gears are listed in Table A1 in Appendix A.
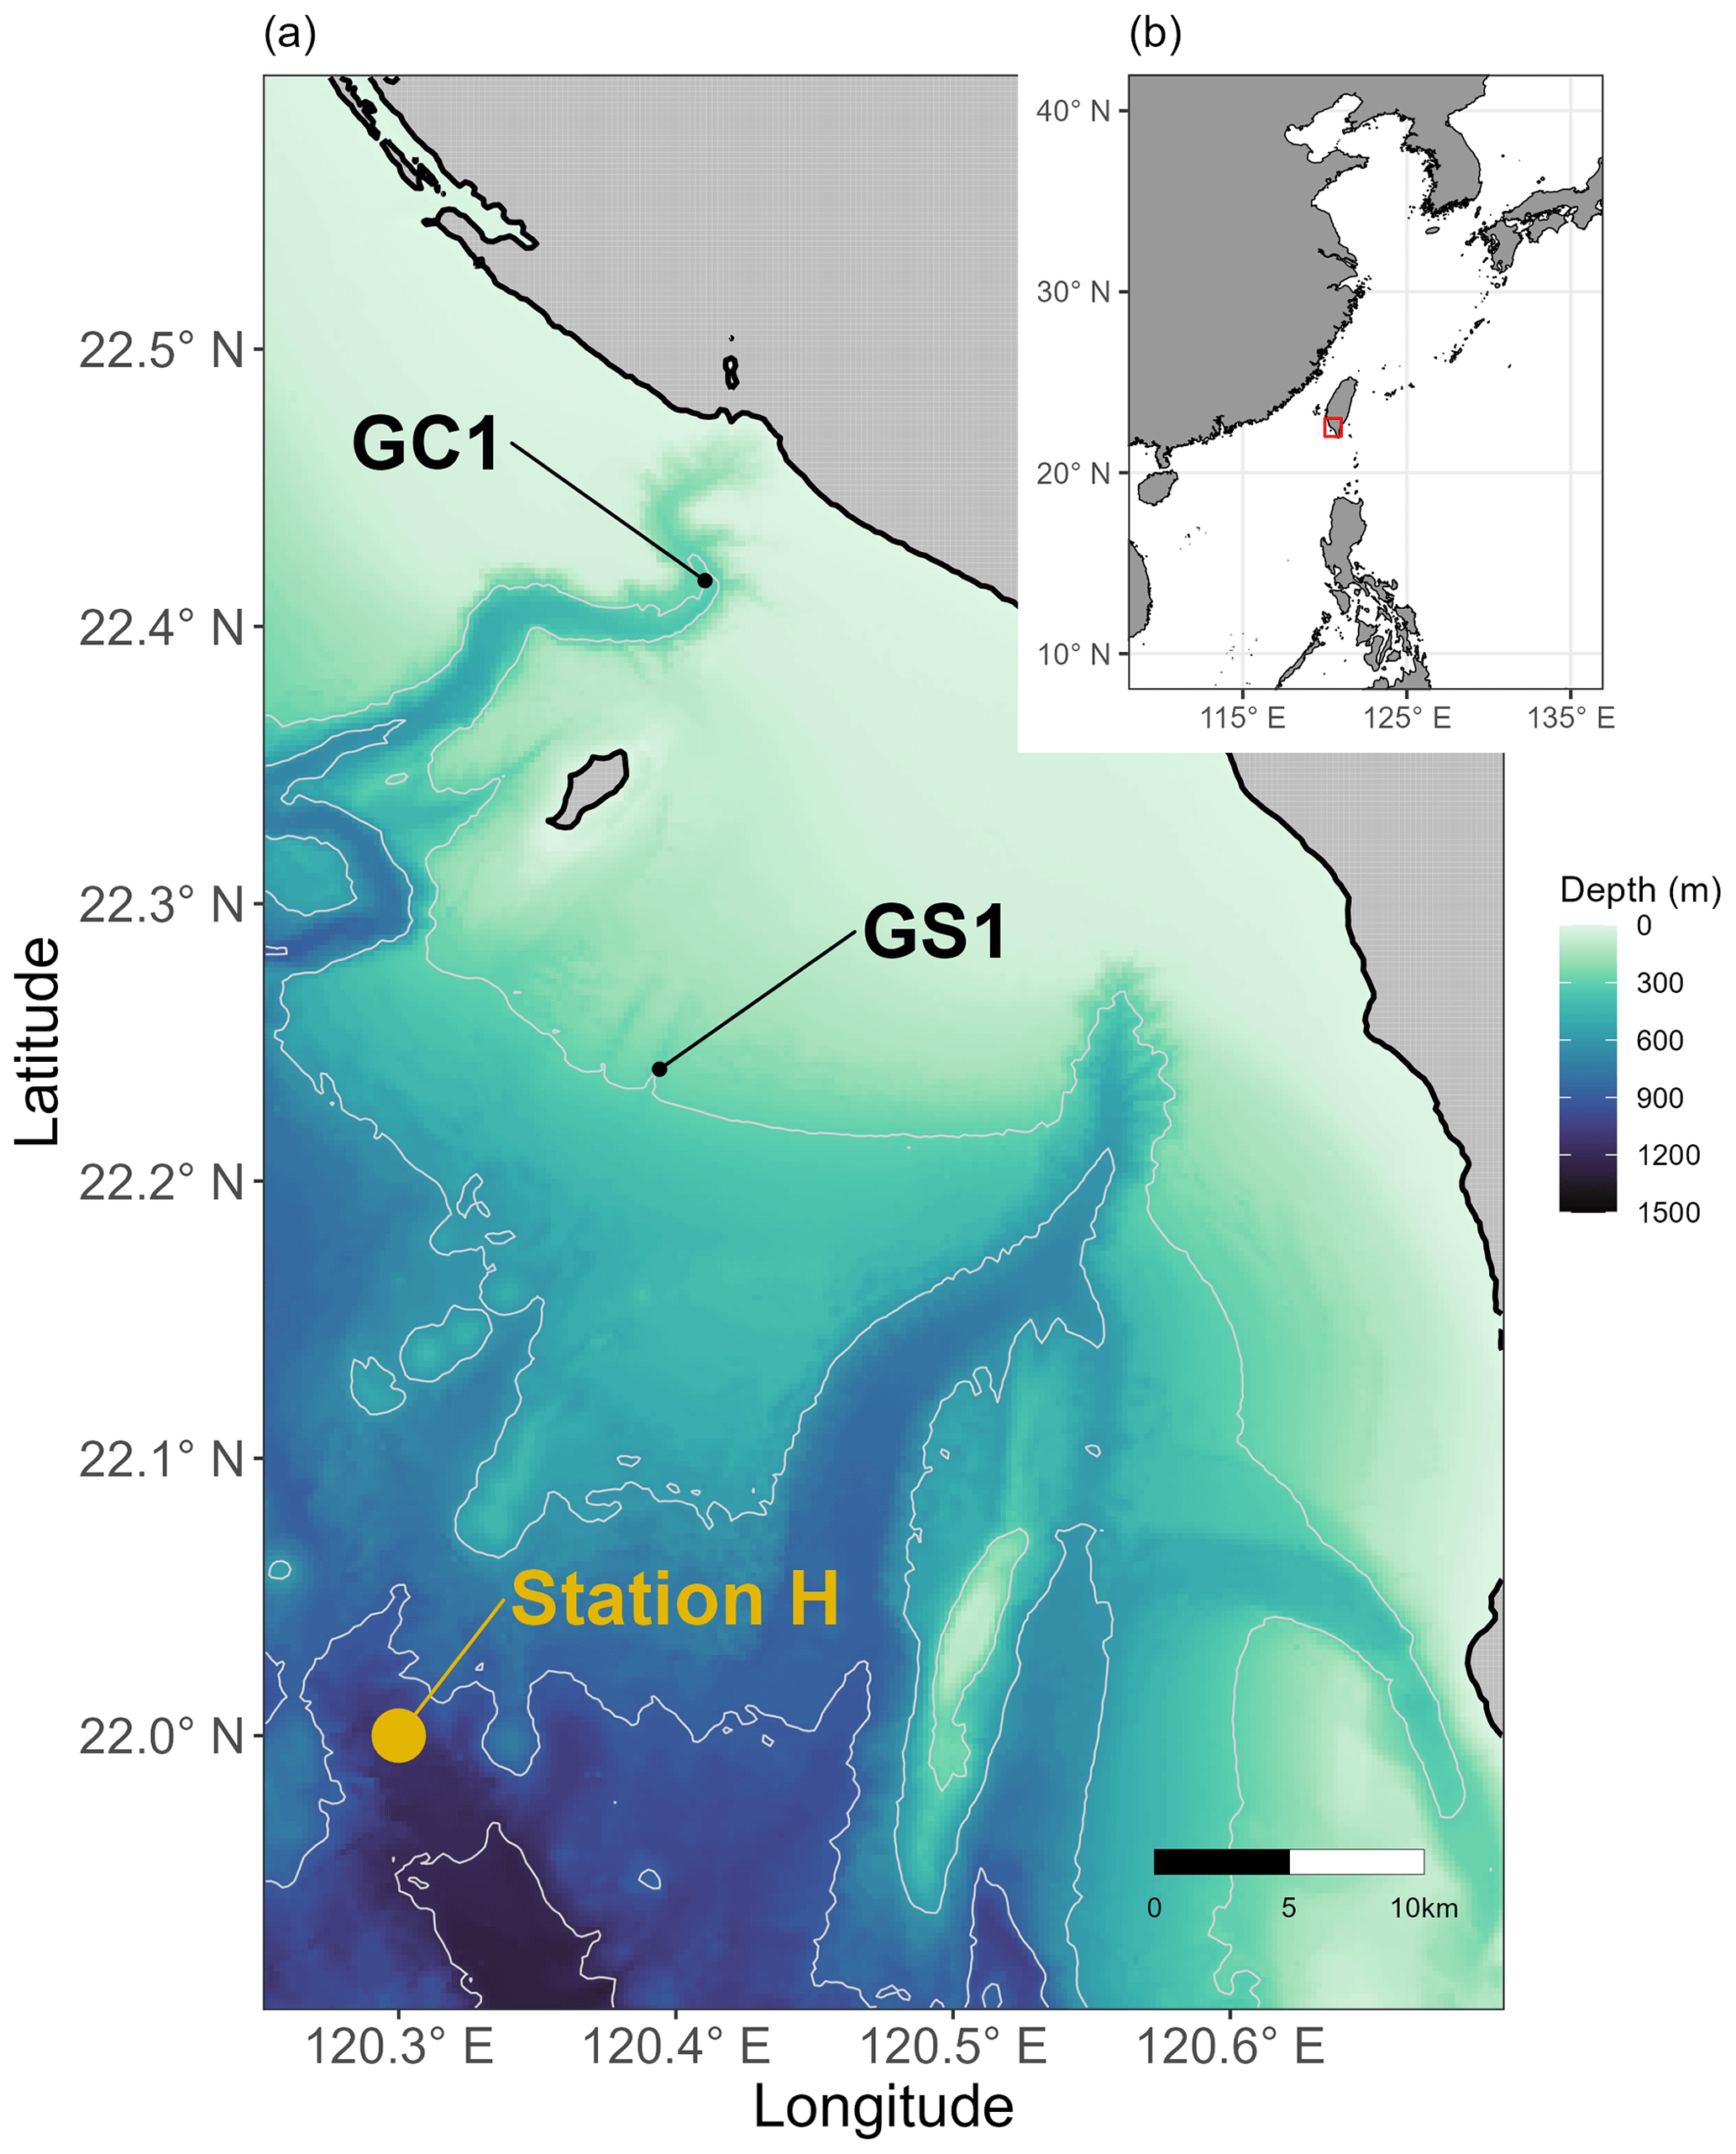
Figure 1Map of sampling stations visited from 2014 to 2020. (a) Sampling sites at the head of Gaoping Submarine Canyon (GPSC) and the upper Gaoping slope (GS) are abbreviated as GC1 and GS1, respectively. POC fluxes collected by drifting sediment trap at station H (Shih et al., 2020) adjacent to GS1 are also annotated. (b) The sampling area off the continental margin of SW Taiwan.
2.3 Food web structure
This study utilized linear inverse models (LIMs) to establish connections between the abiotic and biotic components within the food webs of GC1 and GS1 (illustrated in Fig. B1 in Appendix B). In the model, the influx of POC consists of a mixture of OC derived from the water column, with a portion exiting the network through burial and export processes such as removal from the sediment surface or resuspension by bottom currents (represented by orange flows). The faunal compartments are categorized based on size classes, encompassing bacteria (BAC), meiofauna (MEI), and macrofauna (MAC). A simplified microbial loop is included, with a portion of detritus degrading into a dissolved organic matter (DOC) pool, which bacteria then take up. Bacteria die and contribute to the DOC pool through viral lysis. The predators from each size class consume organisms of all smaller size classes (black flows). For example, meiofauna only consumes detrital OC and bacteria. Macrofauna preys on meiofauna, bacteria, and detrital OC. Carbon loss includes fauna mortality and defecation (i.e., flow back to detritus stock), consumption by benthopelagic/pelagic predators, and transfer to dissolved inorganic carbon (DIC) through respiration (blue flows in Fig. B1). All food web components are linked by mass-balance equations, describing the biomass changes due to the difference between feeding and carbon loss (i.e., feces, respiration, mortality, and consumption). The carbon flows between components are constrained by inequality equations, which use the site-specific or physiological upper and lower bounds from direct measurements, theoretical calculations, or literature values. Since almost all sampling was conducted in autumn and spring (i.e., only one cruise in summer, Table A1), the LIM food webs only used the “dry” period data (i.e., autumn and spring).
2.4 Data sources
2.4.1 Sampling procedures of non-living component of OC
Surface sediment (0–1 cm) was collected by a 50 mL centrifuge tube and preserved in a −20 °C freezer. The sediment samples were freeze-dried for 3 to 5 d to measure wet weight (before freeze-drying), dry weight (after freeze-drying), water content, and porosity. An aliquot of freeze-dried sediment (∼ 0.4 g) was acidified with HCl to remove carbonate, combusted at 1000 °C with pure oxygen, and analyzed with a Flash EA 1112 elemental analyzer for TOC. The core area (m2) was first converted to volume (m3) by multiplying the depth at which the macrofauna may dwell (i.e., 10 cm). The volume was then converted into mass using the sediment dry densities converted from the bulk densities reported by Su et al. (2018), which was 2.1 (g cm−3) in GC1 and 1.8 (g cm−3) in GS1, corrected by the water contents (Table A2). Finally, the OC stock was determined by multiplying the sediment mass with TOC content (%) and dividing by the sampling area, resulting in the unit of mg C m−2. Because only a small aliquot of sediment was used in TOC measurement, the sample likely excluded larger fauna and was assumed to contain only detrital OC.
2.4.2 Sampling procedures of living component of OC
Prokaryotes in the surface sediment (0–1 cm) were taken from a cutoff 10 mL sterile syringe (i.d. 15 mm) within a core tube. A 2 mL subsample was added to a 15 mL polyethylene centrifuge tube containing 2 mL of pre-filtered phosphate-buffered saline (PBS) solution, and the mixture was then fixed in 2 % paraformaldehyde. Based on the procedures described in Kallmeyer et al. (2008), prokaryotic cells in the fixed samples were detached from the sediments. The detached cells were subsequently stained with SYBR Green and DAPI and mounted on a slide for enumeration (Deming and Carpenter, 2008). A total of 10 slides were prepared for each station to calculate the mean prokaryotic abundance. The stock of prokaryotic OC was calculated by assuming a conversion factor of 10 fg C per cell (Deming and Carpenter, 2008) and converted to the unit of mg C m−2.
Meiofauna was collected from the top 5 cm of sediment using a cutoff 10 mL sterile syringe (i.d. 15 mm) (Montagna et al., 2017). Three samples in each station (from different core tubes) were fixed in 5 % formalin, stained with Rose Bengal, and wet-sieved through a 40 µm sieve before transferring to 70 % ethanol. After centrifuging at 8000 rpm for 10 min in Ludox HS40 solution (repeated three times) (Danovaro, 2009; Montagna et al., 2017), the meiofauna specimens were enumerated into major taxonomic groups under a high-power stereomicroscope (Olympus® SZX16; 0.7–11.5 × zoom). Both the macrofauna and meiofauna were identified to the lowest possible taxonomic level (phylum, class, or order).
At least three core tubes were retained in each station for macrofauna analysis. The top 10 cm of the sediments (including supernatant water) were wet-filtered through a 300 µm sieve (Montagna et al., 2017). After being fixed in 5 % formalin and stained with Rose Bengal, the macrobenthos samples were sorted and enumerated into major taxonomic groups and then permanently preserved in 70 % ethanol.
The body volume of meiofauna and macrofauna specimens was calculated using the formula:
where V is the volume, L is the length, W is the width, and C is the taxon-specific conversion factor (Warwick and Gee, 1984). For the taxa without conversion factors, the biovolume was calculated from length and width using the nearest geometric shapes (e.g., cone shape: scaphopods; cylinder shape: aplacophorans, sipunculans, and nemerteans; ellipsoid shape: ophiuroids and asteroids) (Tung et al., 2023). The biovolume was first converted into wet weight by assuming a specific gravity of 1.13 (Warwick and Gee, 1984). Subsequently, it was converted into OC using the conversion factor of 12 % for meiofauna (Baguley et al., 2004) and 4.3 % for macrofauna (Rowe, 1983). Finally, all the OC stock of fauna was divided by the sampling area and then converted to the unit of mg C m−2. The size data exceeding 3 standard deviations from the mean (i.e., z score) were excluded as outliers before estimating the total biomass.
2.4.3 Sediment community oxygen consumption (SCOC)
Three core tubes recovered from the megacorer were used to measure SCOC for each station. The incubation was conducted in a dark, temperature-controlled water bath. If the supernatant water was insufficient to fill the core tube, the sediment core was carefully filled with bottom water collected from the CTD rosette. After carefully removing air bubbles, the core tube was sealed hermetically with a custom-built HDPE lid attached to a magnetically driven impeller (60–80 rpm) to circulate the water during the incubation. Then, the sediments were acclimated for approximately 6 h until the flocculent materials settled and the overlying water was clear. The dissolved oxygen concentration was measured every 8 h with a miniature oxygen optode (i.d. 2 mm) through a sampling port on the core lid (PreSens® Microx 4). According to Glud (2008), the dissolved oxygen concentration was measured until it decreased by 15 % of the initial concentration to prevent hypoxic stress. The fluxes of oxygen into or out of the sediments were calculated as
Here V is the volume of the overlying water, A is the core area, and T is the incubation time.
After shipboard incubation, one to three oxygen microelectrodes (100 µm tip size) were inserted simultaneously into sediments at 100 µm increments using the Unisense® Field MicroProfiling System. The diffusive oxygen fluxes through the sediment–water interface were calculated according to Fick's first law of diffusion (Berg et al., 1998; Glud, 2008). The oxygen concentration profile, sediment porosity, initial concentrations in the overlying water, and oxygen diffusion coefficient corrected by temperature were input to calculate diffusive oxygen fluxes using the Unisense® SensorTrace Profiling software. Diffusive carbon remineralization was estimated from the oxygen flux by assuming a respiratory quotient (RQ) of 0.85 (Jørgensen et al., 2022).
Sediment oxygen profile concentration measures the diffusive oxygen utilization (DOU) mainly contributed by the aerobic respiration of microorganisms through the slow diffusion of oxygen molecules and the chemical oxidation of upward-diffused reduced species (e.g., NH, Mn2+, Fe2+). In contrast, the sediment incubation experiment measures total oxygen utilization (TOU). TOU not only accounts for DOU but also benthos' respiration and the benthos-mediated oxygen utilization (BMU) through their bioirrigation and bioturbation activities (Glud, 2008; Lichtschlag et al., 2015; Wenzhöfer and Glud, 2004). Therefore, we defined the difference between TOU and DOU as BMU, characterizing benthos' contribution to sediment oxygen dynamics.
2.4.4 Geochemical flux constraints
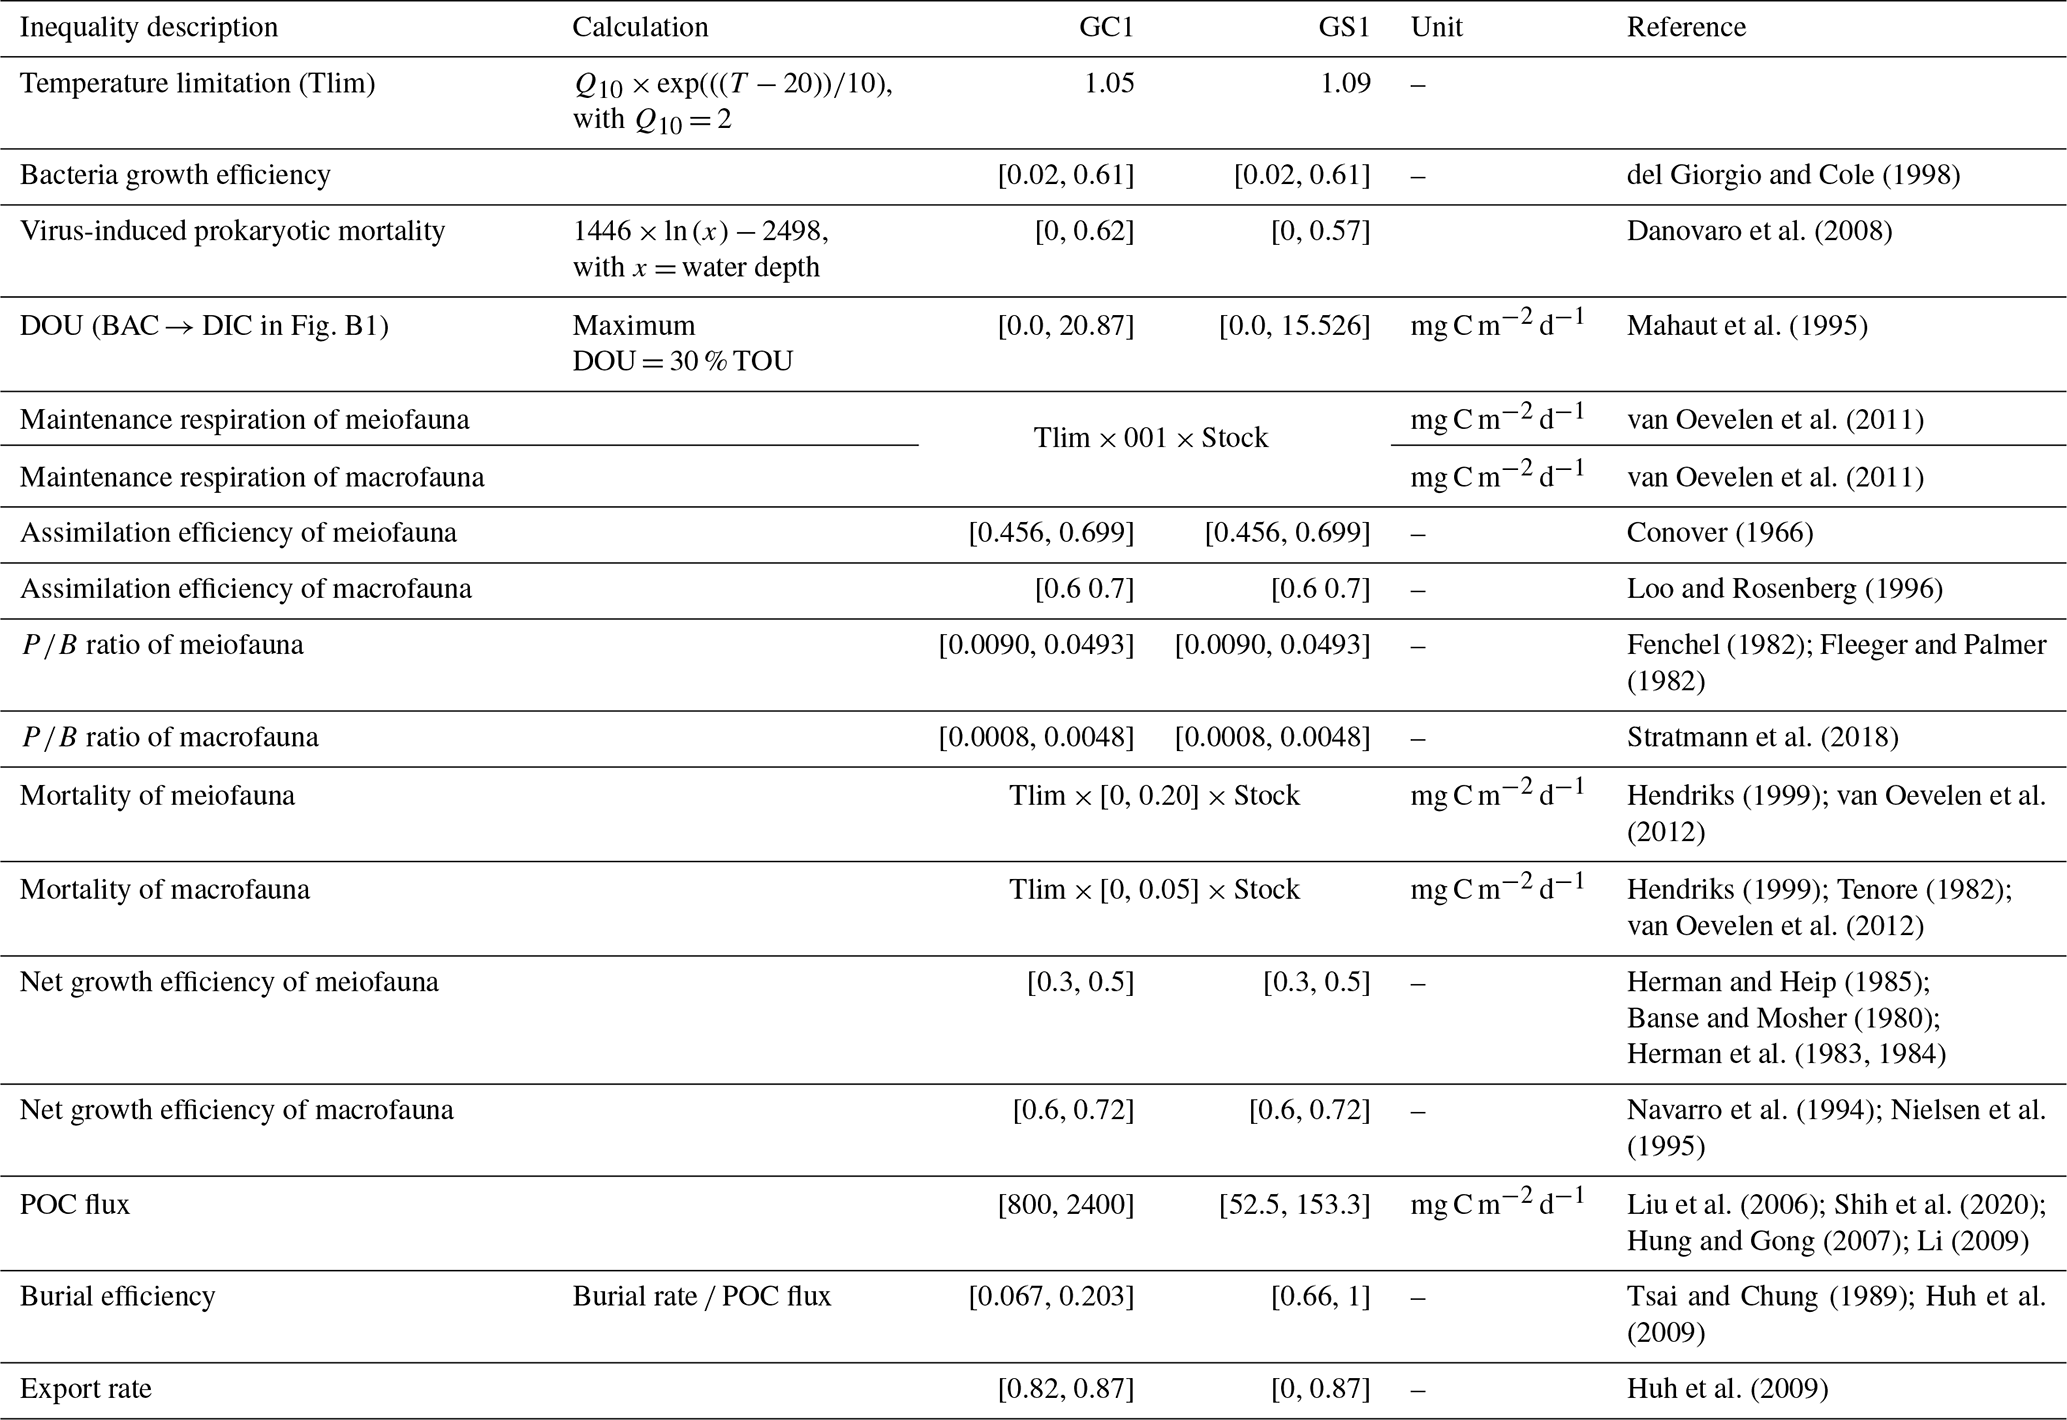
Due to the difficulty in accurately partitioning TOU among the OC stocks (Glud, 2008), we used DOU as the geochemical constraint instead of TOU, as the former can be associated explicitly with BAC → DIC (Fig. B1). However, instead of directly using the measured DOU as input data, we established the upper bound of BAC → DIC at 30 % of the measured TOU, according to Mahaut et al. (1995) (Table 1). This chosen method enhances model flexibility. The measured TOU, DOU, and calculated BMU are used to validate or compare the modeled results.
Extensive sediment accumulation rate (SAR) data are available in our study area from Tsai and Chung (1989), Huh et al. (2009), and Su et al. (2018). Therefore, the OC burial rate was estimated by multiplying the SAR with TOC content (Jahnke, 1996). Carbon burial efficiency (Epping et al., 2002) was calculated through
Equation (3) requires POC flux, which is constrained by the minimum and maximum values of the sediment trap data before spring tides in GC1 (Liu et al., 2006, 2009). The POC flux measurements are not available in GS1, but POC fluxes collected by drifting sediment trap at station H (Fig. 1) adjacent to GS1 are reported by Shih et al. (2020). Therefore, the range of POC fluxes (Shih et al., 2020) below the euphotic zone divided by trapping efficiency (Hung and Gong, 2007; Li, 2009) are used as the POC flux constraints in GS1.
Considering that the accumulated sediment budget can only account for 13 %–18 % of GPR's annual sediment load, Huh et al. (2009) suggested that gravity flows through the GPSC may export the remaining sediment. Therefore, the upper bound of the sediment export rate is set to 87 % at both sites (Table 1). The geochemical constraints are listed in Table 1, and the derivations from the literature are summarized in Table A2.
Table 1Equality and inequality constraints implemented in the LIM models of GC1 and GS1. Values given as single numbers implied that the data were equalities, whereas the values designated in [minimum value, maximum value] represented the inequalities.
2.4.5 Physiological constraints
We applied the four wildly used physiological constraints in LIM studies (van Oevelen et al., 2006; Stratmann et al., 2018) in the food web model, including respiration (R), assimilation efficiency (AE), production (P), and net growth efficiency (NGE).
For meiofauna and macrofauna, R is defined as the sum of maintenance respiration (biomass-specific respiration, MR) and growth respiration (associated with growth processes, e.g., synthesis of new structures in growth, GR). MR is set to be proportional to 1 % of the biomass per day at 20 °C following the definition in van Oevelen et al. (2006), corrected by a temperature correction factor (Tlim) (Soetart and van Oevelen, 2009) as
Here Q10 is a coefficient for temperature-dependent reaction and was set to 2 for most poikilotherms. T is the bottom water temperature for each site. Therefore, the maintenance respiration is calculated as
Within the food web model, GR is defined as
AE is described as
Here I is the ingested food, and F is the feces.
P and ratio are expressed as
and
respectively. Bacterial growth efficiency (BGE) is defined as the amount of new bacterial biomass produced per unit of assimilated OC (del Giorgio and Cole, 1998). Net growth efficiency (NGE) (Clausen and Riisgård, 1996) is defined as
The AE, ratio, BGE, and NGE constraints are derived from the literature and summarized in Table 1.
2.5 Linear inverse models
With a priori food web structure (Fig. B1), the empirical data of standing stocks, geochemical flux constraints, and physiological constraints were combined as a set of linear functions of equality and inequality equations (van Oevelen et al., 2010). Several reviews have explained the technical and methodological aspects of LIM (e.g., van Oevelen et al., 2006, 2010; Soetaert and van Oevelen, 2009), thus not rehashed here. We adopted a likelihood approach based on the Markov chain Monte Carlo (MCMC) algorithm (Kones et al., 2006) to calculate the possible solution sets for LIM. The standard deviation is set to a ±2 % error margin to iterate until the convergence of solution sets. The model was run 10 000 times to estimate the mean of unknown flows using the R package LIM (Soetaert and Herman, 2009; van Oevelen et al., 2010).
2.6 Turnover rate of OM
The turnover rate (or residence time) of organic matter (OM) is a function of stock size and energy transfer in/out of stock (Rowe et al., 1990, 2008). Therefore, the OC turnover rate was quantified by dividing the carbon stock with measured oxygen consumption or modeled carbon flows. For example, the OC turnover rate was calculated as the sum of detrital and biotic carbon divided by measured TOU or by the sum of flows BAC → DIC, MEI → DIC, and MAC → DIC, corresponding to the definition of TOU.
2.7 Network indices of ecosystems
Food web functions were examined using network indices widely applied in deep-sea food web studies, including total system throughput (), total system throughflow (TST), total system cycled throughflow (TSTC), Finn's cycling index (FCI), and average mutual information (AMI) (Tables A3 and A4, Latham and Scully, 2002; Ulanowicz, 2004; Kones et al., 2009). All the indices were calculated using the R package NetIndices (Kones et al., 2009). The fraction of indices (from 10 000 solutions) with greater values in the GC1 than GS1 was calculated to compare the difference between sites. For instance, when the fraction is 0.9, it implies that 90 % of the solutions were greater in the GC1 than GS1, and vice versa for a fraction of 0.1. The difference was considered significant when the fraction was greater than 90 % or smaller than 10 %, and it was considered highly significant when the fraction was greater than 95 % or smaller than 5 % (van Oevelen et al., 2011).
2.8 Statistical analysis
The seasonality of OC stock and oxygen utilization was first examined to determine whether the sampling seasons may affect the analysis. The assumption of homogeneous variance was examined by permutational analysis of dispersion (PERMDISP). Mixed effect permutational analysis of variance (PERMANOVA) was used to investigate the impact of habitat (canyon vs. slope) and season (spring, summer, and autumn) on the biotic and abiotic carbon stocks and oxygen utilization. The number of permutations for each test was set to 9999, and all statistical tests used α value = 0.05. The multivariate statistical analyses used the R package “vegan” (Oksanen et al., 2022).
3.1 Environment data
The average bottom water temperature was 13.5 °C in GC1 and 13.9 °C in GS1. As a result, the calculated Tlim are 1.05 and 1.09 for GC1 and GS1, respectively. Tlim values are important correction factors controlling biomass-specific maintenance respiration in the LIM model. While the bottom water density, salinity, and temperature were comparable between GC1 and GS1, the light transmission profiles showed a notable distinction (Fig. B2). For instance, little to no light transmission was observed near the GC1 seafloor throughout the sampling cruises, indicating the persistent presence of BNL. This result coincided with the observation of Liu et al. (2010), who reported a 100 m thick BNL with high suspended-sediment concentration in GPSC based on mooring observations.
3.2 Stock of the non-living component of OC
For the abiotic sediment OC stock, the average TOC content in the upper 10 cm of the sediment was 0.4 ± 0.11 % and 0.5 ± 0.04 % in GC1 and GS1, respectively. This value fits in the range of TOC content (ca. 0.3 %–0.8 %) reported previously in the southwestern margin of Taiwan (Kao et al., 2006; Hsu et al., 2014). PERMDISP showed that the assumption of homogenous variation is not violated between habitat groups and among season groups (Table A5, habitat, p=0.4469; season, p=0.9375). The sediment OC stock in the GS1 was significantly higher than in the GC1 (Table A6, PERMANOVA, p=0.0399), but the seasonal variability was not evident (p=0.8077). Since the seasonal signal was not detected, we used the average dry-period OC of 442 915 ± 88 074 mg C m−2 for GC1 and 540 985 ± 93 128 mg C m−2 for GS1 in the LIM model (Table 2, Fig. 2a).
Table 2Mean standing stocks (in mg C m−2) with standard deviation from GC1 and GS1 in the dry period.
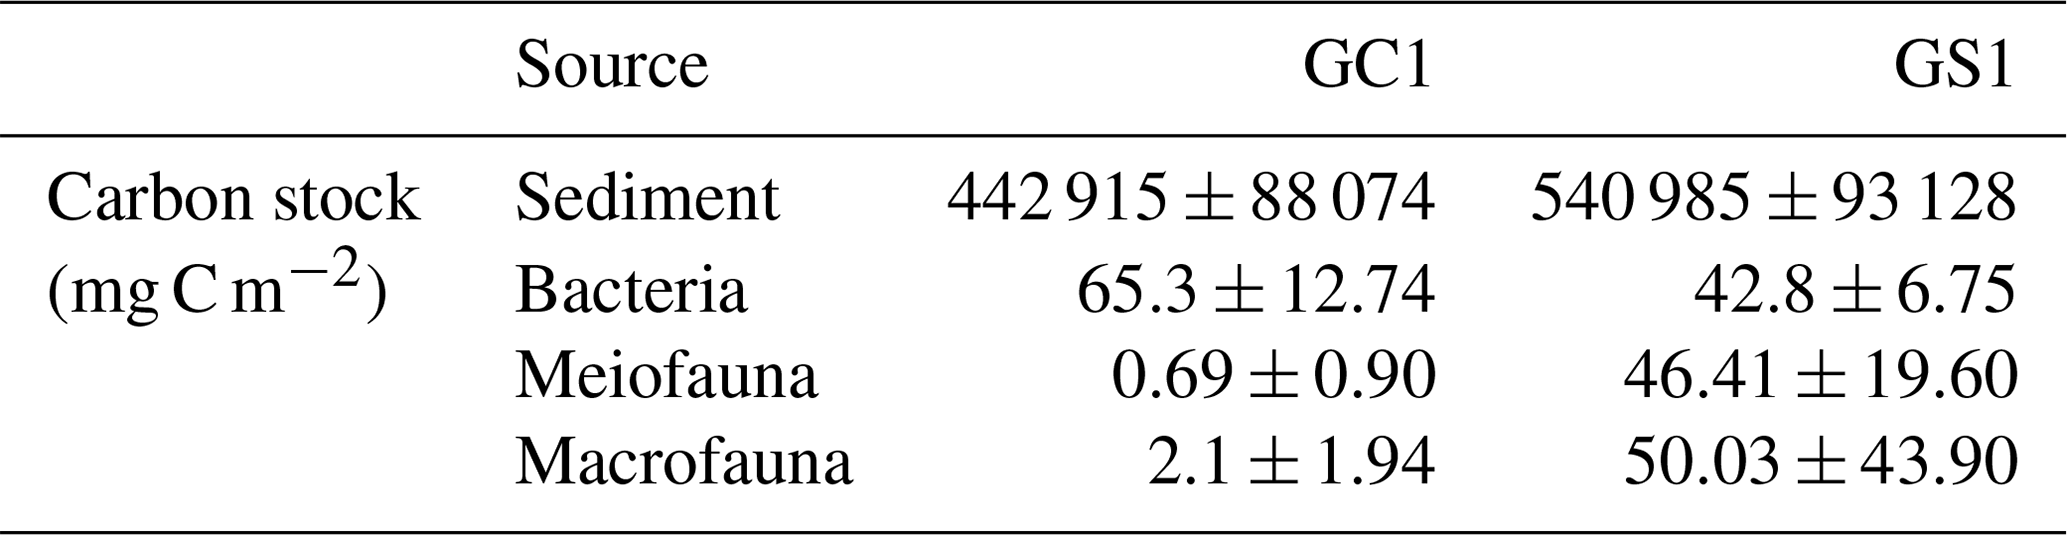
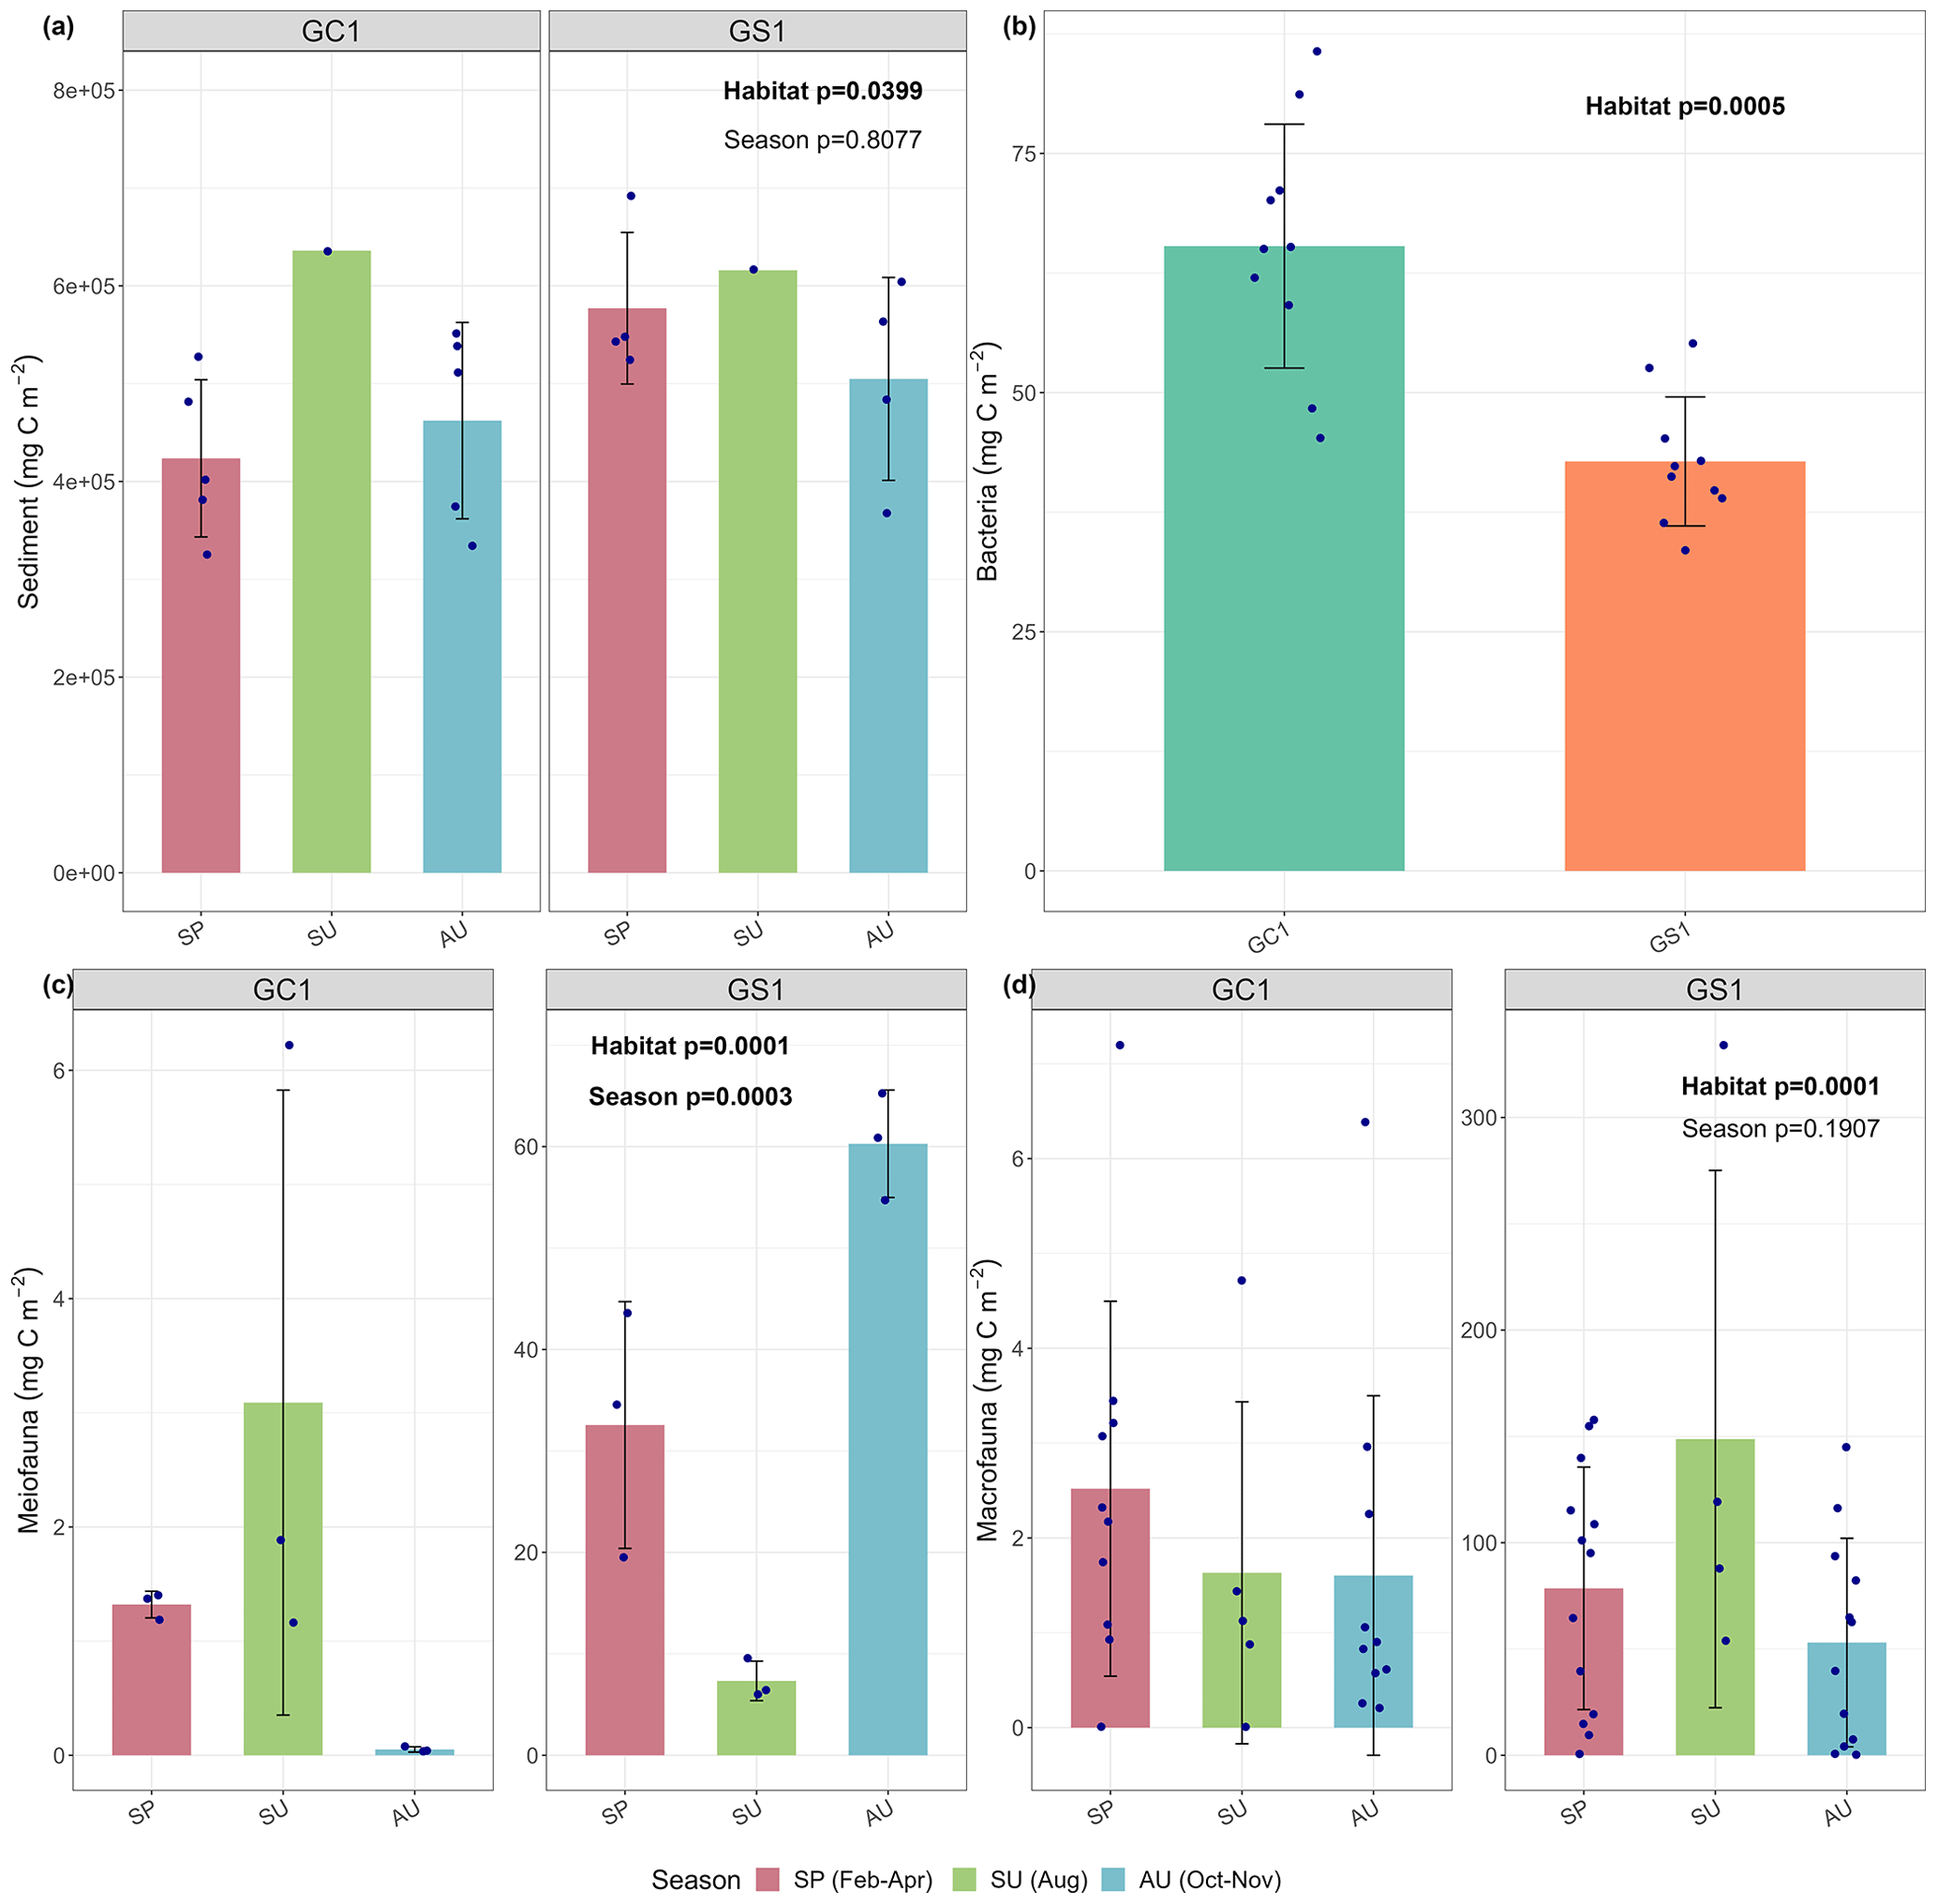
Figure 2Carbon stocks of (a) sediment, (b) bacteria, (c) meiofauna, and (d) macrofauna of GC1 and GS1. The bar chart and error bars show the mean and standard deviation of carbon stocks. The dots represent the OC stock (in mg C m−2) for each replicate. Note that summer sampling of sediment was only conducted once in August 2015 (cruise OR1_1114). Bacteria was only collected in March–April 2018 (cruise OR1-1190). Meiofauna was only collected once each season for both sites, so the three replicates were conducted during a single cruise.
3.3 Stocks of the living component of OC
Prokaryotes were only sampled in spring 2018 (cruise OR1_1190) with 10 replicates in each site. Prokaryote biomass in GC1 was significantly higher than in GS1 (Fig. 2b, Table A6, PERMANOVA, p=0.0005). For the model input, the average bacteria biomass is set to 65.3 ± 12.7 mg C m−2 in GC1 and 42.8 ± 6.8 mg C m−2 in GS1, respectively (Table 2).
PERMDISP indicates that the meiofaunal variation between habitat and season groups was not homogeneous (Table A5, habitat, p=0.0001; season, p=0.0001). The meiofaunal biomass in GS1 was significantly higher than in GC1 (Table A6, PERMANOVA, p=0.0002), with significant seasonal variability (p=0.006) but also a significant interaction between the season and habitat (p=0.0002). Due to the lack of a consistent seasonal pattern between habitats and the fact that only one sampling cruise was conducted for each season (Fig. 2c), the average meiofaunal biomass in the dry period was used in the model, with 0.69 ± 0.90 mg C m−2 in GC1 and 46.41 ± 19.60 mg C m−2 in GS1.
Macrofauna sampling was conducted for eight cruises across the two habitats. Macrofaunal biomass was approximately an order of magnitude lower, and abundance was about 5 times lower in the GC1 than in GS1 (Fig. 2d). PERMDISP showed a significant difference in variance between habitat groups but not among season groups (Table A5, PERMDISP, habitat, p=0.0001; season, p=0.3136). In addition, there was a significant biomass difference between habitats but not among seasons (Table A6, PERMANOVA, habitat, p=0.0001; season, p=0.1907). Therefore, the average macrofaunal biomass in the dry period was considered in the LIM model, with 2.1 ± 1.94 mg C m−2 for GC1 and 50.03 ± 43.90 mg C m−2 for GS1 (Table 2).
Table 2 summarizes the mean standing stocks used for the LIM model inputs. All OC stocks were higher in GS1 than in GC1, except for the bacteria. The stock of non-living components was approximately 4 orders of magnitude higher than that of living components. The meiofauna and macrofauna biomass were remarkably depressed in the canyon due to physical disturbances (Liao et al., 2017, 2020; Tung et al., 2023). Macrofauna had greater biomass than meiofauna on both the slope and canyon.
3.4 Oxygen utilization
The variation and mean of all oxygen utilization measurements (TOU, DOU, and BMU) were not statistically different among seasonal groups (Fig. 3; Table A5, PERMDISP, p>0.05) and between habitat groups (Fig. 3; Table A6, PERMANOVA, p>0.05). The means and standard deviations of TOUs were 69.6 ± 39.9 mg C m−2 d−1 for GC1 and 51.8 ± 15.2 mg C m−2 d−1 for GS1 (Fig. 3; Table 2). The measured DOUs representing aerobic respiration of bacteria showed little difference between the two sites, with values of 14.4 ± 15.8 mg C m−2 d−1 in the canyon head and 9.0 ± 9.5 mg C m−2 d−1 on the slope (Fig. 3; Table 2), despite the higher bacterial biomass in GC1 than GS1. Note that the standard deviations were greater than or close to the mean value in both sites, suggesting wide variations existed between samplings. BMU was presumed lower in GC1 due to lower metazoan biomass and thus lower benthos-mediated oxygen utilization. Nevertheless, BMU was 49.0 ± 28.2 mg C m−2 d−1 in GC1 and 41.2 ± 12.3 mg C m−2 d−1 in GS1 (Fig. 3; Table 2), showing no statistical difference between the two habitats.
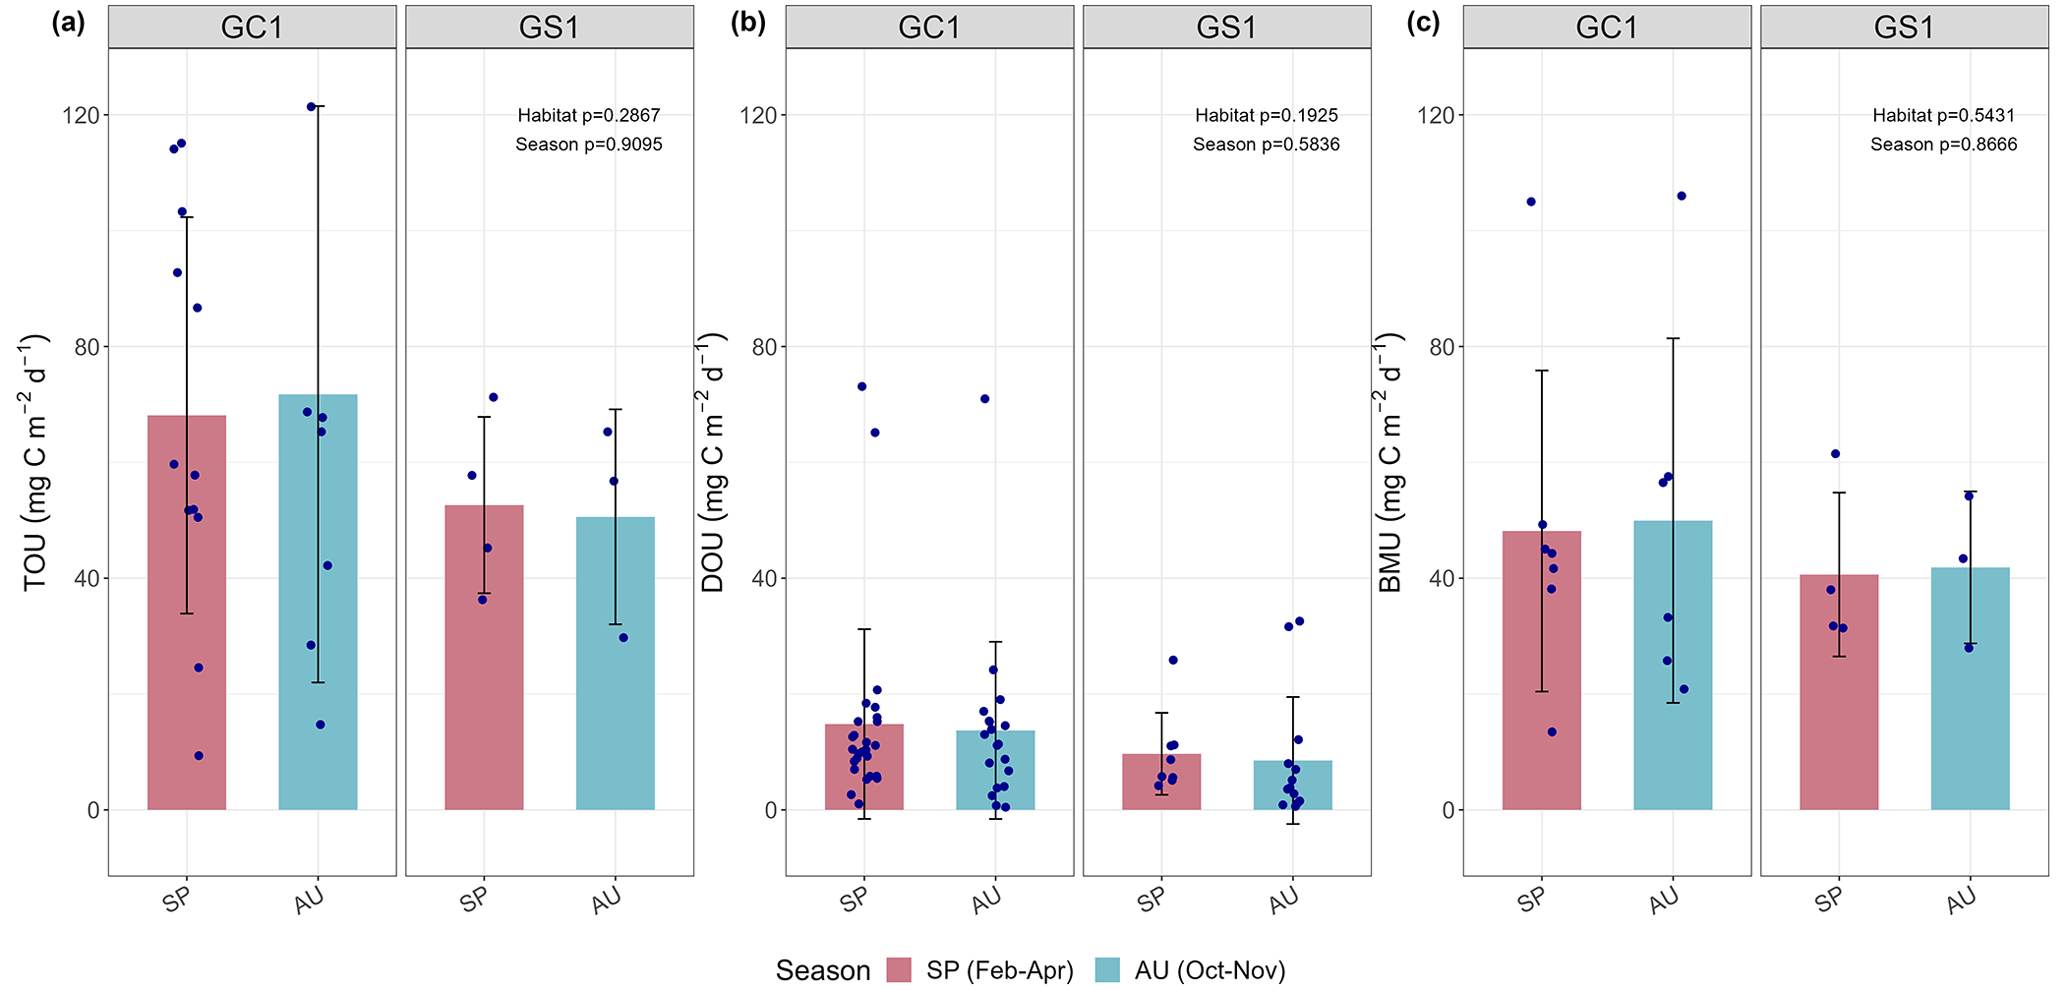
Figure 3Measured (a) total oxygen utilization (TOU), (b) diffusive oxygen utilization (DOU), and (c) benthos-mediated oxygen utilization (BMU) of GC1 and GS1. The bar chart and error bars show the mean and standard deviation for spring and autumn cruises. The dots represent the measurements for each replicate. The dotted lines represent the mean values from all sampling. No summer data are available.
3.5 LIM results
MCMC-solved flows in the GC1 model can be separated into three parts according to the order of magnitude of the mean values (Fig. 4a and Table A7). First, the mean value for POC flux was 2017.5 mg C m−2 d−1. The export (1696.6 mg C m−2 d−1) occupied 84 % of the POC input. Although 16 % of the POC flux (320.8 mg C m−2 d−1) is retained the sediment, only 4 % (72.4 mg C m−2 d−1) enters the benthic food web. The second-largest flow values were those related to the microbial loop, including DOC → BAC (26.3 mg C m−2 d−1), BAC → DOC (12.4 mg C m−2 d−1), and BAC → DIC (13.8 mg C m−2 d−1). Although the remaining flows were less than 1 mg C m−2 d−1, the meiofauna-related flows were at least 1 order of magnitude higher than the macrofauna-related flows.
The estimated POC flux input was 103.0 mg C m−2 d−1 in the GS1 by the MCMC method, with about 7 % (8.6 mg C m−2 d−1) exported out of the system (Fig. 4b). While 93 % of the POC flux (121.5 mg C m−2 d−1) is retained in the sediment, 10 % (12.6 mg C m−2 d−1) enters the benthic food web. On the other hand, the carbon flows between bacteria and the environment declined by 7 % (DOC → BAC), 34 % (BAC → DOC), and 16 % (BAC→DIC) in GS1 compared to GC1. Instead, the metazoan contribution increased due to higher mean flows between the compartments of meiofauna and macrofauna. Likewise, in GS1, the meiofauna-related flows were 1 or 2 orders of magnitude higher than those related to macrofauna.
The biological system within the GC1 food web received around 6 times more OC flux than GS1. The primary distinction lay in the quantity of OC flux degraded from detritus to the DOC pool. The incoming OC flux in the biological system was roughly equivalent to the measured TOU in GC1 (Table 3) and approximately 24 % of the measured TOU in GS1. The values of the internal flows (black flows in Fig. 4) representing the biological interactions in GS1 were higher than GC1, corresponding to the higher biomass of meiofauna and macrofauna on the slope (Table 2). Since the bacteria stock accounted for a larger proportion of the biomass in the canyon (∼ 96 %) compared to the slope (∼ 31 %, Table 2), the energy flow between bacteria and sediment stock was approximately 1.1 times (DOC → BAC) and 1.5 times (BAC → DOC) greater in GC1 than in GS1 (Fig. 4 and Table A7). On the other hand, the energy loss through predation and respiration was much lower in GC1 than in GS1, consistent with the significantly lower meiofauna and macrofauna standing stocks in the canyon head.
Within the benthic food webs, more than 99 % of the prokaryotic production in GC1 is channeled to mortality and returns to the DOC pool (Fig. 5). In the GS1, 63.3 % and 35.4 % of the prokaryotic productions are directed toward mortality and meiofauna grazing, respectively. The relative fates of meiofaunal and macrofauna productions are similar between the two habitats. For meiofauna, the production is primarily transferred to mortality (i.e., ∼ 32.6 % to 33.3 % returning to detritus), maintenance respiration (∼ 20.2 % to 23.1 %), and megafauna predation (∼ 31.8 % to 36.7 %). For macrofauna, the productions mainly go to maintenance respirations (∼ 72.6 % to 73 %).
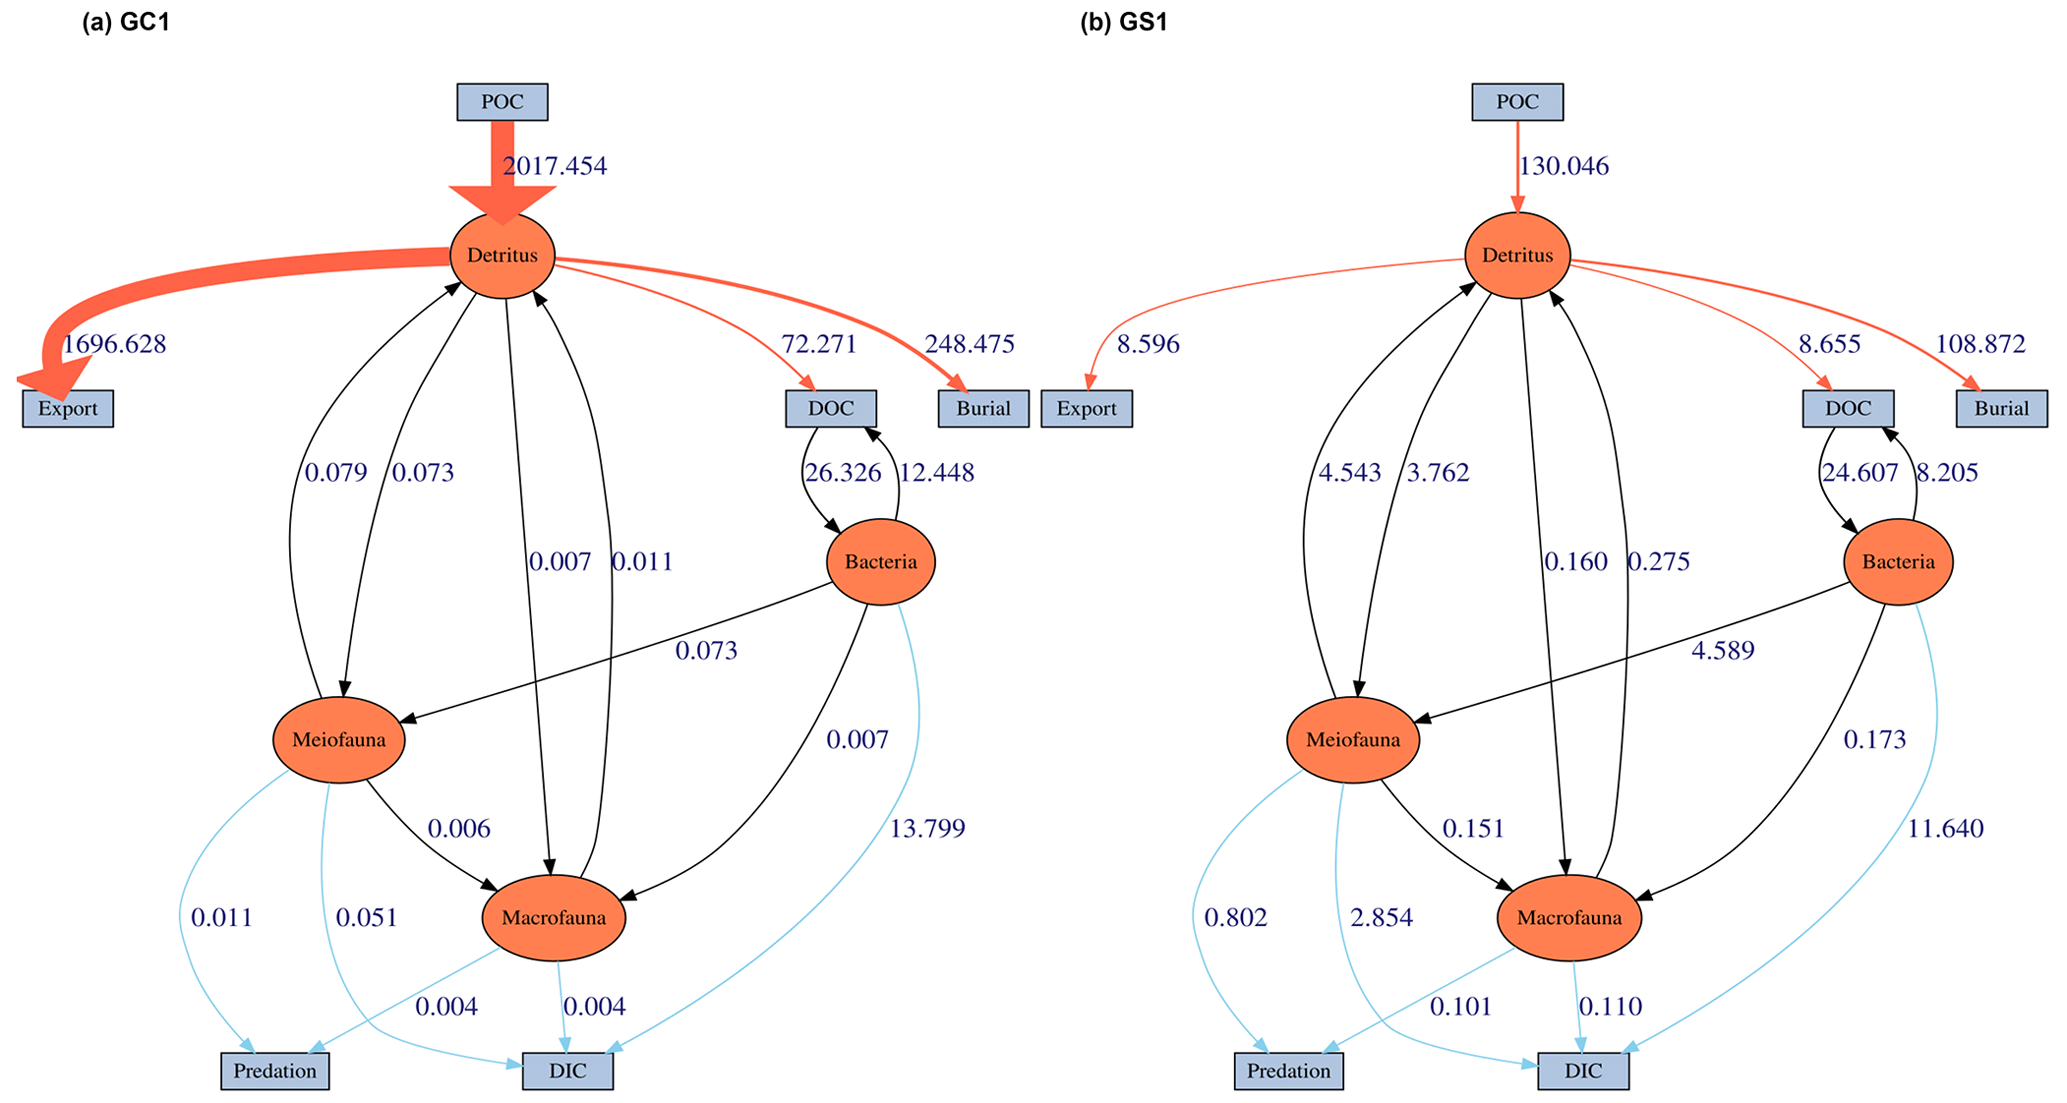
Figure 4The food web model derived from LIM results of (a) GC1 and (b) GS1 processed with the MCMC algorithm.
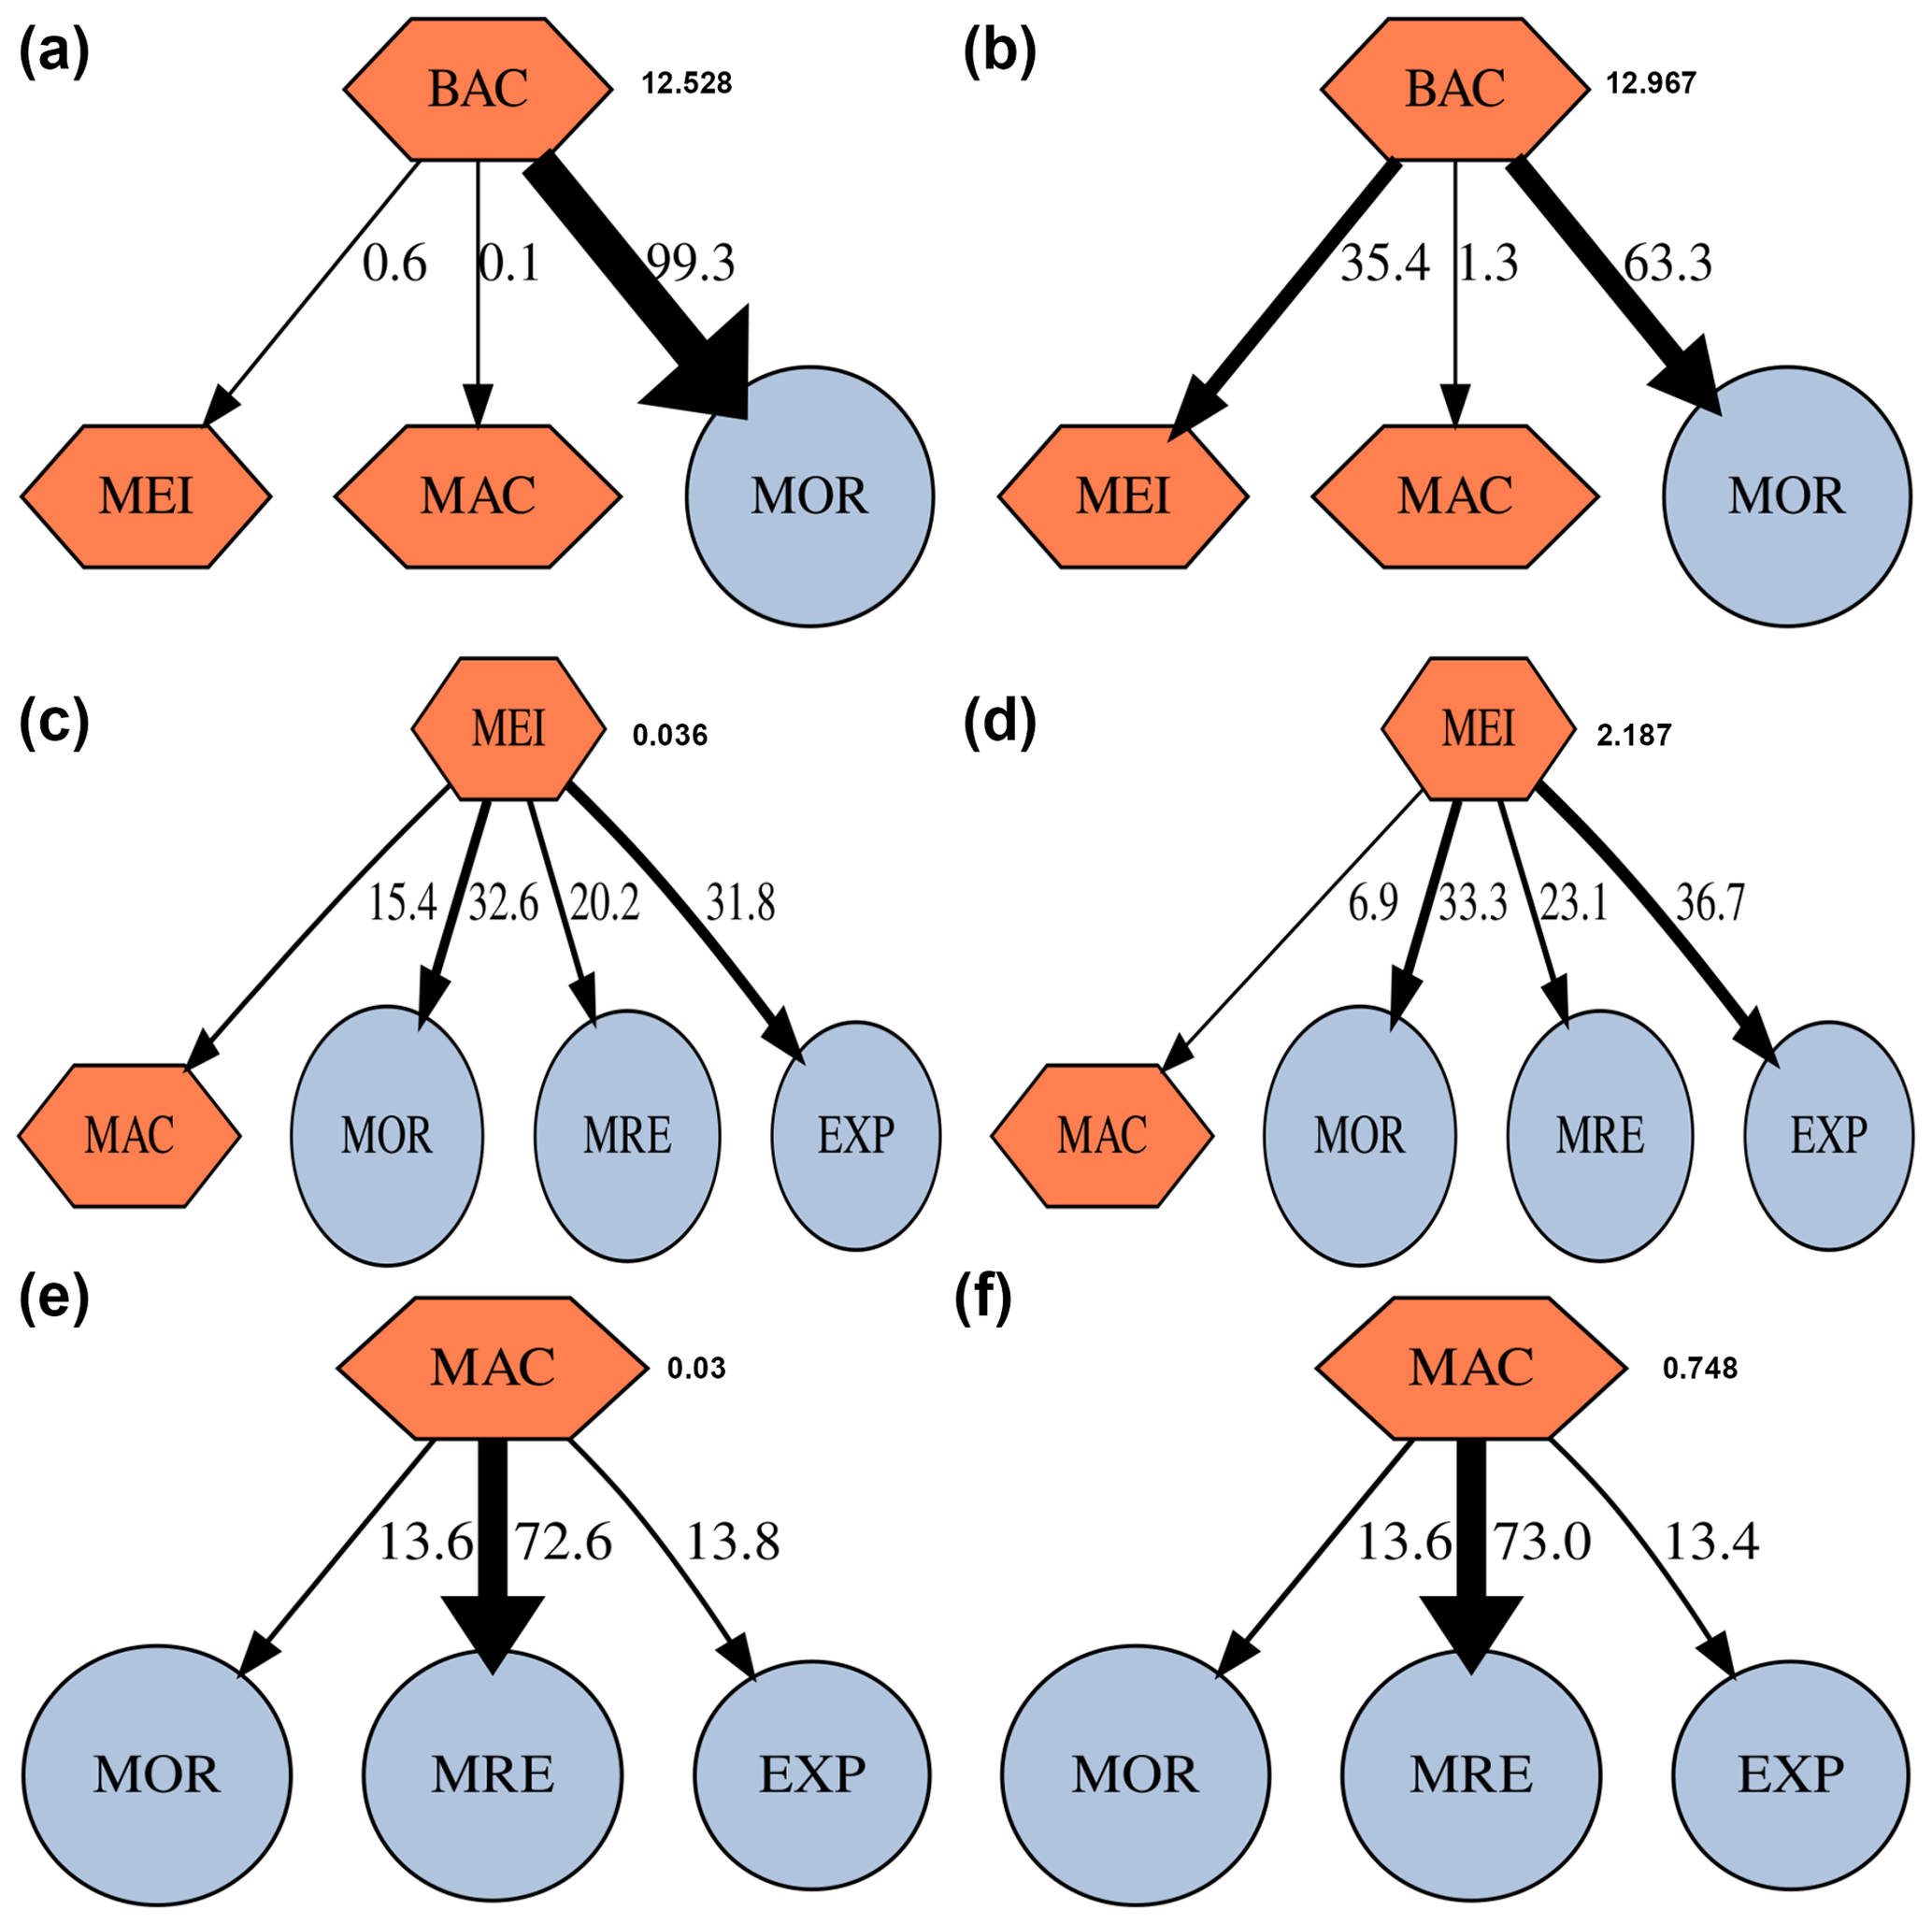
Figure 5Fate of secondary production (%) of prokaryotes, meiofauna, and macrofauna in GC1 (a, c, e) and GS1 (b, d, f). Absolute production (mg C m−2 d−1) is indicated next to the compartment. The possible fates of this secondary production are mortality (MOR), predation by meiofauna (MEI), macrofauna (MAC), maintenance respiration (MRE), and predation by megafauna (EXP).
3.6 Turnover time
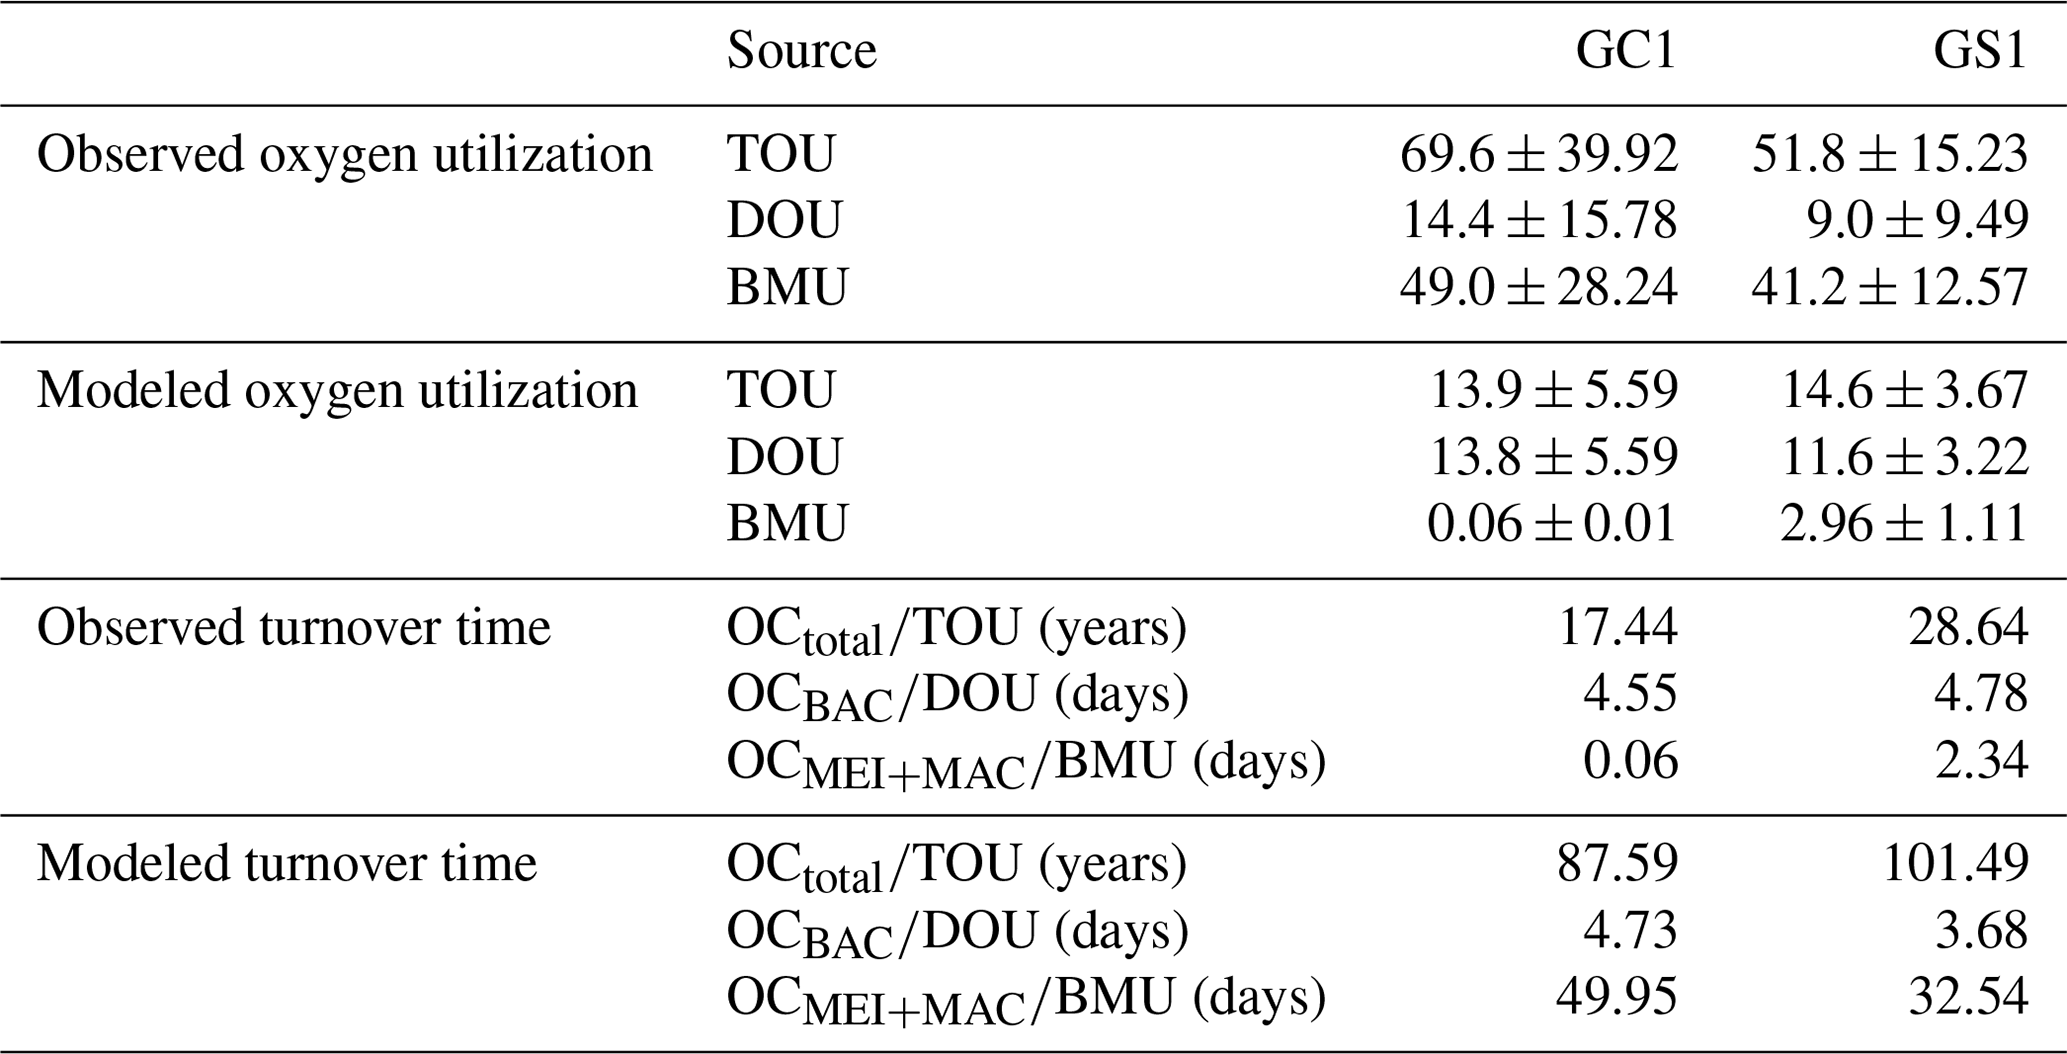
Both measurement and modeling results showed that TOC turnover was much slower in GS1 (Table 3). The TOC turnover based on TOU was about 1.2–1.6 times slower in GS1 than in GC1, and the TOC turnover based on model results was about 3.5–5.0 times slower than that based on measured TOU for both sites. Bacteria turnover rates in two habitats calculated by different methods were comparable, with 4.6–4.7 d in GC1 and 3.7–4.8 d in GS1. However, the turnover time for meiofauna and macrofauna estimated by the two methods was distinctly different. In GC1, the turnover time estimated by the observation-based BMU was ∼ 800 times shorter than those calculated by the model. Though the turnover time difference between the two methods in GS1 was not as vast as in GC1, it was still 14 times longer by model estimation. The turnover time was much shorter in GC1 with the measured BMU (GC1: 0.1 d; GS1: 2.3 d), while the turnover times estimated by models in GC1 (50.0 d) were about 1.5 times higher than in GS1 (32.5 d).
Table 3Oxygen utilization (mg C m−2 d−1) and stock turnover (unit: year or day) calculated from measured and modeled oxygen utilization rates. Note that for the modeled results, TOU was defined as the sum of BAC → DIC, MEI → DIC, and MAC → DIC; DOU was defined as BAC→DIC; and BMU was defined as the sum of MEI → DIC and MAC → DIC in Fig. B1.
3.7 Network indices
Total system throughput () and total system throughflow (TST) were significantly higher in the food web of GC1 than in that of GS1 (Fig. 6). Total system cycled throughflow (TSTC) was not statistically different between the two sites, while the Finn cycling index (FCI) and average mutual information (AMI) of GC1 were significantly lower than those of GS1 (Fig. 6).
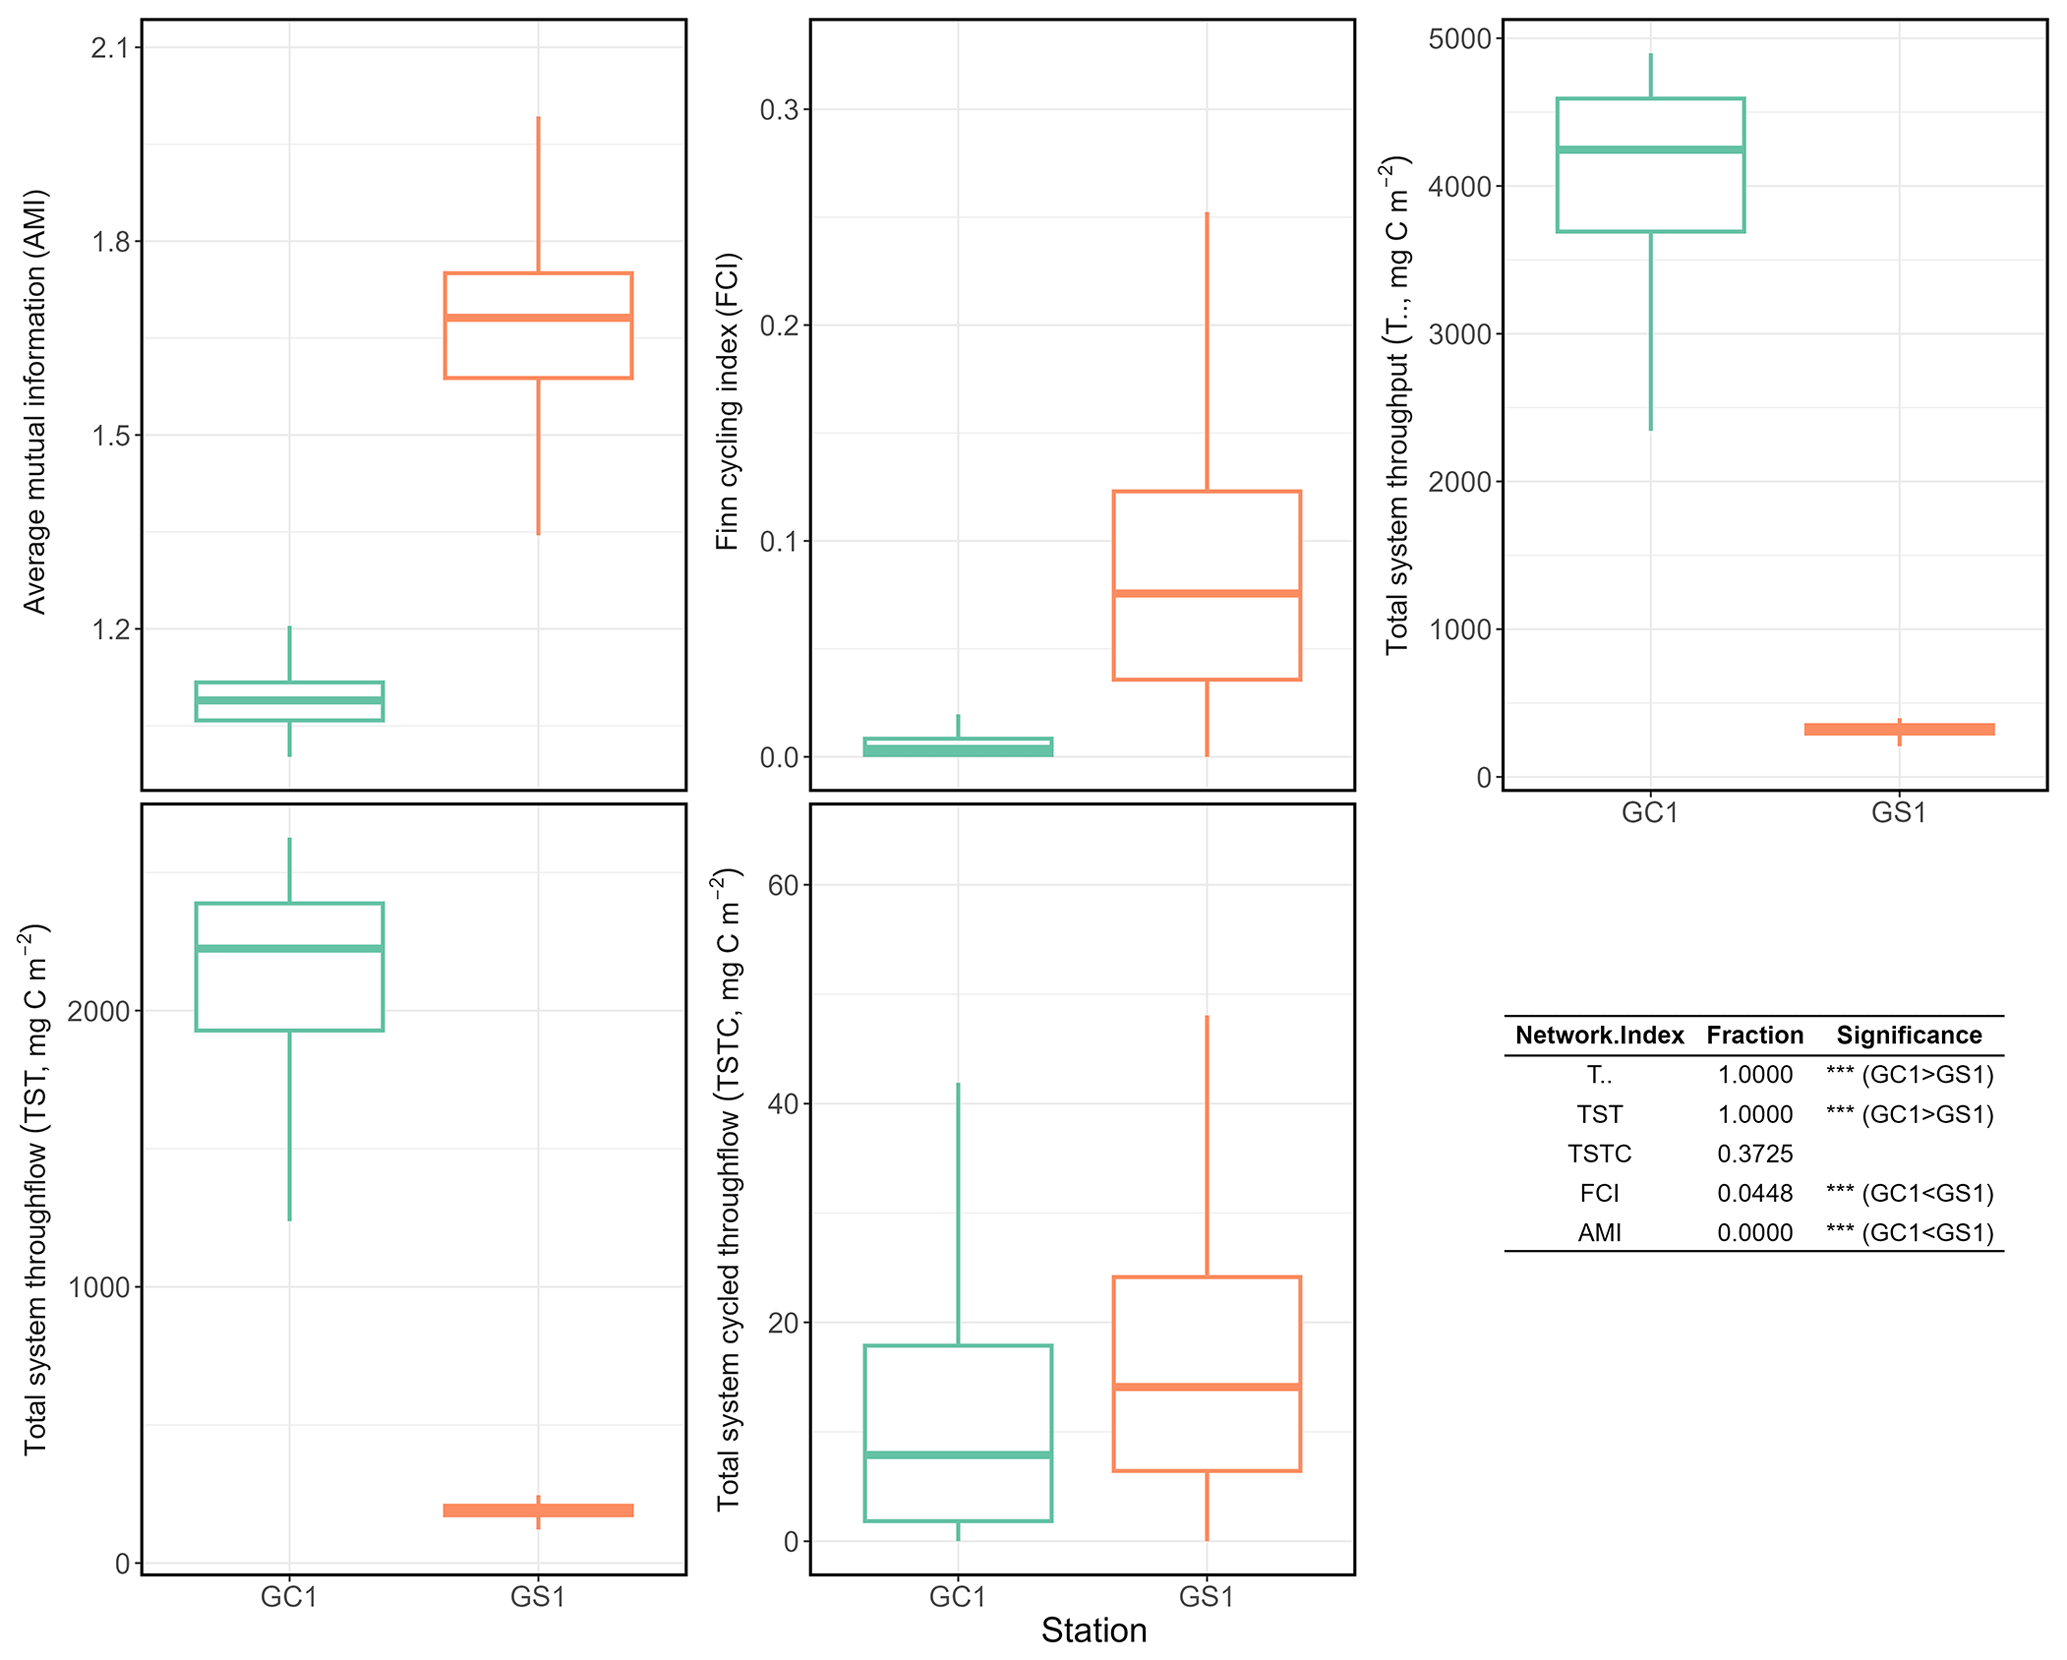
Figure 6Selected network indices of GC1 and GS1. The indices were calculated from 10 000 solutions of the LIM. As a result, there were also 10 000 values for each index, presented as box plots. The table at the bottom right compares network indices calculated for GC1 and GS1. The number indicates the fraction of network values higher in GC1 than in GS1.
4.1 OC stocks and study limitations
GPR and GPSC exhibit distinct dry and wet seasons due to the influence of monsoons and typhoons, resulting in extreme precipitation in the region from May to October (Liu et al., 2016). The combination of steep topography, a highly erodible drainage basin, and intense human activities also leads to remarkably high suspended-sediment load and fluvial discharges from the GPR during the wet season (Huh et al., 2009; Liu et al., 2013, 2016). However, the sediment and macrofauna OC stocks were not statistically different among sampling seasons (Fig. 2a, d). A possible explanation for the lack of seasonal variation in the OC stocks is the sampling timing. Our sampling cruises were mainly conducted in spring (March to April) and autumn (October to November) during the dry period, with only one summer sampling (August, Table A1). The OC stocks could have recovered from presumably more perturbed wet periods and, thus, without a notable seasonal difference. The lack of seasonality prompts us to use the average stocks of spring and autumn in the LIM model, representing the food web dynamic during the dry period.
The sediment OC in the head of GPSC is lower than in the previous submarine canyon studies by Rowe et al. (2008) and van Oevelen et al. (2011). For instance, the TOC content in the Mississippi Canyon head is approximately 1.9 % (Rowe et al., 2008), which is considerably higher than the average TOC content in the head of GPSC (0.39 %). Bacteria biomass is the largest living component of OC stock in the head of GPSC (Fig. 2b). Still, it is less than half of the value in the Mississippi Canyon head (2585 mg C m−2). Bacteria biomass and production can be affected by temperature, physical disturbance, substrate type, and sediment composition (Yamamoto and Lopez, 1985; Alongi, 1988). Seasonal bacterial population and biomass variations have also been observed from the shallow to deep Baltic (Meyer-Reil, 1983) and Cretan (Danovaro et al., 2000) seas; however, the controlling factor is site-specific (van Duyl and Kop, 1994). As the bacterial biomass was also low in GS1, the low bacterial biomass may be a shared feature for the sediment of this SMR-fed active margin.
In food web studies, the general trophic structure of communities is established by grouping organisms into broader feeding types based on information gathered from the literature (e.g., Fauchald and Jumars, 1979; Lincoln, 1979; Dauwe et al., 1998). However, the lack of adequate taxonomic resolution (e.g., family, genus, or species level) hinders our ability to segregate data into functional groups. Consequently, we derived estimates of the metazoan carbon flows solely based on physiological constraints and mass balancing rather than relying on the feeding preferences of the functional groups. Moreover, some metazoans can switch their feeding behavior in response to changing food quality and quantity in the environment. For instance, some Polychaeta and Mollusca species can transition from deposit feeding to suspension feeding or vice versa following fluctuations in the flux of suspended particles (Taghon and Greene, 1992), providing an advantage in environments with varying flow velocities. A mesocosm observational study also demonstrated that two surface deposit feeder species, Sipunculus sp. (Sipuncula) and Spiophanes kroeyeri (Polychaeta), shift from deposit feeding to suspension feeding under different flow conditions (Thomsen and Flach, 1997). Thus, while aggregating all metazoans into two size classes oversimplifies the food web model, it may help prevent misrepresenting the relative contributions of taxa exhibiting high feeding plasticity.
On the other hand, the organic matter degradation in sediments exhibits high variability, influenced by factors such as organic matter chemistry, sediment physical characteristics, and biological agents involved in decomposition (Middelburg and Meysman, 2007). As a result, the proportions of detrital organic carbon components (i.e., labile, semi-labile, and refractory fractions) typically differ across study locations and cannot be directly inferred from previous literature (e.g., van Oevelen et al., 2011; Dunlop et al., 2016; Stratmann et al., 2018; Durden et al., 2020). Due to lacking empirical data, we aggregated all detritus into a single compartment, consistent with the approach in other benthic food web model studies (e.g., Rowe et al., 2008). Additionally, organic matter degradation occurs over a broad spectrum of timescales, from minutes for biochemical breakdown in animal guts to 106 years for organic carbon mineralization in deep-sea sediments (Middelburg et al., 1993). This wide dynamic range underscores the significant influence of the characteristic timescale of experimental observations on measurable degradation rates (Hedges and Keil, 1995). Given that our model measures sediment organic carbon oxidation through oxygen consumption, it likely emphasizes the estimation of labile organic carbon degradation over semi-labile and refractory fractions due to their extended timescales.
The current food web models omit megafauna stock due to data limitations, notably the technical challenges of trawling in hazardous areas like the GPSC. Consequently, the megafauna predation is only constrained by the net growth efficiency of meiofauna and macrofauna, with all metazoan growths assumed to be consumed by megafauna. In the deep sea, the megafauna abundance and biomass are generally lower and decrease more rapidly with depth than smaller infauna in the deep sea (Rex et al., 2006; Wei et al., 2010). However, certain areas can exhibit high megafauna and fish densities (Sibuet, 1977; Hecker, 1994; Fodrie et al., 2009), which can influence the redistribution and quality of OM in the marine sediments (Smallwood et al., 1999), potentially affecting the food web dynamics. While van Oevelen et al. (2011) highlighted the significance of deposit-feeding megabenthos at the mid-section of the Nazaré Canyon, their sampling depths are considerably deeper than ours. It is suggested that the intense flow regimes at the canyon head (i.e., tidal and turbidity currents) may favor the mobile megafauna (i.e., fish, crabs, and octopus) over the deposit-feeding counterparts (i.e., sea urchins) because the mobile megafauna predators better cope with physical disturbance and may benefit from transient food subsidy in the canyon (Vetter and Dayton, 1999; Vetter et al., 2010). Per the presented model structure, the sediment detrital carbon in GPSC would be directed toward export, burial, microbial loop, and smaller metazoan. Nonetheless, the absence of deposit-feeding megafauna is not expected to disproportionately influence the GPSC food web.
4.2 Implemented model constraints
LIM food webs combine several physiological and geochemical constraints as lower and upper bounds of the carbon flows. This creates the possible solution space for the algorithm to iterate and find a solution set of all flows. However, most LIM studies used reference constraints due to technical difficulties in physiological experiments on benthic species (van Oevelen et al., 2010). For example, Stratmann et al. (2018) studied the abyssal plain food web of the Peru Basin; however, some physiological constraints of benthos in the food webs were derived from the shallow water or intertidal species (e.g., Drazen et al., 2007; Koopmans et al., 2010). In other food web studies, the physiological constraint of the dominant species was used as the representative for the entire size group (e.g., De Smet et al., 2016). Though these low-quality constraints bring some uncertainty to our model results, the flow solution was still more convincing than those without constraints (van Oevelen et al., 2010).
In the LIM food webs, the maximum bacterial OC remineralization (BAC → DIC) was set to 30 % of the measured TOU (cf. Sect. 2.4.4). In fact, the measured DOUs were 21 % of the measured TOU in GC1 and 17 % of the measured TOU in GS1, suggesting that the maximal constraints were reasonable. Furthermore, the modeled DOU flows (BAC → DIC) agreed well with the direct measurement in both study sites, and the modeled TOU flows (sum of BAC → DIC, MEI → DIC, and MAC → DIC) were within the same order of magnitude as the measured TOU (Table 3), lending credibility to the LIM results.
The main difficulty lies in modeling BMU, which includes faunal respiration and the oxygen uptake related to biological activities (Glud et al., 2003). Macrobenthos may modify diagenetic reactions, sediment–water exchange, and sediment composition (Aller, 1982, 1994) through their activities, such as feeding, burrowing, tube construction, bioirrigation (Jørgensen et al., 2005), and bioresuspension (Graf and Rosenberg, 1997). Forster and Graf (1995) reported that two macrofauna species, Callianassa subterranea (Decapoda) and Lanice conchilega (Polychaeta), enhance TOU by 85 % through their pumping behavior in the shallow North Sea. The animal-induced changes in oxygen distribution are notoriously difficult to quantify and separate from their maintenance respiration. Therefore, the most straightforward and robust procedure to evaluate the fauna activities in mixed communities is to subtract DOU from TOU (Glud, 2008). Unfortunately, the current food web structure considers only the respiration of meiofauna and macrofauna, which is far less than the observed BMU (Table 3). The total biomass of meiobenthos and macrobenthos was significantly higher on the slope, which explained the higher modeled BMU in the GS1. However, the observed BMU was not statistically different between the two sites, suggesting that the biomass may not predict bioturbation and, thus, the observed BMU. Liao et al. (2017) found that several polychaete families capable of burrowing deep into the sediment, including paraonids, cossurids, capitellids, and sternaspids, thrived in the canyon habitats. In contrast, the discretely motile, surface deposit, and suspension feeders (e.g., cirratulids, ampharetids, and spionids) dominated the slope sediment but diminished in the canyon (Liao et al., 2017). Therefore, the discrepancy between the modeled and observed BMU in GC1 may be related to the active bioturbation behaviors of these subsurface deposit feeders.
TOU is the most reliable proxy of total benthic carbon degradation in marine sediments because it integrates aerobic activity, nitrification, and re-oxidation of reduced inorganic compounds (Stratmann et al., 2019). Therefore, the TOU should reflect the variation in POC input. However, POC flux determined by sediment traps usually does not match the carbon demand of the benthic community (Smith, 1987; Jørgensen et al., 2022). This study used reported vertical POC flux data as constraints to approximate OC input in the food webs. While our modeled POC flux is approximately 29 times higher than the measured TOU in the canyon head, the OC flux supporting the GC1 biological system (72.4 mg C m−2 d−1) agreed well with the measured TOU (69.6 mg C m−2 d−1). By contrast, the modeled POC flux is about 2 times higher than the measured TOU on the nearby slope; however, it only meets 19 % of the benthic OC demands (i.e., measured TOU). Similarly, Smith and Kaufmann (1999) and Smith et al. (2016) reported a long-term discrepancy between food supply and demand in the eastern North Pacific, with the POC fluxes contributing only around half of the TOU. Moreover, the imbalance between carbon supply and demand varied by region on the abyssal plain in the deep Arabian Sea (Witte and Pfannkuche, 2000), in which the sediment trap fluxes matched 50 % of the benthic carbon demand in the southernmost station but only 20 % in the westernmost station. These mismatches were mainly explained as the uncertainties concerning relatively short-term TOU incubations via long-term sediment trap deployment (Witte and Pfannkuche, 2000). The sediment traps also fail to capture episodic flux events due to their low temporal resolution (Huffard et al., 2020). Besides, the benthic oxygen consumption rates can be affected by primary production, quality of OM, and bottom water oxygen concentrations (Jahnke, 1996; Wenzhöfer and Glud, 2002). It has been reported that the dissolved oxygen concentration in the bottom water increased toward the canyon head of GPSC (Liao et al., 2017). Also, Wang et al. (2008) reported that the flow velocity near the head of GPSC regularly exceeded 1 m s−1. The high flow velocity may enhance water mass mixing and thus increase oxygen concentration at the canyon head. In short, the peculiarly high value of observed TOU at the canyon head might be associated with higher bacteria stocks and remineralization, underestimated bioturbation, physical disturbances, or chemical oxidation.
4.3 Network characteristics
Network indices are often calculated to describe the function of the food web (Kones et al., 2009). Here, five indices were used to examine the food web structures in GC1 and GS1. TST and quantify the energy that belongs to the system as the sum of flows. The magnitude of these two indices is directly linked to the ecosystem's growth. The greater TST and in the canyon head (Fig. 6) implies more intense carbon processing and a higher total amount of energy flowing through the system (Ulanowicz, 1986, 2004). Notably, the microbial loop (de Jonge et al., 2020), encompassing detritus degradation, DOC assimilation by prokaryotes, viral-induced prokaryote mortality, DOU, and metazoan predation on prokaryotes, reveals a considerable contribution to in the two systems. Specifically, the microbial loop constitutes 3 % of in GC1 (124.9 mg C m−2 d−1) and 18 % of in GS1 (57.9 mg C m−2 d−1). The higher input to the DOC pool in the canyon supports a greater prokaryotic biomass.
However, TST and cannot provide details about how the material is distributed within the system. In other words, two systems with totally different food web structures can have the same TST (Bodini, 2012). Therefore, FCI and AMI were computed to estimate the maturity of the two ecosystems. According to Odum (1969), a mature ecosystem (i.e., with higher FCI values) should involve a higher information content, high biomass, and a high capacity to seize and hold the nutrients for cycling within the system. Our finding shows that FCI is significantly greater in GS1 than in GC1, indicating that the slope system has a higher degree of energy recycling and is a relatively mature ecosystem that develops more completed nutrient conservation routes (Odum, 1969) compared to the canyon system. Moreover, the reported FCI of benthic ecosystems, including one submarine canyon, ranges between 5 % and 20 % (van Oevelen et al., 2011; Kones et al., 2009; Anh et al., 2015). While the FCI of GS1 (7.6 %) falls within this range, that of GC1 is much lower (0.4 %), resulting from the relatively large value of TST. These results also indicated that cycling had a modest impact on the TST in the GC1 model. Though the cycle index alone cannot assess the ability to resist environmental change in a system, perturbations can substantially influence the cycling process of an ecosystem (Saint-Béat et al., 2015). The higher biodiversity (Liao et al., 2017, 2020) and biotic carbon stock suggest that GS1 is a more mature ecosystem than the frequently disturbed GC1.
In contrast, GC1 is dominated by the bacteria-related process (e.g., higher bacteria stocks and OC flows) with the lower metazoan carbon stock and the associated flow, as demonstrated by the modeled fates of secondary production from this (Fig. 5) and other studies (van Oevelen et al., 2011). For instance, despite the increased OC flow to the DOC pool and higher prokaryotic biomass in the GPSC, the energy transfer to higher trophic levels is hindered by the lack of metazoans, leading to the predominant fate of prokaryotic production toward mortality (99.3 %). On the slope, while prokaryotic mortality remains the primary fate (63.3 %), considerable production transfers to higher trophic levels through meiofauna grazing (35.4 %).
Ulanowicz (1980) proposed that AMI is a better indicator of an ecological network's developmental status to measure the maturity of an ecosystem. Since the energy distribution and pathway determine the maintenance cost for the whole system, Bodini (2012) suggested that a highly redundant network that is less organized would have a lower AMI value. Also, trophic specialization is expected to result in higher values for AMI (Ulanowicz, 2004). Conversely, a low AMI value reflects the early immature stage of the ecosystem (Mukherjee et al., 2019). As expected, the highly disturbed canyon head has a significantly lower AMI than the upper slope.
Turnover time derived from the direct measurements of TOU, DOU, or BMU was much shorter than that derived from modeled estimations. The longer OC turnover rates estimated by models have resulted from an underestimation of the bioturbation or physical disturbance in the natural environment. The turnover time of total OC estimated by direct measurement in both sites was in the timescale of decades, consistent with the previous study by Rowe et al. (2008) in the Mississippi Canyon. Besides, the longer OC residence time in GS1 corresponds to the interpretation of FCI, revealing that more OC is recycled in the slope habitat.
4.4 Fate of OC in the source-to-sink system
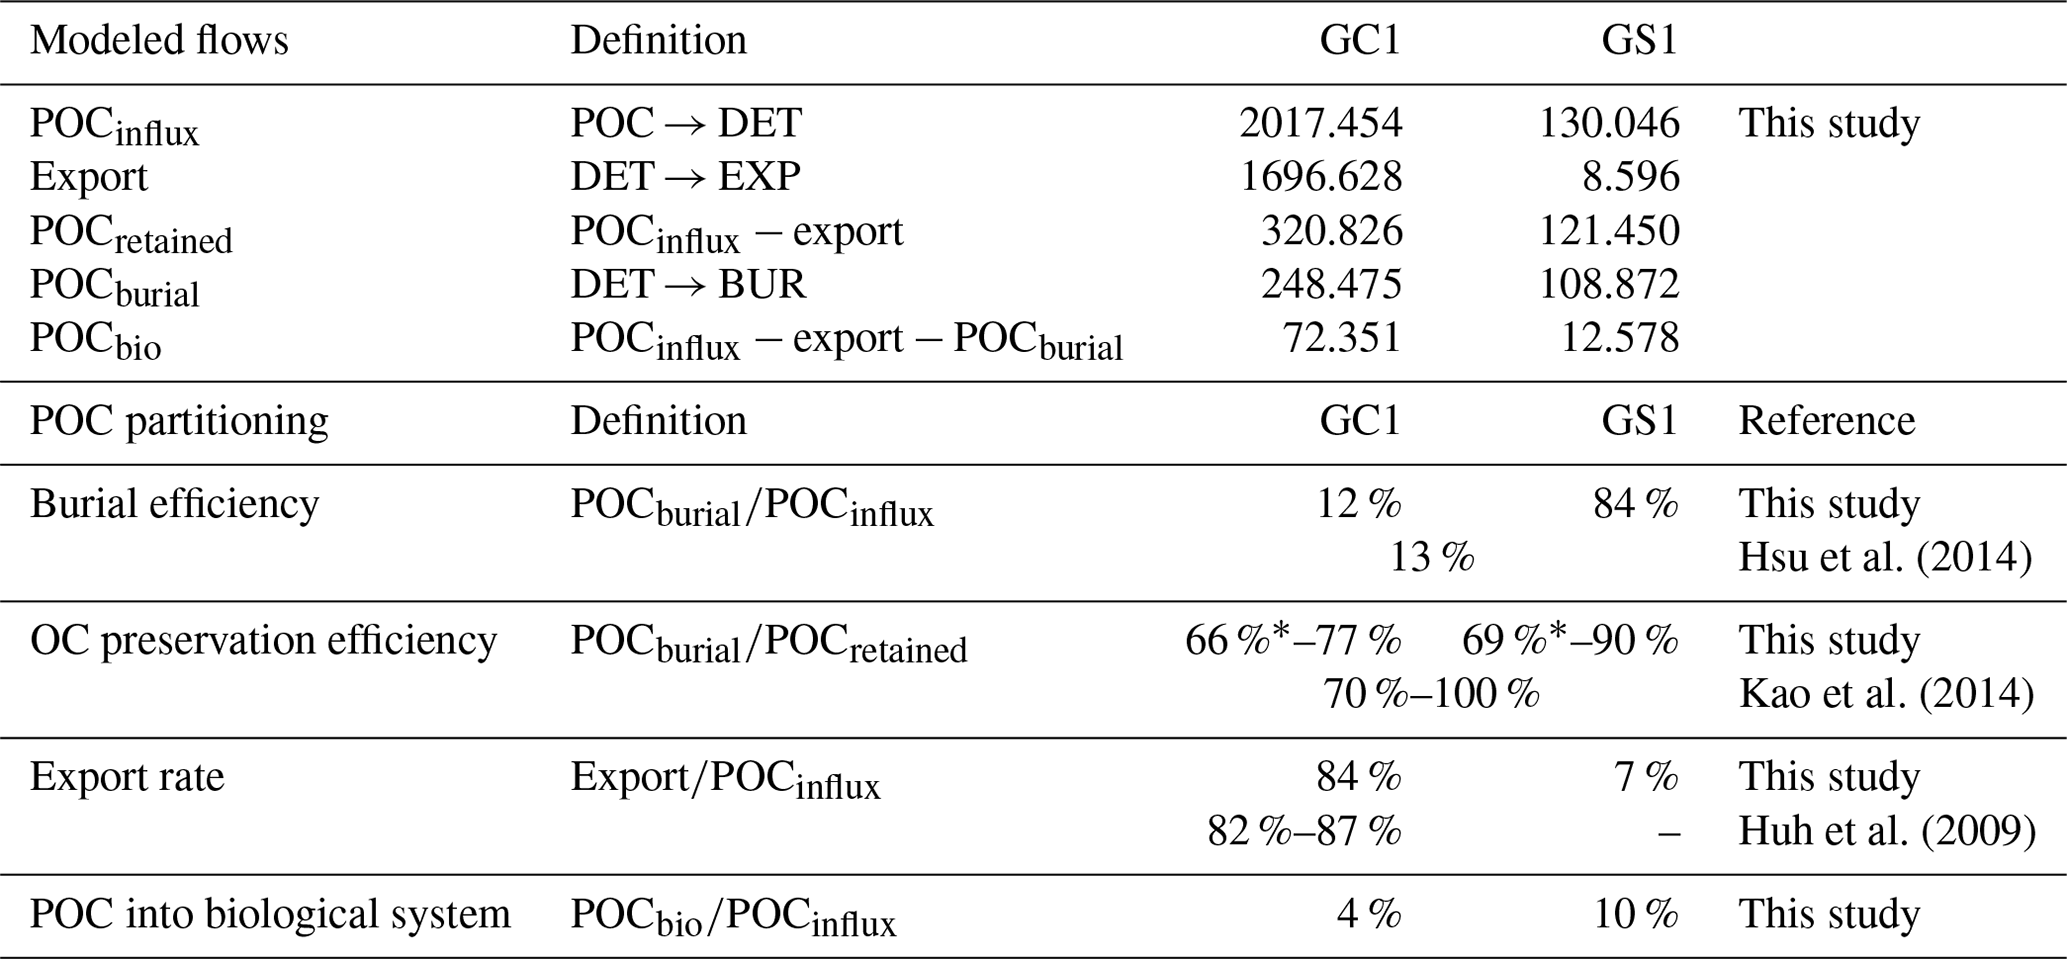
The fate of OC in source-to-sink systems is a topic of everlasting interest and discussion within the biogeoscience community. From the perspective of system budget, earlier studies estimated a burial efficiency, defined as the proportion of buried flux relative to riverine POC load, of 11 %–13 % in the Gaoping shelf–slope–canyon system (Hsu et al., 2014; Hung et al., 2012). Our model-based burial efficiency of 12 % in the GC1 model (Table A8) is consistent with these estimates, but the GS1 model yields a much higher value (84 %). This mismatch can be attributed to earlier studies not distinguishing the canyon from the slope in their estimates. Given the distinct hydrodynamic conditions within the canyon and on the slope (Liu et al., 2002, 2016), our site-specific estimates adequately capture the heterogeneous nature of burial efficiency at this active margin.
Other studies approached the issue by comparing OC's isotopic and elemental composition in buried sediments to those of riverine POC (e.g., Galy et al., 2007). This approach concluded that due to frequent hyperpycnal flows and rapid deposition on the narrow continental margin, OC in SMR-fed continental margin sediment typically exhibits high fidelity to riverine POC, ranging from 70 %–85 % (Blair and Aller, 2012). The GPR-sustained margin, a typical SMR-sustained carbon source-to-sink system, has a similar feature: Kao et al. (2014) found that the OC fidelity was ∼ 100 % in the GPSC sediment but dropped to ∼ 70 % on the slope sediment. In our model, OC fidelity can be approximated as the proportion of buried flux relative to the flux of OC initially retained on the seabed (Table A8). Our modeling results show that the fidelity is 77 % in GC1 and 90 % in GS1, which agrees with the geochemistry-based approach by Kao et al. (2014). Nevertheless, our result should be viewed as an overestimate of the fidelity because of the underestimated modeled BMU (Table 3). If the unaccounted TOU (i.e., the difference between observed and modeled TOU) were added to the OC flux retained on the seabed, the fidelity would drop to 66 % in GC1 and 69 % in GS1 (Table A8).
The extraordinary OC export rate in the canyon head may be attributed to sediment resuspension or lateral transports due to strong internal tide energy, as observed by Liu et al. (2006, 2009). Considering that the estimated OC export rate in the canyon head is almost 8 times greater than on the adjacent upper slope (Table A8), our finding suggests that while the GPSC may be a short-term sink within a season, it functions primarily as a conduit for sediment transport to deep ocean basins in the long run (Liu et al., 2006; Huh et al., 2009; Yu et al., 2009; Kao et al., 2010; Chiou et al., 2011). By contrast, sediment deposition across the upper GS is influenced by the “filling-and-spilling” process (Hsu et al., 2013), with competition between local basin flank uplift and sediment deposition rates leading to higher accumulation rates.
As the cycling and sequestration of OC in seafloor sediments are crucial in deep-sea ecosystems (Dunne et al., 2007; Thurber et al., 2014), understanding the fate of POC is essential. Our study investigates the amount of OC entering the biological system, which was not previously determined through geochemical studies. Surprisingly, the energy supporting a highly disturbed canyon food web is disproportionately low (4 %, Table A8) compared to the significant influx of POC. In contrast, the adjacent slope receives approximately an equal amount of OC flux into its biological system, despite a significantly lower influx of POC. The strong physical disturbances in GC1 have negatively impacted the benthic community structure (Tung et al., 2023), resulting in meager meiofauna and macrofauna biomass and interaction flows. Nevertheless, the higher bacteria stocks and bacteria-related carbon flows could compensate for these deficiencies. Our models show the inner workings of carbon cycling on the seabed with the advantage of disentangling the OC entering the food web, contributing to long-term burial, and exiting the system.
Having reconstructed the sedimentary OC cycling during dry periods in both the canyon and slope, the reasonable next step involves developing models that establish connections to driving factors of the system, such as variations in river water flux or sediment load. These endeavors necessitate a collaborative approach, combining high-frequency data collection with more advanced model design techniques. The ultimate objective is to enhance our capacity to predict the response of benthic communities and OC cycling under the influence of climate change. This is especially pertinent given the anticipated increase in flooding intensity and frequency, which may lead to heightened disturbances in submarine canyons (Canals et al., 2006; Chao et al., 2016; Huang and Swain, 2022; Sequeiros et al., 2019).
This study provides the first quantitative analysis of carbon flows within the benthic food webs of GPSC and the adjacent slope. The amount of OC stocks differed significantly between the canyon and slope but not among sampling seasons. Nevertheless, there was no significant difference in oxygen utilization, including TOU, DOU, and BMU, between habitats or among the sampling seasons. Therefore, LIM food web models were applied to the average OC stocks during dry periods, assuming mass balance with geochemical and physiological constraints on energy flows, to gain insight into ecosystem functioning and food web characteristics. Using network indices, including total system throughput, energy recycling, and food web maturity, we found more OC flowing through the canyon head than the upper slope. Bacteria-related processes dominated the canyon head food web. In contrast, meiofauna and macrofauna contributed more to carbon processing on the adjacent slope, implying a relatively mature ecosystem and significantly higher energy cycling. Furthermore, the food web models accurately predict oxygen utilization, demonstrating a good match between modeled and observed oxygen utilization. The turnover time, calculated from the ratio between OC stocks and oxygen utilization, was much longer on the slope than in the canyon, corresponding to a higher degree of energy recycling indicated by network indices. The low faunal carbon stock in the canyon head suggests that it may be a fragile ecosystem under severe physical perturbation. Despite the high OC input, only 4 % of the OC enters the canyon food web, while the remaining OC either exits the system or buries in the sediment. This study confirms the significant role of GPSC in transporting OC to the deep South China Sea, contributing to our understanding of ecosystem functioning in the area and improving our knowledge of natural carbon transfer within the source-to-sink system.
Table A1Sampling cruises including dates, coordinates, and water depths of two sites. Different gears were used to collect sediment and benthic fauna samples. Cruises were assigned to the corresponding seasons to test the seasonal effect.
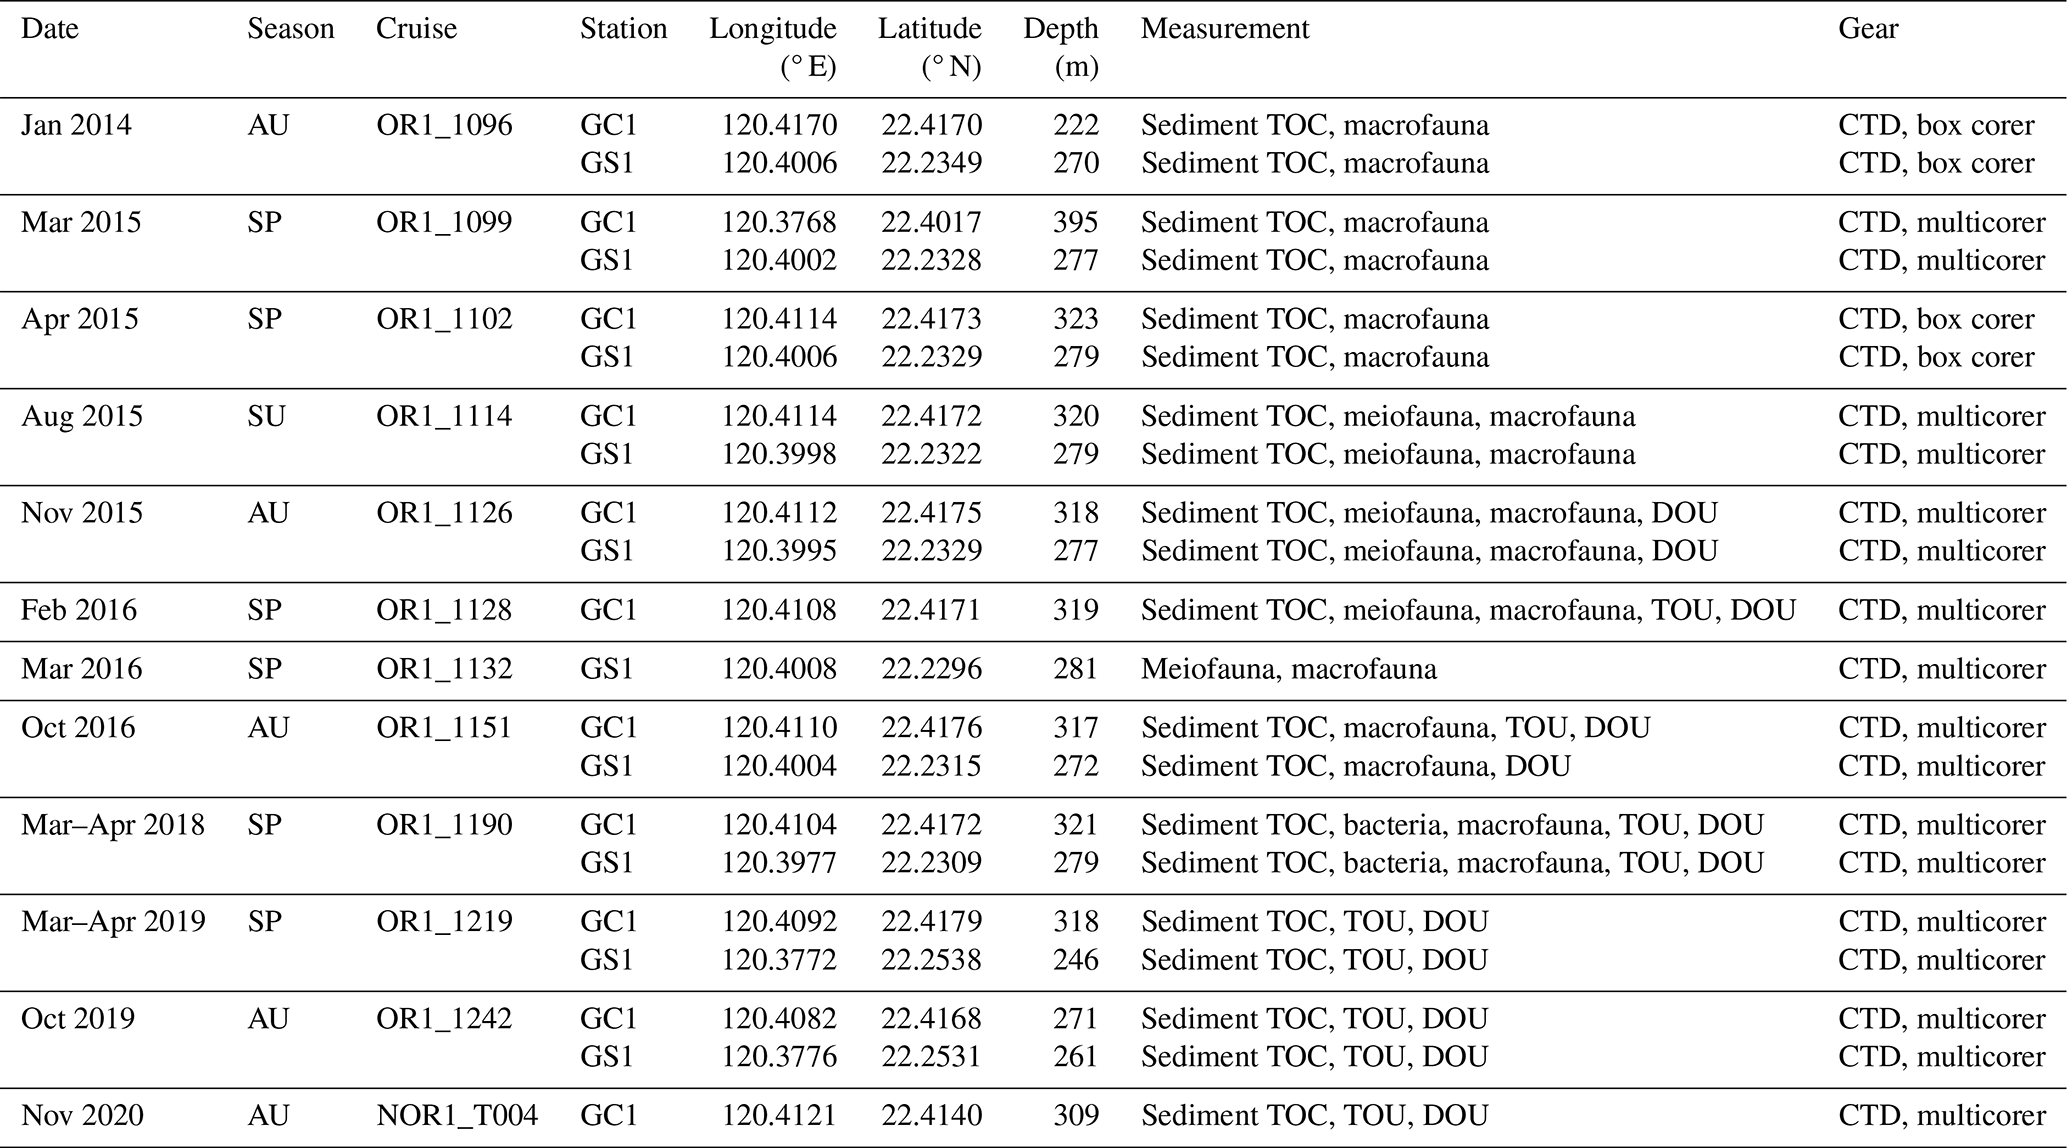
Table A2Reference of geochemical data and derivation of geochemical constraints in Table 1.
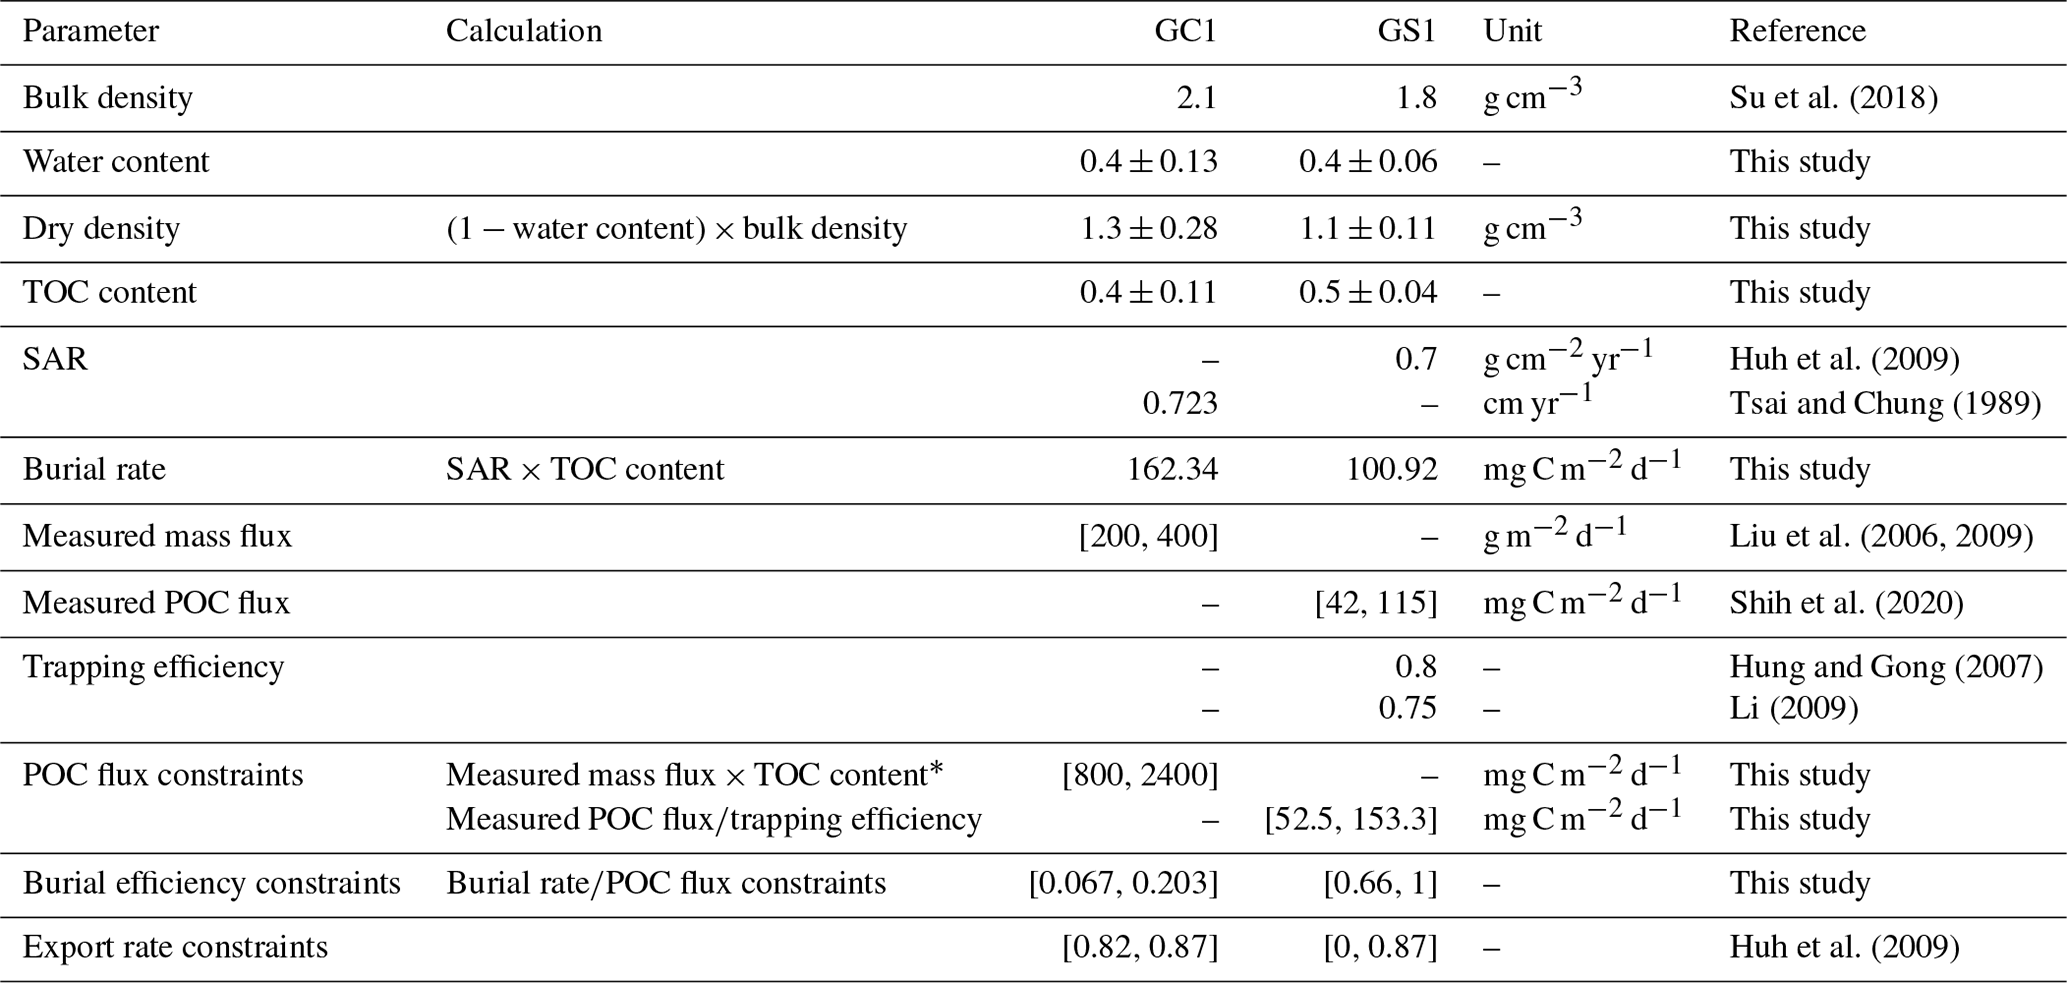
* Here TOC content was substituted with 0.4 %–0.6 % as reported in Liu et al. (2009).
Table A3Symbol nomenclature for the calculating network (Kones et al., 2009). Assuming a system comprises n compartments, the flow value Tij is defined as a sink-to-source flow (i.e., j→i) following the notation by Latham (2006). The compartments importing to the internal network are denoted by 0, the destination of usable exports (secondary production) is labeled as n+1, and the destination of unusable exports (respirationdissipation) is labeled as n+2 (Hirata and Ulanowicz, 1984).
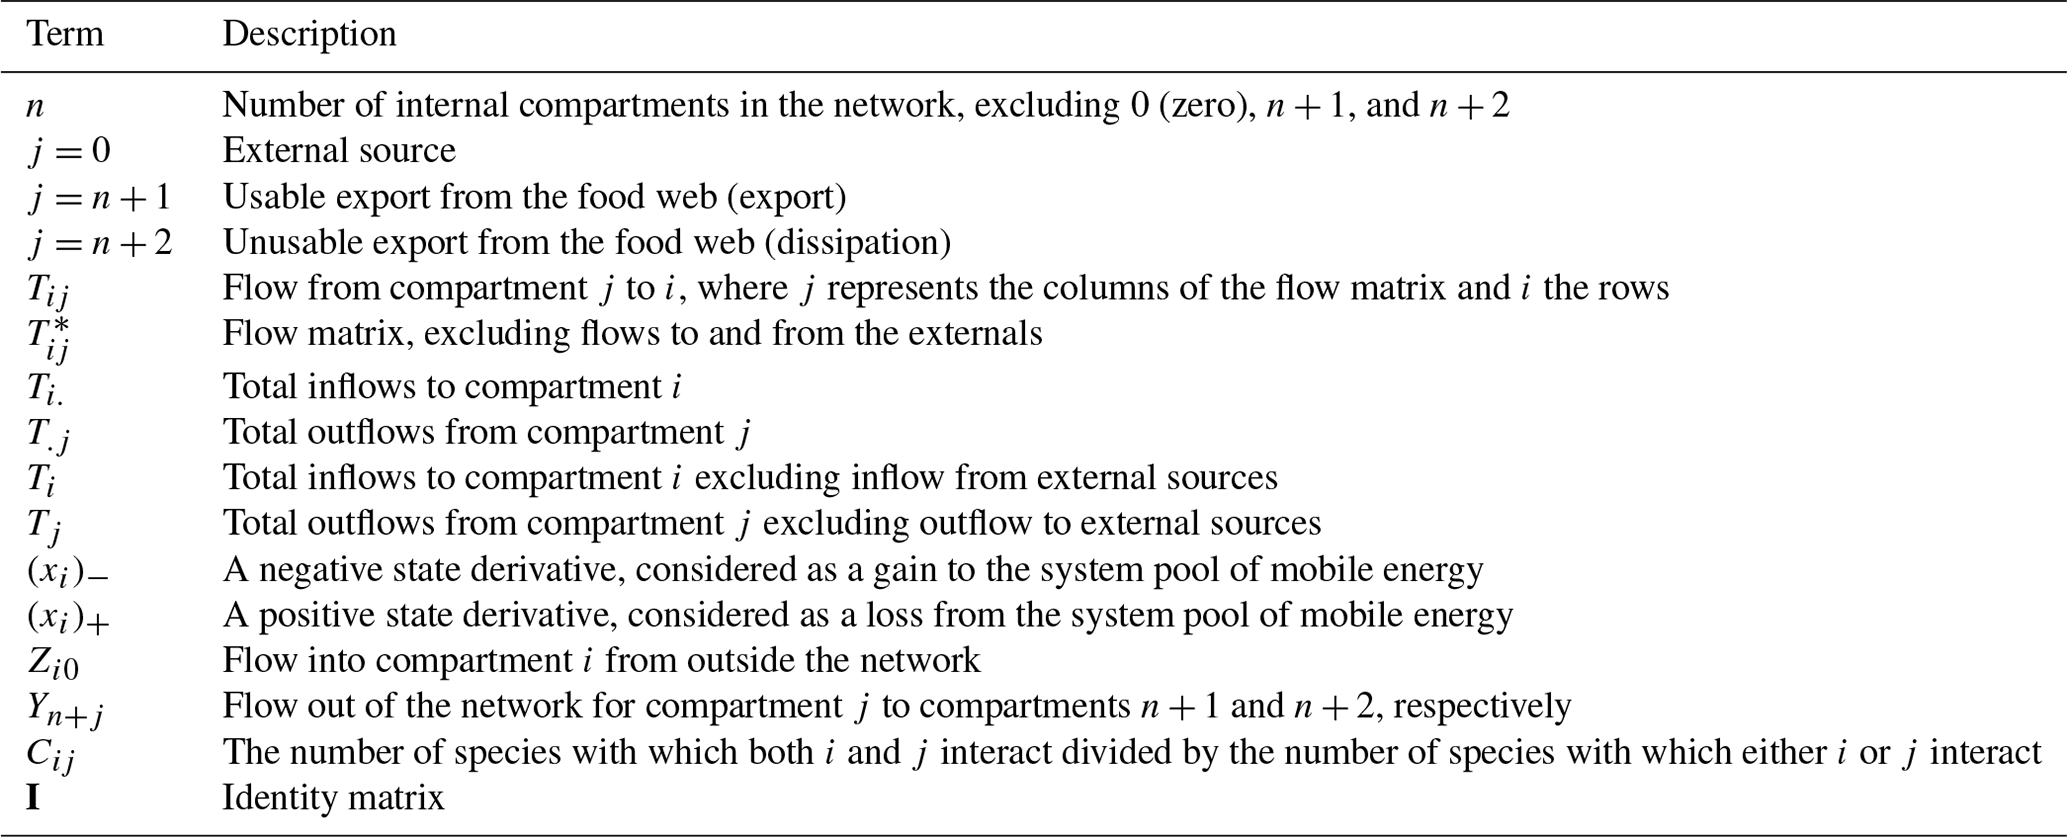
Table A4Formula of the network indices; see Table A3 for the symbols.
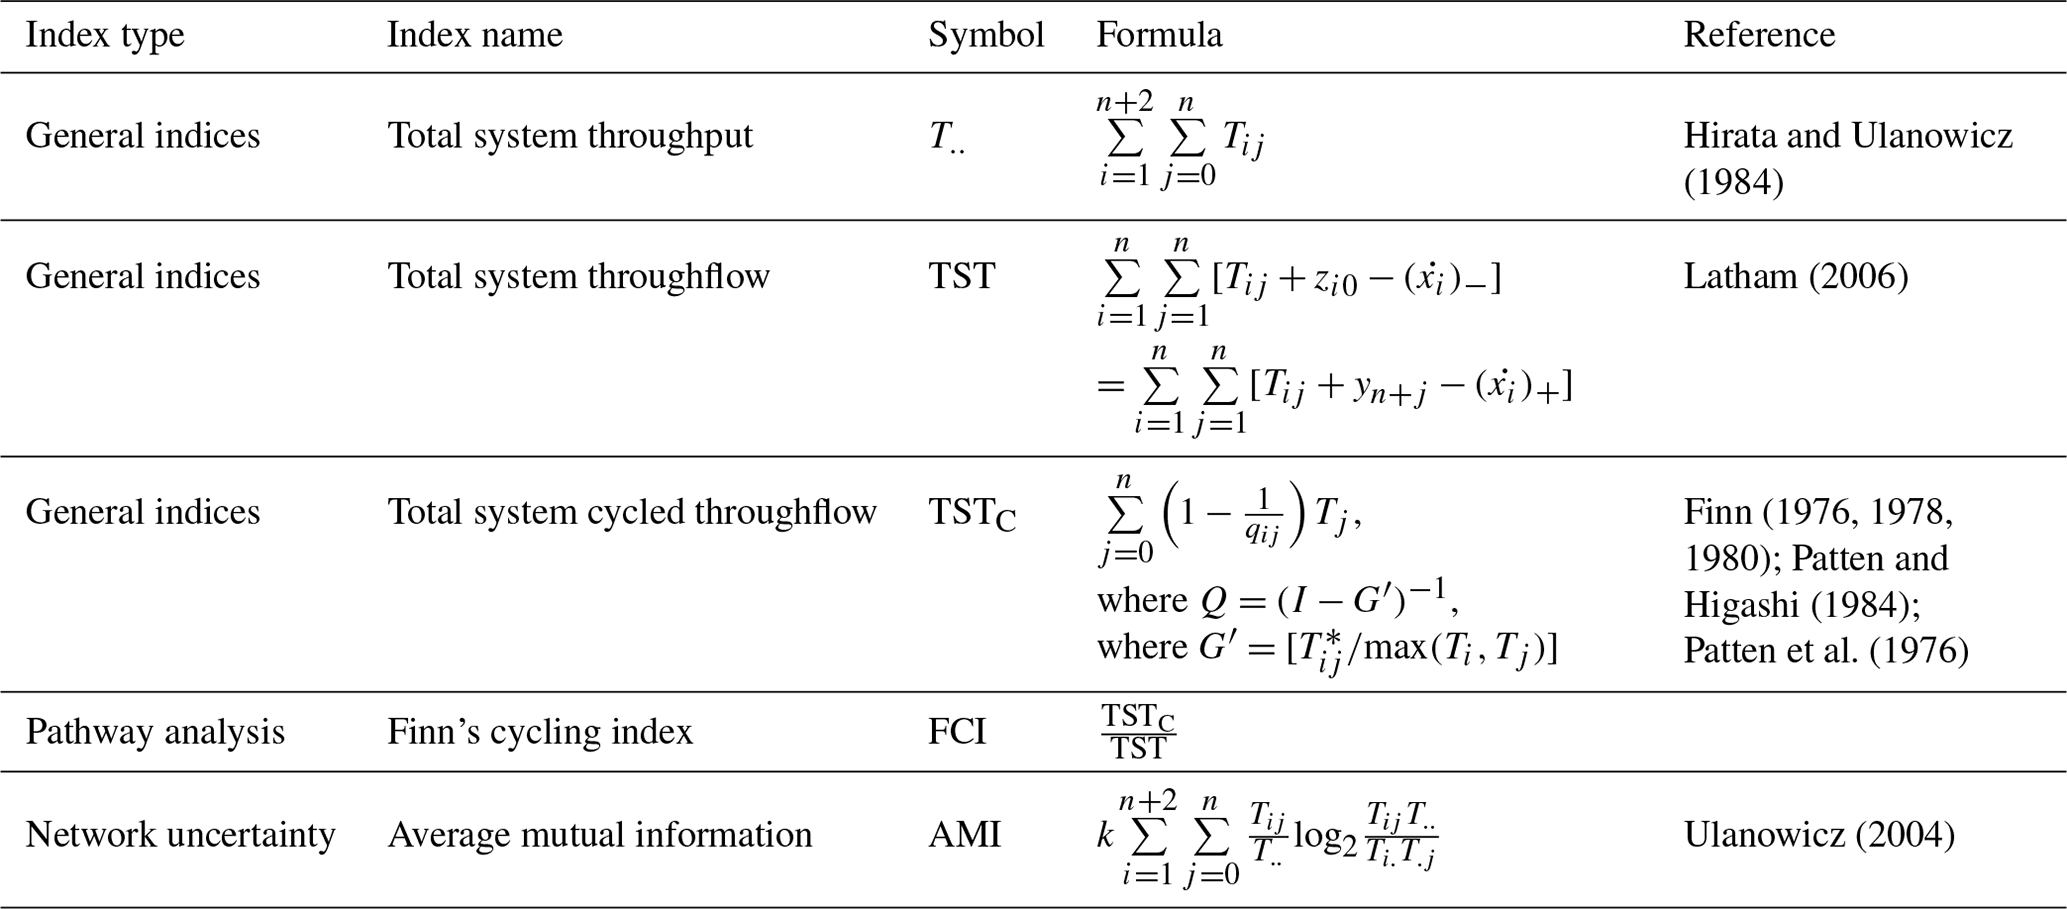
Table A5PERMDISP on carbon standing stocks and oxygen utilization of GC1 and GS1. The bold font indicates p<0.05.
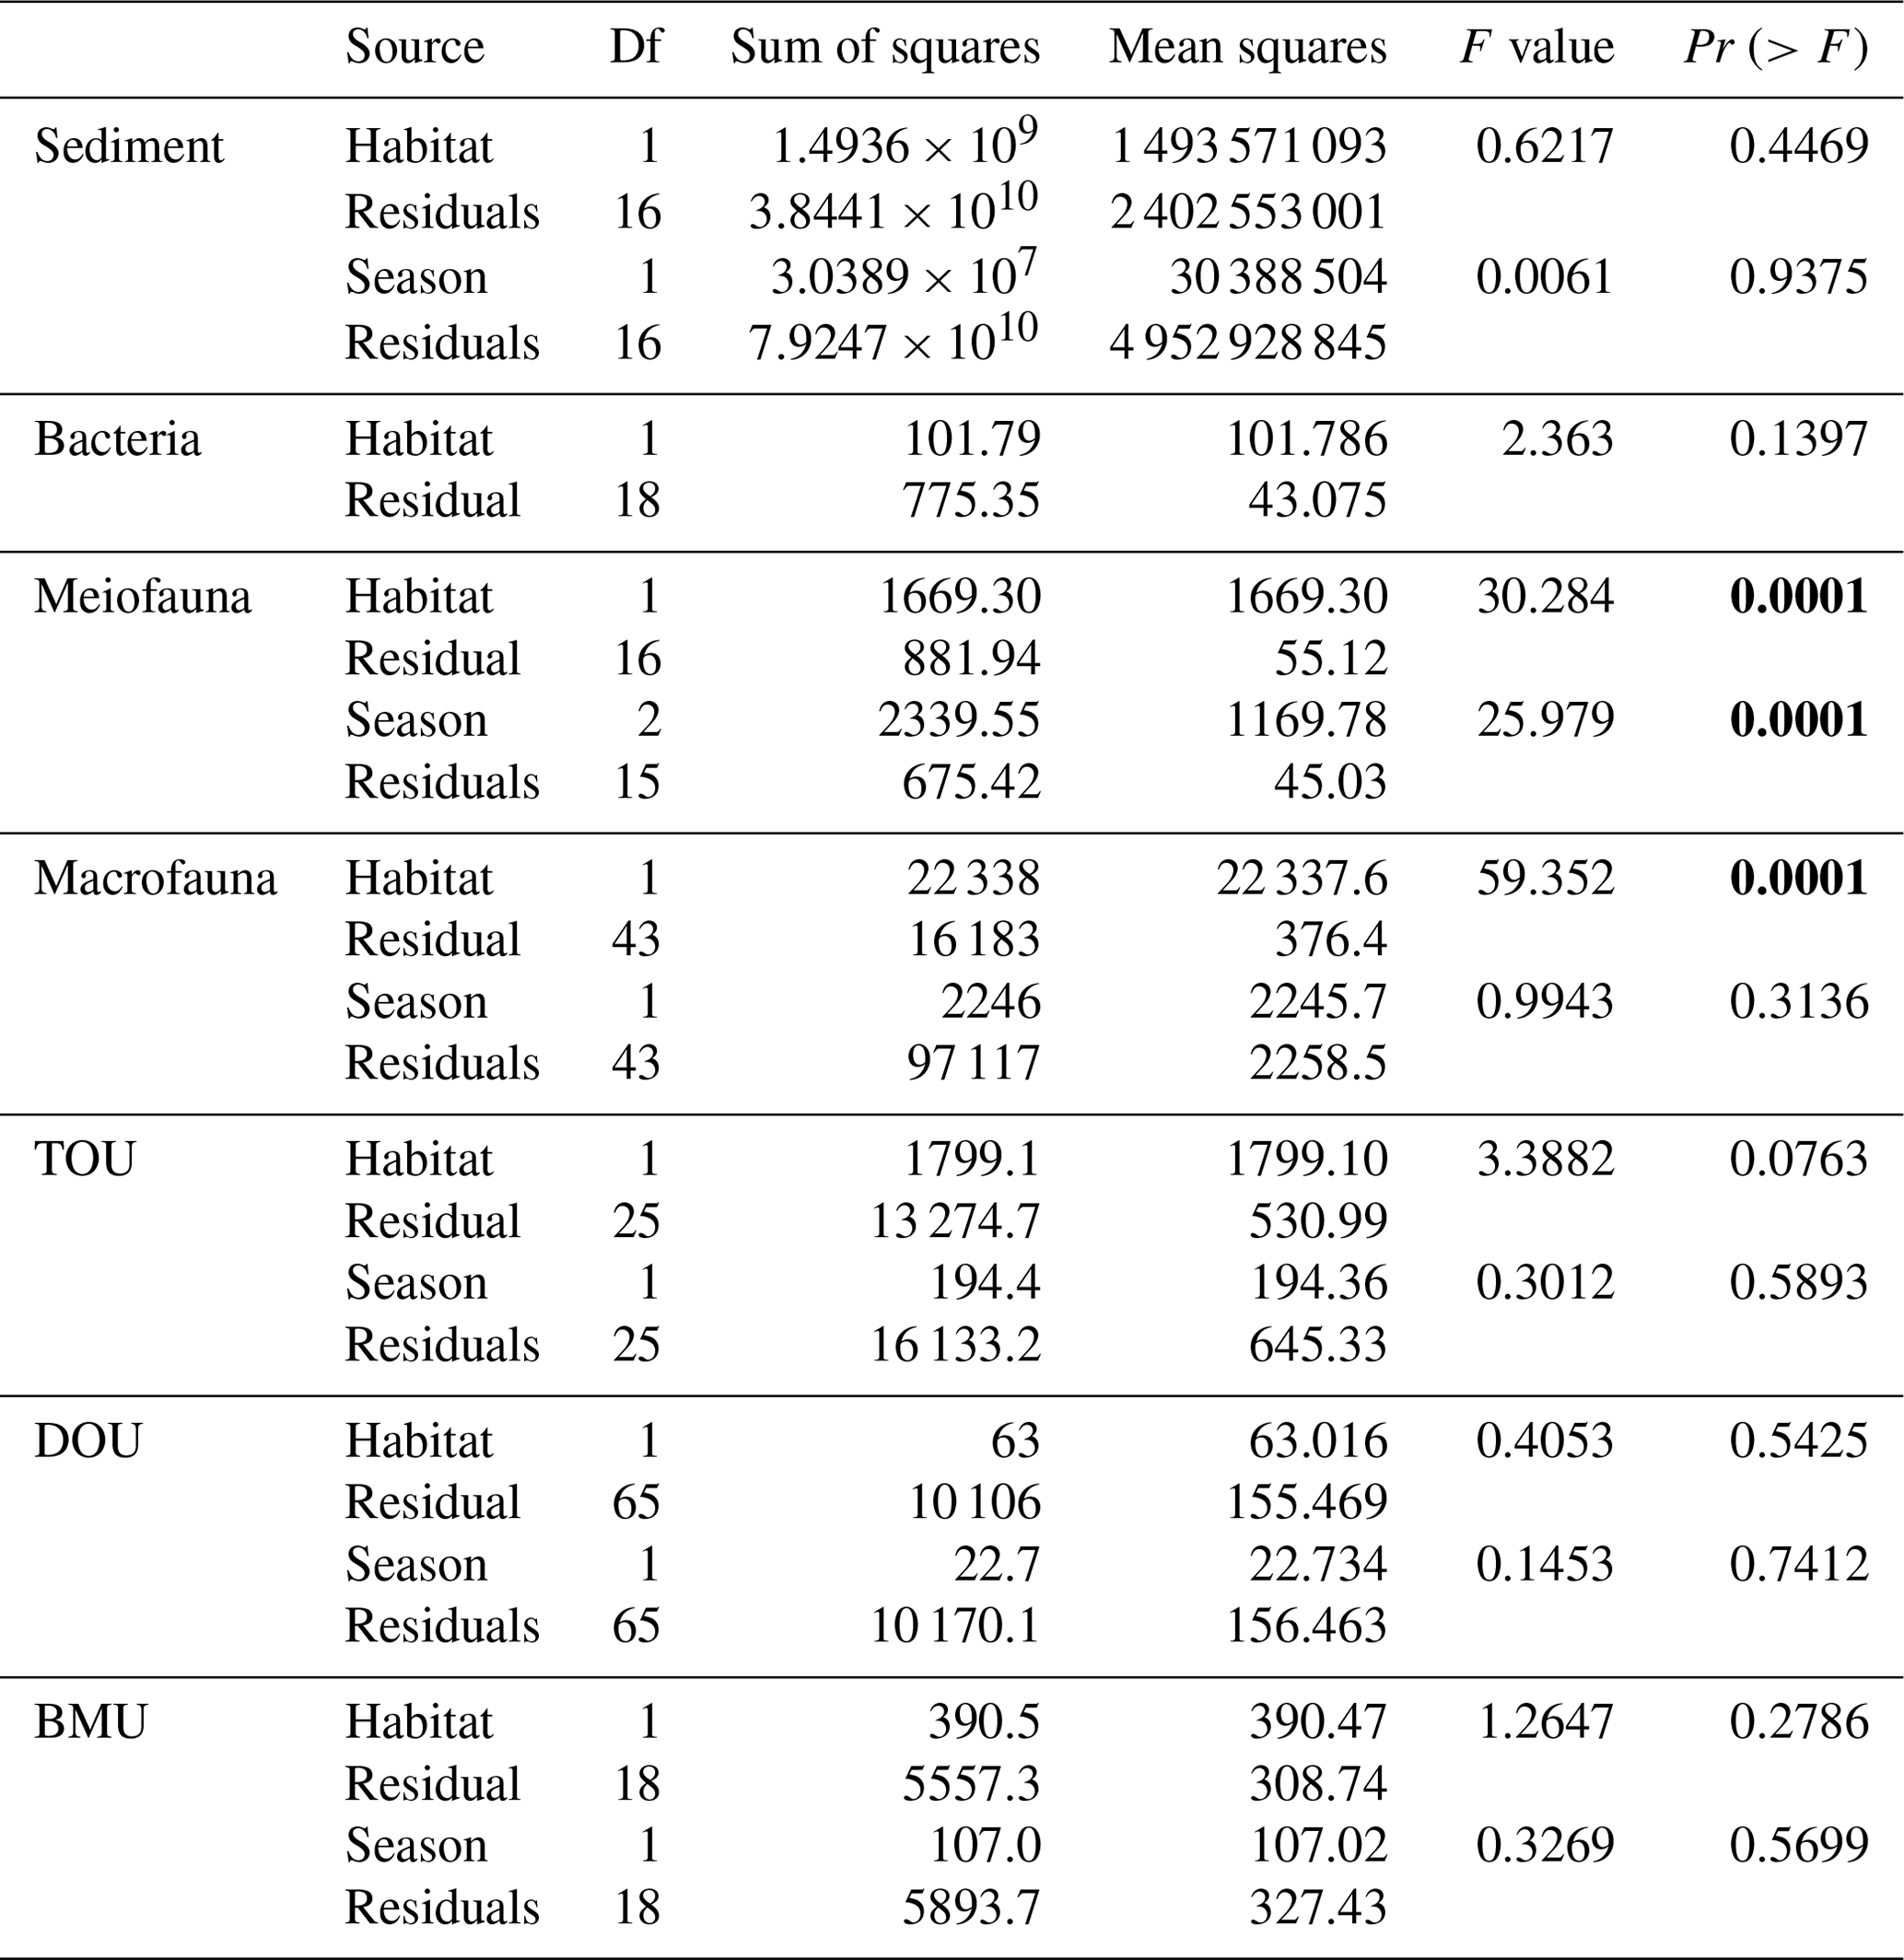
Table A6PERMANOVA on carbon standing stocks and oxygen utilization of GC1 and GS1. The bold font indicates p<0.05.
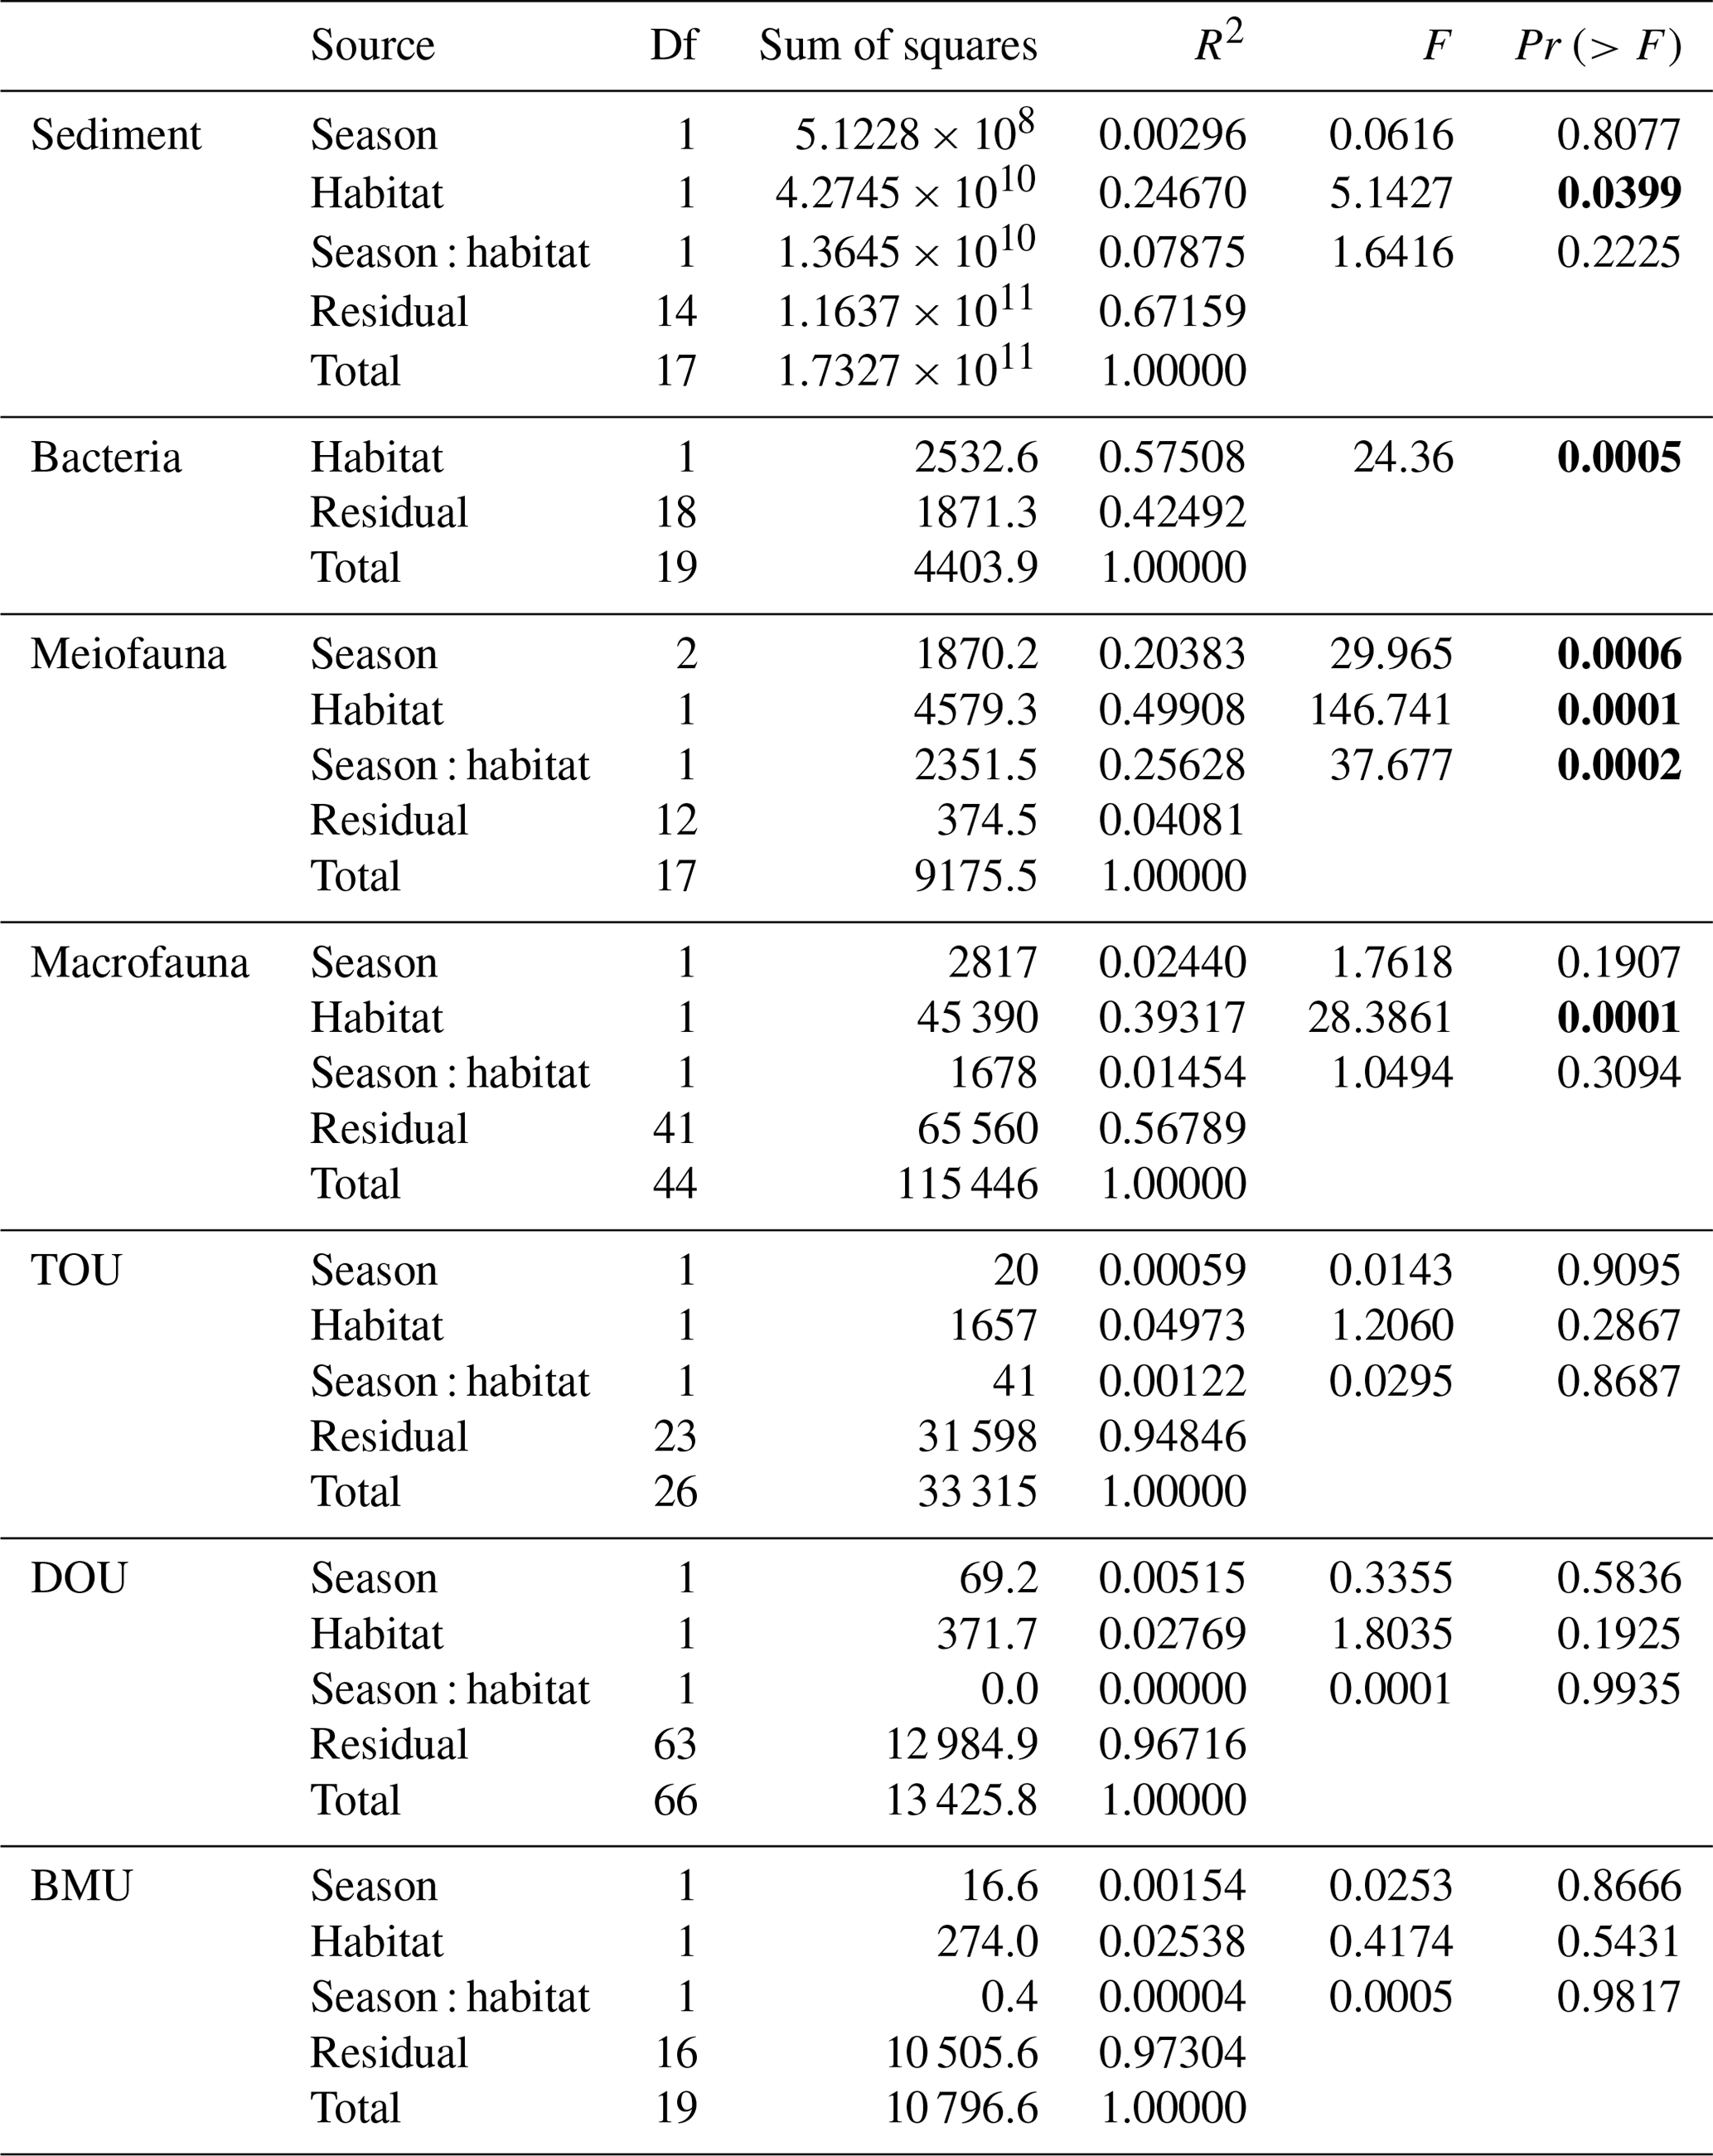
Table A7Mean and standard deviation of the food web flows (mg C m−2 d−1) of the GC1 and GS1 processed with the MCMC algorithm.
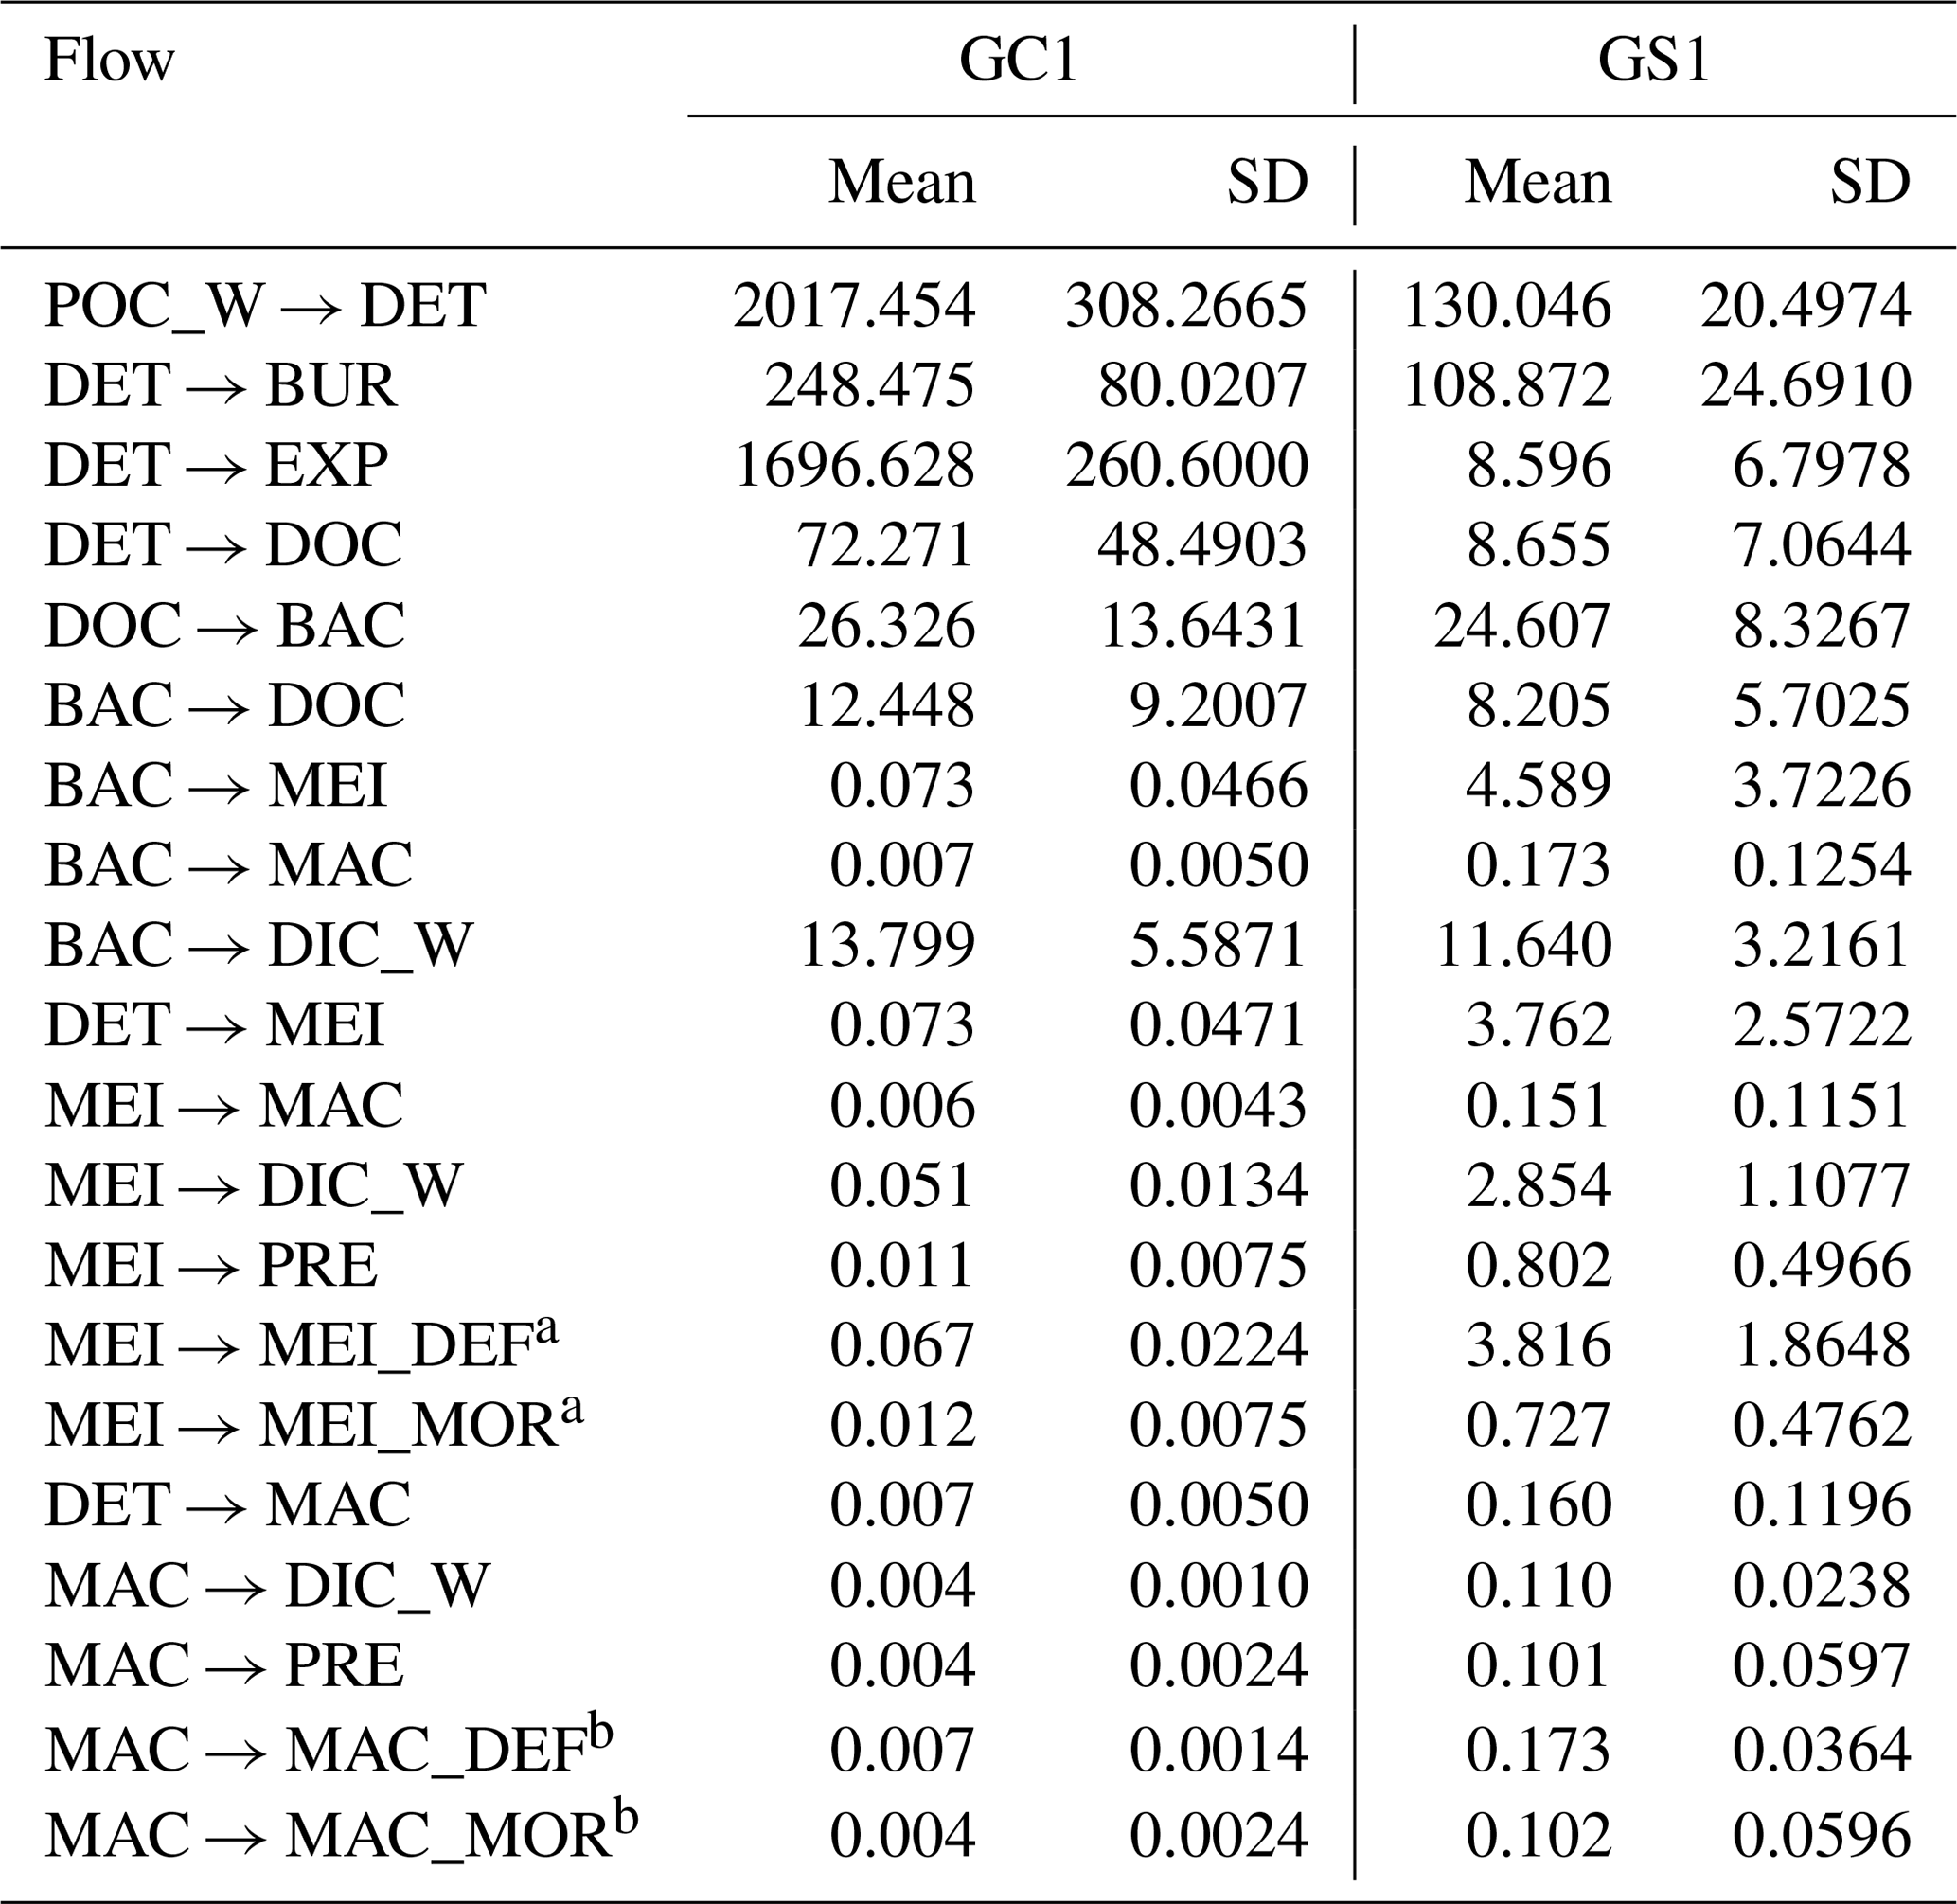
a MEI → MEI_DEF and MEI → MEI_MOR was combined into MEI → DET in Fig. B1. b MAC → MAC_DEF and MAC → MAC_MOR was combined into MAC → DET in Fig. B1.
Table A8Modeled carbon flows (mg C m−2 d−1) and comparison of POC partitioning.
* The difference between modeled TOU and measured TOU was added to POCretained, and a more conservative OC preservation efficiency was estimated.
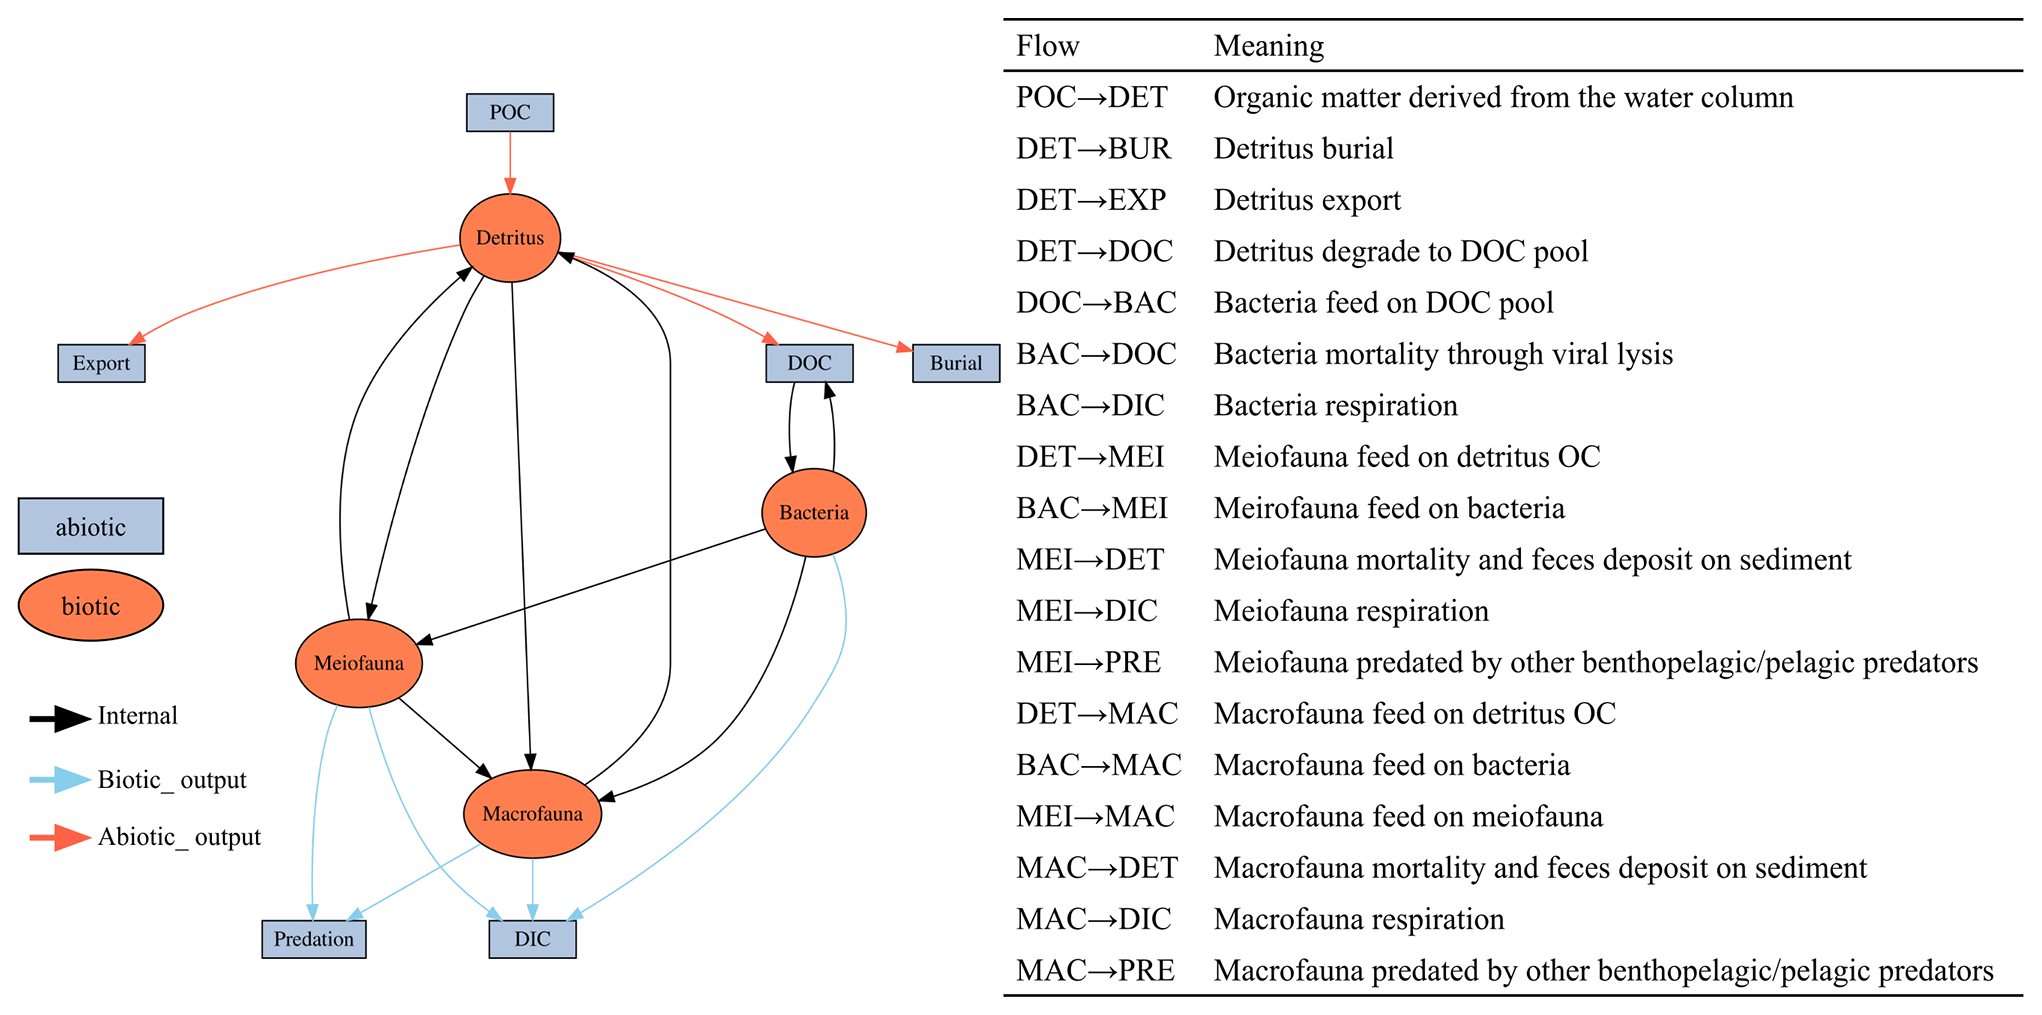
Figure B1The conceptual model of the food web structure formed the basis of our linear inverse model (LIM). The flows are with direction. For example, “SED → BAC” represents carbon flow from detritus to bacteria stock. See Sect. 2.3 (“Food web structure”) for further description.
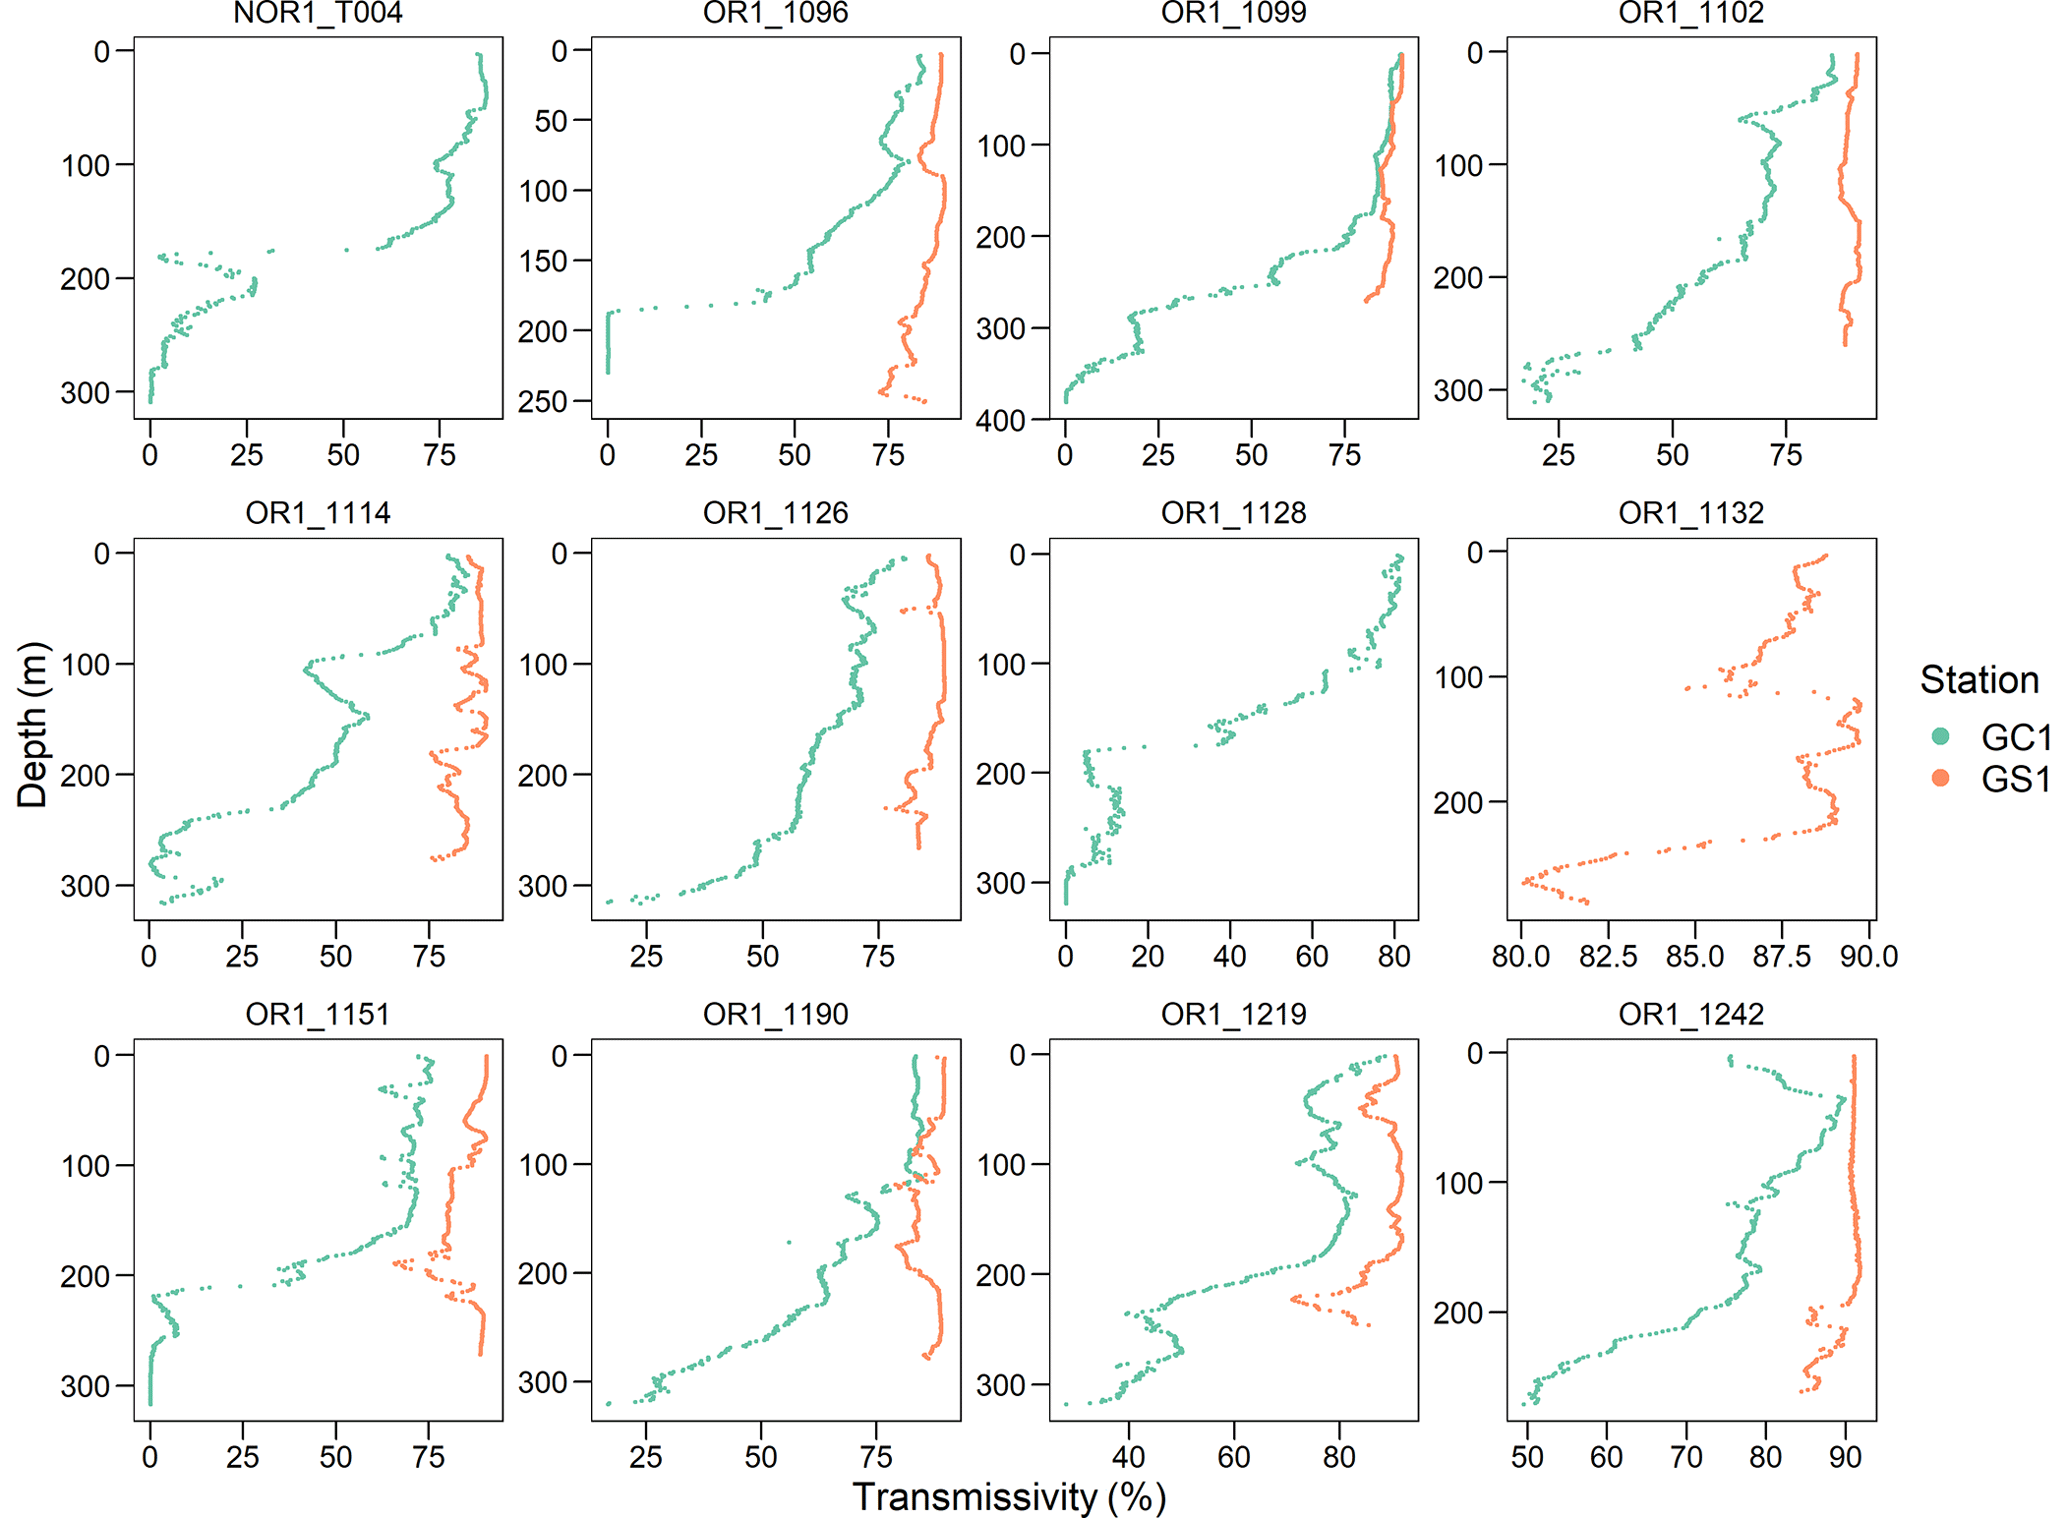
Figure B2Light transmission profile for each cruise of the two sites. Note that GC1 has a very low light transmission below 200 m depth in almost all the sampling cruises.
The datasets generated for this study can be found at https://doi.org/10.5281/zenodo.10912175 (Tung and Wei, 2024).
JTL and C-LW designed research; C-CT, Y-SL, J-XL, T-HT, and C-LW performed research; C-CT and C-LW analyzed data; and C-CT, Y-SL, J-XL, T-HT, JTL, L-HL, P-LW, and C-LW wrote the paper with intellectual contributions from all authors.
The contact author has declared that none of the authors has any competing interests.
Publisher’s note: Copernicus Publications remains neutral with regard to jurisdictional claims made in the text, published maps, institutional affiliations, or any other geographical representation in this paper. While Copernicus Publications makes every effort to include appropriate place names, the final responsibility lies with the authors.
We thank the Institute of Oceanography, National Taiwan University (NTU), and National Science and Technology Council (NSTC) for supporting the fieldwork, analysis, and manuscript preparation. We also thank the captain, crew members, and technicians of the RV Ocean Researcher 1 and RV New Ocean Researcher 1, as well as the graduate students who participated in the OCEAN 7090 Field Work in Marine Biology. This project is part of Fate of Terrestrial/Non-terrestrial Sediments in High Yield Particle-Export River-sea Systems (FATES-HYPERS), sponsored by NSTC.
This research has been supported by the National Science and Technology Council (grant no. 112-2611-M-002-011).
This paper was edited by Andrew Thurber and reviewed by two anonymous referees.
Aller, R. C.: The effects of macrobenthos on chemical properties of marine sediment and overlying water, in: Animal-sediment relations, Vol. 100, 53–102, Springer, Boston, MA, https://doi.org/10.1007/978-1-4757-1317-6_2, 1982.
Aller, R. C.: Bioturbation and remineralization of sedimentary organic matter: effects of redox oscillation, Chem. Geol., 114, 331–345, https://doi.org/10.1016/0009-2541(94)90062-0, 1994.
Alongi, D. M.: Bacterial productivity and microbial biomass in tropical mangrove sediments, Microb. Ecol., 15, 59–79, https://doi.org/10.1007/BF02012952, 1988.
Amaro, T., Witte, H., Herndl, G. J., Cunha, M. R., and Billett, D. S.: Deep-sea bacterial communities in sediments and guts of deposit-feeding holothurians in Portuguese canyons (NE Atlantic), Deep-Sea Res. Pt. I, 56, 1834–1843, https://doi.org/10.1016/j.dsr.2009.05.014, 2009.
Anh, P. V., Everaert, G., Goethals, P., Vinh, C. T., and De Laender, F.: Production and food web efficiency decrease as fishing activity increases in a coastal ecosystem, Estuar. Coast. Shelf S., 165, 226–236, https://doi.org/10.1016/j.ecss.2015.05.019, 2015.
Baguley, J. G., Hyde, L. J., and Montagna, P. A.: A semi-automated digital microphotographic approach to measure meiofaunal biomass, Limnol. Oceanogr.-Meth., 2, 181–190, https://doi.org/10.4319/lom.2004.2.181, 2004.
Banse, K. and Mosher, S.: Adult body mass and annual production/biomass relationships of field populations, Ecol. Monogr., 50, 355–379, https://doi.org/10.2307/2937256, 1980.
Berg, P., Risgaard-Petersen, N., and Rysgaard, S.: Interpretation of measured concentration profiles in sediment pore water, Limnol. Oceanogr., 43, 1500–1510, https://doi.org/10.4319/lo.1998.43.7.1500, 1998.
Bernhardt, A. and Schwanghart, W.: Where and why do submarine canyons remain connected to the shore during sea-level rise? Insights from global topographic analysis and Bayesian regression, Geophs. Res. Lett., 48, e2020GL092234, https://doi.org/10.1029/2020GL092234, 2021.
Blair, N. E. and Aller, R. C.: The fate of terrestrial organic carbon in the marine environment, Annu. Rev. Mar. Sci., 4, 401–423, https://doi.org/10.1146/annurev-marine-120709-142717, 2012.
Bodini, A.: Building a systemic environmental monitoring and indicators for sustainability: What has the ecological network approach to offer?, Ecol. Indic., 15, 140–148, https://doi.org/10.1016/j.ecolind.2011.09.032, 2012.
Canals, M., Puig, P., de Madron, X. D., Heussner, S., Palanques, A., and Fabres, J.: Flushing submarine canyons, Nature, 444, 354–357, https://doi.org/10.1038/nature05271, 2006.
Chao, Y.-C., Li, H.-C., Liou, J.-J., and Chen, Y.-M.: Extreme bed changes in the Gaoping River under climate change, Terr. Atmos. Ocean Sci., 27, 717–727, https://doi.org/10.3319/TAO.2016.06.30.03, 2016.
Chiang, C.-S. and Yu, H.-S.: Controls of Submarine Canyons Connected to Shore during the LGM Sea-Level Rise: Examples from Taiwan, J. Mar. Sci. Eng., 10, 494, https://doi.org/10.3390/jmse10040494, 2022.
Chiang, C.-S., Hsiung, K.-H., Yu, H.-S., and Chen, S.-C.: Three types of modern submarine canyons on the tectonically active continental margin offshore southwestern Taiwan, Mar. Geophys. Res., 41, 1–17, https://doi.org/10.1007/s11001-020-09403-z, 2020.
Chiou, M.-D., Jan, S., Wang, J., Lien, R.-C., and Chien, H.: Sources of baroclinic tidal energy in the Gaoping Submarine Canyon off southwestern Taiwan. J. Geophys. Res.-Oceans., 116, C12016, https://doi.org/10.1029/2011JC007366, 2011
Clausen, I. B. and Riisgård, H. U.: Growth, filtration and respiration in the mussel Mytilus edulis: no evidence for physiological regulation of the filter-pump to nutritional needs, Mar. Ecol.-Prog. Ser., 141, 37–45, https://doi.org/10.3354/meps141037, 1996.
Conover, R. J.: Assimilation of organic matter by zooplankton 1, Limnol. Oceanogr., 11, 338–345, https://doi.org/10.4319/lo.1966.11.3.0338, 1966.
Covault, J. A., Normark, W. R., Romans, B. W., and Graham, S. A.: Highstand fans in the California borderland: The overlooked deep-water depositional systems, Geology, 35, 783–786, https://doi.org/10.1130/G23800A.1, 2007.
Danovaro, R. (Ed.): Methods for the study of deep-sea sediments, their functioning and biodiversity, CRC press, https://doi.org/10.1201/9781439811382, 2009.
Danovaro, R., Marrale, D., Dell'Anno, A., Della Croce, N., Tselepides, A., and Fabiano, M.: Bacterial response to seasonal changes in labile organic matter composition on the continental shelf and bathyal sediments of the Cretan Sea, Prog. Oceanogr., 46, 345–366, https://doi.org/10.1016/S0079-6611(00)00025-2, 2000.
Danovaro, R., Dell'Anno, A., Corinaldesi, C., Magagnini, M., Noble, R., Tamburini, C., and Weinbauer, M.: Major viral impact on the functioning of benthic deep-sea ecosystems, Nature, 454, 1084–1087, https://doi.org/10.1038/nature07268, 2008.
Dauwe, B. P. H. J., Herman, P. M. J., and Heip, C. H. R.: Community structure and bioturbation potential of macrofauna at four North Sea stations with contrasting food supply, Mar. Ecol.-Prog. Ser., 173, 67–83, https://doi.org/10.3354/meps173067, 1998.
De Jonge, D. S., Stratmann, T., Lins, L., Vanreusel, A., Purser, A., Marcon, Y., Rodrigues, C. F., Ravara, A., Esquete, P., Cunha, M. R., Simon-Lledó, E., van Breugel, P., Sweetman, A. K., Soetaert, K., and van Oevelen, D.: Abyssal food-web model indicates faunal carbon flow recovery and impaired microbial loop 26 years after a sediment disturbance experiment, Prog. Oceanogr., 189, 102446, https://doi.org/10.1016/j.pocean.2020.102446, 2020.
De Leo, F. C., Smith, C. R., Rowden, A. A., Bowden, D. A., and Clark, M. R.: Submarine canyons: hotspots of benthic biomass and productivity in the deep sea, P. Roy. Soc. B-Biol. Sci., 277, 2783–2792, https://doi.org/10.1098/rspb.2010.0462, 2010.
De Smet, B., van Oevelen, D., Vincx, M., Vanaverbeke, J., and Soetaert, K.: Lanice conchilega structures carbon flows in soft-bottom intertidal areas, Mar. Ecol.-Prog. Ser., 552, 47–60, https://doi.org/10.3354/meps11747, 2016.
Del Giorgio, P. A. and Cole, J. J.: Bacterial growth efficiency in natural aquatic systems, Annu. Rev. Ecol. Syst., 29, 503–541, https://doi.org/10.1146/annurev.ecolsys.29.1.503, 1998.
Deming, J. W. and Carpenter, S. D.: Factors influencing benthic bacterial abundance, biomass, and activity on the northern continental margin and deep basin of the Gulf of Mexico, Deep-Sea Res. Pt. II, 55, 2597–2606, https://doi.org/10.1016/j.dsr2.2008.07.009, 2008.
Drazen, J. C., Reisenbichler, K. R., and Robison, B. H.: A comparison of absorption and assimilation efficiencies between four species of shallow-and deep-living fishes, Mar. Biol., 151, 1551–1558, https://doi.org/10.1007/s00227-006-0596-6, 2007.
Dunlop, K. M., van Oevelen, D., Ruhl, H. A., Huffard, C. L., Kuhnz, L. A., and Smith Jr., K. L.: Carbon cycling in the deep eastern North Pacific benthic food web: Investigating the effect of organic carbon input, Limnol. Oceanogr., 61, 1956–1968, https://doi.org/10.1002/lno.10345, 2016.
Dunne, J. P., Sarmiento, J. L., and Gnanadesikan, A.: A synthesis of global particle export from the surface ocean and cycling through the ocean interior and on the seafloor, Global Biogeochem. Cy., 21, GB4006, https://doi.org/10.1029/2006GB002907, 2007.
Durden, J. M., Bett, B. J., Huffard, C. L., Pebody, C., Ruhl, H. A., and Smith Jr., K. L.: Response of deep-sea deposit-feeders to detrital inputs: A comparison of two abyssal time-series sites, Deep-Sea Res. Pt. II, 173, 104677, https://doi.org/10.1016/j.dsr2.2019.104677, 2020.
Epping, E., van der Zee, C., Soetaert, K., and Helder, W.: On the oxidation and burial of organic carbon in sediments of the Iberian margin and Nazaré Canyon (NE Atlantic), Prog. Oceanogr., 52, 399–431, https://doi.org/10.1016/S0079-6611(02)00017-4, 2002.
Fauchald, K. and Jumars, P. A.: The diet of worms: a study of polychaete feeding guilds, Oceanogr. Mar. Biol., 17, 193–284, https://doi.org/10.5179/benthos1970.1981.65, 1979.
Fenchel, T.: Ecology of Heterotrophic Microflagellates, Bioenergetics and Growth, Mar. Ecol.-Prog. Ser., 8, 225–231, https://doi.org/10.3354/meps008225, 1982.
Finn, J. T.: Measures of ecosystem structure and function derived from analysis of flows, J. Theor. Biol., 56, 363–380, https://doi.org/10.1016/S0022-5193(76)80080-X, 1976.
Finn, J. T.: Cycling index: a general definition for cycling in compartmental models, in: Environmental Chemistry and Cycling Processes, edited by: Adriano, D. C. and Brisbin, I. L., DOE Proceedings 45, Conf. 760429, National Technical Information Service, Springfield, VA, 138–165, 1978.
Finn, J. T: Flow analysis of models of the Hubbard Brook ecosystem, Ecology, 61, 562–571, https://doi.org/10.2307/1937422, 1980.
Fleeger, J. W. and Palmer, M. A.: Secondary Production of the Estuarine, Meiobenthic Copepod Microarthridion littorale, Mar. Ecol.-Prog. Ser., 7, 157–162, https://doi.org/10.3354/meps007157, 1982.
Fodrie, F. J., Levin, L. A., and Rathburn, A. E.: High densities and depth-associated changes of epibenthic megafauna along the Aleutian margin from 2000–4200 m, J. Mar. Biol. Assoc. UK, 89, 1517–1527, https://doi.org/10.1017/S0025315409000903, 2009.
Forster, S. and Graf, G.: Impact of irrigation on oxygen flux into the sediment: intermittent pumping by Callianassa subterranea and “piston-pumping” by Lanice conchilega, Mar. Biol., 123, 335–346, https://doi.org/10.1007/BF00353625, 1995.
Galy, V., France-Lanord, C., Beyssac, O., Faure, P., Kudrass, H., and Palhol, F.: Efficient organic carbon burial in the Bengal fan sustained by the Himalayan erosional system, Nature, 450, 407–410, https://doi.org/10.1038/nature06273, 2007.
Garcia, R., Koho, K. A., De Stigter, H. C., Epping, E., Koning, E., and Thomsen, L.: Distribution of meiobenthos in the Nazaré canyon and adjacent slope (western Iberian Margin) in relation to sedimentary composition, Mar. Ecol.-Prog. Ser., 340, 207–220, https://doi.org/10.3354/meps340207, 2007.
Gavey, R., Carter, L., Liu, J. T., Talling, P. J., Hsu, R., Pope, E., and Evans, G.: Frequent sediment density flows during 2006 to 2015, triggered by competing seismic and weather events: Observations from subsea cable breaks off southern Taiwan, Mar. Geol., 384, 147–158, https://doi.org/10.1016/j.margeo.2016.06.001, 2017.
Glud, R. N.: Oxygen dynamics of marine sediments, Mar. Biol. Res., 4, 243–289, https://doi.org/10.1080/17451000801888726, 2008.
Glud, R. N., Gundersen, J. K., Røy, H., and Jørgensen, B. B.: Seasonal dynamics of benthic O2 uptake in a semienclosed bay: Importance of diffusion and faunal activity, Limnol. Oceanogr., 48, 1265–1276, https://doi.org/10.4319/lo.2003.48.3.1265, 2003.
Graf, G. and Rosenberg, R.: Bioresuspension and biodeposition: a review, J. Marine Syst., 11, 269–278, https://doi.org/10.1016/S0924-7963(96)00126-1, 1997.
Harris, P. T. and Wihteway, T.: Global distribution of large submarine canyons: geomorphic differences between active and passive continental margins, Mar. Geol., 285, 68–86, https://doi.org/10.1016/j.margeo.2011.05.008, 2011.
Hecker, B.: Unusual megafaunal assemblages on the continental slope off Cape Hatteras, Deep-Sea Res. Pt. II, 41, 809–834, https://doi.org/10.1016/0967-0645(94)90050-7, 1994.
Hedges, J. I. and Keil, R. G.: Sedimentary organic matter preservation: an assessment and speculative synthesis, Mar. Chem., 49, 81–115, https://doi.org/10.1016/0304-4203(95)00008-F, 1995.
Hendriks, A. J.: Allometric scaling of rate, age and density parameters in ecological models, Oikos, 86, 293–310, https://doi.org/10.2307/3546447, 1999.
Herman, P. M. and Heip, C.: Secondary production of the harpacticoid copepod Paronychocamptus nanus in a brackish-water habitat, Limnol. Oceanogr., 30, 1060–1066, https://doi.org/10.4319/lo.1985.30.5.1060, 1985.
Herman, P. M. J., Heip, C., and Vranken, G.: The production of Cyprideis torosa Jones 1850 (Crustacea, Ostracoda), Oecologia, 58, 326–331, https://doi.org/10.1007/BF00385231, 1983.
Herman, P. M. J., Heip, C., and Guillemijn, B.: Production of Tachidius discipes (Copepoda: Harpacticoida), Mar. Ecol.-Prog. Ser., 17, 271–278, https://doi.org/10.3354/meps017271, 1984.
Hessler, R. R. and Jumars, P. A.: Abyssal community analysis from replicate box cores in the central North Pacific, Deep-Sea Res. Oceanogr. Abstr., 21, 185–209, https://doi.org/10.1016/0011-7471(74)90058-8, 1974.
Hirata, H. and Ulanowicz, R. E.: Informational theoretical analysis of ecological networks, Am. Nat., 133, 288–302, https://doi.org/10.1080/00207728408926559, 1984.
Hsu, F. H., Su, C. C., Wang, C. H., Lin, S., Liu, J., and Huh, C. A.: Accumulation of terrestrial organic carbon on an active continental margin offshore southwestern Taiwan: Source-to-sink pathways of river-borne organic particles, J. Asian Earth. Sci., 91, 163–173, https://doi.org/10.1016/j.jseaes.2014.05.006, 2014.
Hsu, H. H., Liu, C. S., Yu, H. S., Chang, J. H., and Chen, S. C.: Sediment dispersal and accumulation in tectonic accommodation across the Gaoping Slope, offshore Southwestern Taiwan, J. Asian. Earth. Sci., 69, 26–38, https://doi.org/10.1016/j.jseaes.2013.01.012, 2013.
Huang, X. and Swain, D. L.: Climate change is increasing the risk of a California megaflood, Sci. Adv., 8, eabq0995, https://doi.org/10.1126/sciadv.abq0995, 2022.
Huffard, C. L., Durkin, C. A., Wilson, S. E., McGill, P. R., Henthorn, R., and Smith Jr., K. L.: Temporally-resolved mechanisms of deep-ocean particle flux and impact on the seafloor carbon cycle in the northeast Pacific, Deep-Sea Res. Pt. II, 173, 104763, https://doi.org/10.1016/j.dsr2.2020.104763, 2020.
Huh, C.-A., Lin, H.-L., Lin, S., and Huang, Y.-W.: Modern accumulation rates and a budget of sediment off the Gaoping (Kaoping) River, SW Taiwan: a tidal and flood dominated depositional environment around a submarine canyon, J. Marine Syst., 76, 405–416, https://doi.org/10.1016/j.jmarsys.2007.07.009, 2009.
Hung, C.-C. and Gong, G.-C.: Export flux of POC in the main stream of the Kuroshio, Geophys Res. Lett., 34, L18606, https://doi.org/10.1029/2007GL030236, 2007.
Ikehara, K., Usami, K., and Kanamatsu, T.: Repeated occurrence of surface-sediment remobilization along the landward slope of the Japan Trench by great earthquakes, Earth Planets Space., 72, 1–9, https://doi.org/10.1186/s40623-020-01241-y, 2020.
Ingels, J., Kiriakoulakis, K., Wolff, G. A., and Vanreusel, A.: Nematode diversity and its relation to the quantity and quality of sedimentary organic matter in the deep Nazaré Canyon, Western Iberian Margin, Deep-Sea Res. Pt. I, 56, 1521–1539, https://doi.org/10.1016/j.dsr.2009.04.010, 2009.
Jahnke, R. A.: The global ocean flux of particulate organic carbon: Areal distribution and magnitude, Global Biogeochem. Cy., 10, 71–88, https://doi.org/10.1029/95GB03525, 1996.
Jan, S., Lien, R.-C., and Ting, C.-H.: Numerical study of baroclinic tides in Luzon Strait, J. Oceanogr., 64, 789–802, https://doi.org/10.1007/s10872-008-0066-5, 2008.
Jørgensen, B. B., Glud, R. N., and Holby, O.: Oxygen distribution and bioirrigation in Arctic fjord sediments (Svalbard, Barents Sea), Mar. Ecol.-Prog. Ser., 292, 85–95, https://doi.org/10.3354/meps292085, 2005.
Jørgensen, B. B., Wenzhöfer, F., Egger, M., and Glud, R. N.: Sediment oxygen consumption: Role in the global marine carbon cycle, Earth-Sci. Rev., 228, 103987, https://doi.org/10.1016/j.earscirev.2022.103987, 2022.
Kallmeyer, J., Smith, D. C., Spivack, A. J., and D'Hondt, S.: New cell extraction procedure applied to deep subsurface sediments, Limnol. Oceanogr.-Meth., 6, 236–245, https://doi.org/10.4319/lom.2008.6.236, 2008.
Kao, S.-J., Shiah, F.-K., Wang, C.-H., and Liu, K.-K.: Efficient trapping of organic carbon in sediments on the continental margin with high fluvial sediment input off southwestern Taiwan, Cont. Shelf Res., 26, 2520–2537, https://doi.org/10.1016/j.csr.2006.07.030, 2006.
Kao, S.-J., Dai, M., Selvaraj, K., Zhai, W., Cai, P., Chen, S.-N., Yang, J.-Y. T., Liu, J. T., Liu, C.-C., and Syvitski, J. P. M.: Cyclone-driven deep sea injection of freshwater and heat by hyperpycnal flow in the subtropics, Geophys. Res. Lett., 37, L21702, https://doi.org/10.1029/2010GL044893, 2010.
Kao, S.-J., Hilton, R. G., Selvaraj, K., Dai, M., Zehetner, F., Huang, J.-C., Hsu, S.-C., Sparkes, R., Liu, J. T., Lee, T.-Y., Yang, J.-Y. T., Galy, A., Xu, X., and Hovius, N.: Preservation of terrestrial organic carbon in marine sediments offshore Taiwan: mountain building and atmospheric carbon dioxide sequestration, Earth Surf. Dynam., 2, 127–139, https://doi.org/10.5194/esurf-2-127-2014, 2014.
Kones, J. K., Soetaert, K., van Oevelen, D., Owino, J. O., and Mavuti, K.: Gaining insight into food webs reconstructed by the inverse method, J. Marine Syst., 60, 153–166, https://doi.org/10.1016/j.jmarsys.2005.12.002, 2006.
Kones, J. K., Soetaert, K., van Oevelen, D., and Owino, J. O.: Are network indices robust indicators of food web functioning? A Monte Carlo approach, Ecol. Model., 220, 370–382, https://doi.org/10.1016/j.ecolmodel.2008.10.012, 2009.
Koopmans, M., Martens, D., and Wijffels, R. H.: Growth efficiency and carbon balance for the sponge Haliclona oculate, Mar. Biotechnol., 12, 340–349, https://doi.org/10.1007/s10126-009-9228-8, 2010.
Latham, L. G. and Scully, E. P.: Quantifying constraint to assess development in ecological networks, Ecol. Model., 154, 25–44, https://doi.org/10.1016/S0304-3800(02)00032-7, 2002.
Latham, L. G.: Network flow analysis algorithms, Ecol. Model., 192, 586–600, https://doi.org/10.1016/j.ecolmodel.2005.07.029, 2006.
Lee, I.-H., Lien, R.-C., Liu, J. T., and Chuang, W.-S.: Turbulent mixing and internal tides in Gaoping (Kaoping) submarine canyon, Taiwan, J. Marine Syst., 76, 383–396, https://doi.org/10.1016/j.jmarsys.2007.08.005, 2009a.
Lee, I.-H., Wang, Y.-H., Liu, J. T., Chuang, W.-S., and Xu, J.-P.: Internal Tidal Currents in the Gaoping (Kaoping) Submarine Canyon, J. Marine Syst., 76, 397–404, https://doi.org/10.1016/j.jmarsys.2007.12.011, 2009b.
Li, S. L.: Particulate organic carbon flux in the upwelling region off northeastern Taiwan, master's thesis, National Taiwan Ocean University, Taiwan, 55 pp., https://hdl.handle.net/11296/6hkk9h (last access: 4 April 2024), 2009.
Liao, J.-X., Chen, G.-M., Chiou, M.-D., Jan, S., and Wei, C.-L.: Internal tides affect benthic community structure in an energetic submarine canyon off SW Taiwan, Deep-Sea Res. Pt. I, 125, 147–160, https://doi.org/10.1016/j.dsr.2017.05.014, 2017.
Liao, J.-X., Wei, C.-L., and Yasuhara, M.: Species and Functional Diversity of Deep-Sea Nematodes in a High Energy Submarine Canyon, Front. Mar. Sci., 7, 591, https://doi.org/10.3389/fmars.2020.00591, 2020.
Lichtschlag, A., Donis, D., Janssen, F., Jessen, G. L., Holtappels, M., Wenzhöfer, F., Mazlumyan, S., Sergeeva, N., Waldmann, C., and Boetius, A.: Effects of fluctuating hypoxia on benthic oxygen consumption in the Black Sea (Crimean shelf), Biogeosciences, 12, 5075–5092, https://doi.org/10.5194/bg-12-5075-2015, 2015.
Lincoln, R. J.: British marine amphipoda: Gammaridea, Natural History Museum Publications, United Kingdom, ISBN 1904690483, 1979.
Liu, J. T. and Lin, H.-L.: Sediment dynamics in a submarine canyon: a case of river-sea interaction, Mar. Geol., 207, 55–81, https://doi.org/10.1016/j.margeo.2004.03.015, 2004.
Liu, J. T., Liu, K.-J., and Huang, J.-C.: The effect of a submarine canyon on the river sediment dispersal and inner shelf sediment movements in southern Taiwan, Mar. Geol., 181, 357–386, https://doi.org/10.1016/S0025-3227(01)00219-5, 2002.
Liu, J. T., Lin, H.-L., and Hung, J.-J.: A submarine canyon conduit under typhoon conditions off Southern Taiwan, Deep-Sea Res. Pt. I, 53, 223–240, https://doi.org/10.1016/j.dsr.2005.09.012, 2006.
Liu, J. T., Hung, J. -J., and Huang, Y.-W.: Partition of suspended and riverbed sediments related to the salt-wedge in the lower reaches of a small mountainous river, Mar. Geol., 264, 152–164, https://doi.org/10.1016/j.margeo.2009.05.005, 2009.
Liu, J. T., Wang, Y.-H., Lee, I.-H., and Hsu, R.-T.: Quantifying tidal signatures of the benthic nepheloid layer in Gaoping Submarine Canyon in Southern Taiwan, Mar. Geol., 271, 119–130, https://doi.org/10.1016/j.margeo.2010.01.016, 2010.
Liu, J. T., Kao, S.-J., Huh, C.-A., and Hung, C.-C.: Gravity flows associated with flood events and carbon burial: Taiwan as instructional source area, Annu. Rev. Mar. Sci., 5, 47–68, https://doi.org/10.1146/annurev-marine-121211-172307, 2013.
Liu, J. T., Hsu, R.-T., Hung, J.-J., Chang, Y.-P., Wang, Y.-H., Rendle-Bühring, R. H., Lee, C.-L., Huh, C.-A., and Yang, R.-J.: From the highest to the deepest: The Gaoping River–Gaoping Submarine Canyon dispersal system, Earth-Sci. Rev., 153, 274–300, https://doi.org/10.1016/j.earscirev.2015.10.012, 2016.
Loo, L. O. and Rosenberg, R.: Production and energy budget in marine suspension feeding populations: Mytilus edulis, Cerastoderma edule, Mya arenaria and Amphiura filiformis, J. Sea Res., 35, 199–207, https://doi.org/10.1016/S0077-7579(96)90020-4, 1996.
Mahaut, M. L., Sibuet, M., and Shirayama, Y.: Weight-dependent respiration rates in deep-sea organisms, Deep-Sea Res. Pt. I, 42, 1575–1582, https://doi.org/10.1016/0967-0637(95)00070-M, 1995.
Meade, R. H. and Moody, J. A.: Causes for the decline of suspended-sediment discharge in the Mississippi River system, 1940–2007, Hydrol. Process., 24, 35–49, https://doi.org/10.1002/hyp.7477, 2010.
Meyer-Reil, L. A.: Benthic response to sedimentation events during autumn to spring at a shallow water station in the Western Kiel Bight, Mar. Biol., 77, 247–256, https://doi.org/10.1007/BF00395813, 1983.
Middelburg, J. J. and Meysman, F. J.: Burial at sea, Science, 316, 1294–1295, https://doi.org/10.1126/science.1144001, 2007.
Middelburg, J. J., Vlug, T., Jaco, F., and Van der Nat, W. A.: Organic matter mineralization in marine systems, Global Planet. Change, 8, 47–58, https://doi.org/10.1016/0921-8181(93)90062-S, 1993.
Montagna, P. A., Baguley, J. G., Hsiang, C. Y., and Reuscher, M. G.: Comparison of sampling methods for deep-sea infauna, Limnol. Oceanogr.-Meth., 15, 166–183, https://doi.org/10.1002/lom3.10150, 2017.
Mukherjee, J., Karan, S., Chakrabarty, M., Banerjee, A., Rakshit, N., and Ray, S.: An approach towards quantification of ecosystem trophic status and health through ecological network analysis applied in Hooghly–Matla estuarine system, India, Ecol. Indic., 100, 55–68, https://doi.org/10.1016/j.ecolind.2018.08.025, 2019.
Mulder, T., Weber, O., Anschutz, P., Jorissen, F., and Jouanneau, J. M.: A few months-old storm-generated turbidite deposited in the Capbreton Canyon (Bay of Biscay, SW France), Geo-Mar. Lett., 21, 149–156, https://doi.org/10.1007/s003670100077, 2001.
Navarro, E., Iglesias, J. I. P., Ortega, M. M., and Larretxea, X.: The basis for a functional response to variable food quantity and quality in cockles Cerastoderma edule (Bivalvia, Cardiidae), Physiol. Zool., 67, 468–496, https://doi.org/10.1086/physzool.67.2.30163859, 1994.
Nielsen, A. M., Eriksen, N. T., Iversen, J. L., and Riisgård, H. U.: Feeding, growth and respiration in the polychaetes Nereis diversicolor (facultative filter-feeder) and N. virens (omnivorous) – a comparative study, Mar. Ecol.-Prog. Ser., 125, 149–158, https://doi.org/10.3354/meps125149, 1995.
Nittrouer, C. A. and Wright, L. D.: Transport of particles across continental shelves, Rev. Geophy., 32, 85–113, https://doi.org/10.1029/93RG02603, 1994.
Odum, E. P.: The Strategy of Ecosystem Development: An understanding of ecological succession provides a basis for resolving man's conflict with nature, Science, 164, 262–270, https://doi.org/10.1126/science.164.3877.262, 1969.
Oksanen, J., Simpson, G. L., Blanchet, F. G., Kindt, R., Legendre, P., Minchin, P. R., O'Hara, R. B., Solymos, P., Stevens, M. H. H., Szoecs, E., Wagner, H., Barbour, M., Bedward, M., Bolker B., Borcard, D., Carvalho, G., Chirico, M., De Caceres, M., Durand, S., Evangelista, H. B. A., FitzJohn, R., Friendly, M., Furneaux, B., Hannigan, G., Hill, M. O., Lahti, L., McGlinn, D., Ouellette, M., Cunha, E. R., Smith, T., Stier, A., Ter Braak, C. J. F., and Weedon, J.: Vegan Community Ecology Package Version 2.6-2 April 2022, The Comprehensive R Archive Network, http://cran.r-project.org (last access: 17 April 2022), 2022.
Patten, B. C. and Higashi, M.: Modified cycling index for ecological applications, Ecol. Model., 25, 69–83, https://doi.org/10.1016/0304-3800(84)90033-4, 1984.
Patten, B. C., Bosserman, R. W., Finn, J. T., and Cale, W. G.: Propagation of cause in ecosystems, in: Systems Analysis and Simulation in Ecology, edited by: Patten, B. C., Vol. 4, Academic Press, New York, 457–579, 1976.
Pusceddu, A., Bianchelli, S., Canals, M., Sanchez-Vidal, A., De Madron, X. D., Heussner, S., Lykousis, V., de Stigter, H., Trincardi, F., and Danovaro, R.: Organic matter in sediments of canyons and open slopes of the Portuguese, Catalan, Southern Adriatic and Cretan Sea margins, Deep-Sea Res. Pt. I, 57, 441–457, https://doi.org/10.1016/j.dsr.2009.11.008, 2010.
Rabouille, C., Caprais, J. C., Lansard, B., Crassous, P., Dedieu, K., Reyss, J. L., and Khripounoff, A.: Organic matter budget in the Southeast Atlantic continental margin close to the Congo Canyon: In situ measurements of sediment oxygen consumption, Deep-Sea Res. Pt. II, 56, 2223–2238, https://doi.org/10.1016/j.dsr2.2009.04.005, 2009.
Rex, M. A., Etter, R. J., Morris, J. S., Crouse, J., McClain, C. R., Johnson, N. A., Stuart, C. T., Deming, J. W., Thies, R., and Avery, R.: Global bathymetric patterns of standing stock and body size in the deep-sea benthos, Mar. Ecol.-Prog. Ser., 317, 1–8, https://doi.org/10.3354/meps317001, 2006.
Rowe, G. T.: Biomass and production of the deep-sea macrobenthos, Sea, 8, 97–121, 1983.
Rowe, G. T., Sibuet, M., Deming, J., Tietjen, J., and Khripounoff, A.: Organic carbon turnover time in deep-sea benthos, Prog. Oceanogr., 24, 141–160, https://doi.org/10.1016/0079-6611(90)90026-X, 1990.
Rowe, G. T., Wei, C., Nunnally, C., Haedrich, R., Montagna, P., Baguley, J. G., Bernhard, J. M., Wicksten, M., Ammons, A., Briones, E. E., Soliman, Y., and Deming, J. W.: Comparative biomass structure and estimated carbon flow in food webs in the deep Gulf of Mexico, Deep-Sea Res. Pt. II, 55, 2699–2711, https://doi.org/10.1016/j.dsr2.2008.07.020, 2008.
Saint-Béat, B., Baird, D., Asmus, H., Asmus, R., Bacher, C., Pacella, S. R., Johnson, G. A., David, V., Vézina, A. F., and Niquil, N.: Trophic networks: How do theories link ecosystem structure and functioning to stability properties? A review, Ecol. Indic., 52, 458–471, https://doi.org/10.1016/j.ecolind.2014.12.017, 2015.
Sequeiros, O. E., Bolla Pittaluga, M., Frascati, A., Pirmez, C., Masson, D. G., Weaver, P., Crosby, A. R., Lazzaro, G., Botter, G., and Rimmer, J. G.: How typhoons trigger turbidity currents in submarine canyons, Sci. Rep., 9, https://doi.org/10.1038/s41598-019-45615-z, 2019.
Shepard, F. P.: Submarine canyons: multiple causes and long-time persistence, AAPG bulletin, 65, 1062–1077, https://doi.org/10.1306/03B59459-16D1-11D7-8645000102C1865D, 1981.
Shih, Y.-Y., Hung, C.-C., Huang, S.-Y., Muller, F. L., and Chen, Y.-H.: Biogeochemical variability of the upper ocean response to typhoons and storms in the Northern South China Sea, Front. Mar. Sci., 7, 151, https://doi.org/10.3389/fmars.2020.00151, 2020.
Sibuet, M.: Répartition et diversité des Echinodermes (Holothurides-Astérides) en zone profonde dans le Golfe de Gascogne, Deep-Sea Res., 24, 549–563, https://doi.org/10.1016/0146-6291(77)90527-6, 1977.
Smallwood, B. J., Wolff, G. A., Bett, B. J., Smith, C. R., Hoover, D., Gage, J. D., and Patience, A.: Megafauna can control the quality of organic matter in marine sediments, Naturwissenschaften, 86, 320–324, https://doi.org/10.1007/s001140050624, 1999.
Smith Jr., K. L.: Food energy supply and demand: A discrepancy between particulate organic carbon flux and sediment community oxygen consumption in the deep ocean, Limnol. Oceanogr., 32, 201–220, https://doi.org/10.4319/lo.1987.32.1.0201, 1987.
Smith Jr., K. L. and Kaufmann, R. S.: Long-term discrepancy between food supply and demand in the deep eastern North Pacific, Science, 284, 1174–1177, https://doi.org/10.1126/science.284.5417.1174, 1999.
Smith Jr., K. L., Huffard, C. L., Sherman, A. D., and Ruhl, H. A.: Decadal change in sediment community oxygen consumption in the abyssal northeast Pacific, Aquat. Geochem., 22, 401–417, https://doi.org/10.1007/s10498-016-9293-3, 2016.
Snelgrove, P. V., Soetaert, K., Solan, M., Thrush, S., Wei, C.-L., Danovaro, R., Fulweiler, R. W., Kitazato, H., Ingole, B., Norkko, A., Parkes, R. J., and Volkenborn, N.: Global carbon cycling on a heterogeneous seafloor, Trends Ecol. Evol., 33, 96–105, https://doi.org/10.1016/j.tree.2017.11.004, 2018.
Soetaert, K. and Herman, P. M.: A practical guide to ecological modelling: using R as a simulation platform (Vol. 7, No. 7), Springer, New York, https://doi.org/10.1016/S0075-9511(09)00026-7, 2009.
Soetaert, K. and van Oevelen, D.: Modeling food web interactions in benthic deep-sea ecosystems: a practical guide, Oceanography, 22, 128–143, https://doi.org/10.5670/oceanog.2009.13, 2009.
Stratmann, T., Lins, L., Purser, A., Marcon, Y., Rodrigues, C. F., Ravara, A., Cunha, M. R., Simon-Lledó, E., Jones, D. O. B., Sweetman, A. K., Köser, K., and van Oevelen, D.: Abyssal plain faunal carbon flows remain depressed 26 years after a simulated deep-sea mining disturbance, Biogeosciences, 15, 4131–4145, https://doi.org/10.5194/bg-15-4131-2018, 2018.
Stratmann, T., Soetaert, K., Wei, C. L., Lin, Y. S., and van Oevelen, D.: The SCOC database, a large, open, and global database with sediment community oxygen consumption rates, Sci. Data, 6, 242, https://doi.org/10.1038/s41597-019-0259-3, 2019.
Su, C.-C., Hsu, S.-T., Hsu, H.-H., Lin, J.-Y., and Dong, J.-J.: Sedimentological characteristics and seafloor failure offshore SW Taiwan, Terr. Atmos. Ocean Sci., 29, 65–76, https://doi.org/10.3319/TAO.2017.06.21.01, 2018.
Taghon, G. L. and Greene, R. R.: Utilization of deposited and suspended particulate matter by benthic “interface” feeders, Limnol. Oceanogr., 37, 1370–1391, https://doi.org/10.4319/lo.1992.37.7.1370, 1992.
Tenore, K. R.: Comparison of the ecological energetics of the polychaetes Capitella capitata and Nereis succinea in experimental systems receiving similar levels of detritus, Neth. J. Sea Res., 16, 46–54, https://doi.org/10.1016/0077-7579(82)90016-3, 1982.
Thomsen, L. and Flach, E.: Mesocosm observations of fluxes of particulate matter within the benthic boundary layer, J. Sea Res., 37, 67–79, https://doi.org/10.1016/S1385-1101(97)00004-X, 1997.
Thurber, A. R., Sweetman, A. K., Narayanaswamy, B. E., Jones, D. O. B., Ingels, J., and Hansman, R. L.: Ecosystem function and services provided by the deep sea, Biogeosciences, 11, 3941–3963, https://doi.org/10.5194/bg-11-3941-2014, 2014.
Tsai, S.-W. and Chung, Y.: Pb-210 in the sediments of Taiwan Strait, Acta Oceanographica Taiwanica, 22, 1–13, 1989.
Tung, C.-C. and Wei, C.-L.: chihlinwei/GPSC_LIM: Contrasting carbon cycling in the benthic food webs (v.1), Zenodo [data set, code], https://doi.org/10.5281/zenodo.10912175, 2024.
Tung, C.-C., Chen, Y.-T., Liao, J.-X., and Wei, C.-L.: Response of the benthic biomass-size structure to a high-energy submarine canyon, Front. Mar. Sci., 10, 1122143, https://doi.org/10.3389/fmars.2023.1122143, 2023.
Ulanowicz, R. E.: An hypothesis on the development of natural communities, J. Theor. Biol., 85, 223–245, https://doi.org/10.1016/0022-5193(80)90019-3, 1980.
Ulanowicz, R. E.: A phenomenological perspective of ecological development, Aquatic Toxicology and Environmental Fate: Ninth Volume, edited by: Poston, T. M. and Purdy, R., American Society for Testing and Materials, Philadelphia, https://doi.org/10.1520/STP29016S, 1986.
Ulanowicz, R. E.: Quantitative methods for ecological network analysis, Comput. Biol. Chem., 28, 321–339, https://doi.org/10.1016/j.compbiolchem.2004.09.001, 2004.
van Duyl, F. C. and Kop, A. J.: Bacterial production in North Sea sediments: clues to seasonal and spatial variations, Mar. Biol., 120, 323–337, https://doi.org/10.1007/BF00349694, 1994.
van Oevelen, D., Soetaert, K., Middelburg, J. J., Herman, P. M., Moodley, L., Hamels, I., Moens, T., and Heip, C. H.: Carbon flows through a benthic food web: Integrating biomass, isotope and tracer data, J. Mar. Res., 64, 453–482, https://elischolar.library.yale.edu/journal_of_marine_research/135 (last access: 4 April 2024), 2006.
van Oevelen, D., van den Meersche, K., Meysman, F. J., Soetaert, K., Middelburg, J. J., and Vézina, A. F.: Quantifying food web flows using linear inverse models, Ecosystems, 13, 32–45, https://doi.org/10.1007/s10021-009-9297-6, 2010.
van Oevelen, D., Soetaert, K., Garcia, R., De Stigter, H. C., Cunha, M. R., Pusceddu, A., and Danovaro, R.: Canyon conditions impact carbon flows in food webs of three sections of the Nazaré canyon, Deep-Sea Res. Pt. II, 58, 2461–2476, https://doi.org/10.1016/j.dsr2.2011.04.009, 2011.
van Oevelen, D., Soetaert, K., and Heip, C.: Carbon flows in the benthic food web of the Porcupine Abyssal Plain: The (un) importance of labile detritus in supporting microbial and faunal carbon demands, Limnol. Oceanogr., 57, 645–664, https://doi.org/10.4319/lo.2012.57.2.0645, 2012.
Vetter, E. W. and Dayton, P. K.: Organic enrichment by macrophyte detritus, and abundance patterns of megafaunal populations in submarine canyons, Mar. Ecol.-Prog. Ser., 186, 137–148, https://doi.org/10.3354/meps186137, 1999.
Vetter, E. W., Smith, C. R., and De Leo, F. C.: Hawaiian hotspots: enhanced megafaunal abundance and diversity in submarine canyons on the oceanic islands of Hawaii, Mar. Ecol., 31, 183–199, https://doi.org/10.1111/j.1439-0485.2009.00351.x, 2010.
Walsh, J. P., Alexander, C. R., Gerber, T., Orpin, A. R., and Sumners, B. W.: Demise of a submarine canyon? Evidence for highstand infilling on the Waipaoa River continental margin, New Zealand, Geophys. Res. Lett., 34, L20606, https://doi.org/10.1029/2007GL031142, 2007.
Wang, Y.-H., Lee, I.-H., and Liu, J. T.: Observation of internal tidal currents in the Kaoping Canyon off southwestern Taiwan, Estuar. Coast. Shelf S., 80, 153–160, https://doi.org/10.1016/j.ecss.2008.07.016, 2008.
Warwick, R. M. and Gee, J. M.: Community structure of estuarine meiobenthos, Mar. Ecol.-Prog. Ser., 18, 97–111, https://doi.org/10.3354/meps018097, 1984.
Wei, C.-L., Rowe, G. T., Escobar-Briones, E., Boetius, A., Soltwedel, T., Caley, M. J., Soliman, Y., Huettmann, F., Qu, F., Yu, Z., Pitcher, C. R., Haedrich, R. L., Wicksten, M. K., Rex, M. A., Baguley, J. G., Sharma, J., Danovaro, R., MacDonald, I. R., Nunnally, C. C., Deming, J. W., Montagna, P., Lévesque, M., Weslawski, J. M., Wlodarska-Kowalczuk, M., Ingole, B. S., Bett, B. J., Billett, D. S. M., Yool, A., Bluhm, B. A., Iken, K., and Narayanaswamy, B. E.: Global patterns and predictions of seafloor biomass using Random Forests, PLoS ONE, 5, e15323, https://doi.org/10.1371/journal.pone.0015323, 2010.
Wenzhöfer, F. and Glud, R. N.: Benthic carbon mineralization in the Atlantic: a synthesis based on in situ data from the last decade, Deep-Sea Res. Pt. I, 49, 1255–1279, https://doi.org/10.1016/S0967-0637(02)00025-0, 2002.
Wenzhöfer, F. and Glud, R. N.: Small-scale spatial and temporal variability in coastal benthic O2 dynamics: Effects of fauna activity, Limnol. Oceanogr., 49, 1471–1481, https://doi.org/10.4319/lo.2004.49.5.1471, 2004.
Witte, U. and Pfannkuche, O.: High rates of benthic carbon remineralisation in the abyssal Arabian Sea, Deep-Sea Res. Pt. II, 47, 2785–2804, https://doi.org/10.1016/S0967-0645(00)00049-7, 2000.
Yamamoto, N. and Lopez, G.: Bacterial abundance in relation to surface area and organic content of marine sediments, J. Exp. Mar. Biol. Ecol., 90, 209–220, https://doi.org/10.1016/0022-0981(85)90167-4, 1985.
Yu, H. S., Chiang, C. S., and Shen, S. M.: Tectonically active sediment dispersal system in SW Taiwan margin with emphasis on the Gaoping (Kaoping) Submarine Canyon, J. Marine Syst., 76, 369–382, https://doi.org/10.1016/j.jmarsys.2007.07.010, 2009.