the Creative Commons Attribution 4.0 License.
the Creative Commons Attribution 4.0 License.
 | 11 Apr 2024
Inclusion of bedrock vadose zone in dynamic global vegetation models is key for simulating vegetation structure and function
Dana A. Lapides
W. Jesse Hahm
Matthew Forrest
Daniella M. Rempe
Thomas Hickler
David N. Dralle
Across many upland environments, soils are thin and plant roots extend into fractured and weathered bedrock where moisture and nutrients can be obtained. Root water extraction from unsaturated weathered bedrock is widespread and, in many environments, can explain gradients in vegetation community composition, transpiration, and plant sensitivity to climate. Despite increasing recognition of its importance, the “rock moisture” reservoir is rarely incorporated into vegetation and Earth system models. Here, we address this weakness in a widely used dynamic global vegetation model (DGVM; LPJ-GUESS). First, we use a water flux-tracking deficit approach to more accurately parameterize plant-accessible water storage capacity across the contiguous United States, which critically includes the water in bedrock below depths typically prescribed by soil databases. Secondly, we exploit field-based knowledge of contrasting plant-available water storage capacity in weathered bedrock across two bedrock types in the Northern California Coast Ranges as a detailed case study. For the case study in Northern California, climate and soil water storage capacity are similar at the two study areas, but the site with thick weathered bedrock and ample rock moisture supports a temperate mixed broadleaf–needleleaf evergreen forest, whereas the site with thin weathered bedrock and limited rock moisture supports an oak savanna. The distinct biomes, seasonality and magnitude of transpiration and primary productivity, and baseflow magnitudes only emerge from the DGVM when a new and simple subsurface storage structure and hydrology scheme is parameterized with storage capacities extending beyond the soil into the bedrock. Across the contiguous United States, the updated hydrology and subsurface storage improve annual evapotranspiration estimates as compared to satellite-derived products, particularly in seasonally dry regions. Specifically, the updated hydrology and subsurface storage allow for enhanced evapotranspiration through the dry season that better matches actual evapotranspiration patterns. While we made changes to both the subsurface water storage capacity and the hydrology, the most important impacts on model performance derive from changes to the subsurface water storage capacity. Our findings highlight the importance of rock moisture in explaining and predicting vegetation structure and function, particularly in seasonally dry climates. These findings motivate efforts to better incorporate the rock moisture reservoir into vegetation, climate, and landscape evolution models.
- Article
(11392 KB) - Full-text XML
- BibTeX
- EndNote


Climate change is driving changes to precipitation, temperature, and fire regimes. Regions with a Mediterranean climate in particular, which host significant amounts of the world's threatened plant biodiversity (Cowling et al., 1996), are projected to experience increased precipitation volatility (Swain et al., 2018) and overall drier climate (Parmesan et al., 2022; Lee et al., 2021), including shorter wet seasons and an increase in the frequency and duration of conditions that result in extreme wildfire (Swain, 2021; Luković et al., 2021). To preserve these communities and better inform land management and climate adaptation research and policy, it is essential to understand how the current changes unfolding globally will impact plant communities in the decades to come. However, dynamic regional to global vegetation models – our most advanced tools for evaluating vegetation response to climatic drivers – have historically struggled to capture vegetation behavior in seasonally dry environments, such as regions with a Mediterranean climate (Hickler et al., 2012, 2006), which experience hot, dry summers and cooler, wetter winters. This performance gap provides a clue that there may be an essential component missing from these models.
Research insights from critical zone science may provide a clue as to what this missing piece might be. The critical life-supporting zone extends from the top of the vegetation canopy downward through typically thin, physically mobile soil and into deeper underlying saprolite and weathered bedrock layers (Anderson et al., 2004; Grant and Dietrich, 2017). Soil and bedrock in the subsurface critical zone store and release water to plants and streams. Although extensive maps exist that can inform soil moisture properties in Earth system and vegetation models, mounting evidence suggests that (i) many plants extensively exploit unsaturated moisture sourced from weathered bedrock below the mapped soil to sustain transpiration (McCormick et al., 2021), (ii) the importance of shallow roots may be overestimated (Feddes et al., 2001), and (iii) infiltrating rainfall and snowmelt in upland environments tend to transit this vadose zone rather than run off as Horton overland flow over the surface (Salve et al., 2012; Hahm et al., 2022). Woody plant use of water stored beneath soils in weathered bedrock has been documented as early as the beginning of the 20th century (Cannon, 1911). “Rock moisture”, or water derived from the unsaturated weathered bedrock layer, is now understood to be an essential plant water reservoir, particularly in seasonally dry regions where it sustains transpiration later into the dry season (e.g., Schwinning, 2010; Rempe and Dietrich, 2018; Rose, 2003; McCormick et al., 2021; Hahm et al., 2022, 2020; Ruiz et al., 2010; Maysonnave et al., 2022). It has been difficult to incorporate deeper water storage into dynamic vegetation models and Earth system models because weathered bedrock storage capacity has been historically challenging to quantify except at intensively monitored study sites. Recently, Wang-Erlandsson et al. (2016) presented a mass-balance-based method for estimating total plant-available storage as the largest cumulative difference between incoming precipitation and outgoing evapotranspiration over a given time period, referred to as a “deficit” (Grindley, 1960, 1968). For long time periods, the largest-observed deficit places a reasonable lower bound on the true plant-accessible water storage capacity, providing a method for estimating total plant-accessible water at large scales. McCormick et al. (2021) used a modification (Dralle et al., 2021) of this deficit-based approach to map rock moisture storage across the contiguous United States (CONUS) by subtracting soil water storage capacity (from Soil Survey Staff, 2019a) from the total plant-available storage capacity. They confirmed that large regions of the US southwest and western Texas host vegetation communities that rely on bedrock-derived water nearly every year. In such seasonally or intermittently dry areas, the subsurface is responsible for storing the water that supports plant communities through dry periods. Generally, it is the case that water stored from the wet winter is essential for supporting plant function during the dry summer in regions with Mediterranean climates.
Smith et al. (2001)Smith et al. (2014)Pollard and Thompson (1995)Daly et al. (2000)Friend et al. (1997)Bond et al. (2005)Sato et al. (2007)Cox (2001)Lawrence et al. (2019)Moorcroft et al. (2001)Table 1Table of subsurface storage structures used in DGVMs. In the “Variable soil depth?” column, Y indicates that depth can vary by location, and N indicates that it does not vary by location.
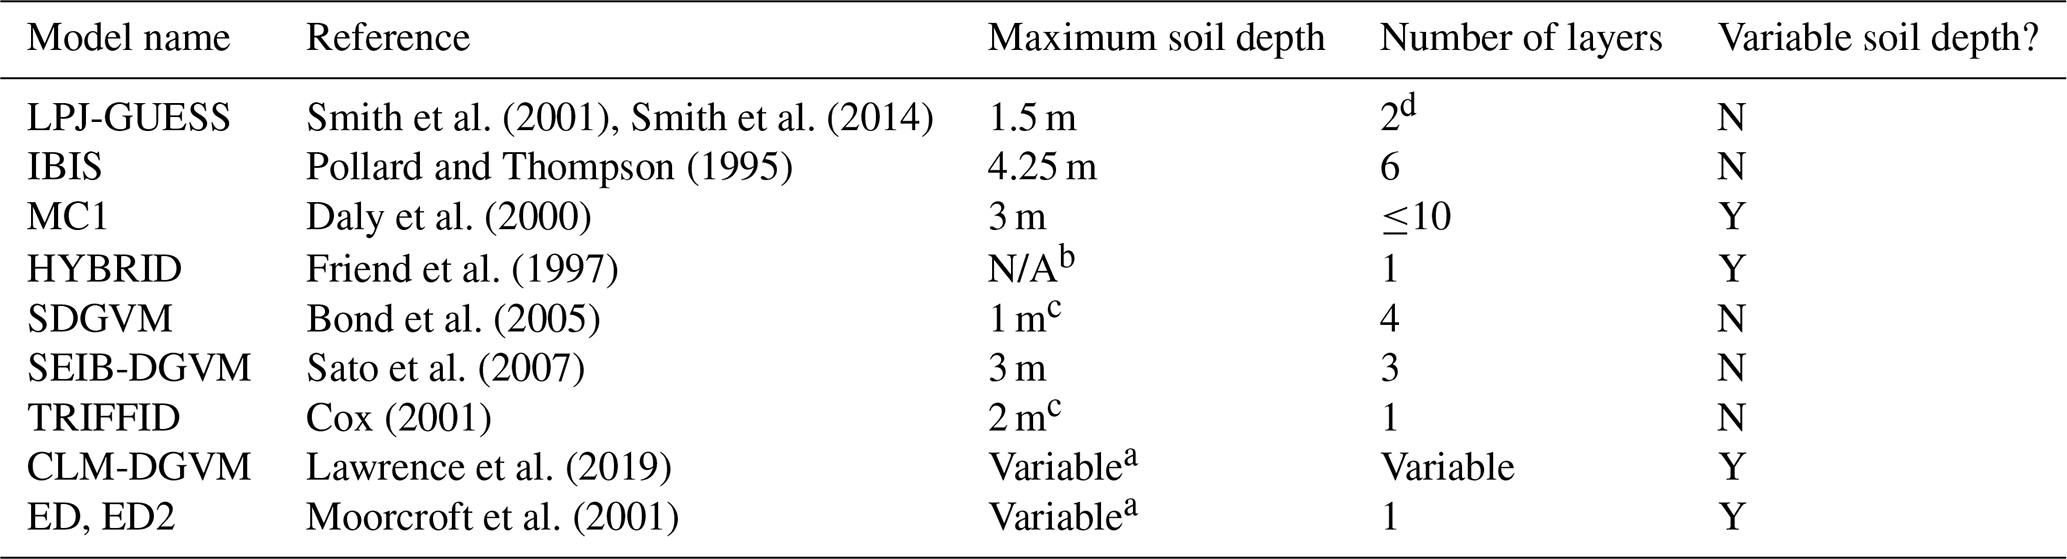
a Soil depth is determined from a soil dataset, which does not generally include weathered bedrock storage. Five of the nine dynamic global vegetation models (DGVMs) do not allow for soil depths greater than 3 m. Of the four models with spatially varying soil depth, the soil depth is specified from a soil dataset alone, which does not account for rock moisture. b Soil water depth is not defined. Soil water capacity is defined. c This is the default value, but it may be possible to edit this in the model. d This study uses LPJ-GUESS version 4.0.1. The most recent version of LPJ-GUESS has 10 soil layers, although the soil depth is still 1.5 m.
Regions with Mediterranean climates where rock moisture appears to be important coincide with the regions where DGVMs and land surface models tend to underpredict dry-season plant transpiration and vegetation growth (e.g., Hickler et al., 2006, 2012), suggesting that incorporating rock moisture into DGVMs could improve performance in these regions. Across the set of widely used DGVMs included in Table 1, none explicitly accounts for rock moisture. Growing consensus in the hydrology community indicates that using soil properties to determine water availability to ecosystems neglects essential feedbacks between climate, ecosystems, and hydrology that determine subsurface water availability to plants (Gao et al., 2023). Further, subsurface plant water access (represented by rooting depth) has been demonstrated to be a strong control on DGVM results (e.g., Langan et al., 2017; Sakschewski et al., 2021). For these reasons, it may be important to improve prescriptions of the subsurface water storage accessible to plants (Piedallu et al., 2013). Jiménez-Rodríguez et al. (2022) implemented CLM-DGVM in Europe with two non-standard subsurface structures, both with soils 1.5 m deeper everywhere but using different soil textures for deeper soil layers. They found that the greater storage capacity allowed for better model performance in seasonally dry areas. This finding is suggestive, but without using realistic estimates of rock moisture storage, it is difficult to determine whether the model is “getting the right answers for the right reasons” (Kirchner, 2006).
Here, we seek to investigate the impact of subsurface water flowpaths and deeper moisture supplies on plants by incorporating insights gained from an intensive field-based study of hillslope flow, water storage capacity and plant community composition and function into the Lund-Potsdam-Jena GUESS Dynamic Global Vegetation Model (LPJ-GUESS DGVM; Smith et al., 2001, 2014). We alter model representation of subsurface structure to incorporate location-specific estimates of plant-accessible storage in weathered bedrock. Additionally, we develop a new hydrology scheme based on our best understanding of hydrological processes that results in increased infiltration into the vadose zone. Previous efforts focused on improving hydrological processes in DGVMs have shown important model improvements arising from increased hydrologic realism, for example, by capturing the effects of topography and inter-pixel flow or improving inter-soil layer water transfer (Tang et al., 2014, 2015; Wolf et al., 2008a). We hypothesize that the inclusion of plant-available water storage in weathered bedrock – in addition to soil water storage – in a DGVM will significantly improve the prediction of (i) potential plant communities, (ii) phenological patterns, and (iii) summer dry-season evapotranspiration (Gordon et al., 2004; Pappas et al., 2013; Eliades et al., 2018; Schwinning, 2010; Milly and Dunne, 1994; Pitman, 2003). We expect to see the largest impacts in areas with a Mediterranean climate, but these improvements should show up more modestly in other areas as well since this change will result in a more realistic depiction of subsurface water availability everywhere. We test this hypothesis in detail at two intensively monitored sites in Northern California with similar climates but distinct vegetation communities (Hahm et al., 2019) and more broadly at 4 km resolution across CONUS to demonstrate that these changes result in realistic predictions not just in areas with Mediterranean climates but across all biomes represented in CONUS. This work provides a blueprint for incorporating deeper moisture stores into other DGVMs and Earth system models; accurately simulating this rock moisture reservoir is critical to understanding the impacts of global change on plants and water–carbon cycles in seasonally dry climates.
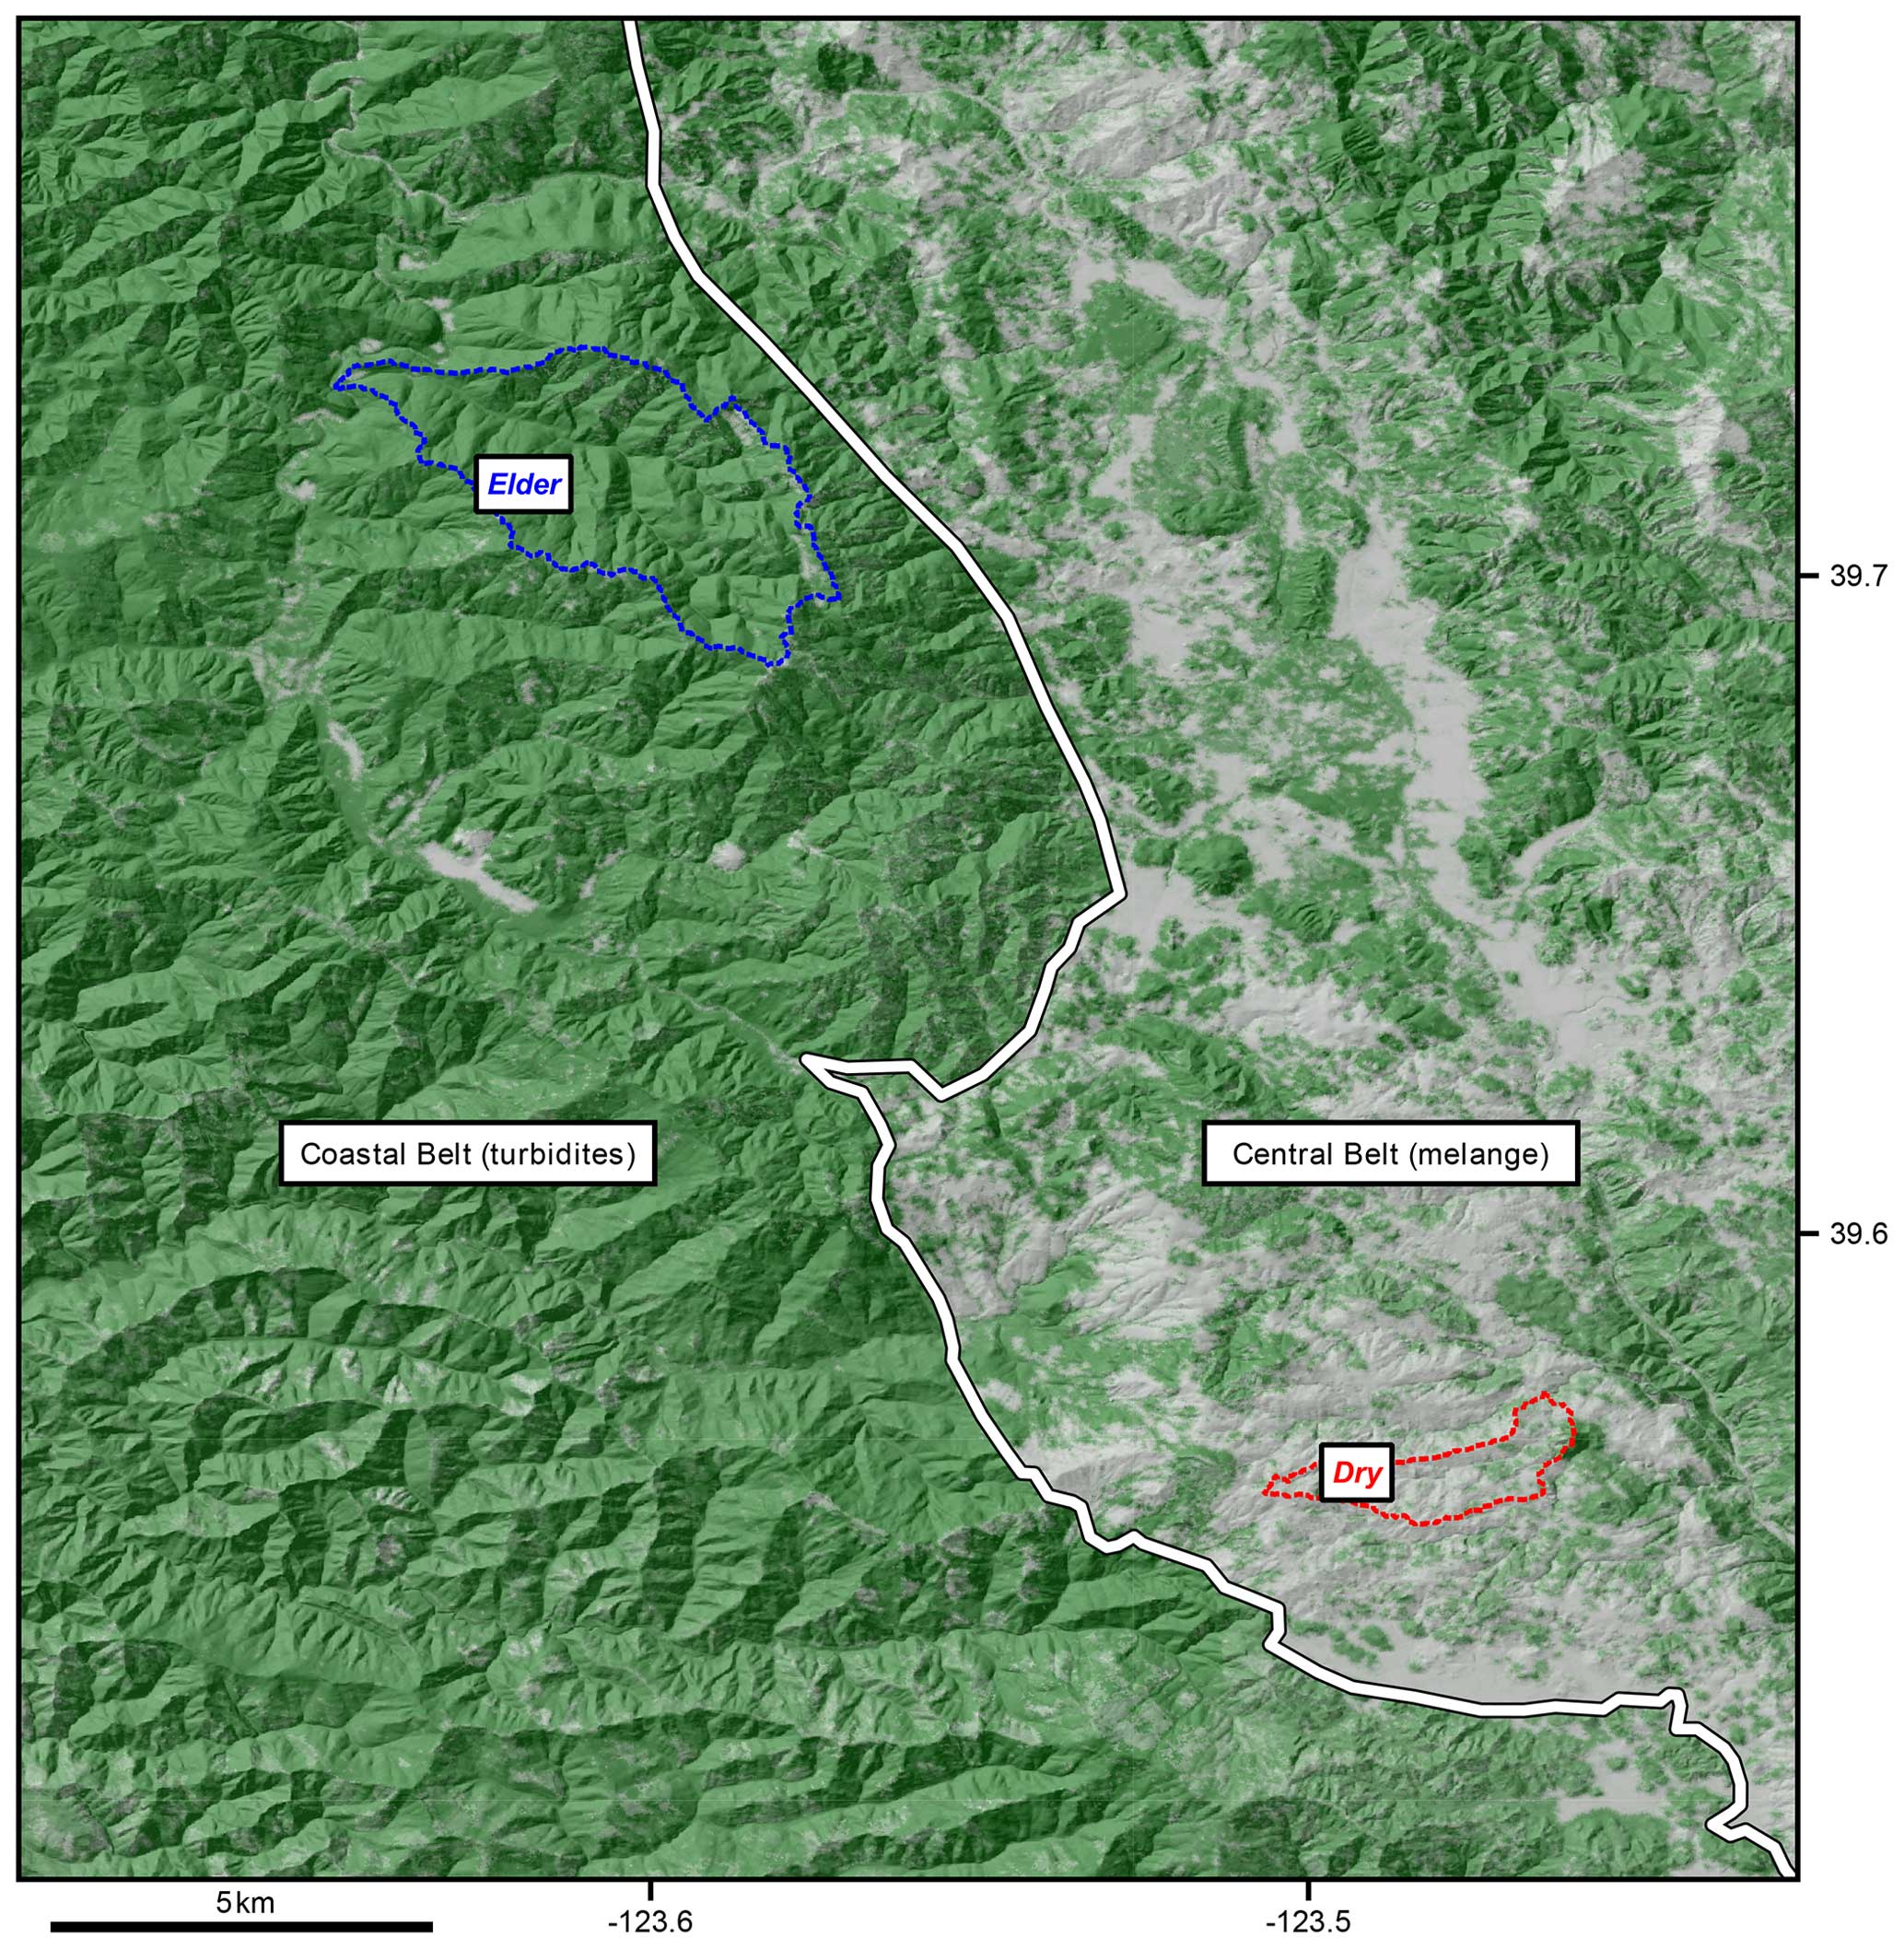
Figure 1Map showing the locations of the two field study sites in Northern California, reprinted from Hahm et al. (2019). Elder Creek is positioned to the west of the geologic divide marked in white, while Dry Creek is positioned to the east so that the two sites have very similar climate but very different subsurface characteristics. Elder Creek has a large subsurface storage capacity, while Dry Creek has a small subsurface storage capacity. Coordinates reported in WGS84, geologic contact based on Jayko et al. (1989), and canopy cover from the 2011 National Land Cover Database.
2.1 Field site descriptions
We build on recent studies (Hahm et al., 2019; Dralle et al., 2018, 2023b; Lovill et al., 2018) that found that within a large area of similar climate in the Northern California Coast Ranges, lithologically controlled differences in the extent of bedrock weathering and water storage capacity result in radical differences in plant communities (Fig. 1) and their phenological behavior as well as regional runoff patterns.
Two intensively studied watersheds across a geologic contact reveal the role of bedrock water storage on plant water availability and streamflow generation. Elder Creek, a 16.9 km2 watershed in the western Coastal Belt of the Franciscan Formation, receives around 2000 mm of annual precipitation, mostly as rain between November and April. The underlying bedrock consists primarily of shale (argillite) with some sandstone and conglomerate. The critical zone at Elder Creek has a thick unsaturated zone and weathered, fractured bedrock (30 m thick at ridgetops) (Rempe and Dietrich, 2018; Salve et al., 2012), allowing ample water storage and supporting a dense evergreen forest canopy. Hydrological dynamics follow an annual cycle, with all rain infiltrating into the subsurface, increasing moisture in the soil and weathered bedrock vadose zone at the start of the wet season. The vadose zone recharges a hillslope groundwater aquifer (Dralle et al., 2023a), which flows laterally through fractures to generate streamflow, including both storm and baseflow (Dralle et al., 2018).
In contrast, Dry Creek is a smaller watershed (3.5 km2) located about 20 km southeast of Elder Creek in the Central Belt of the Franciscan Formation. It receives approximately 1800 mm of annual precipitation. Dry Creek's lithology consists of mélange with an intensely sheared, primarily argillaceous matrix (Hahm et al., 2019). The subsurface critical zone at Dry Creek is shallow, with thin organic soils and clay-rich weathered matrix overlaying unweathered, perennially saturated mélange found just 2–4 m below the surface (Hahm et al., 2020). As a result of limited weathering, Dry Creek has limited subsurface water storage capacity, which results in a winter deciduous oak and annual grassland savanna as the primary vegetation community, despite similar rainfall totals to Elder Creek. Across the state of California, the Central Belt mélange has a lower plant water storage capacity than other rock types in a similar climate (Hahm et al., 2024).
Thus, the differing lithologies and critical zone structures between the two sites lead to significant disparities in storage dynamics and vegetation communities. Elder Creek's thick subsurface critical zone supports a dense mixed broadleaf–needleleaf evergreen forest canopy, while Dry Creek's shallow subsurface critical zone can only sustain a grassland savanna.
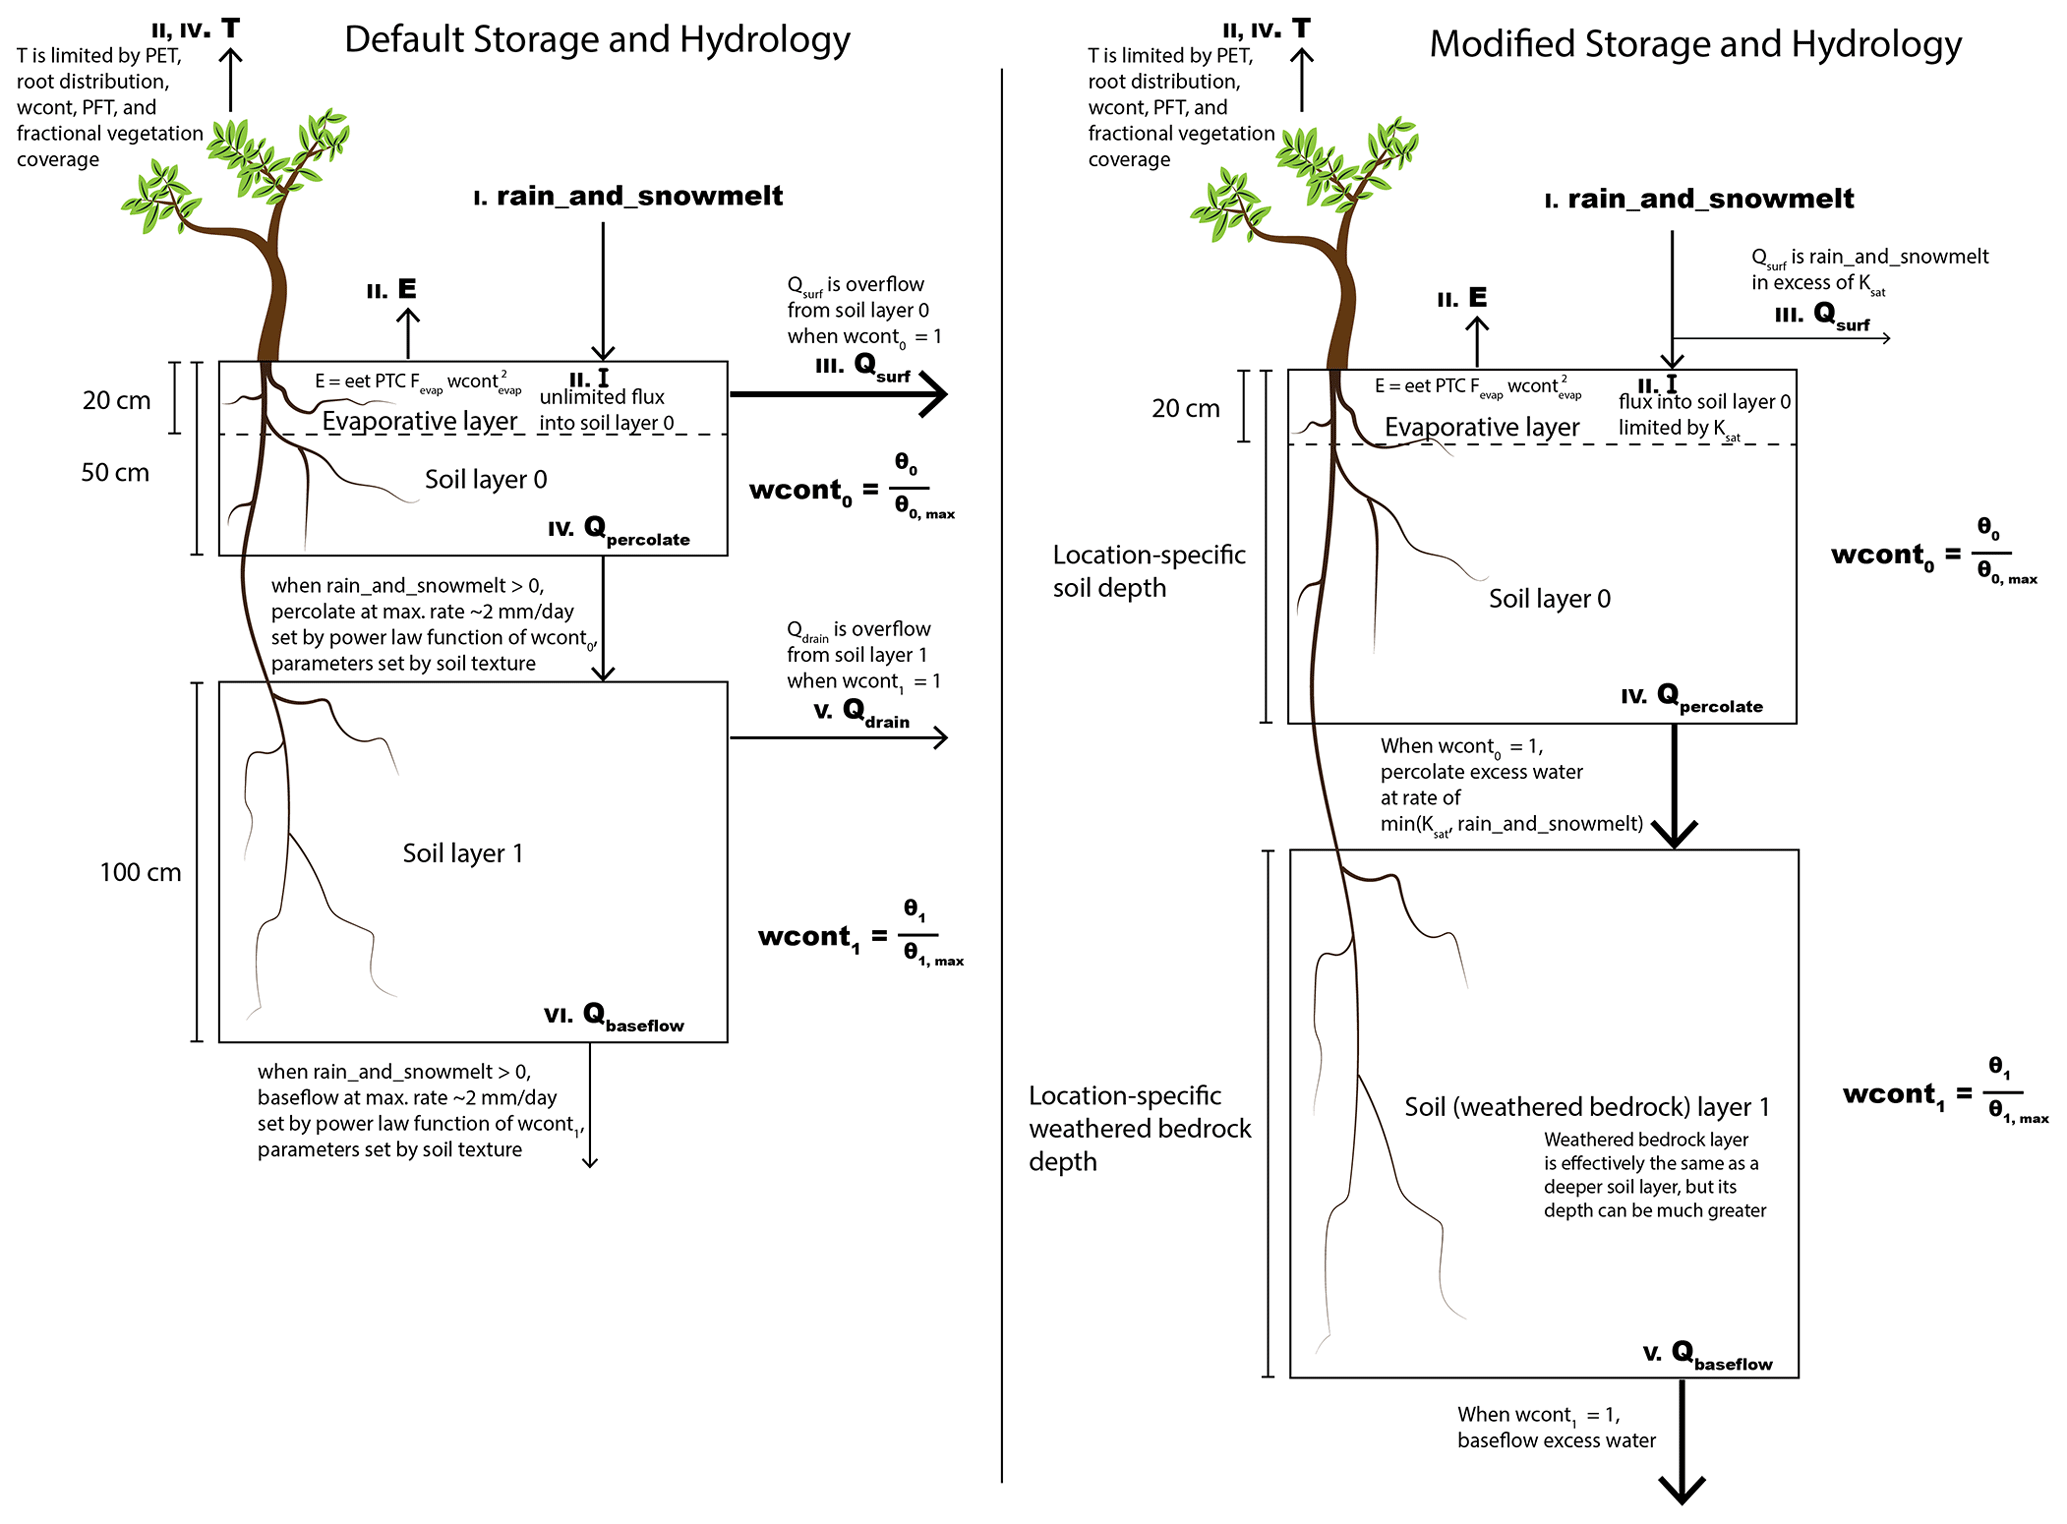
Figure 2Schematic representing (left) the default LPJ-GUESS soil storage hydrology vs. (right) the modified LPJ-GUESS soil storage hydrology. See Sect. 2.2 for more details. Roman numerals indicate the order in which processes are simulated. PFT is plant functional type, “T” transpiration, “E” evaporation, “rain_and_snowmelt” the combination of input rainwater and snowmelt, Qsurf surface runoff, Qpercolate percolation of water from upper soil layer to lower soil layer, Qdrain a lateral drainage term of water leaving the lower soil layer, Qbaseflow a runoff term leaving the lower soil layer, wcont0 and wcont1 the water content of the upper and lower soil layers, θ0 and θ1 the volumetric water content of the upper and lower soil layers, and and the volumetric water content at field capacity for the upper and lower soil layers, respectively. Ksat is the saturated hydraulic conductivity, wcontevap is the water content in the evaporative layer, eet is the daily evaporation rate in equilibrium with atmospheric conditions, PTC is the Priestley–Taylor coefficient, and Fevap is the fraction of pixel area that is exposed to evaporation.
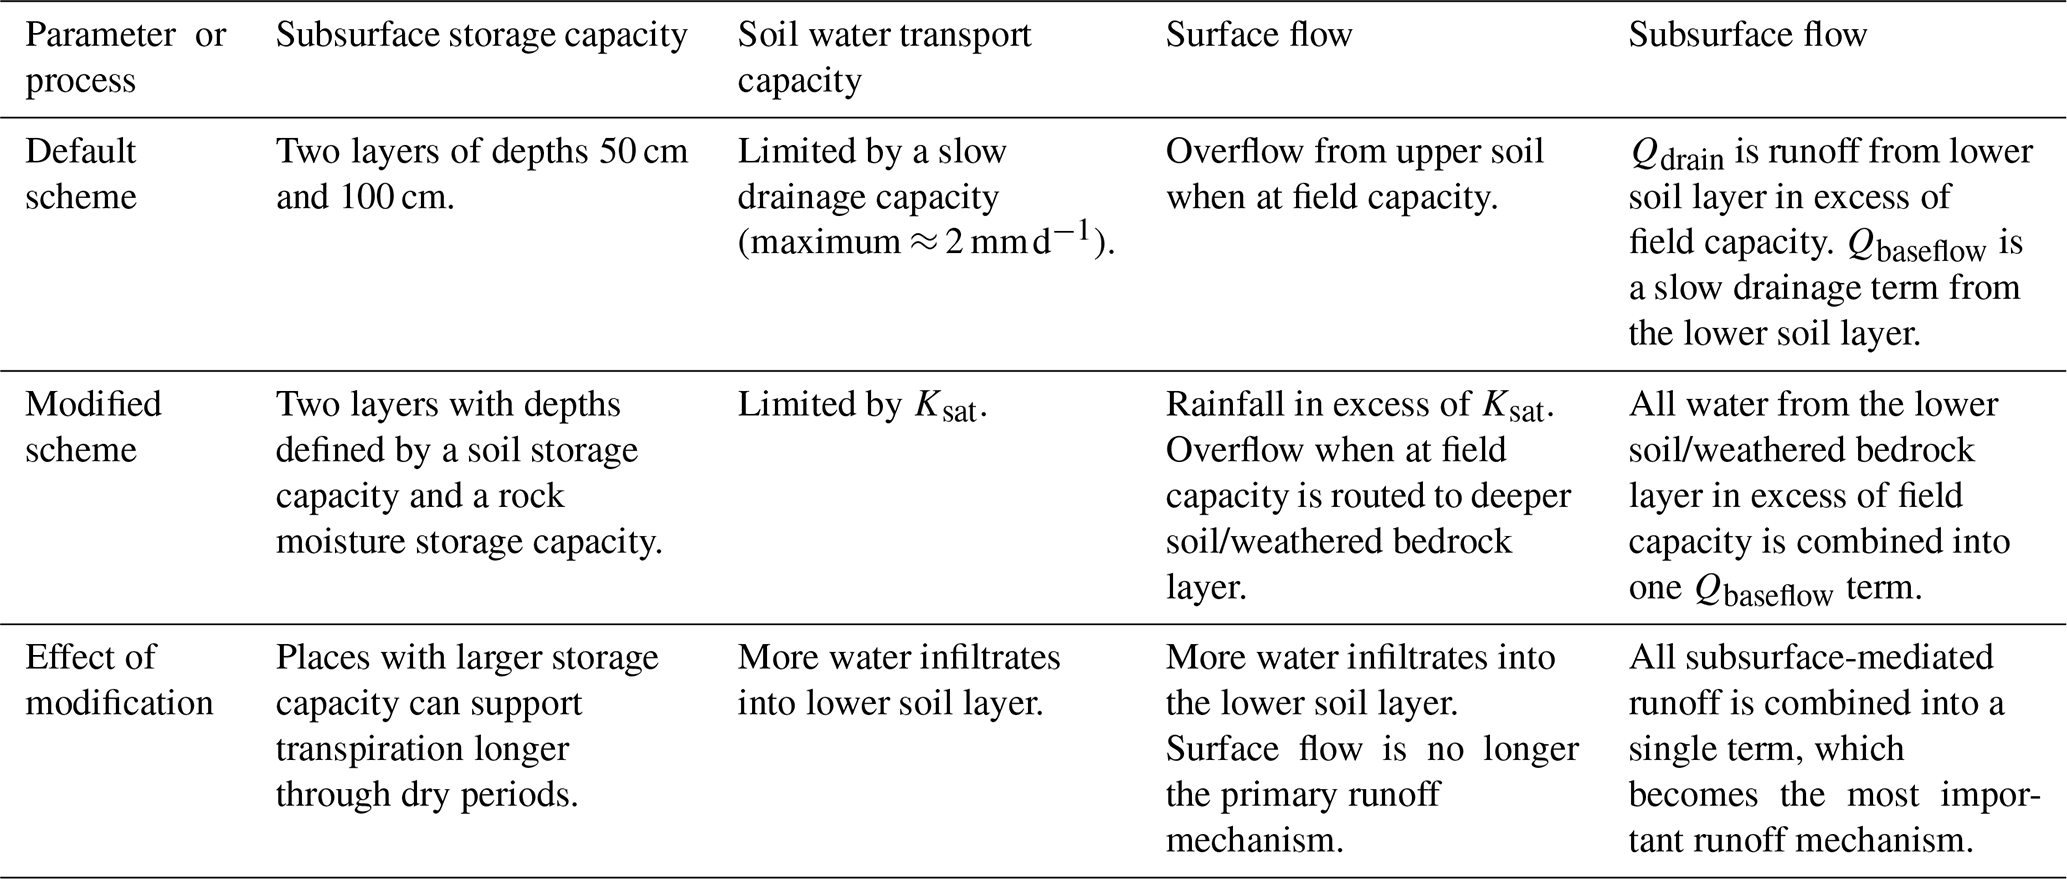
Table 2Table summarizing modifications made to the LPJ-GUESS hydrology scheme.
2.2 Model description
LPJ-GUESS is a process-based dynamic regional to global vegetation model that represents plant physiological and biogeochemical processes as well as detailed representations of tree population dynamics, disturbance by wildfires, and biome biogeography (Sitch et al., 2003; Smith et al., 2001). LPJ-GUESS has been successfully used for a variety of applications in vegetation change, carbon cycling, and biomass modeling (Hickler et al., 2004; Steinkamp and Hickler, 2015; Wolf et al., 2008b, and others found at https://web.nateko.lu.se/lpj-guess/index.html, last access: 9 April 2024). A full description of the LPJ-GUESS model can be found in Smith et al. (2001) and Smith et al. (2014), with the default hydrology scheme described by Gerten et al. (2004). In this study, we work from LPJ-GUESS version 4.0.1 (https://web.nateko.lu.se/lpj-guess/index.html, last access: 9 April 2024). We made two distinct updates to the subsurface hydrology scheme in LPJ-GUESS. The first update is a change to the subsurface storage capacity, and the second is a change to the hydrological processes. We refer to these throughout as the “modified” storage and hydrology, respectively, as compared to the “default” storage and hydrology. Figure 2 shows a schematic diagram of the subsurface hydrology for the default storage capacity and hydrology (left) and the modified storage capacity and hydrology (right). Here, we discuss the differences between the two schemes, summarized in Table 2.
2.2.1 Changes to subsurface storage capacity
In LPJ-GUESS v4.01, the plant-available water storage capacity is divided between an upper and a lower subsurface layer. In the default storage capacity, the two soil layer thicknesses are globally uniform (0.5 and 1 m for the upper and lower layers, respectively). The storage capacity varies by location only due to variability in soil properties that alter the water-holding capacity of the substrate. However, the size of this subsurface storage reservoir is crucial to plant functioning through dry periods. If geology permits and climate supplies enough water, plants can expand their root systems to access water stored outside of this 1.5 m zone. In order to capture plant functioning through dry periods, it is essential to incorporate a more accurately sized storage reservoir. Thus, in the modified storage capacity, the upper soil layer depth is defined by a soil capacity specified from a soil dataset, and the lower layer depth is defined by a storage capacity specified from a rock moisture dataset. In general, this difference from the default layer depths will result in greater root-zone depth in the modified storage capacity, but the magnitude and direction of change is location-specific. It is important that the rock moisture be location-specific rather than quasi-unlimited everywhere since the latter formulation can result in a model with no water limitation, which is not realistic. By setting a location-specific depth, water stress is allowed but only when a realistic storage capacity is depleted.
2.2.2 Changes to flow processes
Each gridcell in LPJ-GUESS functions as a separate 1-D column (i.e., there is no lateral flow). The input flux at the top of the column is from rain or snowmelt, which recharges the upper layer. Abiotic evaporation can remove water from the uppermost portion of the upper layer until the wilting point is reached. Transpiration can remove water from throughout both the upper and lower layers, based on the availability of water in these layers, leaf and atmospheric demand, and root distribution of present plant functional types (PFTs). The details of the hydrologic processes determine how much water enters and leaves each soil layer and where it goes when it leaves. There are three main differences between the default and modified hydrology introduced here, which pertain to (i) overland flow runoff generation, (ii) percolation from the upper to the lower soil (or weathered bedrock) layer, and (iii) runoff generation from the lower soil (or weathered bedrock) layer.
In the default hydrology, overland flow (Qsurf) can remove water from the upper layer only when field capacity is exceeded. In the modified hydrology, we instead allow for Qsurf when the intensity of rainfall exceeds the infiltration capacity of the soil (Ksat), which explicitly represents the process of infiltration excess or Horton overland flow (HOF; Horton, 1933, 1945). When field capacity is reached, excess water percolates (at a rate not exceeding the saturated hydraulic conductivity, Ksat) to the lower layer rather than leaving the soil column as surface runoff. The overland flow mechanism of saturation overland flow (SOF; Dunne and Black, 1970) occurs when the subsurface is fully saturated in a manner similar to Qsurf in the default hydrology. However, without a confining layer, this mechanism would require saturation of both soil layers (rather than just the top layer) before producing surface flows. Without additional process modeling and details on subsurface structure, it is most reasonable to assume that water would infiltrate to the lower soil layer before producing runoff. If SOF did occur once both layers were saturated, it would be classified as subsurface-mediated flow in the modified hydrology, leaving from the lower layer. However, this classification is reasonable for SOF, which does involve significant mixing with subsurface waters prior to producing flows (Lapides et al., 2022).
In the default hydrology, percolation from the upper layer to the lower layer and to baseflow from the lower soil layer occurs at a percolation rate which is determined from soil textural properties and multiplied by the square of the relative plant-available water content (PAWC) in the layer. This percolation rate, when at field capacity, is at most ≈ 2 mm d−1. Importantly, the slow rate of percolation from the upper soil layer in the default hydrology limits the amount of water that can infiltrate into the lower soil layer so that, once the upper soil layer reaches field capacity, nearly all rainfall is transported out of the column as Qsurf. In the modified hydrology, we allow percolation from the upper to lower layer at a rate of Ksat. For comparison, Ksat in forested areas can be as high as tens or hundreds of mm h−1 (e.g., Godsey and Elsenbeer, 2002; Elsenbeer et al., 1999; Davis et al., 1996), orders of magnitude larger than the default percolation rate. Thus, in the modified model, more water is transported into storage in the lower layer before runoff is generated.
While the default hydrology provides two pathways for runoff from the lower layer, the modified hydrology has only one. The slow drainage term called Qbaseflow and the Qdrain runoff term in the default hydrology are replaced in the modified hydrology by a single baseflow term Qbaseflow that delivers all water above field capacity out of the column. In effect, the modified hydrology Qbaseflow is the same as the default hydrology Qdrain, and the default Qbaseflow is removed from the modified hydrology. This means that when the lower layers are below field capacity in the modified hydrology, there is no runoff or drainage (compared to the slow drip of Qbaseflow in the default model), retaining more water in the lower layer for plant use.
Overall, the processes in the default hydrology can be interpreted as quickflow that relatively rapidly flows to streams (Qsurf and Qdrain) and a baseflow term (Qbaseflow) that recharges groundwater that more slowly makes its way to streams. In the modified hydrology, the processes can be interpreted as Horton overland flow (Qsurf) and groundwater-mediated runoff (Qbaseflow). Groundwater-mediated runoff conceptually includes saturation overland flow (Dunne and Black, 1970), which is a groundwater-mediated flow (Lapides et al., 2022); drainage to groundwater; and any lateral flows out of the column. Without simulating groundwater levels or routing flows, this 1-D hydrology scheme allows us to simply account for runoff in a mass balance sense, although we do not know specifically which groundwater-mediated runoff mechanisms are at play in a given location without a more detailed modeling approach. Both the upper and lower layers in the modified hydrology function with a threshold drainage behavior that matches contemporary understanding of runoff generation on hillslopes (Spence, 2010).
2.2.3 Effects of the modified hydrology scheme
The change to realistic soil and weathered bedrock storage capacities from a globally uniform soil depth generally increases water storage capacity. This increase in capacity provides more space to store plant-available water that is accessible during dry periods. The changes to the hydrology scheme further act to enhance subsurface water availability to plants. First, more water percolates from the upper soil layer to the lower layer due to the increased soil transport capacity in the modified model, retaining more water in the root zone rather than immediately generating surface runoff. Second, runoff is not generated from the lower layer in the modified hydrology unless it has reached field capacity, so all unsaturated moisture below field capacity (and above wilting point) is retained for plant water use in the lower layer. The other major effect of the modified hydrology scheme is that Qsurf becomes a negligible term, and runoff is predominantly made up of Qbaseflow, which reflects better the understanding that most runoff is generated via groundwater-mediated mechanisms rather than as overland flow, particularly in areas with a Mediterranean climate (Salve et al., 2012; Hahm et al., 2022).
2.2.4 Root water uptake in LPJ-GUESS
We used the so-called “SMART” root water uptake scheme implemented in LPJ-GUESS. This maintains a key feature of the current default water uptake scheme, which is that the supply of water for transpiration is not curtailed until soil water content reaches wilting point (which stands in contrast to previous versions of LPJ and its ancestor BIOME models). In the SMART scheme, unlike the default water uptake scheme, trees are not constrained to access water according to prescribed root distributions. By removing this constraint on trees, we believe that the SMART scheme better reflects the ability of trees to forage for water throughout the available subsurface storage volume using their taproot and other coarse roots. This is supported by our finding that the SMART water uptake strategy allows transpiration to continue further into the summer (more closely matching real transpiration patterns) than any other root water uptake model implemented in LPJ-GUESS (Fig. A6 in the Appendix). This also is aligned theoretically with our approach for determining the subsurface storage capacity, which is sized to hold all of the water that plants are known to have access to. As such, trees should be able to access all of the water stored in the subsurface in either layer. Furthermore, model parsimony is improved by effectively removing the rooting depth parameters. This has the further benefit of avoiding the necessity to reconcile rooting depth profiles developed for the fixed soil layer depths in the default LPJ-GUESS model with the new subsurface structure with spatially variable layer depths. Grasses, however, follow the default root uptake behavior in which they have 90 % of their roots in the upper soil layer, with only 10 % of their roots in the lower layer. Their maximum water uptake rates are weighted by this rooting profile regardless of layer depths, implying that grasses have limited access to the lower soil/weathered bedrock water pool and can draw a maximum of 10 % of their water from it. Again we believe this is a reasonable representation of reality because, without coarse roots, grasses mostly draw water from near the surface but may be able to root deeper to some extent if needed.
2.2.5 Plant dynamics in LPJ-GUESS
LPJ-GUESS is a dynamic global vegetation model, which simulates how different plant functional types (PFTs) compete for resources (here light, water, and nitrogen). The traits of the PFTs determine which PFTs are most successful and thus reach the largest biomass or cover under given environmental conditions. For example, a summer- or raingreen phenology is beneficial in seasonal environments, and PFTs with such a phenology then outcompete evergreen PFTs because individuals grow faster. Root distributions influence the competition for water, whereby deep rooting yields more water access in Mediterranean areas with winter rain. These outcomes are not predefined, but they emerge from the functional traits of the PFTs in a given environment. The distribution of PFTs is further constrained by bioclimatic limits (adopted from Sitch et al., 2003), and disturbance by wildfires also affects vegetation dynamics.
Table 3Distributed data sources used for input to LPJ-GUESS and evaluation of results.
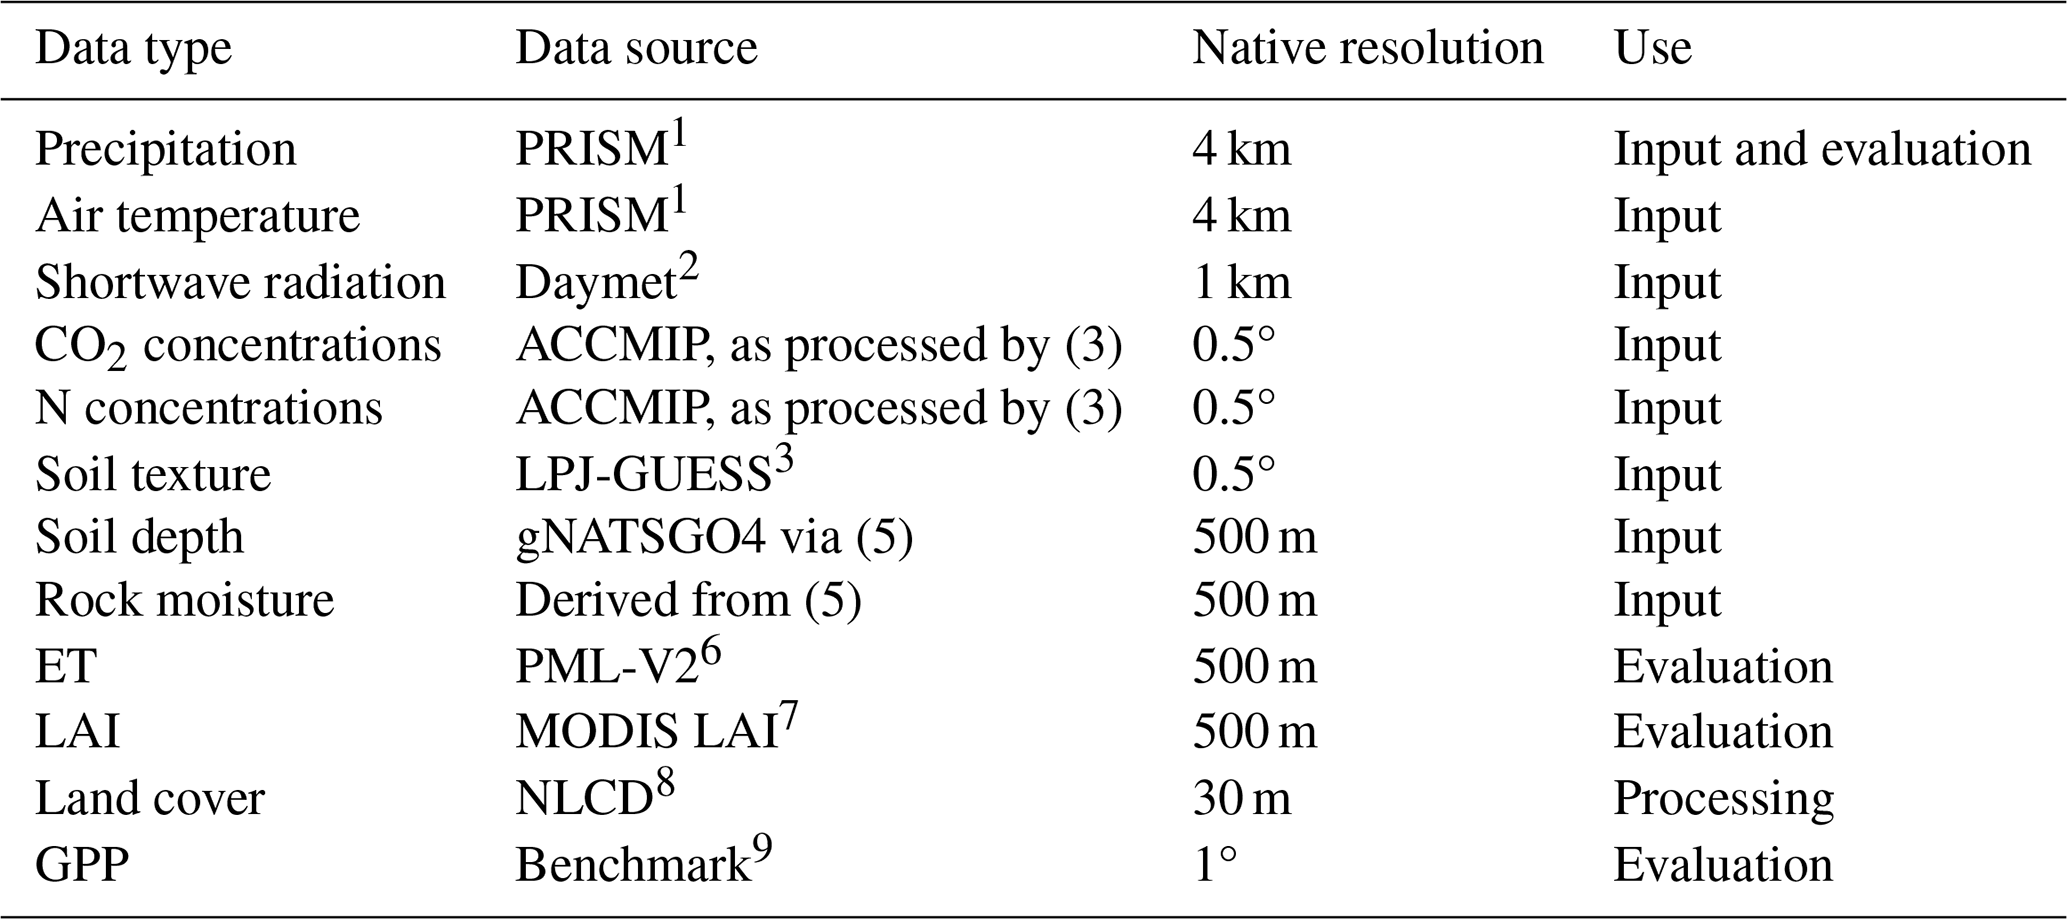
1 – PRISM Climate Group (2014); 2 – Thornton et al. (2022); 3 – Smith et al. (2014); 4 – Soil Survey Staff (2019b); 5 – McCormick et al. (2021); 6 – Zhang et al. (2019), Gan et al. (2018), and Zhang et al. (2016); 7 – Wang et al. (2022); 8 – Jin et al. (2023); and 9 – Seiler et al. (2022).
2.3 Data sources
Historical climate data for the period from 1981–2021 were compiled from the sources listed in Table 3. All data were regridded to match the 4 km grid used for the PRISM dataset since that is the lowest-resolution forcing data source. PRISM precipitation and PML-V2 have been found to perform well for mass balance closure compared with USGS streamflow gages (Rempe et al., 2023). For case study model runs, soil depth and rock moisture were derived from field-based estimates (Rempe and Dietrich, 2018; Dralle et al., 2018; Hahm et al., 2019, 2020). For CONUS model runs, soil depth and rock moisture are derived from the datasets available through Dralle et al. (2021), including the downsampled gNATSGO (Soil Survey Staff, 2019b) and rock moisture storage. We masked out areas where evapotranspiration (ET) exceeds precipitation (P) over the period 2003–2017 and areas with negative estimated rock moisture storage. These criteria help to ensure that ET is not supplemented significantly by irrigation and that pixels with negative rock moisture storage estimates are not fed into LPJ-GUESS. We then converted the rock moisture storage capacity to a depth for the lower layer using the soil texture characteristics, as specified by Sitch et al. (2003). Since plant water access is not restricted by depth within the second soil layer, it is important only that the storage capacity of the lower layer is reflective of natural conditions, not its depth. For this reason, it is convenient to use the same soil texture for both layers since depth can be tuned to achieve the correct storage. Prior to model evaluation, we masked out pixels classified as open water, developed, or cultivated land cover types in the National Land Cover Database (Jin et al., 2023).
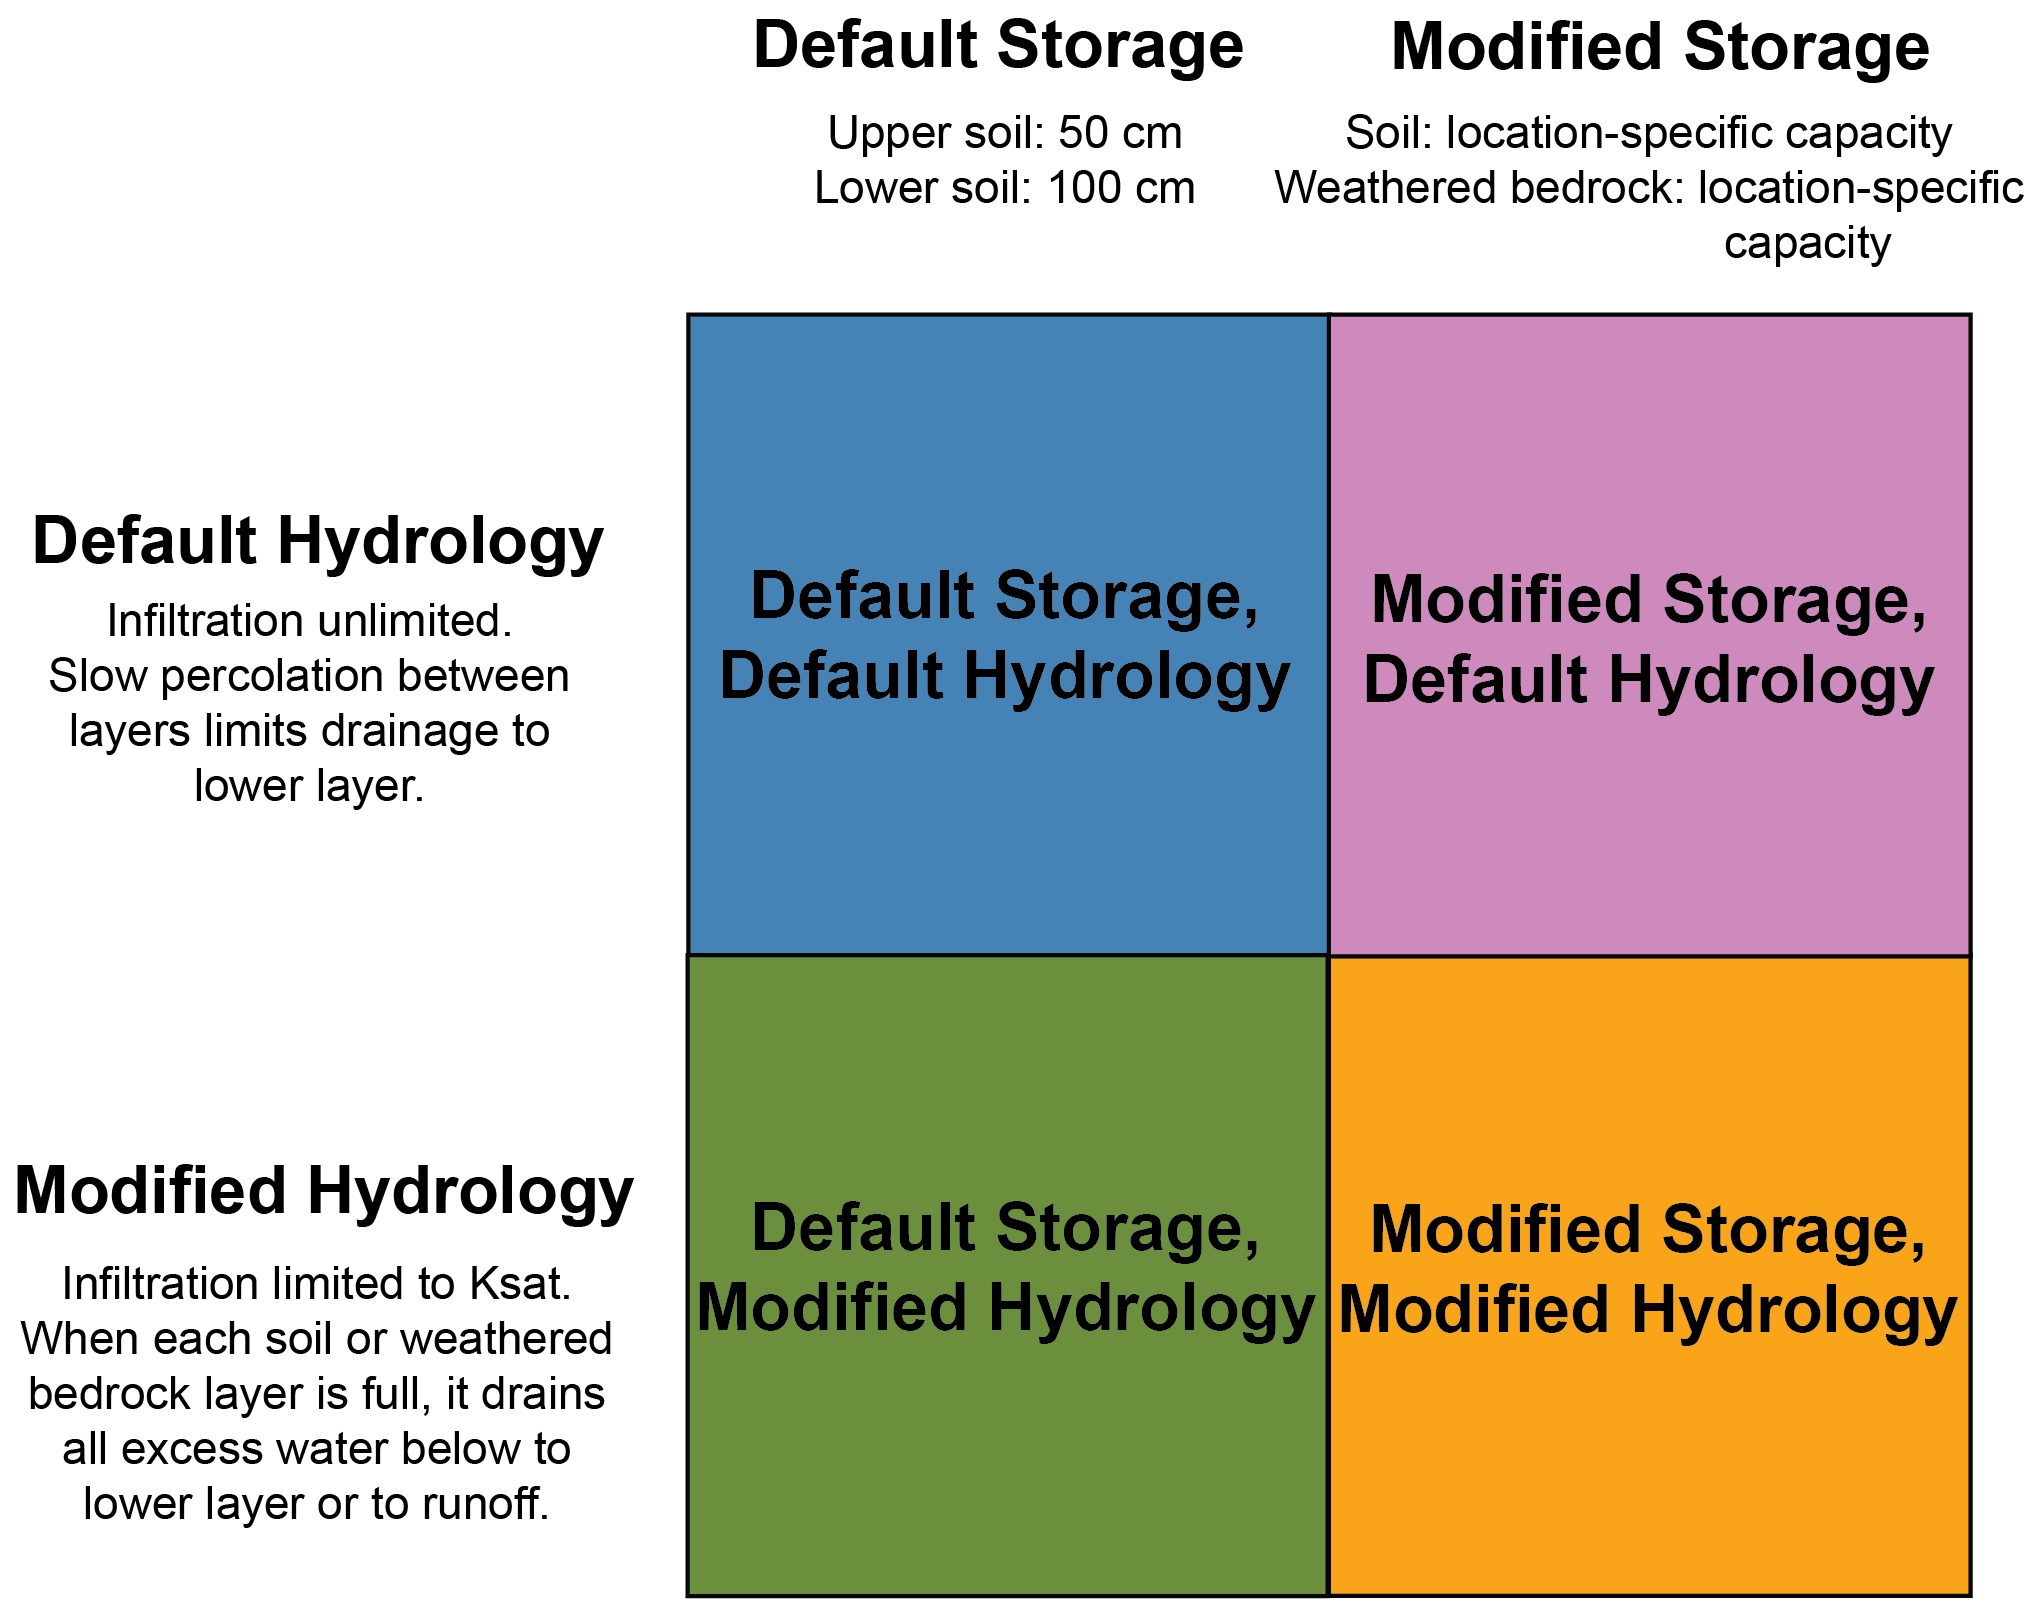
Figure 3Key to describe the four model structures used in this study as combinations of two hydrology schemes (rows) and two storage structures (columns). Colors correspond to the colors used to represent each model structure in Sect. 2.4. More details about the model structures can be found in Sect. 2.2.
2.4 Model runs
We ran LPJ-GUESS for case study sites at Elder Creek and Dry Creek and then across CONUS. For all model runs, the nitrogen cycle was enabled, and land use was not included, so simulation results represent potential natural vegetation. For all locations, we ran four different simulations based on the same climate data for the period 1981–2021 using a 500-year spin-up period. Results are shown as a mean over the period 1981–2021. These simulations include each combination of the default storage capacity and hydrology and the modified storage capacity and hydrology: (i) default storage capacity and hydrology; (ii) modified storage capacity with default hydrology; (iii) default storage capacity with modified hydrology; and (iv) modified storage capacity and hydrology, as shown in Fig. 3. For the case study locations both in reality and in the model, climate is nearly the same at both sites, and the soil texture is the same. This means that the model runs with default storage capacity (i, iii) are essentially identical for the two sites, so only a single output is shown to represent these cases in the case study results.
2.5 Model evaluation
Case study results for Elder Creek and Dry Creek were evaluated based on field observations of plant communities. All output was evaluated based on the comparison between mean annual and mean summer (July–September) ET signatures produced by LPJ-GUESS and the distributed ET data product PML-V2 (Zhang et al., 2019) for the full study period (1981–2021). Pixel-wise annual runoff was estimated as mean annual evapotranspiration from PML-V2 subtracted from mean annual precipitation from PRISM. This estimated annual runoff was also used for validation purposes, given the introduction of a new hydrology scheme (see Fig. A1). Since there is no saturated zone model, stream routing algorithm, or lateral flow in LPJ-GUESS, the absolute timing of runoff cannot be compared directly to hydrograph data, but integrated seasonal and annual runoff totals should approximate basin-scale runoff, which has been proven to be an appropriate approach at the coarse scale at which the model often is applied (0.5°, i.e., roughly 50 km pixels; Gerten et al., 2004). When comparing LPJ-GUESS modeled ET to PML-V2, output data were restricted to the period 2000–2021 for which PML-V2 is available.
For the case study sites, vegetation community composition was assessed using MODIS leaf area index (LAI) (Myneni et al., 2021), with a mean and standard deviation LAI of 4.4 ± 0.85 for Elder Creek and 1.6 ± 0.19 for Dry Creek. Based on field observations, we estimated a fraction of LAI expected for trees vs. grass at each site. For Elder Creek, given nearly full forest cover, we expect that 75 %–100 % of LAI is accounted for by trees. At Dry Creek, given the oak woodland structure, we expected that 10 %–50 % of LAI is accounted for by trees.
We used annual runoff from mass balance between PRISM P and PML-V2 ET for comparison with LPJ-GUESS runoff and annual and summer ET from PML-V2 for comparison with LPJ-GUESS ET to evaluate model performance based on Kling–Gupta efficiency (KGE; Gupta et al., 2009) and a spatial distribution metric (Seiler et al., 2022).
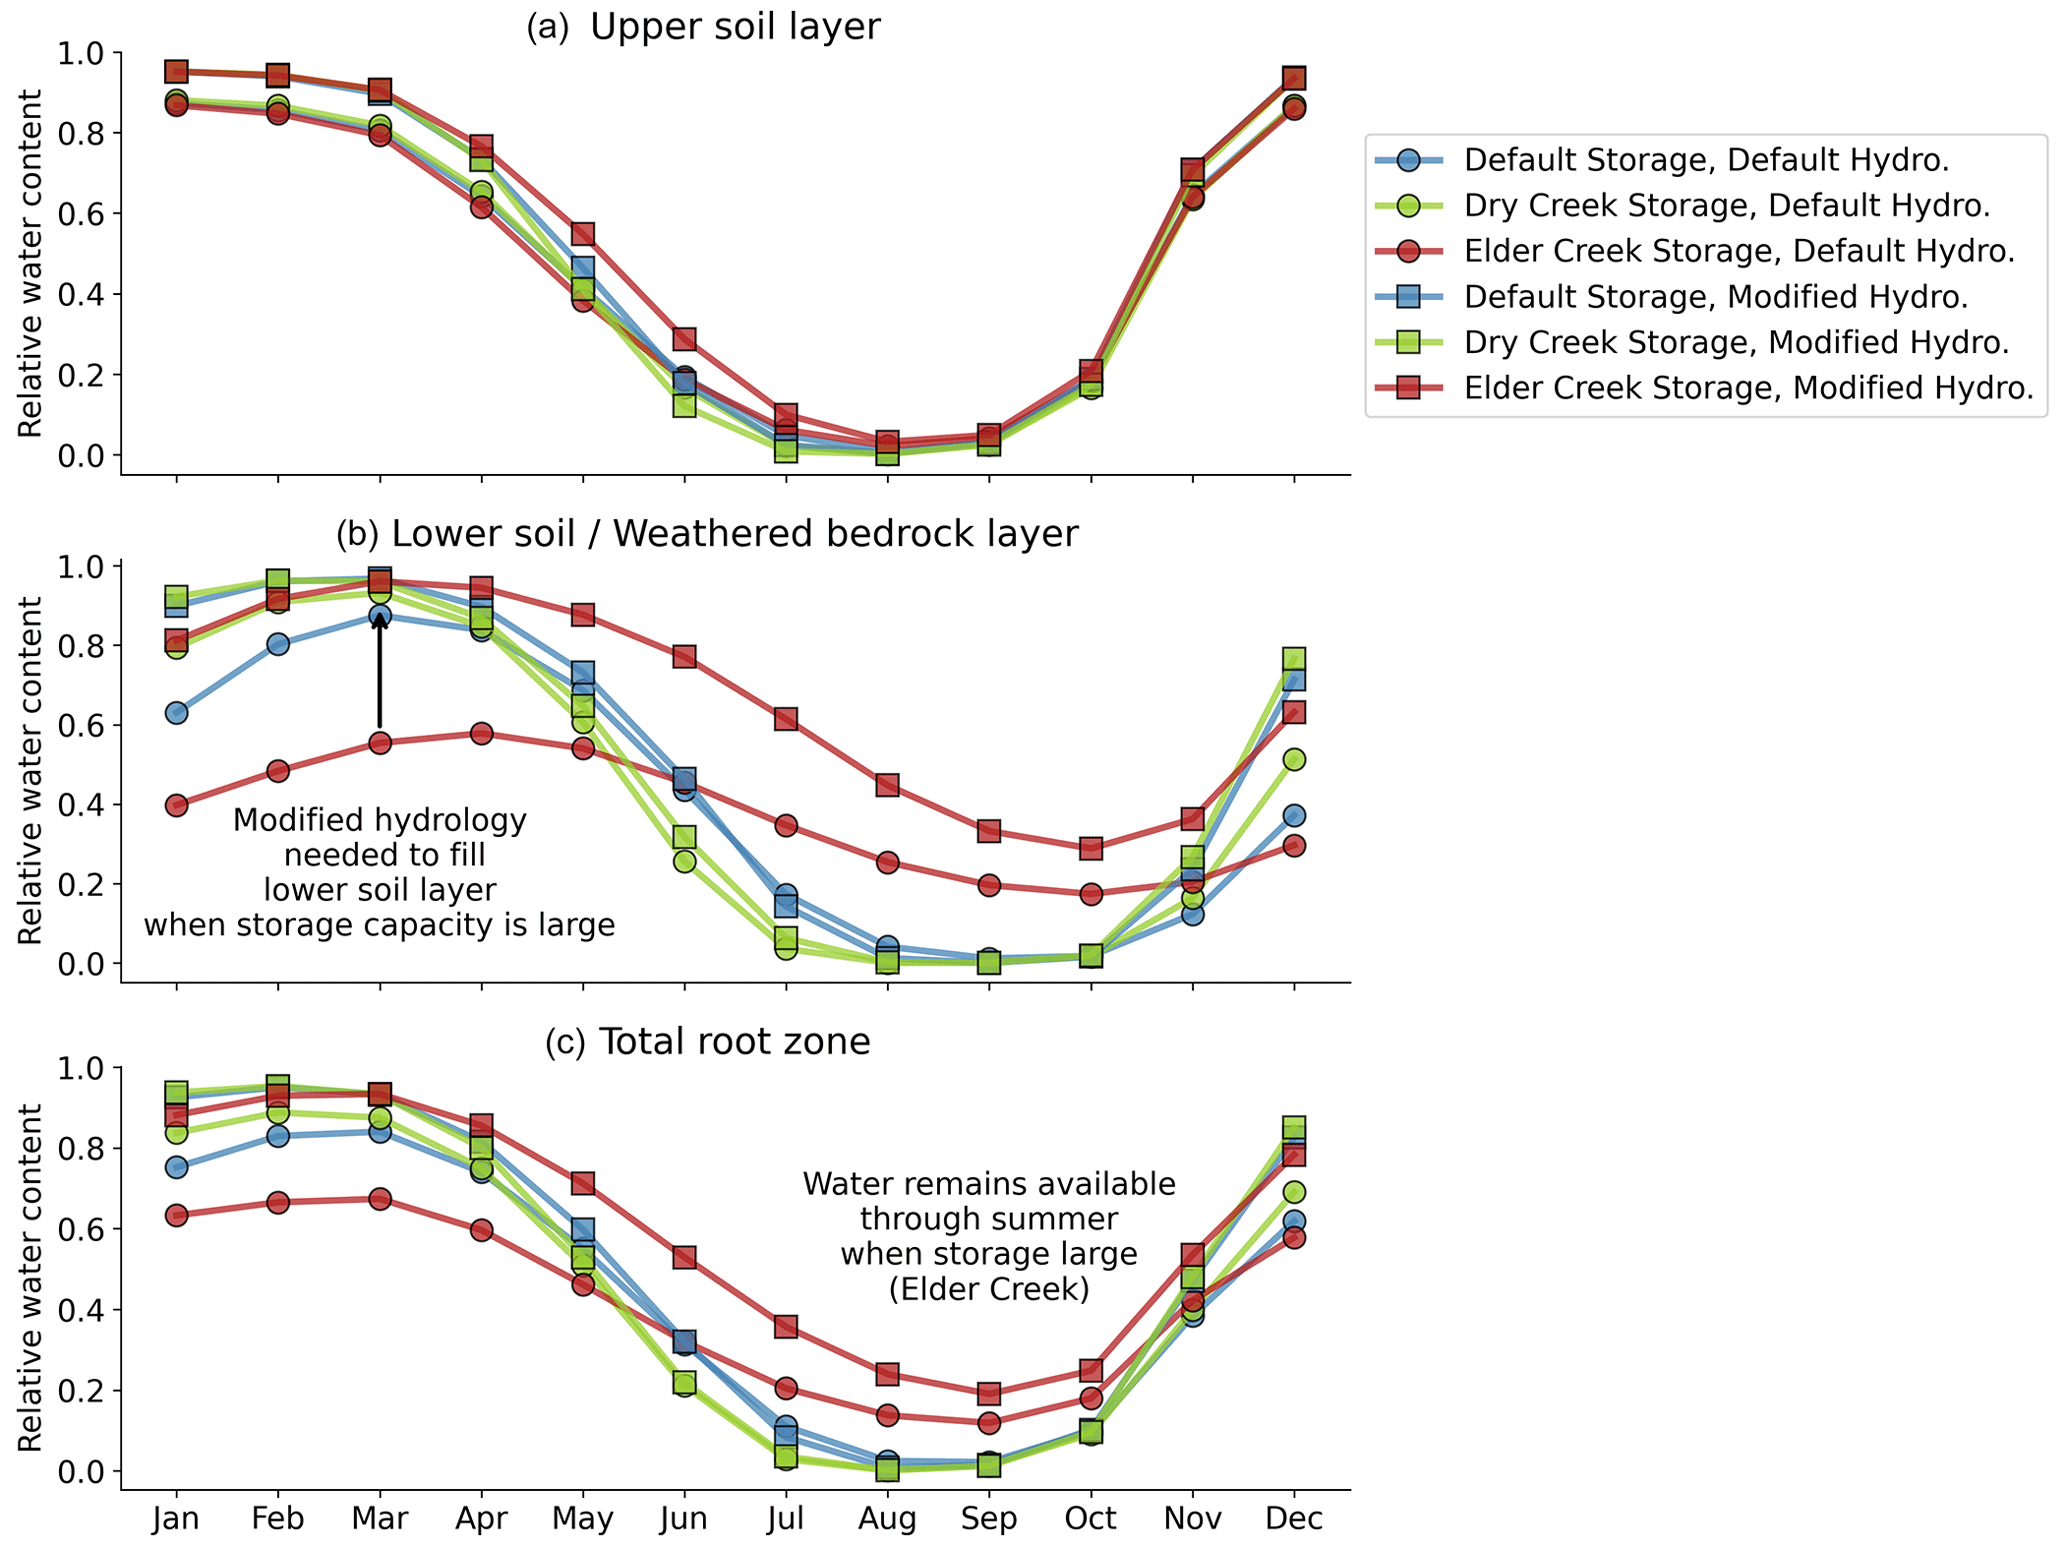
Figure 4Monthly mean relative water content in the (a) upper soil layer, (b) lower soil or weathered bedrock layer, and (c) total root zone for each model setup. Squares denote the modified hydrology scheme, and circles denote the default hydrology scheme. Color indicates the subsurface storage, with blue default, green Dry Creek, and red Elder Creek. Default and Dry Creek water contents go to zero in the summer for both hydrology schemes. Only the large storage capacity for Elder Creek allows for sustained water supply through the summer. By comparing the circles and squares for each storage, it is clear that more water enters the lower layer with the modified hydrology scheme in the wet season, leading to enhanced water availability even with the same storage.
3.1 Modified hydrology increases plant-available storage
The modified hydrology scheme increases infiltration into the lower soil/weathered bedrock layer. This is clear to see in the case study results (compare squares to circles for each color in Fig. 4b). The increase in available water becomes larger as the size of the lower layer increases from Dry Creek (green) to default (blue) to Elder Creek (red). The observation that (with the modified hydrology) all curves meet the maximum relative water content at the end of the wet season in March in Fig. 4c indicates that the climate is able to supply water to fill larger subsurface storage. Thus, at Elder Creek, increasing total root-zone storage capacity substantially increases plant-available water, especially through the summer as water use draws down storage. These same observations hold across the contiguous United States (CONUS; see Fig. A5 in the Appendix).
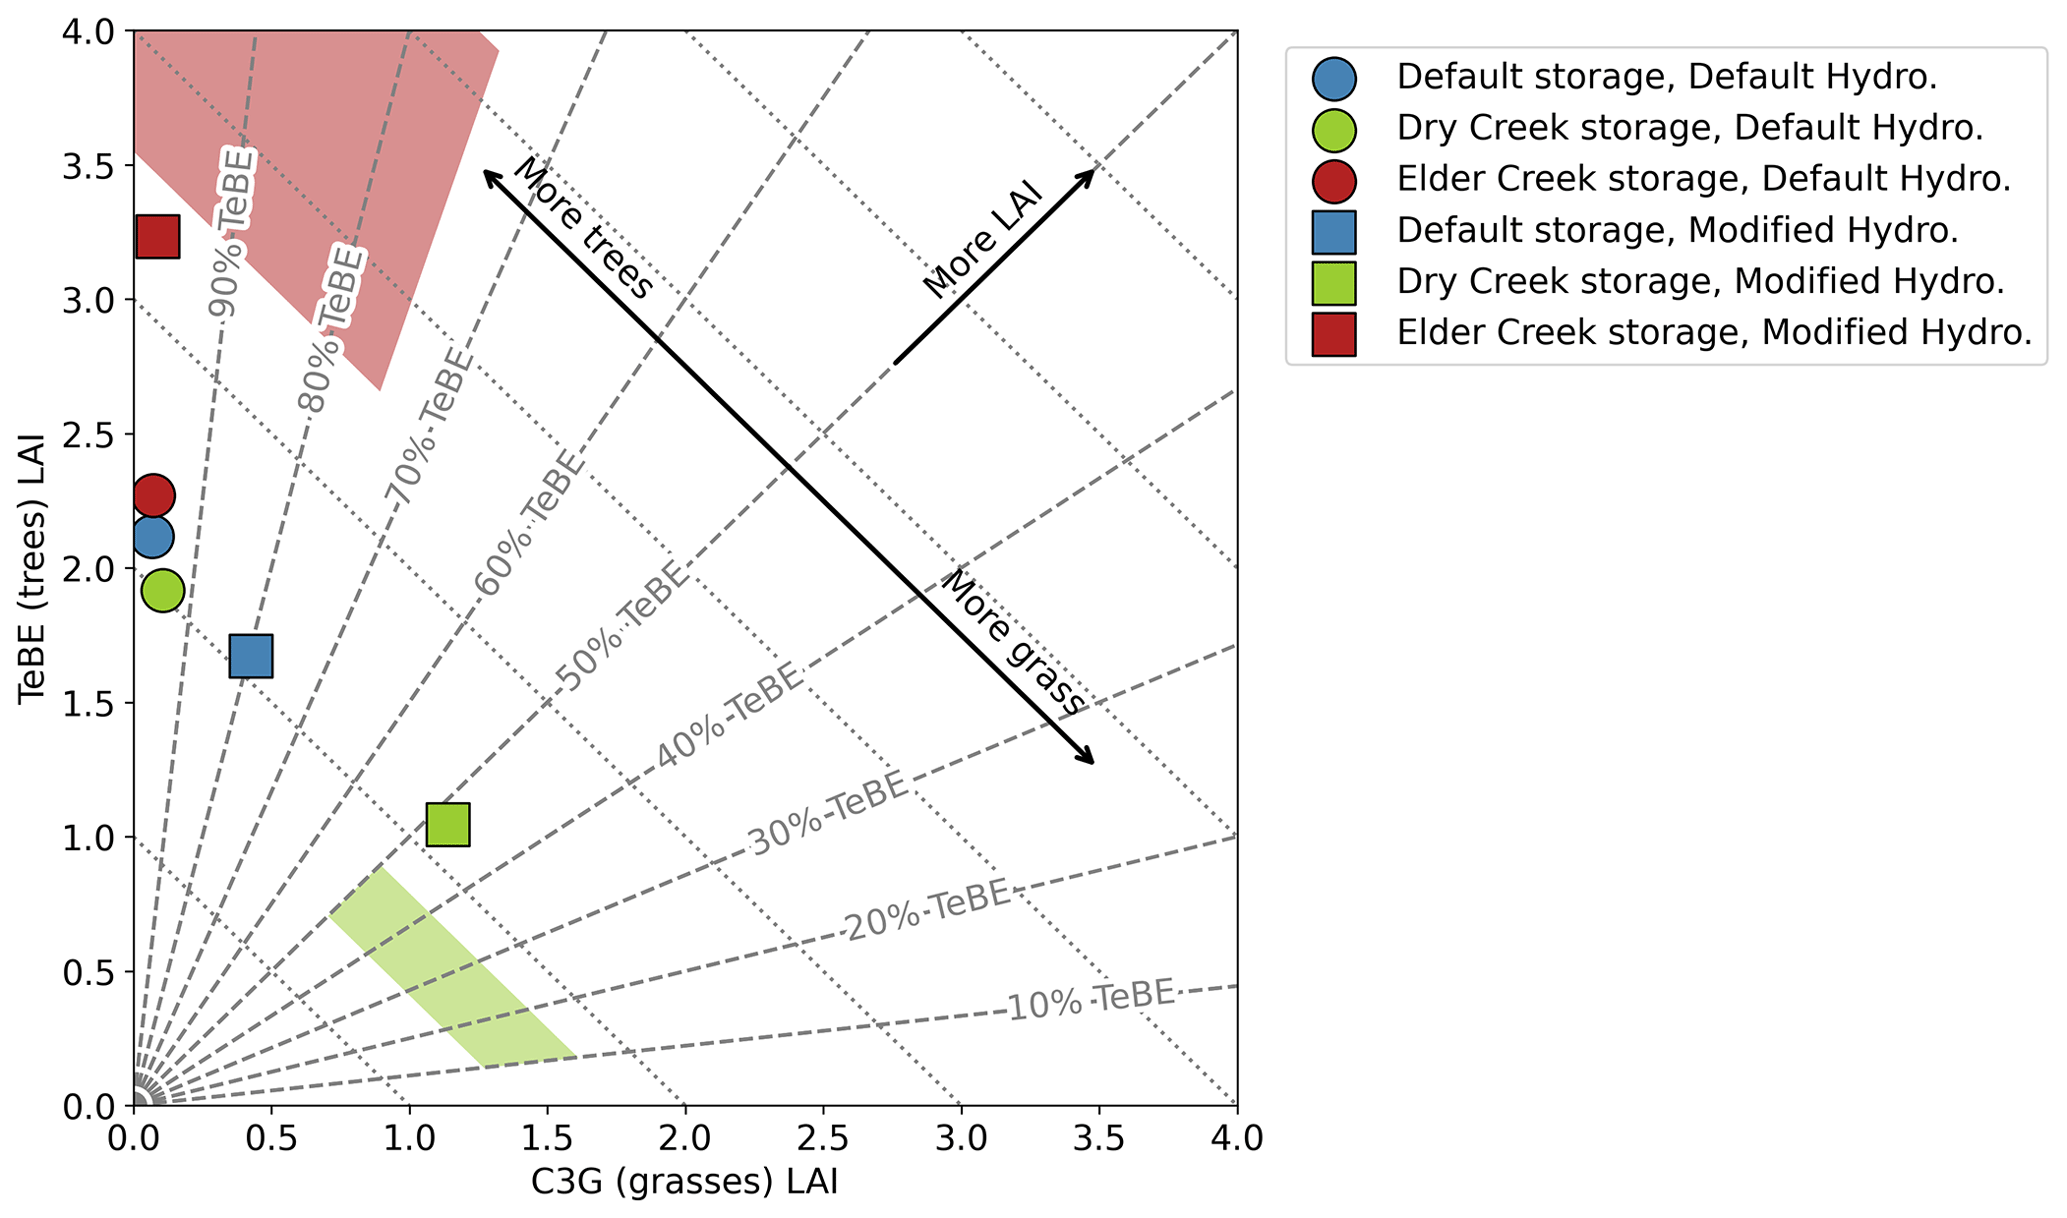
Figure 5Predicted vegetation community, as measured by fraction of LAI devoted to C3G (C3 grass) vs. TeBE (temperate broadleaf evergreen tree). The shaded regions denote the actual vegetation community composition at (red) Elder Creek and (green) Dry Creek, estimated from field observations. Dotted lines indicate lines of constant total LAI, and dashed lines indicate lines of constant ratio between TeBE and C3G. Default model configuration (blue circle) does not closely match either the Dry Creek or Elder Creek biome. It is necessary to modify both the hydrology scheme (squares) and the subsurface storage capacity (red for Elder Creek and green for Dry Creek) to achieve the best match to the actual vegetation community.
3.2 Modified hydrology results in more accurate representation of plant community
Enhanced moisture availability results in improvements to the representation of the plant community composition. For the case study areas, this can be represented as a position in a 2-D space relating the LAI of grasses and trees (Fig. 5). Shaded regions denote the estimated space in which plant community should fall for (red) Elder Creek and (green) Dry Creek, based on MODIS LAI and field expertise. Using the default storage capacity, LPJ-GUESS predicts the same plant community for Elder Creek and Dry Creek (blue) with essentially all trees with the default hydrology (blue circle) and about 80 % trees with the modified hydrology (blue square). With the modified storage capacity but the default hydrology, Dry Creek (green circle) and Elder Creek (red circle) are still very similar to the default storage capacity vegetation community, although Elder Creek has slightly higher LAI than Dry Creek. With the modified storage capacity and hydrology, however, vegetation communities for Elder Creek and Dry Creek are substantially different, with nearly 100 % trees at Elder Creek and less than 50 % trees at Dry Creek. LAI at Dry Creek is also significantly lower than that at Elder Creek. Neither prediction falls exactly in the shaded region for the site; however these results clearly distinguish the high- and low-storage sites.
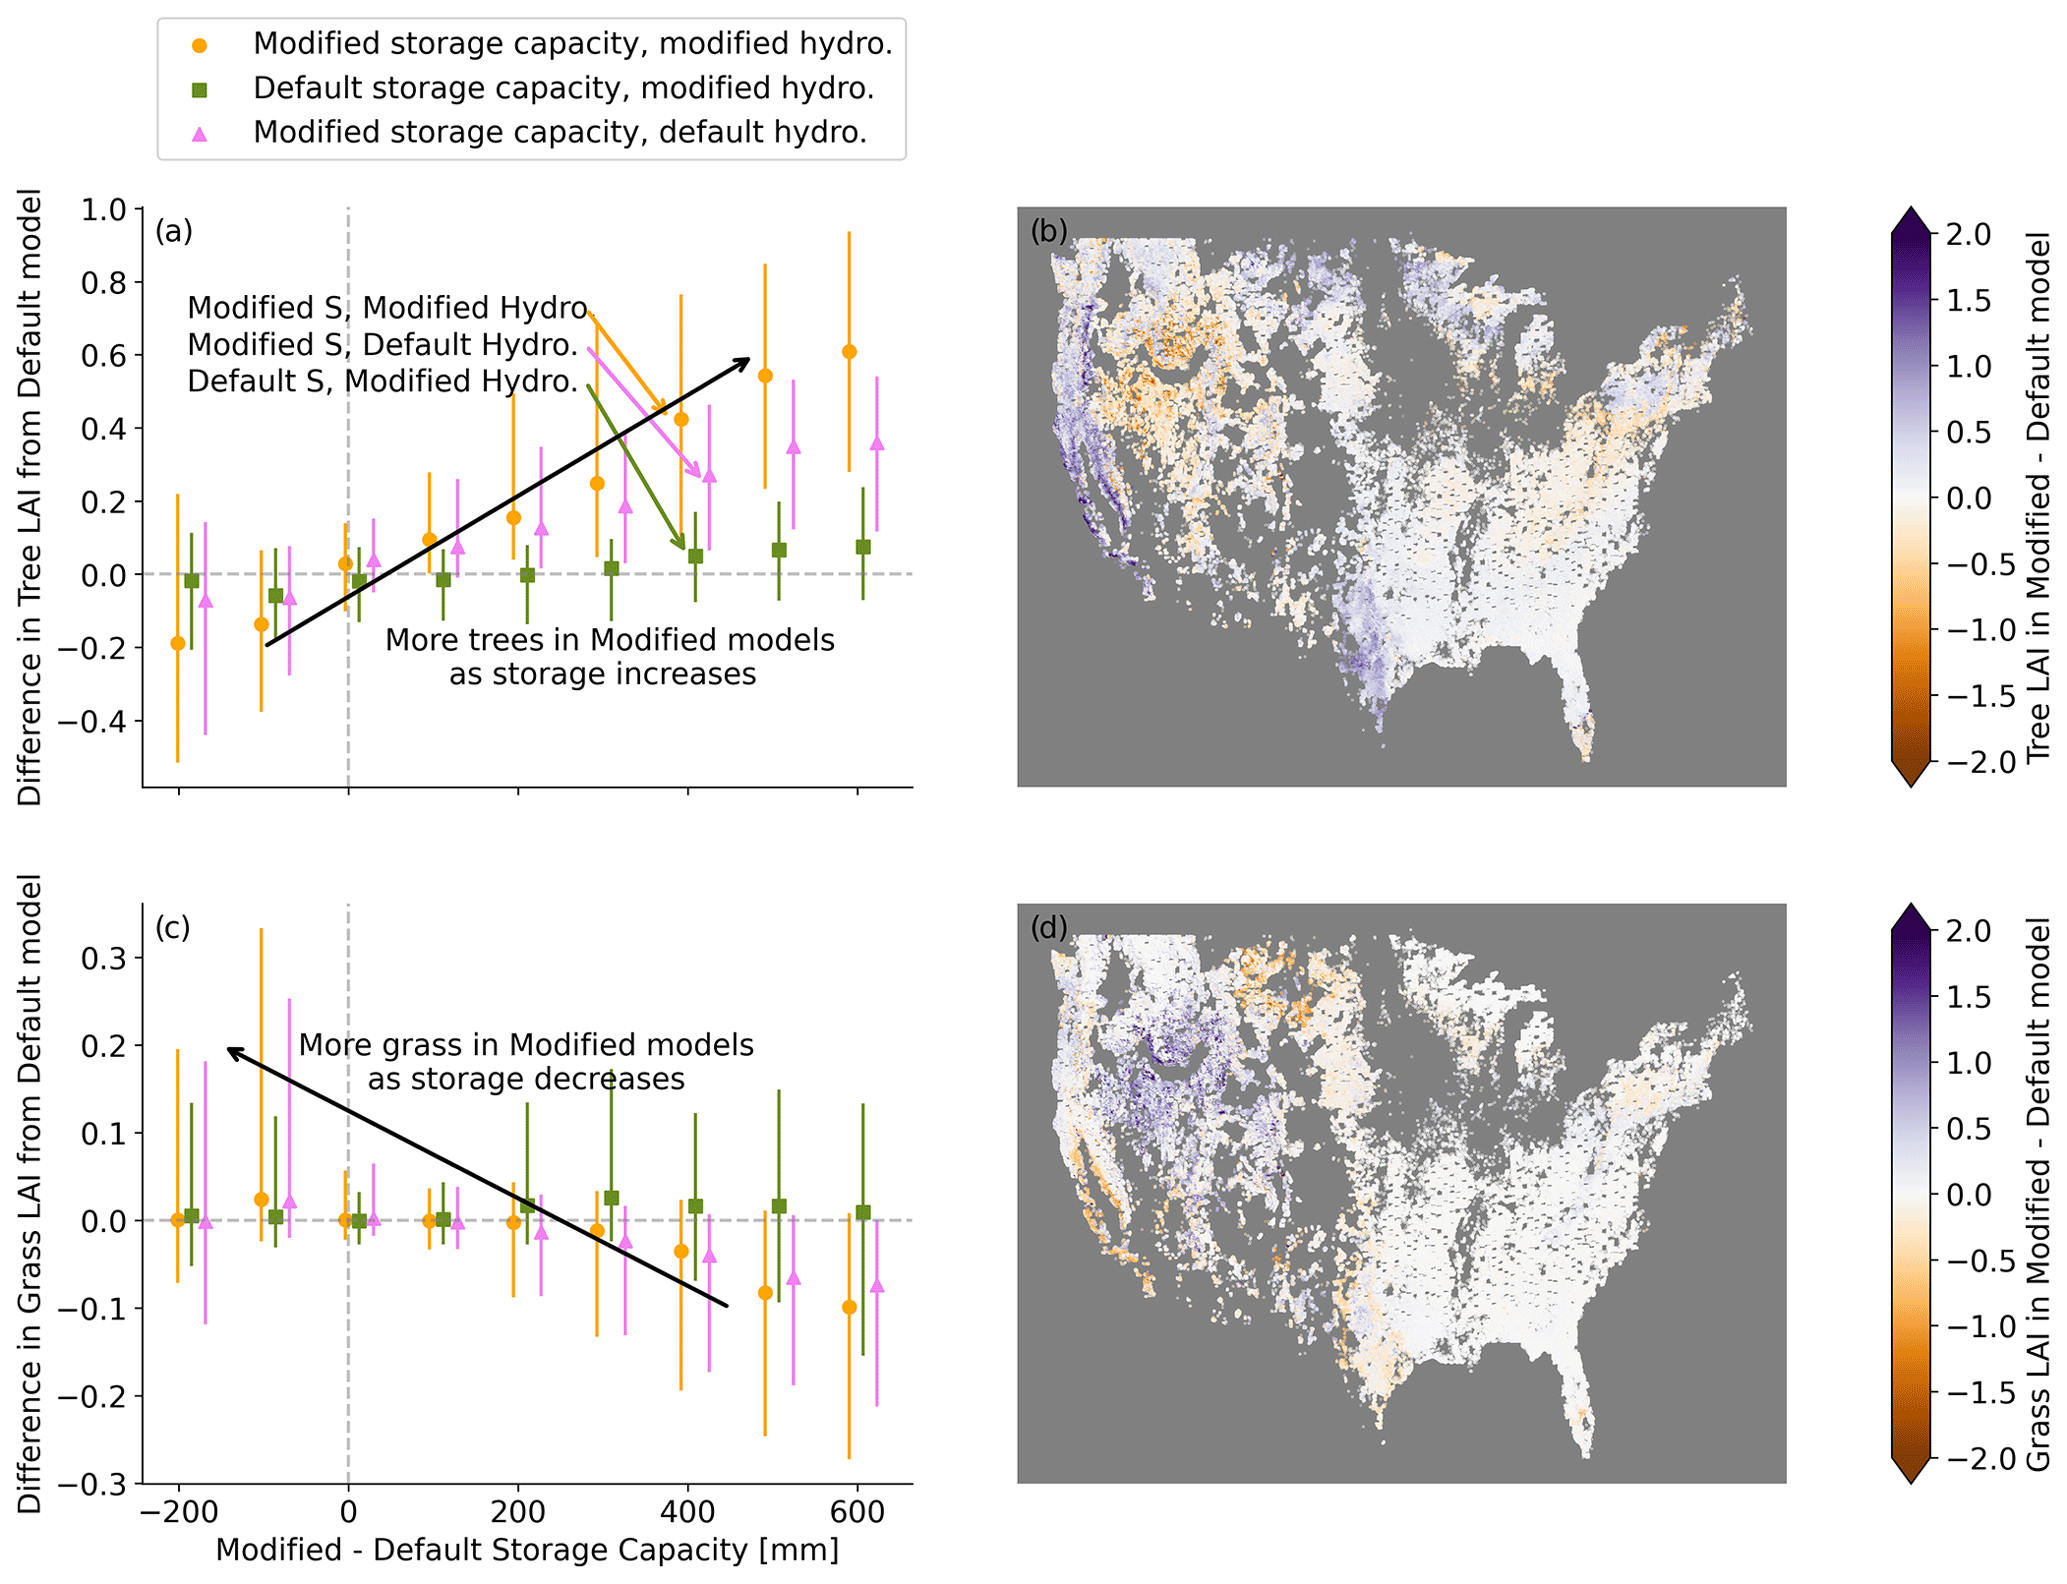
Figure 6Modifications to hydrology and subsurface storage capacity impact the modeled plant community across CONUS. (a) As the modified storage capacity grows relative to the default, more trees are supported. When storage capacity decreases, fewer trees are supported. Conversely, in (b) there is more grass at lower storage capacity and less grass at higher capacity. Panels (b) and (d) show the spatial patterns of changes in vegetation. In (b), more trees are supported along the west coast and in Texas, while fewer trees are supported in the Great Basin. In (c), more grass is supported in the Great Basin. In (a) and (c), points mark median value for each bin, and the range spans the 25th–75th percentile.
Across CONUS, greater storage capacity is related to an increase in trees (Fig. 6a), as was found at the Elder Creek site. Conversely, where storage capacity decreases (as with Dry Creek), the community shifts towards more grass (Fig. 6c). Increases in trees are largest in Texas and California (Fig. 6b), the same places where enhancements in ET are strongest. Increases in grass are centered in the Great Basin (Fig. 6d).
At both the case studies and across CONUS, Figs. 4–6 indicate that it is necessary to incorporate both the modified hydrology and the modified storage capacity in order to achieve best performance. Throughout the remainder of the results, we will show results only for the fully default model and the fully modified model.
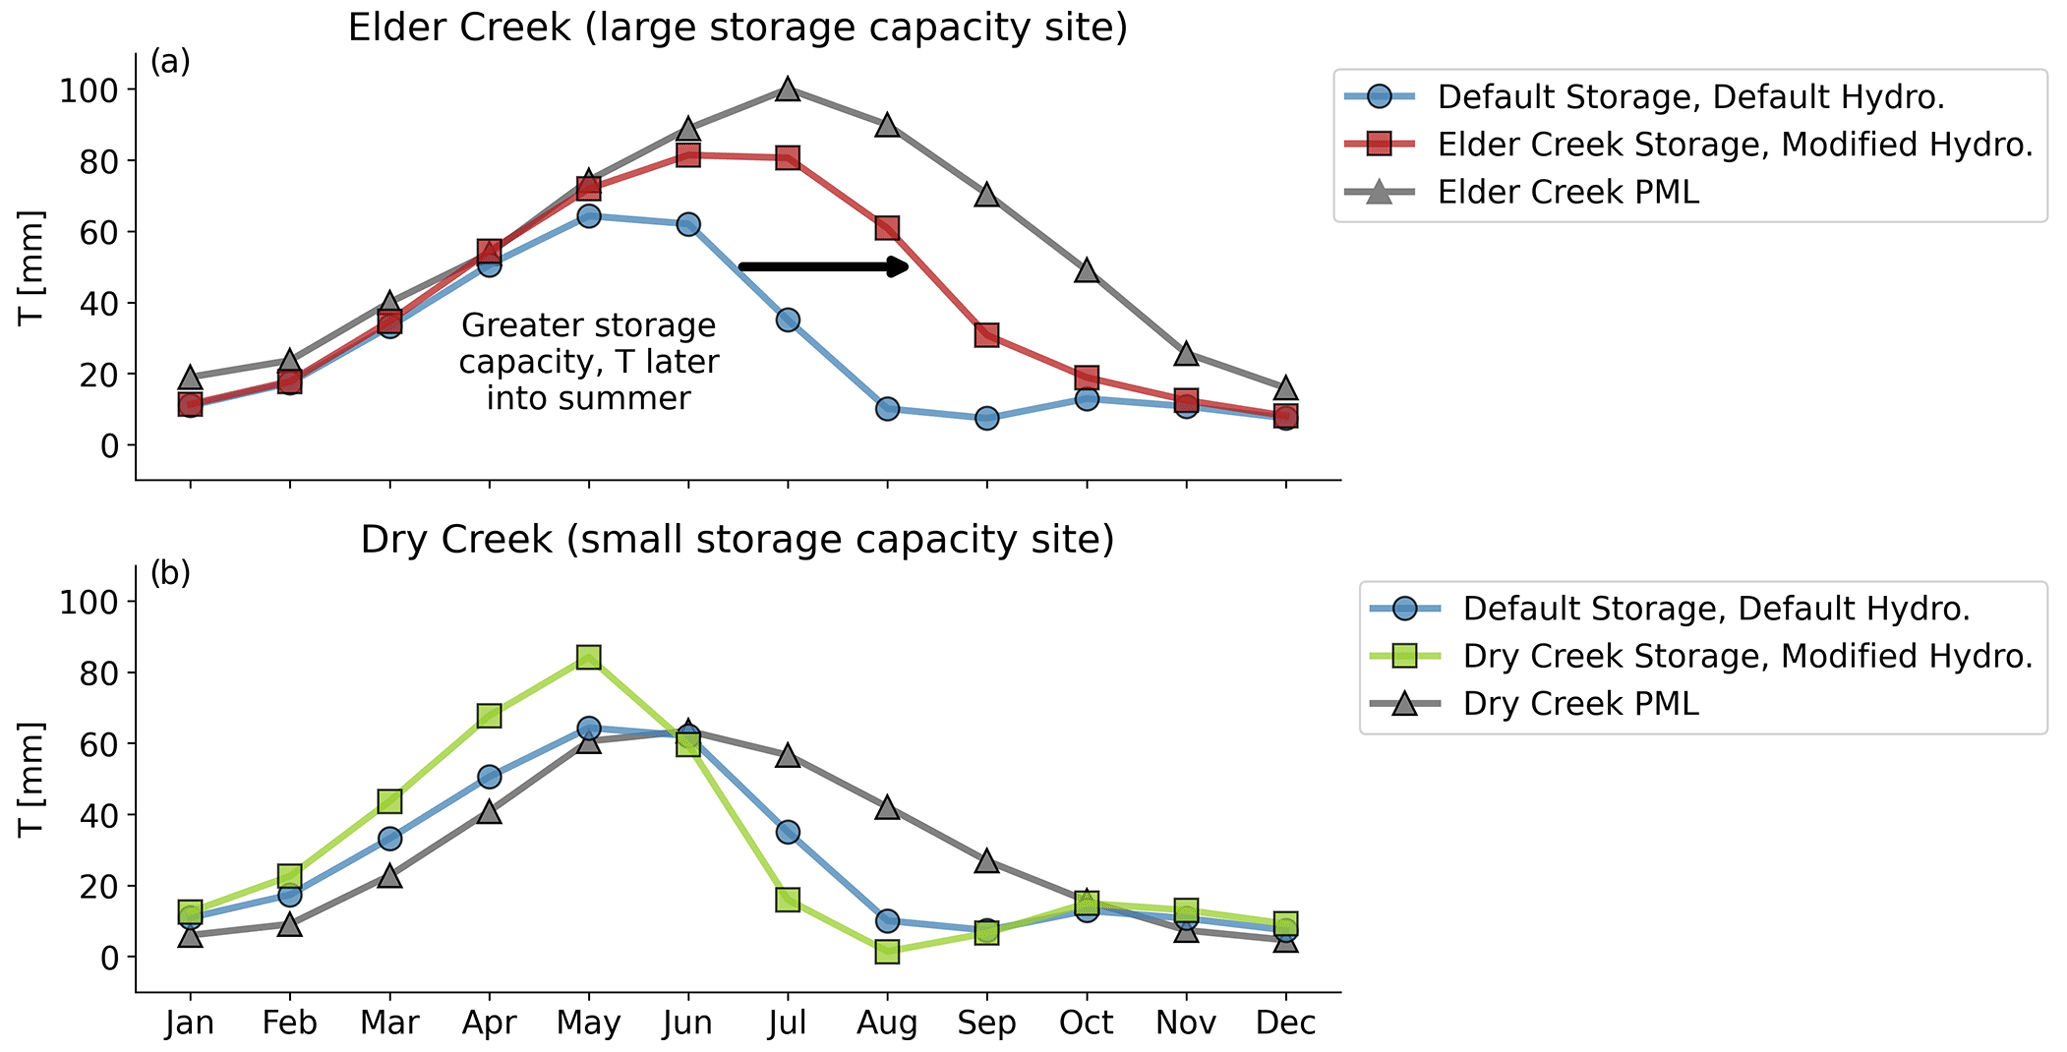
Figure 7Comparison between average monthly ET as estimated by LPJ-GUESS using different storage and hydrology and from PML-V2 for (a) Elder Creek, which has a large subsurface storage capacity, and (b) Dry Creek, which has a small subsurface storage capacity. Transpiration from PML (black triangles) shows sustained T (transpiration) into the dry season. LPJ-GUESS best approximates this behavior at Elder Creek with both greater subsurface storage capacity and the modified hydrology routine.
3.3 More plant-accessible water results in more transpiration
Enhanced water availability (along with the modified hydrology) translates into overall greater plant transpiration at the case study sites (transpiration T; Fig. 7a and b). As storage capacity increases from Dry Creek (green) to default (blue) to Elder Creek (red), T shifts later into the summer, better matching T derived from the satellite-derived product PML-V2 (Zhang et al., 2019).
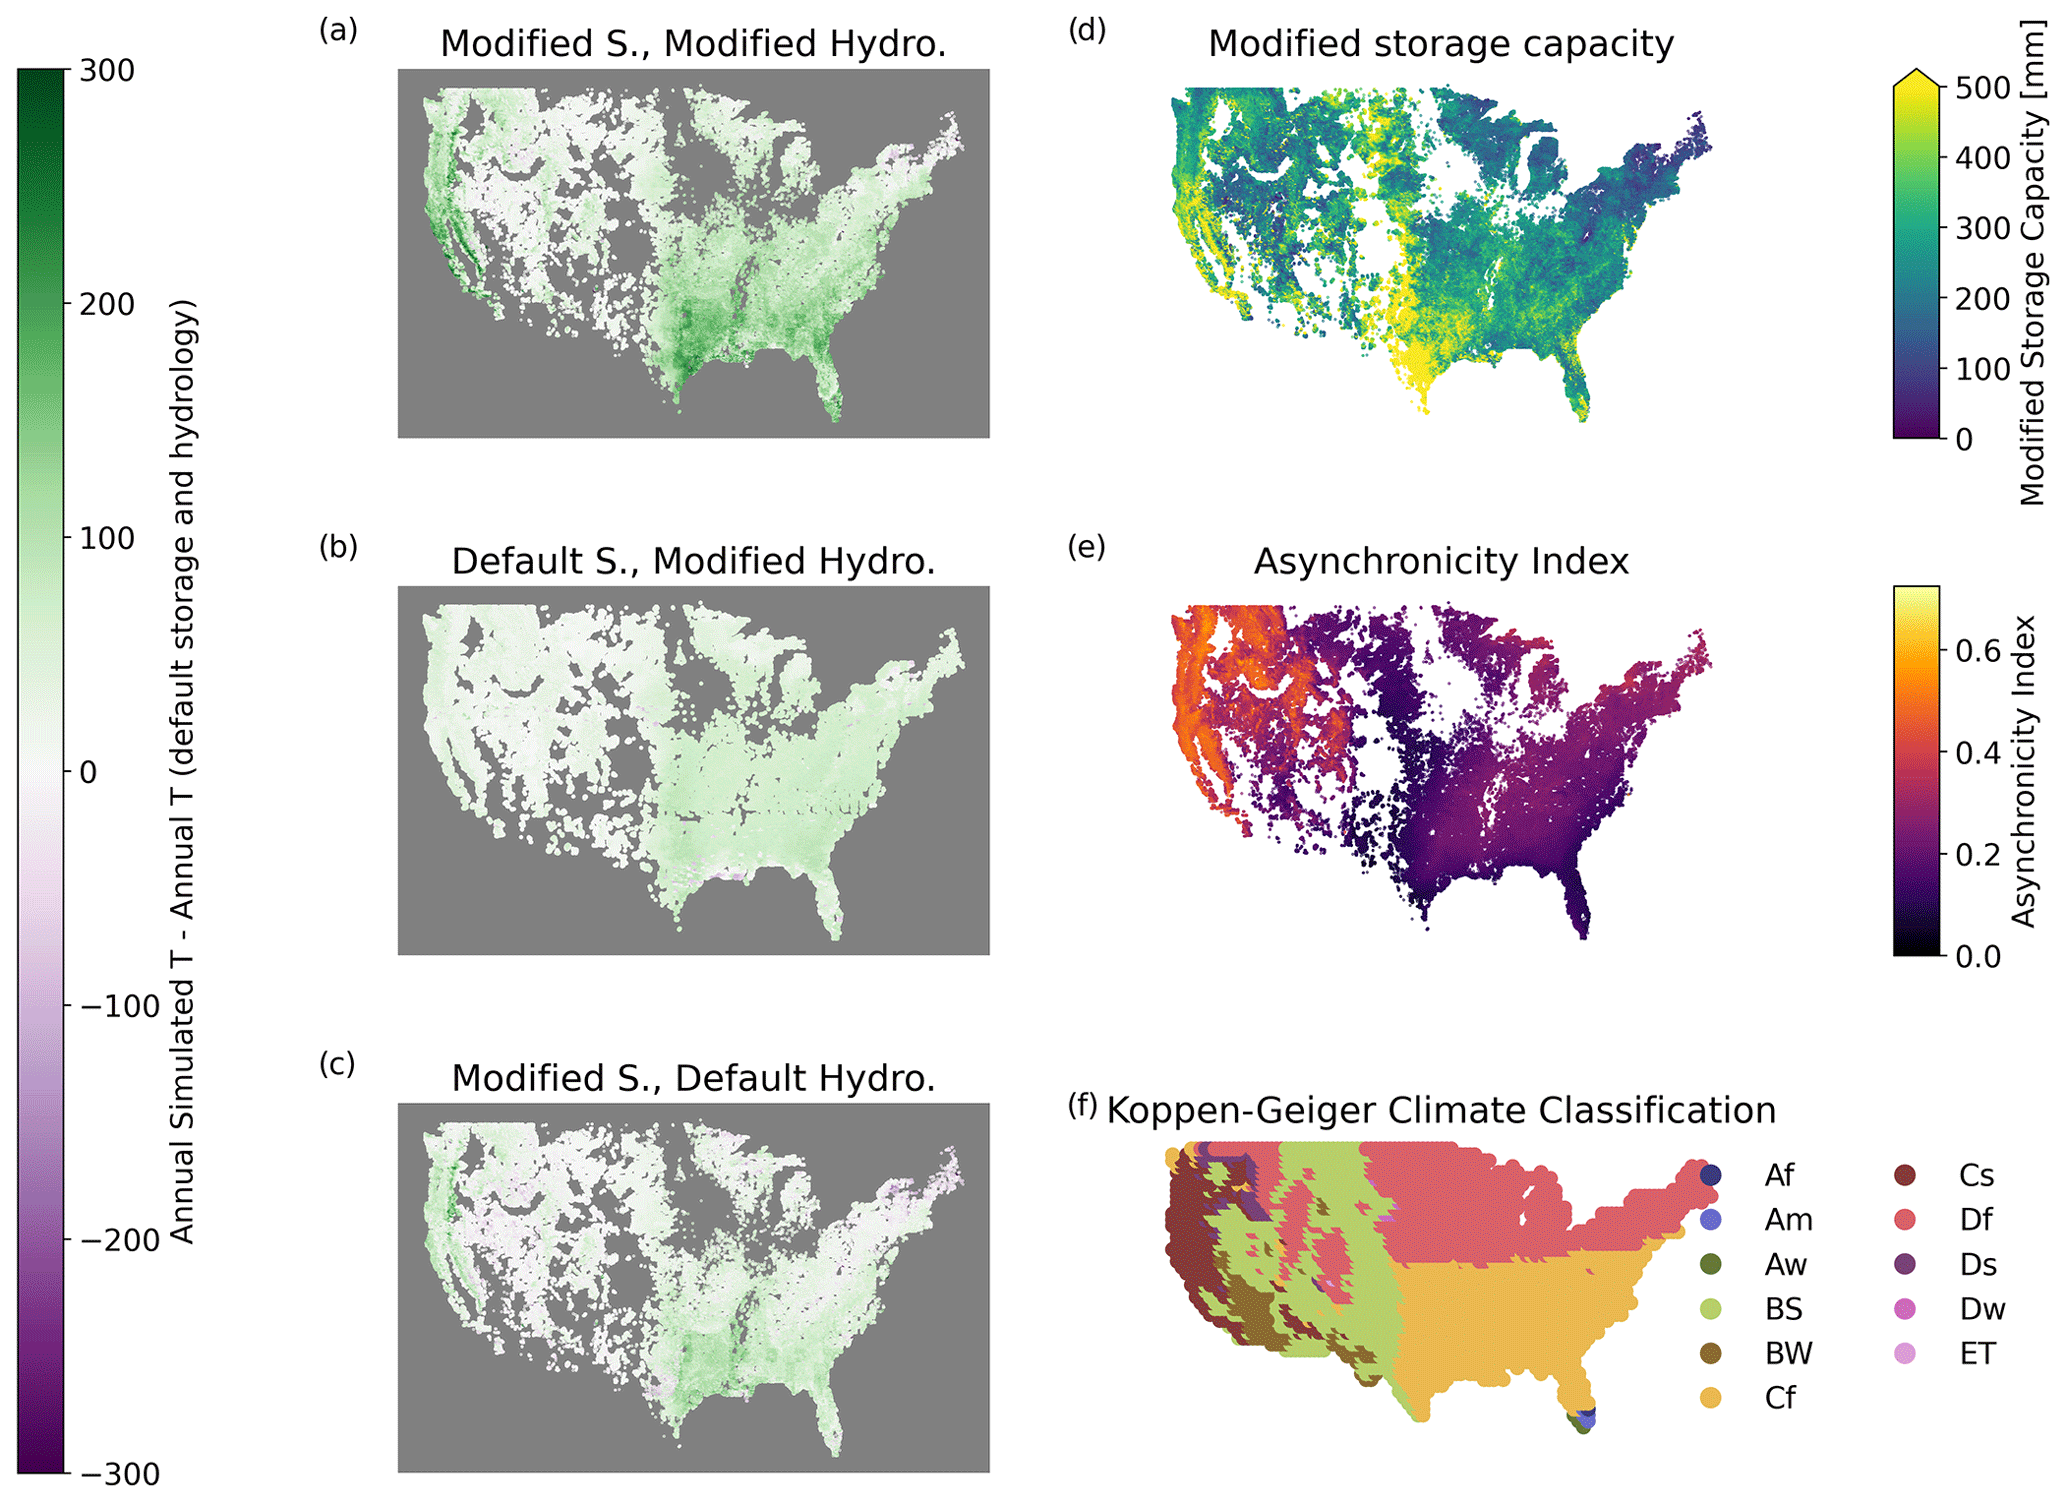
Figure 8(a–c) Difference in simulated annual T between each modified simulation and the simulation with default storage capacity and hydrology. In (a), regions with the largest enhancement in T from modifications to storage and hydrology include the west coast, Texas, and the southeast. (d) Root-zone storage used for the modified storage capacity, as described in Sect. 2.3. The largest storage capacities are found in California and in a vertical band running north from Texas. (e) Asynchronicity index, demonstrating difference in seasonality between ET and precipitation at each pixel, following Feng et al. (2019). See Sect. 2.3 for more detail. (f) Koppen–Geiger climate classification from Kottek et al. (2006). Symbols are defined as follows: Af – tropical rainforest; Am – tropical monsoon; Aw – tropical savanna; BS – dry semi-arid; BW – dry arid desert; Cf – temperate no dry season; Cs – temperate dry summer; Df – continental no dry season; Ds – continental dry summer; ET – polar tundra.
With modified storage capacity and hydrology, T is enhanced across CONUS relative to the default model (Figs. 8a–c and A4 in the Appendix), with a median increase of 100–150 mm annually. This effect is particularly notable in the late-summer months, when monthly T can increase by a median of 20 mm. As with the case study, both modified hydrology (Fig. 8b) and modified storage capacity (Fig. 8c) result in generally greater T, with an additive effect between both changes resulting in strong increases in ET along the west coast, Texas, and the southeast (Fig. 8a). The regions with the greatest increase in ET match with the areas with highest storage capacity in the modified storage capacity model (Fig. 8d). The effect is strongest in the intersection between areas with large root-zone storage capacity and high asynchronicity index (Fig. 8e). T increases are largely limited to temperate dry summer and temperate no-dry-season climates (Fig. 8f).
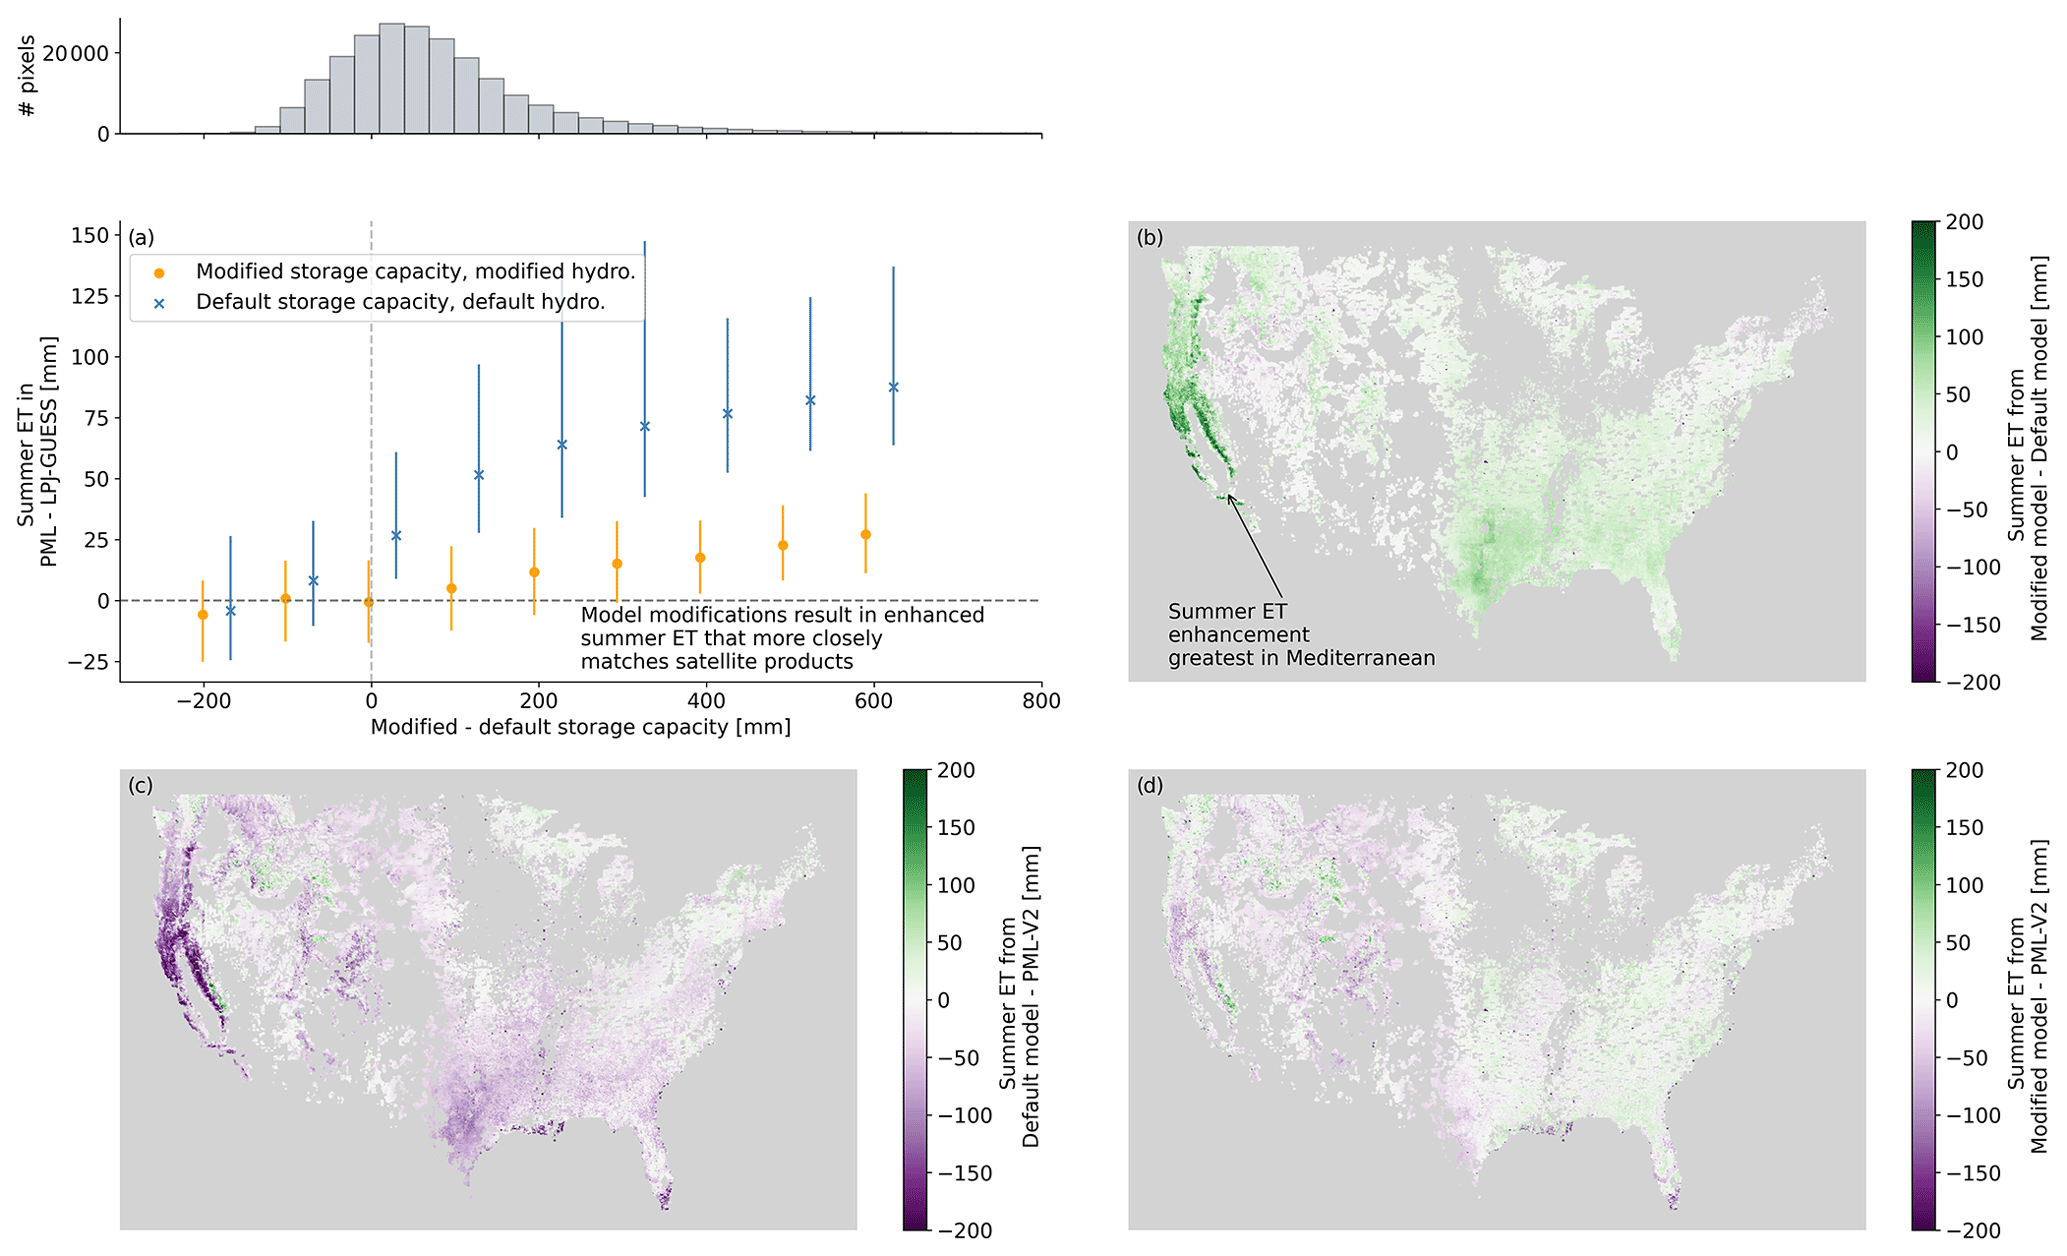
Figure 9(a) Difference in summer ET between each simulation and ET from PML-V2 across CONUS. Points mark median value, and the range shown spans the 25th–75th percentile. Summer is defined as July–September. As the change in storage capacity grows, the difference in summer ET between PML-V2 and the default model grows as well, with the default model underpredicting ET by an average of about 80 mm. The histogram above shows the distribution of pixels across the storage differences from the default model. (b) A map of the difference between summer ET in the fully modified model and in the default model. The most important summer gains are along the west coast, particularly in California. Differences between summer ET as modeled by PML-V2 and (c) the default model and (d) the modified model.
To compare with the satellite-derived product PML-V2 product, we use the modeled ET, which includes, in addition to T, modeled soil evaporation and interception. While we generally report changes in T to highlight the plant response, we compare ET from LPJ-GUESS to PML-V2 to ensure that different partitioning between evaporation and T does not affect the comparison. The increase in summer T results in more accurate summer ET (July–September) across CONUS when compared to PML-V2 (Fig. 9a). KGE between mean annual summer ET from LPJ-GUESS and PML-V2 improves from 0.27 for the standard model to 0.89 with the modified model (see Table A1 in the Appendix for more details). As the difference in storage capacity between the modified and default models increases, the fit between PML-V2 and the default LPJ-GUESS summer ET becomes worse, with the highest median error around 100 mm from July–September (Fig. 9a). With modified storage capacity and hydrology, the fit is much better, and median errors nearly vanish until the largest storage capacity bins (Fig. 9a). Across CONUS, these error reductions are strongest in the west and western Texas, although improvements are visible across most of the area (Fig. 9c and d). The change in storage capacity between the modified and default models does an excellent job determining how large of a change there will be to summer ET (Fig. 9a), so places with little change in summer ET are those where the storage change was negative or very small. In terms of overall model performance, summer ET improvements with the fully modified model drive strong model improvements, although annual runoff and overall ET performance is slightly decreased (Appendix A).
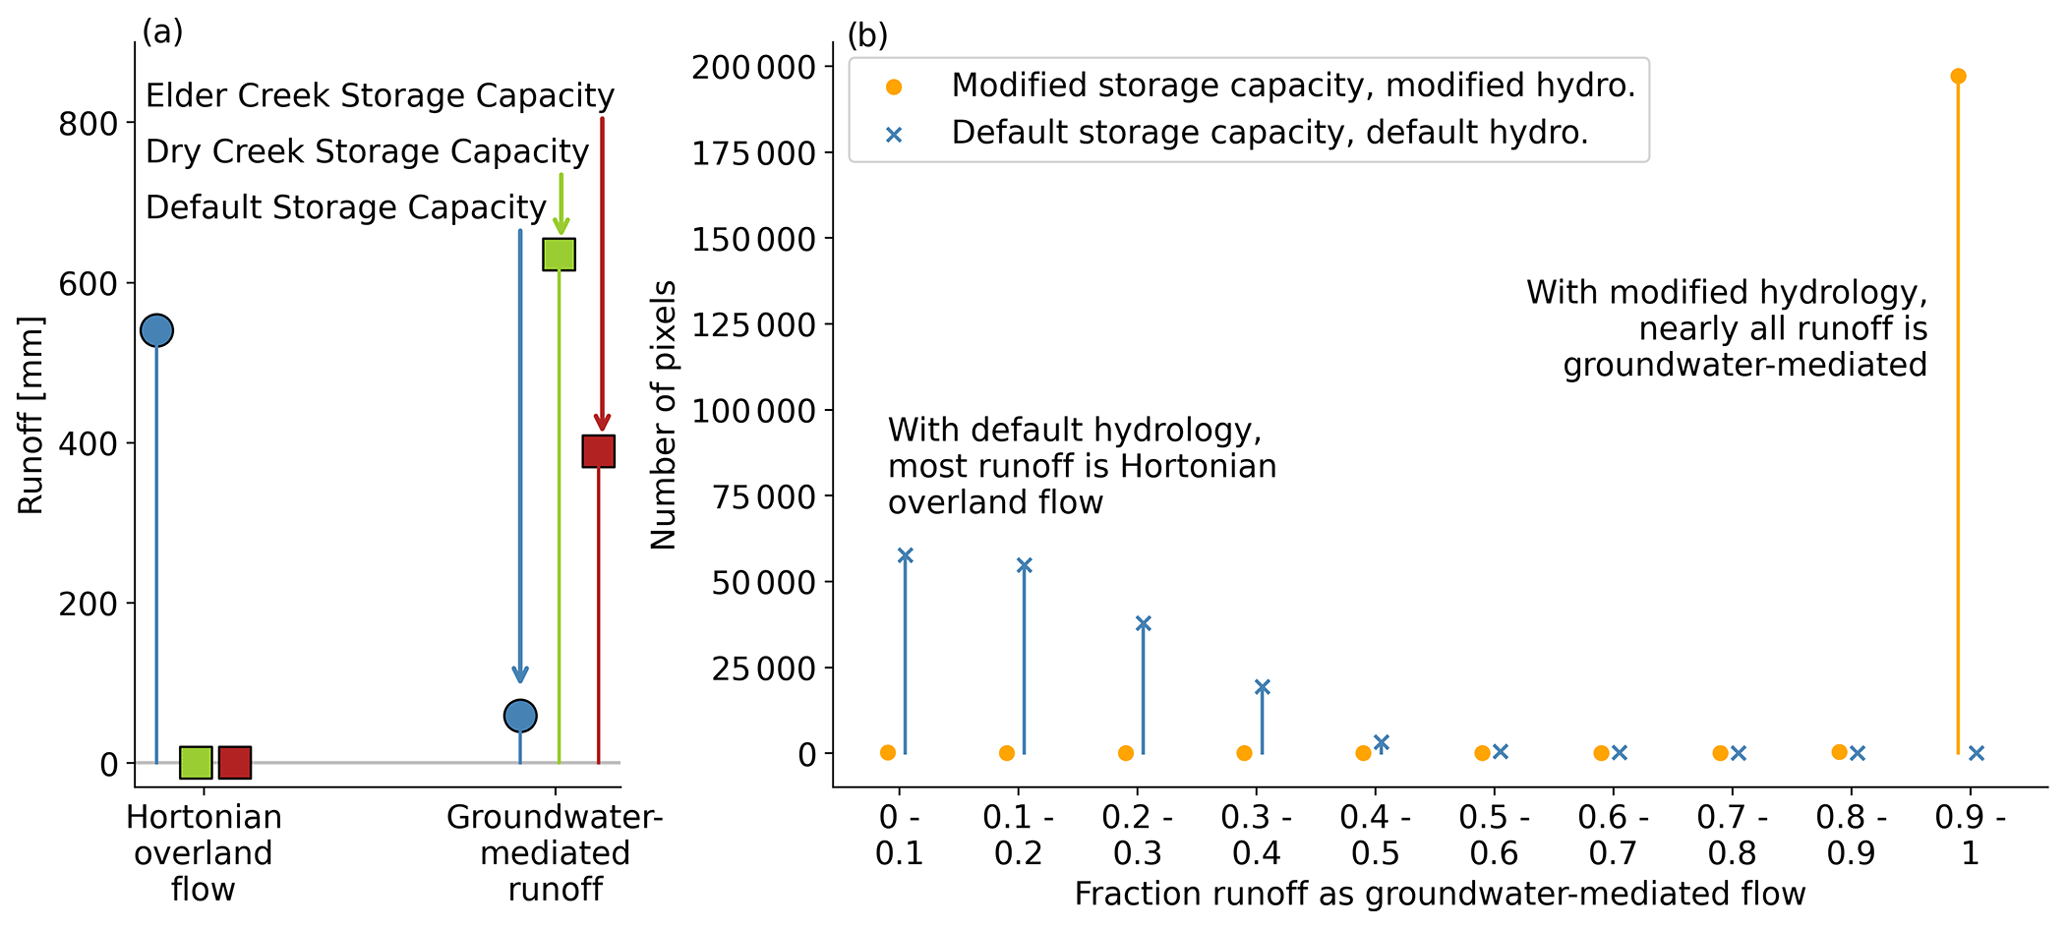
Figure 10Evaluation of runoff partitioning between surface flows and groundwater-mediated flows in the different model setups for (a) the case study sites and (b) across CONUS. With the modified hydrology scheme (squares in panel a, orange circle and green square in panel b), essentially all runoff is groundwater-mediated, whereas most runoff is Horton overland flow in the default model (circles in panel a, violet triangle and blue x in panel b).
3.4 When using modified hydrology, interpretation of dominant runoff generation mechanisms is dramatically different
The modified hydrology scheme results in a massive shift in the runoff generation mechanism from mostly Horton overland flow to essentially all groundwater-mediation runoff (Fig. 10). This change matches our understanding of runoff generation at Elder Creek (Salve et al., 2012) and Dry Creek (Lapides et al., 2022), where Horton overland flow does not occur (Hahm et al., 2019; Dralle et al., 2018). More generally, the prevalence of groundwater-mediated runoff matches the contemporary understanding of runoff processes in upland, vegetated landscapes.
4.1 Where is it most important to account for rock moisture?
Across CONUS, the largest enhancements in transpiration (T) with the modified storage and hydrology occurred along the west coast and in Texas with other visible gains around the southeast (Fig. 8a). Both the west coast and Texas experience long dry periods with substantial precipitation in between (Kottek et al., 2006). However, annual patterns of precipitation delivery are markedly different. On the west coast, precipitation is delivered primarily in the winter with a predictably dry summer (Kottek et al., 2006), whereas in Texas, dry periods are scattered throughout the year. Thus, for both areas, the ability to store more water allows for sustained T through dry periods when plants can continue to transpire water stored underground. For the west coast, the dry period is specifically the summer, so the enhancement in T is particularly clear when examining summer ET only (Fig. 9b), whereas the increase in ET is spread throughout the year for Texas and the southeast. Regardless of the seasonal pattern, enhanced water availability allows for enhanced T and representation of a lusher vegetation community particularly where dry periods are common and storage capacity is large. The resulting impact on the water cycle can be large (more than 100 mm more T per year; Fig. A4a in the Appendix), corresponding to a large change in modeled vegetation community (Fig. 6), net primary productivity (Fig. A2), and carbon storage (Fig. A3).
4.2 Further improvements to LPJ-GUESS needed to capture late-summer ET
In the Elder Creek case study, transpiration (T) is extended later into the summer when using the modified storage and hydrology (Fig. 7). However, T from LPJ-GUESS still drops before T from PML-V2. This behavior holds for the sites across CONUS with the largest storage, where summer ET is still underestimated by LPJ-GUESS relative to PML-V2 (Fig. 9). It is possible that PML-V2 may overestimate the extent to which T continues through the late summer (MODIS may overestimate late-summer T; Link et al., 2014). However, if T does continue further into the summer at sites with large storage capacity, what limits this late-summer T in LPJ-GUESS?
The case study root-zone moisture time series provide a clue. For Dry Creek and default storage capacity, all storage water was used up in the summer (Fig. 4c). This drop in available storage corresponded to a drop in T. At Elder Creek, T also drops before the end of the summer, but significant water remains in storage (Fig. 4c). This is true for minimum storage at large-storage-capacity sites across CONUS, where up to a median of about 200 mm of storage remained even at the driest time of year (Fig. A5c in the Appendix). Since simulated transpiration is given by the smaller of water supply or demand, the fact that the supply was not used up indicates that the model identified demand-limited (rather than supply-limited) conditions. This observation indicates that the limitation on late-summer T was no longer water availability but something related to plant physiology or root water uptake. To rule out root distribution or water uptake strategy, we perturbed the root distributions (10 %, 40 %, and 90 % of roots in top soil layer) and applied three of the built-in water uptake schemes (SMART – used in this study –, root-distribution-based, and water-content-based) in the case study sites. Across all of these permutations, none resulted in an enhanced transpiration signal that extends later into the dry season than the results presented in the main text (see Appendix C), indicating that plant physiology routines are driving the downregulation of T late in the summer. Therefore, the limitation on late-summer T must be related to a rate limitation from photosynthetic pathways that may not be well-represented in LPJ-GUESS since they are still not fully understood in water-limited conditions (Tezara et al., 1999; Tuzet et al., 2003; Pappas et al., 2013; Zweifel et al., 2006; Vico and Porporato, 2008; Lawlor and Tezara, 2009; Keenan et al., 2010; McDowell, 2011; Tardieu et al., 2011; Sun et al., 2020). Thus, if it is necessary to further enhance late-summer T for greater model realism, it is necessary to improve the plant physiology in addition to the hydrology scheme and storage to see further gains.
Elder Creek (480 mm storage capacity) and Dry Creek (180 mm storage capacity) have storage capacities at the 79th and 4th percentiles of storage capacities in the region with a Mediterranean climate included in this study (Cs label in Fig. 8e). As such, they capture two broad sets of behavior found in sites with Mediterranean climates that are also common beyond these sites, but they do not fall into the mode of the distribution of storage capacities, which is 330 mm. Thus, it would be valuable to continue with more site-specific studies to identify whether additional complexity or alteration to the model structure would be valuable. In particular, it would be valuable to explore rock moisture dynamics in DGVMs in snow-dominated sites, which was not explored in detail in this study.
4.3 Implications for DGVMs and ESMs
Three key conclusions can be drawn from this work to inform DGVM modeling and Earth system models (ESMs). Firstly, modeling the ability of plants to access moisture in weathered bedrock has the capacity to improve DGVMs. These improvements will change water fluxes and vegetation cover and, in the context of simulation with ESMs, also energy fluxes. Including these improvements in the land surface components of ESMs has the potential to reduce model biases, particularly in the atmospheric model component which is dependent on the land surface for its lower boundary condition. Given the importance of climate modeling, this would appear to be of high scientific and political priority. However, doing so for global modeling will be challenging as most regions are relatively data and knowledge poor when compared to the CONUS and the study sites. Implementing weathered bedrock soil moisture in global DGVMs (and therefore ESMs) will likely require a coordinated effort by hydrologists, ecologists, and DGVM and ESM modelers.
Secondly, we note that DGVMs are sensitive to both storage and water flow pathways. Historically, this may not have been fully recognized. Pappas et al. (2013) found that LPJ-GUESS results were sensitive to only one hydrological model parameter: soil storage capacity. Our results corroborate this finding to some extent, but we also found that altering the hydrology scheme was important, in particular setting the maximum rate of infiltration to saturated hydraulic conductivity. However, the increase in infiltration rate with the modified hydrology became important only with large storage capacities (at least 100 mm more than default storage capacity; see Fig. A4), which fall outside the range explored by Pappas et al. (2013). Thus, our analysis reveals the importance of improved process representation, as well as representing realistic storage capacity. Other aspects of hydrology may also be essential to account for in certain regions or landscape positions, such as lateral groundwater flows (Fan et al., 2019). However, most DGVMs are not structured to account for topography, making the inclusion of both subsurface and surface water flow subsidies highly challenging. Future efforts could explore more complex hydrology by restructuring a DGVM like LPJ-GUESS to take into account topography or coupling the plant dynamics in a DGVM such as LPJ to an existing hydrological model.
Finally, improving the simulated hydrology (via, for example, weathered bedrock moisture) will present opportunities to reevaluate and improve the representation of related plant processes (in this case plant water demand). This is well evidenced by the case of the simulated late-summer T shortfall as discussed above. Furthermore, in some cases some adjustments may even be essential as unrealistic hydrology may have required a compensating error in other processes, and this error will be laid bare under the new hydrology scheme. It might be possible to mitigate such cases with fairly minor adjustments to existing process representations. However, increased realism on the hydrological side presents an opportunity to implement and test alternative approaches for modeling plant responses. In particular, recent developments in understanding plant behavior using eco-evolutionary optimality approaches (Stocker et al., 2020; Joshi et al., 2022) may provide alternative process representations that synergize with improved hydrology to increase overall model realism.
4.4 Model simplifications
The modified hydrology and subsurface representations presented in this study are simplified relative to reality. The hydrology scheme is 1-D, and subsurface structure is represented using only two buckets (soil and weathered bedrock). Even with this simple representation, enhanced process realism and realistic subsurface storage capacities significantly improve flux calculations (see Figs. 4–9), indicating that previous model limitations were not due primarily to the bucket model structure (as expected from previous studies, e.g., Pappas et al., 2013). However, using only two subsurface layers regardless of the depth does have limitations. For instance, the two-layer model does not allow for plants of different rooting depths within the upper soil layer to have different water access. If the upper soil layer is 150 cm thick, then a grass that roots to 50 cm has the same access to water as a plant that roots to 120 cm – both have full access to the upper soil layer. This setup also provides no ability to prescribe different plant sensitivities to water limitations at detailed sublayers within the root profile. Given the great complexity involved in plant water uptake, however, and our use of subsurface storage estimates based on actual plant water use (McCormick et al., 2021), it is reasonable to assume that plants have access somehow to all stored water (Feddes et al., 2001). The simplicity of the two-layer model allows for plants to access all of the available water without prescribing detailed strategies based on root profiles and niches. However, the model setup here does preserve the core logic implicit in the LPJ-GUESS hydrology, which is that grasses have very limited access to deeper soil water and that trees have more. Further, since layer depths were determined based on soil properties to achieve the desired storage, layer depths may not correspond to actual depths of water storage in the landscape, so using rooting depths to determine plant water access within the profile is not appropriate in this model structure.
4.5 Extending model modifications to other countries
The data sources used in this study for soil capacity and to calculate weathered bedrock storage capacity are specific to the United States. To extend this model beyond the United States, it would be most important to extend estimates of total plant-accessible storage since soil datasets are generally inadequate to represent plant-accessible water stores even where they are available (McCormick et al., 2021) due to widespread plant water uptake from layers deeper than those in traditionally mapped soil databases. While the specific distributed water flux datasets used in this study are not globally available, Wang-Erlandsson et al. (2016) used a similar deficit-based strategy to the one used in this study to estimate plant-accessible water storage globally with alternative water flux datasets. The accuracy of estimates of this type is limited by both (i) the accuracy of the input water flux data and (ii) the time period of data availability. In the case of the present study, the PML-V2 evapotranspiration and PRISM precipitation datasets used to calculate the root-zone storage deficit close mass balance well with USGS streamflow gages (Rempe et al., 2023) in undisturbed watersheds in the western United States. However, data concordance should be confirmed with any data sources to be combined for use in a root-zone storage deficit calculation since mass balance errors can compound over time. Second, the time period of data availability is important since the maximum root-zone storage deficit provides only a minimum bound on plant-accessible water storage. With a longer time series, the minimum bound is more likely to approach the actual plant-accessible water storage, particularly if dry periods or disturbances like fire or logging are included in the time series. Shorter time series or time series that fall during a particularly wet period of history may be more likely to underestimate plant-available water storage. Based on the findings of this study, underestimating storage capacity would result in lower evapotranspiration and less tree growth in LPJ-GUESS, and overestimating storage capacity would result in the opposite.
In this study, we unite three important themes that have recently emerged from critical zone research efforts, responding to a recent call for action to better incorporate findings from critical zone science into Earth system models (Fan et al., 2019): (i) the observation that water sourced from below soil, within weathered bedrock, commonly sustains plant communities through seasonal dry periods (e.g., Rempe and Dietrich, 2018; Rose, 2003; Schwinning, 2010); (ii) the observation that the structure – or weathering profile – of this weathered bedrock zone dictates its water storage capacity and seasonal water storage dynamics (e.g., Dralle et al., 2018; Hahm et al., 2019, 2022); and (iii) empirical and theoretical work that suggests that critical zone architecture varies systematically across the landscape as a function of lithology, tectonics, and climate (e.g., Pelletier et al., 2018; Riebe et al., 2017). We bring these insights to bear on global dynamic vegetation models (DGVMs) by incorporating water stored in weathered bedrock into a widely used DGVM, LPJ-GUESS. The addition of this spatially variable deeper moisture store (“rock moisture”) along with updates to the hydrology module allowed LPJ-GUESS to capture the differences in vegetation community and response between two intensively studied sites with similar climate but very distinct vegetation communities. When applied across the contiguous United States, the addition of rock moisture allowed for enhanced evapotranspiration later into the dry season at seasonally dry sites, better capturing observed behavior. This work highlights the importance of accounting for rock moisture in DGVMs and Earth system models and provides a roadmap for the inclusion of rock moisture in other modeling frameworks.
We evaluated overall model performance by comparing modeled annual runoff, annual ET, and summer ET across CONUS. PML-V2 (Zhang et al., 2019) was used as the reference ET dataset, and a reference runoff dataset was calculated as the difference between precipitation from PRISM (PRISM Climate Group, 2014) and ET from PML-V2. We compared mean annual runoff and mean summer ET at each pixel (Fig. A1 for runoff and Fig. 9 for summer ET). There is essentially no difference in performance at estimating annual runoff among the different LPJ-GUESS model scenarios tested (Fig. A1. However, summer ET model performance for pixels with a large subsurface storage capacity was significantly improved with the LPJ-GUESS model with modified storage and hydrology (Fig. 9).
We further explored model performance for runoff and ET using Kling–Gupta efficiency (Gupta et al., 2009) and a metric determining the effectiveness at capturing spatial distribution, calculated following Seiler et al. (2022) as
where R is the correlation coefficient between a mean annual variable from an LPJ-GUESS model scenario and a reference dataset, and σ is given as
where σmodel and σreference are the standard deviation of a mean annual variable for the LPJ-GUESS model scenario and the reference dataset, respectively.
For annual runoff and annual ET, KGE with the reference data decreases from the standard model to the modified model. The difference is modest but measurable in both cases. The spatial distribution of annual runoff and ET are captured essentially the same by all model scenarios. Dry-season ET performance, however, is substantially improved from the standard to the modified model from a KGE of 0.27 (poor performance) to 0.89 (excellent performance). The spatial distribution is also captured significantly better (improves from 0.66 to 0.96).
Table A1Model performance for different subsurface structures and hydrology schemes showing runoff performance against mass balance and ET performance against PML-V2. KGE is the Kling–Gupta efficiency (Gupta et al., 2009), and Sdist (Seiler et al., 2022) describes how well the spatial distribution of values is captured.
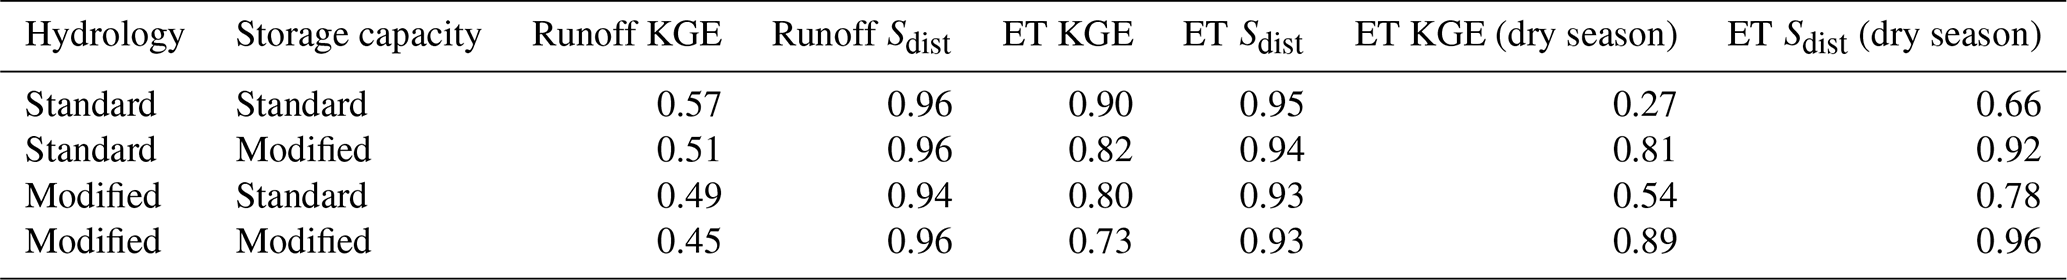
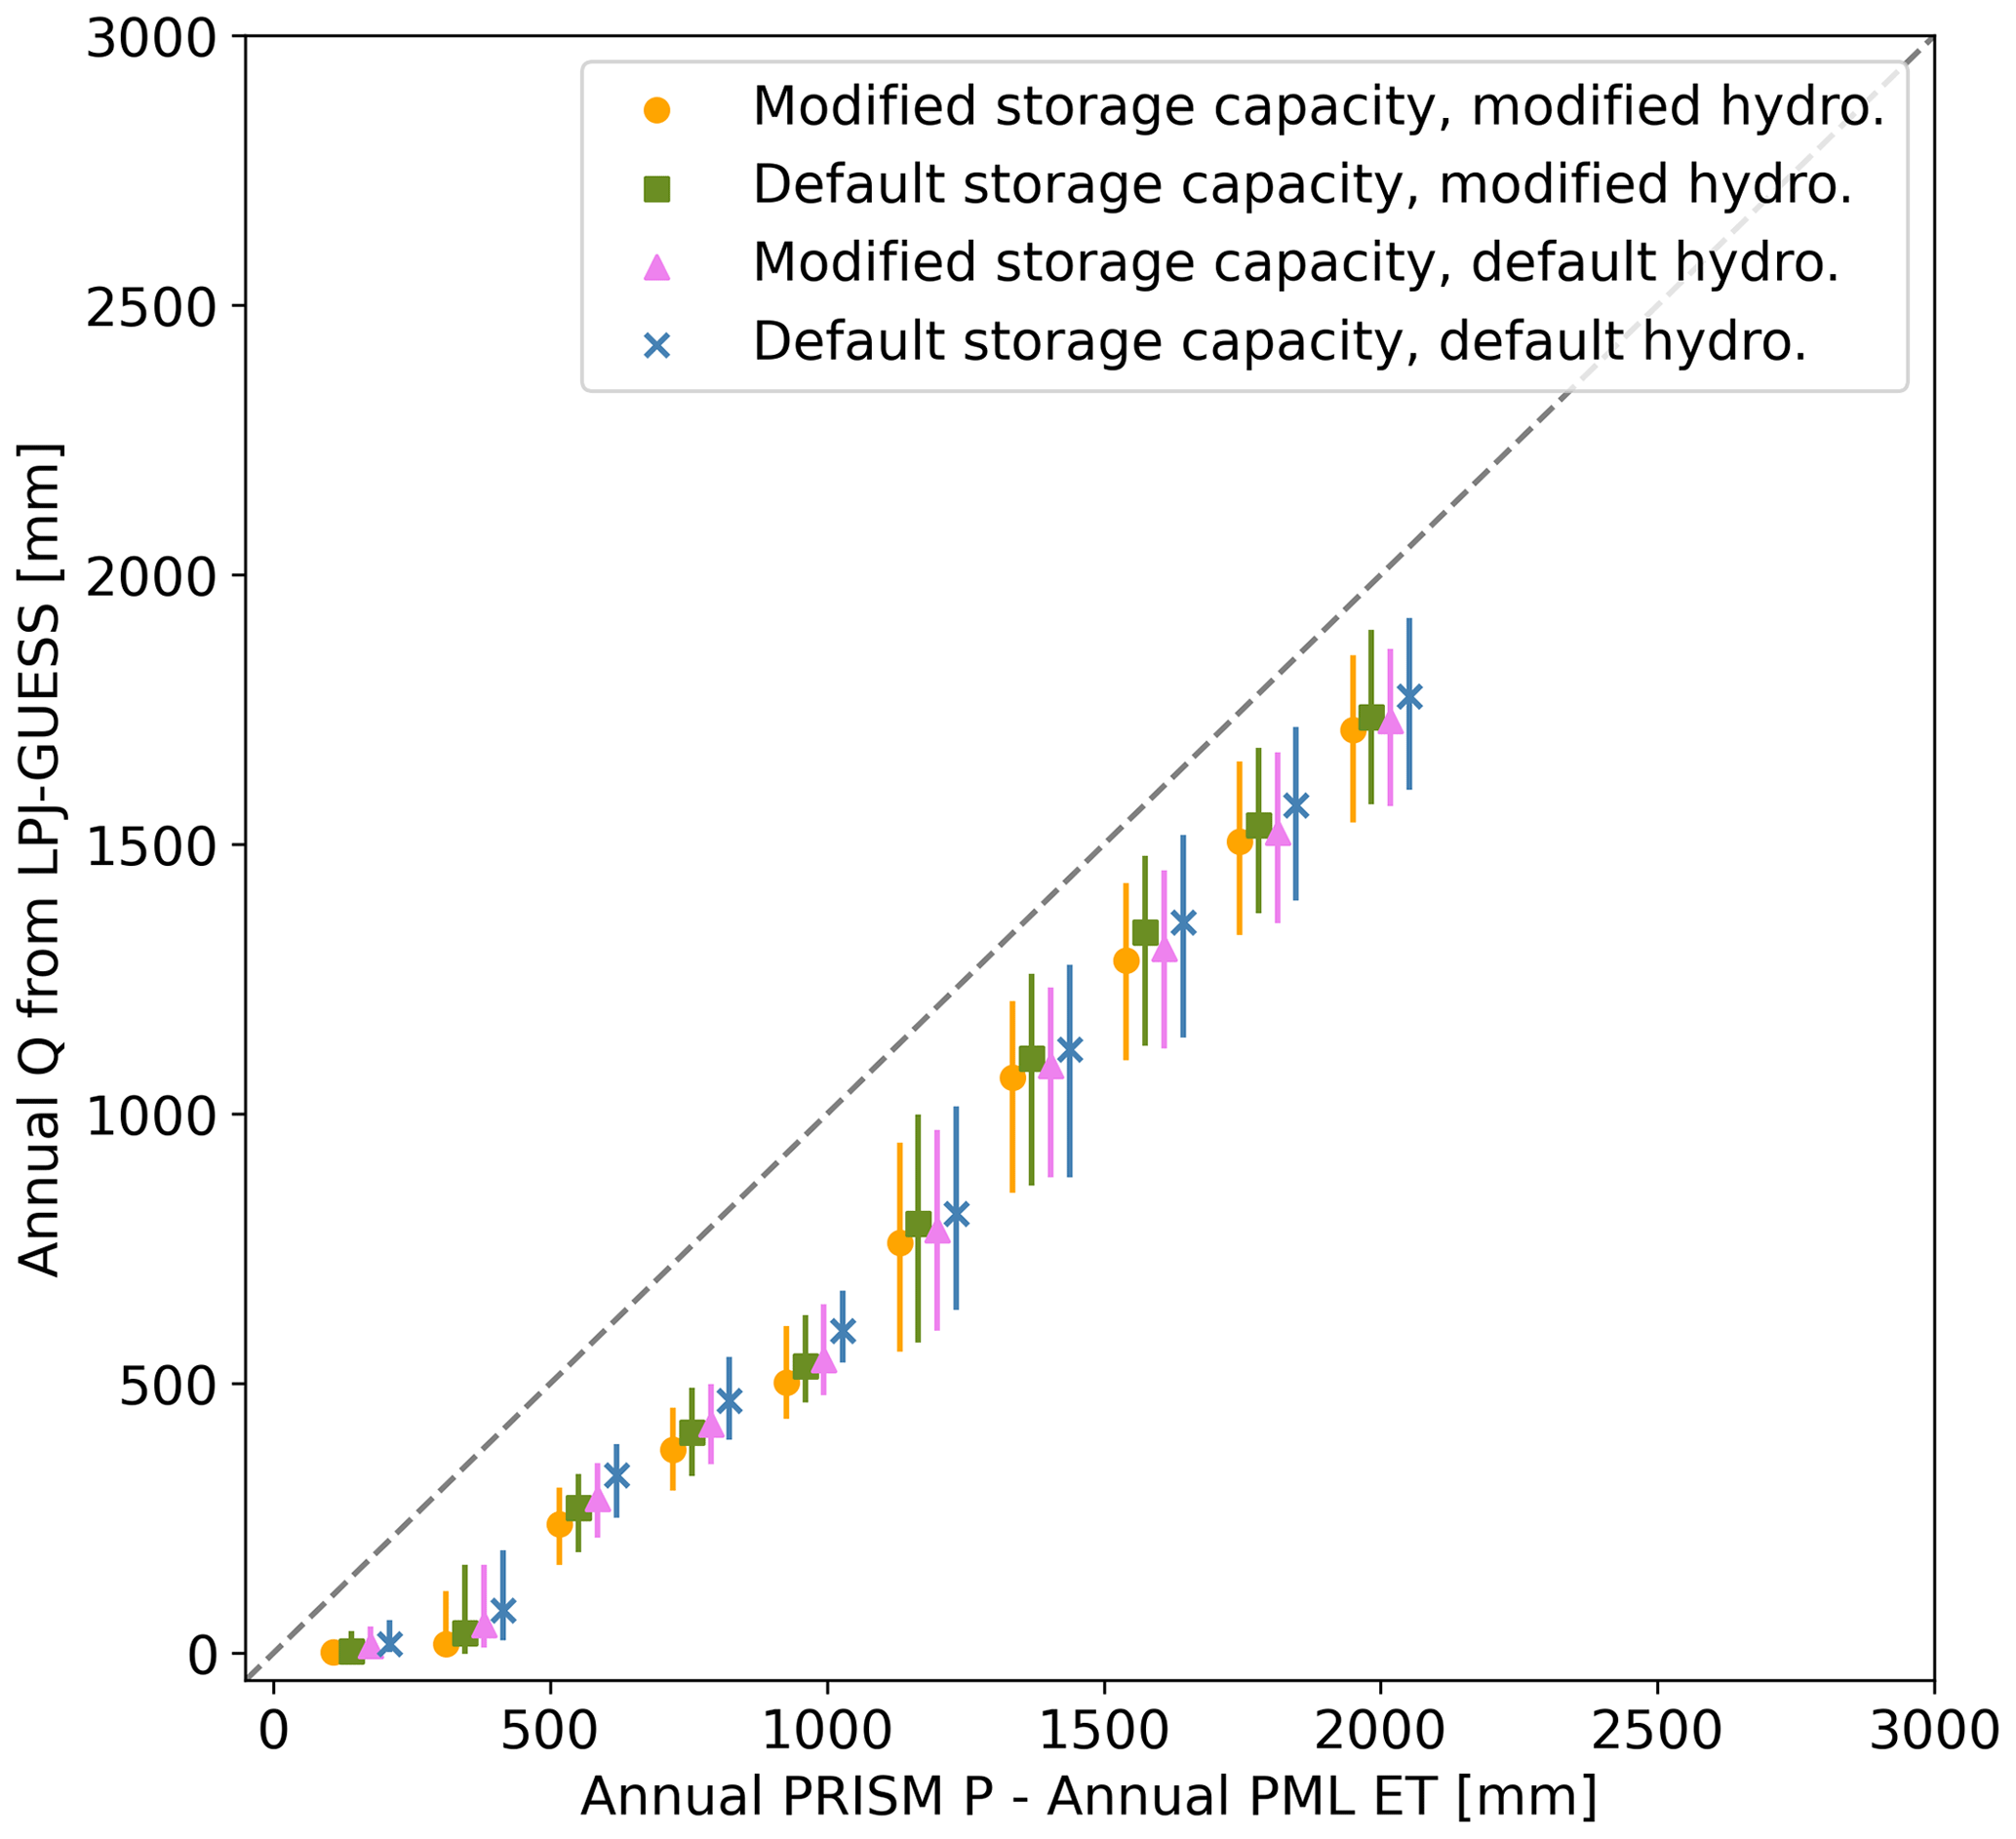
Figure A1Mass balance check showing that the model modifications do not affect mass balance. Runoff from LPJ-GUESS is slightly lower than that calculated via mass balance from PRISM precipitation and PML-V2 ET across all pixels and simulations.
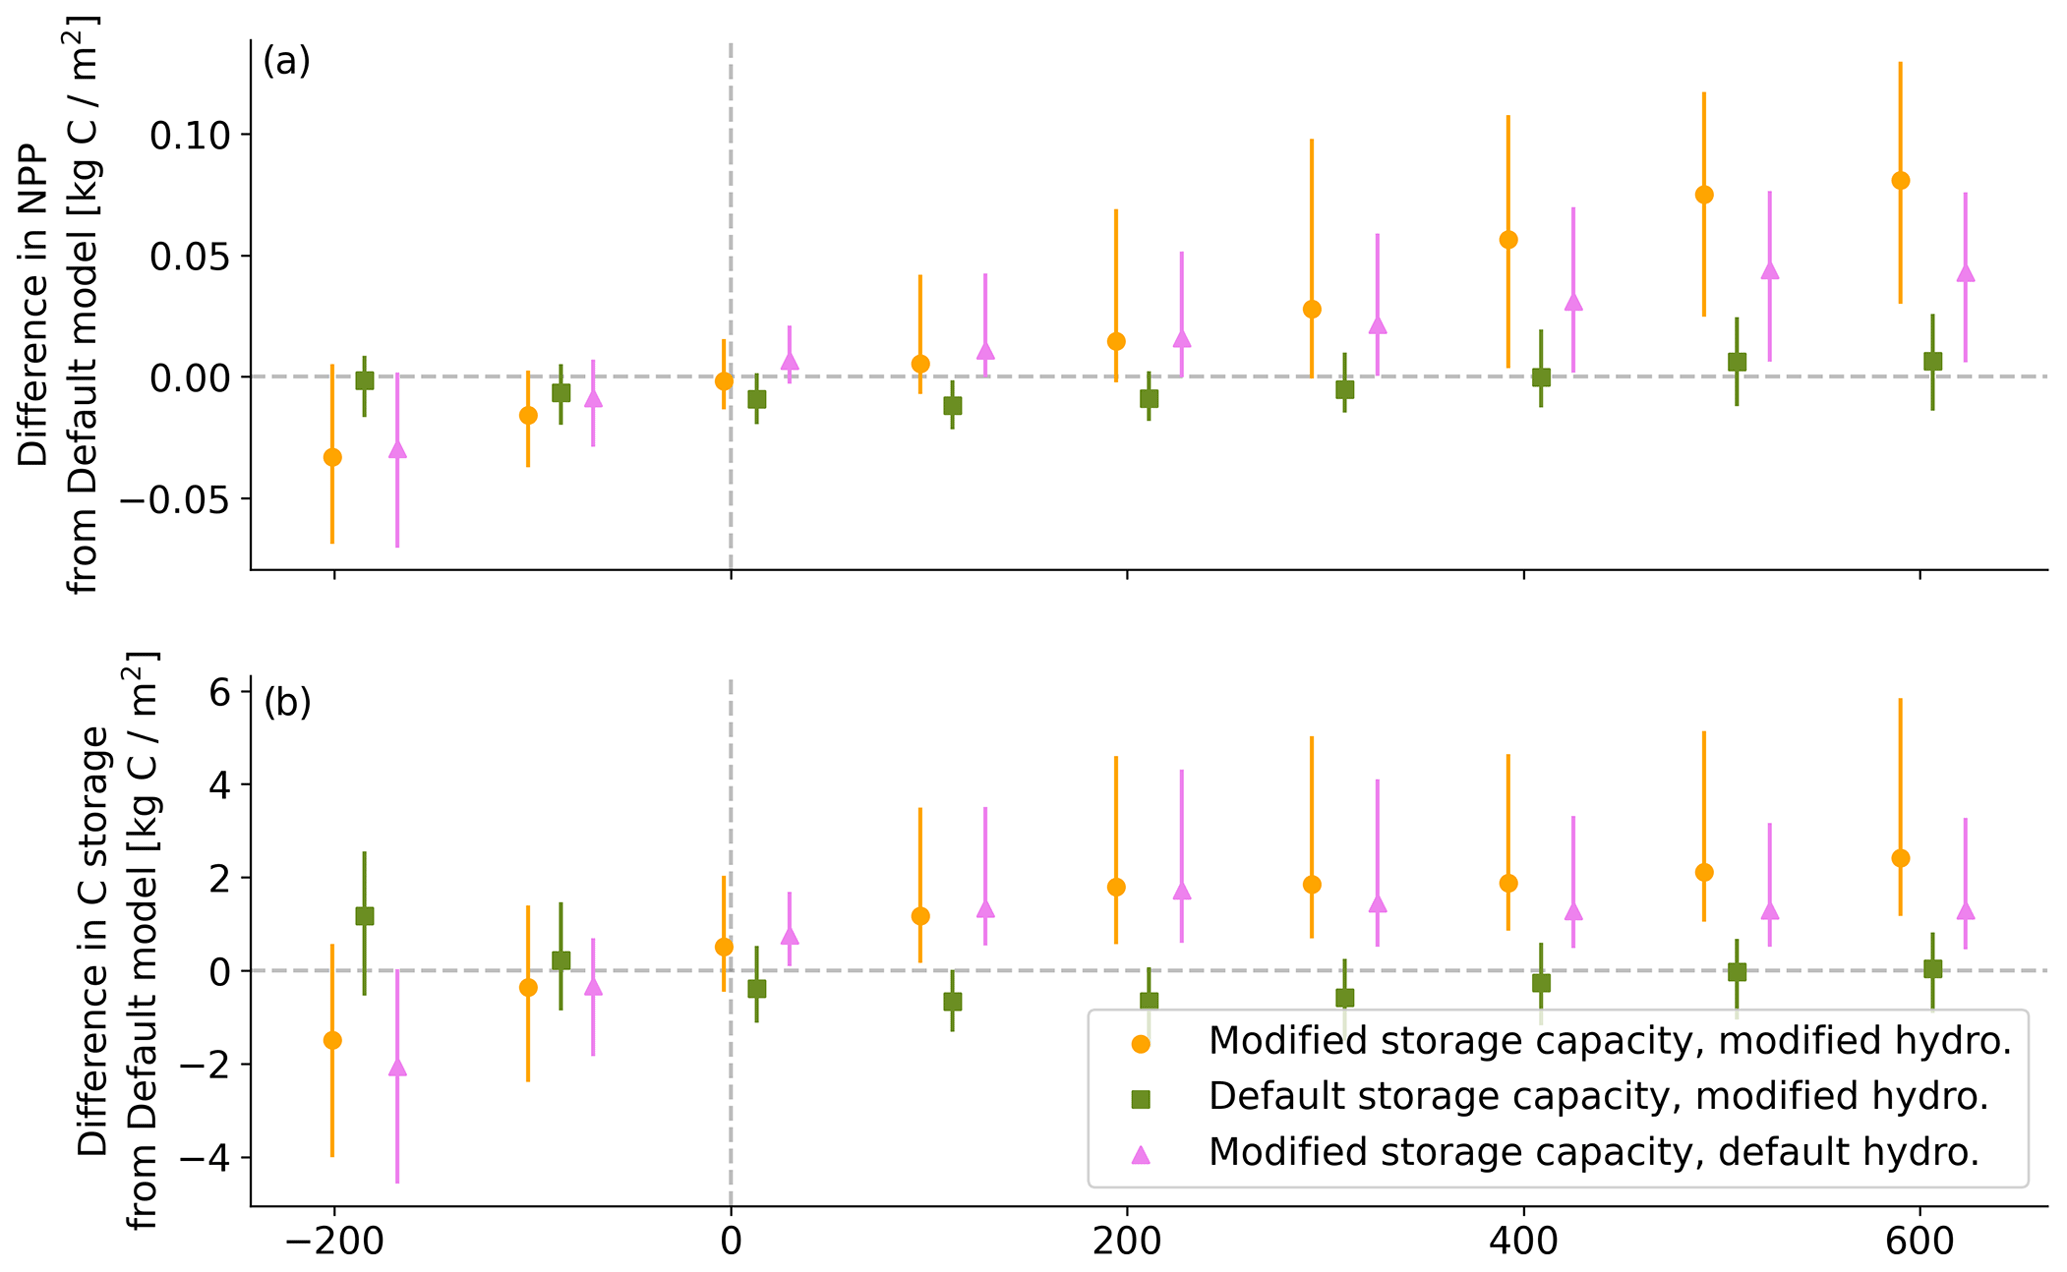
Figure A2Impact of modified hydrology and storage relative to default LPJ-GUESS model on (a) net primary productivity (NPP) and (b) carbon (C) sequestration. Both NPP and C are enhanced with modified storage and hydrology schemes.
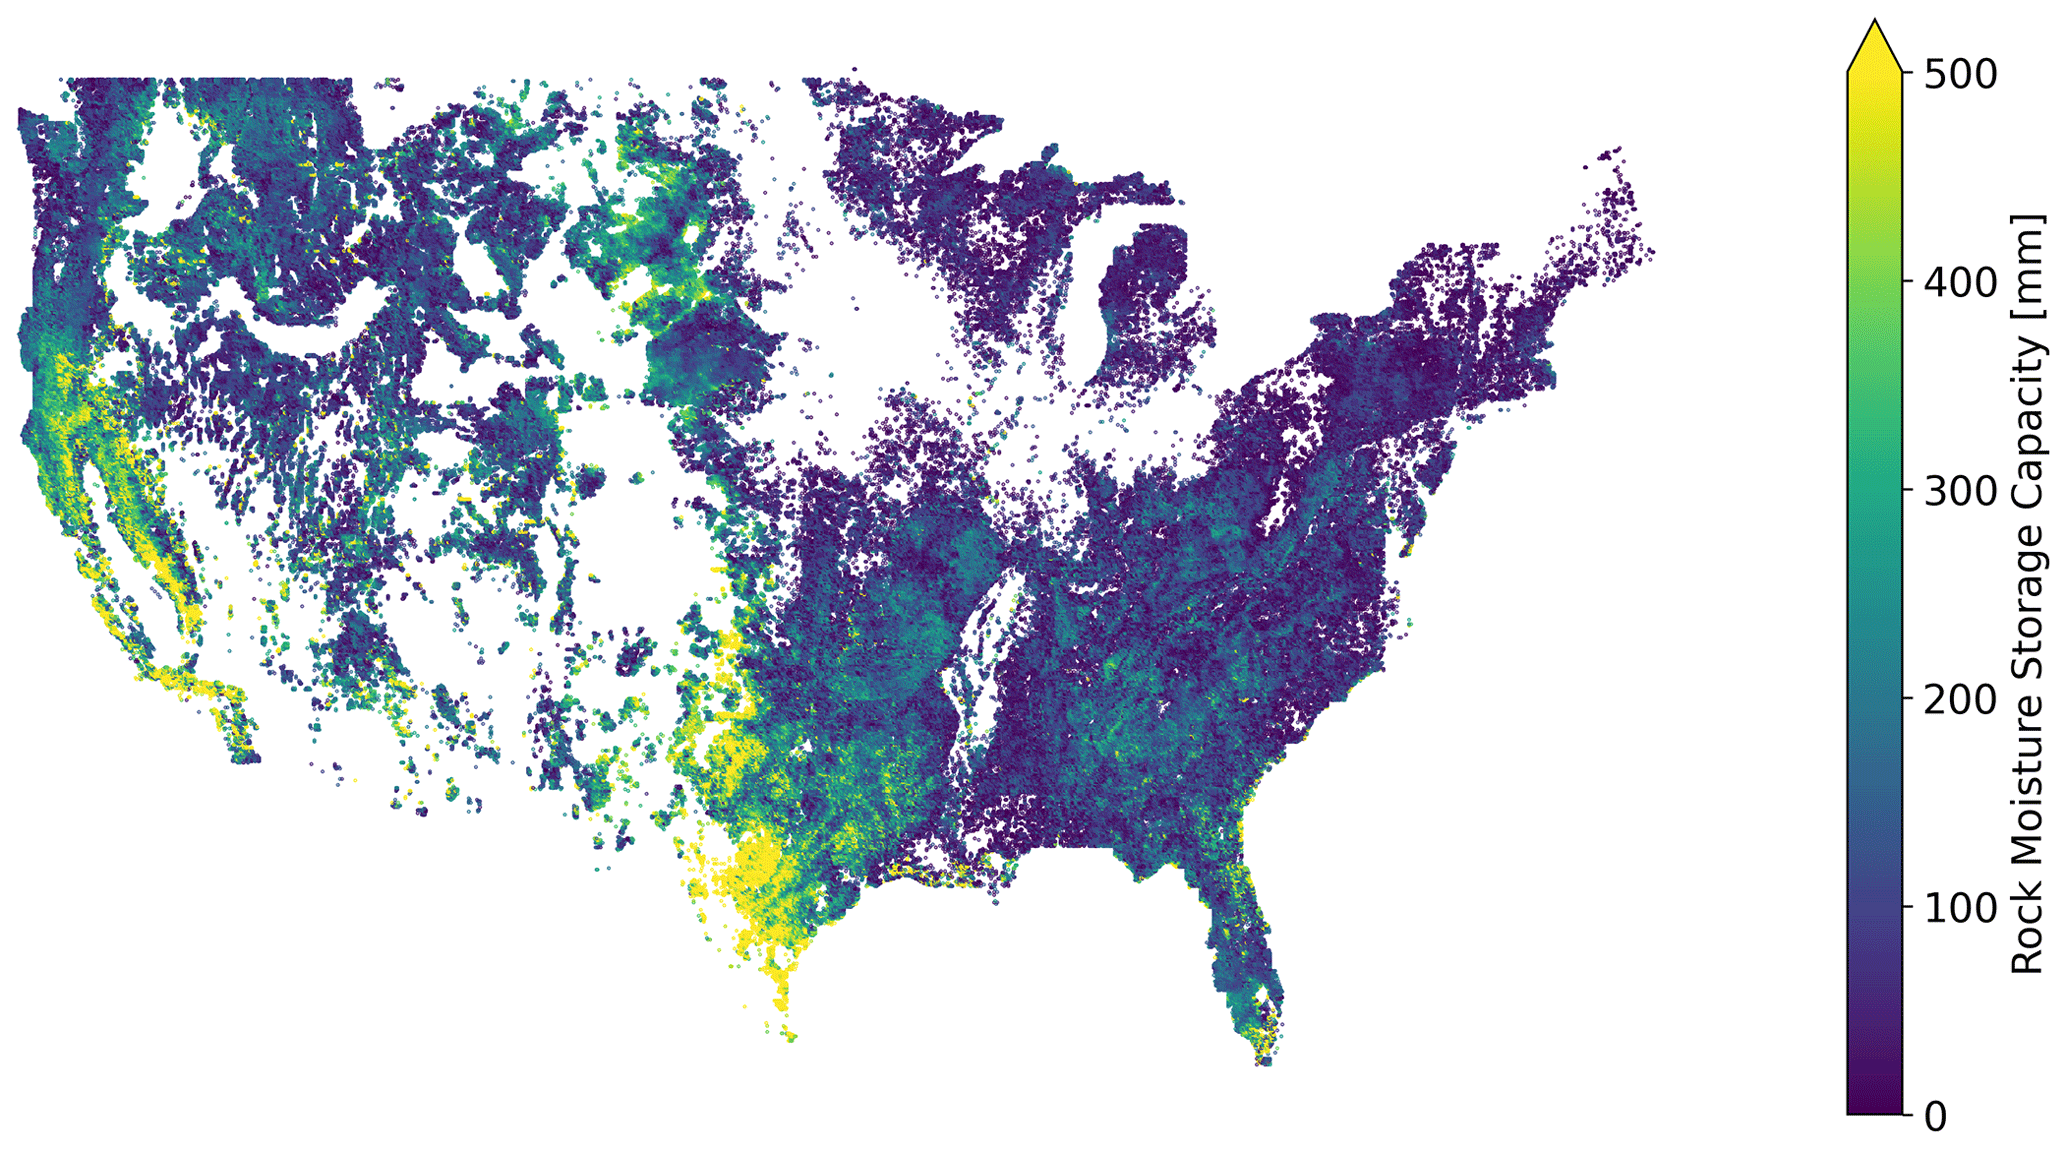
Figure A3Rock moisture storage across CONUS, as described in Sect. 2.3 of the main text. This storage reservoir represents water held below soils in weathered bedrock and is given by the difference between total estimated root-zone storage capacity and estimated soil storage capacity.
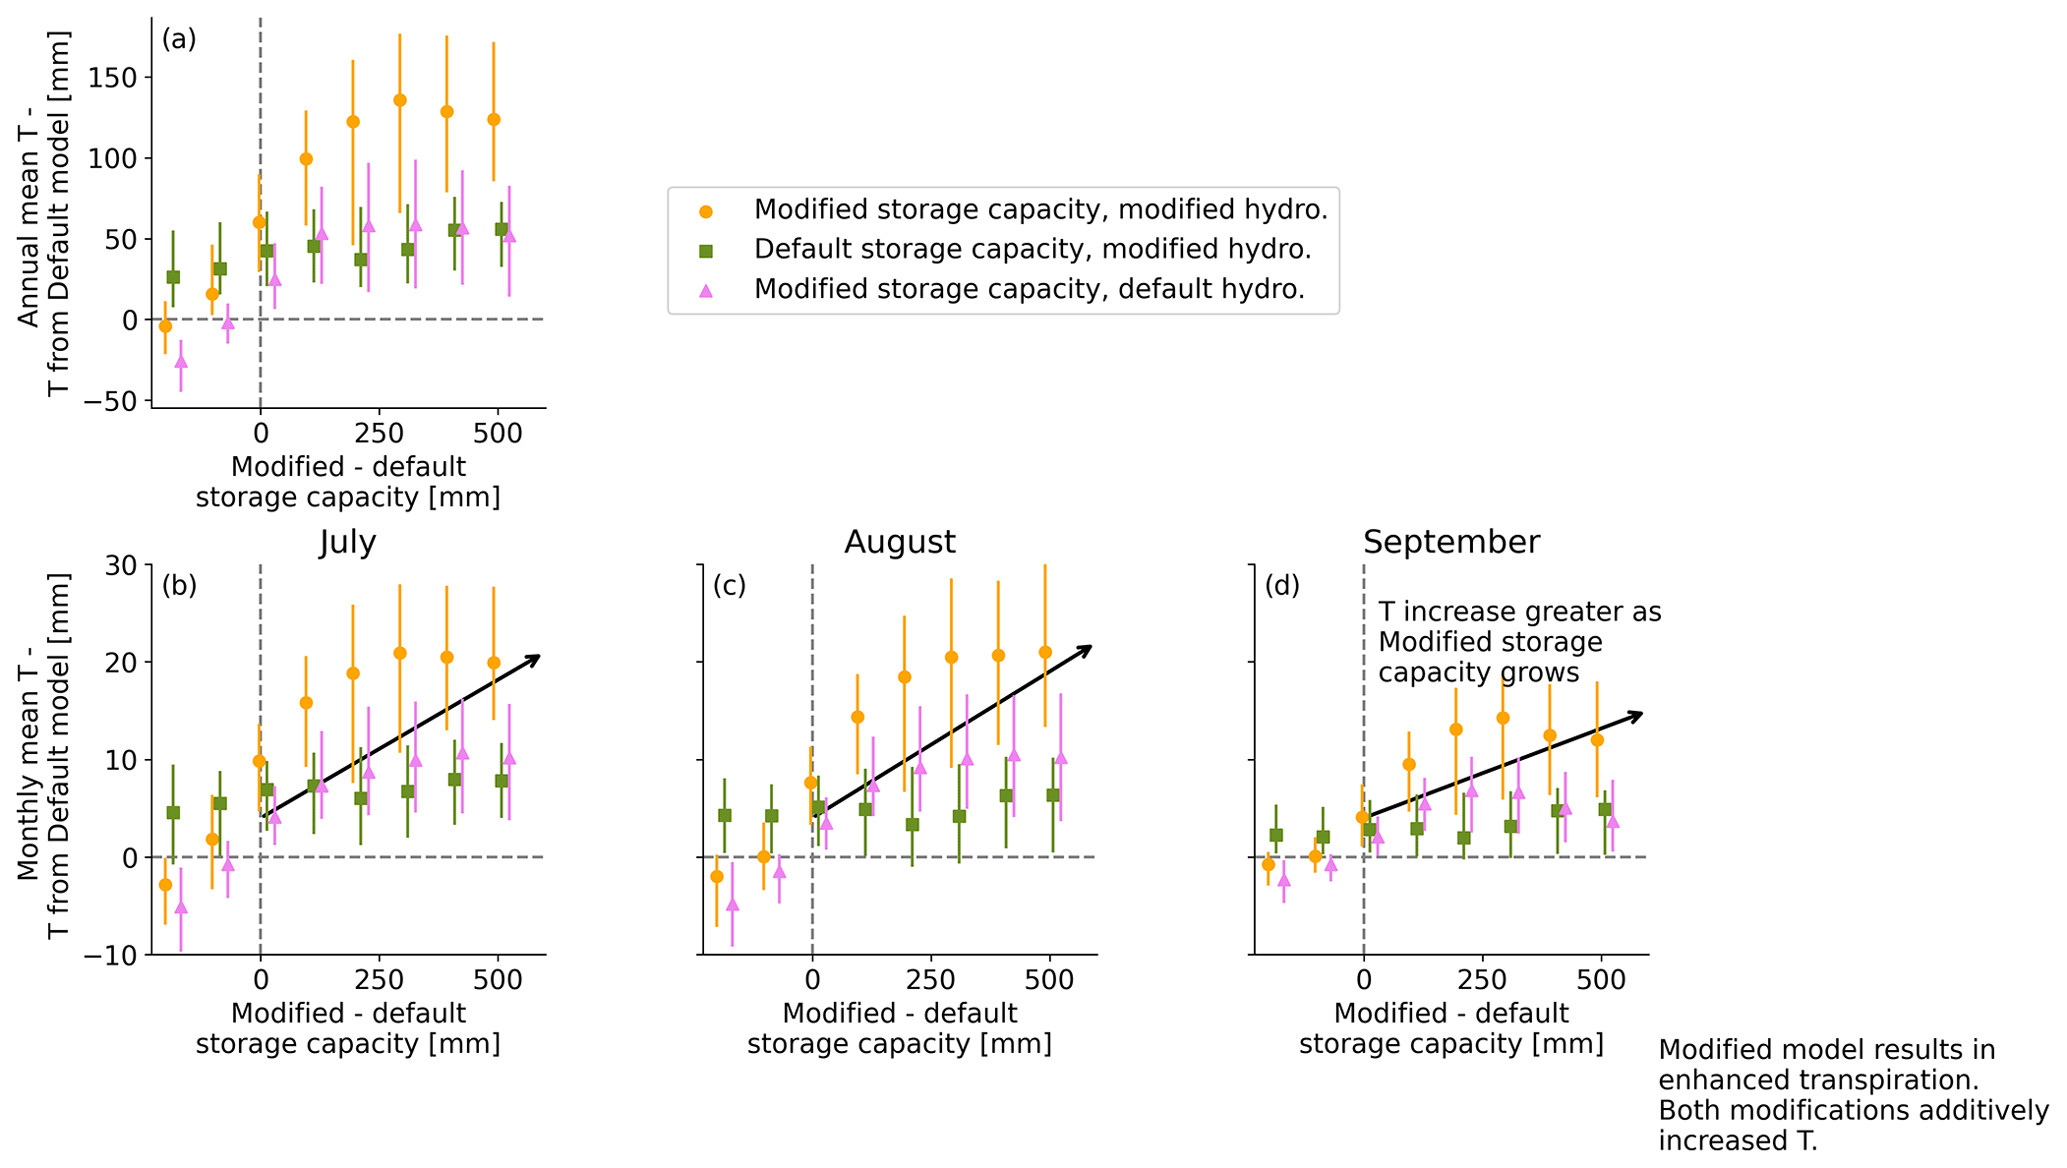
Figure A4Binned histograms of the difference in simulated transpiration (T) between each simulation and the simulation with default storage capacity and hydrology as a function of the change in storage capacity from the default to modified for (a) annual T and (b–d) monthly T for July, August, and September, respectively. Dashed grey lines mark (horizontal) no T change from the default model and (vertical) no storage capacity change between the modified and default storage capacity. Vertical lines for each marked point indicate the spread from 25th–75th percentile. There is little change in T for locations with a change in storage of < 100 mm. When greater than 100 mm, though, both the modified hydrology and modified storage capacity separately result in enhanced T, with the combined effect for the fully modified simulation being an average of about 100 mm annual increase for sites with large modified storage capacity or a monthly difference of about 20 mm in August. The result is significantly enhanced T, with the largest effect at sites with the largest storage capacity in the modified model.
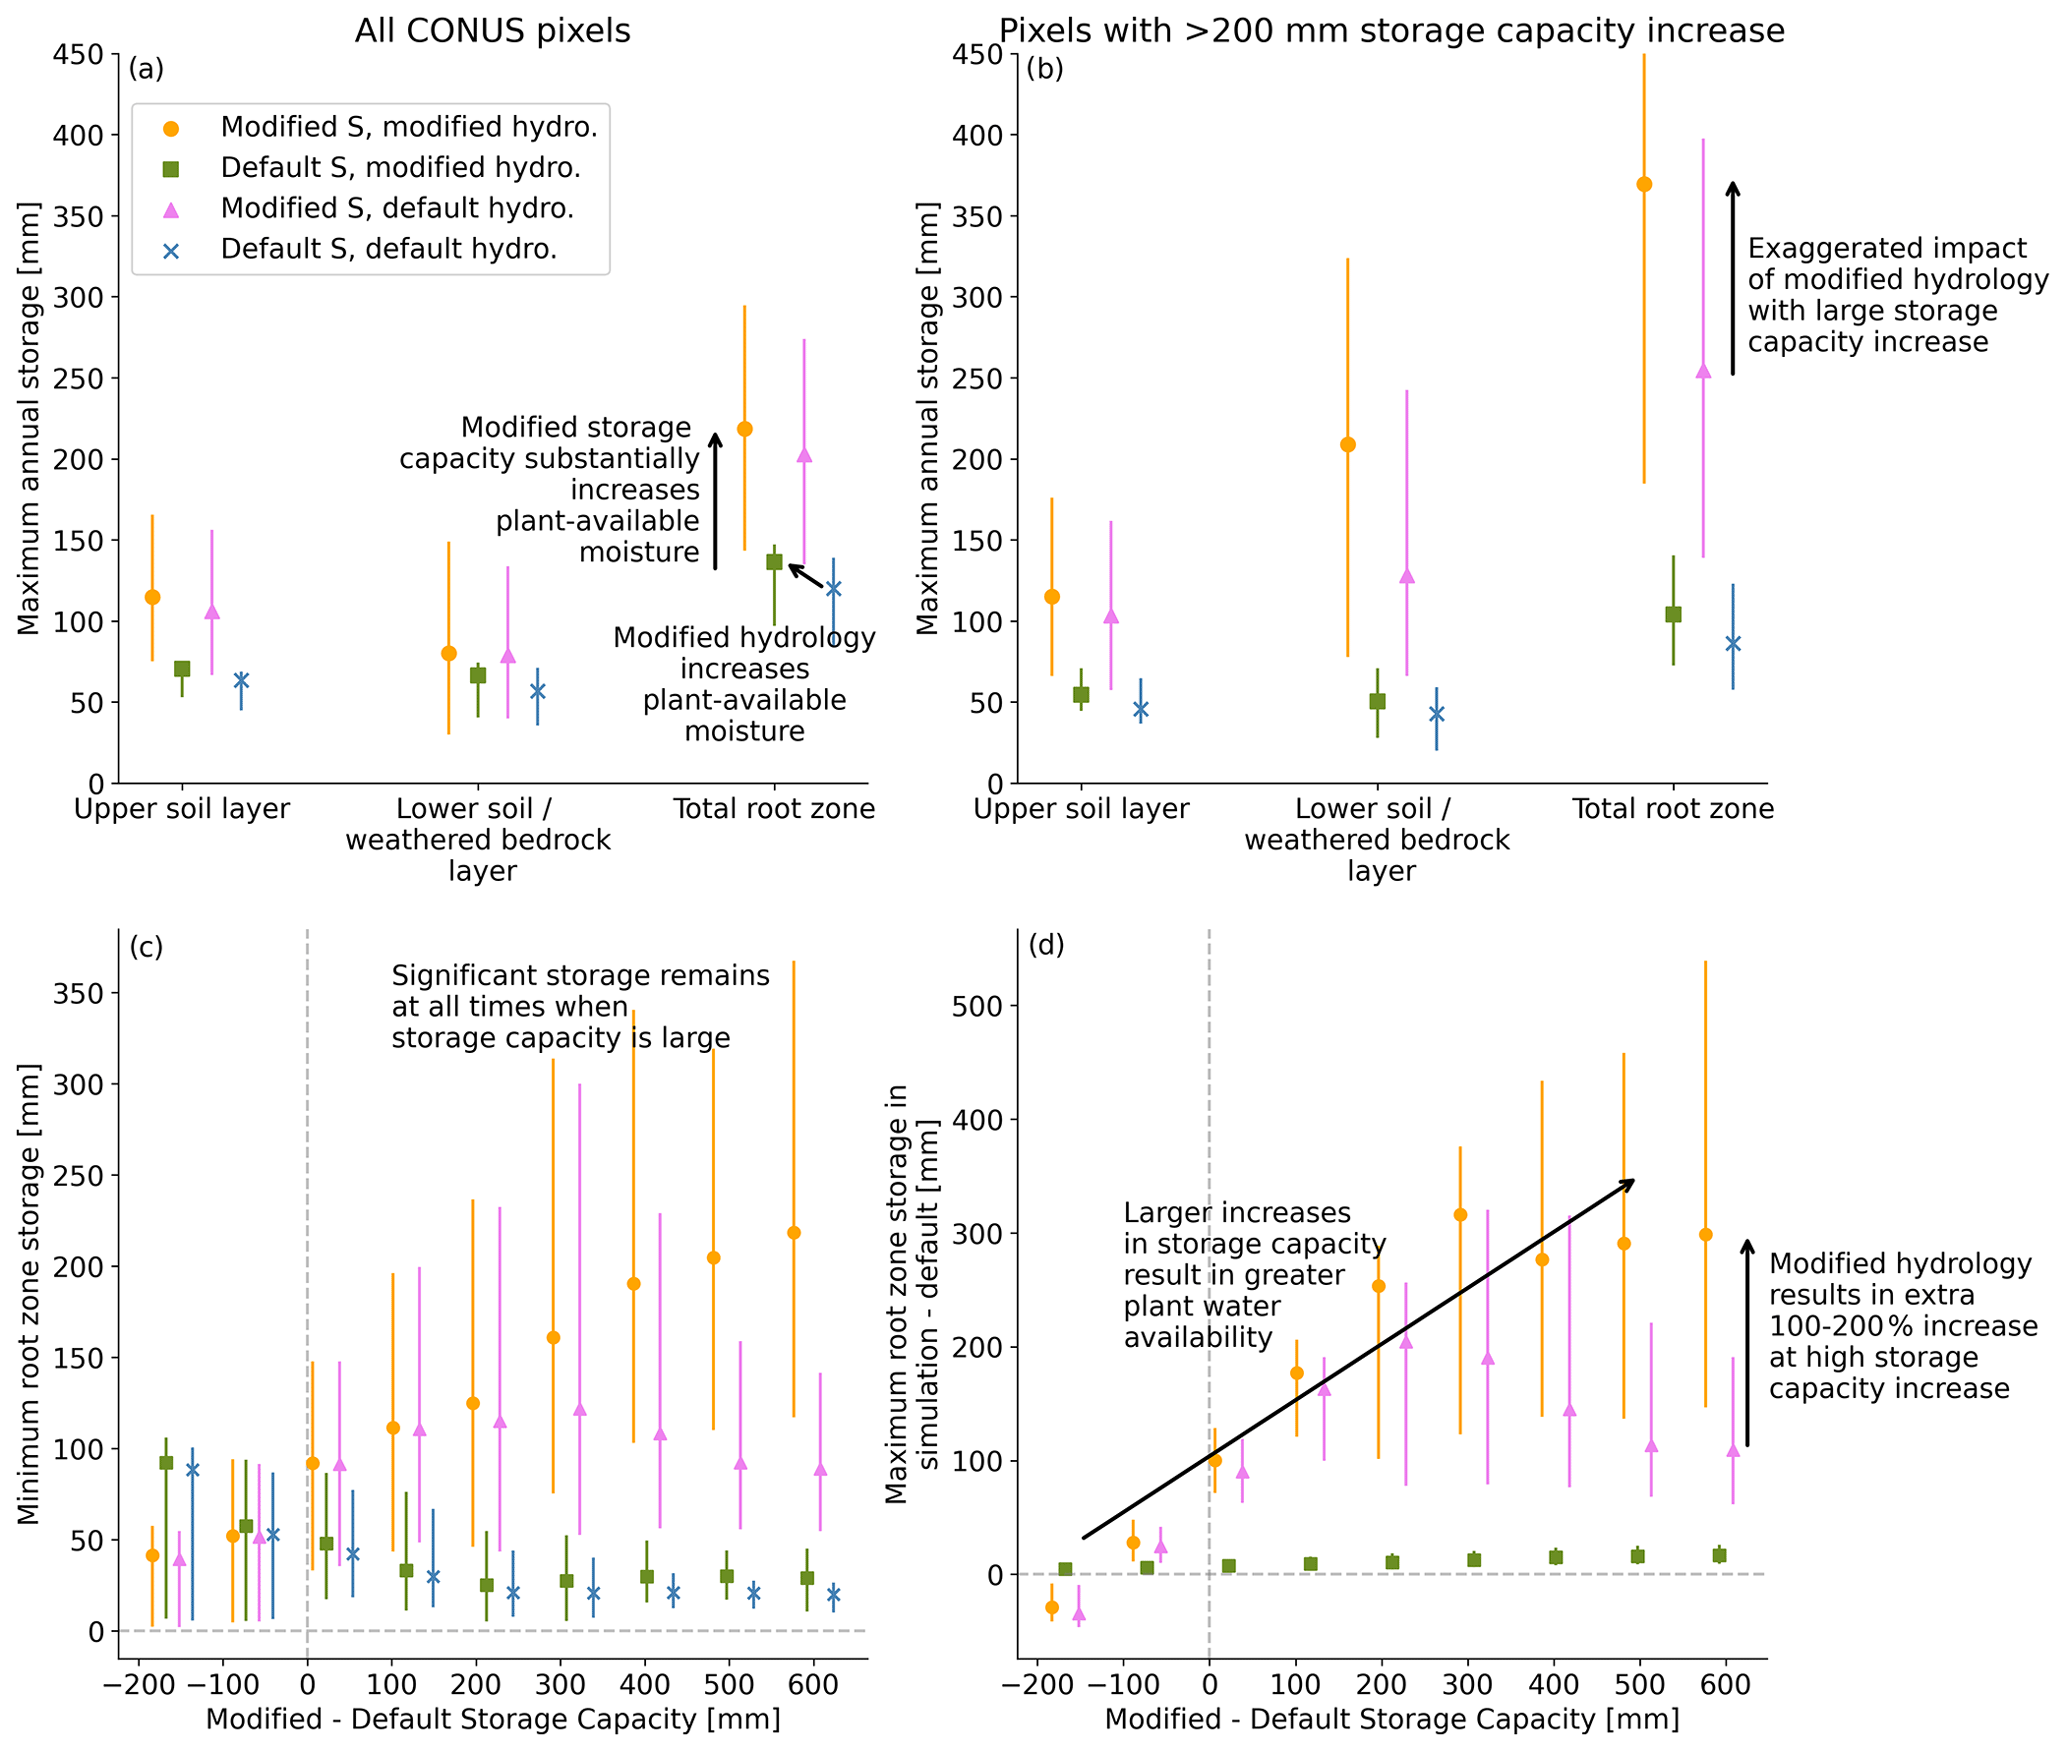
Figure A5Average maximum annual moisture storage in each soil or weathered bedrock layer and across the full root zone for all four simulations (a) across CONUS and (b) for pixels across CONUS where storage capacity increases by more than 200 mm. Differences between simulations are more substantial with a larger storage increase in panel (b). (c) Minimum root-zone storage as a function of difference in storage capacity from the default across CONUS. With large storage capacity, significant amounts of water remain in storage at all times. (d) Difference in maximum mean monthly plant-available moisture from the default model to each simulation across CONUS. As the difference in storage capacity grows, up to an average of 300 mm more moisture is available. In all panels, error bars show the range from 25th–75th percentile.
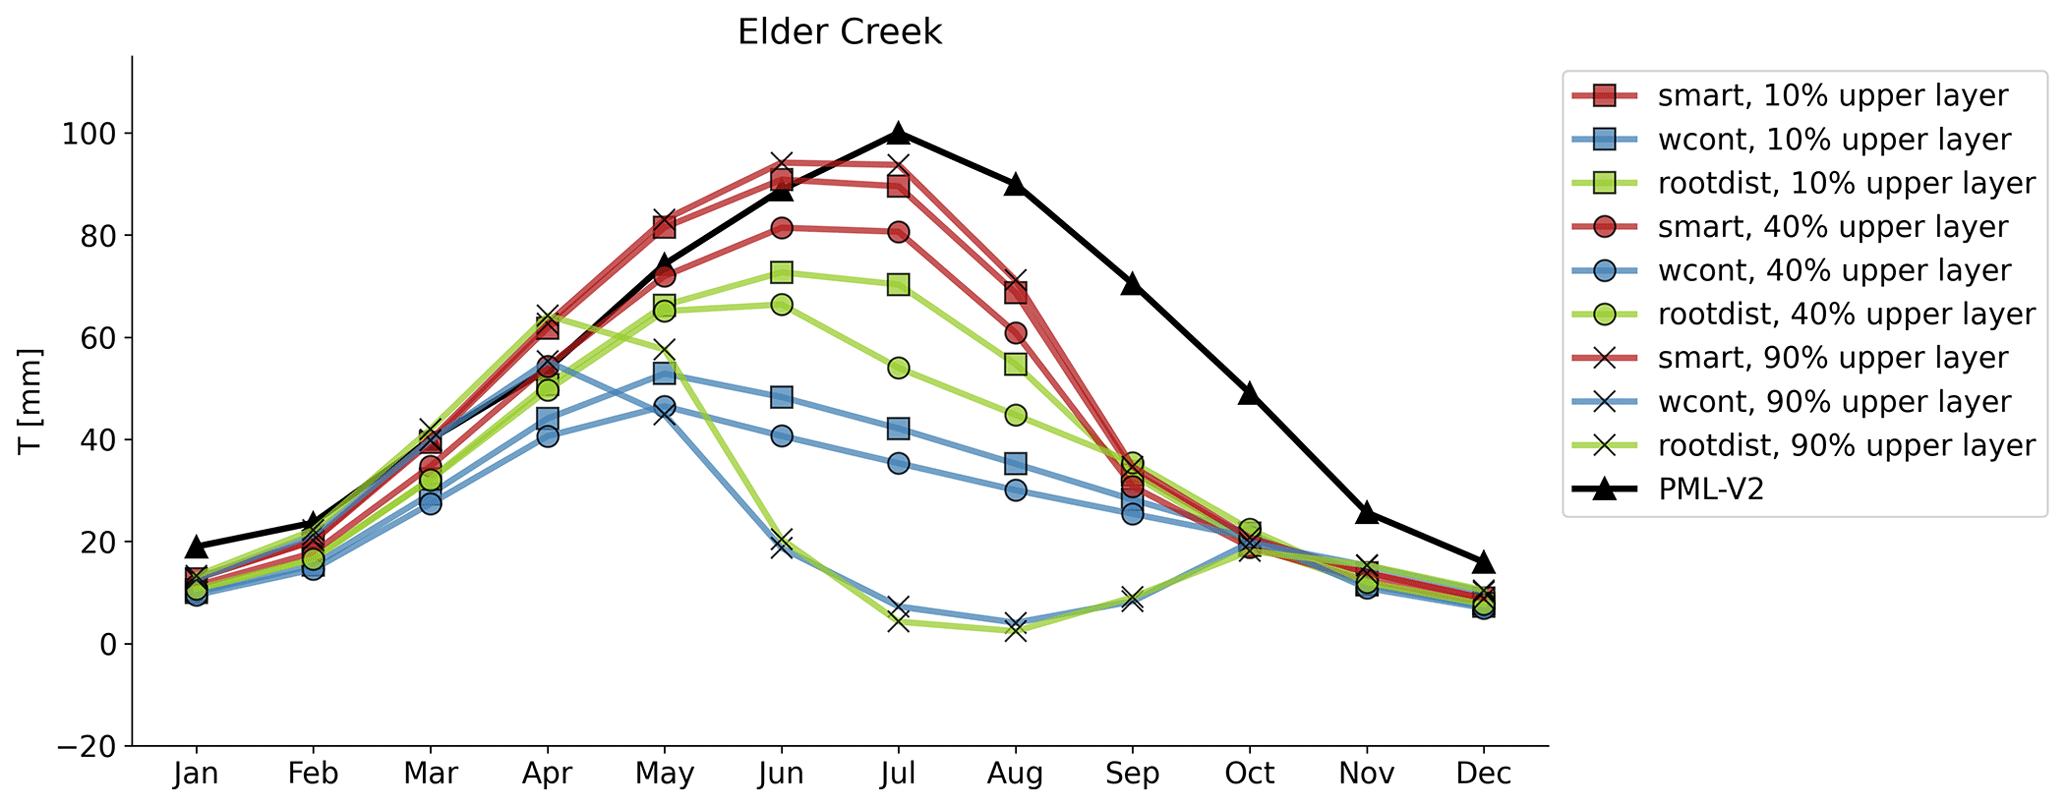
Figure A6Elder Creek transpiration using three different root distributions for trees and three different water uptake strategies. All water uptake strategies and root distributions result in downregulated transpiration later in the summer compared to the PML-V2 distributed data product.
Modified hydrology and storage capacity generally result in more plant-available moisture (Fig. A5a and b). For locations where storage capacity increases by more than 200 mm between the default and modified storage capacity, differences between simulations in plant-available moisture are magnified (Fig. A5b). At an annual level, modified hydrology increases root-zone storage, but modified storage capacity has an even bigger impact on root-zone storage. As the modified storage capacity increases, maximal plant-available moisture with the modified storage capacity and hydrology grows to a median of about 300 mm more than with the defaults (Fig. A5d).
To explore how the root distribution and water uptake routines may impact results, we adjusted the tree root distribution and water uptake scheme for the case study sites. We used three different root distributions (10 %, 40 %, and 90 % of roots in the upper layer). The 10 % and 90 % cases represent extremes of most roots in the lower level vs. most roots in the upper level, and the 40 % case is the default root distribution for trees that is used in this study. We applied three different water uptake schemes, including smart (described in Sect. 2.2.4), root-distribution-based (water uptake distribution follows the root distribution), and water-content-based (water uptake distribution follows the distribution of moisture in the profile multiplied by the root distribution). We ran LPJ-GUESS for the Elder Creek case study site for all permutations of the three root distributions and water uptake schemes (Fig. A6). The root distribution and uptake scheme have a large impact on resulting transpiration. Of the three schemes, smart is most appropriate for this model application since it is the only scheme that allows roots to access the bottom soil layer fully regardless of the root distribution. This is important since the soil layers were sized under the assumption that plants can access the water. It is therefore unsurprising that the model runs using the smart water uptake scheme all result in a similar transpiration curve that is higher than those using the other water uptake distributions. There is only a small impact of root distribution on the transpiration curve when using the smart water uptake scheme since the root distribution is only used to set a maximum transpiration rate. Across all water uptake schemes and root distributions, transpiration is downregulated late in the summer, indicating that root distribution or water uptake are not the drivers of transpiration downregulation.
The modified version of the LPJ-GUESS DGVM used to produce the results described in this paper and the required input data and produced output are available on CyVerse at https://data.cyverse.org/dav-anon/iplant/home/danalapides/Lapides_LPJ_Rock_Moisture_2023 (Lapides et al., 2024).
WJH, MF, TH, and DND conceived of this study. DAL, WJH, and DND developed modified model code. DAL ran model simulations and produced publication figures. All authors contributed to writing and editing the manuscript.
The contact author has declared that none of the authors has any competing interests.
Publisher's note: Copernicus Publications remains neutral with regard to jurisdictional claims made in the text, published maps, institutional affiliations, or any other geographical representation in this paper. While Copernicus Publications makes every effort to include appropriate place names, the final responsibility lies with the authors.
We would like to acknowledge the US-NSF CZO SAVI International Scholars Program; Simon Fraser University; Natural Sciences and Engineering Research Council of Canada – Discovery Grant; and the Canadian Foundation for Innovation – British Columbia Knowledge Development Fund JELF grant for supporting this research. This research used resources provided by the SCINet project and the AI Center of Excellence of the USDA Agricultural Research Service, ARS project number 0500-00093-001-00-D.
This paper was edited by Paul Stoy and reviewed by Robert Reinecke and one anonymous referee.
Anderson, S. P., Blum, J., Brantley, S. L., Chadwick, O., Chorover, J., Derry, L. A., Drever, J. I., Hering, J. G., Kirchner, J. W., Kump, L. R., Richter, D., and White, A. E.: Proposed initiative would study Earth's weathering engine, Eos T. Am. Geophys. Un., 85, 265–269, 2004. a
Bond, W. J., Woodward, F. I., and Midgley, G. F.: The global distribution of ecosystems in a world without fire, New Phytol., 165, 525–538, 2005. a
Cannon, W. A.: The root habits of desert plants, vol. 131, Carnegie Institution of Washington, 1911. a
Cowling, R. M., Rundel, P. W., Lamont, B. B., Arroyo, M. K., and Arianoutsou, M.: Plant diversity in Mediterranean-climate regions, Trends Ecol. Evol., 11, 362–366, 1996. a
Cox, P. M.: Description of the “TRIFFID” dynamic global vegetation model, Met Office, 2001. a
Daly, C., Bachelet, D., Lenihan, J. M., Neilson, R. P., Parton, W., and Ojima, D.: Dynamic simulation of tree–grass interactions for global change studies, Ecol. Appl., 10, 449–469, 2000. a
Davis, S. H., Vertessy, R. A., Dunkerley, D. L., and Mein, R. G.: The influence of scale on the measurement of saturated hydraulic conductivity in forest soils, in: National Conference Publication-Institution of Engineers Australia NCP, vol. 1, pp. 103–108, Institution of Engineers, Australia, 1996. a
Dralle, D. N., Hahm, W. J., Rempe, D. M., Karst, N. J., Thompson, S. E., and Dietrich, W. E.: Quantification of the seasonal hillslope water storage that does not drive streamflow, Hydrol. Process., 32, 1978–1992, 2018. a, b, c, d, e
Dralle, D. N., Hahm, W. J., Chadwick, K. D., McCormick, E., and Rempe, D. M.: Technical note: Accounting for snow in the estimation of root zone water storage capacity from precipitation and evapotranspiration fluxes, Hydrol. Earth Syst. Sci., 25, 2861–2867, https://doi.org/10.5194/hess-25-2861-2021, 2021. a, b
Dralle, D. N., Hahm, W. J., and Rempe, D.: Inferring hillslope groundwater recharge ratios from the storage–discharge relation, Geophys. Res. Lett., 50, e2023GL104255, https://doi.org/10.1029/2023GL104255, 2023a. a
Dralle, D. N., Rossi, G., Georgakakos, P., Hahm, W. J., Rempe, D. M., Blanchard, M., Power, M., Dietrich, W., and Carlson, S.: The salmonid and the subsurface: Hillslope storage capacity determines the quality and distribution of fish habitat, Ecosphere, 14, e4436, https://doi.org/10.1002/ecs2.4436, 2023b. a
Dunne, T. and Black, R. D.: Partial area contributions to storm runoff in a small New England watershed, Water Resour. Res., 6, 1296–1311, 1970. a, b
Eliades, M., Bruggeman, A., Lubczynski, M. W., Christou, A., Camera, C., and Djuma, H.: The water balance components of Mediterranean pine trees on a steep mountain slope during two hydrologically contrasting years, J. Hydrol., 562, 712–724, 2018. a
Elsenbeer, H., Newton, B. E., Dunne, T., and de Moraes, J. M.: Soil hydraulic conductivities of latosols under pasture, forest and teak in Rondonia, Brazil, Hydrol. Process., 13, 1417–1422, 1999. a
Fan, Y., Clark, M., Lawrence, D. M., Swenson, S., Band, L. E., Brantley, S. L., Brooks, P. D., Dietrich, W. E., Flores, A., Grant, G., Kirchner, J. W., Mackay, D. S., McDonnell, J. J., Milly, P. C. D., Sullivan, P. L., Tague, C., Ajami, H., Chaney, N., Hartmann, A., Hazenberg, P., McNamara, J., Pelletier, J., Perket, J., Rouholahnejad‐Freund, E., Wagener, T., Zeng, X., Beighley, E., Buzan, J., Huang, M., Livneh, B., Mohanty, B. P., Nijssen, B., Safeeq, M., Shen, C., van Verseveld, W., Volk, J., and Yamazaki, D.: Hillslope hydrology in global change research and earth system modeling, Water Resour. Res., 55, 1737–1772, 2019. a, b
Feddes, R. A., Hoff, H., Bruen, M., Dawson, T., De Rosnay, P., Dirmeyer, P., Jackson, R. B., Kabat, P., Kleidon, A., Lilly, A., and Pitman, A. J.: Modeling root water uptake in hydrological and climate models, B. Am. Meteorol. Soc., 82, 2797–2810, 2001. a, b
Feng, X., Thompson, S. E., Woods, R., and Porporato, A.: Quantifying asynchronicity of precipitation and potential evapotranspiration in Mediterranean climates, Geophys. Res Lett., 46, 14692–14701, 2019. a
Friend, A., Stevens, A., Knox, R., and Cannell, M.: A process-based, terrestrial biosphere model of ecosystem dynamics (Hybrid v3.0), Ecol. Model., 95, 249–287, 1997. a
Gan, R., Zhang, Y., Shi, H., Yang, Y., Eamus, D., Cheng, L., Chiew, F. H., and Yu, Q.: Use of satellite leaf area index estimating evapotranspiration and gross assimilation for Australian ecosystems, Ecohydrology, 11, e1974, https://doi.org/10.1002/eco.1974, 2018. a
Gao, H., Fenicia, F., and Savenije, H. H. G.: HESS Opinions: Are soils overrated in hydrology?, Hydrol. Earth Syst. Sci., 27, 2607–2620, https://doi.org/10.5194/hess-27-2607-2023, 2023. a
Gerten, D., Schaphoff, S., Haberlandt, U., Lucht, W., and Sitch, S.: Terrestrial vegetation and water balance—hydrological evaluation of a dynamic global vegetation model, J. Hydrol., 286, 249–270, 2004. a, b
Godsey, S. and Elsenbeer, H.: The soil hydrologic response to forest regrowth: a case study from southwestern Amazonia, Hydrol. Process., 16, 1519–1522, 2002. a
Gordon, W., Famiglietti, J., Fowler, N., Kittel, T., and Hibbard, K.: Validation of simulated runoff from six terrestrial ecosystem models: results from VEMAP, Ecol. Appl., 14, 527–545, 2004. a
Grant, G. E. and Dietrich, W. E.: The frontier beneath our feet, Water Resour. Res., 53, 2605–2609, 2017. a
Grindley, J.: Calculated soil moisture deficits in the dry summer of 1959 and forecast dates of first appreciable runoff, International Association of Scientific Hydrology, pp. 109–120, 1960. a
Grindley, J.: The estimation of soil moisture deficits, Water for Peace: Water Supply Technology, 3, 241, 1968. a
Gupta, H. V., Kling, H., Yilmaz, K. K., and Martinez, G. F.: Decomposition of the mean squared error and NSE performance criteria: Implications for improving hydrological modelling, J. Hydrol., 377, 80–91, 2009. a, b
Hahm, W. J., Rempe, D. M., Dralle, D. N., Dawson, T. E., Lovill, S. M., Bryk, A. B., Bish, D. L., Schieber, J., and Dietrich, W. E.: Lithologically controlled subsurface critical zone thickness and water storage capacity determine regional plant community composition, Water Resour. Res., 55, 3028–3055, 2019. a, b, c, d, e, f, g
Hahm, W. J., Rempe, D., Dralle, D., Dawson, T., and Dietrich, W.: Oak transpiration drawn from the weathered bedrock vadose zone in the summer dry season, Water Resour. Res., 56, e2020WR027419, https://doi.org/10.1029/2020WR027419, 2020. a, b, c
Hahm, W. J., Dralle, D. N., Sanders, M., Bryk, A. B., Fauria, K. E., Huang, M.-H., Hudson-Rasmussen, B., Nelson, M. D., Pedrazas, M. A., Schmidt, L., Whiting, J., Dietrich, W. E., and Rempe, D. M.: Bedrock vadose zone storage dynamics under extreme drought: consequences for plant water availability, recharge, and runoff, Water Resour. Res., 58, e2021WR031781, https://doi.org/10.1029/2021WR031781, 2022. a, b, c, d
Hahm, W. J., Dralle, D. N., Lapides, D. A., Ehlert, R. S., and Rempe, D. M.: Geologic controls on apparent root‐zone storage capacity, Water Resour. Res., 60, e2023WR035362, https://doi.org/10.22541/essoar.168500262.25691702/v1, 2024. a
Hickler, T., Smith, B., Sykes, M. T., Davis, M. B., Sugita, S., and Walker, K.: Using a generalized vegetation model to simulate vegetation dynamics in northeastern USA, Ecology, 85, 519–530, 2004. a
Hickler, T., Prentice, I. C., Smith, B., Sykes, M. T., and Zaehle, S.: Implementing plant hydraulic architecture within the LPJ Dynamic Global Vegetation Model, Global Ecol. Biogeogr., 15, 567–577, 2006. a, b
Hickler, T., Vohland, K., Feehan, J., Miller, P. A., Smith, B., Costa, L., Giesecke, T., Fronzek, S., Carter, T. R., Cramer, W., Kühn, I., and Sykes, M. T.: Projecting the future distribution of European potential natural vegetation zones with a generalized, tree species-based dynamic vegetation model, Global Ecol. Biogeogr., 21, 50–63, 2012. a, b
Horton, R. E.: The role of infiltration in the hydrologic cycle, Eos T. Am. Geophys. Un., 14, 446–460, 1933. a
Horton, R. E.: Erosional development of streams and their drainage basins; hydrophysical approach to quantitative morphology, Geol. Soc. Am. Bull., 56, 275–370, 1945. a
Jayko, A., Blake, M., McLaughlin, R., Ohlin, H., Ellen, S., and Kelsey, H.: Reconnaissance geologic map of the Covelo 30-by 60-minute quadrangle, northern California, Tech. rep., US Government Printing Office, 1989. a
Jiménez-Rodríguez, C. D., Sulis, M., and Schymanski, S.: Exploring the role of bedrock representation on plant transpiration response during dry periods at four forested sites in Europe, Biogeosciences, 19, 3395–3423, https://doi.org/10.5194/bg-19-3395-2022, 2022. a
Jin, S., Dewitz, J., Li, C., Sorenson, D., Zhu, Z., Shogib, M. R. I., Danielson, P., Granneman, B., Costello, C., Case, A., and Glass, L.: National Land Cover Database 2019: A Comprehensive Strategy for Creating the 1986–2019 Forest Disturbance Product, J. Remote Sens., 3, 0021, https://doi.org/10.34133/remotesensing.0021, 2023. a, b
Joshi, J., Stocker, B. D., Hofhansl, F., Zhou, S., Dieckmann, U., and Prentice, I. C.: Towards a unified theory of plant photosynthesis and hydraulics, Nat. Plants, 8, 1304–1316, 2022. a
Keenan, T., Sabate, S., and Gracia, C.: Soil water stress and coupled photosynthesis–conductance models: Bridging the gap between conflicting reports on the relative roles of stomatal, mesophyll conductance and biochemical limitations to photosynthesis, Agr. Forest Meteorol., 150, 443–453, 2010. a
Kirchner, J. W.: Getting the right answers for the right reasons: Linking measurements, analyses, and models to advance the science of hydrology, Water Resour. Res., 42, 3, https://doi.org/10.1029/2005WR004362, 2006. a
Kottek, M., Grieser, J., Beck, C., Rudolf, B., and Rubel, F.: World map of the Köppen–Geiger climate classification updated, Meteorol. Z., 15, 3, https://doi.org/10.1127/0941-2948/2006/0130, 2006. a, b, c
Langan, L., Higgins, S. I., and Scheiter, S.: Climate-biomes, pedo-biomes or pyro-biomes: which world view explains the tropical forest–savanna boundary in South America?, J. Biogeogr., 44, 2319–2330, 2017. a
Lapides, D. A., Hahm, W. J., Rempe, D. M., Dietrich, W. E., and Dralle, D. N.: Controls on stream water age in a saturation overland flow-dominated catchment, Water Resour. Res., 58, e2021WR031665, https://doi.org/10.1029/2021WR031665, 2022. a, b, c
Lapides, D. A., Hahm, W. J., Forrest, M., Rempe, D. M., Hickler, T., and Dralle, D. N.: Lapides LPJ Rock Moisture 2023, Cyverse [data set], https://data.cyverse.org/dav-anon/iplant/home/danalapides/Lapides_LPJ_Rock_Moisture_2023, last accessed: 9 April 2024. a
Lawlor, D. W. and Tezara, W.: Causes of decreased photosynthetic rate and metabolic capacity in water-deficient leaf cells: a critical evaluation of mechanisms and integration of processes, Ann. Bot.-London, 103, 561–579, 2009. a
Lawrence, D. M., Fisher, R. A., Koven, C. D., Oleson, K. W., Swenson, S. C., Bonan, G., Collier, N., Ghimire, B., van Kampenhout, L., Kennedy, D., Kluzek, E., Lawrence, P J., Li, F., Li, H., Lombardozzi, D., Riley, W. J., Sacks, W. J., Shi, M., Vertenstein, M, Wieder, W. R., Xu, C., Ali, A. A., Badger, A. M., Bisht, G., van den Broeke, M., Brunke, M. A., Burns, S. P., Buzan, J., Clark, M., Craig, A., Dahlin, K., Drewniak, B., Fisher, J. B., Flanner, M., Fox, A. M., Gentine, P., Hoffman, F., Keppel-Aleks, G., Knox, R., Kumar, S., Lenaerts, J., Leung, L R., Lipscomb, W. H., Lu, Y., Pandey, A., Pelletier, J. D., Perket, J., Randerson, J. T., Ricciuto, D. M., Sanderson, B. M., Slater, A., Subin, Z. M., Tang, J., Thomas, R. Q., Martin, M. V., and Zeng, X.: CLM5 documentation, in: Technical Report, National Center for Atmospheric Research, 2019. a
Lee, J.-Y., Marotzke, J., Bala, G., Cao, L., Corti, S., Dunne, J. P., Engelbrecht, F., Fischer, E., Fyfe, J. C., Jones, C., Maycock, A., Mutemi, J., Ndiaye, O., Panickal, S., and Zhou, T.: Future global climate: scenario-based projections and near-term information, in: Climate change 2021: The physical science basis. Contribution of working group to the sixth assessment report of the intergovernmental panel on climate change, Cambridge University Press, pp. 553–672, 2021. a
Link, P., Simonin, K., Maness, H., Oshun, J., Dawson, T., and Fung, I.: Species differences in the seasonality of evergreen tree transpiration in a Mediterranean climate: Analysis of multiyear, half-hourly sap flow observations, Water Resour. Res., 50, 1869–1894, 2014. a
Lovill, S., Hahm, W., and Dietrich, W.: Drainage from the critical zone: Lithologic controls on the persistence and spatial extent of wetted channels during the summer dry season, Water Resour. Res., 54, 5702–5726, 2018. a
Luković, J., Chiang, J. C., Blagojević, D., and Sekulić, A.: A later onset of the rainy season in California, Geophys. Res Lett., 48, e2020GL090350, https://doi.org/10.1029/2020GL090350, 2021. a
Maysonnave, J., Delpierre, N., François, C., Jourdan, M., Cornut, I., Bazot, S., Vincent, G., Morfin, A., and Berveiller, D.: Contribution of deep soil layers to the transpiration of a temperate deciduous forest: Implications for the modelling of productivity, Sci. Total Environ., 838, 155981, https://doi.org/10.1016/j.scitotenv.2022.155981, 2022. a
McCormick, E. L., Dralle, D. N., Hahm, W. J., Tune, A. K., Schmidt, L. M., Chadwick, K. D., and Rempe, D. M.: Widespread woody plant use of water stored in bedrock, Nature, 597, 225–229, 2021. a, b, c, d, e, f
McDowell, N. G.: Mechanisms linking drought, hydraulics, carbon metabolism, and vegetation mortality, Plant Physiol., 155, 1051–1059, 2011. a
Milly, P. and Dunne, K.: Sensitivity of the global water cycle to the water-holding capacity of land, J. Climate, 7, 506–526, 1994. a
Moorcroft, P. R., Hurtt, G. C., and Pacala, S. W.: A method for scaling vegetation dynamics: the ecosystem demography model (ED), Ecol. Monogr., 71, 557–586, 2001. a
Myneni, R., Knyazikhin, Y., and Park, T.: MODIS/Terra Leaf Area Index/FPAR 8-Day L4 Global 500m SIN Grid V061 [Data set], Tech. rep., NASA EOSDIS Land Processes DAAC, https://doi.org/10.5067/MODIS/MOD15A2H.061, 2021. a
Pappas, C., Fatichi, S., Leuzinger, S., Wolf, A., and Burlando, P.: Sensitivity analysis of a process-based ecosystem model: Pinpointing parameterization and structural issues, J. Geophys. Res.-Biogeo., 118, 505–528, 2013. a, b, c, d, e
Parmesan, C., Morecroft, M. D., Trisurat, Y., Adrian, R., Anshari, G. Z., Arneth, A., Gao, Q., Gonzalez, P., Harris, R., Price, J., Stevens, N., and Talukdarr, G. H.: Terrestrial and freshwater ecosystems and their services, Cambridge University Press, 2022. a
Pelletier, J. D., Barron-Gafford, G. A., Gutiérrez-Jurado, H., Hinckley, E. S., Istanbulluoglu, E., McGuire, L. A., Niu, G.-Y., Poulos, M. J., Rasmussen, C., Richardson, P., Swetnam, T. L., and Tucker, G. E.: Which way do you lean? Using slope aspect variations to understand Critical Zone processes and feedbacks, Earth Surf. Proc. Land., 43, 1133–1154, 2018. a
Piedallu, C., Gégout, J.-C., Perez, V., and Lebourgeois, F.: Soil water balance performs better than climatic water variables in tree species distribution modelling, Global Ecol. Biogeogr., 22, 470–482, 2013. a
Pitman, A.: The evolution of, and revolution in, land surface schemes designed for climate models, Int. J. Climatol., 23, 479–510, 2003. a
Pollard, D. and Thompson, S. L.: Use of a land-surface-transfer scheme (LSX) in a global climate model: the response to doubling stomatal resistance, Global Planet. Change, 10, 129–161, 1995. a
PRISM Climate Group: PRISM Gridded Climate Data, Oregon State University, https://prism.oregonstate.edu, data created 4 February 2014 (last access: August 2022), 2014. a, b
Rempe, D. M. and Dietrich, W. E.: Direct observations of rock moisture, a hidden component of the hydrologic cycle, P. Natl. Acad. Sci. USA, 115, 2664–2669, 2018. a, b, c, d
Rempe, D. M., McCormick, E. L., Hahm, W. J., Persad, G., Cummins, C., Lapides, D. A., Chadwick, K. D., and Dralle, D. N.: Mechanisms underlying the vulnerability of seasonally dry ecosystems to drought, https://doi.org/10.31223/X5XW7D, 2023. a, b
Riebe, C. S., Hahm, W. J., and Brantley, S. L.: Controls on deep critical zone architecture: A historical review and four testable hypotheses, Earth Surf. Proc. Land., 42, 128–156, 2017. a
Rose, K. L.: Water source utilization and seasonal root dynamics of Pinus jeffreyi and Arctostaphylos patula on thin soils over weathered bedrock, University of California, Riverside, 2003. a, b
Ruiz, L., Varma, M. R., Kumar, M. M., Sekhar, M., Maréchal, J.-C., Descloitres, M., Riotte, J., Kumar, S., Kumar, C., and Braun, J.-J.: Water balance modelling in a tropical watershed under deciduous forest (Mule Hole, India): Regolith matric storage buffers the groundwater recharge process, J. Hydrol., 380, 460–472, 2010. a
Sakschewski, B., von Bloh, W., Drüke, M., Sörensson, A. A., Ruscica, R., Langerwisch, F., Billing, M., Bereswill, S., Hirota, M., Oliveira, R. S., Heinke, J., and Thonicke, K.: Variable tree rooting strategies are key for modelling the distribution, productivity and evapotranspiration of tropical evergreen forests, Biogeosciences, 18, 4091–4116, https://doi.org/10.5194/bg-18-4091-2021, 2021. a
Salve, R., Rempe, D. M., and Dietrich, W. E.: Rain, rock moisture dynamics, and the rapid response of perched groundwater in weathered, fractured argillite underlying a steep hillslope, Water Resour. Res., 48, 11, https://doi.org/10.1029/2012WR012583, 2012. a, b, c, d
Sato, H., Itoh, A., and Kohyama, T.: SEIB–DGVM: A new Dynamic Global Vegetation Model using a spatially explicit individual-based approach, Ecol. Model., 200, 279–307, 2007. a
Schwinning, S.: The ecohydrology of roots in rocks, Ecohydrology: Ecosystems, land and water process interactions, Ecohydrogeomorphology, 3, 238–245, 2010. a, b, c
Seiler, C., Melton, J. R., Arora, V. K., Sitch, S., Friedlingstein, P., Anthoni, P., Goll, D., Jain, A. K., Joetzjer, E., Lienert, S., Lombardozzi, D., Luyssaert, S., Nabel, J. E. M. S., Tian, H., Vuichard, N., Walker, A. P., Yuan, W., and Zaehle, S.: Are terrestrial biosphere models fit for simulating the global land carbon sink?, J. Adv. Model. Earth Sy., 14, e2021MS002946, https://doi.org/10.1029/2021MS002946, 2022. a, b, c
Sitch, S., Smith, B., Prentice, I. C., Arneth, A., Bondeau, A., Cramer, W., Kaplan, J. O., Levis, S., Lucht, W., Sykes, M. T., Thonicke, K., and Venevsky, S.: Evaluation of ecosystem dynamics, plant geography and terrestrial carbon cycling in the LPJ dynamic global vegetation model, Glob. Change Biol., 9, 161–185, 2003. a, b, c
Smith, B., Prentice, I. C., and Sykes, M. T.: Representation of vegetation dynamics in the modelling of terrestrial ecosystems: comparing two contrasting approaches within European climate space, Global Ecol. Biogeogr., 10, 621–637, 2001. a, b, c, d
Smith, B., Wårlind, D., Arneth, A., Hickler, T., Leadley, P., Siltberg, J., and Zaehle, S.: Implications of incorporating N cycling and N limitations on primary production in an individual-based dynamic vegetation model, Biogeosciences, 11, 2027–2054, https://doi.org/10.5194/bg-11-2027-2014, 2014. a, b, c, d
Soil Survey Staff: Gridded National Soil Survey Geographic (gNATSGO) Database for the Conterminous United States, Tech. rep., United States Department of Agriculture, Natural Resources Conservation Service, https://nrcs.app.box.com/v/soils (last access: 9 April 2024), 2019a. a
Soil Survey Staff: Gridded National Soil Survey Geographic (gNATSGO) Database for the Conterminous United States, 2019b. a, b
Spence, C.: A paradigm shift in hydrology: Storage thresholds across scales influence catchment runoff generation, Geography Compass, 4, 819–833, 2010. a
Steinkamp, J. and Hickler, T.: Is drought-induced forest dieback globally increasing?, J. Ecol., 103, 31–43, 2015. a
Stocker, B. D., Wang, H., Smith, N. G., Harrison, S. P., Keenan, T. F., Sandoval, D., Davis, T., and Prentice, I. C.: P-model v1.0: an optimality-based light use efficiency model for simulating ecosystem gross primary production, Geosci. Model Dev., 13, 1545–1581, https://doi.org/10.5194/gmd-13-1545-2020, 2020. a
Sun, Y., Wang, C., Chen, H. Y., and Ruan, H.: Response of plants to water stress: a meta-analysis, Front. Plant Sci., 11, 978, https://doi.org/10.3389/fpls.2020.00978, 2020. a
Swain, D. L.: A shorter, sharper rainy season amplifies California wildfire risk, Geophys. Res Lett., 48, e2021GL092843, https://doi.org/10.1029/2021GL092843, 2021. a
Swain, D. L., Langenbrunner, B., Neelin, J. D., and Hall, A.: Increasing precipitation volatility in twenty-first-century California, Nat. Clim. Change, 8, 427–433, 2018. a
Tang, J., Pilesjö, P., Miller, P. A., Persson, A., Yang, Z., Hanna, E., and Callaghan, T. V.: Incorporating topographic indices into dynamic ecosystem modelling using LPJ-GUESS, Ecohydrology, 7, 1147–1162, 2014. a
Tang, J., Miller, P. A., Crill, P. M., Olin, S., and Pilesjö, P.: Investigating the influence of two different flow routing algorithms on soil–water–vegetation interactions using the dynamic ecosystem model LPJ-GUESS, Ecohydrology, 8, 570–583, 2015. a
Tardieu, F., Granier, C., and Muller, B.: Water deficit and growth. Co-ordinating processes without an orchestrator?, Curr. Opin. Plant Biol., 14, 283–289, 2011. a
Tezara, W., Mitchell, V., Driscoll, S., and Lawlor, D.: Water stress inhibits plant photosynthesis by decreasing coupling factor and ATP, Nature, 401, 914–917, 1999. a
Thornton, M., Shrestha, R., Wei, Y., Thornton, P., Kao, S., Wilson, B., Mayer, B., Wei, Y., Devarakonda, R., and Vose, R.: Daymet: daily surface weather data on a 1-km grid for North America, Version 4 R1, Single Pixel Extraction Tool | Daymet (ornl. gov), ORNL DAAC, Oak Ridge, Tennessee, USA, 2022. a
Tuzet, A., Perrier, A., and Leuning, R.: A coupled model of stomatal conductance, photosynthesis and transpiration, Plant Cell Environ., 26, 1097–1116, 2003. a
Vico, G. and Porporato, A.: Modelling C 3 and C 4 photosynthesis under water-stressed conditions, Plant Soil, 313, 187–203, 2008. a
Wang, S., Xu, M., Zhang, X., and Wang, Y.: Fitting Nonlinear Equations with the Levenberg–Marquardt Method on Google Earth Engine, Remote Sens.-Basel, 14, 2055, https://doi.org/10.3390/rs14092055, 2022. a
Wang-Erlandsson, L., Bastiaanssen, W. G. M., Gao, H., Jägermeyr, J., Senay, G. B., van Dijk, A. I. J. M., Guerschman, J. P., Keys, P. W., Gordon, L. J., and Savenije, H. H. G.: Global root zone storage capacity from satellite-based evaporation, Hydrol. Earth Syst. Sci., 20, 1459–1481, https://doi.org/10.5194/hess-20-1459-2016, 2016. a, b
Wolf, A., Blyth, E., Harding, R., Jacob, D., Keup-Thiel, E., Goettel, H., and Callaghan, T.: Sensitivity of an ecosystem model to hydrology and temperature, Climatic Change, 87, 75–89, 2008a. a
Wolf, A., Callaghan, T. V., and Larson, K.: Future changes in vegetation and ecosystem function of the Barents Region, Climatic Change, 87, 51–73, 2008b. a
Zhang, Y., Peña-Arancibia, J. L., McVicar, T. R., Chiew, F. H., Vaze, J., Liu, C., Lu, X., Zheng, H., Wang, Y., Liu, Y. Y., Miralles, D. G., and Pan, M.: Multi-decadal trends in global terrestrial evapotranspiration and its components, Sci. Rep.-UK, 6, 1–12, 2016. a
Zhang, Y., Kong, D., Gan, R., Chiew, F. H., McVicar, T. R., Zhang, Q., and Yang, Y.: Coupled estimation of 500 m and 8-day resolution global evapotranspiration and gross primary production in 2002–2017, Remote Sens. Environ., 222, 165–182, 2019. a, b, c, d
Zweifel, R., Zimmermann, L., Zeugin, F., and Newbery, D. M.: Intra-annual radial growth and water relations of trees: implications towards a growth mechanism, J. Exp. Bot., 57, 1445–1459, 2006. a
- Abstract
- Introduction
- Methods
- Results
- Discussion
- Conclusions
- Appendix A: Model evaluation – runoff
- Appendix B: Additional CONUS-wide results
- Appendix C: Root distribution and water uptake impacts on transpiration
- Code and data availability
- Author contributions
- Competing interests
- Disclaimer
- Acknowledgements
- Review statement
- References