the Creative Commons Attribution 4.0 License.
the Creative Commons Attribution 4.0 License.
 | 24 Apr 2024
Forest-floor respiration, N2O fluxes, and CH4 fluxes in a subalpine spruce forest: drivers and annual budgets
Susanne Burri
Iris Feigenwinter
Mana Gharun
Philip Meier
Nina Buchmann
Forest ecosystems play an important role in the global carbon (C) budget by sequestering a large fraction of anthropogenic carbon dioxide (CO2) emissions and by acting as important methane (CH4) sinks. The forest-floor greenhouse gas (GHG; CO2, CH4, and nitrous oxide (N2O)) flux, i.e., from soil and understory vegetation, is one of the major components to consider when determining the C or GHG budget of forests. Although winter fluxes are essential to determine the annual C budget, only very few studies have examined long-term, year-round forest-floor GHG fluxes. Thus, we aimed to (i) quantify seasonal and annual variations of forest-floor GHG fluxes; (ii) evaluate their drivers, including the effects of snow cover, timing, and amount of snowmelt; and (iii) calculate annual budgets of forest-floor GHG fluxes for a subalpine spruce forest in Switzerland. We measured GHG fluxes year-round during 4 years with four automatic large chambers at the ICOS Class 1 Ecosystem station Davos (CH-Dav). We applied random forest models to investigate environmental drivers and to gap-fill the flux time series. The forest floor emitted 2336 g CO2 m−2 yr−1 (average over 4 years). Annual and seasonal forest-floor respiration responded most strongly to soil temperature and snow depth. No response of forest-floor respiration to leaf area index or photosynthetic photon flux density was observed, suggesting a strong direct control of soil environmental factors and a weak, or even lacking, indirect control of canopy biology. Furthermore, the forest floor was a consistent CH4 sink (−0.71 g CH4 m−2 yr−1), with annual fluxes driven mainly by snow depth. Winter CO2 fluxes were less important for the CO2 budget (6.0 %–7.3 %), while winter CH4 fluxes contributed substantially to the annual CH4 budget (14.4 %–18.4 %). N2O fluxes were very low (0.007 g N2O m−2 yr−1), negligible for the forest-floor GHG budget at our site. In 2022, the warmest year on record with below-average precipitation at the Davos site, we observed a substantial increase in forest-floor respiration compared with other years. The mean forest-floor GHG budget indicated emissions of 2319 ± 200 g CO2 eq. m−2 yr−1 (mean ± standard deviation (SD) over all years), with respiration fluxes dominating and CH4 offsetting a very small proportion (0.8 %) of the CO2 emissions. Due to the relevance of snow cover, we recommend year-round measurements of GHG fluxes with high temporal resolution. In a future with increasing temperatures and less snow cover due to climate change, we expect increased forest-floor respiration at this subalpine site modulating the carbon sink of the forest ecosystem.
- Article
(9188 KB) - Full-text XML
- BibTeX
- EndNote


Carbon dioxide (CO2), methane (CH4), and nitrous oxide (N2O) are the three main greenhouse gases (GHGs) driving global warming. Forest ecosystems play an important role in the global carbon (C) cycle by sequestering a large fraction of anthropogenic CO2 emissions and by acting as an important CH4 sink (Borken et al., 2006; Ni and Groffman, 2018; Friedlingstein et al., 2023). The GHG flux of the forest floor, i.e., soil and understory vegetation, is one of the major components to consider when determining the C budget of forests, since soil respiration is the second largest terrestrial C flux and accounts for approximately 70 % of CO2 losses in temperate forests (IPCC, 2021; Yuste et al., 2005). However, how forest-floor GHG fluxes will respond to climate change is still largely unknown.
Global warming particularly affects high latitude and high altitude forests (IPCC, 2021), altering the snowfall, length, and timing of snow cover, as well as melting and soil freeze–thaw cycles (CH2018, 2018; Klein et al., 2016). Nevertheless, there have been very few studies that examined continuous, year-round, and long-term forest-floor GHG fluxes in high latitude or high altitude forests (Barba et al., 2019; Luo et al., 2011). Unfortunately, measurements during periods with snow cover are challenging and thus often lacking due to logistical reasons, leading to winter fluxes missing even from multi-year studies (e.g., Richardson et al., 2019).
Forest-floor CO2 fluxes include photosynthetic CO2 uptake by plants as well as autotrophic and heterotrophic respiratory losses from plants and soils, respectively (Hanson et al., 2000). All three processes and their contributions to the total soil CO2 fluxes depend on biotic and abiotic factors as well as their interactions. For example, soil respiration is coupled to canopy photosynthesis and thus to incoming radiation, but it is also strongly controlled by soil conditions (i.e., soil temperature and moisture), substrate availability, and the microbial community (e.g., Högberg et al., 2001; Janssens et al., 2001; Scott-Denton et al., 2006). Furthermore, winter dynamics can impact soil respiration rates through changes in snow cover, soil freezing, and thawing cycles (Reinmann and Templer, 2018; Schindlbacher et al., 2007). Especially, freeze–thaw events have recently been the focus of research because they cause abrupt changes in biophysical soil conditions which can alter autotrophic and heterotrophic soil respiration rates (Song et al., 2017). How soil respiration responds to climate change is, however, not fully clear. With increasing soil temperatures as a consequence of increasing air temperatures (Lembrechts et al., 2022), global observations and models show a trend in globally rising soil respiration over recent decades and a continuation of the increase with progressing climate change (Bond-Lamberty et al., 2018; Nissan et al., 2023). At the same time, there is evidence for a thermal optimum of ecosystem respiration over a range of different biomes, indicating a non-monotonic relationship between soil temperature and respiration (Chen et al., 2023).
Forest soils have been shown to act as an atmospheric CH4 sink (Dutaur and Verchot, 2007). The uptake of CH4 in well-aerated soils is related to the presence of methane-oxidizing bacteria (Saunois et al., 2020). This process is highly dependent on environmental factors, including soil temperature (Tsoil), soil texture (transport of CH4 into the soil), soil moisture (transport of CH4 into the soil and limitation of bacterial activity), and soil nitrogen (N) content (Borken et al., 2006; Luo et al., 2013; Ni and Groffman, 2018). Furthermore, biotic factors, such as plant cover, can affect CH4 uptake of the forest floor through the presence of Sphagnum moss species which are inhabited by methane-oxidizing bacteria (Basiliko et al., 2004). Generally, in temperate forests, CH4 uptake increases in warmer and drier soils (Borken et al., 2006; Ni and Groffman, 2018). Winter dynamics further impact CH4 fluxes, with frozen soil and snow cover affecting microbial activity and gas transport (Blankinship et al., 2018; Borken et al., 2006). Understanding the drivers of forest-floor CH4 fluxes, including the complex interplay between biotic and abiotic factors, is vital for accurately modeling and predicting the role of forest ecosystems in the global CH4 cycle.
Moreover, the forest floor can act as a source or sink of N2O (Chapuis-Lardy et al., 2007; Goldberg et al., 2010). Soil temperature, soil moisture, and N availability significantly influence N2O fluxes through regulating microbial processes which are mainly responsible for N2O production in soils, i.e., nitrification and denitrification (Schaufler et al., 2010). High N2O emission rates in temperate forests have been found under warm and moist conditions (Luo et al., 2013). Furthermore, high N2O emissions occur during freezing–thawing cycles and rewetting events, when abrupt changes in temperature and moisture conditions promote microbial activity and thus the release of N2O (Goldberg et al., 2010; Papen and Butterbach-Bahl, 1999; Liu et al., 2018; Butterbach-Bahl et al., 2013). Understanding the dynamics of these processes and drivers, particularly during freezing–thawing cycles, is crucial for estimating N2O emissions from forests.
In this study, we investigated combined measurements of forest-floor respiration as well as CH4 and N2O fluxes in a subalpine Norway spruce forest (Davos, CH-Dav, ICOS Class 1 Ecosystem station), in response to biotic and environmental drivers, based on 4 years of year-round measurements (2017, 2020–2022). Our objectives were to (i) quantify seasonal and annual variations in climate variables and forest-floor respiration, as well as CH4 and N2O fluxes; (ii) evaluate the drivers of forest-floor GHG fluxes, including the effects of snow cover, timing, and amount of snowmelt; and (iii) calculate the annual budgets of forest-floor GHG fluxes. We hypothesized that the forest floor is a source of CO2 throughout the years, with large seasonal variability due to the temperature sensitivity of respiratory processes but very low N2O emissions due to the overall low N supply at the site. In contrast, we expected that the forest floor is a net sink of CH4, with soil temperature and snow dynamics being important drivers due to their impact on microbial activity and diffusion rates between soil and atmosphere. Thus, we expected the highest respiratory fluxes and CH4 uptake in 2022, an exceptionally warm year at our site. Overall, we anticipated the forest-floor GHG budget being mainly determined by respiration fluxes, with CH4 uptake only slightly offsetting the respiratory CO2 losses and N2O emissions being negligible.
2.1 Study site
The study site is a subalpine evergreen coniferous forest located in the eastern Swiss Alps at an altitude of 1640 m a.s.l. (Davos Seehornwald; CH-Dav; 46°48′55.2′′ N, 9°51′21.3′′ E). The total annual precipitation is 876 mm and the mean annual temperature is 4.3 °C (1997–2022). The site has been certified as an Integrated Carbon Observation System (ICOS) Class 1 Ecosystem station for eddy-covariance flux measurements since 2019. The dominant species is Norway spruce (Picea abies (L.) Karst), with an average tree height of 18 m (maximum 35 m), and a mean tree age of approximately 100 years (with some trees reaching over 300 years). Understory vegetation covers about 30 % of the surface and is mainly composed of blueberry (Vaccinium myrtillus and Vaccinium gaulterioides) and mosses (Sphagnum sp. Ehrh. and Hylocomium splendens). CH-Dav is a sustainably managed forest according to the Swiss National Forest Protection Law (1876; Tschopp, 2012). The soil types are Chromic Cambisols (L, F, and H layers with 1, 2, and 1.5 cm thickness, respectively; A, B(h), B(fe), B, and (B)Cv horizons with 0–4, 4–12, 12–45, 45–70, and > 70 cm depth, respectively) and Rustic Podzols (L, F, and H layers with 1, 3, and 7 cm thickness, respectively; Ah, (A)E, Bfe, BCv, and (B)Cv horizons with 0–3, 3–10, 10–40, 40–80, and > 80 cm soil depth, respectively; FAO classification; Jörg, 2008). Soil texture ranges from sand to sandy loam (Jörg, 2008). Soil bulk density at 5 cm depth of mineral soil is 0.27–0.35 g cm−3 (Saby et al., 2023). Soil C and N stocks (0–60 cm depth) are on average 142.3 and 5.1 t ha−1, respectively (Jörg, 2008).
2.2 Chamber flux measurements
2.2.1 Chamber setup and tests
Forest-floor respiration as well as CH4 and N2O fluxes were measured during the years 2017 and 2020–2022 using a fully automated system with four chambers (FF1–FF4), distributed within an area of 3600 m2 in the forest to represent the eddy-covariance footprint. Concentrations of CO2, CH4, and N2O were measured with a dual laser trace gas analyzer (TILDAS; Aerodyne Research, Billerica, MA, USA) since 2017. To ensure high measurement quality, laser temperatures and tuning rates were adjusted on a regular basis. After the measurement campaign in 2017, the TILDAS was sent to Aerodyne for maintenance and repair (new N2O laser source), and measurements of all three GHGs were resumed in fall 2019. In January 2021, the N2O laser broke, and thus N2O measurements stopped. Since November 2019, CO2 concentrations in the chambers were also measured with an infrared gas analyzer (LI-840; LI-COR Biosciences, Lincoln, NE, USA). For the year 2020, CO2 chamber measurements from both TILDAS and LI-840 were available and used for further analyses (see below). For 2021 and 2022, only the infrared gas analyzer CO2 measurements were used.
Chambers were designed according to Brümmer et al. (2017), following the ICOS research infrastructure protocol for chamber measurements (Pavelka et al., 2018). The large opaque polyvinyl chloride (PVC) chambers (white surfaces to increase albedo) rested on aluminum frames and were inserted 10 cm into the soil, sealed with ethylene propylene diene monomer gaskets. Their large size (75 cm length × 75 cm width× 50 cm height, approximately 281 dm3) allowed us to reduce edge effects as much as possible. Chambers were equipped with a pressure vent, as well as air temperature and pressure sensors (BME280; Bosch Sensortec, Reutlingen, Germany). During the winter periods with snowfall, extension frames (2 × 50 cm height) allowed to increase chamber height. A 17 watt geared electric motor (model 80807021; Crouzet, Valence, France) was used to move the entire PVC chamber vertically and horizontally by about 190 and 70 cm, respectively (Fig. A1). One webcam per chamber allowed remote observation of the operation as well as estimates of snow cover and depth (see below). Since the vegetation inside the chamber frames was not cut, the chamber setup measured forest-floor GHG fluxes (and not only soil fluxes). Due to their opaque material, no understory photosynthesis was measured with the chambers. Soil and vegetation cover inside the chambers (differentiated into three plant functional types: moss, grass, and blueberry) were assessed visually in June 2022, when also leaf area index (LAI) of the spruce forest was measured using digital photography above the chamber locations (Fuentes et al., 2008). One chamber cycle lasted 10 min, with 3 min for the actual measurement period (when chamber resided on the frame, i.e., was fully closed), 3.5 min for closing, and 3.5 min for opening the chambers (slow upward and sideward movement was controlled by an Arduino Ethernet). Thus, chambers were fully closed for 48 min d−1 (i.e., 3.3 % of the day), during which rainfall was fully excluded. If we added the time when the chambers were hovering directly over the frame (about 4 min per cycle), the chambers would be closed for a maximum of 7 min per chamber cycle (i.e., 7.8 % of the day). But this is a rather conservative estimate of rainfall exclusion, since rain does not always fall vertically, and throughfall is typically much less than bulk precipitation due to canopy interception. Together with further tests on potential chamber effects, i.e., soil water content (SWC) inside vs. outside for two chambers and 4 years, and Tsoil inside vs. outside for four chambers and 3 years (see Figs. A2–A4), we concluded that our chamber design and closure duration avoided potential effects on environmental conditions as much as possible.
During the 10 min cycles, concentrations were measured continuously once per second. The air from the chamber was fed to the gas analyzers in 6 mm OD tubing (Synflex 1300; Eaton, Dublin, Ireland) and pumped back to the chamber, forming a closed system. Tube lengths between chamber and instrument ranged between 49 and 85 m, and the flow rate ranged between 0.9 and 1.0 slpm (standard liters per minute). We determined the time lags for the arrival of gas in the instrument based on the change in chamber status (fully open or fully closed) and maximum CO2 concentrations measured. Switching of the air stream between different chambers and gas analyzers was accomplished using rotary selector valves (Valco Selectors; VICI AG International, Schenkon, Switzerland). Chamber cycles (lasting approximately 1 h for four chambers) were repeated every 3 h for each gas analyzer individually, leading to a total of 16 cycles per chamber and day (eight per gas analyzer). Leakage tests of all four chambers were performed in 2019. Variations caused by possible leakage were below 3 % of the measured flux, as required by the ICOS RI protocol (Pavelka et al., 2018).
2.2.2 Data processing and quality assessment
The concentration increase in the chamber headspace over time was used to determine the respective flux F using Eq. (1):
where is the concentration change over time (mol mol−1 s−1), V the actual chamber volume (m3), A the forest-floor area within the chamber frame (m2), m the molecular mass (dimensionless), Vm the molar volume (m3 mol−1) of the respective gas, p the mean chamber pressure (Pa), p0 the standard pressure (1013.25 Pa), T0 the standard temperature (273.15 K), and T the mean chamber temperature (K). We accounted for the varying chamber volume due to snow depth and additional extension frames installed during winter. Thus, the actual chamber volume was calculated using Eq. (2):
where hchamber is the height of the chamber, hframe the height of the extension frame(s), and hsnow the snow depth. We fitted a linear regression to the change in concentration of the respective gas over time () during the closed period of the chamber (180 s), excluding the first 20 s after closing. The R2 and root mean square error (RMSE) of the fit was later used for the quality assessment and filtering of the calculated fluxes (see below). A positive flux means release from the forest floor to the atmosphere, and a negative flux indicates uptake by the forest floor.
The quality of the calculated fluxes was ensured by removing negative CO2 fluxes (Step 1), removing outliers (Step 2, despiking), and applying a filter based on R2 for CO2 and CH4 and based on RMSE for N2O (Step 3). These three steps were applied to each GHG separately. In more detail, we took the following actions: (1) We excluded negative CO2 fluxes (about 2 % of all fluxes). (2) We despiked (i.e., removed outliers) the flux dataset with a running mean algorithm using a width of 30 d. Step 2 removed 0.2 %, 0.7 %, and 1.2 % of CO2, CH4, and N2O fluxes, respectively. (3) For CO2 and CH4 fluxes, we analyzed data separately for each gas and each chamber, as well as growing period (May to November) vs. dormant period (December to April), and based the quality assessment on R2 values. We removed fluxes with an R2 value below the 10th percentile of all R2 values in the respective period (except if R2>0.9) to avoid setting a fixed threshold for an acceptable R2. The 10th percentile of R2 values ranged from 0.21 to 0.99, being lower during the dormant compared with the growing period (Table A1). Step 3 excluded 6 % and 9 % of CO2 and CH4 fluxes, respectively. For N2O fluxes, we separated data of the 2 years available (2017 and 2020) to account for the replacement of the N2O laser source in 2019 and based the quality assessment on the RMSE (due to the low magnitude of the N2O fluxes). N2O fluxes with an RMSE below the 10th percentile of all RMSE, which were 0.13 and 0.03 for 2017 and 2020, respectively, were removed. Step 3 excluded 25 % of all N2O fluxes. Furthermore, for N2O, we estimated a minimum reliable flux with the specifications of the TILDAS instrument (precision of 0.03 ppb) and the closure time, i.e., any change in N2O concentrations in the chamber headspace during the measurement period had to be > 0.06 ppb (McManus et al., 2006) or > 29.1 nmol N2O m−2 h−1.
Overall, the initial time series consisted of 38 103 CO2 (in 2020 from two gas analyzers), 27 503 CH4, and 13 291 N2O flux measurements over the 4 years. After the quality checks described above, 34 938 CO2 (92 %), 25 083 CH4 (91 %), and 9823 N2O (74 %) flux measurements remained, which resulted in 4446, 3972, and 1755 daily means, respectively.
2.2.3 Static chamber measurements
In order to check for the validity of our N2O flux measurements using the automatic chambers, we performed N2O measurements using static chambers (dimensions of d=30 and h=30 cm; Hutchinson and Mosier, 1981). We used eight static chambers, i.e., four chambers next to the automatic chambers and four chambers placed randomly within the research area. Soil collars were installed 2 weeks prior to the first measurement campaign. Four rounds of measurements were done on 2 d in October 2023 (n=32), when soil temperature was between 5.5 and 12 °C, well above the long-term mean, and when the water-filled pore space (WFPS) at 5 cm depth was on average 13.1 %, favoring microbial activities. Three collars were irrigated between the first and second measurement round on the 2 d to simulate a heavy rainfall event, favoring denitrification. We left the chambers closed for 1 h and sampled air in the headspace every 20 min. Sampling and flux calculations were done as described in Barthel et al. (2022). All gas samples were analyzed at ETH Zurich for N2O mole fraction using gas chromatography (model 456-GC; Scion Instruments, Livingston, UK).
2.3 Environmental data
Each of the chambers were measured for soil water content (SWC) using a soil moisture sensor (model EC-5; Decagon Devices, Pullman, WA, USA) and for Tsoil using a temperature probe (model 107; Campbell Scientific, Logan, UT USA) at 5 cm soil depth in close vicinity (< 2 m away from the chamber). To account for potential drivers of canopy photosynthesis modulating forest-floor fluxes, photosynthetic photon flux density (PPFD; PAR LITE; Kipp and Zonen, Delft, the Netherlands), air temperature (TA; HygroClip HC2-S3; Rotronic, Basserdorf, Switzerland), and precipitation (PREC; model 1518H3; Lambrecht Meteo, Göttingen, Germany) data were used as well, measured at the tower above the tree canopy at 35 m height (precipitation measured at 25 m height).
We calculated water-filled pore space (WFPS) from the SWC measurements using Eq. (2):
Bulk density (BD) was calculated using the data from a soil sampling campaign done in July 2018 according to ICOS RI standards (Arrouays et al., 2018; Saby et al., 2023). Soil data were used from soil profiles closest to the respective chambers. (In total, data from six profiles were used.) Particle density (PD) was assumed to be constant at 2.65 g cm−3 (Danielson and Sutherland, 2018). Mean daily snow cover and snow depth per chamber were derived from webcam images using a custom-made Python image analysis tool, deriving snow depth from a scale installed in the vicinity of each chamber within the image section.
2.4 Statistical analyses
2.4.1 Driver analysis
We used conditional random forest (RF) models to model daily forest-floor respiration and CH4 fluxes (based on all years and chambers) and investigated their environmental drivers. Due to the low N2O fluxes, we excluded them from the RF analyses. We selected predictors which were known from the literature, i.e., daily averages of Tair, Tsoil at 5 cm depth, WFPS at 5 cm depth, and PPFD, as well as their 1 and 4 d leads (meaning that we shifted the variables forward in time by 1 and 4 d). Furthermore, we added snow depth and changes in snow depth from one day to another (Δ snow depth) to the predictor set. To account for factors which could explain differences in GHG fluxes among chambers, we included several chamber-specific characteristics (Table A2), i.e., LAI, bare soil fraction in the chambers, and total C and N stocks in the topsoil (litter, organic material layers, and 0–20 cm depth of mineral soil). We applied the function cforest from the R-package “party” which can deal with highly correlated predictor variables (v1.3.10; Strobl et al., 2007, 2008). Prior to model development, predictors and target variables were centered and scaled using the “caret” preProcess function, which brings all variables and measurements from different sensors and locations into the same range, improving performance of the RF models (v6.0.93; Kuhn, 2008). The hyperparameter fitting was done using the train function from the R-package “caret” (see Appendix for final model setup) using 10-fold cross-validation. The assessment of driver importance in the RF model was done using the R package “permimp” which accounts for correlated variables within the predictor set (v.1.0.2; Strobl et al., 2007; Debeer and Strobl, 2020; Debeer et al., 2021). The calculated values for driver importance were rescaled to values between 0 and 1 using a min–max normalization.
We developed RF models separately for daily CO2 and CH4 fluxes (N=4446 and 3972, respectively). The training of the RF was done using only a fraction of the dataset (70 %). The remaining 30 % of the dataset was used as a test dataset to evaluate model performance. Centering and scaling were done separately for the training and test datasets to avoid data leakage. The performance of the RF models was assessed using R2 and RMSE. During model development, we tested several different predictor sets. Furthermore, to optimize the models and to evaluate the robustness of model results, we evaluated the RF models trained on datasets separated by year of measurement or by chamber, and compared their accuracy to the model that was built using data from all years and all chambers. In total, 17 predictor variables entered the models (including the leads). The RF models were also trained on seasonal data (i.e., spring, summer, fall, and winter; defined according to the meteorological definition) to investigate differences in drivers among seasons. For seasonal RFs, we used the same predictor sets as for the RFs developed on the multi-year dataset. We calculated partial dependence (PD) plots of conditional RFs using the “moreparty” package (v0.3.1; Robette, 2023), which is based on the “pdp” package (v0.8.1; Goldstein et al., 2015; Greenwell, 2017), to assess relationships between the four most important predictors and the predictions. The PD was calculated as the change in the average predicted value, while the predictor of interest was varied over its marginal distribution.
2.4.2 Flux gap filling and budget calculations
The gap filling of CO2 and CH4 fluxes was done using the RF models described above. Missing values in the predictor variables (gap length < 3 d) were linearly interpolated using the R package “chillR” (v0.72.8; Luedeling and Fernandez, 2022). The gap-filled flux data were then used to calculate annual budgets of forest-floor C fluxes per chamber. Since we estimated the annual forest-floor C budget for the study area, we reported the mean over the four chambers. To be able to compare CO2, CH4, and N2O budgets, we converted CH4 and N2O fluxes into CO2 equivalents (CO2 eq.) using the 100-year global warming potential of 27 for methane and 273 for N2O (IPCC, 2021).
In addition, we modeled the daily forest-floor respiration fluxes using a Q10 model according to Eq. (4):
where Rref is the modeled RS at Tsoil of 10 °C and Q10 is the temperature sensitivity. We developed one model for the full dataset (all years and all four chambers together). The annual respiration budgets calculated with the Q10 modeled fluxes were then compared with the annual respiration budgets from the RF gap filling. All statistical analyses were performed using R statistical software (v4.2.0; R Core Team, 2022).
3.1 Seasonal and interannual variability in environmental conditions and GHG fluxes
The seasonal courses of Tair and Tsoil were very pronounced during the 4 years of the study, with highest temperatures in July and August, and lowest temperatures in January (Fig. 1a). All years showed highly variable WFPS with large differences among chambers (i.e., up to 35 % difference; Fig. 1b) and the highest WFPS values during the snowmelt period, i.e., March to May. While the snow-covered periods usually started in November and lasted until April or May (Fig. 1c), the snow depths were much higher during winter 2020–2021 (reaching snow depths of over 1 m) compared with the other winters. Overall, 2022 was the warmest year ever recorded at the Davos research site so far, with an annual mean Tair of 5.6 °C (vs. the long-term mean of 4.3 °C; station data 1997–2022). Accordingly, annual mean Tsoil at 5 cm was highest in 2022 for all chambers (annual mean Tsoil over all chambers was 5.0 °C; Table A2). At the same time, precipitation in 2022 was low (773 mm vs. long-term mean of 876 mm; station data 1997–2022), which led to comparably dry soil conditions (annual mean WFPS over all chambers was lowest in 2022 with 14.9 %).
The forest floor at the Davos Seehornwald site was a source of CO2 during all 4 years, independent of the season (Fig. 1d). Typically, forest-floor respiration fluxes were very low in winter (mean CO2 flux ± standard deviation (SD): 0.46 ± 0.14 µmol m−2 s−1), increased in spring after the snowmelt, and reached their maximum values in June to September (mean CO2 flux of 3.50 ± 0.84 µmol m−2 s−1 over all years). The lowest forest-floor respiration was measured in January 2021 (minimum CO2 flux of 0.06 µmol m−2 s−1) and the highest respiratory fluxes were observed in July 2022 (maximum CO2 flux of 6.54 µmol m−2 s−1).
Moreover, the forest floor was a consistent sink for CH4, despite large short-term variations (days to weeks; Fig. 1e) and a few short peaks of CH4 emissions in winter and spring. Seasonality of forest-floor CH4 fluxes was very pronounced, with the highest uptake in summer (mean CH4 flux of −2.11 ± 0.28 nmol m−2 s−1), and still high CH4 uptake rates during fall and early winter (October to December; most clearly seen in 2022). With increasing duration of winter (January to March; Fig. 1e), the CH4 sink strength decreased, with the lowest CH4 uptake measured in March (mean CH4 flux of −0.17 ± 0.07 nmol m−2 s−1). However, after snowmelt, between April and the end of May (depending on the year), CH4 uptake rates increased sharply.
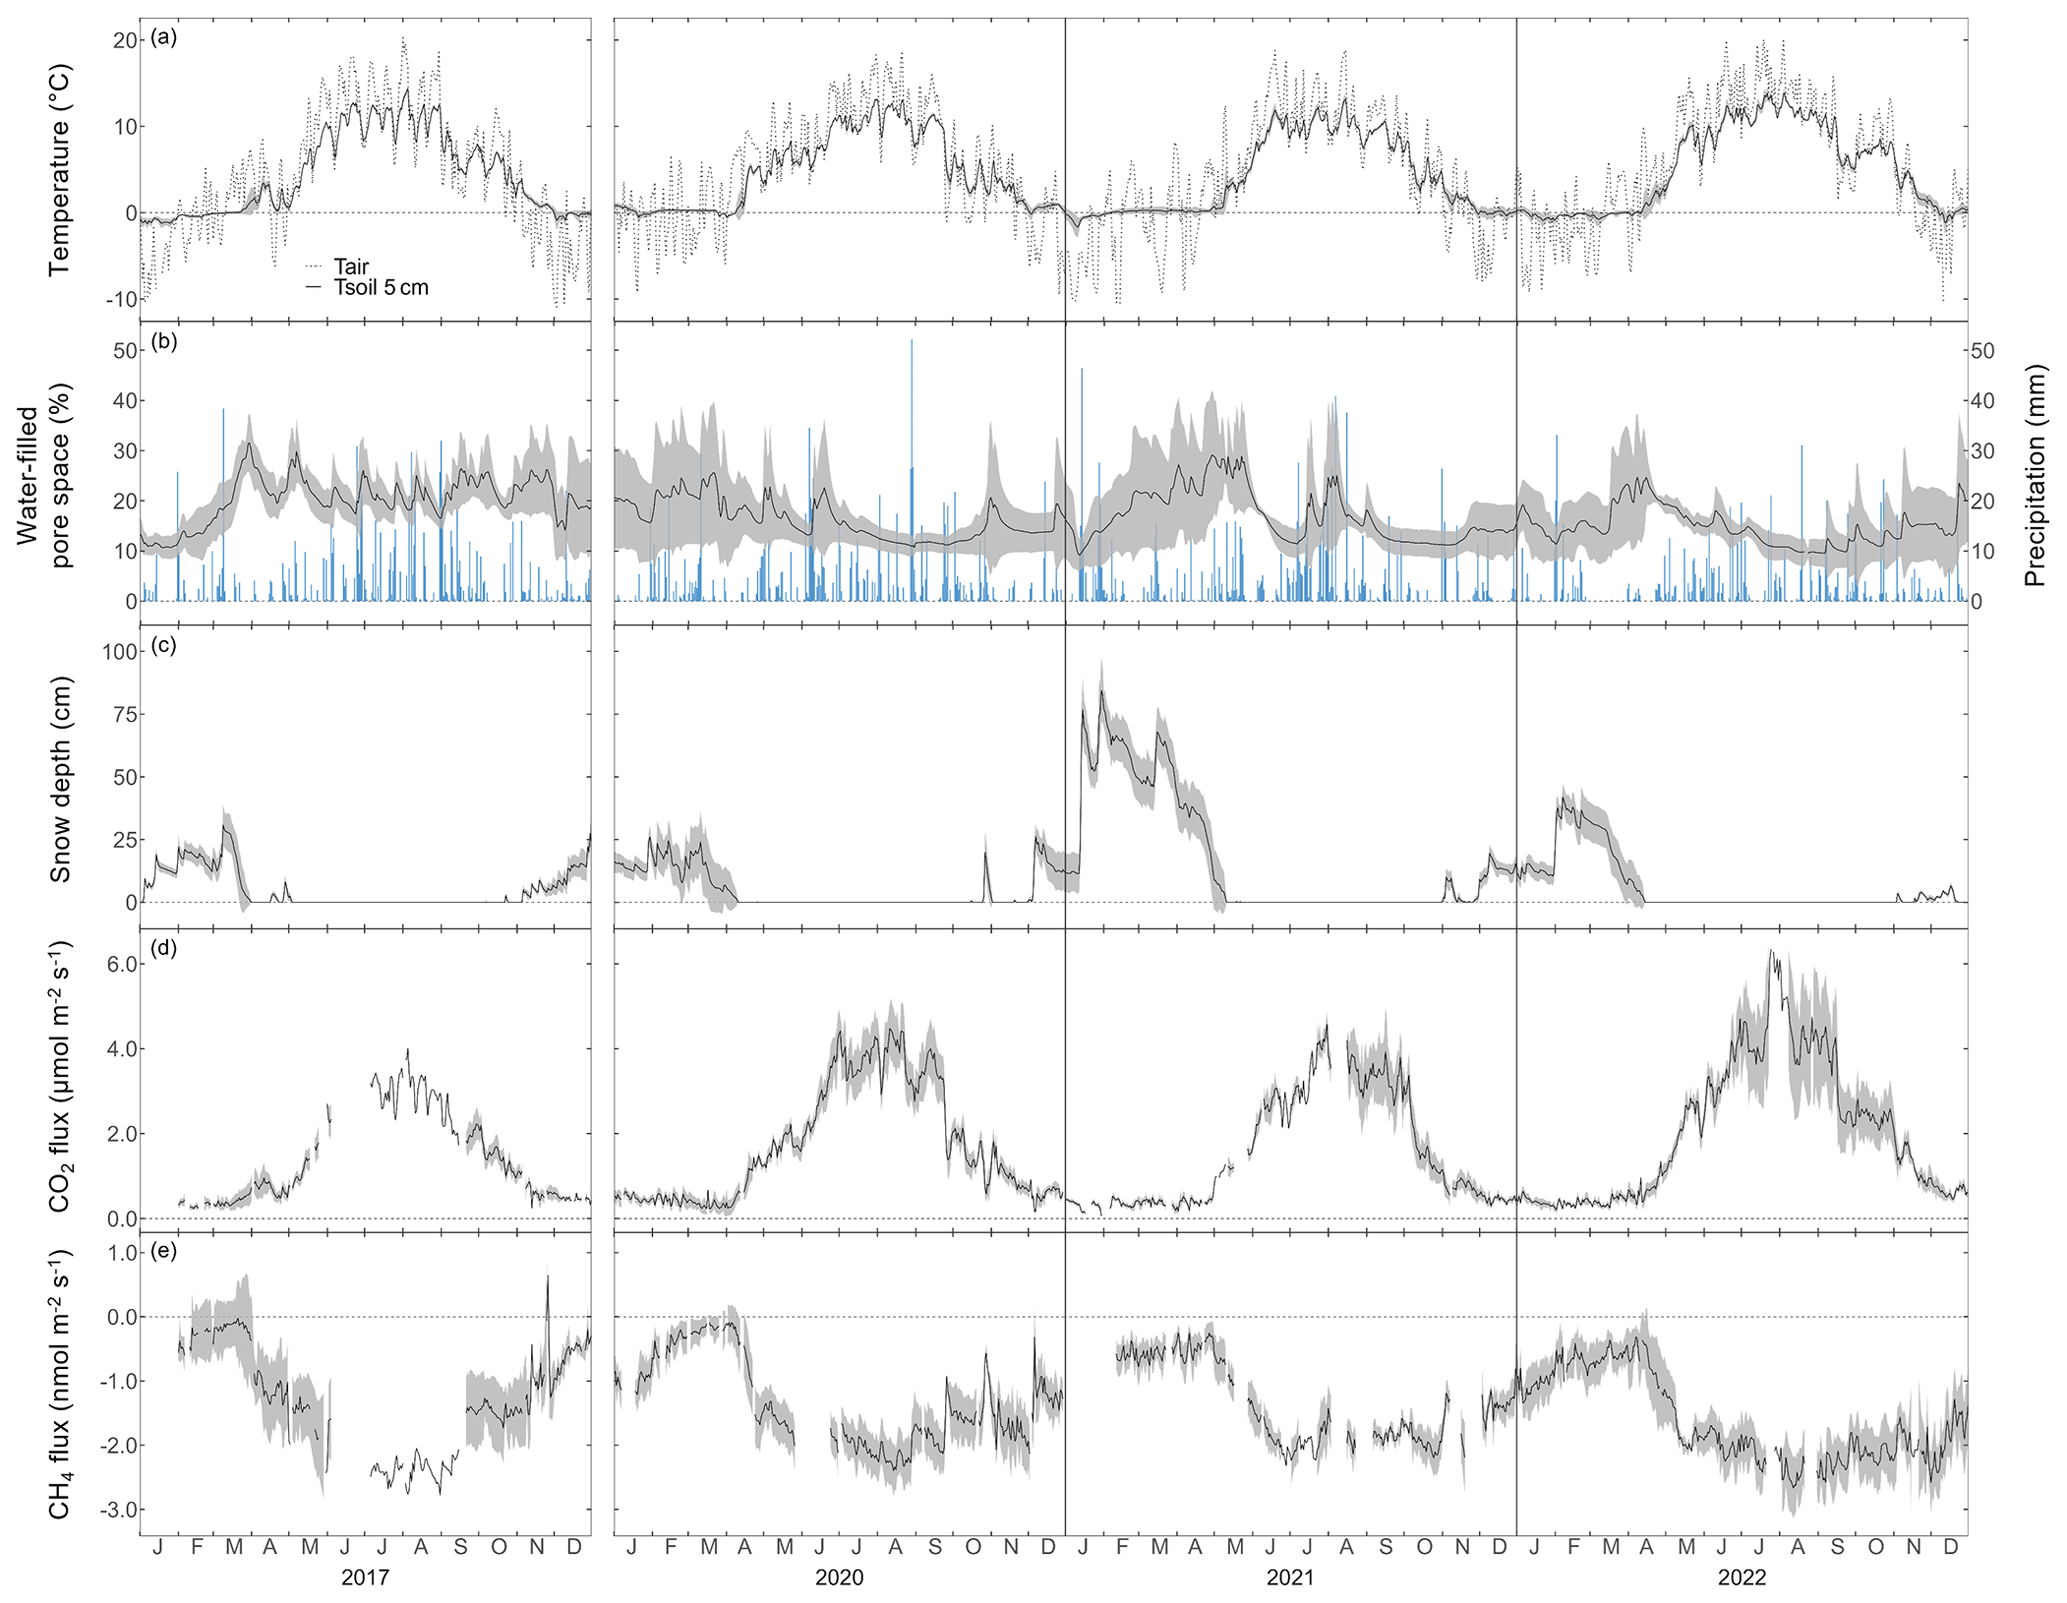
Figure 1Daily mean (a) air temperature and soil temperature at 5 cm depth, (b) water-filled pore space at 5 cm depth (left axis) and daily sum of precipitation (right axis), (c) snow depth, (d) daily mean forest-floor respiration fluxes (not gap-filled), and (e) daily mean forest-floor CH4 fluxes (not gap-filled), for 2017, 2020, 2021, and 2022. Note the gap in measurements between 2017 and 2020. Black lines show means over four chambers and gray bands show standard deviations among four chambers. All data were quality checked as described in the main text.
The forest-floor N2O fluxes ranged between −100 and 200 nmol m−2 h−1 but were mostly between 0 and 30 nmol m−2 h−1, with a mean over both years of 18.9 ± 22.5 nmol N2O m−2 h−1 (measured with automatic chambers and laser spectrometer; Fig. 2a, b, c). Winter fluxes (November to April) were generally higher and showed higher variability compared with the rest of the year. N2O fluxes were within the calculated flux detection limit (29.1 nmol N2O m−2 h−1) over a large part of the measurement period. N2O fluxes measured manually with eight static chambers in October 2023 were low (mean ± SD = 2.9 ± 31.1 nmol m−2 h−1; Fig. 2d) and agreed very well with the fluxes measured using the automatic chambers (mean in October: 10.2 ± 14.7 nmol m−2 h−1). Both chamber measurements showed occasional N2O uptake.
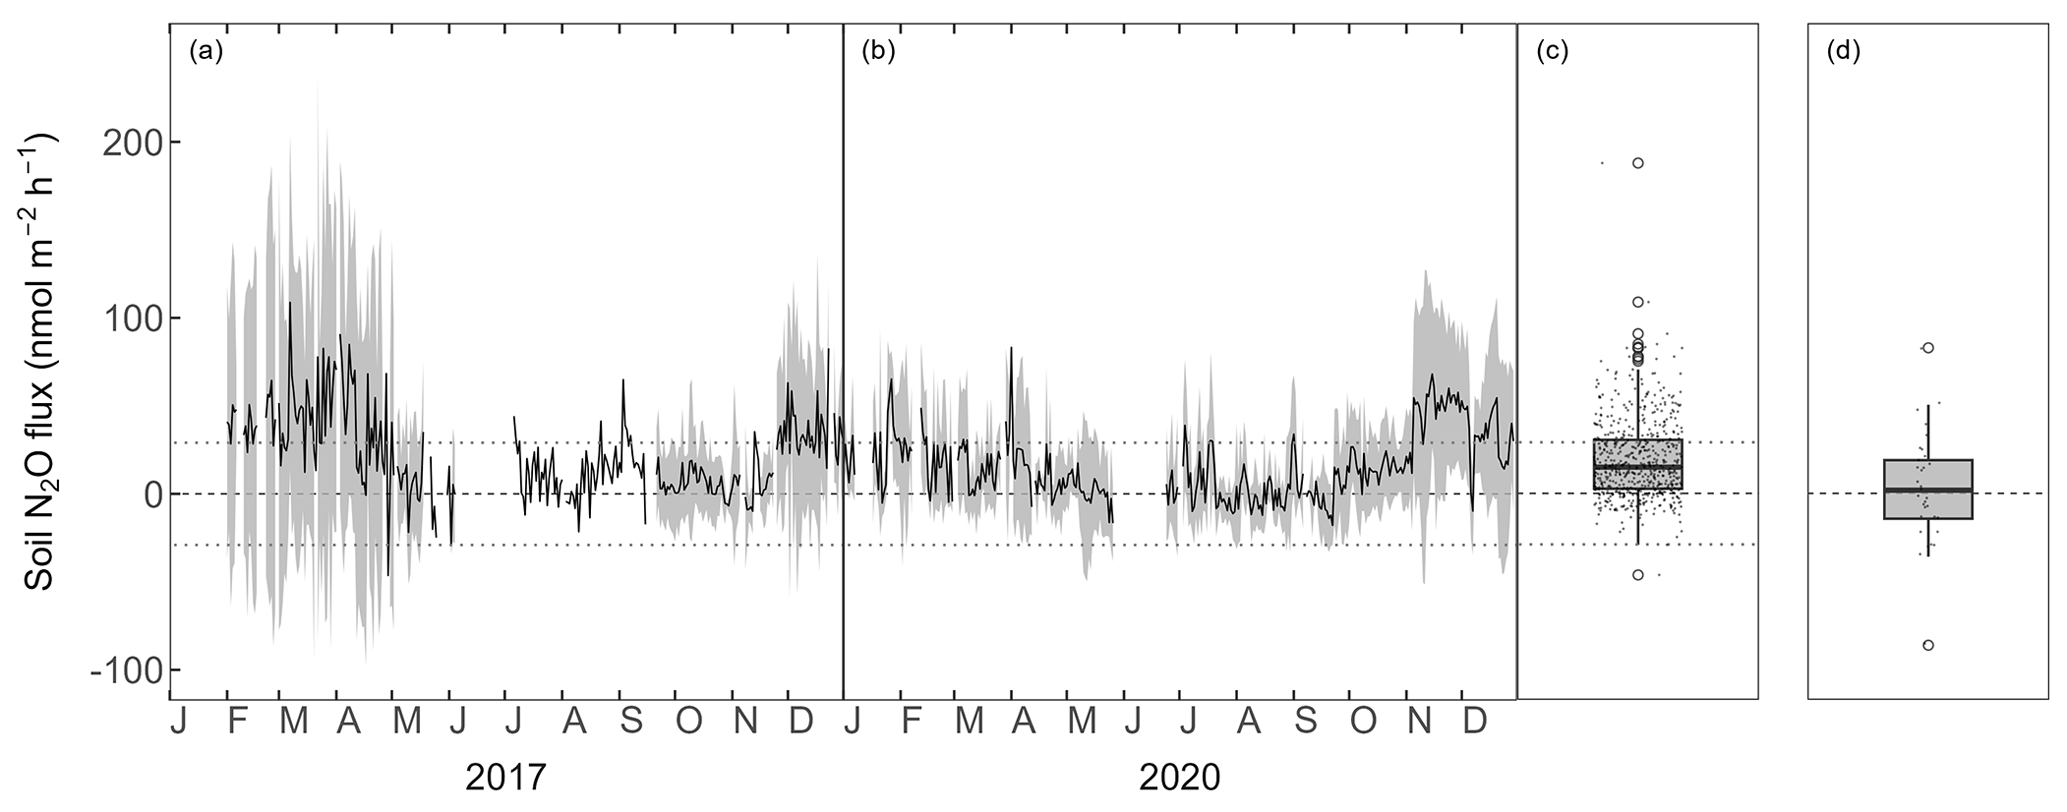
Figure 2Forest-floor N2O fluxes (nmol m−2 h−1) (a) 2017 and (b) 2020. Black lines show means over four chambers and gray bands show standard deviations among four chambers. Boxplots show distribution of (c) mean N2O fluxes from four automatic chambers and (d) N2O fluxes from static chamber measurements. The dotted lines depict the minimum flux (29.1 nmol N2O m−2 h−1) which could be detected by the dual quantum cascade laser spectrometer.
3.2 Driver analyses with random forest models
The RF models captured the temporal dynamics and absolute magnitudes of the observed forest-floor respiration and CH4 fluxes very well, with R2 values of 0.95 and 0.87, respectively (relationships of observed vs. predicted fluxes from test datasets), and RSME of 0.32 and 0.27 nmol m−2 s−1, respectively (Fig. A5). The seasonal RF models for forest-floor respiration fluxes yielded high R2 values of 0.94, 0.73, 0.90, and 0.63 for spring, summer, fall, and winter, respectively (Table A3). Similarly, forest-floor CH4 fluxes during spring, summer, fall, and winter were predicted well, with R2 values of 0.80, 0.76, 0.72, and 0.73, respectively. Thus, the RF model performance was very good, also when shorter time periods were considered.
Forest-floor respiration fluxes combined for all 4 years and seasons were predominantly driven by Tsoil at 5 cm depth: Tsoil at the time of the flux measurements was the most important driver, but also Tsoil with a 4 d lead (second most important) and with a 1 d lead was relevant (Fig. 3). Furthermore, WFPS at 5 cm with a 4 d lead played an important role. As expected, higher Tsoil led to higher respiration, while higher WFPS reduced forest-floor respiration. Drivers enhancing canopy photosynthesis, i.e., LAI or PPFD, did not play any role in forest-floor respiration. Separating forest-floor respiration fluxes into seasonal fluxes resulted in a clear distinction of drivers in winter compared with the other seasons (Fig. 3). Winter respiration fluxes were mainly driven by snow depth (most important driver), leading to lower respiration fluxes with higher snow depths, while Tsoil played a smaller role. As for the overall fluxes, summer forest-floor respiration fluxes were mainly driven by Tsoil, increasing with Tsoil. Also total N stocks were highly relevant in summer, with higher total N stock leading to lower respiration fluxes, much in contrast to the fluxes during spring and fall (Fig. 3).
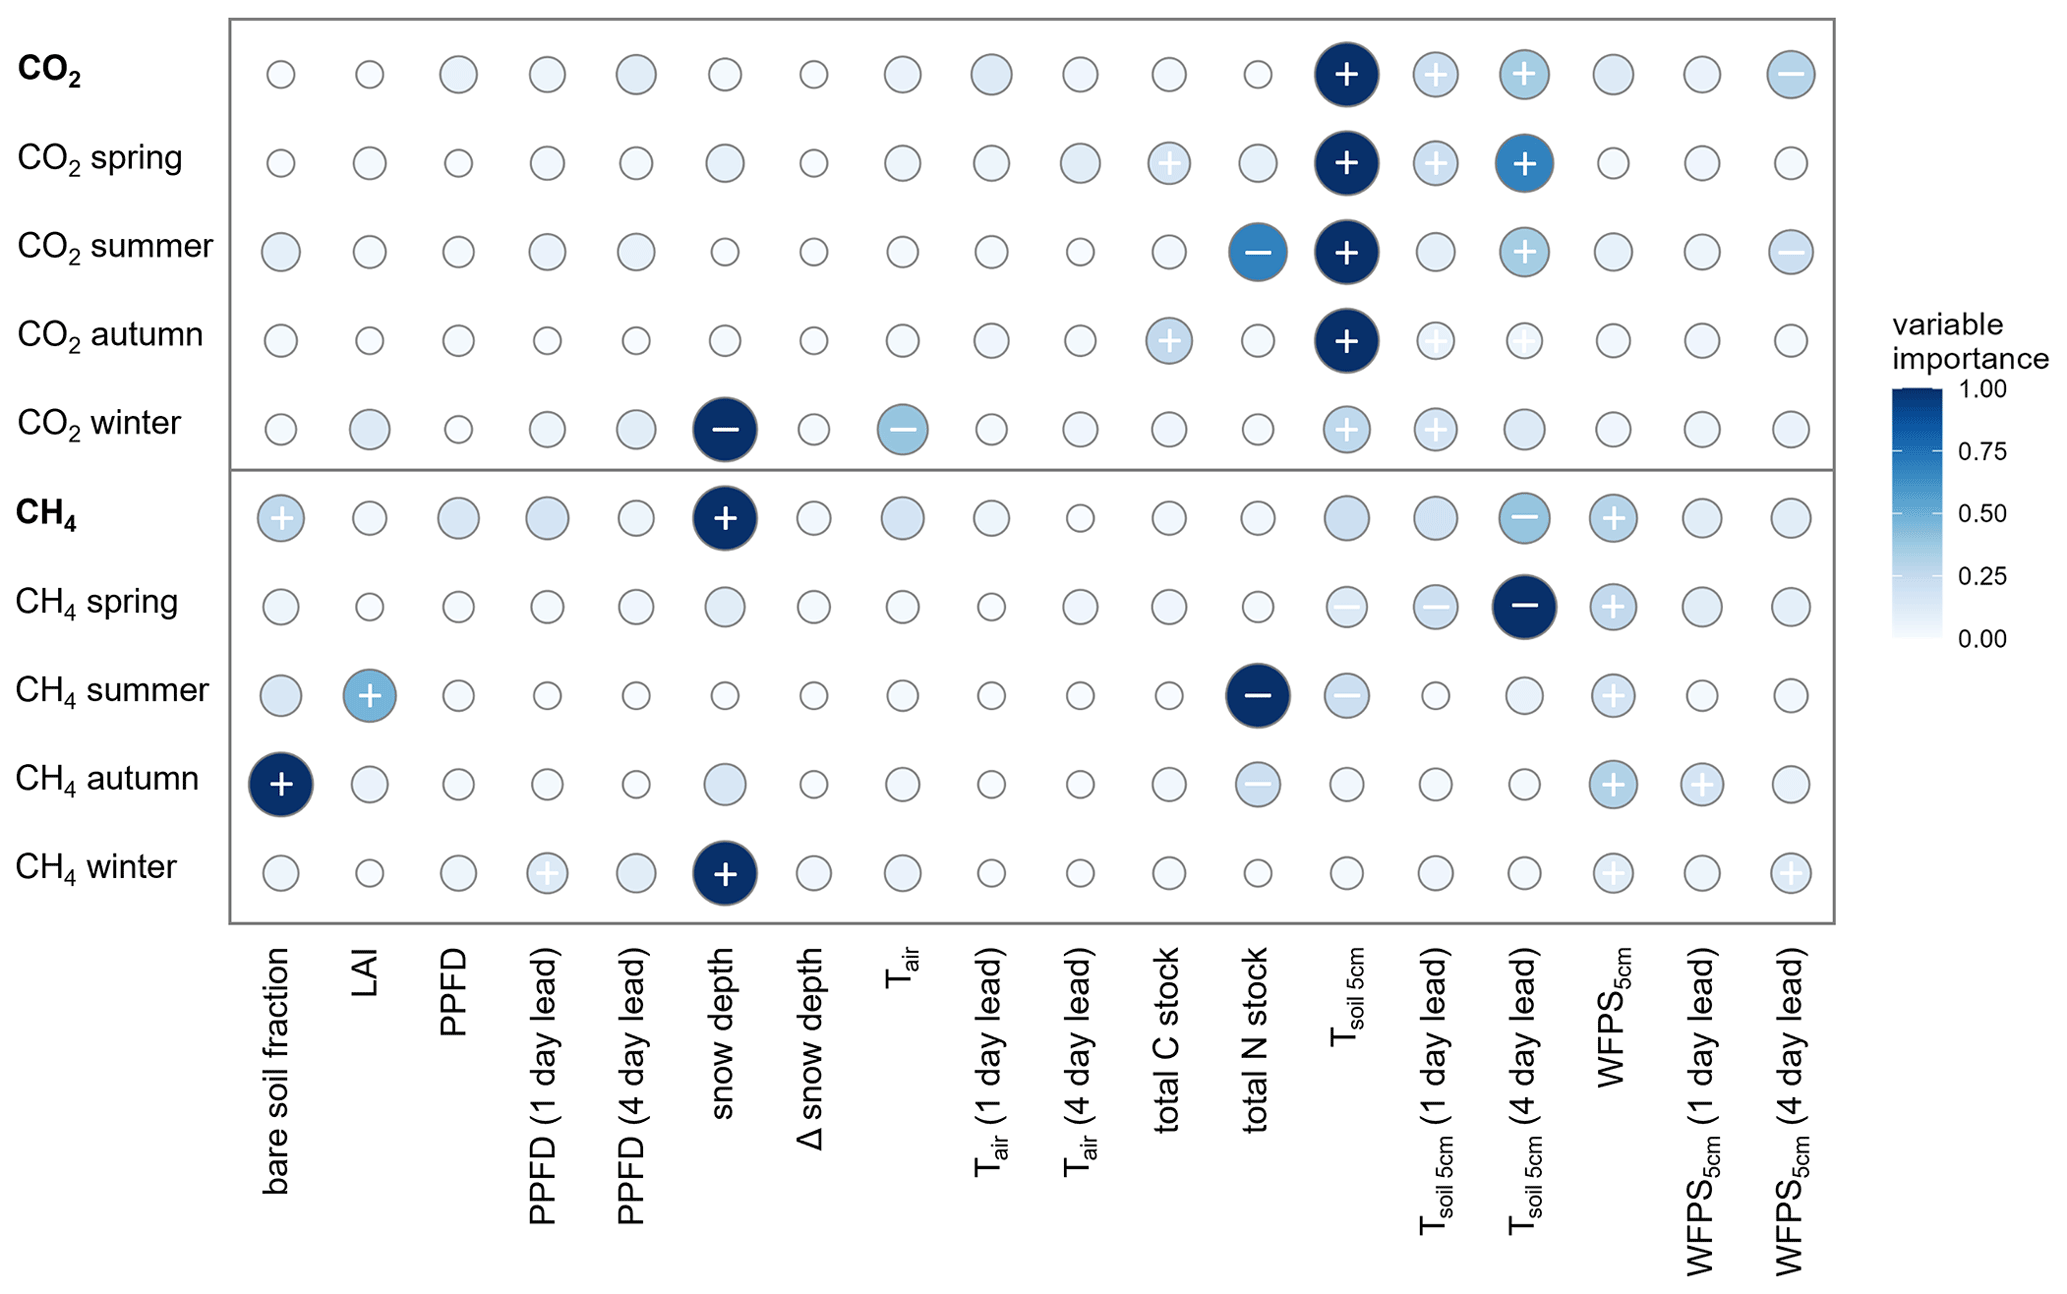
Figure 3Relative variable importance (rescaled to 0–1) according to the random forest driver analysis for forest-floor respiration (top; CO2) and CH4 (bottom) fluxes (not gap-filled; shown for the entire year and per season). The direction of the effect of each predictor variable on the fluxes is shown by + (positive correlation) and – (negative correlation) signs, i.e., + indicates increased forest-floor respiration or decreased CH4 uptake (i.e., increased CH4 emissions). Signs are given for the four most important predictors which were investigated using partial dependence plots. (See “Methods” for variable abbreviations.)
The RF analysis showed that forest-floor CH4 fluxes combined for all 4 years and seasons were mainly driven by snow depth, with higher snow depths leading to more positive CH4 fluxes and thus less CH4 uptake (Fig. 3). Furthermore, the 4 d lead of Tsoil at 5 cm impacted the fluxes negatively, leading to increased CH4 uptake, while WFPS at 5 cm and the bare soil fraction inside the chamber led to strongly decreased CH4 uptake. We found that the drivers of the forest-floor CH4 fluxes changed profoundly among seasons. Spring CH4 fluxes were mainly temperature driven (higher temperatures leading to more CH4 uptake). In summer, forest-floor CH4 fluxes were mainly driven by total N stocks (higher N stocks leading to more negative CH4 fluxes and thus higher uptake) and by LAI (higher LAI leading to more positive CH4 fluxes and thus lower uptake), reflecting spatial variability among chambers. In addition, CH4 fluxes were influenced by an interaction of several drivers such as Tsoil (higher Tsoil leading to higher uptake) and WFPS (higher WFPS leading to lower uptake). For fall CH4 fluxes, bare soil fraction was the most important driver (more bare soil – and thus smaller moss cover (Table A2) – leading to more positive CH4 fluxes and thus less CH4 uptake), but also WFPS played an important role. Winter CH4 fluxes responded mainly to snow depth, with higher snow depth leading to less CH4 uptake (Fig. 3). Closer investigation of the relationship between the two most important drivers (snow depth and the 4 d lead of Tsoil) with daily CH4 uptake over the entire year revealed that the temperature dependence of the CH4 fluxes disappeared when snow was present (Fig. 4a). We found a significant logarithmic relationship between CH4 uptake and snow depths, showing a decrease in CH4 uptake with increasing snow depth (Fig. 4b). Additionally, observations of CH4 release were mainly attributed to snow-covered periods (85 % of positive CH4 fluxes). Furthermore, the Spearman correlation coefficient between the CH4 fluxes from October to May and snow depth was high with r=0.59.
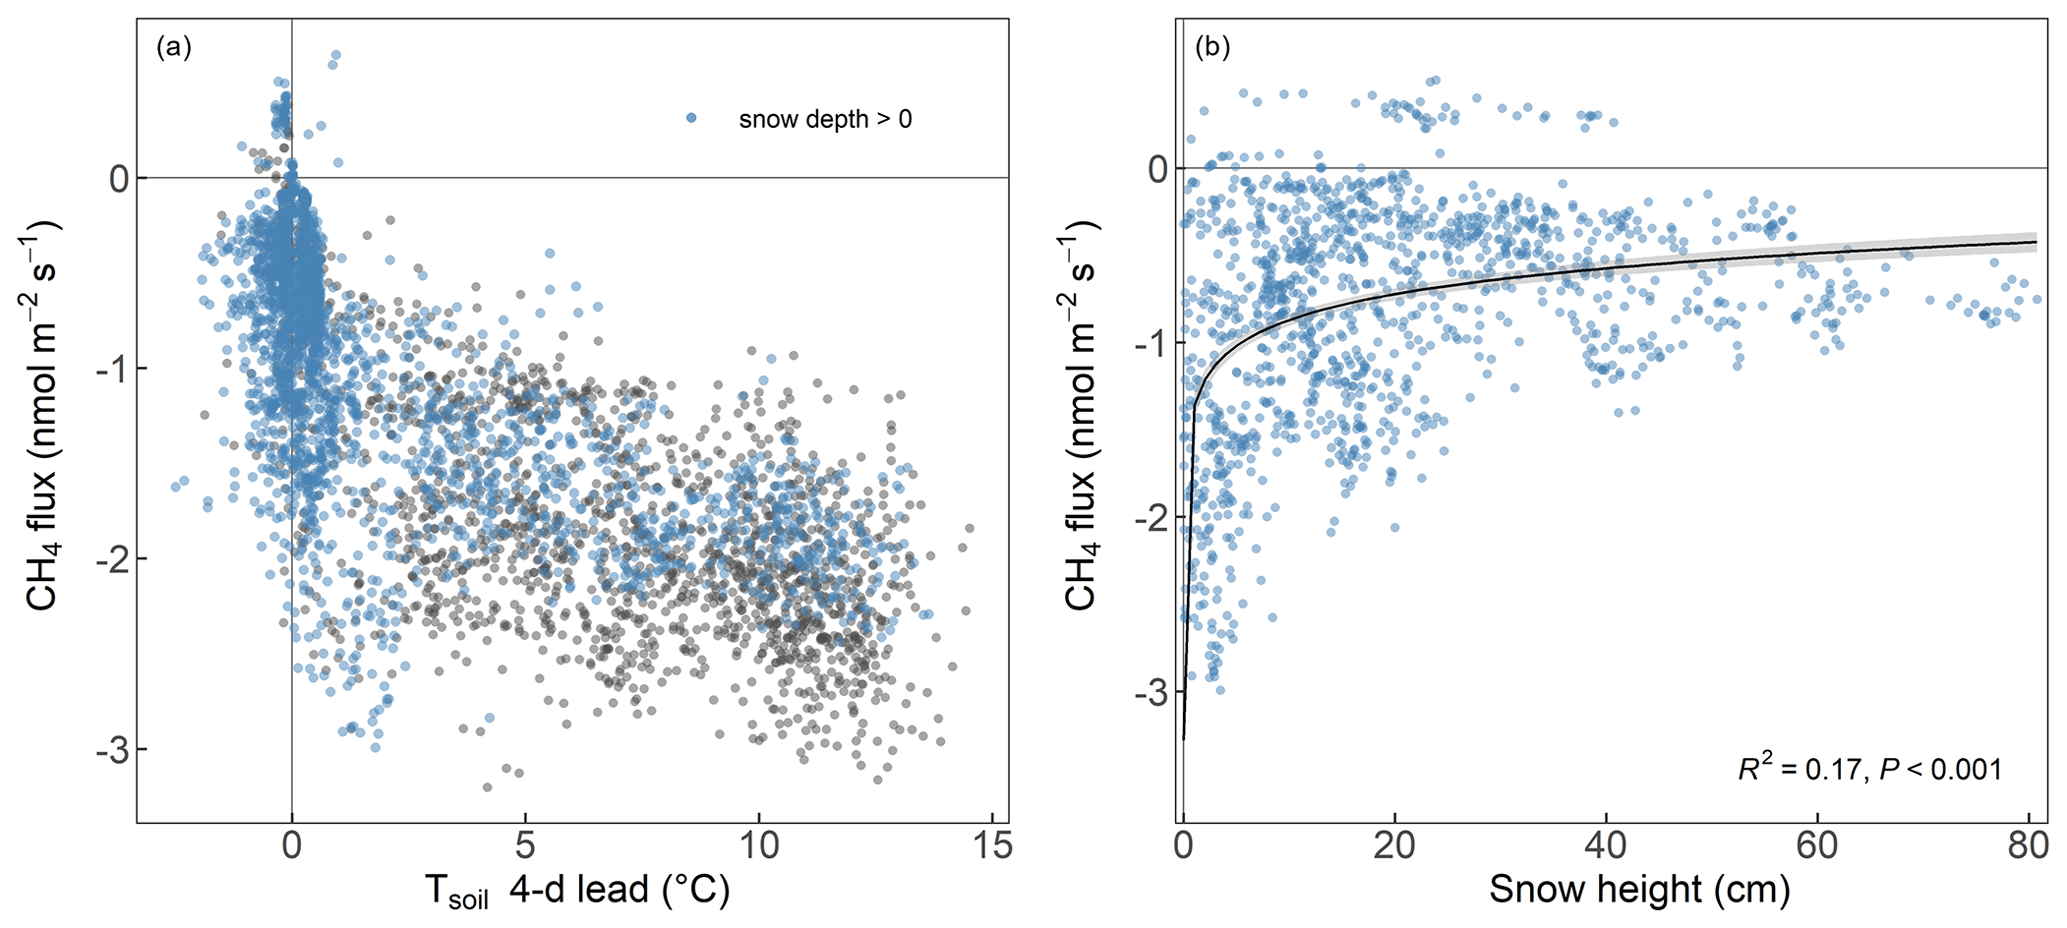
Figure 4Relationship between forest-floor CH4 fluxes (nmol m−2 s−1; daily means per chamber) and (a) 4 d lead of soil temperature at 5 cm depth (°C) and (b) snow depth (cm) with the black line showing the fitted logarithmic curve.
3.3 Forest-floor GHG budgets
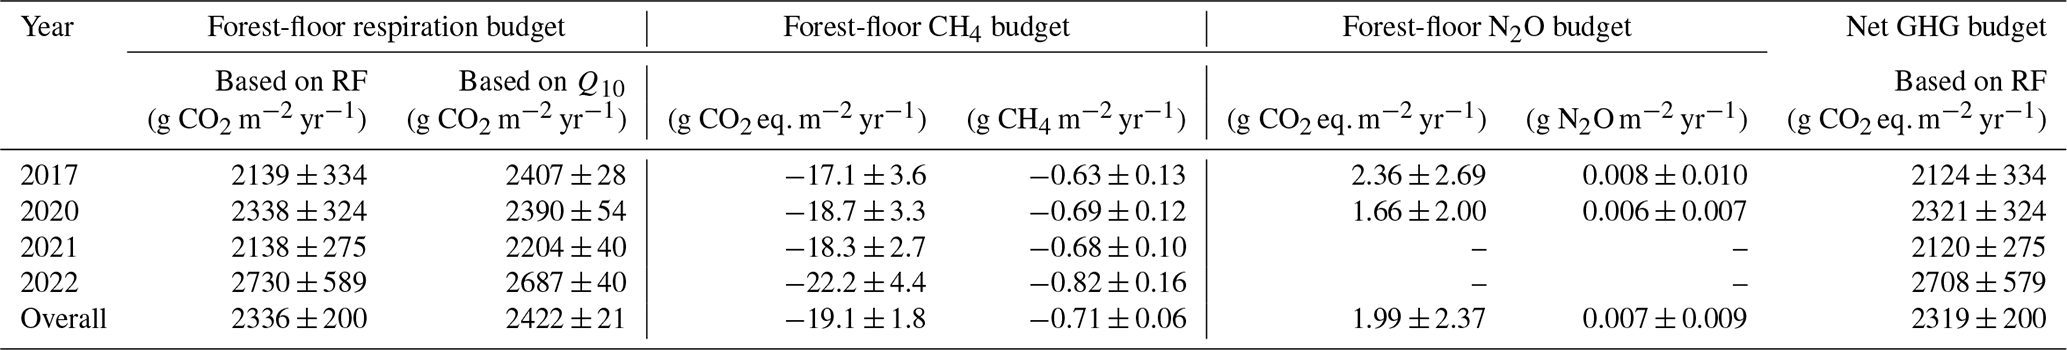
The forest floor of this subalpine spruce forest was a source of CO2, a net sink of CH4, and a close to zero N2O source for all years of the study (averaged over all four chambers; Table 1). Mean annual budgets were 2336 ± 200 g CO2 m−2 yr−1 for forest-floor respiration, 0.007 ± 0.009 g N2O m−2 yr−1 for N2O emissions (2-year mean), and −0.71 ± 0.06 g CH4 m−2 yr−1 for CH4 fluxes. The annual forest-floor respiration budgets were mainly determined by summer and early fall fluxes (i.e., June to September). The interannual variability of forest-floor respiration budgets was approximately 200 g CO2 m−2 yr−1 (SD 8.6 %) during the 4 years of the study, with 2017 and 2021 showing smaller and 2022 the highest emissions. The annual forest-floor respiration budgets calculated with the Q10 modeled data (2422 ± 21 g CO2 m−2 yr−1; Table 1; Fig. A4) agreed well with the forest-floor respiration budgets based on the gap-filled fluxes using RF, also showing the highest fluxes in 2022. A similar interannual variability as for the respiration budgets was found for the CH4 budgets, with 0.06 g CH4 m−2 yr−1 (SD 8.5 %). Comparing the magnitudes of all three GHG fluxes (in CO2 eq.) clearly showed that the respiration budget dominated the forest-floor GHG budget of the spruce forest. The forest-floor CH4 uptake (−19.1 ± 1.8 g CO2 eq. m−2 yr−1) was about 2 orders of magnitude smaller than the respiration fluxes (2336 ± 200 g CO2 eq. m−2 yr−1), while the annual forest-floor N2O emissions accounted for only 1.99 ± 2.37 g CO2 eq. m−2 yr−1, representing 0.09 % of the annual forest-floor GHG budget.
Table 1Mean annual GHG budgets (± standard deviation (SD) over four chambers) of forest-floor respiration and CH4 fluxes (using gap-filled data) and N2O fluxes (mean of 2 years of measurements). The Q10 budget was calculated with Eq. (3). Q10 and Rref estimates were 4.8 and 3.16, respectively; overall R2 was 0.86.
The year 2022 can be considered an exceptional year, both in terms of annual forest-floor respiration and CH4 fluxes (Table 1) but also in terms of temporal development (Fig. 5a). For CO2, there were not only higher respiration rates in summer, but also a faster increase in respiration rates already in mid-April and sustained higher rates until later in the year (Fig. 5a). The exceptionally high forest-floor respiration fluxes (2022 forest-floor respiration budget falls outside the 95 % confidence interval = ± 1.96 SD, i.e., for the forest-floor respiration budget: ± 392 g CO2 m−2 yr−1) coincided with the higher-than-usual Tsoil (annual mean Tsoil of 2022 falls outside the 95 % confidence interval) which was the main driver of spring, summer, and fall forest-floor respiration fluxes. For CH4, we observed a higher annual CH4 uptake in 2022 compared with other years (Table 1), mainly due to higher uptake rates in summer as well as still high uptake rates in fall and early winter (Fig. 5b). Apart from higher Tsoil driving the higher summer CH4 uptake, this was mainly connected to comparably low soil moisture in fall 2022 and the low snow depths in November and December 2022.
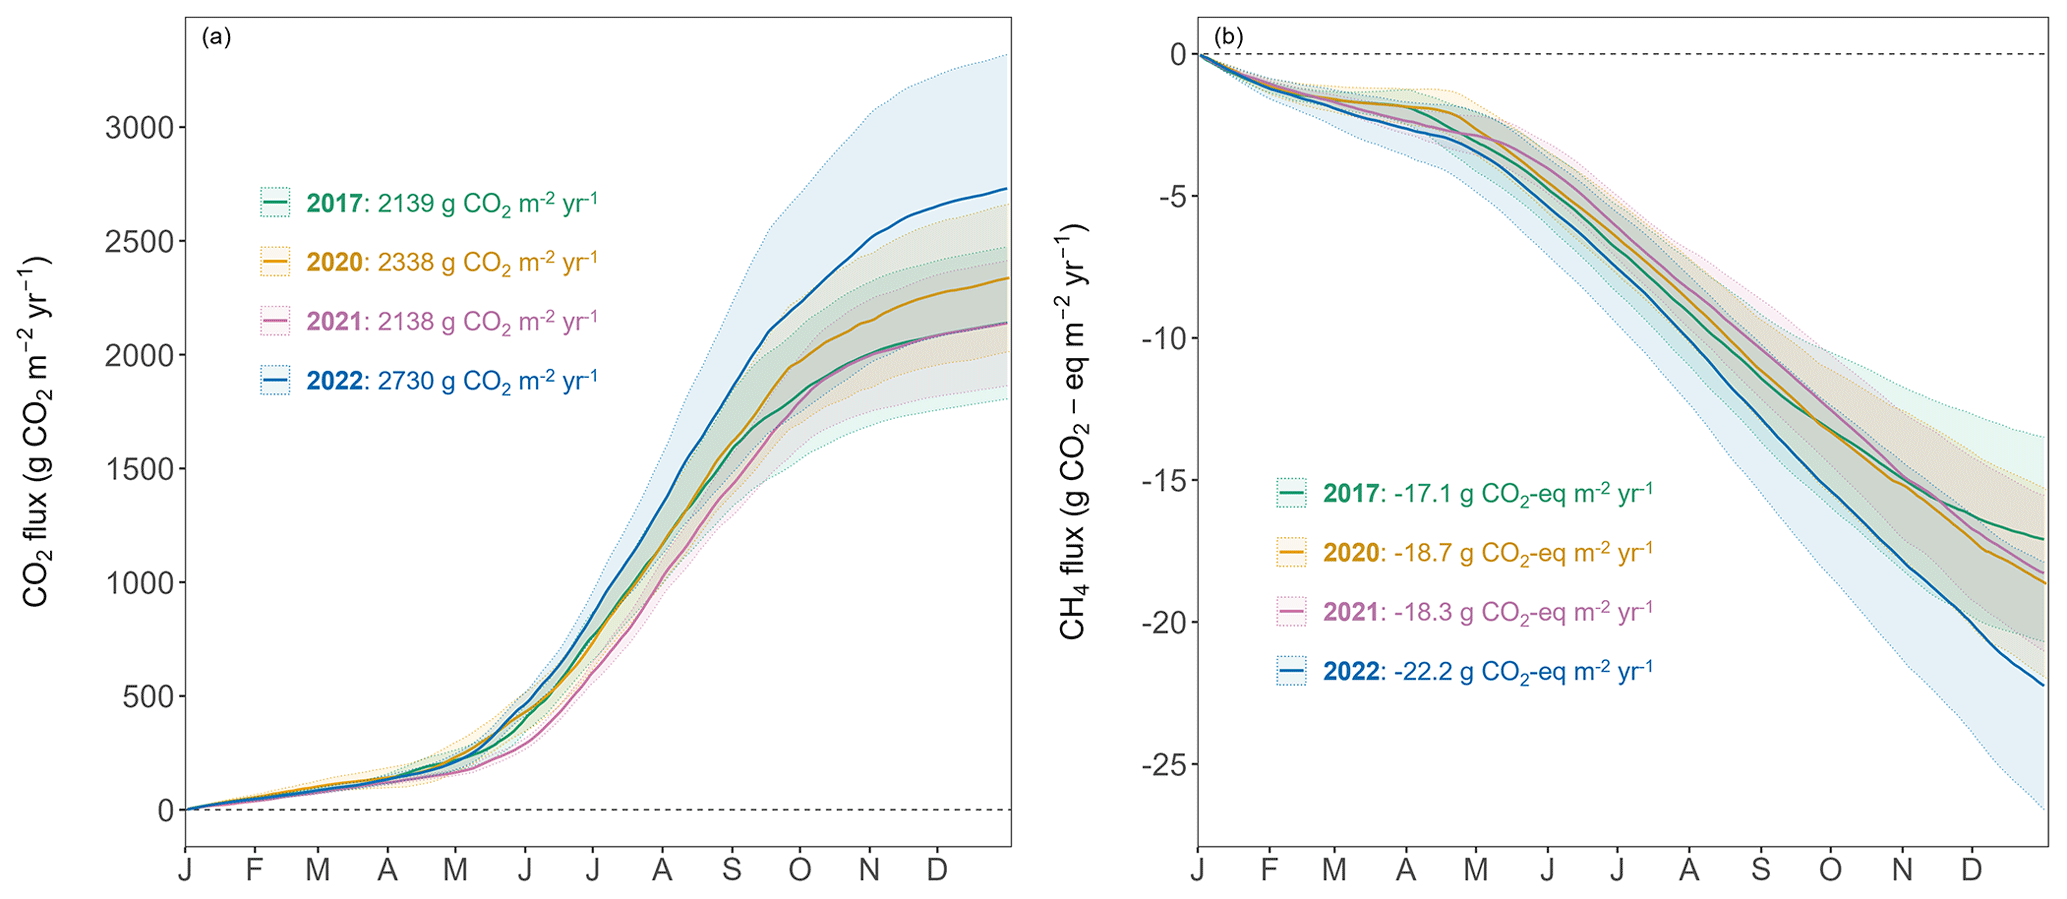
Figure 5Cumulative forest-floor (a) respiration (g CO2 m−2 yr−1) and (b) CH4 (g CO2 eq. m−2 yr−1) fluxes over 4 years. Lines show means of all four chambers and colored bands represent standard deviations among four chambers.
4.1 Interannual variability in forest-floor GHG fluxes
Over the 4-year measurement period (2017 and 2020–2022), we collected high-resolution, reliable forest-floor GHG flux measurements for four very distinct years allowing comprehensive year-round analyses (2 years for N2O). Notably, 2022 emerged as the warmest year ever recorded at the Davos site so far, coinciding with remarkably low precipitation and WFPS levels. The forest-floor respiration in 2022 exceeded those in the other 3 years by approximately 20 %. Concurrently, we observed the highest forest-floor CH4 uptake in 2022. It is well known that temperature is a major driver for any respiratory process (Davidson et al., 2006; Amthor, 2000). Also our RF driver analysis revealed that soil temperature was the main driver for forest-floor respiration fluxes, while no soil water limitation existed at this high elevation forest site during the study period. Anjileli et al. (2021) reported that at multiple sites across the contiguous United States, even during extreme heat events, soil respiration increased by approximately 25 % compared with average conditions, emphasizing the dominating influence of temperature on respiration also under extreme dry conditions for those sites. Additionally, Borken et al. (2006) indicated that droughts can enhance the soil CH4 sink in temperate forests. In contrast, 2021 was the coldest year among the 4 years we investigated, with an annual mean Tair of 3.9 °C, mainly driven by below-average spring temperatures. This was reflected clearly in the forest-floor fluxes with below-average respiration rates (approximately 30 % lower compared to the 4-year mean) and below-average CH4 uptake in spring 2021 (approximately 20 % lower compared with the 4-year mean). Moreover, 2021 was an exceptional year in terms of snow depth, a relevant driver identified in this study. Snow depth in winter and spring exceeded the 4-year average by 87 % and 145 %, respectively.
While 2020 was also characterized by warm weather, its summer temperatures were less extreme than those of 2022. Our findings revealed that the forest-floor respiration in 2020 did not reach the levels observed in 2022, supporting our driver analyses, clearly indicating that the exceptionally high summer temperatures experienced in 2022 were the primary driving force behind the 2022 annual forest-floor respiration fluxes. The RF models for 2022 resulted in slightly lower forest-floor respiration than measured, suggesting that no overfitting had occurred (Figs. A6, A7). Moreover, these results highlighted the critical role played by extreme summer temperatures in shaping the C dynamics of this subalpine spruce ecosystem and underscored the significance of understanding their implications for future C budgets, potentially reducing the overall C sink capacity observed so far in this forest (Zielis et al., 2014).
We measured very low forest-floor N2O fluxes which agreed well between the two measurement techniques used (automatic chambers and laser spectroscopy vs. static chambers and gas chromatography). Due to soil aeration and soil moisture conditions at our site, we assumed that nitrification, and not denitrification, was the main process responsible for the N2O emissions measured (Papen and Butterbach-Bahl, 1999; Butterbach-Bahl et al., 2013). At our site, N supply to plants and microorganisms is limited. Foliage N concentrations indicate N limitation for spruce. Foliar N concentration is about 1 % in needles up to 1-year old as opposed to the optimum range of N content in needles, i.e., between 1.5 % and 2.3 % (Thimonier et al., 2010; Ingestad, 1959). Furthermore, N concentrations in the soil are low (1.4 % in the organic layer and 0.4 % in 10–20 cm depth; Jörg, 2008). N deposition at the site (about 10 kg N ha−1 yr−1; Thimonier et al., 2019; Gharun et al., 2021) corresponds to the lower level of critical N loads for forests in Switzerland (Hettelingh et al., 2017), well below the N deposition negatively related to basal area increments for spruce (20–22 kg N ha−1 yr−1; Braun et al., 2017) or that with the highest positive effect on net ecosystem productivity, i.e., the C sink, of forests across Europe (22 kg N ha−1 yr−1; Wang et al., 2022). Thus, our site can clearly be considered rather low in N, which could be used for microbial transformations like nitrification, competing with plant uptake (Schulze, 2000); therefore, low soil N2O fluxes were to be expected. The observations of occasional low N2O uptake measured with static and automatic chambers are in line with Goldberg and Gebauer (2009) who observed N2O uptake in a German spruce forest. Microbial processes in forest soils can contribute to both uptake and release of N2O, depending on the prevailing environmental conditions such as oxygen availability, soil moisture, and microbial communities. Under anaerobic conditions, denitrification contributes to N2O release, while under aerobic conditions, N2O reduction to N2 can dominate over N2O production, which results in observations of net N2O uptake by soils (Wen et al., 2017).
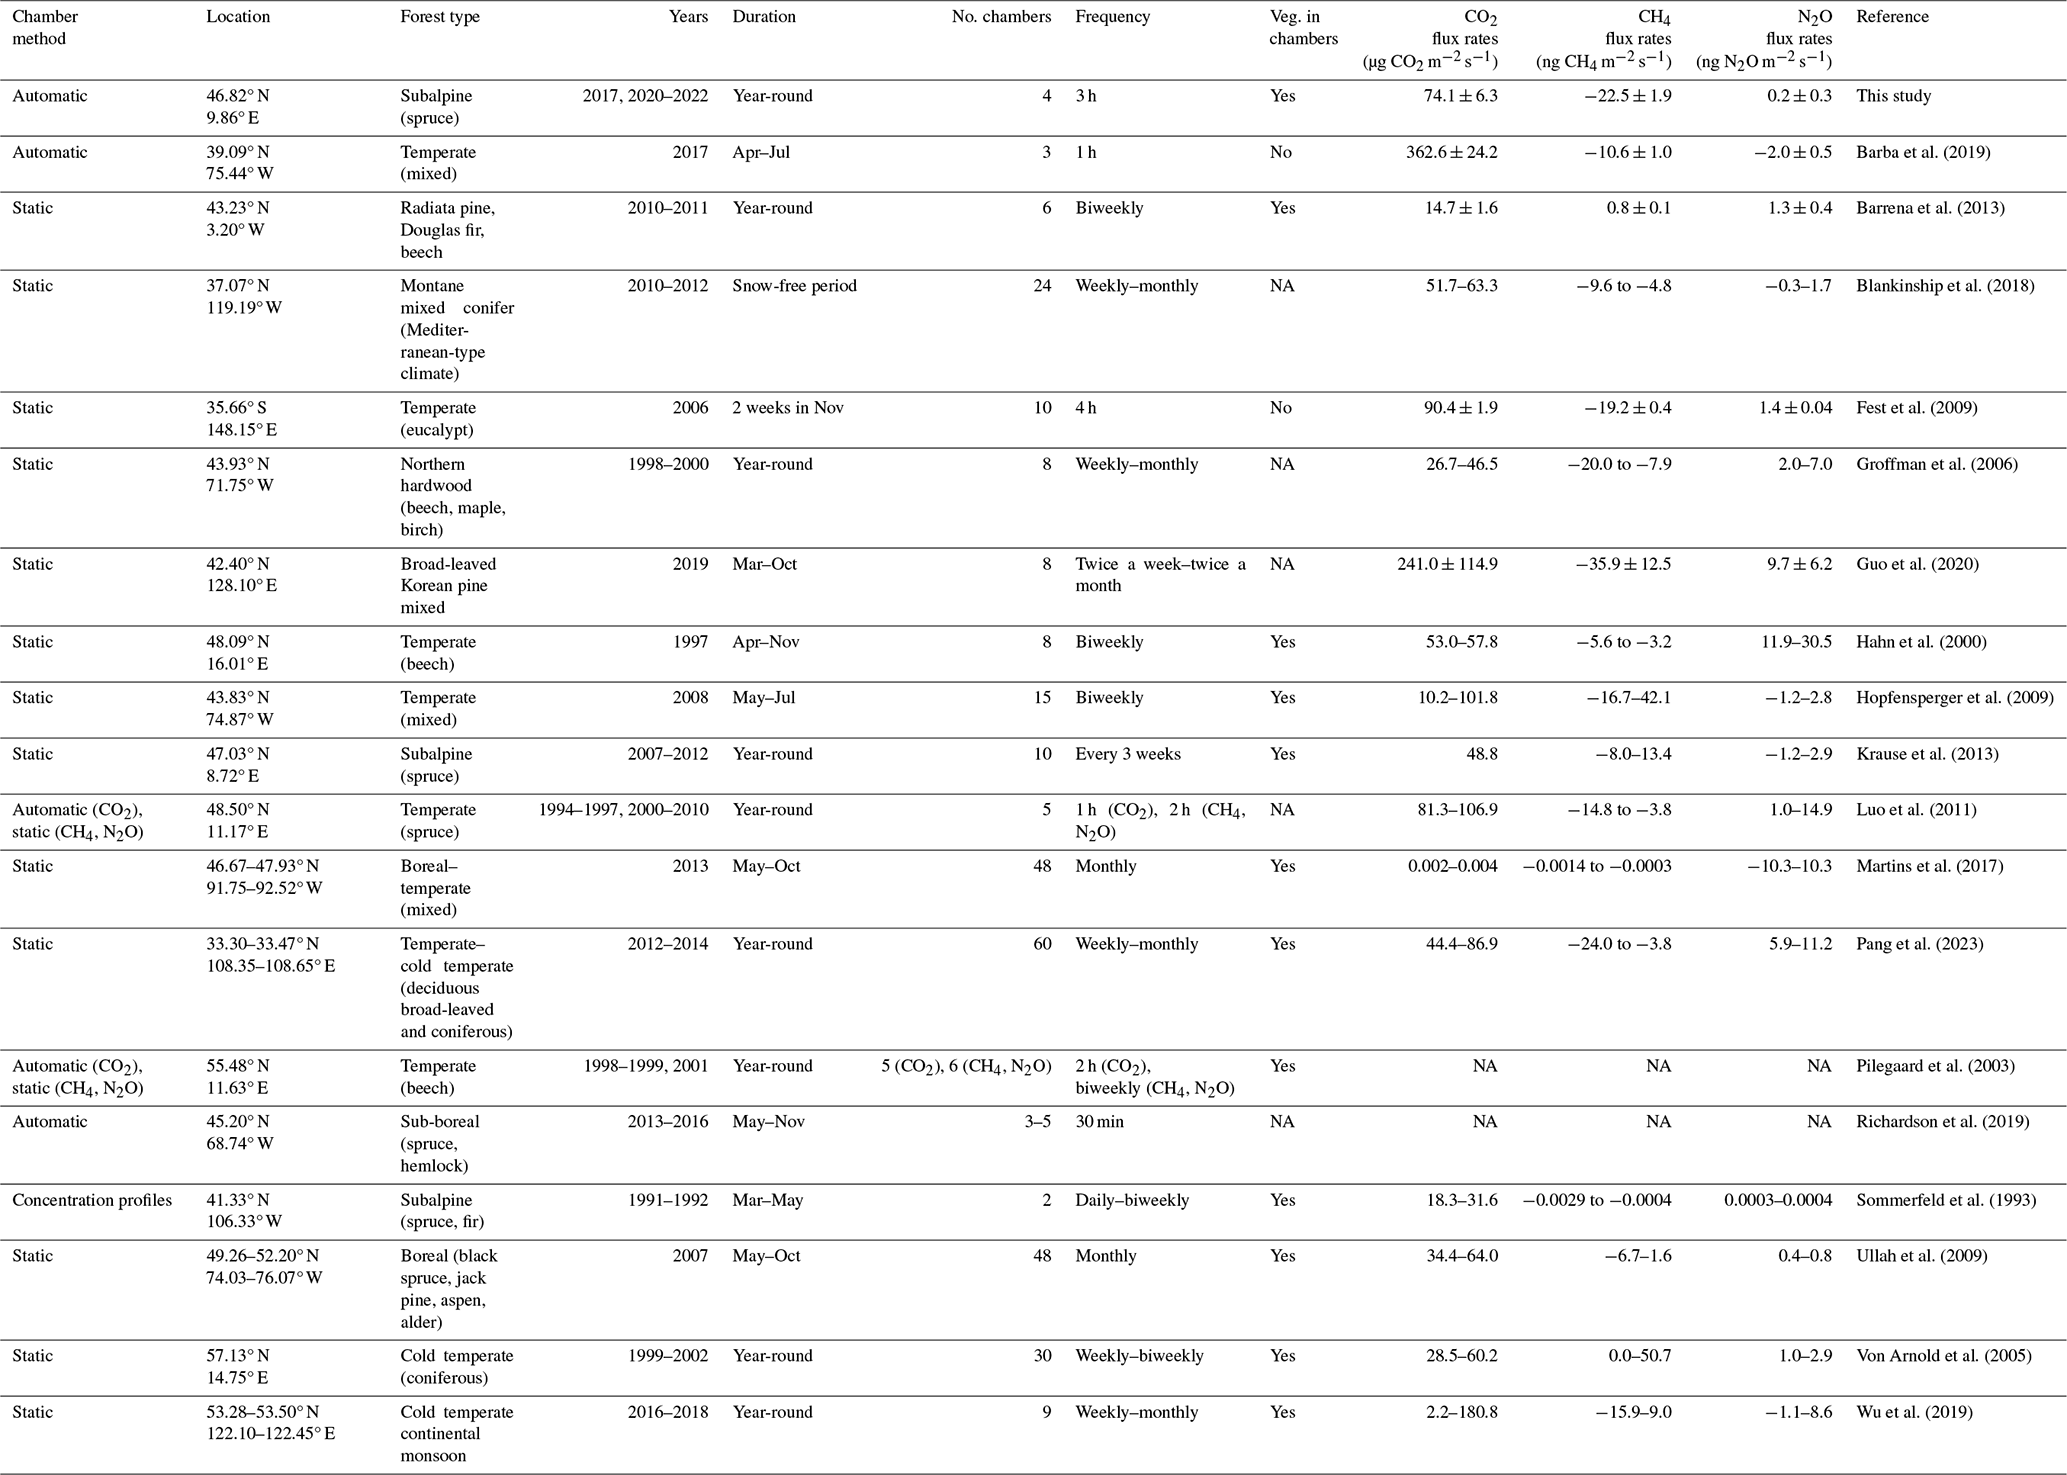
Table 2Previously published studies investigating forest-floor or soil CO2, CH4, and N2O fluxes in parallel in temperate, subalpine, or boreal forests using automatic or static chambers. NA: not available.
4.2 Drivers of forest-floor GHG fluxes
Forest-floor respiratory CO2 and CH4 fluxes were shown to have very distinct drivers across the different seasons. Consistent with our expectations, soil temperature predominantly controlled forest-floor respiration fluxes, thereby influencing the respiration budget at annual as well as seasonal scales (except winter season). In contrast, no effects of drivers known to enhance canopy photosynthesis (i.e., LAI and PPFD), and thus below-ground allocation and soil respiration (Högberg et al., 2001), were observed on the forest-floor respiration fluxes for any time in this spruce forest, suggesting a strong direct control of environmental factors and only a weak, or even lacking, indirect control of canopy biology or structure. Drivers of forest-floor CH4 fluxes were much more variable compared with those of forest-floor respiration fluxes, with winter CH4 fluxes being affected by the same driver (snow depth) as the annual fluxes. The observations of lower CH4 uptake during snow cover reflect the results of Heinzle et al. (2023) from a long-term soil warming experiment in a temperate forest. The findings that snow depth and WFPS (in fall) were important drivers of forest-floor CH4 fluxes supported the hypothesis proposed by Borken et al. (2006), who emphasized the role of factors influencing the diffusion rates of atmospheric CH4 into the soil, such as SWC and snow cover, in determining CH4 uptake in forest soils. Notably, previous studies had also reported a close relationship between CH4 fluxes and seasonal changes in soil moisture (Ni and Groffman, 2018; Ueyama et al., 2015). However, our results indicated that in spring and summer, Tsoil, rather than WFPS, played a more important role in driving forest-floor CH4 uptake. Additionally, we identified a notable influence of soil N on summer CH4 fluxes, with higher N stocks, and thus most likely higher N mineralization during the summer months, corresponding to enhanced CH4 uptake. This aligned with previous findings in forest ecosystems, where soil mineral N had been shown to stimulate CH4 oxidation (Goldman et al., 1995; Martinson et al., 2021). Moreover, we found a positive correlation between bare soil fraction and forest-floor CH4 uptake, i.e., more bare soil and thus lower moss cover leading to lower forest-floor CH4 uptake. This is in line with findings that Sphagnum mosses can promote CH4 oxidation (Basiliko et al., 2004). Also, for forest-floor CH4 fluxes, hardly any effect of tree canopy biology was detected (except for summer). Thus, a strong direct control of environmental factors on both forest-floor respiration and CH4 fluxes was observed, increasing the vulnerability of the forest C sink with future climate change (IPCC, 2021).
4.3 Forest-floor GHG budgets
The overall forest-floor GHG budget showed a total emission of 2319 ± 200 g CO2 eq. m−2 yr−1, dominated by the annual forest-floor respiration budget (2336 ± 200 g CO2 m−2 yr−1), which was within the range of studies conducted in temperate, subalpine, or boreal forests, and which we considered comparable to our site (1070–2906 g CO2 m−2 yr−1; Gaumont-Guay et al., 2014; Groffman et al., 2006; Schindlbacher et al., 2007, 2014; Wang et al., 2013; Xu et al., 2015). Also our estimate of annual CH4 budget at the site (−0.71 ± 0.06 g CH4 m−2 yr−1) fell within the range of −1.6 to −0.18 g CH4 m−2 yr−1 observed in other forest studies (Borken et al., 2006; Luo et al., 2013; Ueyama et al., 2015; Yu et al., 2017), offsetting a mere 0.8 % of forest-floor respiration. Our estimate of the annual N2O budget of 0.0073 g N2O m−2 yr−1 agreed well with previous studies (Rütting et al., 2021; Ullah et al., 2009). For instance, a study conducted in a boreal spruce forest with low N deposition rates (about 5 kg N ha−1 yr−1) reported very low mean N2O fluxes of around 0.0077 g N2O m−2 yr−1 (Rütting et al., 2021). Higher soil N2O emissions (0.08 g N2O m2 yr−1) have been observed in a temperate forest with higher N availability (N deposition rates 18 kg N ha−1, N stocks in litter layer, and mineral soil ∼ 15 t ha−1; Heinzle et al., 2023). Winter fluxes contributed a large fraction to the overall CH4 budget (14.4 %–18.4 %) but played a less important role for the forest-floor respiration budget (6.0 %–7.3 %), similar to the CO2 contribution in other mid-latitude and temperate ecosystems (5.5 %–8.9 %; Gao et al., 2018; Wang et al., 2013) but smaller than some high latitude and other subalpine ecosystems (12 %–20 %; Kim et al., 2017; Schindlbacher et al., 2007; Xu et al., 2015). To date, only a few studies have examined soil or forest-floor GHG fluxes in subalpine, temperate, or boreal forests, measuring CO2, CH4, and N2O fluxes in parallel (Table 2). Table 2 includes studies examining fluxes from both the forest floor (soil and ground vegetation) and the soil. However, their comparability is constrained, as forest-floor flux measurements encompass both soil respiration (including heterotrophic and root respiration) and autotrophic respiration from forest-floor plants, whereas soil flux measurements specifically capture soil respiration (Barba et al., 2018). It is noteworthy that the integration of year-round and temporally highly resolved measurements remains rather uncommon. To our knowledge, only two other studies with year-round measurements of CO2, CH4, and N2O exist apart from the current study (Luo et al., 2011; Pilegaard et al., 2003). On the one hand, previous studies frequently measured fluxes for only a limited period of the year, often excluding the dormant season. On the other hand, many of the studies adopted a weekly to monthly measurement frequency, potentially missing the full range of flux magnitudes. If year-round measurements of forest-floor respiration are not feasible, using Q10 models might be a viable option, as long as the annual temperature range is being well covered, as seen in the agreement between our respiration budget based on gap-filled continuous measurements and the Q10 respiration budget. However, although Tsoil was identified as the primary driver of forest-floor respiration, it was not the only driver. We argue that Q10 models are not able to capture extreme respiration fluxes which might be caused by more drivers than temperature alone. Many studies have shown that Q10 models do not reproduce measured fluxes well when additional drivers impact the fluxes, for instance when soil moisture, frost, or carbohydrate limitations come into play (e.g., Ruehr et al., 2010; Reichstein et al., 2013; Mitra et al., 2019). In contrast, our high-resolution dataset coupled with machine learning offered a more comprehensive approach, which included multiple environmental variables and at the same time was able to consider chamber-specific characteristics, and thus was able to capture the extreme fluxes we observed in summer 2022. Thus, we think that the reliability of the RF budget is higher than that of the Q10 budget. Moreover, identification of important drivers for GHG fluxes is more reliable the longer, and thus typically the more frequently, measurements were done. Additionally, to effectively capture the dynamic nature of soil and/or forest-floor fluxes, it is essential to use automatic chambers with high temporal resolution, preferentially opaque to exclusively quantify respiration. Therefore, we recommend continuous, year-round measurements to reliably estimate annual forest-floor GHG budgets, particularly when large seasonal variability in potential drivers is expected or when the duration of the active period, i.e., the start and end of the snow-free period, is highly variable like in high elevation or high latitude ecosystems. Particularly with the anticipated impacts of future climate change (IPCC, 2021), the duration of growing periods will change, and winter fluxes (or the lack thereof) will gain increasing importance (Xie et al., 2017).
Forest-floor GHG fluxes, measured during multiple years with large opaque automatic chambers, were mainly driven by environmental factors, with only limited impacts of tree biology or structure. Particularly, in light of climate-change-induced variations in the onset of the active growing season, growing season length, and winter conditions, we recommend spatial expansion of the deployment of such chambers at research stations capable of year-round measurements, including periods with snow cover. Since our forest study site was very low in N supply and thus N2O fluxes were very low, it remains to be seen how large annual N2O emissions are from other forest sites with higher N supply and what drivers are most relevant there. As temperatures will continue to rise due to climate change, and warm and dry conditions, such as in the recent summers, are projected to become more frequent and more severe, we expect an increase in forest-floor respiration at the Davos spruce forest and similar subalpine or high latitude ecosystems. Similarly, anticipated milder winters with reduced snowfall, resulting in shorter snow-cover duration and lower average snow depth, will likely contribute to enhanced forest-floor respiration and increased forest-floor CH4 uptake in the future. Since respiratory CO2 losses are typically much larger than CH4 uptake rates, as at our site, we expect the forest floor to become a more substantial C source in the future, potentially modulating the overall C sink capacity of this type of forest.
We tested for chamber effects using SWC measurements from inside and outside FF1 and FF2 over all 4 years (Fig. A2). SWC was highly variable over time as well as in space (Fig. A2a). SWC differences between inside and outside the chamber varied between +10 % and −10 % during the 4 years (Fig. A2b). No clear trend was detectable over time. The average difference between inside and outside SWC over the 4 years was −2.9 ± 5.8%. No significant differences in SWC inside vs. outside the chamber were detected during most of the year (exception: during winter, on average 5 % lower SWC values inside compared with outside the chamber). We found high agreement in the dynamics of SWC inside and outside FF1 and FF2 (R2 values of 0.69 and 0.82, respectively). In terms of Tsoil, we did not find any significant differences inside vs. outside the chambers over most of the year (Fig. A3a). The differences were only significantly different from zero in December, February, and March when Tsoil inside the chambers was around 0.1–0.5 °C lower than outside the chambers (Fig. A3b). At prevailing soil temperatures of around 0 °C in these months, such a difference in Tsoil has no effect on the magnitude of forest-floor respiration (Fig. A4).
Table A1The 10th percentiles of R2 values from linear regressions used for flux calculations per gas, given separately for each chamber (FF1–FF4) as well as growing and dormant periods. Percentiles were applied as quality thresholds.
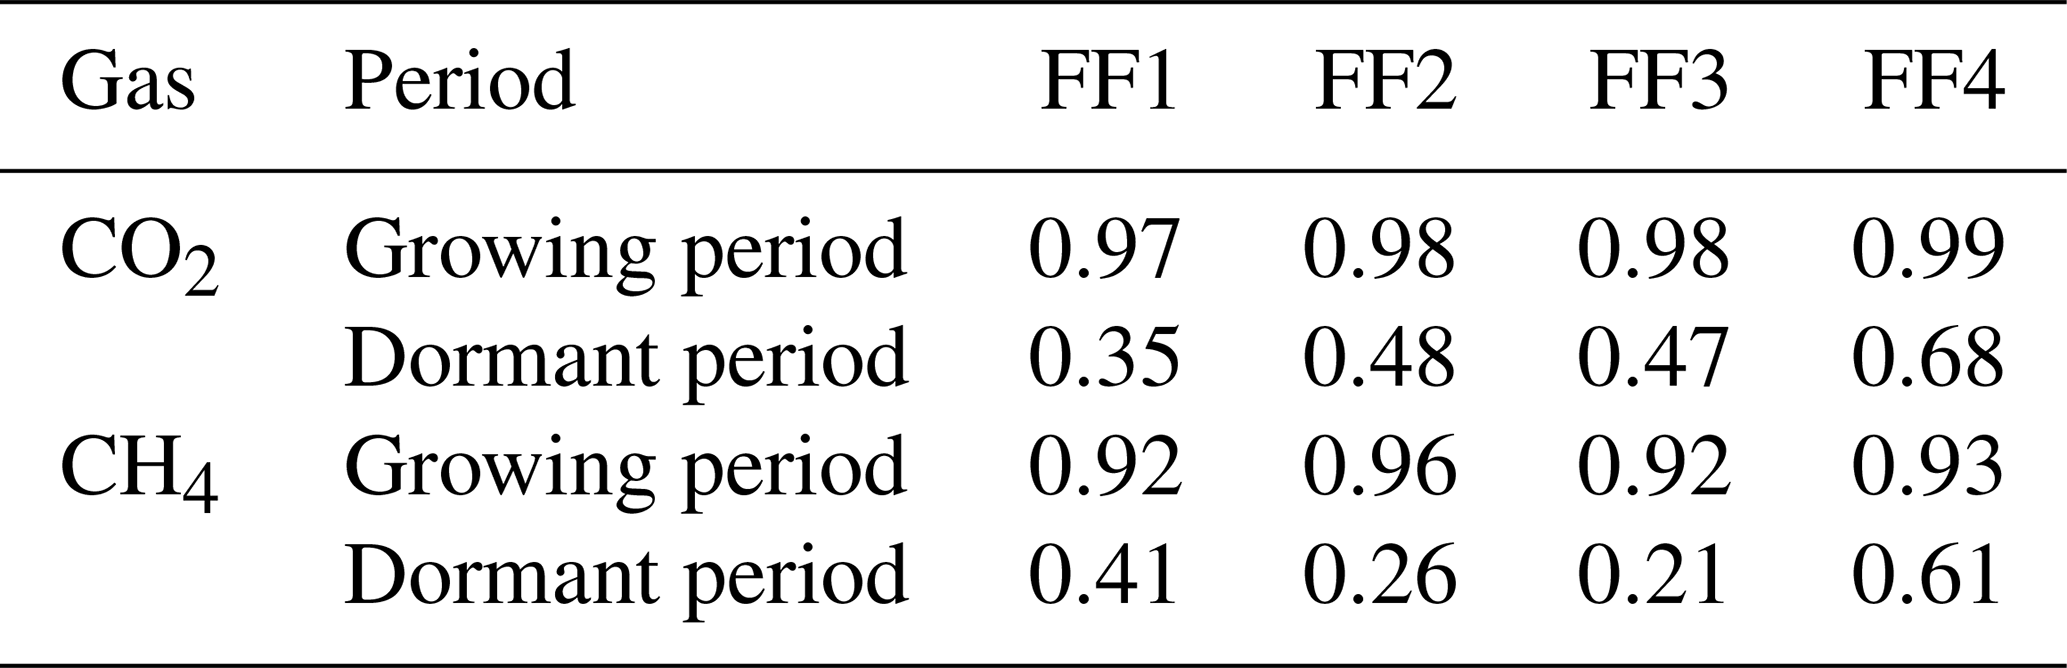
Table A2Site characteristics of the four chambers (FF1–FF4). Annual means and standard deviations are shown for soil temperature (Tsoil) and water-filled pore space (WFPS) at 5 cm, mean and maximum snow depth, and days with snow cover. LAI, soil, and vegetation cover inside each chamber were determined in June 2022. Soil data (bulk density, pH, as well as C and N stocks in the topsoil, i.e., litter, organic material layers, and 0–20 cm depth of mineral soil) are taken from Jörg (2008) and Saby et al. (2023).
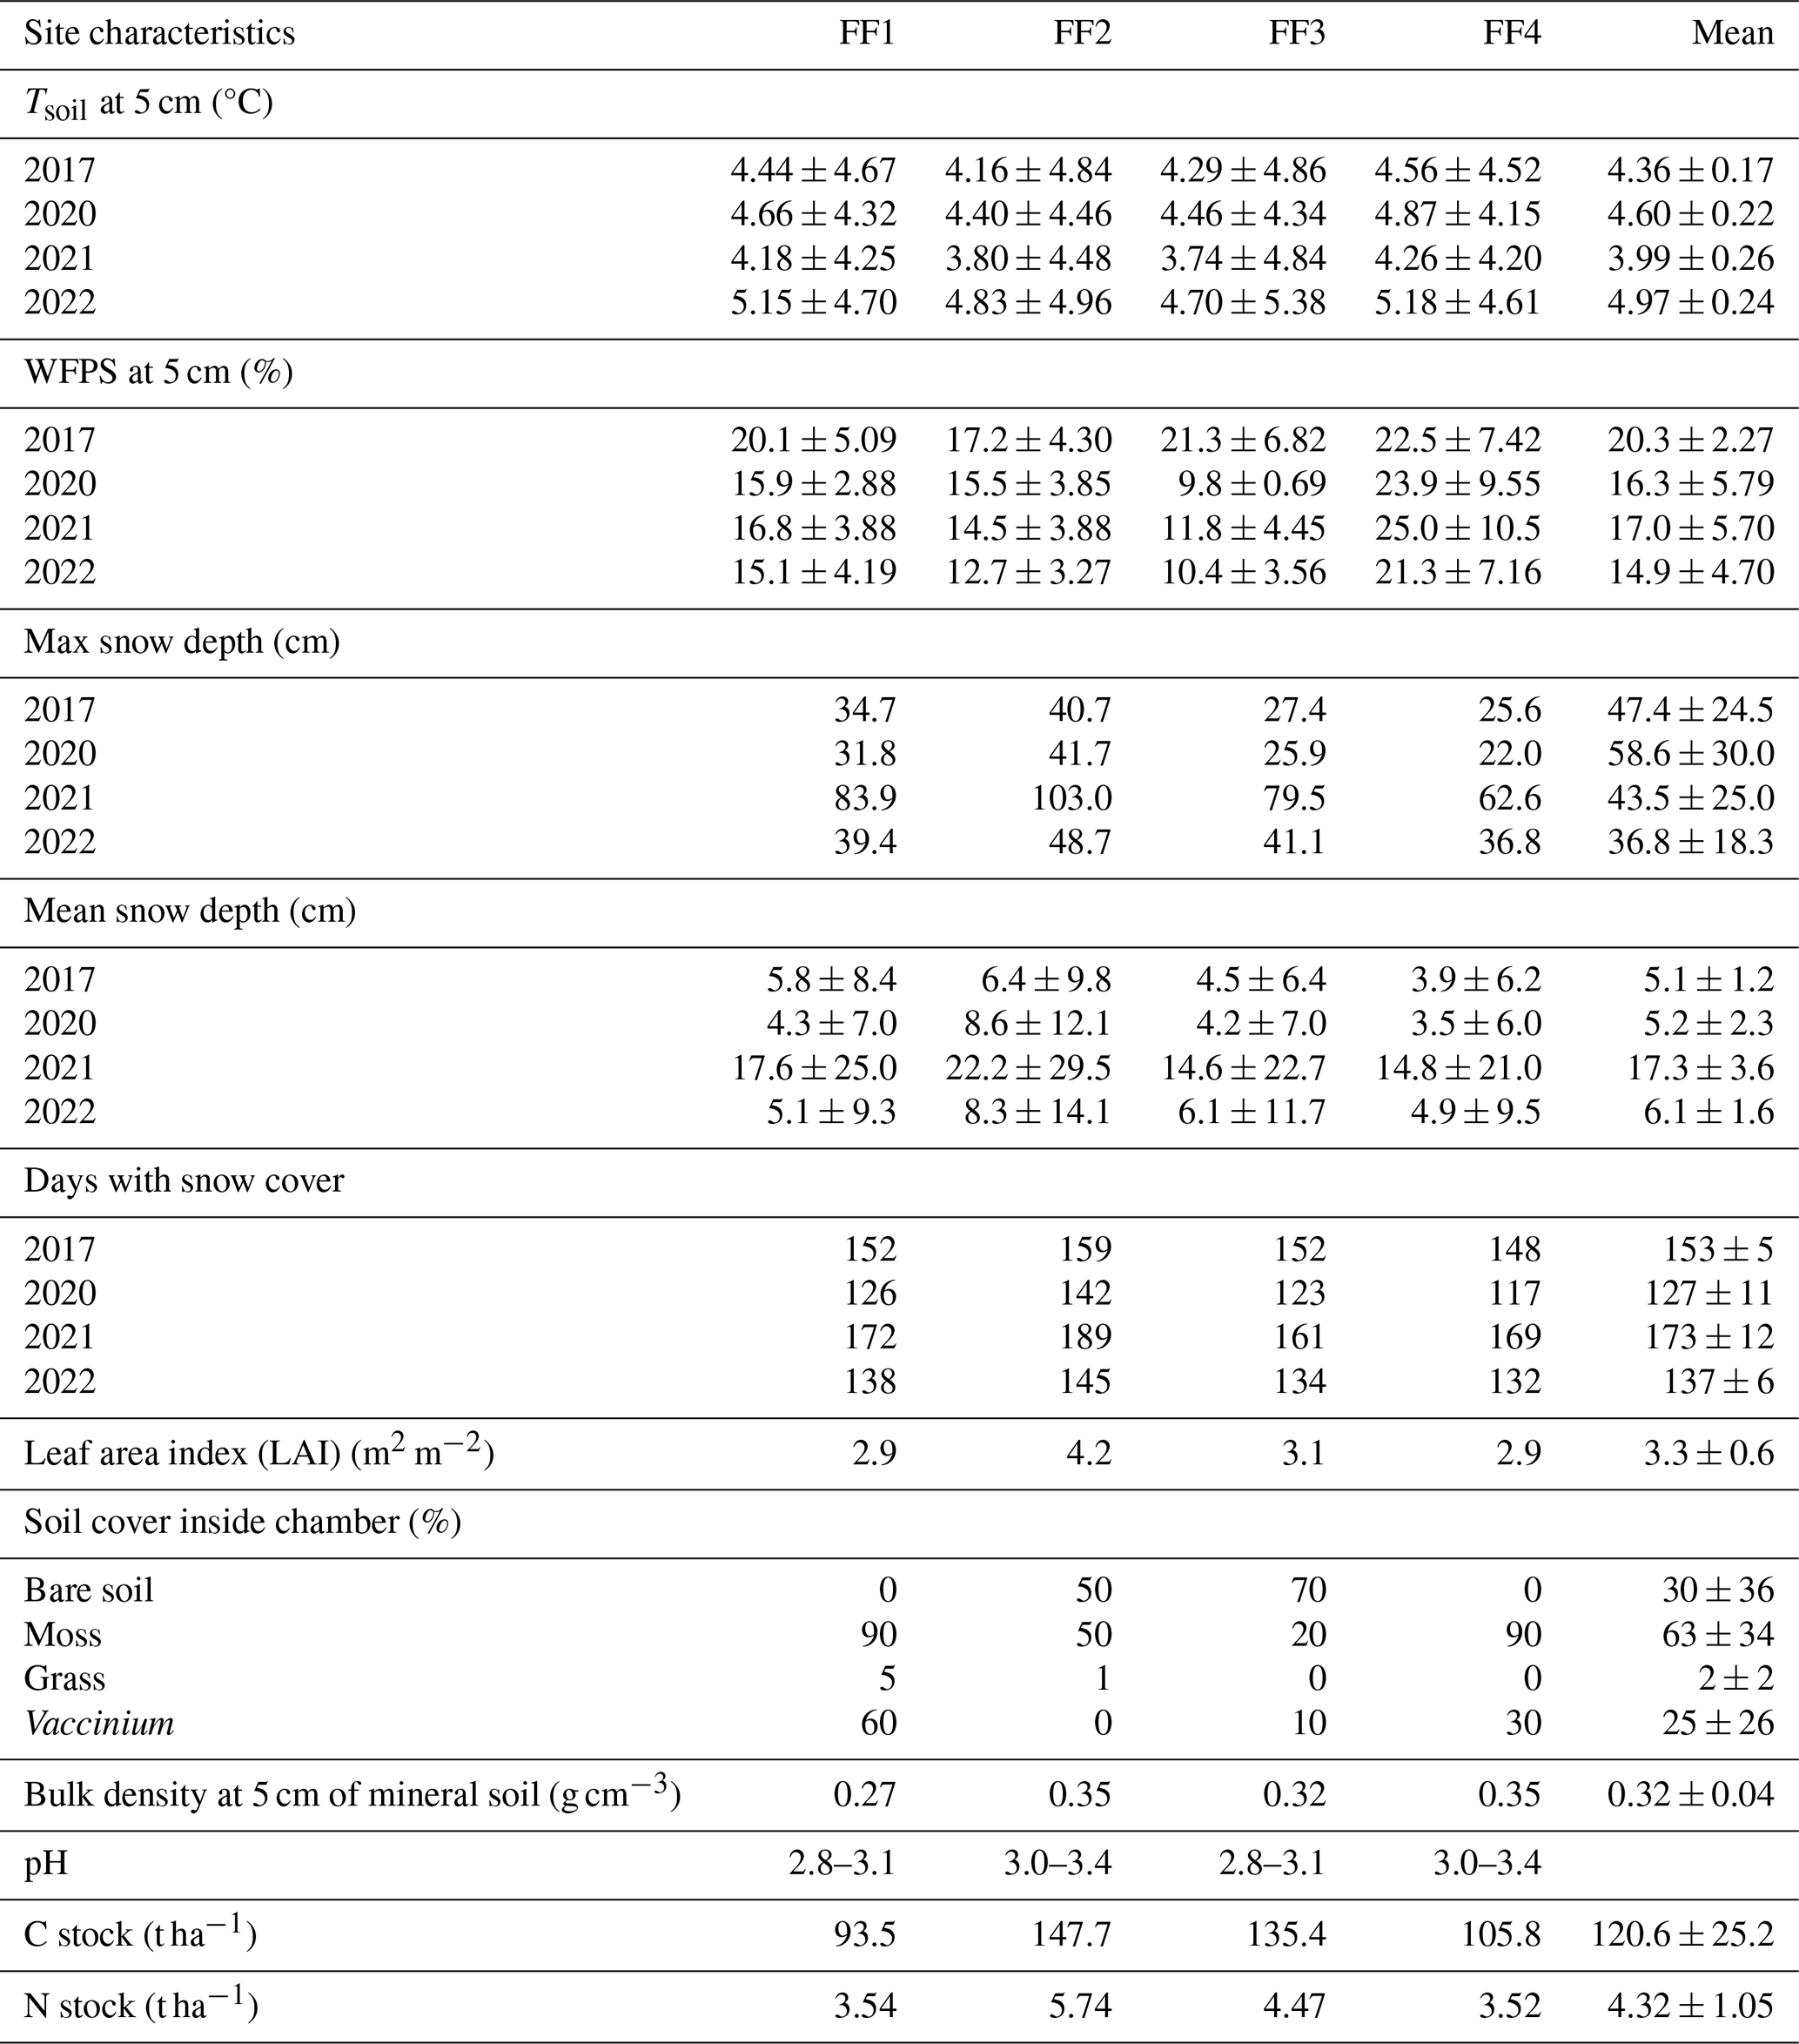
Table A3Details of random forest models used for driver analysis and gap filling for different time periods (entire year, separately for seasons). The number of observations used to train the models (training set), hyperparameters “mtry” and “ntree”, as well as R2 values for observed vs. predicted test data are given. The hyperparameter “mtry” specifies how many variables were randomly sampled as candidates at each split and “ntree” indicates the number of trees.
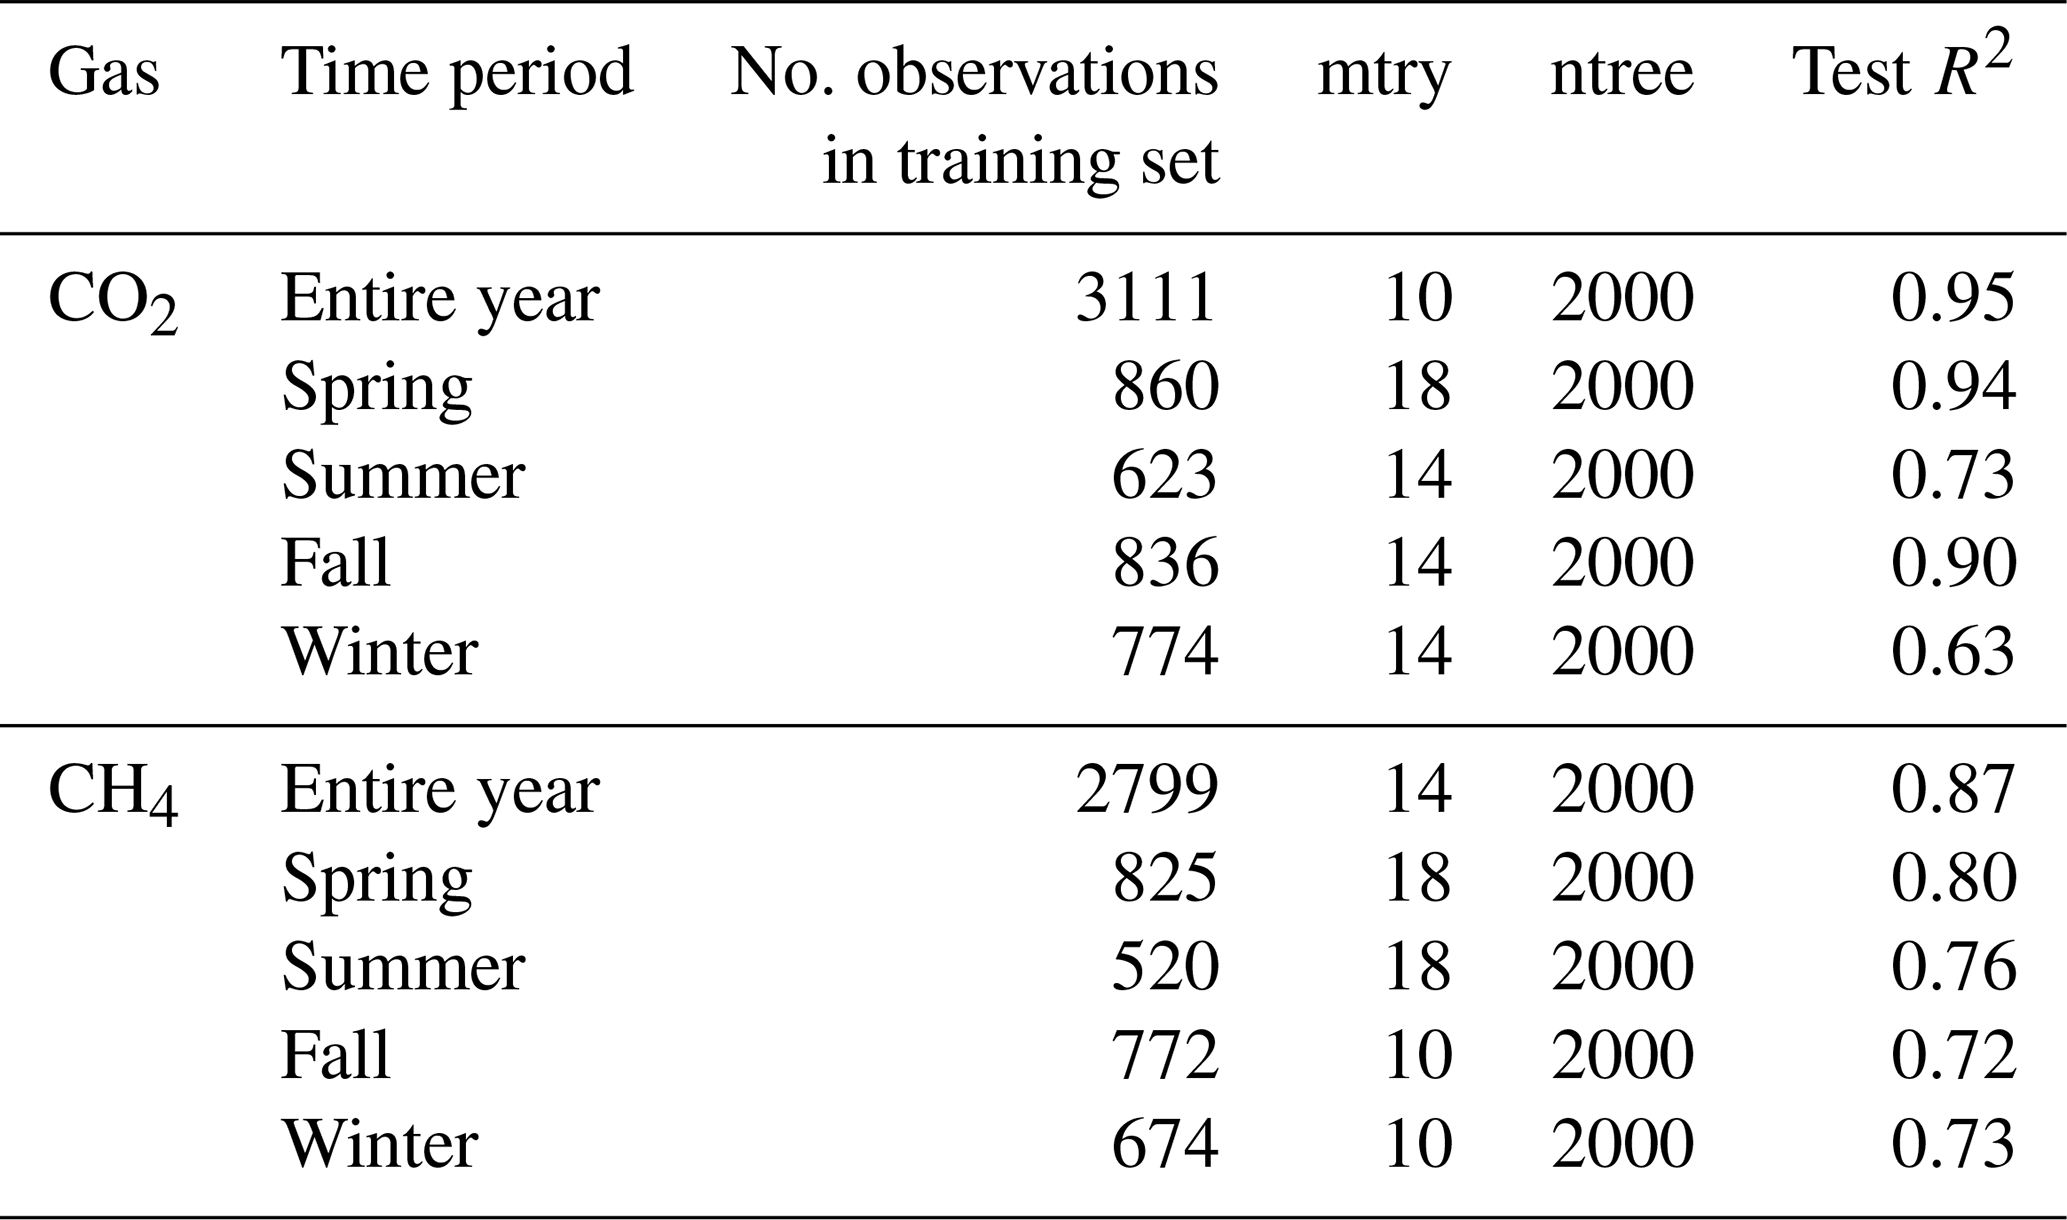
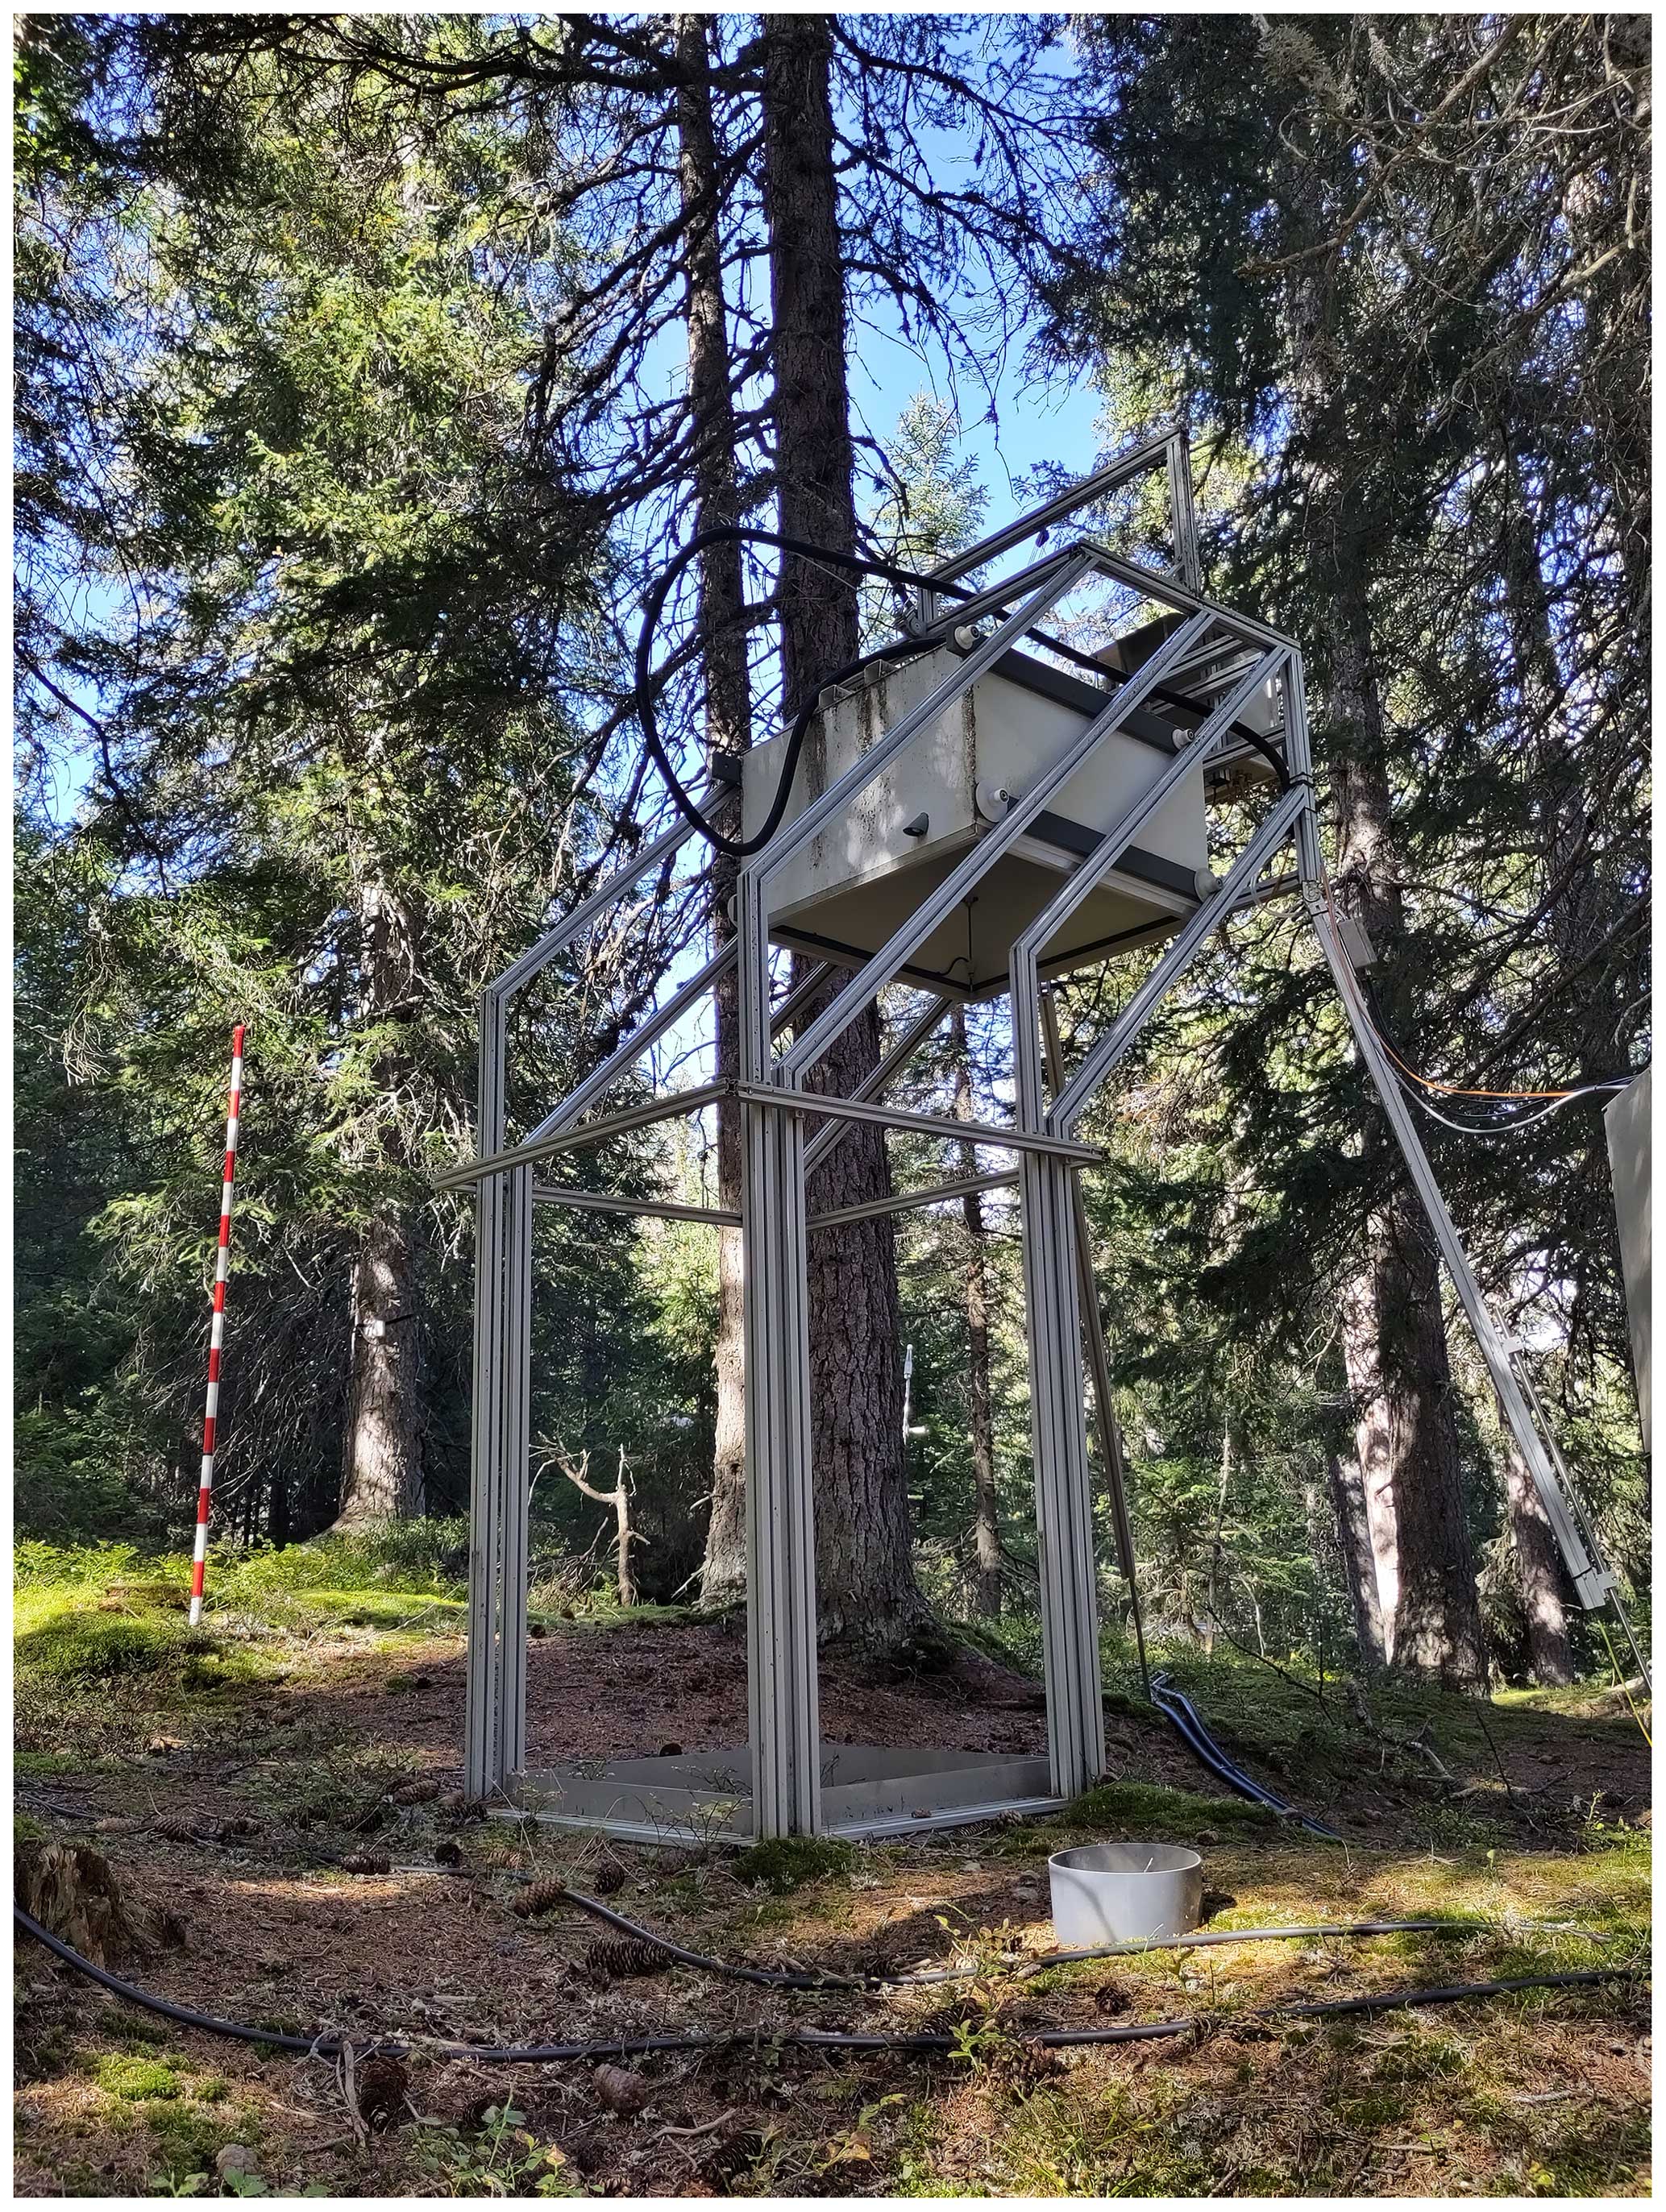
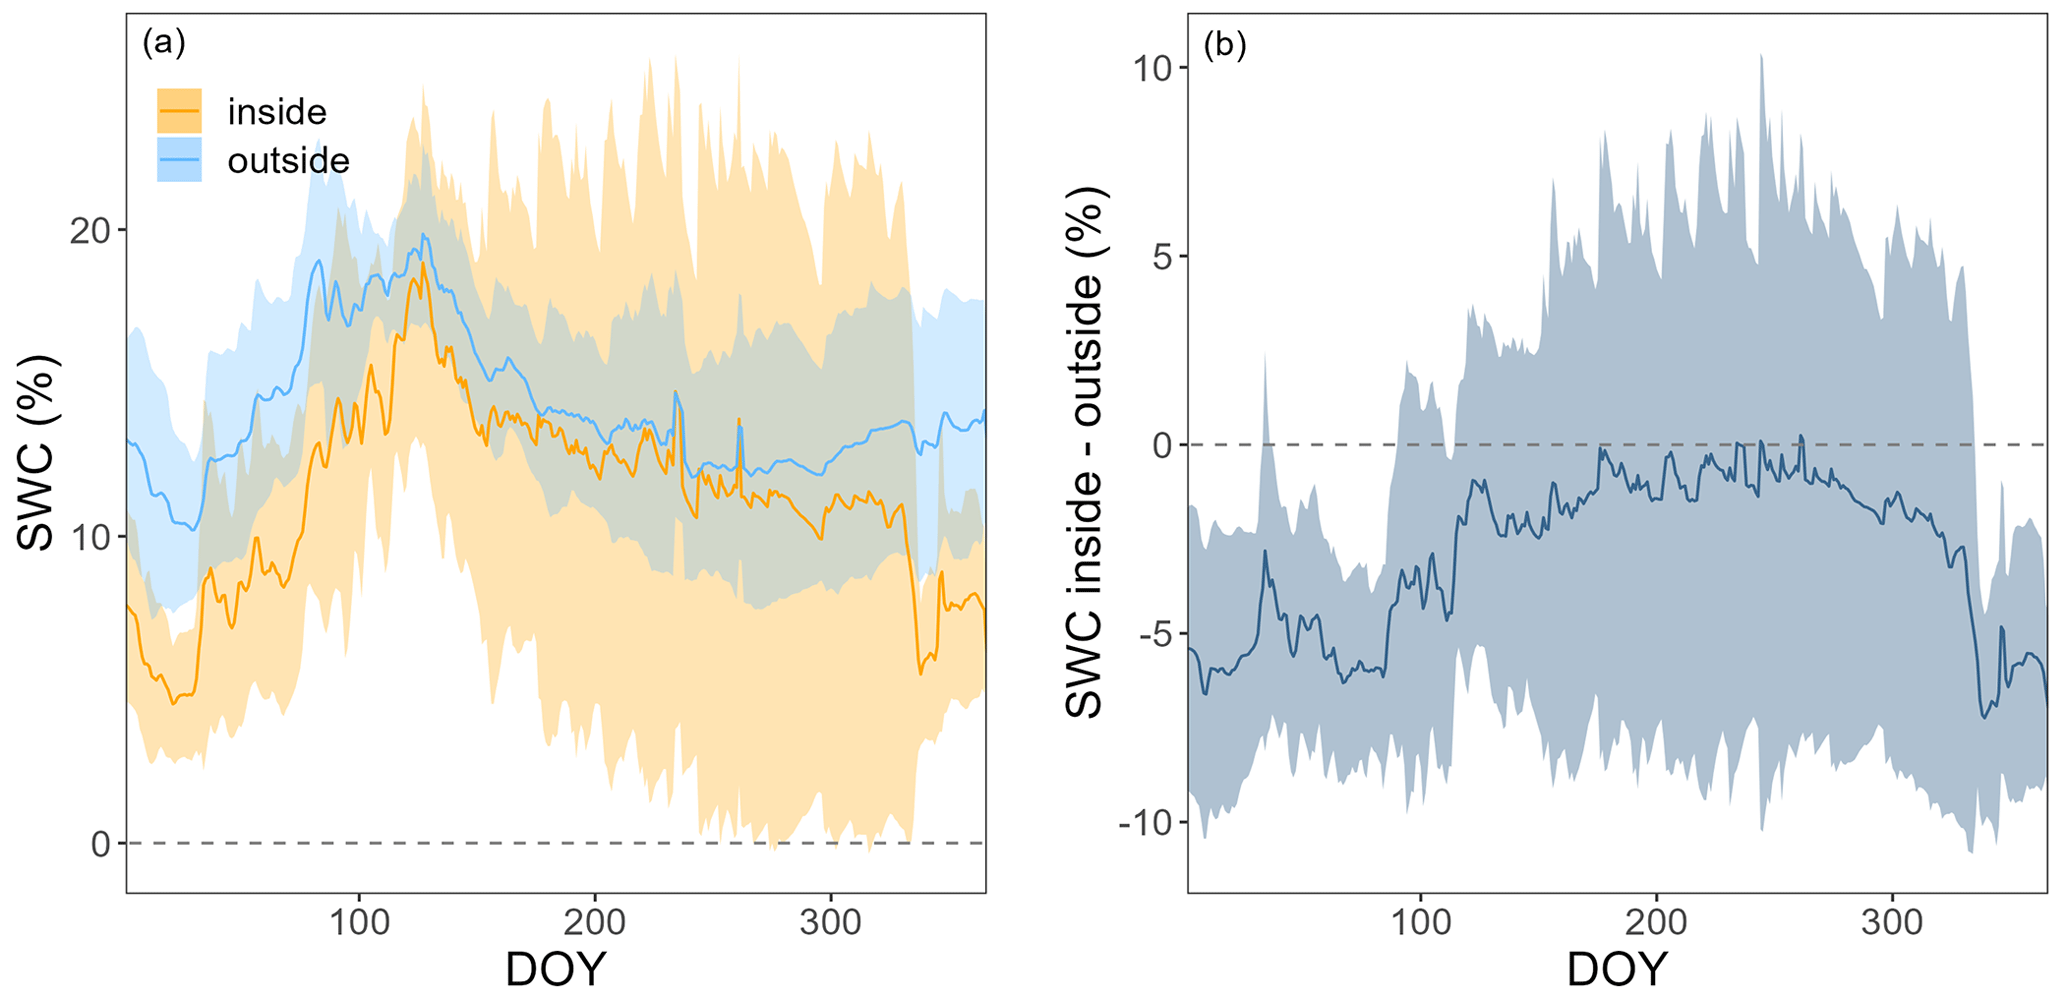
Figure A2Panel (a) shows the soil water content (SWC) at 5 cm inside (orange) and outside (light blue), and (b) shows the difference in SWC at 5 cm between the inside and outside of chambers FF1 and FF2 over the course of a year. Lines show means and bands show standard deviations over all 4 years.
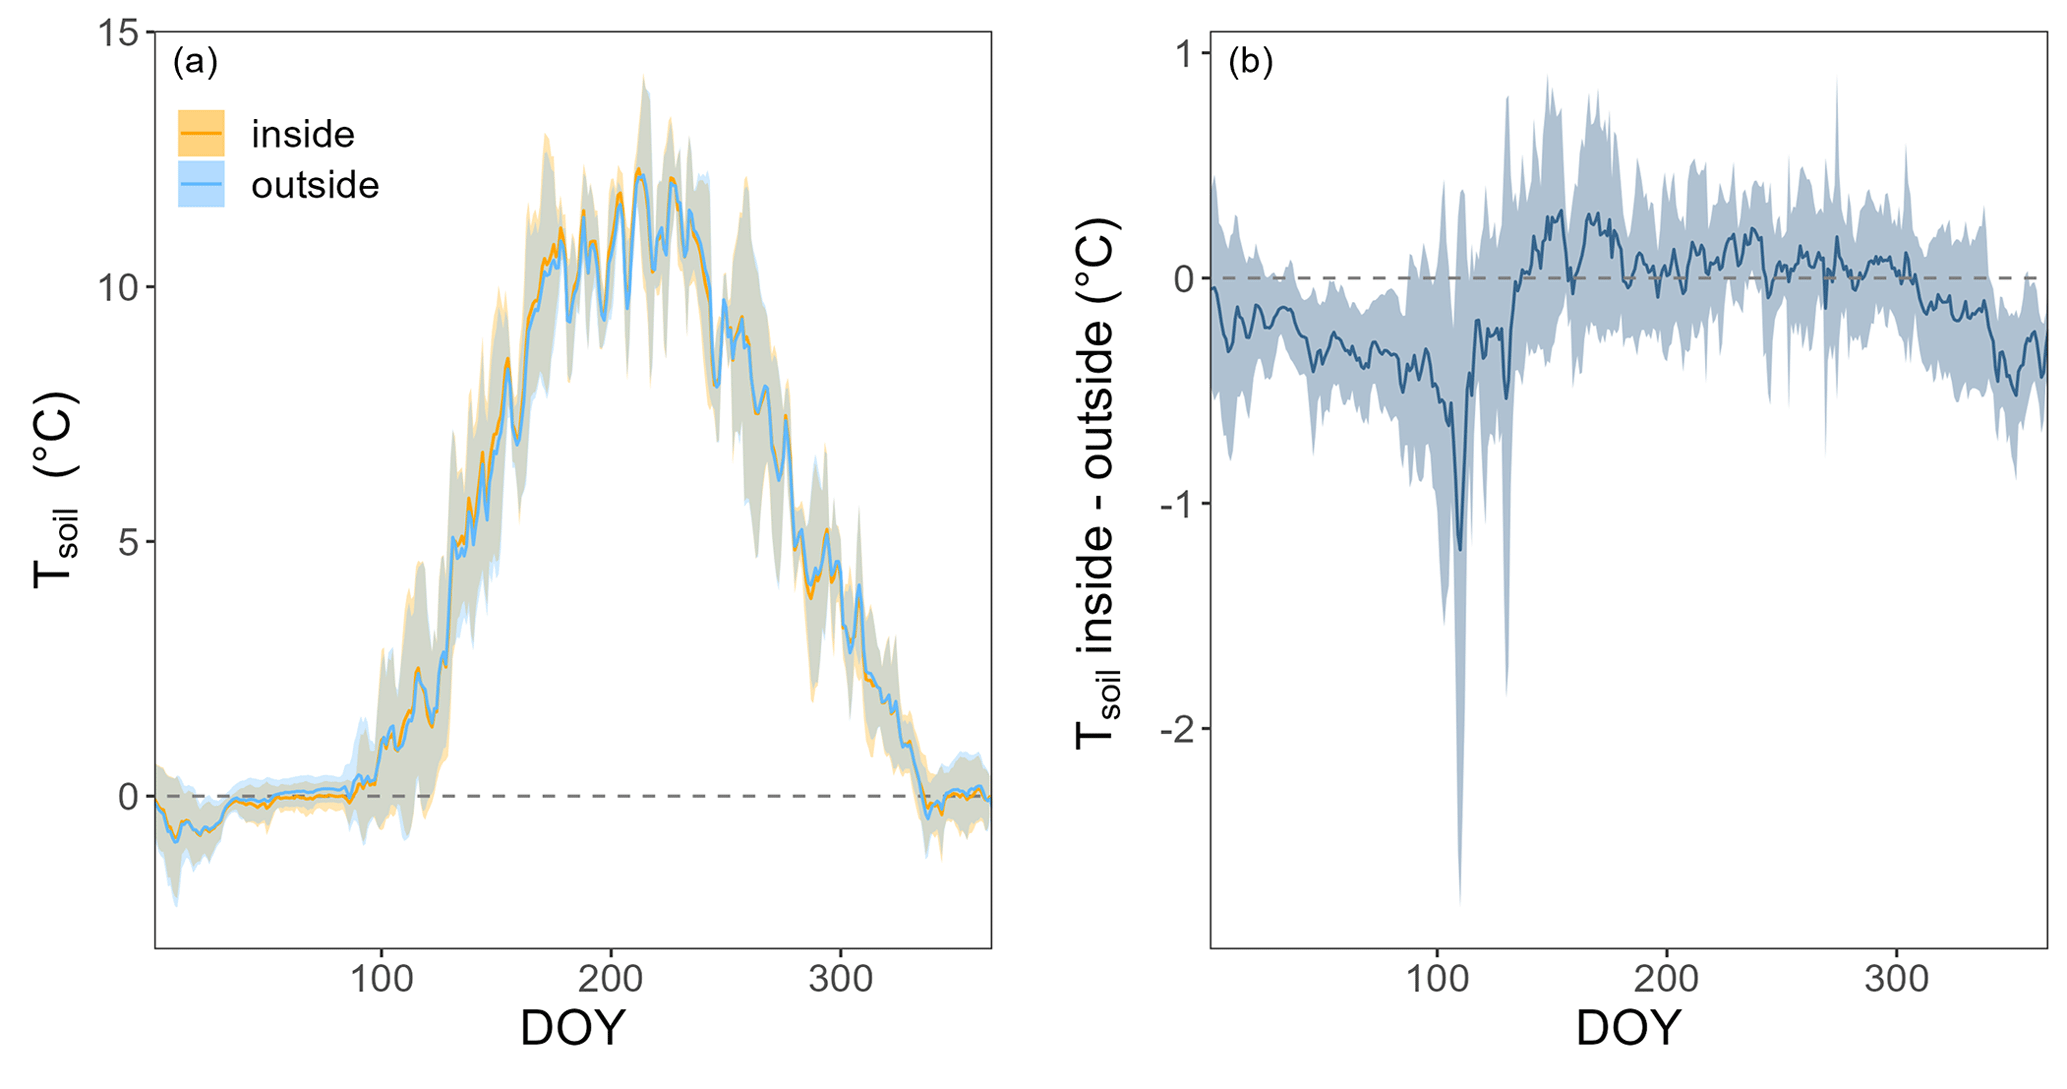
Figure A3Panel (a) shows the soil temperatures (Tsoil) at 5 cm inside (orange) and outside (light blue), and (b) shows the difference in Tsoil at 5 cm between the inside and outside of chambers FF1–FF4 over the course of a year. Lines show means and bands show standard deviations over 3 years (2017, 2020, and 2021).
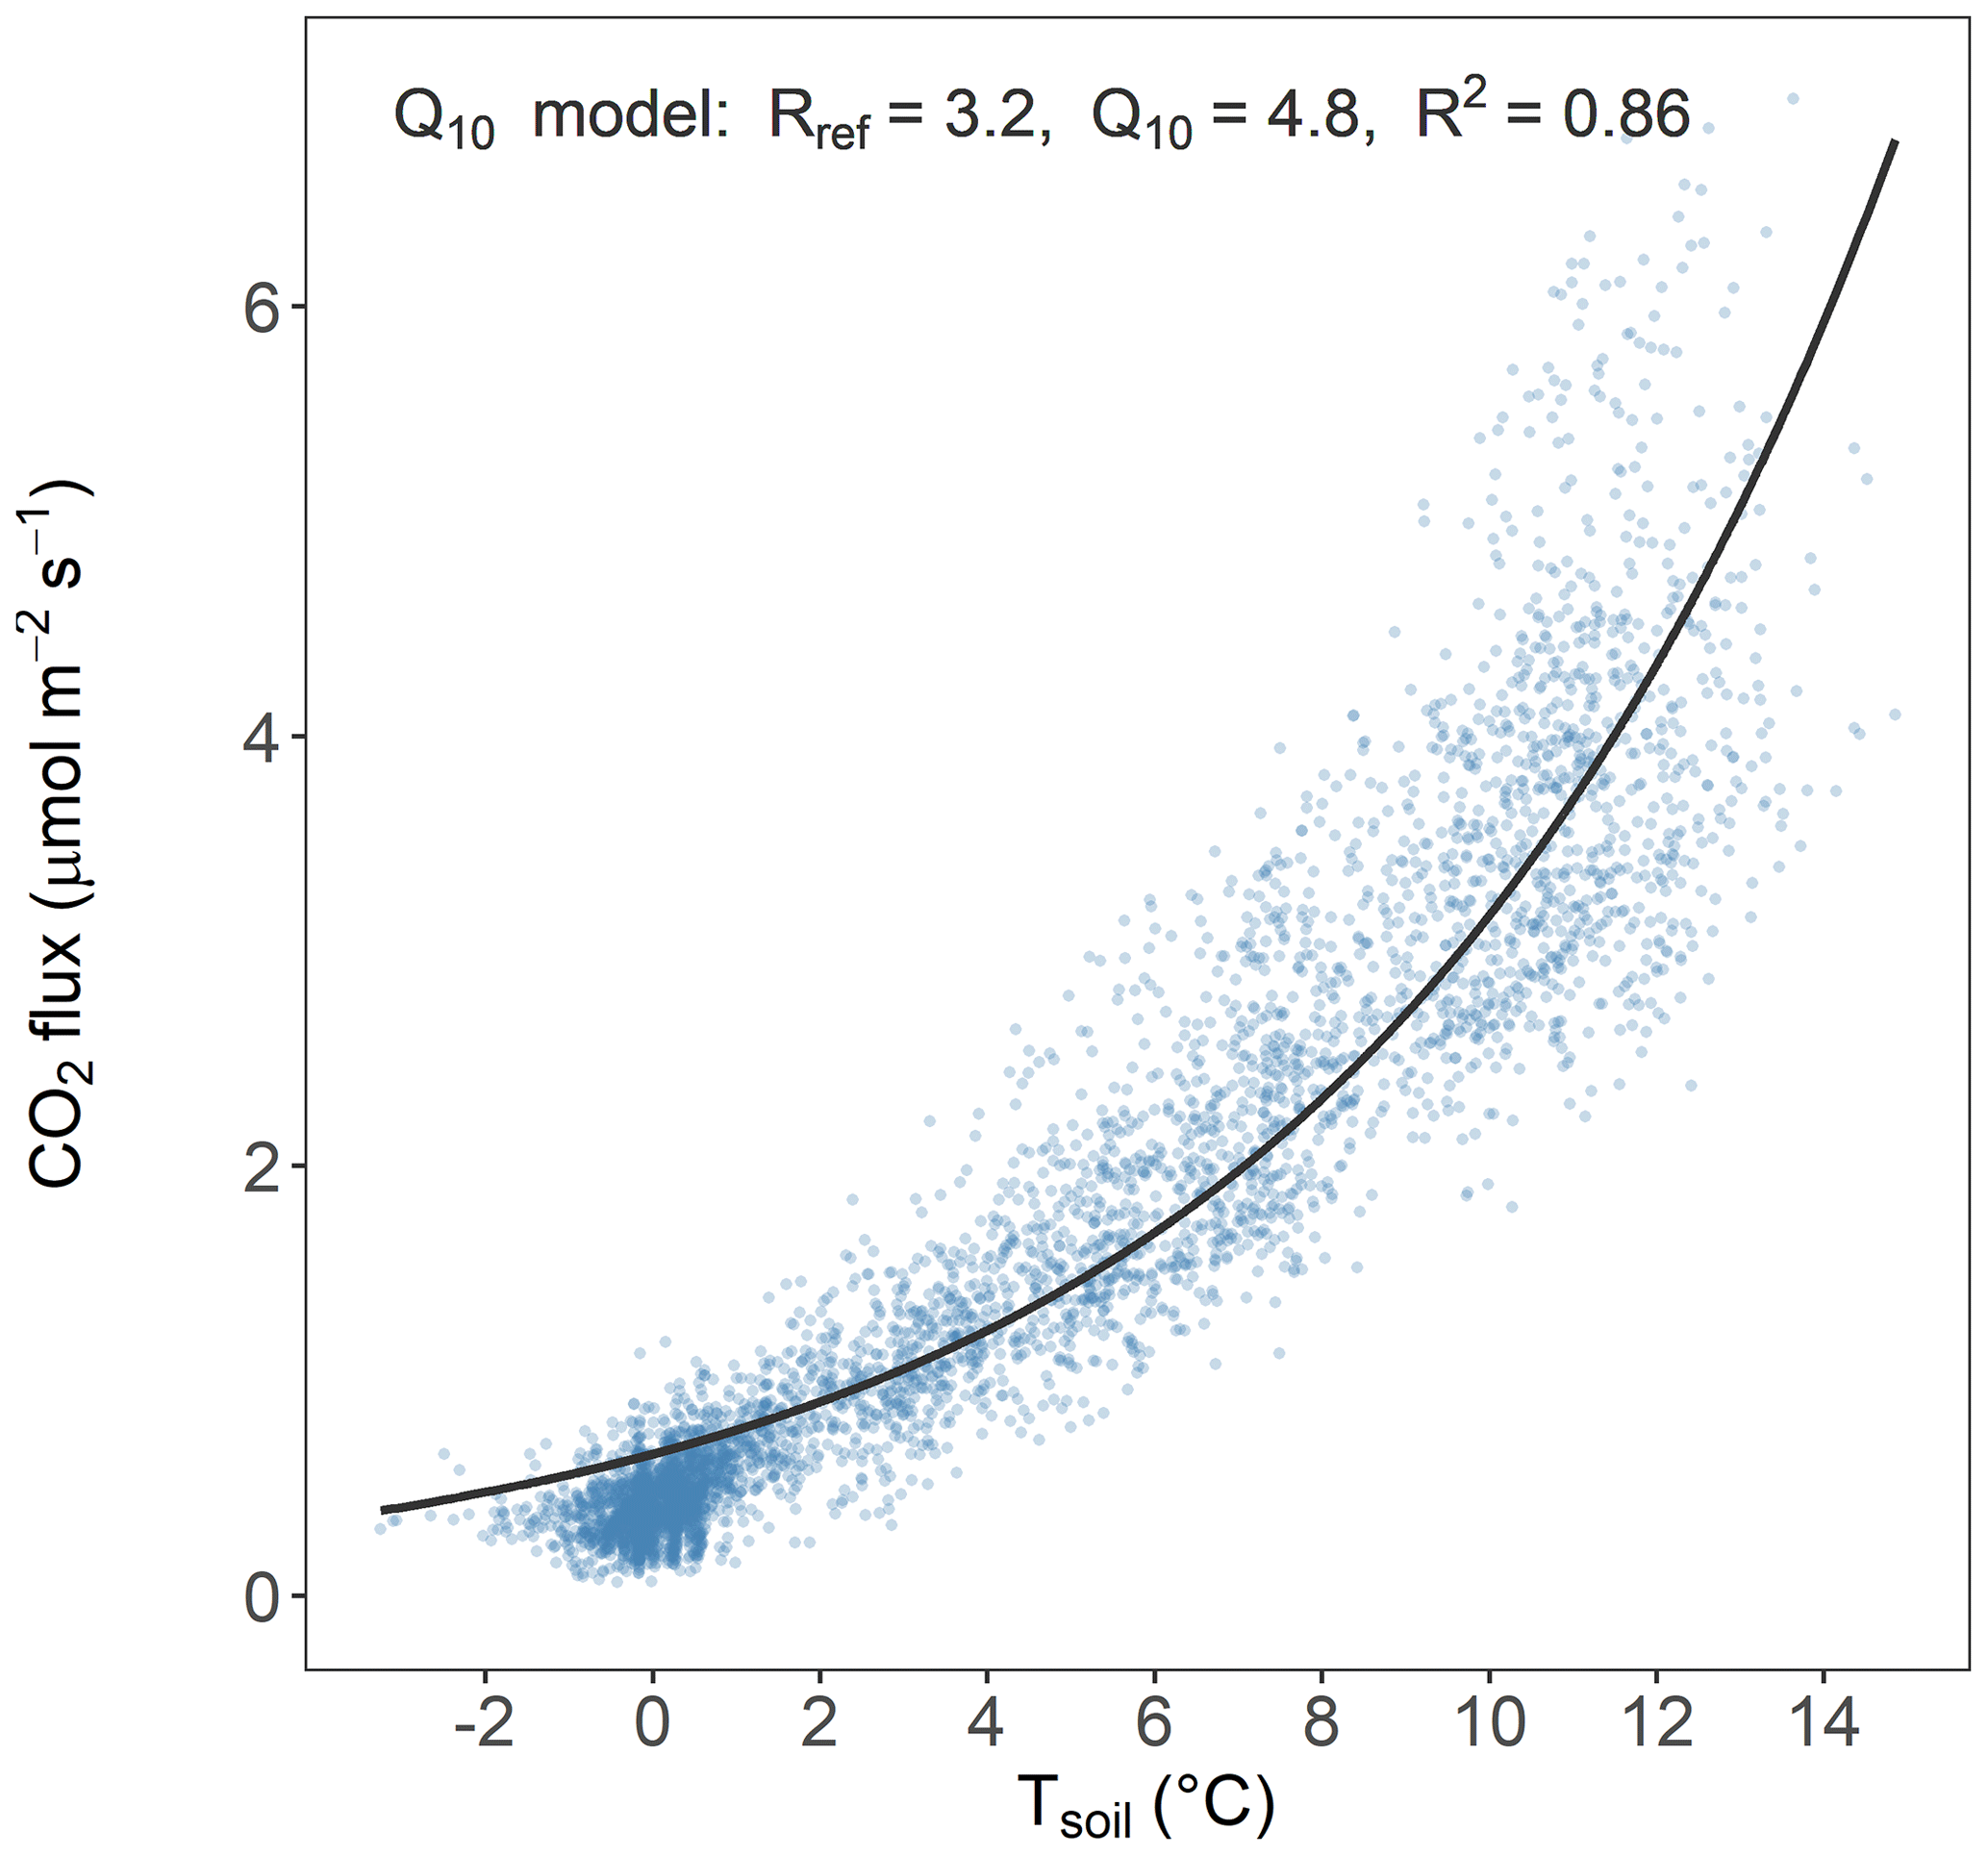
Figure A4Q10 model showing the relationship of daily means of Tsoil at 5 cm and forest-floor respiration of all chambers and years.
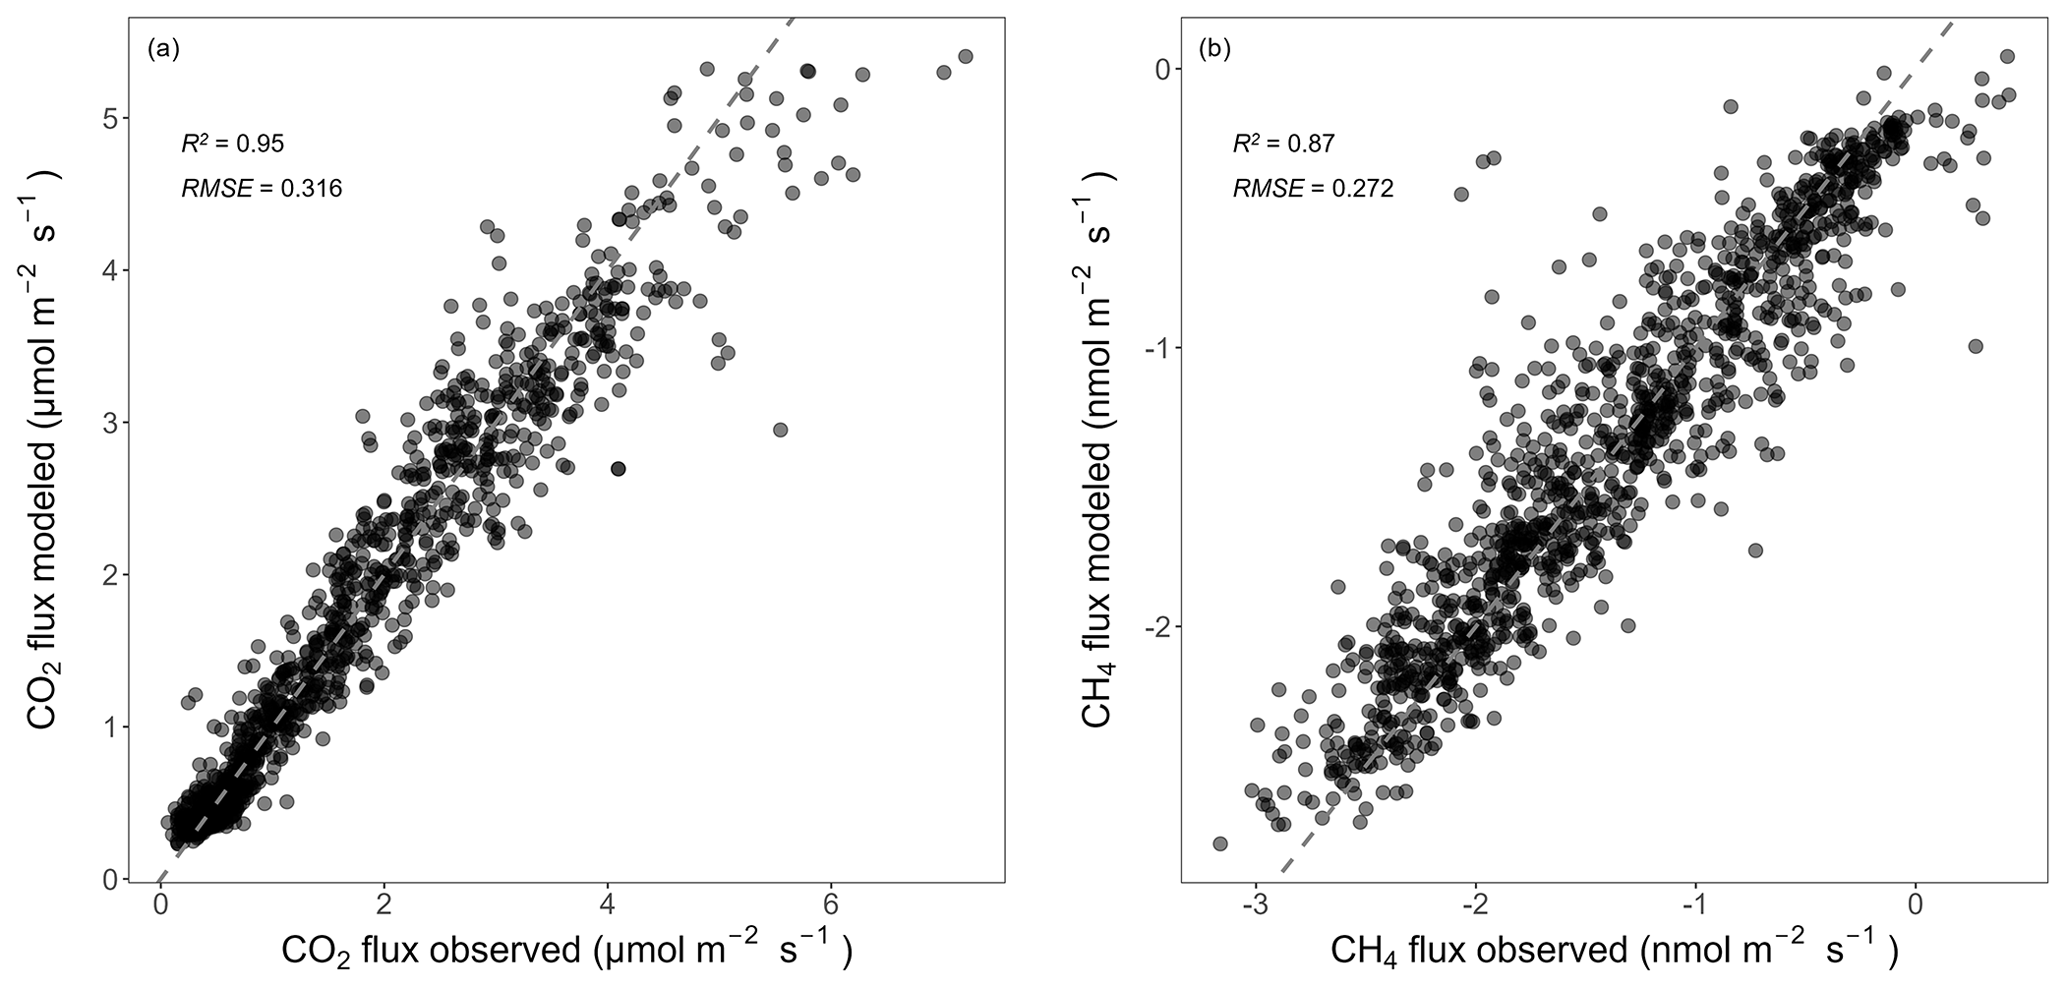
Figure A5Relationships between observed and predicted forest-floor (a) respiration and (b) CH4 fluxes from the RF models used for gap filling (only showing test data). R2 and RSME are given. Dashed gray lines mark the 1:1 lines.
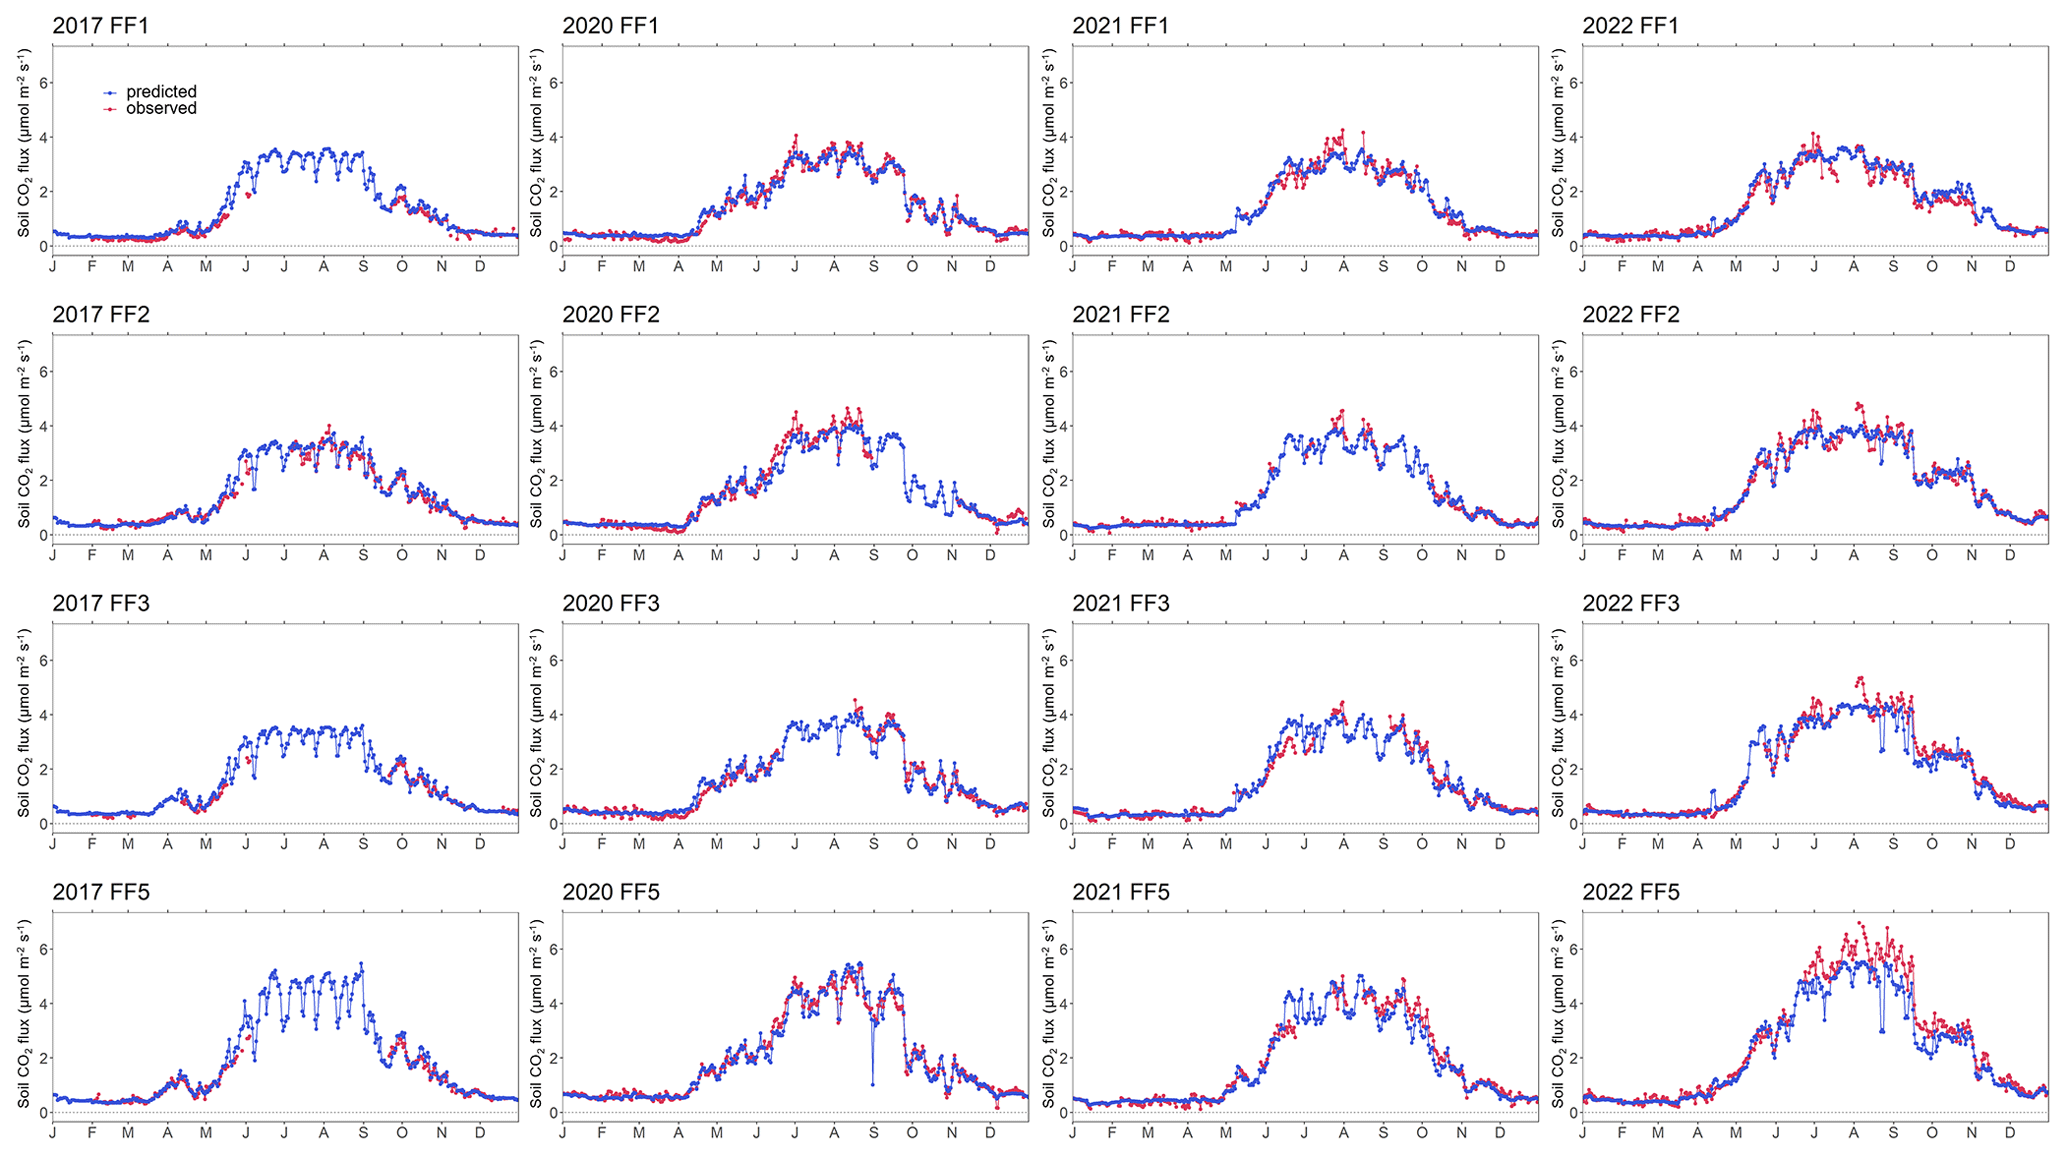
Figure A6Time series of observed and predicted (using random forest model) forest-floor respiration fluxes for 4 years (2017, 2020–2022) and four chambers (FF1–FF4).
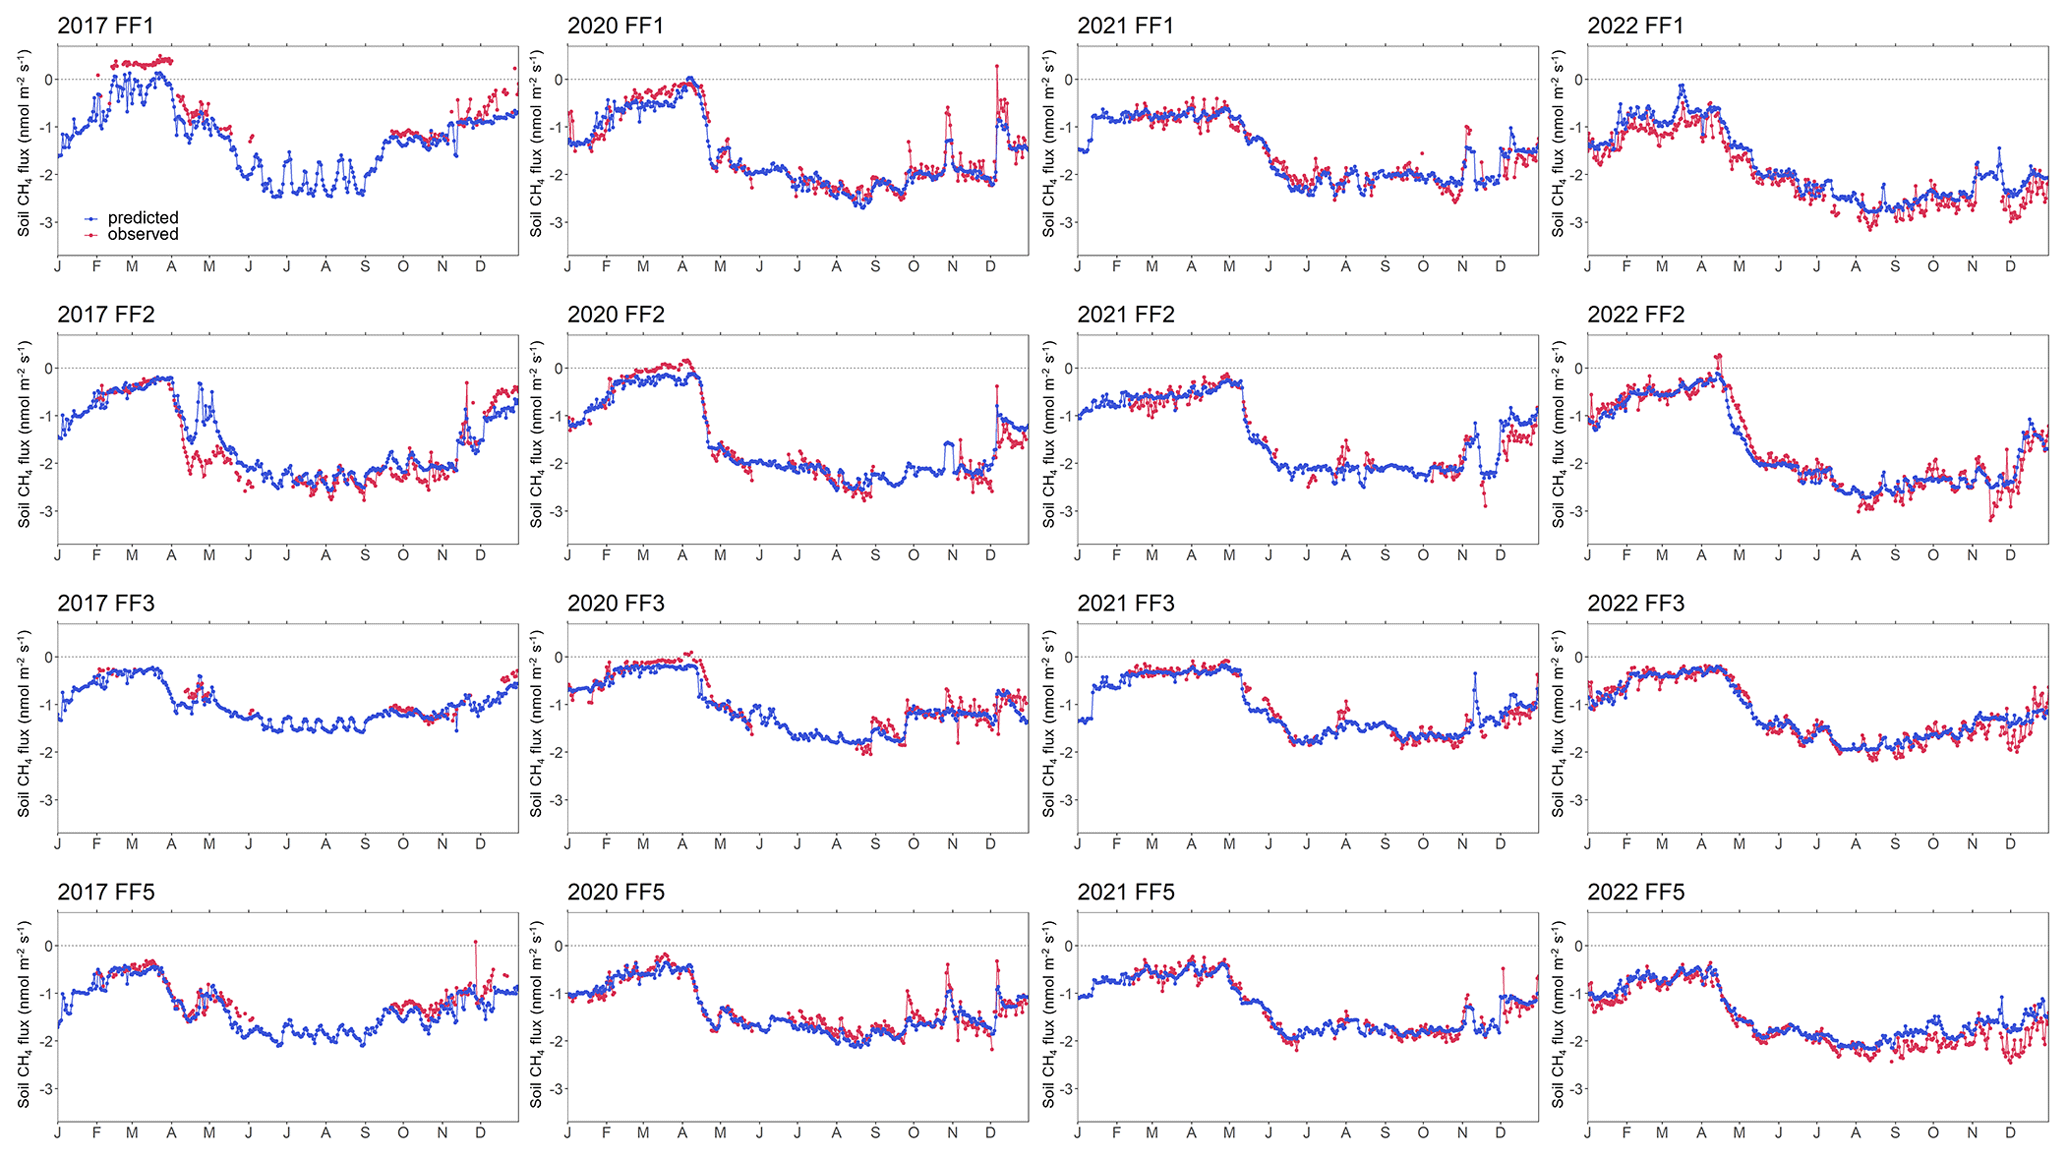
Figure A7Time series of observed and predicted (using random forest model) forest-floor CH4 fluxes for 4 years (2017, 2020–2022) and four chambers (FF1–FF4).
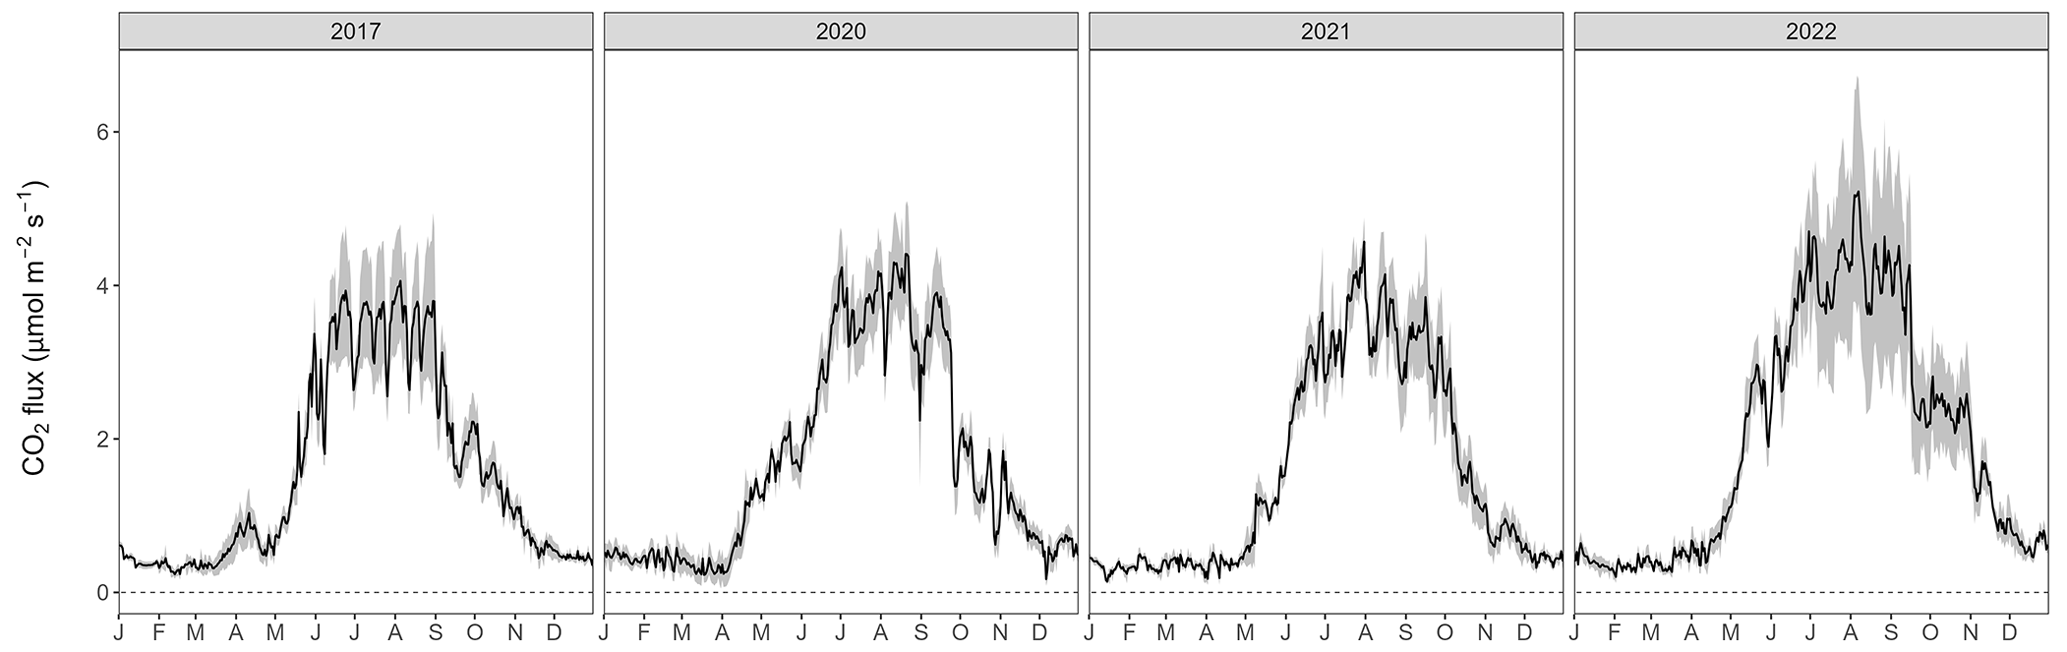
Figure A8Gap-filled forest-floor respiration fluxes over 4 years (gray area: min–max among four chambers).
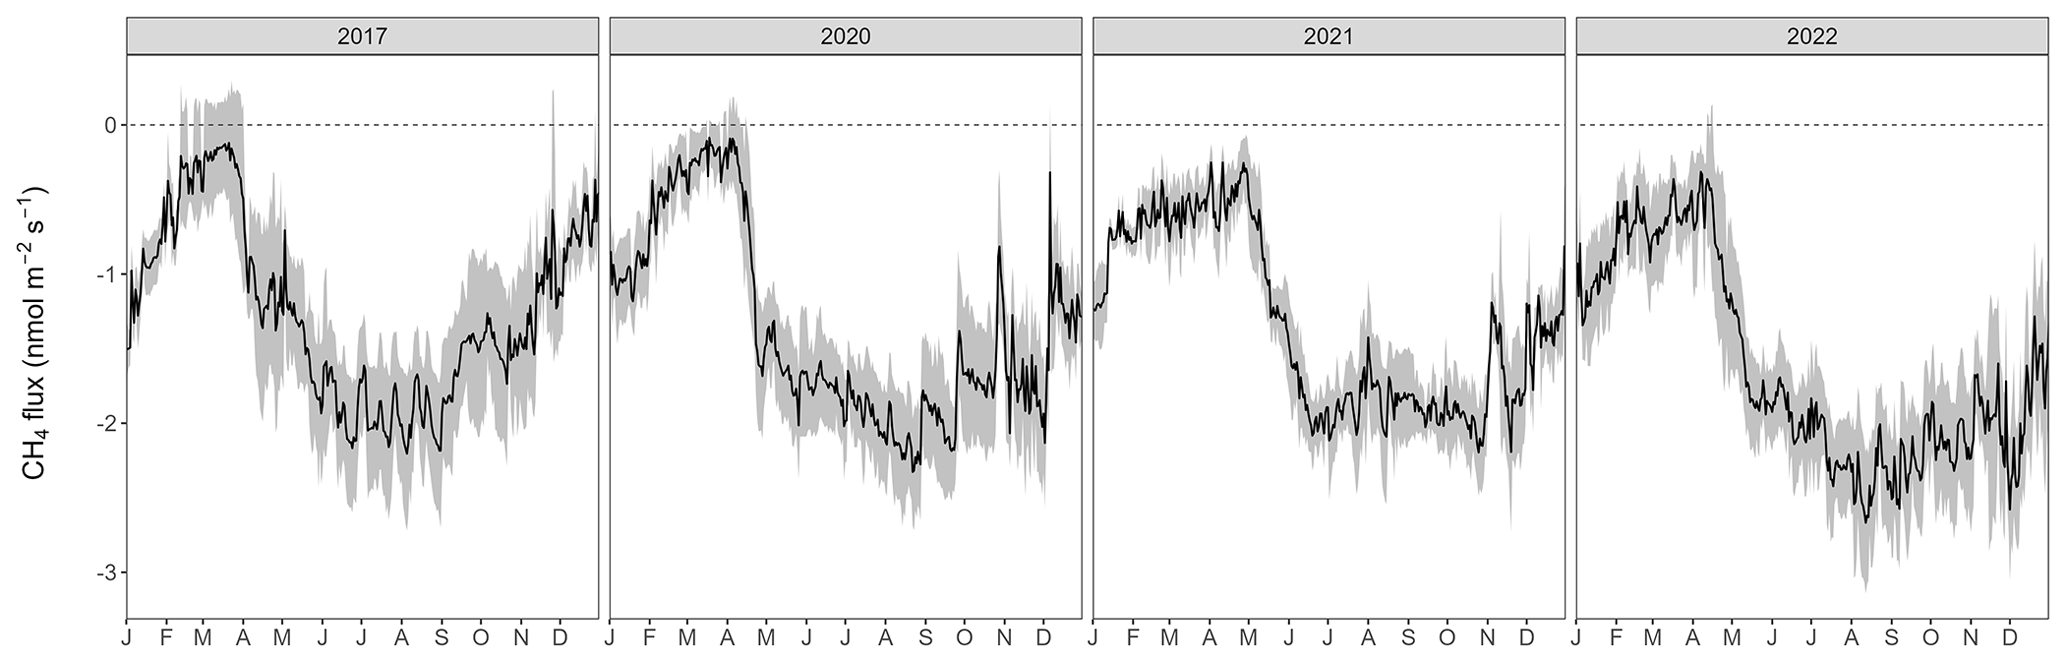
Figure A9Gap-filled forest-floor CH4 fluxes over 4 years (gray area: min–max among four chambers).
The data used in this study is publicly available from the ETH Research Collection (https://doi.org/10.3929/ethz-b-000619728, Krebs et al., 2024).
NB designed the study. PM, LK, and SB conducted the field work. SB and LK processed the data. LK performed the data analyses, developed the models, and wrote the manuscript draft. SB, MG, PM, IF, and NB commented on the manuscript and contributed substantially to discussions and revisions.
The contact author has declared that none of the authors has any competing interests.
Publisher's note: Copernicus Publications remains neutral with regard to jurisdictional claims made in the text, published maps, institutional affiliations, or any other geographical representation in this paper. While Copernicus Publications makes every effort to include appropriate place names, the final responsibility lies with the authors.
The authors thank their colleagues Lutz Merbold, Matti Barthel, Lukas Hörtnagl, Thomas Baur, Werner Eugster, and Liliana Scapucci for their assistance in designing and setting up the chambers, conducting fieldwork, and providing helpful inputs during the flux processing and data interpretation. Their contributions greatly contributed to the progress of this study.
This research has been supported by the Schweizerischer Nationalfonds zur Förderung der Wissenschaftlichen Forschung, in the projects ICOS-CH Phase 1, 2, 3 (grant nos. 20FI21_148992, 20FI20_173691, 20F120_198227) and COCO (grant no. 200021_197357).
This paper was edited by Edzo Veldkamp and reviewed by two anonymous referees.
Amthor, J. S.: The McCree–de Wit–Penning de Vries–Thornley Respiration Paradigms: 30 Years Later, Ann. Bot., 86, 1–20, https://doi.org/10.1006/anbo.2000.1175, 2000.
Anjileli, H., Huning, L. S., Moftakhari, Ashraf, S., Asanjan, A. A., Norouzi, H., and AghaKouchak, A.: Extreme heat events heighten soil respiration, Sci. Rep., 11, 6632, https://doi.org/10.1038/s41598-021-85764-8
Arrouays, D., Saby, N. P. A., Boukir, H., Jolivet, C., Ratié, C., Schrumpf, M., Merbold, L., Gielen, B., Gogo, S., Delpierre, N., Vincent, G., Klumpp, K., and Loustau, D.: Soil sampling and preparation for monitoring soil carbon, Int. Agrophys., 32, 633–643, https://doi.org/10.1515/intag-2017-0047, 2018.
Barba, J., Cueva, A., Bahn, M., Barron-Gafford, G. A., Bond-Lamberty, B., Hanson, P. J., Jaimes, A., Kulmala, L., Pumpanen, J., Scott, R. L., Wohlfahrt, G., and Vargas, R.: Comparing ecosystem and soil respiration: Review and key challenges of tower-based and soil measurements, Agr. Forest Meteorol., 249, 434–443, https://doi.org/10.1016/j.agrformet.2017.10.028, 2018.
Barba, J., Poyatos, R., and Vargas, R.: Automated measurements of greenhouse gases fluxes from tree stems and soils: magnitudes, patterns and drivers, Sci. Rep., 9, 4005, https://doi.org/10.1038/s41598-019-39663-8, 2019.
Barrena, I., Menéndez, S., Duñabeitia, M., Merino, P., Florian Stange, C., Spott, O., González-Murua, C., and Estavillo, J. M.: Greenhouse gas fluxes (CO2, N2O and CH4) from forest soils in the Basque Country: Comparison of different tree species and growth stages, Forest Ecol. Manag., 310, 600–611, https://doi.org/10.1016/j.foreco.2013.08.065, 2013.
Barthel, M., Bauters, M., Baumgartner, S., Drake, T. W., Bey, N. M., Bush, G., Boeckx, P., Botefa, C. I., Dériaz, N., Ekamba, G. L., Gallarotti, N., Mbayu, F. M., Mugula, J. K., Makelele, I. A., Mbongo, C. E., Mohn, J., Mandea, J. Z., Mpambi, D. M., Ntaboba, L. C., Rukeza, M. B., Spencer, R. G. M., Summerauer, L., Vanlauwe, B., Van Oost, K., Wolf, B., and Six, J.: Low N2O and variable CH4 fluxes from tropical forest soils of the Congo Basin, Nat. Commun., 13, 330, https://doi.org/10.1038/s41467-022-27978-6, 2022.
Basiliko, N., Knowles, R., and Moore, T. R.: Roles of moss species and habitat in methane consumption potential in a northern peatland, Wetlands, 24, 178–185, https://doi.org/10.1672/0277-5212(2004)024[0178:ROMSAH]2.0.CO;2, 2004.
Blankinship, J. C., McCorkle, E. P., Meadows, M. W., and Hart, S. C.: Quantifying the legacy of snowmelt timing on soil greenhouse gas emissions in a seasonally dry montane forest, Glob. Change Biol., 24, 5933–5947, https://doi.org/10.1111/gcb.14471, 2018.
Bond-Lamberty, B., Bailey, V. L., Chen, M., Gough, C. M., and Vargas, R.: Globally rising soil heterotrophic respiration over recent decades, Nature, 560, 80–83, https://doi.org/10.1038/s41586-018-0358-x, 2018.
Borken, W., Davidson, E. A., Savage, K., Sundquist, E. T., and Steudler, P.: Effect of summer throughfall exclusion, summer drought, and winter snow cover on methane fluxes in a temperate forest soil, Soil Biol. Biochem., 38, 1388–1395, https://doi.org/10.1016/j.soilbio.2005.10.011, 2006.
Braun, S., Schindler, C., and Rihm, B.: Growth trends of beech and Norway spruce in Switzerland: The role of nitrogen deposition, ozone, mineral nutrition and climate, Sci. Total Environ., 599–600, 637–646, https://doi.org/10.1016/j.scitotenv.2017.04.230, 2017.
Brümmer, C., Lyshede, B., Lempio, D., Delorme, J.-P., Rüffer, J. J., Fuß, R., Moffat, A. M., Hurkuck, M., Ibrom, A., Ambus, P., Flessa, H., and Kutsch, W. L.: Gas chromatography vs. quantum cascade laser-based N2O flux measurements using a novel chamber design, Biogeosciences, 14, 1365–1381, https://doi.org/10.5194/bg-14-1365-2017, 2017.
Butterbach-Bahl, K., Baggs, E. M., Dannenmann, M., Kiese, R., and Zechmeister-Boltenstern, S.: Nitrous oxide emissions from soils: how well do we understand the processes and their controls?, Philos. Trans. R. Soc. B, 368, 20130122, https://doi.org/10.1098/rstb.2013.0122, 2013.
CH2018: CH2018 – Climate Scenarios for Switzerland, Tech. Rep., National Centre for Climate Services, Zurich, Switzerland, ISBN: 78-3-9525031-4-0, 2018.
Chapuis-Lardy, L., Wrage, N., Metay, A., Chotte, J.-L., and Bernoux, M.: Soils, a sink for N2O? A review, Glob. Change Biol., 13, 1–17, https://doi.org/10.1111/j.1365-2486.2006.01280.x, 2007.
Chen, W., Wang, S., Wang, J., Xia, J., Luo, Y., Yu, G., and Niu, S.: Evidence for widespread thermal optimality of ecosystem respiration, Nat. Ecol. Evol., 7, 1379–1387, https://doi.org/10.1038/s41559-023-02121-w, 2023.
Danielson, R. E. and Sutherland, P. L.: Porosity, in: SSSA Book Series, edited by: Klute, A., Soil Science Society of America, American Society of Agronomy, Madison, WI, USA, 443–461, https://doi.org/10.2136/sssabookser5.1.2ed.c18, 2018.
Davidson, E. A., Janssens, I. A., and Luo, Y.: On the variability of respiration in terrestrial ecosystems: moving beyond Q10: On the variability of respiration in terrestrial ecosystems, Glob. Change Biol., 12, 154–164, https://doi.org/10.1111/j.1365-2486.2005.01065.x, 2006.
Debeer, D. and Strobl, C.: Conditional permutation importance revisited, BMC Bioinformatics, 21, 307, https://doi.org/10.1186/s12859-020-03622-2, 2020.
Debeer, D., Hothorn, T., and Strobl, C.: permimp: Conditional Permutation Importance, R package, CRAN, https://cran.r-project.org/web/packages/permimp (last access: 10 April 2024), 2021.
Dutaur, L. and Verchot, L. V.: A global inventory of the soil CH4 sink, Global Biogeochem. Cy., 21, GB4013, https://doi.org/10.1029/2006GB002734, 2007.
Fest, B. J., Livesley, S. J., Drösler, M., van Gorsel, E., and Arndt, S. K.: Soil–atmosphere greenhouse gas exchange in a cool, temperate Eucalyptus delegatensis forest in south-eastern Australia, Agr. Forest Meteorol., 149, 393–406, https://doi.org/10.1016/j.agrformet.2008.09.007, 2009.
Friedlingstein, P., O'Sullivan, M., Jones, M. W., Andrew, R. M., Bakker, D. C. E., Hauck, J., Landschützer, P., Le Quéré, C., Luijkx, I. T., Peters, G. P., Peters, W., Pongratz, J., Schwingshackl, C., Sitch, S., Canadell, J. G., Ciais, P., Jackson, R. B., Alin, S. R., Anthoni, P., Barbero, L., Bates, N. R., Becker, M., Bellouin, N., Decharme, B., Bopp, L., Brasika, I. B. M., Cadule, P., Chamberlain, M. A., Chandra, N., Chau, T.-T.-T., Chevallier, F., Chini, L. P., Cronin, M., Dou, X., Enyo, K., Evans, W., Falk, S., Feely, R. A., Feng, L., Ford, D. J., Gasser, T., Ghattas, J., Gkritzalis, T., Grassi, G., Gregor, L., Gruber, N., Gürses, Ö., Harris, I., Hefner, M., Heinke, J., Houghton, R. A., Hurtt, G. C., Iida, Y., Ilyina, T., Jacobson, A. R., Jain, A., Jarníková, T., Jersild, A., Jiang, F., Jin, Z., Joos, F., Kato, E., Keeling, R. F., Kennedy, D., Klein Goldewijk, K., Knauer, J., Korsbakken, J. I., Körtzinger, A., Lan, X., Lefèvre, N., Li, H., Liu, J., Liu, Z., Ma, L., Marland, G., Mayot, N., McGuire, P. C., McKinley, G. A., Meyer, G., Morgan, E. J., Munro, D. R., Nakaoka, S.-I., Niwa, Y., O'Brien, K. M., Olsen, A., Omar, A. M., Ono, T., Paulsen, M., Pierrot, D., Pocock, K., Poulter, B., Powis, C. M., Rehder, G., Resplandy, L., Robertson, E., Rödenbeck, C., Rosan, T. M., Schwinger, J., Séférian, R., Smallman, T. L., Smith, S. M., Sospedra-Alfonso, R., Sun, Q., Sutton, A. J., Sweeney, C., Takao, S., Tans, P. P., Tian, H., Tilbrook, B., Tsujino, H., Tubiello, F., van der Werf, G. R., van Ooijen, E., Wanninkhof, R., Watanabe, M., Wimart-Rousseau, C., Yang, D., Yang, X., Yuan, W., Yue, X., Zaehle, S., Zeng, J., and Zheng, B.: Global Carbon Budget 2023, Earth Syst. Sci. Data, 15, 5301–5369, https://doi.org/10.5194/essd-15-5301-2023, 2023.
Fuentes, S., Palmer, A. R., Taylor, D., Zeppel, M., Whitley, R., and Eamus, D.: An automated procedure for estimating the leaf area index (LAI) of woodland ecosystems using digital imagery, MATLAB programming and its application to an examination of the relationship between remotely sensed and field measurements of LAI, Funct. Plant Biol., 35, 1070, https://doi.org/10.1071/FP08045, 2008.
Gao, D., Hagedorn, F., Zhang, L., Liu, J., Qu, G., Sun, J., Peng, B., Fan, Z., Zheng, J., Jiang, P., and Bai, E.: Small and transient response of winter soil respiration and microbial communities to altered snow depth in a mid-temperate forest, Appl. Soil Ecol., 130, 40–49, https://doi.org/10.1016/j.apsoil.2018.05.010, 2018.
Gaumont-Guay, D., Black, T. A., Barr, A. G., Griffis, T. J., Jassal, R. S., Krishnan, P., Grant, N., and Nesic, Z.: Eight years of forest-floor CO2 exchange in a boreal black spruce forest: Spatial integration and long-term temporal trends, Agr. Forest Meteorol., 184, 25–35, https://doi.org/10.1016/j.agrformet.2013.08.010, 2014.
Gharun, M., Klesse, S., Tomlinson, G., Waldner, P., Stocker, B., Rihm, B., Siegwolf, R., and Buchmann, N.: Effect of nitrogen deposition on centennial forest water-use efficiency, Environ. Res. Lett., 16, 114036, https://doi.org/10.1088/1748-9326/ac30f9, 2021.
Goldberg, S. D. and Gebauer, G.: N2O and NO fluxes between a Norway spruce forest soil and atmosphere as affected by prolonged summer drought, Soil Biol., 41, 1986–1995, https://doi.org/10.1016/j.soilbio.2009.07.001, 2009.
Goldberg, S. D., Borken, W., and Gebauer, G.: N2O emission in a Norway spruce forest due to soil frost: concentration and isotope profiles shed a new light on an old story, Biogeochemistry, 97, 21–30, https://doi.org/10.1007/s10533-009-9294-z, 2010.
Goldman, M. B., Groffman, P. M., Pouyat, R. V., McDonnell, M. J., and Pickett, S. T. A.: CH4 uptake and N availability in forest soils along an urban to rural gradient, Soil Biol. Biochem., 27, 281–286, https://doi.org/10.1016/0038-0717(94)00185-4, 1995.
Goldstein, A., Kapelner, A., Bleich, J., and Pitkin, E.: Peeking inside the black box: Visualizing statistical learning with plots of individual conditional expectation, J. Comput. Graph. Stat., 24, 44–65, https://doi.org/10.1080/10618600.2014.907095, 2015.
Greenwell, B., M.: pdp: An R package for constructing partial dependence plots, R. J., 9, 421–436, https://doi.org/10.32614/RJ-2017-016, 2017.
Groffman, P. M., Hardy, J. P., Driscoll, C. T., and Fahey, T. J.: Snow depth, soil freezing, and fluxes of carbon dioxide, nitrous oxide and methane in a northern hardwood forest, Glob. Change Biol., 12, 1748–1760, https://doi.org/10.1111/j.1365-2486.2006.01194.x, 2006.
Guo, C., Zhang, L., Li, S., Li, Q., and Dai, G.: Comparison of Soil Greenhouse Gas Fluxes during the Spring Freeze–Thaw Period and the Growing Season in a Temperate Broadleaved Korean Pine Forest, Changbai Mountains, China, Forests, 11, 1135, 2020.
Hahn, M., Gartner, K., and Zechmeister-Boltenstern, S.: Greenhouse gas emissions (N2O, CO2 and CH4) from three forest soils near Vienna (Austria) with different water and nitrogen regimes, Bodenkultur, 51, 115–125, 2000.
Hanson, P. J., Edwards, N. T., Garten, C. T., and Andrews, J. A.: Separating root and soil microbial contributions to soil respiration: A review of methods and observations, Biogeochemistry, 48, 115–146, https://doi.org/10.1023/A:1006244819642, 2000.
Heinzle, J., Kitzler, B., Zechmeister-Boltenstern, S., Tian, Y., Kwatcho Kengdo, S., Wanek, W., Borken, W., and Schindlbacher, A.: Soil CH4 and N2O response diminishes during decadal soil warming in a temperate mountain forest, Agr. Forest Meteorol., 329, 109287, https://doi.org/10.1016/j.agrformet.2022.109287, 2023.
Hettelingh, J. P., Posch, M., and Slootweg, J.: European critical loads: database, biodiversity and ecosystems at risk: CCE Final Report 2017, Coordination Centre for Effects, RIVM Report 2017-0155, Bilthoven, the Netherlands, https://doi.org/10.21945/RIVM-2017-0155, 2017.
Högberg, P., Nordgren, A., Buchmann, N., Taylor, A. F. S., Ekblad, A., Högberg, M. N., Nyberg, G., Ottosson-Löfvenius, M., and Read, D. J.: Large-scale forest girdling shows that current photosynthesis drives soil respiration, Nature, 411, 789–792, https://doi.org/10.1038/35081058, 2001.
Hopfensperger, K. N., Gault, C. M., and Groffman, P. M.: Influence of plant communities and soil properties on trace gas fluxes in riparian northern hardwood forests, Forest Ecol. Manag., 258, 2076–2082, https://doi.org/10.1016/j.foreco.2009.08.004, 2009.
Hutchinson, G. L. and Mosier, A. R.: Improved Soil Cover Method for Field Measurement of Nitrous Oxide Fluxes, Soil Sci. Soc. Am. J., 45, 311–316, https://doi.org/10.2136/sssaj1981.03615995004500020017x, 1981.
Ingestad, T.: Studies on the Nutrition of Forest Tree Seedlings, II Mineral Nutrition of Spruce, Physiol. Plant., 12, 568–593, https://doi.org/10.1111/j.1399-3054.1959.tb07979.x, 1959.
IPCC: Climate Change 2021: The Physical Science Basis. Contribution of Working Group I to the Sixth Assessment Report of the Intergovernmental Panel on Climate Change, edited by: Masson-Delmotte, V., Zhai, P., Pirani, A., Connors, S. L., Péan, C., Berger, S., Caud, N., Chen, Y., Goldfarb, L., Gomis, M. I., Huang, M., Leitzell, K., Lonnoy, E., Matthews, J. B. R., Maycock, T. K., Waterfield, T., Yelekçi, O., Yu, R., and Zhou, B., Cambridge University Press, Cambridge, United Kingdom and New York, NY, USA, in press, https://doi.org/10.1017/9781009157896, 2021.
Janssens, I. A., Lankreijer, H., Matteucci, G., Kowalski, A. S., Buchmann, N., Epron, D., Pilegaard, K., Kutsch, W., Longdoz, B., Grünwald, T., Montagnani, L., Dore, S., Rebmann, C., Moors, E. J., Grelle, A., Rannik, Ü., Morgenstern, K., Oltchev, S., Clement, R., Guðmundsson, J., Minerbi, S., Berbigier, P., Ibrom, A., Moncrieff, J., Aubinet, M., Bernhofer, C., Jensen, N. O., Vesala, T., Granier, A., Schulze, E.-D., Lindroth, A., Dolman, A. J., Jarvis, P. G., Ceulemans, R., and Valentini, R.: Productivity overshadows temperature in determining soil and ecosystem respiration across European forests, Glob. Change Biol., 7, 269–278, https://doi.org/10.1046/j.1365-2486.2001.00412.x, 2001.
Jörg, S.: Böden im Seehornwald bei Davos und deren Vorrat an Kohlenstoff und Stickstoff, Diplomarbeit, Zürcher Hochschule für Angewandte Wissenschaften, Zürcher Hochschule für Angewandte Wissenschaften, Zurich, 79 pp., 2008.
Kim, Y., Kodama, Y., and Fochesatto, G. J.: Environmental factors regulating winter CO2 flux in snow-covered black forest soil of Interior Alaska, Geochem. J., 51, 359–371, https://doi.org/10.2343/geochemj.2.0475, 2017.
Klein, G., Vitasse, Y., Rixen, C., Marty, C., and Rebetez, M.: Shorter snow cover duration since 1970 in the Swiss Alps due to earlier snowmelt more than to later snow onset, Climatic Change, 139, 637–649, https://doi.org/10.1007/s10584-016-1806-y, 2016.
Krause, K., Niklaus, P. A., and Schleppi, P.: Soil-atmosphere fluxes of the greenhouse gases CO2, CH4 and N2O in a mountain spruce forest subjected to long-term N addition and to tree girdling, Agr. Forest Meteorol., 181, 61–68, https://doi.org/10.1016/j.agrformet.2013.07.007, 2013.
Kuhn, M.: Building Predictive Models in R Using the caret Package, J. Stat. Softw., 28, 1–26, https://doi.org/10.18637/jss.v028.i05, 2008.
Lembrechts, J. J., van den Hoogen, J., Aalto, J., et al.: Global maps of soil temperature, Glob. Change Biol., 28, 3110–3144, https://doi.org/10.1111/gcb.16060, 2022.
Liu, S., Schloter, M., and Brüggemann, N.: Accumulation of NO during periods of drying stimulates soil N2O emissions during subsequent rewetting: Nitrite stimulates N2O emissions during rewetting, Eur. J. Soil Sci., 69, 936–946, https://doi.org/10.1111/ejss.12683, 2018.
Krebs, L., Burri, S., Feigenwinter, I., Gharun, M., Meier, P., and Buchmann, N.: Forest-floor greenhouse gas fluxes in a subalpine spruce forest. Continuous multi-year measurements of CO2, CH4, N2O, ETHZ [data set], https://doi.org/10.3929/ethz-b-000619728, 2024.
Luedeling, E. and Fernandez, E.: chillR: Statistical methods for phenology analysis in temperate fruit, R packag, CRAN, https://cran.r-project.org/web/packages/chillR/ (last access: 10 April 2024), 2022.
Luo, G. J., Brüggemann, N., Wolf, B., Gasche, R., Grote, R., and Butterbach-Bahl, K.: Decadal variability of soil CO2, NO, N2O, and CH4 fluxes at the Höglwald Forest, Germany, Biogeosciences, 9, 1741–1763, https://doi.org/10.5194/BG-9-1741-2012, 2011.
Luo, G. J., Kiese, R., Wolf, B., and Butterbach-Bahl, K.: Effects of soil temperature and moisture on methane uptake and nitrous oxide emissions across three different ecosystem types, Biogeosciences, 10, 3205–3219, https://doi.org/10.5194/bg-10-3205-2013, 2013.
Martins, C. S. C., Nazaries, L., Delgado-Baquerizo, M., Macdonald, C. A., Anderson, I. C., Hobbie, S. E., Venterea, R. T., Reich, P. B., and Singh, B. K.: Identifying environmental drivers of greenhouse gas emissions under warming and reduced rainfall in boreal–temperate forests, Funct. Ecol., 31, 2356–2368, https://doi.org/10.1111/1365-2435.12928, 2017.
Martinson, G. O., Müller, A. K., Matson, A. L., Corre, M. D., and Veldkamp, E.: Nitrogen and Phosphorus Control Soil Methane Uptake in Tropical Montane Forests, J. Geophys. Res.-Biogeo., 126, e2020JG005970, https://doi.org/10.1029/2020JG005970, 2021.
McManus, J. B., Nelson, D. D., Herndon, S. C., Shorter, J. H., Zahniser, M. S., Blaser, S., Hvozdara, L., Muller, A., Giovannini, M., and Faist, J.: Comparison of cw and pulsed operation with a TE-cooled quantum cascade infrared laser for detection of nitric oxide at 1900 cm−1, Appl. Phys. B, 85, 235–241, https://doi.org/10.1007/s00340-006-2407-7, 2006.
Mitra, B., Miao, G., Minick, K., McNulty, S. G., Sun, G., Gavazzi, M., King, J. S., and Noormets, A.: Disentangling the Effects of Temperature, Moisture, and Substrate Availability on Soil CO 2 Efflux, J. Geophys. Res.-Biogeo., 124, 2060–2075, https://doi.org/10.1029/2019JG005148, 2019.
Ni, X. and Groffman, P. M.: Declines in methane uptake in forest soils, P. Natl. Acad. Sci. USA, 115, 8587–8590, https://doi.org/10.1073/pnas.1807377115, 2018.
Nissan, A., Alcolombri, U., Peleg, N., Galili, N., Jimenez-Martinez, J., Molnar, P., and Holzner, M.: Global warming accelerates soil heterotrophic respiration, Nat. Commun., 14, 3452, https://doi.org/10.1038/s41467-023-38981-w, 2023.
Pang, J., Peng, C., Wang, X., Zhang, H., and Zhang, S.: Soil-atmosphere exchange of carbon dioxide, methane and nitrous oxide in temperate forests along an elevation gradient in the Qinling Mountains, China, Plant Soil, 488, 325–342, https://doi.org/10.1007/s11104-023-05967-y, 2023.
Papen, H. and Butterbach-Bahl, K.: A 3-year continuous record of nitrogen trace gas fluxes from untreated and limed soil of a N-saturated spruce and beech forest ecosystem in Germany: 1. N2O emissions, J. Geophys. Res.-Atmos., 104, 18487–18503, https://doi.org/10.1029/1999JD900293, 1999.
Pavelka, M., Acosta, M., Kiese, R., Altimir, N., Brümmer, C., Crill, P., Darenova, E., Fuß, R., Gielen, B., Graf, A., Klemedtsson, L., Lohila, A., Longdoz, B., Lindroth, A., Nilsson, M., Jiménez, S. M., Merbold, L., Montagnani, L., Peichl, M., Pihlatie, M., Pumpanen, J., Ortiz, P. S., Silvennoinen, H., Skiba, U., Vestin, P., Weslien, P., Janous, D., and Kutsch, W.: Standardisation of chamber technique for CO2, N2O and CH4 fluxes measurements from terrestrial ecosystems, Int. Agrophys., 32, 569–587, https://doi.org/10.1515/intag-2017-0045, 2018.
Pilegaard, K., Mikkelsen, T. N., Beier, C., Jensen, N., Ambus, P., and Ro-Poulsen, H.: Field measurements of atmosphere–biosphere interactions in a Danish beech forest, Boreal Environ. Res., 8, 315–333, 2003.
R Core Team: R: A language and environment for statistical computing, R Foundation for Statistical Computing, Vienna, Austria, https://www.R-project.org/ (last access: 10 April 2024), 2022.
Reichstein, M., Bahn, M., Ciais, P., Frank, D., Mahecha, M. D., Seneviratne, S. I., Zscheischler, J., Beer, C., Buchmann, N., Frank, D. C., Papale, D., Rammig, A., Smith, P., Thonicke, K., van der Velde, M., Vicca, S., Walz, A., and Wattenbach, M.: Climate extremes and the carbon cycle, Nature, 500, 287–295, https://doi.org/10.1038/nature12350, 2013.
Reinmann, A. B. and Templer, P. H.: Increased soil respiration in response to experimentally reduced snow cover and increased soil freezing in a temperate deciduous forest, Biogeochemistry, 140, 359–371, https://doi.org/10.1007/s10533-018-0497-z, 2018.
Richardson, A. D., Hollinger, D. Y., Shoemaker, J. K., Hughes, H., Savage, K., and Davidson, E. A.: Six years of ecosystem-atmosphere greenhouse gas fluxes measured in a sub-boreal forest, Sci. Data, 6, 117, https://doi.org/10.1038/s41597-019-0119-1, 2019.
Robette, N.: moreparty: A toolbox for conditional inference trees and random forests, R package, CRAN, https://cran.r-project.org/web/packages/moreparty/ (last access: 10 April 2024), 2023.
Ruehr, N. K., Knohl, A., and Buchmann, N.: Environmental variables controlling soil respiration on diurnal, seasonal and annual time-scales in a mixed mountain forest in Switzerland, Biogeochemistry, 98, 153–170, https://doi.org/10.1007/s10533-009-9383-z, 2010.
Rütting, T., Björsne, A.-K., Weslien, P., Kasimir, Å., and Klemedtsson, L.: Low Nitrous Oxide Emissions in a Boreal Spruce Forest Soil, Despite Long-Term Fertilization, Front. Forest Glob. Change, 4, 710574, https://doi.org/10.3389/ffgc.2021.710574, 2021.
Saby, N., Loubet, B., Goydarag, M. G., Papale, D., Arrouays, D., and Lafont, S.: Computing C Stock for one ICOS Site, ICOS Ecosystem Thematic Centre, ICOS Ecosystem Thematic Centre, Viterbo, Italy, https://traitementinfosol.pages.mia.inra.fr/icos/CH-DavCarbonReportv2.html (last access: 10 April 2024), 2023.
Saunois, M., Stavert, A. R., Poulter, B., Bousquet, P., Canadell, J. G., Jackson, R. B., Raymond, P. A., Dlugokencky, E. J., Houweling, S., Patra, P. K., Ciais, P., Arora, V. K., Bastviken, D., Bergamaschi, P., Blake, D. R., Brailsford, G., Bruhwiler, L., Carlson, K. M., Carrol, M., Castaldi, S., Chandra, N., Crevoisier, C., Crill, P. M., Covey, K., Curry, C. L., Etiope, G., Frankenberg, C., Gedney, N., Hegglin, M. I., Höglund-Isaksson, L., Hugelius, G., Ishizawa, M., Ito, A., Janssens-Maenhout, G., Jensen, K. M., Joos, F., Kleinen, T., Krummel, P. B., Langenfelds, R. L., Laruelle, G. G., Liu, L., Machida, T., Maksyutov, S., McDonald, K. C., McNorton, J., Miller, P. A., Melton, J. R., Morino, I., Müller, J., Murguia-Flores, F., Naik, V., Niwa, Y., Noce, S., O'Doherty, S., Parker, R. J., Peng, C., Peng, S., Peters, G. P., Prigent, C., Prinn, R., Ramonet, M., Regnier, P., Riley, W. J., Rosentreter, J. A., Segers, A., Simpson, I. J., Shi, H., Smith, S. J., Steele, L. P., Thornton, B. F., Tian, H., Tohjima, Y., Tubiello, F. N., Tsuruta, A., Viovy, N., Voulgarakis, A., Weber, T. S., van Weele, M., van der Werf, G. R., Weiss, R. F., Worthy, D., Wunch, D., Yin, Y., Yoshida, Y., Zhang, W., Zhang, Z., Zhao, Y., Zheng, B., Zhu, Q., Zhu, Q., and Zhuang, Q.: The Global Methane Budget 2000–2017, Earth Syst. Sci. Data, 12, 1561–1623, https://doi.org/10.5194/essd-12-1561-2020, 2020.
Schaufler, G., Kitzler, B., Schindlbacher, A., Skiba, U., Sutton, M., and Zechmeister-Boltenstern, S.: Greenhouse gas emissions from European soils under different land use: effects of soil moisture and temperature, Eur. J. Soil Sci., 61, 683–696, https://doi.org/10.1111/j.1365-2389.2010.01277.x, 2010.
Schindlbacher, A., Zechmeister-Boltenstern, S., Glatzel, G., and Jandl, R.: Winter soil respiration from an Austrian mountain forest, Agr. Forest Meteorol., 146, 205–215, https://doi.org/10.1016/j.agrformet.2007.06.001, 2007.
Schindlbacher, A., Jandl, R., and Schindlbacher, S.: Natural variations in snow cover do not affect the annual soil CO2 from a mid-elevation temperate forest, Glob. Change Biol., 20, 622–632, https://doi.org/10.1111/gcb.12367, 2014.
Schulze, E.-D. (Ed.)Caldwell, M. M., Heldmaier, G., Lange, O. L., Mooney, H. A., Schulze, E.-D., and Sommer, U.: Carbon and Nitrogen Cycling in European Forest Ecosystems, Springer Berlin Heidelberg, Berlin, Heidelberg, https://doi.org/10.1007/978-3-642-57219-7, 2000.
Scott-Denton, L. E., Rosenstiel, T. N., and Monson, R. K.: Differential controls by climate and substrate over the heterotrophic and rhizospheric components of soil respiration: Controls over soil respiration, Glob. Change Biol., 12, 205–216, https://doi.org/10.1111/j.1365-2486.2005.01064.x, 2006.
Sommerfeld, R. A., Mosier, A. R., and Musselman, R. C.: CO2, CH4 and N2O flux through a Wyoming snowpack and implications for global budgets, Nature, 361, 140–142, https://doi.org/10.1038/361140a0, 1993.
Song, Y., Zou, Y., Wang, G., and Yu, X.: Altered soil carbon and nitrogen cycles due to the freeze-thaw effect: A meta-analysis, Soil Biol. Biochem., 109, 35–49, https://doi.org/10.1016/j.soilbio.2017.01.020, 2017.
Strobl, C., Boulesteix, A.-L., Zeileis, A., and Hothorn, T.: Bias in random forest variable importance measures: Illustrations, sources and a solution, BMC Bioinformatics, 8, 25, https://doi.org/10.1186/1471-2105-8-25, 2007.
Strobl, C., Boulesteix, A.-L., Kneib, T., Augustin, T., and Zeileis, A.: Conditional variable importance for random forests, BMC Bioinformatics, 9, 307, https://doi.org/10.1186/1471-2105-9-307, 2008.
Thimonier, A., Graf Pannatier, E., Schmitt, M., Waldner, P., Walthert, L., Schleppi, P., Dobbertin, M., and Kräuchi, N.: Does exceeding the critical loads for nitrogen alter nitrate leaching, the nutrient status of trees and their crown condition at Swiss Long-term Forest Ecosystem Research (LWF) sites?, Eur. J. Forest Res., 129, 443–461, https://doi.org/10.1007/s10342-009-0328-9, 2010.
Thimonier, A., Kosonen, Z., Braun, S., Rihm, B., Schleppi, P., Schmitt, M., Seitler, E., Waldner, P., and Thöni, L.: Total deposition of nitrogen in Swiss forests: comparison of assessment methods and evaluation of changes over two decades, Atmos. Environ., 198, 335–350, https://doi.org/10.1016/j.atmosenv.2018.10.051, 2019.
Tschopp, T.: Zur Geschichte des Seehornwaldes in Davos, Praktikumsarbeit, WSL, Birmensdorf, WSL, Birmensdorf, Switzerland, http://www.natkon.ch/pdf_files/publikationsseite/GeschichteSeehornwald.pdf (last access: 10 April 2024), 2012.
Ueyama, M., Takeuchi, R., Takahashi, Y., Ide, R., Ataka, M., Kosugi, Y., Takahashi, K., and Saigusa, N.: Methane uptake in a temperate forest soil using continuous closed-chamber measurements, Agr. Forest Meteorol., 213, 1–9, https://doi.org/10.1016/j.agrformet.2015.05.004, 2015.
Ullah, S., Frasier, R., Pelletier, L., and Moore, T. R.: Greenhouse gas fluxes from boreal forest soils during the snow-free period in Quebec, Canada, Can. J. Forest Res., 39, 666–680, https://doi.org/10.1139/X08-209, 2009.
Von Arnold, K., Weslien, P., Nilsson, M., Svensson, B. H., and Klemedtsson, L.: Fluxes of CO2, CH4 and N2O from drained coniferous forests on organic soils, Forest Ecol. Manag., 210, 239–254, https://doi.org/10.1016/j.foreco.2005.02.031, 2005.
Wang, C., Han, Y., Chen, J., Wang, X., Zhang, Q., and Bond-Lamberty, B.: Seasonality of soil CO2 efflux in a temperate forest: Biophysical effects of snowpack and spring freeze–thaw cycles, Agr. Forest Meteorol., 177, 83–92, https://doi.org/10.1016/j.agrformet.2013.04.008, 2013.
Wang, Y.-R., Buchmann, N., Hessen, D. O., Stordal, F., Erisman, J. W., Vollsnes, A. V., Andersen, T., and Dolman, H.: Disentangling effects of natural and anthropogenic drivers on forest net ecosystem production, Sci. Total Environ., 839, 156326, https://doi.org/10.1016/j.scitotenv.2022.156326, 2022.
Wen, Y., Corre, M. D., Schrell, W., and Veldkamp, E.: Gross N2O emission and gross N2O uptake in soils under temperate spruce and beech forests, Soil Biol. Biochem., 112, 228–236, https://doi.org/10.1016/j.soilbio.2017.05.011, 2017.
Wu, X., Zang, S., Ma, D., Ren, J., Chen, Q., and Dong, X.: Emissions of CO2, CH4, and N2O Fluxes from Forest Soil in Permafrost Region of Daxing'an Mountains, Northeast China, Int. J. Environ. Res. Public. Health, 16, 2999, https://doi.org/10.3390/ijerph16162999, 2019.
Xie, J., Kneubühler, M., Garonna, I., Notarnicola, C., De Gregorio, L., De Jong, R., Chimani, B., and Schaepman, M. E.: Altitude-dependent influence of snow cover on alpine land surface phenology: Snow cover and Alpine phenology, J. Geophys. Res.-Biogeo., 122, 1107–1122, https://doi.org/10.1002/2016JG003728, 2017.
Xu, Z., Zhou, F., Yin, H., and Liu, Q.: Winter soil CO2 efflux in two contrasting forest ecosystems on the eastern Tibetan Plateau, China, J. Forest Res., 26, 679–686, https://doi.org/10.1007/s11676-015-0120-2, 2015.
Yu, L., Huang, Y., Zhang, W., Li, T., and Sun, W.: Methane uptake in global forest and grassland soils from 1981 to 2010, Sci. Total Environ., 607/608, 1163–1172, https://doi.org/10.1016/j.scitotenv.2017.07.082, 2017.
Yuste, J. C., Nagy, M., Janssens, I. A., Carrara, A., and Ceulemans, R.: Soil respiration in a mixed temperate forest and its contribution to total ecosystem respiration, Tree Physiol., 25, 609–619, https://doi.org/10.1093/treephys/25.5.609, 2005.
Zielis, S., Etzold, S., Zweifel, R., Eugster, W., Haeni, M., and Buchmann, N.: NEP of a Swiss subalpine forest is significantly driven not only by current but also by previous year's weather, Biogeosciences, 11, 1627–1635, https://doi.org/10.5194/bg-11-1627-2014, 2014.