the Creative Commons Attribution 4.0 License.
the Creative Commons Attribution 4.0 License.
 | 12 Jan 2024
Can models adequately reflect how long-term nitrogen enrichment alters the forest soil carbon cycle?
Brooke A. Eastman
William R. Wieder
Melannie D. Hartman
Edward R. Brzostek
William T. Peterjohn
Changes in the nitrogen (N) status of forest ecosystems can directly and indirectly influence their carbon (C) sequestration potential by altering soil organic matter (SOM) decomposition, soil enzyme activity, and plant–soil interactions. However, model representations of linked C–N cycles and SOM decay are not well validated against experimental data. Here, we use extensive data from the Fernow Experimental Forest long-term whole-watershed N fertilization study to compare the response to N perturbations of two soil models that represent decomposition dynamics differently (first-order decay versus microbially explicit reverse Michaelis–Menten kinetics). These two soil models were coupled to a common vegetation model which provided identical input data. Key responses to N additions measured at the study site included a shift in plant allocation to favor woody biomass over belowground carbon inputs, reductions in soil respiration, accumulation of particulate organic matter (POM), and an increase in soil C:N ratios. The vegetation model did not capture the often-observed shift in plant C allocation with N additions, which resulted in poor predictions of the soil responses. We modified the parameterization of the plant C allocation scheme to favor wood production over fine-root production with N additions, which significantly improved the vegetation and soil respiration responses. Additionally, to elicit an increase in the soil C stocks and C:N ratios with N additions, as observed, we modified the decay rates of the POM in the soil models. With these modifications, both models captured negative soil respiration and positive soil C stock responses in line with observations, but only the microbially explicit model captured an increase in soil C:N. Our results highlight the need for further model development to accurately represent plant–soil interactions, such as rhizosphere priming, and their responses to environmental change.
- Article
(1030 KB) - Full-text XML
- BibTeX
- EndNote


Northern temperate forests are a globally important carbon (C) sink (Pan et al., 2011; Friedlingstein et al., 2022) but are experiencing rapid changes to their environment that could impact C sequestration rates. Predicting forest responses to environmental change over decadal timescales (or longer) is a challenge that requires the integration of long-term experimental manipulations and models that can detect and simulate changes in ecosystem patterns and processes. For example, many temperate forests have received decades of N deposition from the combustion of fossil fuels and agricultural sector, which likely released them from N limitation and contributed to significant C sequestration (Vitousek and Howarth, 1991; Litton et al., 2007; Thomas et al., 2010; Vicca et al., 2012; Du and de Vries, 2018). Additionally, many N enrichment studies report reductions in soil respiration rates and an accumulation of soil C, which are likely driven by plant reductions in belowground C allocation and lower soil microbial and enzyme activity (Janssens et al., 2010; Schulte-Uebbing and de Vries, 2018; Du and de Vries, 2018). While most existing models capture the enhancement in plant productivity with N additions, they fail to capture changes in plant C allocation or the reduction in soil respiration fluxes since these fluxes are represented by a positive relationship to plant productivity and litter inputs (Koven et al., 2015; Wieder et al., 2019a; Jian et al., 2021). This shortcoming is especially concerning because, as N deposition declines and forest soils recover, the C that accumulated in these soils may become vulnerable to decomposition and loss. Furthermore, the response of soil heterotrophic respiration to global change will likely determine the overall magnitude of the land C sink (Bond-Lamberty et al., 2018). Thus, to create meaningful emission reduction targets and mitigate climate change, it is of high priority to predict the drivers and fate of the soil C stock under global change scenarios.
Recent theoretical advancements in the understanding of soil organic matter (SOM) formation and destabilization offer a framework for improving the representation of soil C and N cycling in models (Cotrufo et al., 2015; Lehmann and Kleber, 2015; Sokol et al., 2019). These emerging views highlight how plant productivity and belowground C allocation interact with soil microbial community composition and activity to regulate soil C persistence and heterotrophic respiration fluxes. Nonetheless, the Earth system models (ESMs) used to predict future C cycles and inform global change policy do not explicitly represent microbial physiology and are limited in their abilities to predict SOM dynamics under environmental change (Wieder et al., 2015b; Varney et al., 2022). Instead, these models typically represent soil C turnover as a linear process with first-order decay dynamics, and soil C formation is directly related to soil C inputs.
Recently, significant effort has gone towards incorporating explicit microbial communities and microbial physiology into soil models. This incorporation may improve the predictive ability of microbially explicit models – especially under future conditions of environmental change – by incorporating additional mechanisms in the soil C cycle (Sulman et al., 2018; Wieder et al., 2013). Such microbially explicit models represent microbial physiology through parameterized catabolic processes (e.g., Michaelis–Menten kinetics of decomposition: Vmax, Km) and anabolic processes (e.g., C use efficiency, N use efficiency, turnover rates). These models can simulate changes in the temperature sensitivity of decomposition and soil heterotrophic respiration as the microbial community shifts or microbial growth efficiency acclimates to soil warming (Wieder et al., 2013). Additionally, as the N cycle is incorporated into more models, some are being structured to capture the process of priming with N limitation (Sulman et al., 2014; Guenet et al., 2013). Priming can occur when fresh inputs of organic matter to the soil lead to increased microbial demand for nutrients, accelerated microbial growth, and higher rates of SOM decomposition (Bernard et al., 2022). On the other hand, reductions in microbial catabolic activity and shifts in community composition with N additions may contribute to the widely observed reduction in soil respiration with experimental N additions (Ramirez et al., 2012; Moore et al., 2021; Carreiro et al., 2000). Microbially explicit models may have an advantage over first-order decay models at predicting this plant–microbe response and the downstream impacts of N availability on soil C cycling. However, even microbially explicit models often have rather linear pathways of soil organic matter formation and destabilization that are driven by the quantity and quality of litter inputs as opposed to more complex plant–microbial interactions. Furthermore, few studies have compared the responses of first-order versus microbial models to N perturbations. Therefore, there is a need to combine modeling and empirical efforts to assess model performance in response to N additions and to identify any potential benefits of including an explicit representation of microbes and microbial processes (Wieder et al., 2019a).
In this study, we compared how implicit and explicit representations of microbial activity influence ecosystem biogeochemical projections under conditions of elevated N deposition. We evaluated model performance with the results from a 30-year whole-watershed N addition field experiment at the Fernow Experimental Forest (Fernow Forest) in West Virginia, USA. The duration and spatial scale of this field experiment provide a unique opportunity to evaluate model assumptions about soil biogeochemical responses to N enrichment. Long-term experimental manipulations at relatively large scales (e.g., watersheds or large forested plots) are rare but important because significant ecosystem processes can respond slowly to sustained changes in their environment. Observations from this long-term field manipulation found that N additions stimulated aboveground wood production and reduced total belowground C flux (Eastman et al., 2021). Furthermore, this reduced belowground C allocation likely caused a reduction in soil microbial activity as observed through a decrease in soil respiration and leaf litter decomposition, lower rates of ligninolytic enzyme activity and mycorrhizal colonization, and an accumulation of particulate organic matter (POM) in surface mineral soils (Carrara et al., 2018; Eastman et al., 2021, 2022). These soil responses are observed at other N addition studies, as well, and may be difficult to capture with a first-order, linear decay soil model because they are driven by shifts in microbial activity and plant–soil interactions – mechanisms that may not be represented in microbially implicit models.
The main objectives of this study were to compare the default model steady-state C stocks to observations from the Fernow Forest and to compare observations to the results of three 30-year N addition modeling experiments. These three experiments were as follows: (1) default model responses to N additions; (2) modified model parameterizations that shift plant C allocation with N additions, in accordance with field observations; and (3) modified model parameterizations that both shift plant C allocation and slow the decomposition of POM with N additions. We hypothesized that the default models (experiment 1) would be N limited and, thus, respond to N additions with a reduction in N limitation, increase in plant productivity, and subsequent increase in soil respiration and soil C stocks as plant C production and inputs increase. We hypothesized that shifting model parameterization of plant C allocation (experiment 2), and thus reducing plant litter inputs to the soil, will lead to better model–observation agreement by reducing soil respiration rates and shifting the microbial community composition in the MIcrobial-MIneral Carbon Stabilization (MIMICS-CN) model to favor the oligotrophic (K-type) microbes. Finally, we hypothesized that modifying parameters that control POM decomposition rates (slower, experiment 3) will help the models reflect observed increases in POM abundance and soil C:N ratios with N additions.
2.1 Site description
The Fernow Experimental Forest (Fernow Forest) is a broadleaf deciduous forest located in the central Appalachian Mountains near Parsons, West Virginia (39.03∘ N, 79.67∘ W). Elevations at the Fernow Forest range from 530–1115 m with steep slopes between 20 %–50 % grade. The predominant soils at the Fernow Forest are shallow (<1 m) Calvin channery silt loam (Typic Dystrochrept) underlain with fractured sandstone and shale parent material. Mean monthly temperatures range from about −1.8 ∘C in January to about 25 ∘C in July, and annual precipitation is about 146 cm with an even distribution across seasons (Kochenderfer, 2006).
The Fernow Forest is the site of a long-term whole-watershed N addition experiment. N additions to the experimental watershed catchment area (watershed 3; 34 ha) were applied annually by aerial applications of 35.4 as ammonium sulfate from 1989–2019 (30 years). The experimental N addition rate was about double the ambient N deposition measured in throughfall concentrations at the start of the experiment, and about 4 times the rate of N deposition by the end of the experiment (https://nadp.slh.wisc.edu/, last access: November 2022; https://www.epa.gov/CASTNET, last access: November 2022). Aerial application of (NH4)2SO4 was distributed in three applications per year to simulate the seasonal, ambient N deposition rates. An adjacent watershed (watershed 7; 24 ha) of similar topography and forest age is used as a reference, receiving only ambient N deposition.
The vegetation at the Fernow Forest is classified as mixed mesophytic forest. The fertilized watershed was harvested using selection harvesting and patch clear-cutting from 1958–1968 before being clear-cut in 1970 and allowed to regrow naturally for 19 years before fertilization treatment began. The adjacent reference watershed was clear-cut in two sections, the upper half in 1963 and lower half in 1966. Following cutting, both sections of the reference watershed were kept barren with herbicide treatment until 1969 when the vegetation was allowed to regrow. No legacy effects of the herbicide treatment were observed 10 years into regrowth (Kochenderfer and Wendel, 1983). The Fernow Forest has relatively diverse vegetation, and tree species are similar in both watersheds, dominated by Prunus serotina, Acer rubrum, Liriodendron tulipifera, and Betula lenta, although the fertilized watershed has a greater percentage basal area of Prunus serotina and less Liriodendron tulipifera than the reference watershed.
The observational data from the Fernow Forest used in this study were collected over various timescales and locations in the fertilized and reference watersheds, with most of these data described and summarized by Eastman et al. (2021). In brief, tree aboveground net primary productivity (ANPP) measurements were estimated from 25 permanent growth plots per watershed. The aboveground biomass of all trees >2.54 cm diameter at breast height (DBH) was estimated 6 times during the 30-year experiment using measurements of DBH and allometric equations (in the years 1990, 1996, 1999, 2003, 2009, and 2018). Autumnal fine litterfall was also measured at these plots annually from the start of the experiment (1989) through 2015 and in 20 additional plots per watershed from 2015–2017. Fine-root biomass was measured several times throughout the experiment in various sets of plots using soil cores ranging in depth from 0–10 to 0–45 cm (in the years 1991, 2012, 2013, 2015, and 2016). Fine-root production (0–10 cm) was estimated in 2016–2017 using in-growth cores. Soil organic horizon C and N stocks were measured in 2012 and 2013 (which included all organic horizons), and mineral soil C and N stocks were measured from soil pits (0–45 cm depth) in 2016. The top 0–45 cm of soil typically included the A horizon and most of the B horizon. At the study site, the A, B, and C horizons are typically found between depths of 0–12, 12–56, and 56–75 cm (expert opinion, Mary Beth Adams, unpublished data). Soil respiration was measured at 80 locations per watershed approximately weekly during the growing season and monthly during the dormant season for 2 years (2016–2017) using an infrared gas analyzer. Stream inorganic N export has been monitored at the Fernow Forest from continuous streamflow measurements and weekly or biweekly stream water chemistry samples since 1983 by the US Forest Service. Additionally, we used measurements of the partitioning of mineral SOM into different soil density fractions in the fertilized and reference Fernow Forest watersheds to compare observed versus modeled SOM distributions and stoichiometry (Eastman et al., 2022). These mineral soil samples were collected in 2018 at 20 plots per watershed, in 4 subplots per plot, to a depth of 15 cm.
2.2 Soil biogeochemical model test bed description
The soil biogeochemical model test bed, developed by Wieder et al. (2018, 2019a), provides a framework to compare the performance of two structurally different soil C and N biogeochemical models by coupling them to a common vegetation model. The soil model test bed was originally developed to facilitate the comparison among three structurally distinct soil C models in their abilities to predict global soil C stocks and their responses to environmental change. Two of these models in the test bed include the N cycle and its interactions with the C cycle: one first-order soil C and N model, the Carnegie–Ames–Stanford Approach (CASA-CN; Potter et al., 1993; Randerson et al., 1996; Wang et al., 2010), and one microbially explicit soil C and N model, MIcrobial-MIneral Carbon Stabilization (MIMICS-CN) (Wieder et al., 2014, 2015c; Kyker-Snowman et al., 2020). While both models were developed and parameterized to run at the global scale, the test bed allows these models to be run at single-point scale for comparisons against site-level, empirical data.
The soil biogeochemical model test bed provided a computational framework for comparing the response to elevated N inputs of a first-order decay model to a microbially explicit representation of soil biogeochemical cycles. After calibrating these models to our study site (Sect. 2.3), we ran three 30-year N addition experiments that simulated the long-term N addition study at the Fernow Forest. The first experiment was performed using the default models calibrated to the study site. In the second experiment, we addressed the assumptions in the common vegetation model about fixed plant allocation. And in the third experiment, we tested the mechanism that N additions can directly inhibit enzyme activity and the decomposition of chemically recalcitrant POM.
2.2.1 Overview
The soil biogeochemical model test bed was developed to investigate how model structural assumptions and parameterizations influence global-scale soil biogeochemical projections over the historical record and in future climate change scenarios (Wieder et al., 2018, 2019b). The test bed uses common environmental drivers and a shared vegetation model (CASA-CNP) to reduce uncertainties among soil models that are not directly related to their representation nor the parameterization of soil biogeochemical dynamics. The C and N version of the test bed includes the CASA-CN and the MIMICS-CN soil models. Both models have two litter pools (metabolic, structural), a coarse woody debris pool (CWD), and three SOM pools with various turnover times and stoichiometry (Fig. 1). Neither soil model distinguishes between an organic horizon and mineral horizon but rather includes the litter pools and classifies three SOM pools by physicochemical properties and microbial availability. The three SOM pools in CASA-CN and MIMICS-CN, respectively, include (1) a microbial or SOMa (microbially available) pool with fast turnover, (2) a slow or SOMc (chemically protected) pool, and (3) a passive or SOMp (physiochemically protected) pool (Fig. 1). In this study, we equate the relative abundance of the slow and passive pools (for CASA-CN) as well as SOMc and SOMp pools (in MIMICS-CN) to empirical measurements of POM and mineral-associated organic matter (MAOM) from the Fernow Forest.
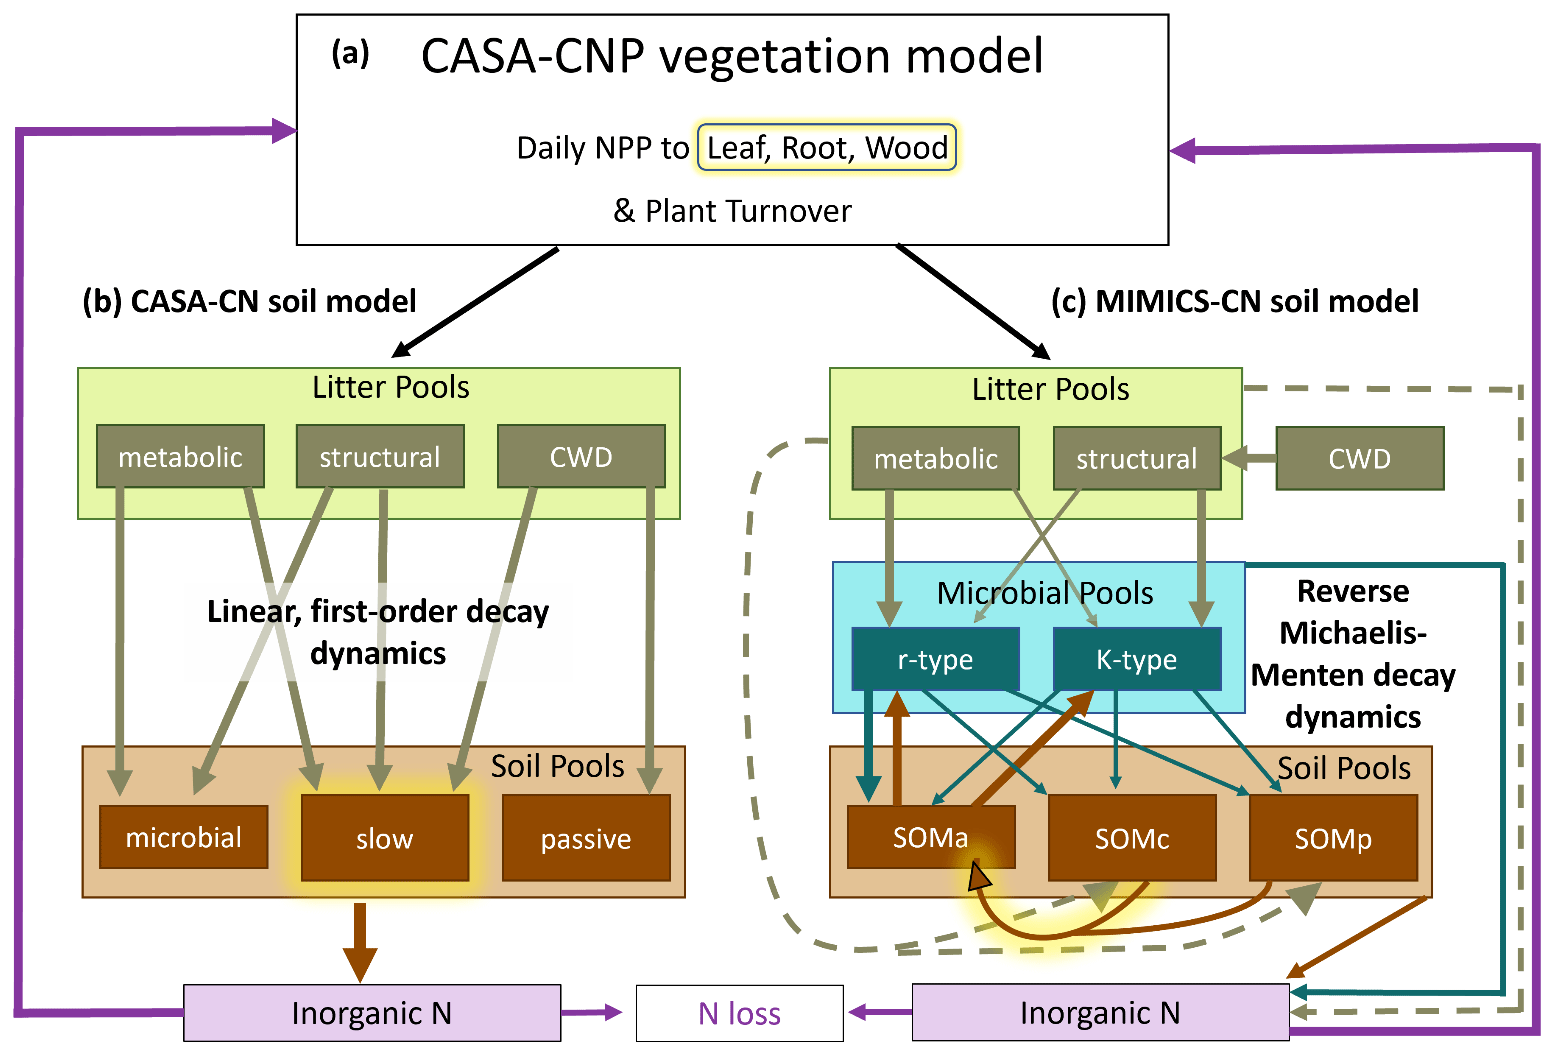
Figure 1Conceptual diagram of the soil biogeochemical model test bed which includes the (a) CASA-CNP vegetation model, (b) CASA-CN soil model, and (c) MIMICS-CN soil model. All pools (boxes) and fluxes (arrows) represent both C and N processes, except for the inorganic N pools and the fluxes into and out of these pools. Highlighted in yellow are processes that were modified to test two key hypotheses: (1) modifying C allocation to plant tissues to increase wood production with N additions and (2) increasing the turnover time (CASA) or increasing the half-saturation constant (MIMICS) of the slow (CASA) or chemically protected (MIMICS) soil pools under conditions of elevated N (see Table 1).
Key differences between the models have been described in previous work (Wieder et al., 2018, 2019b), but here we highlight differences in their representation of soil organic matter turnover and stoichiometry. Litter and SOM turnover in CASA-CN occurs via an implicit representation of microbial activity, with decomposition controlled by linear, first-order dynamics. Soil C turnover times are defined by biome- and pool-specific decay constants that are modified by environmental scalars for soil temperature and soil moisture availability. The stoichiometry for each of the five organic matter pools in CASA-CN is diagnostic (i.e., minimum and maximum values are assigned) and is defined by pool- and biome-specific parameter values (Randerson et al., 1996; Wang et al., 2010; Fig. 1a). Conversely, turnover of litter and SOM in MIMICS-CN is determined via temperature-sensitive reverse Michaelis–Menten kinetics so that organic matter turnover and heterotrophic respiration fluxes are dependent on the size of both the donor (substrate) and the receiver (microbial biomass) pools. MIMICS-CN also represents two functionally distinct microbial communities that correspond to fast (copiotrophic) and slow (oligotrophic) growth strategies (or r- and K-type communities, MICr and MICK; Fig. 1). These microbial communities have different catabolic potential, anabolic traits, C:N ratios, and substrate affinities (Wieder et al., 2015c; Kyker-Snowman et al., 2020). The MICr functional group requires more N and has a greater affinity for organic matter with lower C:N ratios (LITm). In contrast, the MICK functional group is relatively more efficient and has a greater affinity for organic matter with higher C:N ratios (LITS). These functional trait differences lead to varied stoichiometries of the microbial biomass pools, which are parameterized as C:N ratios of 6 and 10 for MICr and MICK, respectively. The stoichiometries of SOM pools, however, are a prognostic feature of the model that reflect litter chemistry, microbial necromass inputs, and the relative abundance of different SOM pools. For this study, the test bed was run at the single point encompassing the study site, Fernow Forest.
2.2.2 Model forcing and initialization
The CASA-CNP model consists of coupled vegetation and soil models (Randerson et al., 1996; Wang et al., 2010). In the test bed used for this study, both the CASA-CN soil component and the MIMICS-CN soil model are coupled to the CASA-CNP vegetation model component (although here we only represent coupled C–N biogeochemistry above- and belowground). The vegetation component of CASA-CNP requires daily meteorological inputs, including air temperature, precipitation, and gross primary productivity (GPP). Both soil models (CASA-CN and MIMICS-CN) also need inputs for depth-weighted means of soil temperature as well as liquid and frozen soil moisture. The CASA-CNP vegetation model calculates net primary productivity; allocation to leaves, wood, and roots; vegetation N demand and uptake; and litterfall fluxes. For this study, input data used to run the model were generated from simulations by the Community Land Model, version 5.0, with satellite phenology (CLM 5.0-SP), forced with Global Soil Wetness Project Phase 3 (GSWP3) climate reanalysis for the 1900–2014 period (Lawrence et al., 2019). In contrast, previous work with the test bed has used input data from an older version of CLM (CLM 4.5-SP) forced with Climatic Research Unit and National Centers for Environmental Prediction (Cru-NCEP) climate reanalysis data (Wieder et al., 2018, 2019b). In the present study, input data beyond 2014 were generated by extending the CLM 5.0-SP simulation with an anomaly forcing (2015–2019) of atmospheric fields from projections made with the Community Earth System Model version 2 (CESM2; see Danabasoglu et al., 2020, for methods; see also Wieder et al., 2015a, 2019a, who used a similar approach with previous versions of CLM and CESM). Briefly, this anomaly forcing cycles over the last decade of the GSWP3 input and applies an anomaly based on a three-member ensemble mean from CESM2 simulations that have been archived for the Coupled Model Intercomparison Project Phase 6 (CMIP6) experiment. This experiment was run under the “high” emissions Shared Socio-Economic Pathway, SPP3-70, climate change scenario to generate data from 2015–2100 (http://www.earthsystemgrid.org, last access: January 2022). For this study we only present results through 2019.
From these global simulations we extracted data for the grid cell capturing the Fernow Forest, and the daily CLM 5.0-SP outputs were then used as input boundary conditions for all simulations presented here. Because we ran the test bed in single-point mode, the CASA-CNP vegetation model was assigned one plant functional type (PFT) for our experiment: temperate deciduous forest. Some of the CASA-CNP vegetation parameters were modified to better represent observations at the Fernow Forest when appropriate empirical observations were available (Table A1). The CASA-CNP vegetation model simulated NPP and plant litterfall inputs that become inputs to both soil biogeochemical models (CASA-CN and MIMICS-CN). In the carbon-only version of the test bed, litterfall fluxes seen by CASA-CN and MIMICS-CN biogeochemical models are identical, but nitrogen limitation reduces NPP in the CASA-CNP vegetation model (Wang et al., 2010), thus providing a feedback between soil biogeochemical representations and simulated vegetation pools. In all simulations, soil depth was set to 45 cm to allow for comparison with observations of total soil C and N stocks.
Models were spun-up by cycling over meteorological input data (1900–1919) until C and N pools equilibrated. This took a spin-up period of 6000 years for MIMICS-CN and 8000 years for CASA-CN to ensure that soil stocks reached steady state. We also ran all simulations through a historic period (1900–1988) using transient GSWP3 climate, N deposition taken from the CLM5 simulation (Lawrence et al., 2019), and atmospheric CO2 data from the same period. Results from historic simulations were compared with observational data from the Fernow Forest and used to complete the site-specific configuration of the test bed models.
2.3 Site-specific configuration of historic simulations
Based on preliminary results, we modified several parameters in the vegetation and soil model components so that historic simulations (through 1988) better matched observed ecosystem C and N stocks and fluxes at the Fernow Forest (Sect. 2.1; based on Eastman et al., 2021). All vegetation and soil parameter modifications for site-specific configuration are detailed in Tables A1–A3, and these modifications are supported by observational data from the long-term experimental data (Eastman et al., 2021). Briefly, changes in the CASA-CNP vegetation parameters were made to decrease vegetation C stocks and increase the baseline N limitation in the model, which was defined by a positive NPP response to N additions (Table A1).
Modifications to CASA soil component parameters reduced the total litter plus soil C:N ratio and total litter plus soil C stocks, again better capturing observed values (Table A2; Eastman et al., 2021, 2022). In contrast, modifications to the MIMICS-CN soil parameters were needed to increase total litter plus soil C:N ratios and total litter plus soil C stocks to better reflect observed values and reduce model-to-model differences (Table A3; Eastman et al., 2021, 2022). After both CASA-CN and MIMICS-CN soil model parameters were calibrated to the Fernow Forest site for the end of the historic period, the models with these calibrated parameters became the “default” models that were used in experimental simulations (1989–2019) that are the focus of this study.
2.4 Experimental design: N enrichment experimental simulations
We performed three soil model test bed experiments that simulated the experimental N additions at the Fernow Forest (1989–2019). Similar to historic simulations, experimental simulations used GSWP3 climate and atmospheric CO2 data that were extended with an anomaly forcing for the years 2015–2019. Each experiment consisted of a control simulation with ambient N deposition rates used in CLM 5.0 and a “+N” simulation that received an additional 3.5 distributed evenly across every day of the year (Table 1). This annual rate of additional N deposition matched the annual rate of experimental N additions at the Fernow Forest whole-watershed fertilization experiment (Adams et al., 2006). In the first experiment, “default +N”, the N perturbations were the only modifications made to the site-calibrated models (Table 1).
Table 1Description of the model experiments, including the model parameter modifications made to test the plant C allocation shift and enzyme inhibition hypotheses. The bold text indicates parameter modification.
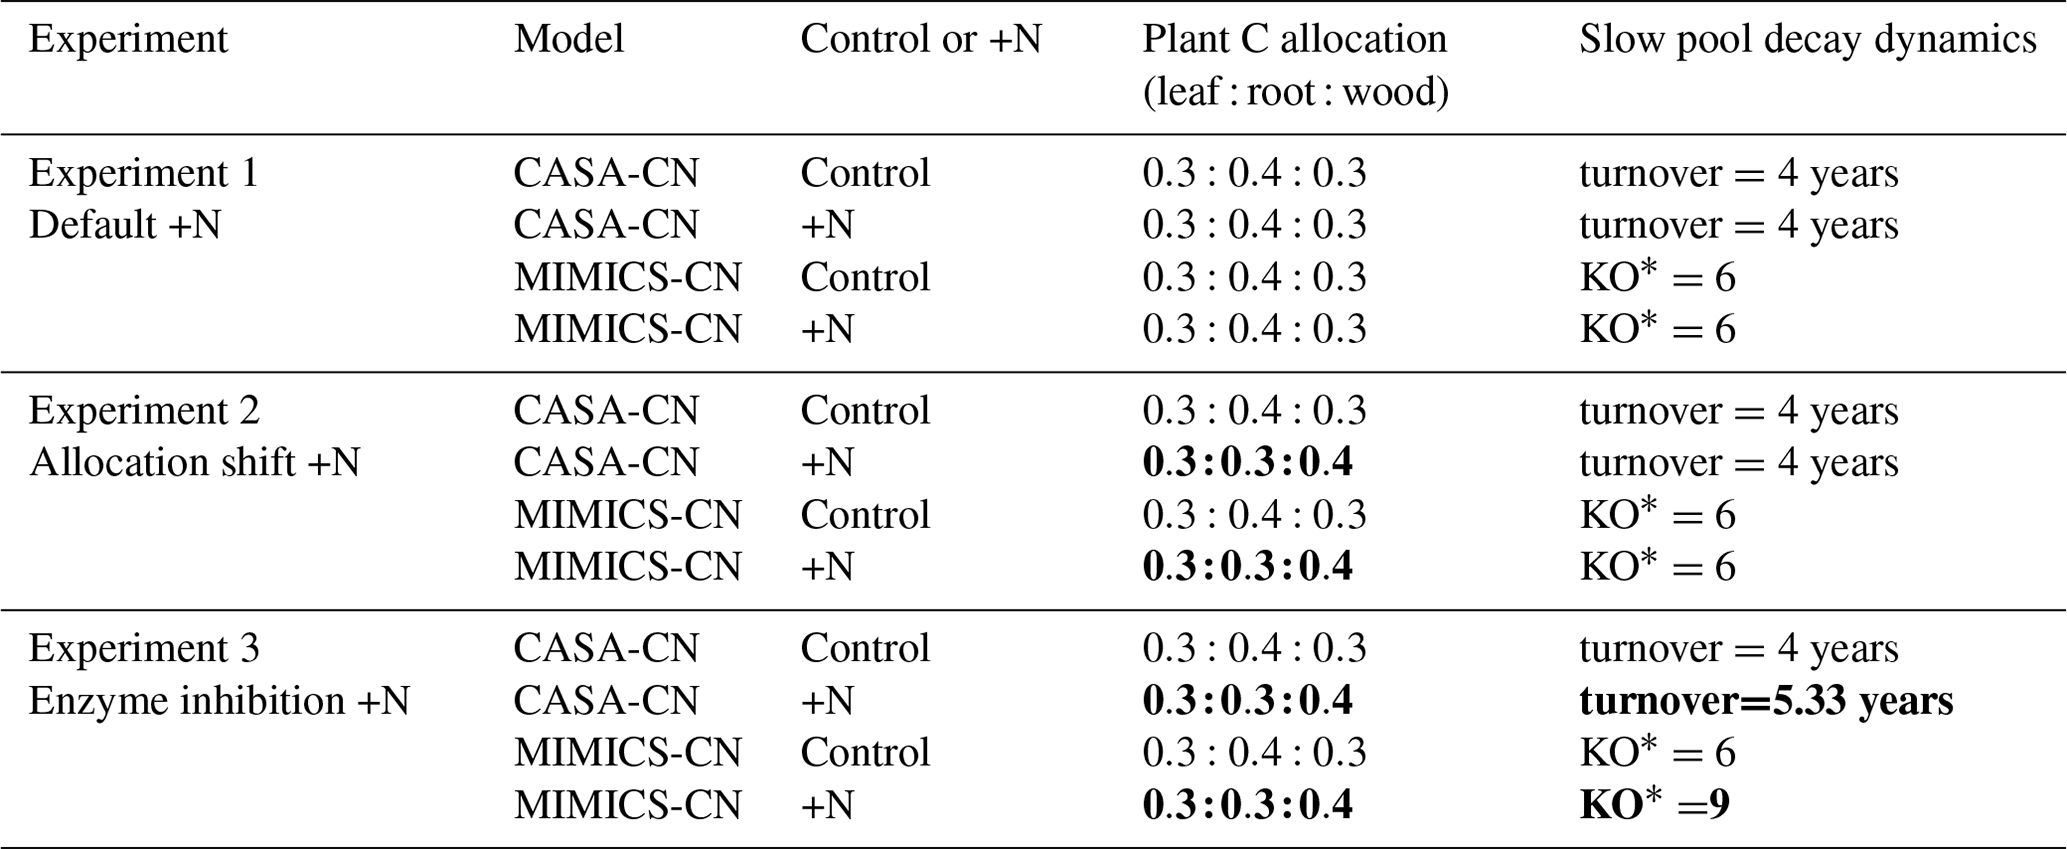
∗ KO is a scalar to modify Km in the Michaelis–Menten equation for the oxidation of SOMc to SOMa, where MIC is the microbial biomass C, Vmax is the maximum velocity, SOMc is the SOMc C pool, and Km is the half-saturation constant.
The default +N simulation did not capture observed responses to N fertilization that included increases in wood biomass, increases in the total litter plus soil C:N ratio, and a reduction in soil heterotrophic respiration (Fig. 2). In the second experiment, “allocation shift +N”, we modified the CASA-CNP vegetation model to address assumptions about plant C allocation. It is well established that more nutrient availability leads to less belowground C flux and thus increases in aboveground NPP (Vicca et al., 2012; Litton et al., 2007; Fernández-Martínez et al., 2017), but this dynamic allocation pattern in response to nutrient enrichment is one that many models do not capture, including CASA-CNP (Wieder et al., 2019a; Thomas et al., 2015). To improve model representation of observed ecosystem responses at the Fernow Forest and to test our second hypothesis that reduced soil heterotrophic respiration resulted from shifts in plant allocation away from belowground C inputs, we adjusted carbon allocation of vegetation in CASA-CNP (Table 1). We adjusted the parameters of the fixed allocation scheme in the CASA-CNP vegetation model to shift 10 % of GPP C away from roots and towards wood production under conditions of +N. This 10 % shift is a conservative estimate of the observed response, where total belowground carbon flux (estimated using a mass balance approach) was ∼13 % lower in the fertilized watershed (Eastman et al., 2021). Results from the adjusted allocation scheme experiment are presented here and referred to as “allocation shift +N” models and simulations hereafter.
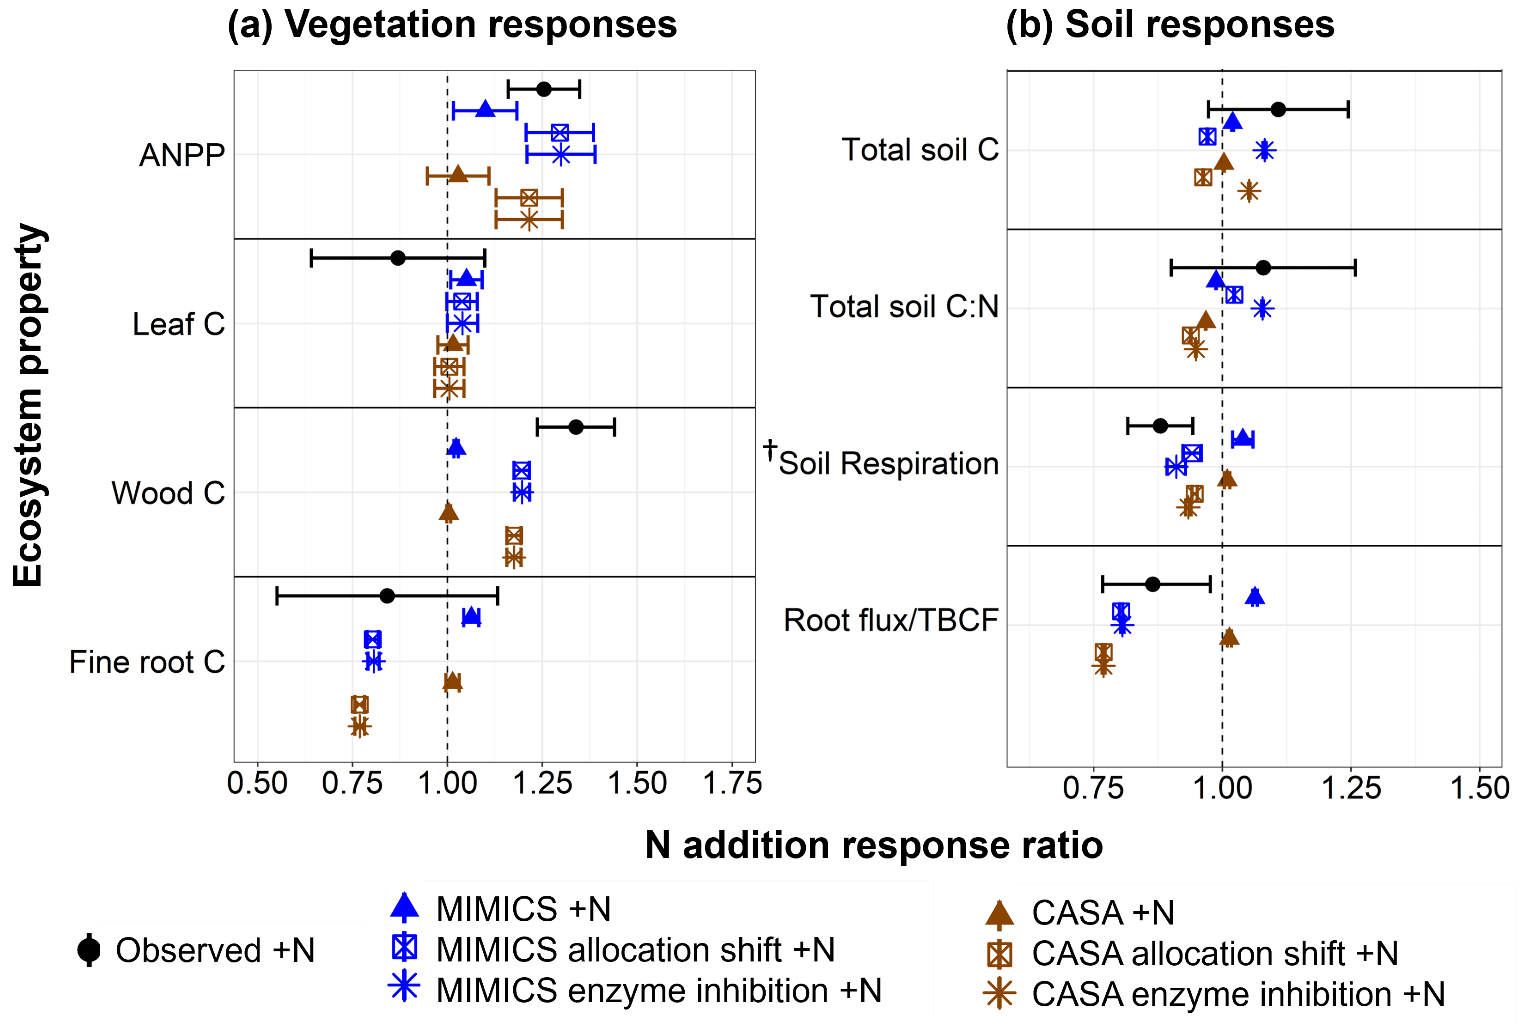
Figure 2 Observed and modeled response ratios of select vegetation (a) and soil (b) pools and fluxes to the three nitrogen addition experiments. Observations (black circles) show the mean (± SE) values across 10 plots per watershed from the watershed fertilization study at the Fernow Forest (Eastman et al., 2021). Modeled responses include the annual mean (± SE) from the last 10 years of experimental N addition simulations for the CASA-CN (brown) and MIMICS-CN (blue) default models (triangles), modified vegetation allocation models (allocation shift; square), and modified vegetation allocation and soil decay models (enzyme inhibition; asterisk). The vertical dashed line represents no effect of N additions. Vegetation fluxes include aboveground net primary productivity (ANPP) as the sum of the leaf C flux to soil and the annual wood C increment (modeled estimates only, including coarse roots). Vegetation pools include the leaf, wood, and fine-root C pools. Total soil pools include organic and mineral horizons, to a depth of 45 cm for both modeled and observed values. Soil fluxes include soil respiration and root C inputs to soil (modeled) and total belowground carbon flux (observation estimated with mass balance approach). The total soil C pool is the sum of C in the litter layer, organic horizon, mineral horizon, and (for MIMICS-CN only) microbial biomass. † Observed soil respiration includes autotrophic and heterotrophic, whereas modeled soil respiration includes only heterotrophic.
In the third experiment, “enzyme inhibition +N”, we built on the allocation shift +N parameterization to test the additional effect of direct enzyme inhibition: the hypothesis that reduced microbial enzyme activity from elevated soil N led to an accumulation of POM and a subsequent increase in the mineral soil C:N ratio. In the MIMICS-CN model, this could be approached in multiple ways (see Wieder et al., 2015a), but here we focus on the direct effects that N additions may have by suppressing ligninolytic enzyme activity, which is supported by observations at the Fernow Forest and other sites (Carreiro et al., 2000; Xia et al., 2017; Carrara et al., 2018; Tan et al., 2020). MIMICS-CN includes a transition of chemically protected SOM (SOMc, which we equate with POM) to microbially available SOM (SOMa). This transition from SOMc to SOMa in MIMICS-CN follows reverse Michaelis–Menten kinetics but is not parameterized as a function of soil N availability. Therefore, to represent potential nitrogen inhibition on POM decomposition, we increased the half-saturation constant for the oxidation of the chemically protected SOM pool during experimental N additions, essentially reducing the rates of decomposition of this pool (Table 1). In CASA-CN, we adjusted the turnover time of the slow pool, increasing it by 30 %. These increases in the turnover time of the SOMc (slow pool) were intended to reflect observed declines in decomposition and increases in POM (Eastman et al., 2022). These declines in decomposition were, in part, a result of a 25 %–57 % reduction in ligninolytic enzyme activity in the fertilized watershed, the primary agent of decomposition of POM (Table 1; Carrara et al., 2018). Results from this experiment are presented here and referred to as enzyme inhibition +N models and simulations hereafter.
2.5 Model–data comparisons
To compare the sensitivity of observed and modeled responses to N enrichment, we calculated response ratios for different C and N pools and fluxes following 30 years of N additions. Response ratios were calculated for key observations and model outputs, using the most recently observed values and the annual mean value from the last 10 years of the experimental simulations. Response ratios were estimated by dividing the +N watershed observed or modeled value by the ambient (control) observed or modeled value. Thus, a response ratio of 1 indicated that there was no effect of N additions on the pool/flux, whereas a response ratio greater than or less than 1 indicated an increase or a decrease in that flux/pool with N additions.
Modeled total soil C and N stocks were estimated as the sum of C in both litter pools, the three SOM pools, and the microbial biomass pools (in MIMICS-CN only), unless otherwise noted. Observed total litter plus soil C and N stocks included the litter layer, organic horizon, and 0–45 cm of the mineral soil horizon, unless otherwise noted. Because of limitations in measuring total NPP, we compare ANPP between models and observations. ANPP is calculated as the sum of wood C production and leaf C production (measured as litter C flux in observational data).
3.1 Comparison of baseline-calibrated models to observations
Baseline models calibrated to the Fernow Forest had overall good agreement of key carbon and nitrogen pools and fluxes in comparison to observations. Table 2 summarizes baseline-calibrated model output from the last 10 years of the historic transient simulations (1979–1988) with comparisons to observations. We compare baseline models to the recent measurements from reference watershed 7 because this was the watershed and time period with the most complete observational data at the site (see Eastman et al., 2021). Because of higher than observed vegetation nitrogen concentrations (especially in wood) represented in the CASA-CNP vegetation model, models had greater aboveground NPP (ANPP) and plant N uptake fluxes than observations but slightly lower wood C pools. The CASA-CNP vegetation model also simulates much larger fine-root C pools than observed (Table 2). The discrepancy in fine-root C pools is in part due to the depth difference in modeled (45 cm) versus observed (15 cm) values, but CASA-CNP still likely overestimates this total pool (over 3 times observed; Table 2) that is typically concentrated in the first 20 cm of soil (Jobbágy and Jackson, 2000). As intended, calibrated soil pools, mineral soil C:N ratios, and simulated soil respiration by baseline models were very similar to observations (Table 2). The CASA-CN soil model attributes more of the total soil C to the litter layers than MIMICS-CN and observations, and MIMICS-CN predicts slightly lower soil respiration fluxes (Table 2).
Table 2Baseline model simulations and observations of the ecosystem pools and fluxes. Model mean (SE) values are from the last 10 years of the historic transient simulations (1979–1988). Observed mean (SE) values are recent measurements (2009–2018) from reference watershed 7, for which the most complete data were available.
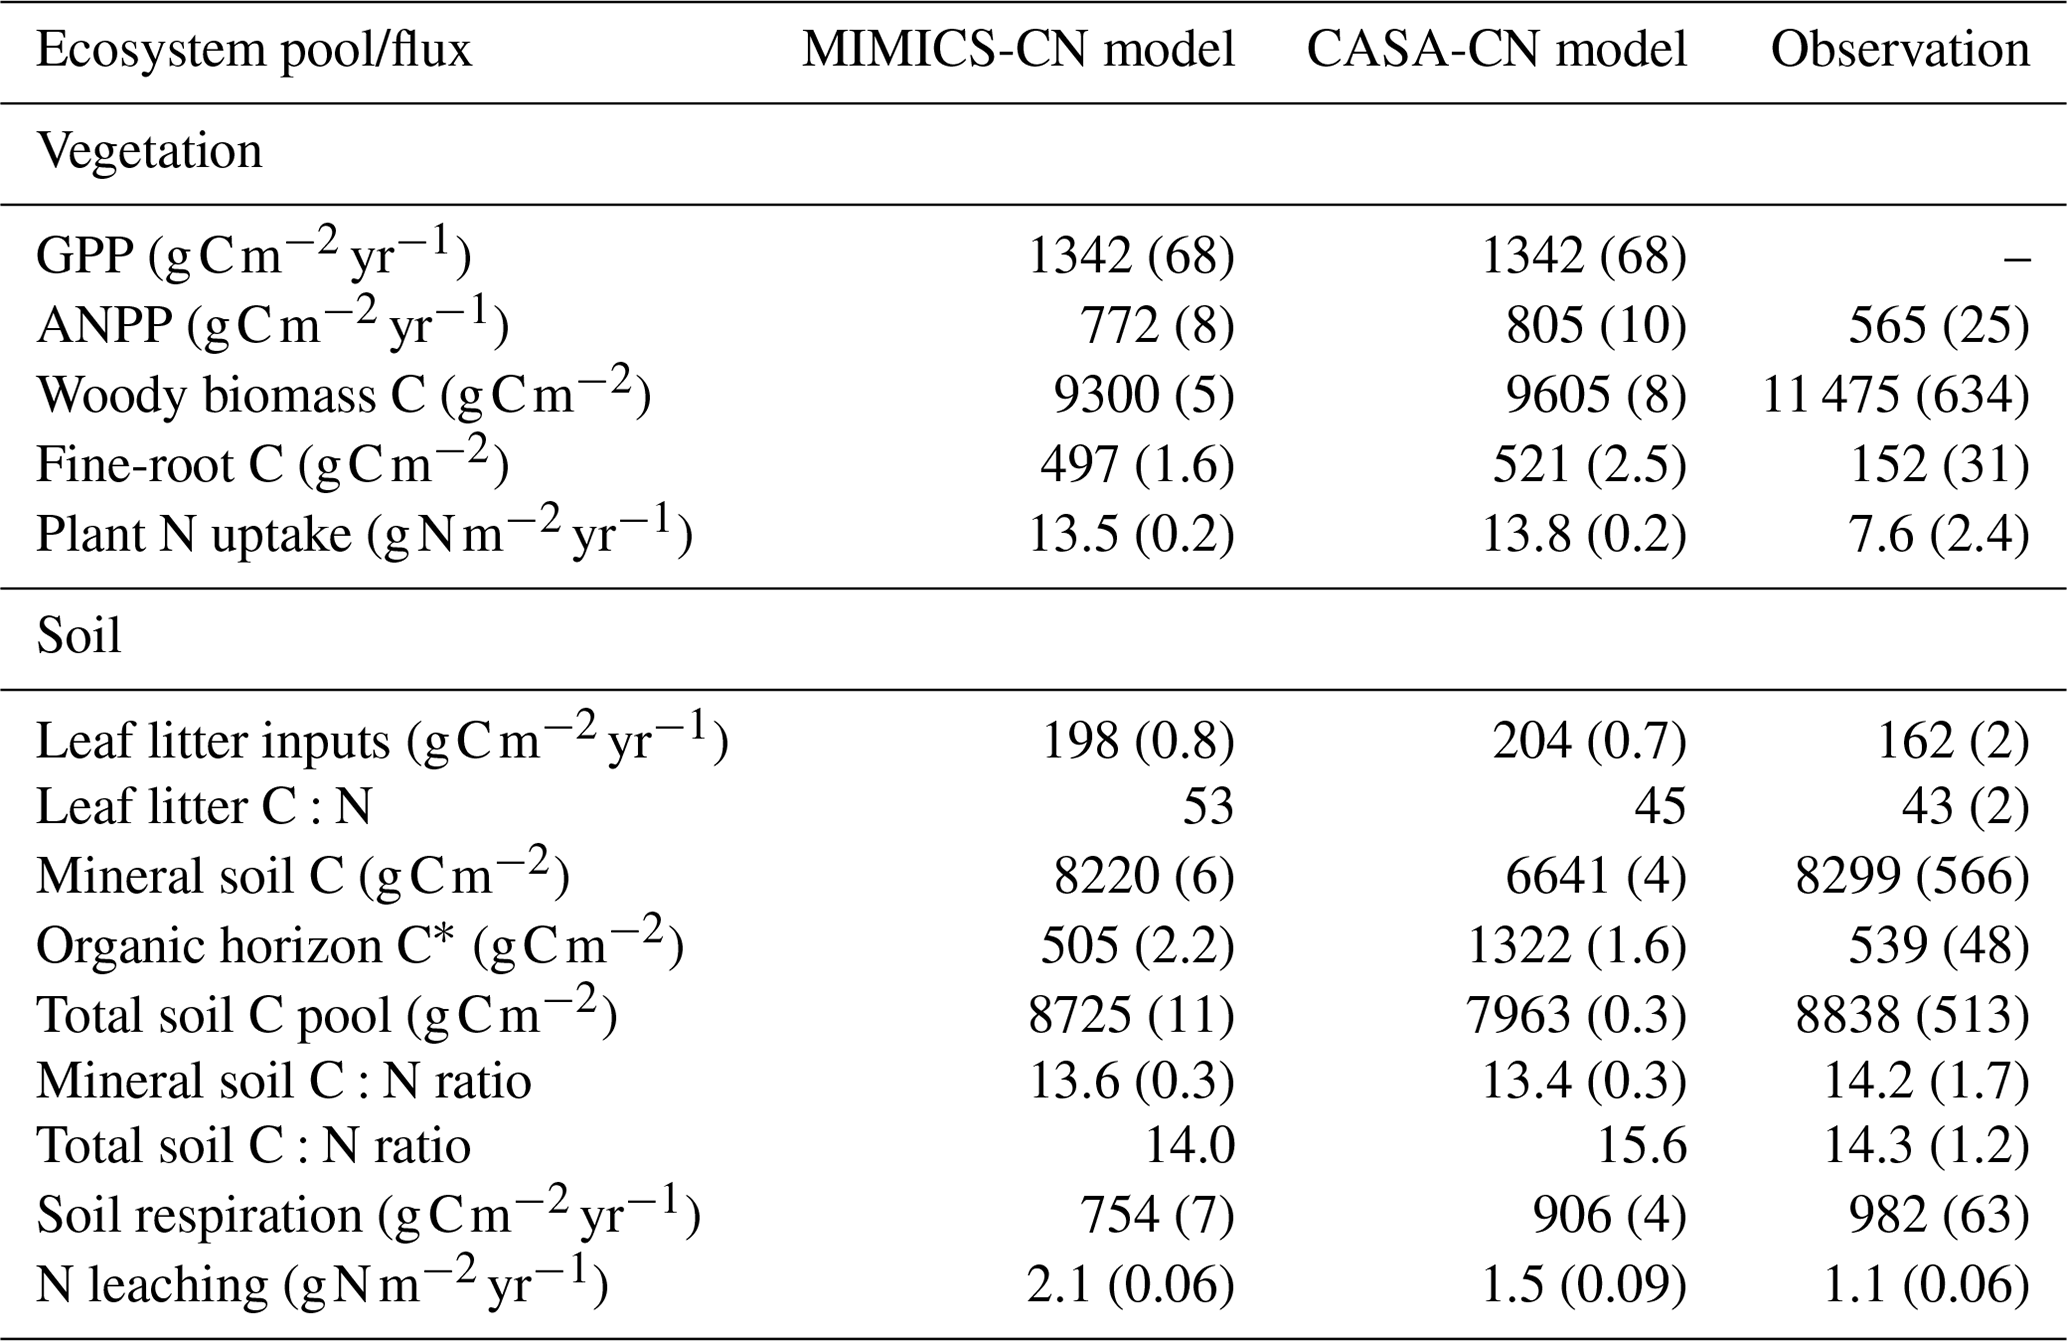
∗ Includes the litter layer and soil organic horizon for observed values and structural and metabolic litter for modeled values.
3.2 Experiment 1: default model responses to N additions
Both default versions of the models exhibited a positive response in aboveground plant productivity but were not as sensitive to nitrogen additions as observations, as shown by relatively small increases in ANPP (Fig. 2a and Table A4). Because the default version of CASA-CNP uses fixed plant allocation, changes in leaf, wood, and root C pools were all positive, reflecting increases in NPP that were associated with N fertilization. Overall, the vegetation response to N addition was stronger with the MIMICS-CN soil model than with the CASA-CN soil model. Belowground, both soil models predicted little to no change in soil C stocks, a slight increase in heterotrophic soil respiration, and very slight decreases in soil C:N ratios (Fig. 2b). These modeled, positive soil responses were the opposite of mean negative observed responses (Fig. 2b). The modeled responses were due to the overall positive response of root and leaf production and, thus, plant matter inputs to the soil without a reduction in decomposition. However, even with no change in the total soil C stock, this response fell within the wide range variability of the observed response. Observed increases in soil C stocks were found in the surface mineral soil (0–10 cm) but not at greater depths (Eastman et al., 2021).
3.3 Experiment 2: plant allocation shifts with N additions
To elicit a vegetation response in CASA-CNP that reflected the observed shift in plant C allocation, we modified allocation parameters for fertilized experiments in the CASA-CNP vegetation model. As intended, this “plant allocation shift” modification to the CASA-CNP vegetation model parameterization improved model–observation agreement through a more positive ANPP response, enhanced woody biomass C stocks, and reduced fine-root production with N additions in both coupled vegetation–soil models (Fig. 2a and Table A4). This change in the vegetation response influenced soil biogeochemical responses by both models as well.
Notably, the significant (∼20 %) reduction in root C inputs to the soil with N additions leads to a small reduction in soil respiration (∼6 %) in both soil models (Fig. 2b). However, the combination of large reductions in soil C inputs and small reductions in soil C outputs (respiration) resulted in an overall 3 %–4 % reduction – rather than the observed stimulation – in the total soil C pool with both models (Fig. 2b). Soil models diverged in their soil stoichiometric response to N additions, with a slight decrease in total soil C:N simulated in the CASA-CN plant allocation shift experiment – similar to the default experiment – but a very slight increase in total soil C:N resulting from the MIMICS-CN plant allocation shift +N experiment, which was more similar to the mean observed response (Fig. 2b). These increases in the soil C:N ratio resulting from the plant allocation shift and N additions in MIMICS-CN coincided with a subtle accumulation of POM (SOMc; Fig. 3).
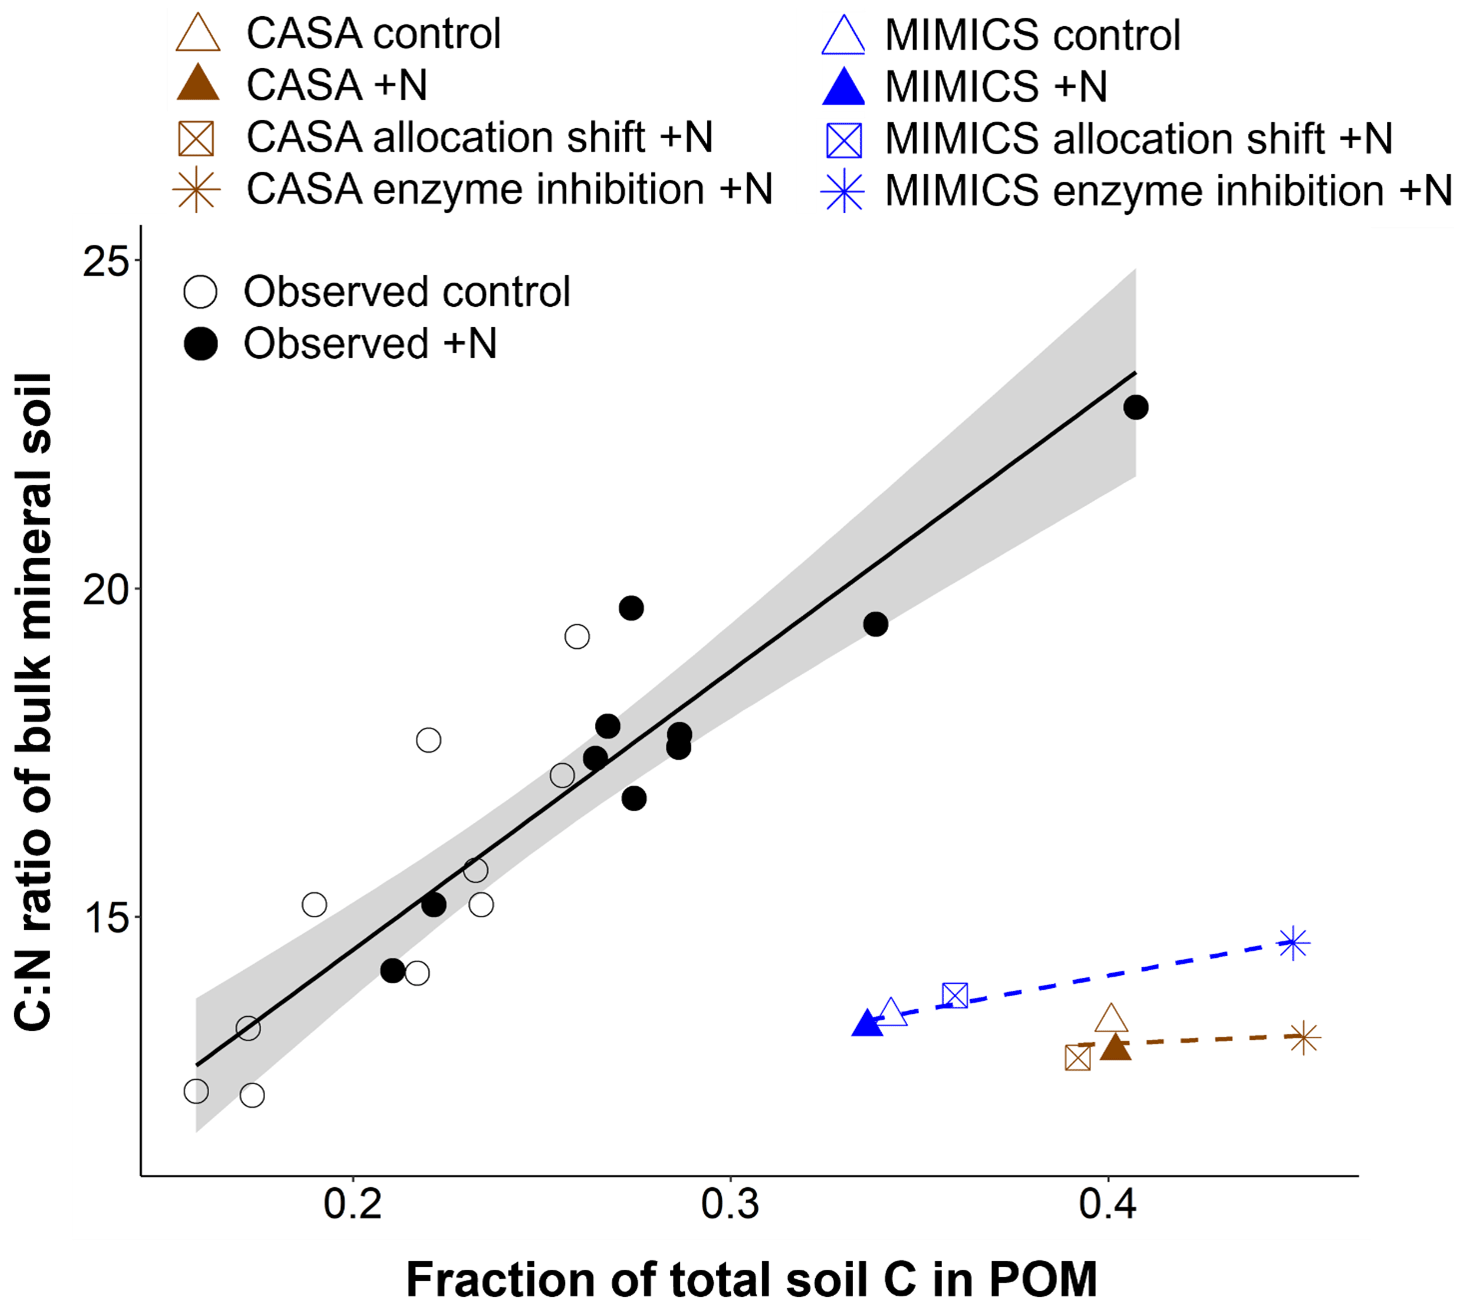
Figure 3Relationship between the relative proportion of light particulate organic matter (POM; named slow and SOMc pools in CASA and MIMICS, respectively) and the C:N ratio of bulk mineral soil in observed (black circles) and modeled (brown = CASA, blue = MIMICS) ambient and +N conditions. The figure is adapted from Eastman et al. (2022). The observed points represent the mean of four soil samples from the top 10 cm of mineral soil per plot (from 10 plots per watershed). The modeled estimates are from the entire mineral soil profile (0–45 cm). Linear regression (standard error in gray shading) for observed (solid black) and modeled (dashed) values.
3.4 Experiment 3: enzyme inhibition of decomposition with N additions
Based on observed increases in light particulate organic matter (POM) and soil C:N ratios with N additions in the surface soil at the Fernow Forest (Eastman et al., 2022), we examined whether the distinct soil models could capture this pattern with an additional parameter modification that reflected a reduction in soil enzyme activity with the elevated N perturbation (Fig. 1 and Table 1). These enzyme inhibition +N experiments generated similar plant productivity responses as in the plant allocation shift +N simulations (Fig. 2a). By increasing the turnover time of the CASA-CN slow pools and reducing the oxidation rate of SOMc in MIMICS-CN, both models simulated increases in the total soil C stocks, consistent with observations (5 % and 8 %, respectively) and, particularly, in the POM pools (slow and SOMc; Figs. 2b and 3). While both models captured total soil C:N responses within the range of observations, only MIMICS-CN captured an increase in the total soil C:N ratio that closely approximated the observed mean value (Fig. 2b and Table A4). Similar to observations, the positive response of the bulk soil C:N ratio (not including litter pools) that occurred with N additions was concurrent with an increase in the relative abundance of the POM pools in enzyme inhibition +N simulations (Fig. 3). However, the relationship between the fraction of soil C in POM and bulk soil C:N ratios captured by the models was weak compared to the actual relationship found in surface mineral soil (0–15 cm) samples collected from both watersheds at the Fernow Forest (Fig. 3). The weak relationship between POM abundance and bulk soil C:N ratios was due to the low C:N ratios of the POM pools in the CASA-CN and MIMICS-CN models.
Using a soil model test bed to evaluate model responses to N additions, we found that modifying plant C allocation and soil POM decomposition parameterizations under conditions of elevated N deposition improved model–observation agreement the most (Fig. 2). Coupled to a vegetation model with a static allocation scheme, both CASA-CN and MIMICS-CN models captured general observations of key ecosystem pools and fluxes in the reference watershed (Table 1). However, without modification to some key model parameters, they failed to capture some key observed responses to N additions: increased woody biomass production, reduced belowground C allocation, reduced soil respiration, and POM accumulation in surface mineral soil (Fig. 2, default models; Fig. 3). With our model experiments, we show that modifications to plant C allocation parameters that increased the overall turnover time of vegetation C created the greatest improvement of model–observation agreement to N additions (Fig. 2). However, this modification still failed to adequately capture two important observed responses: an increase in the total litter plus soil C:N ratio and an increase in the pool of total litter plus soil C.
Further refinement of the model parameterizations to simulate a direct inhibition of microbial activity moved the soil model predictions closer to the mean observed increases in soil C stocks and improved the predicted decreases in soil respiration with N additions (Eastman et al., 2021; Fig. 2b). Furthermore, this modification to one of the models (MIMICS-CN) resulted in elevated soil C:N ratios (not including litter layers) that matched observed surface mineral soil values. Given the widespread occurrence of reduced soil respiration and microbial activity with N additions (Janssens et al., 2010), as well as the importance of this C flux for the future of the land C sink (Bond-Lamberty et al., 2018), validating model assumptions against long-term experimental data is a necessary step to improve our predictions of the land C sink to global change. We recognize that the same parameter modifications may not lead to the same model–observation improvements at other sites with different ecosystem properties or climate. Nonetheless, this exercise allowed us to identify the potential mechanisms and processes that could be better developed in models to more broadly apply across ecosystems and climates under conditions of elevated N deposition.
4.1 Implications of a fixed allocation vegetation model
Our model efforts suggest that capturing the shifts in plant C allocation in response to N additions is the most impactful way to improve the modeled N fertilization response. The default parameterizations with static plant C allocation were not sensitive to N additions, suggesting that the models underestimate N limitation by plants (Fig. 2). We modified the fixed allocation parameterization in the CASA-CNP vegetation model under elevated N inputs so that both models captured the often-observed increase in wood production and reduction in belowground carbon flux (root inputs) with N additions (de Vries et al., 2014; Fernández-Martínez et al., 2014; Frey et al., 2014; Zak et al., 2008). We note this model experiment was a post hoc modification to the CASA-CNP allocation parameters for fertilized simulations, but it allowed us to test the soil model responses to shifts in plant C allocation and underscores the importance of future work to develop more robust model processes that moderate plant C allocation as a function of ecosystem fertility status (e.g., Parton et al., 2010; Shi et al., 2016). Such developments in models that do not already account for dynamic allocation shifts are critical for making more accurate projections of plant NPP responses to global change drivers and the role of terrestrial ecosystems in sequestering atmospheric CO2 (Shi et al., 2019). Notably, with improved vegetation responses to fertilization in our plant allocation shift +N simulations, reduced soil heterotrophic respiration rates followed from reductions to belowground C inputs in both the model and the experimental results (Fig. 2b). The ability of the plant allocation shift +N model experiment to capture the observed responses at the Fernow Forest mirrors other recent model–experiment integration efforts. For example, a recent model–data synthesis of forest responses to elevated CO2 showed that the models that performed the best had dynamic representations of C allocation that were responsive to water and nutrient availability (De Kauwe et al., 2014). As such, there remains a clear need to prioritize models that employ dynamic allocation approaches based on data syntheses.
High soil N availability encourages shifts in plant nutrient acquisition strategies by reducing belowground C flux to mycorrhizae that is typically required for nutrient acquisition (Gill and Finzi, 2016; Eastman et al., 2021). At our study site, shifts in nutrient acquisition strategy and C allocation led to reduced mycorrhizal colonization, reduced rates of SOM decomposition, and an accumulation of POM. When we shifted the overall C allocation of plants (through a parameter change in the second allocation shift +N experiment) to increase wood production and reduce root production, this parameter change did reduce soil respiration relative to the control run but does not account for all mechanisms that reduce soil respiration. Rather than an overall reduction in decomposition and accumulation of POM (as observed), this allocation shift reduced litter inputs from the roots to the soil and thus caused a relative decrease in total soil C (Fig. 2). One shortcoming of our model efforts was the inability to represent a meaningful rhizosphere priming response in the control simulation that would lead to reduced priming in the elevated N simulations. Neither the CASA-CN nor the MIMICS-CN represents mycorrhizae and the plant–soil interactions that occur in the rhizosphere and with priming of soil microbes. Although MIMICS-CN does represent a K-type microbial pool, it does not distinguish between mycorrhizae that closely interact with plants versus free-living saprotrophs.
Future modeling attempts could implement a root exudate flux in a way that reflects C allocated to a microbial community that targets POM and may mobilize plant-available N (e.g., K-type microbes or a new pool of microbes that more closely resemble mycorrhizae). Incorporating a N component of the exudate flux that stimulates microbial growth and activity may also be necessary to avoid microbial N limitation and increase plant-available N in the models. Some ecosystem models do consider plant exudate inputs to the soil that prime the rhizosphere community for N acquisition (e.g., FUN-CORPSE; (Sulman et al., 2017). Because N acquisition comes with a C cost, such a transactional representation of N acquisition and uptake may better predict the plant C allocation response to elevated N inputs (Thomas et al., 2015). As we were not able to address this shortcoming in this study, we directly targeted a parameter controlling decomposition rates and simulated the direct inhibition to decomposition by N additions instead.
4.2 Enzyme inhibition and soil C accumulation
We tested the enzyme inhibition hypothesis by modifying parameters that control the decomposition rates of POM pools with N addition. Augmented N likely increases the turnover time of the POM pool through reduced oxidative enzyme activity and less microbial priming (Von Lützow et al., 2008; Eastman et al., 2022; Craine et al., 2007; Chen et al., 2018). While our modeling efforts did successfully increase the litter plus soil C stocks in both CASA-CN and MIMICS-CN, it only led to an increase in the total litter plus soil C:N ratio response in the MIMICS-CN model (Fig. 2b). The ∼8 % increase in soil C with N addition predicted by the MIMICS-CN enzyme inhibition +N model was similar to the mean enhancement in surface mineral soil (0–15 cm) at the Fernow Forest (∼11 %; Eastman et al., 2021), as well as increases in surface soil C stocks in other long-term N addition experiments (Frey et al., 2014; Zak et al., 2008). The CASA-CN model predicted a more moderate enhancement in soil C stocks (5 %) with N additions and these parameter modifications, which still fell within the range of observation.
Beyond accurately predicting changes in the total soil C stocks and fluxes, the distribution of SOM between POM and MAOM pools is of high importance to the future land C sink (Lavallee et al., 2020; Whalen et al., 2022). Changes in the distribution of these SOM pools may impact overall soil stoichiometry (Mikutta et al., 2019; Eastman et al., 2022), which drives important soil C and nutrient cycling processes, such as net N mineralization rates (Aber et al., 2003; Venterea et al., 2004). An increase in the relative proportion of POM constituting SOM stocks in the fertilized watershed at the Fernow Forest raises compelling questions about the future of C and N accumulations due to chronic N additions in a changing world. For example, how will N-induced increases in the relative importance of POM impact forest recovery from N deposition and progressive N limitation under elevated CO2 conditions (Craine et al., 2018; Groffman et al., 2018; Norby et al., 2010)? Indeed, a recent global analysis by Hartley et al. (2021) found evidence of greater vulnerability of POM decomposition under conditions of soil warming compared to MAOM.
MIMICS-CN offers a potential advantage over CASA-CN because of the diagnostic soil stoichiometry and more mechanistic decomposition dynamics, which allowed for greater shifts in soil organic matter composition (i.e., POM accumulation) and soil C:N ratios compared to CASA-CN. Capturing shifts in bulk soil C:N (not including the litter layer) requires representation of multiple pathways of SOM formation, which MIMICS-CN includes, such as microbial biomass turnover and the direct physical transfer of litter-derived organic matter that has bypassed microbial decomposition (Cotrufo et al., 2019, 2015). Observed C:N ratios of POM at the Fernow study site were ∼25, but the C:N ratios in CASA-CN and MIMICS-CN were between ∼14–20. In CASA-CN, the prescribed C:N ratio of POM is lower than observed, leading to very small changes in total bulk soil C:N even as the fraction of SOM in the POM pool increases. Thus, even if the POM turnover time in CASA-CN was further increased, it would still not capture the mean observed increase in soil C:N with POM accumulation (Fig. 3 and Table A4). In MIMICS-CN, the increase in total soil C:N was mainly driven by the relative increase in the fraction of POM and decrease in the low C:N MAOM fraction. Still, the increase in bulk soil C:N (not including the litter layer) with POM accumulation in MIMICS-CN was not as strong as observations suggest (Fig. 3). This was likely due to the mechanism targeted in the enzyme inhibition +N experiment: reducing the oxidation of SOMc to SOMa. In MIMICS-CN, most litter inputs pass through a microbial pool, and SOM pools are mostly made up of microbial necromass – with a lower C:N ratio – though a small number of litter inputs bypass microbial pools (Fig. 1). This underscores challenges in assessing plant vs. microbial contributions to SOM formation and persistence (Whalen et al., 2022). Under conditions of elevated N inputs, it is thought that more litter inputs bypass microbial decomposition. Therefore, the direct transfer of litter inputs to soil pools is a key pathway that may better achieve observed responses of the SOM stocks and composition to N amendments in MIMICS-CN.
While the microbial explicit foundation of MIMICS-CN holds promise, there still appears to be uncertainties in how plant–soil interactions and their responses to environmental change should be presented and parameterized in the models. For example, our post hoc adjustment of plant C allocation and microbial decomposition with N enrichment were intended to represent ecosystem responses that are commonly observed in nitrogen enrichment studies (Janssens et al., 2010). This experiment allowed us to identify certain mechanisms and processes in the models that exert strong control over the formation and stabilization of SOM and that are influenced by N deposition. However, out results cannot necessarily be generalized to other ecosystems or environmental changes. Future model developments, therefore, should focus on constructing more process-based representations of these mechanisms (i.e., dynamic plant carbon allocation and reduced ligninolytic enzyme activity with N addition) to better predict the often-observed reductions in decomposition and soil respiration under N addition that are currently hard to capture with most soil biogeochemical models.
Given the widespread empirical evidence of a reduction in lignin-degrading enzyme activity with elevated N inputs (Treseder, 2004; Pregitzer et al., 2008; Frey et al., 2014; Carrara et al., 2018) and the resulting impacts on soil stoichiometry (Chen et al., 2018), additional efforts to improve mechanistic representations of decomposition parameterizations with available data should be a focus area for future model improvement. Such responses, however, are nuanced across ecosystems. As such, Rocci et al. (2022) found no consistent changes in soil stoichiometry with nutrient additions in grassland ecosystems, despite an increase in the relative fraction of POM compared to MAOM. Additionally, the microbial community composition, as approximated by the relative abundance of MICr : MICK simulated by MIMICS-CN, was not sensitive to N additions or shifts in plant allocation and inputs (not shown). By contrast, N addition experiments in forest ecosystems have found reductions in fungal decomposer biomass, reduced ligninolytic enzyme activity, (Frey et al., 2014; Argiroff et al., 2019), and a shift in community function with reduced ability to decompose recalcitrant SOM (Ramirez et al., 2012) – including at our study site (Carrara et al., 2018; Moore et al., 2021). In these studies, this shift in microbial community and function results in accumulation of SOM. Microbially explicit models like MIMICS-CN need further development to accurately represent these changes in community composition as resource availability and stoichiometry shift to simulate the downstream effects on soil biogeochemistry. Currently, microbial communities in the model may have too much access to SOM and litter inputs, resulting in more rapid decomposition rates and lower C:N ratios of SOM pools than are often observed (see also Kyker-Snowman et al., 2020). Specifically, constraining carbon use efficiencies (CUEs), nitrogen use efficiencies (NUEs), and C:N ratios for microbial communities against data and observations is warranted to capture their responses to environmental changes.
The two models tested in this study showed that targeted parameter modifications, informed by results from a long-term experiment, significantly improved the models' abilities to capture some key ecosystem responses to N additions: notably, a shift in plant C allocation to favor wood biomass over belowground allocation, decreased soil respiration, and an accumulation of POM with high C:N ratios (Eastman et al., 2021, 2022). Our results also suggest that a microbially explicit model has greater potential than a microbially implicit model to incorporate additional plant–microbe processes and better parameterize existing processes because of the existing plant–microbial processes included in the model structure. However, testing model experiments at additional sites and additional data are required to improve model representation of the complex plant–microbial responses to N enrichment and model predictions of ecosystem recovery following N additions. Specifically, key mechanisms driving the observed responses of the forest soil C cycle to N additions – such as direct enzyme inhibition, reduced rhizosphere priming, and shifts in microbial community composition – should be targeted for future model development efforts.
Table A1Parameter modifications made to the CASA-CNP vegetation model for site-specific configuration during spin-up and historical runs. All C:N ratios are the mass of carbon to the mass of nitrogen. GPP is gross primary productivity, CWD is coarse woody debris, and xkNlimiting is a scalar that controls the amount of soil N required for plants to access and uptake that N.

Table A2Soil parameter modifications made to CASA-CN for site-specific configuration during spin-up and historical runs. Soil C and N stocks and C:N ratios were compared against observations from Eastman et al. (2021, 2022).
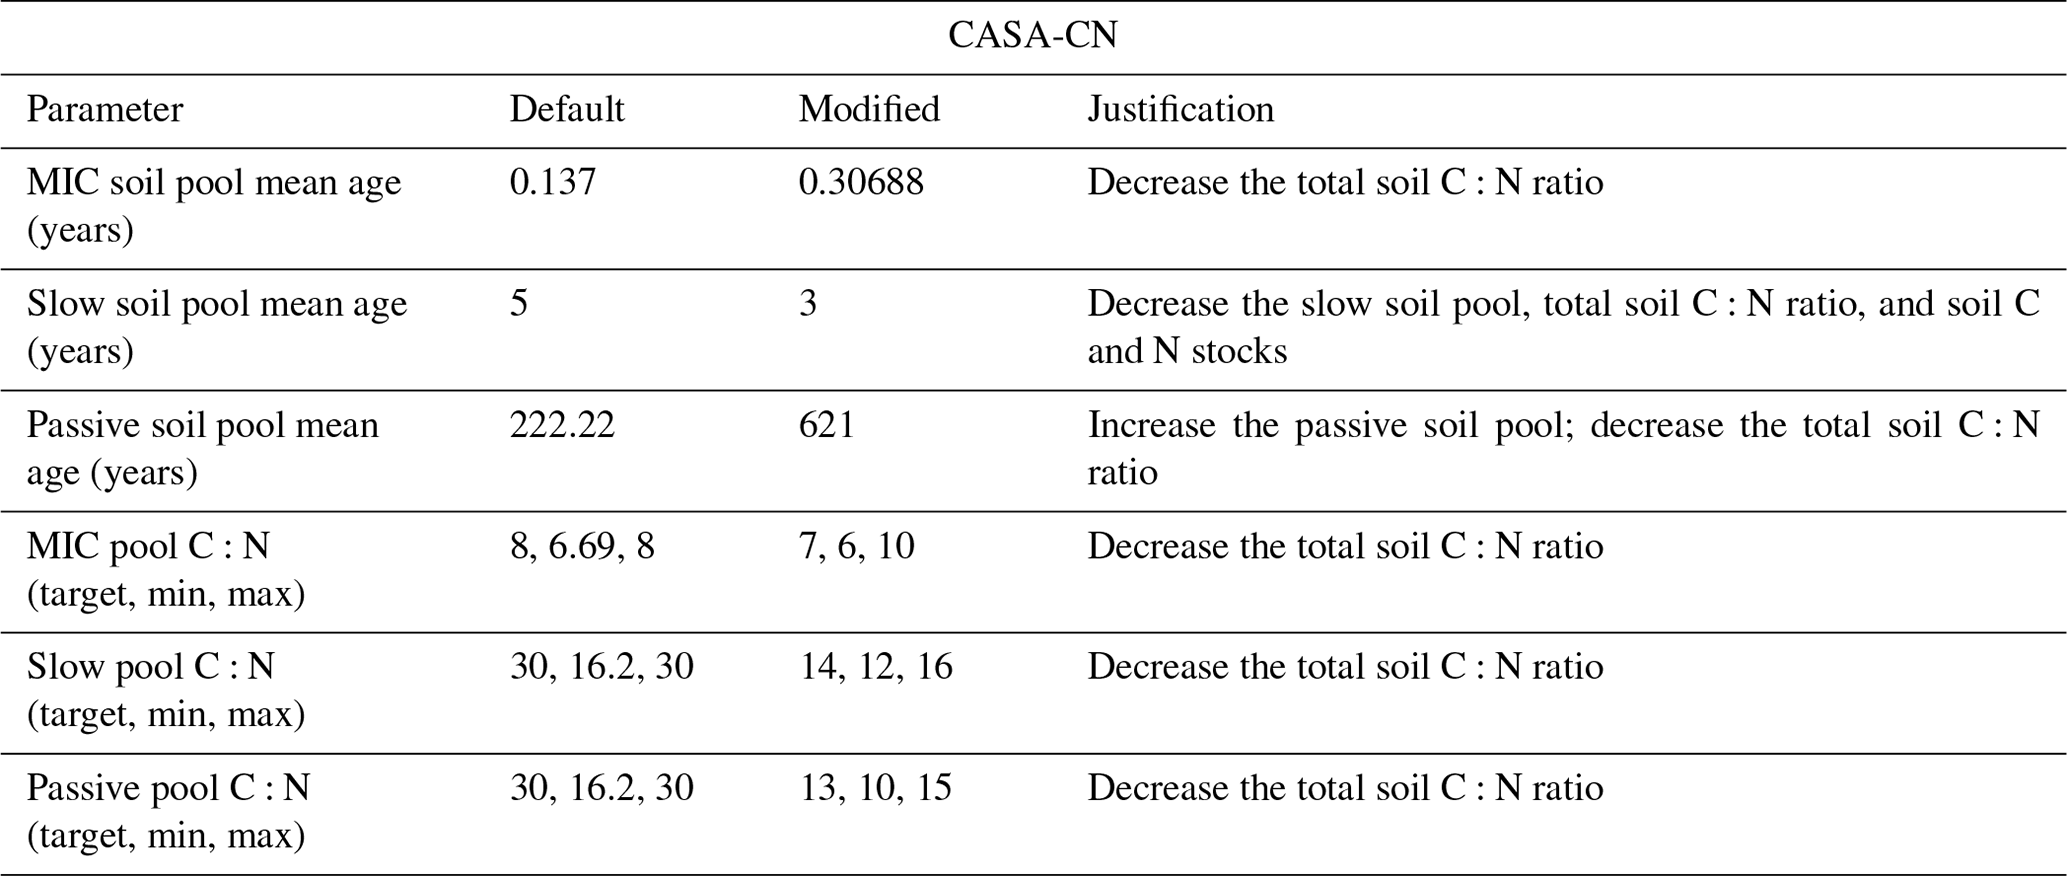
Table A3Soil parameter modifications made to MIMICS-CN for site-specific configuration during spin-up and historical runs. Default values are those used by Kyker-Snowman et al. (2020). Some parameters used were sourced from the C-only global simulation of the test bed (Wieder et al., 2015c) and are denoted as such. Soil C and N stocks and C:N ratios were compared against observations from Eastman et al. (2021, 2022).
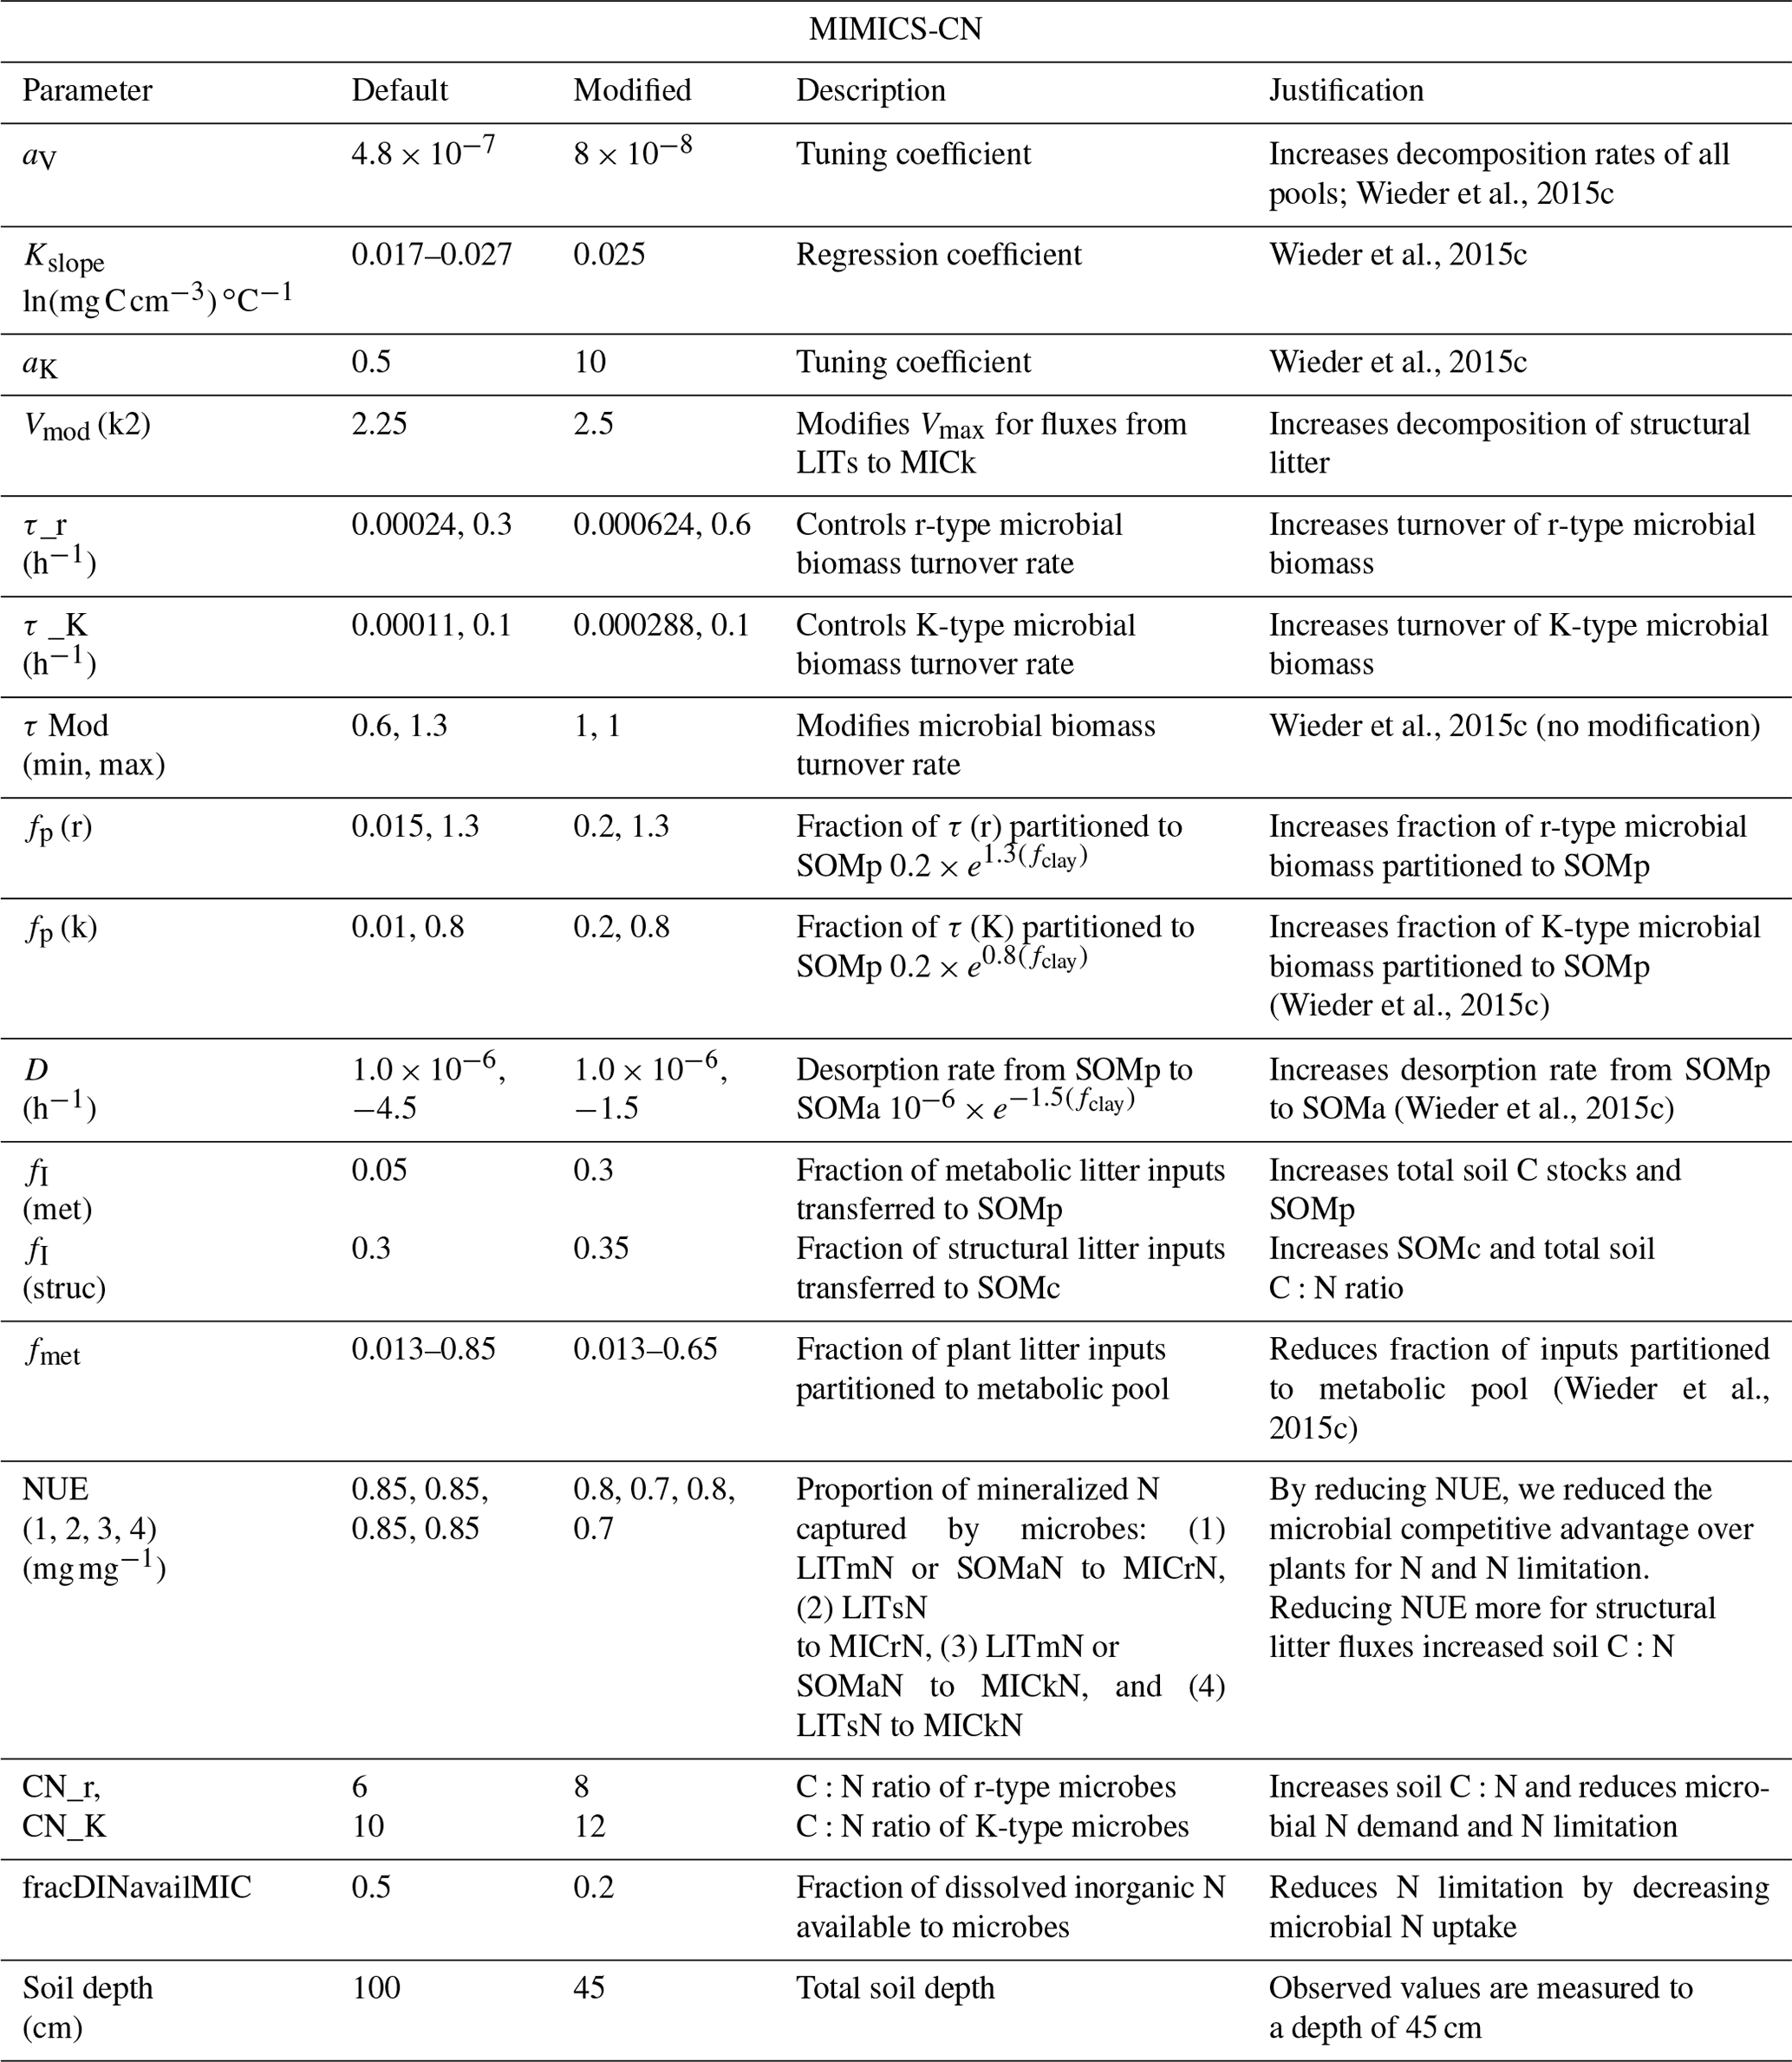
Table A4Model simulations and observations of the ecosystem pools and fluxes after 30 years of experimental N additions. Model mean (SE) values are from the last 10 years of the experimental transient simulations (1989–2019). Model standard errors are not shown for values when SE <0.01. Observed mean (SE) values are recent measurements (2009–2018) from reference watershed 7 and fertilized watershed 3 (see Eastman et al., 2021).
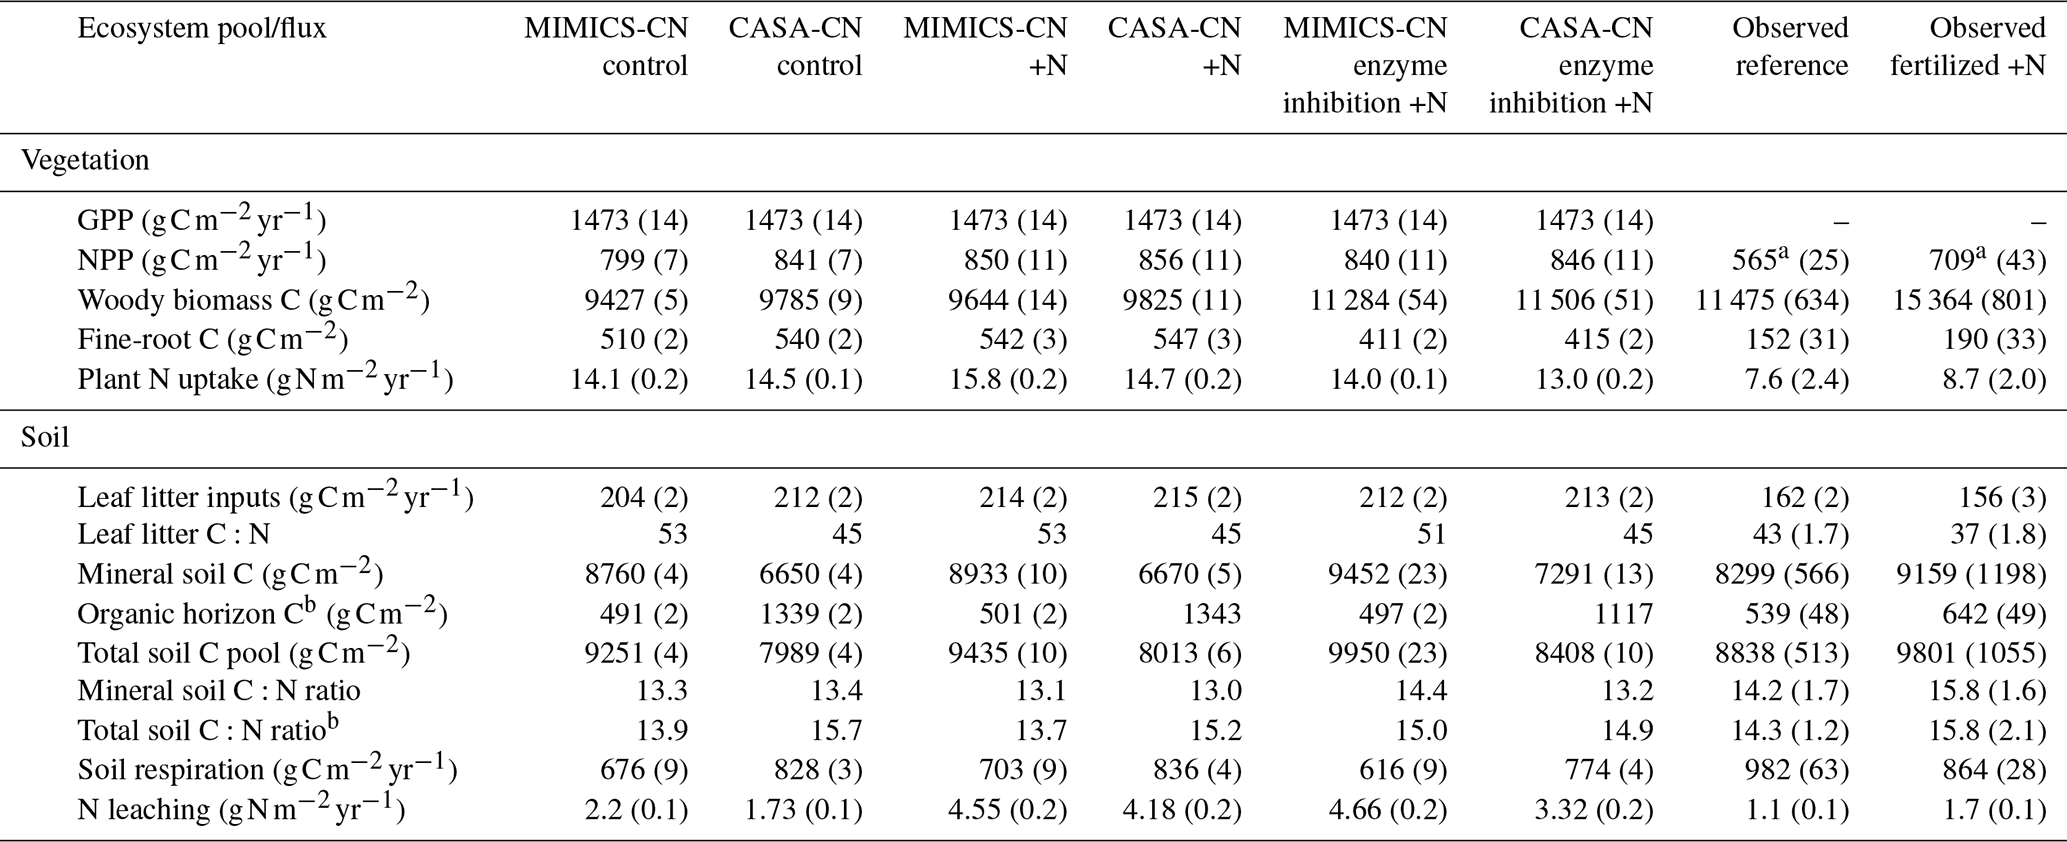
a Aboveground net primary productivity (ANPP) reported for observations. b Includes litter layer and soil organic horizon.
Model code is available at https://doi.org/10.5281/zenodo.7636495 (Wieder and Hartman, 2023). Model code, results, and analysis code can also be accessed at https://github.com/wwieder/ (Eastman et al., 2023). Model output was analyzed in R, and figures were produced in R (R Core Team, 2020), using the tidyverse (Wickham et al., 2019), data.table (Dowle and Srinivasan, 2020), stringr (Wickham, 2019), and scales (Wickham and Seidel, 2020) packages.
All authors contributed to the conceptualization of the project and experimental design. WRW and MDH developed the model code, and BAE performed the model simulations and analyzed model output with key input from WRW. BAE prepared the paper with contributions from all co-authors.
The contact author has declared that none of the authors has any competing interests.
Publisher's note: Copernicus Publications remains neutral with regard to jurisdictional claims made in the text, published maps, institutional affiliations, or any other geographical representation in this paper. While Copernicus Publications makes every effort to include appropriate place names, the final responsibility lies with the authors.
This article is part of the special issue “Ecosystem experiments as a window to future carbon, water, and nutrient cycling in terrestrial ecosystems”. It is not associated with a conference.
This research was funded by the National Science Foundation's Long-Term Research in Environmental Biology awards (grant nos. DEB-0417678, DEB-1019522, and DEB-1455785). Brooke A. Eastman also received support from the National Center for Atmospheric Research Center Advanced Study Program's Graduate Student Fellowship. NCAR is a major facility sponsored by the NSF under cooperative agreement no. 1852977. William R. Wieder acknowledges support from the NSF (award nos. 1926413 and 2031238) and USDA-NIFA (2020-67019-31395).
This research has been supported by the Directorate for Biological Sciences (grant nos. 0417678, 1019522, 1455785, and 1926413), the Office of Polar Programs (grant no. 2031238), the University Corporation for Atmospheric Research (grant no. 1852977), and the National Institute of Food and Agriculture (grant no. 2020-67019-31395).
This paper was edited by Benjamin Stocker and reviewed by Kevin Van Sundert and two anonymous referees.
Aber, J. D., Goodale, C. L., Ollinger, S. V., Smith, M., Magill, A. H., Martin, M. E., Hallett, R. A., and Stoddard, J. L.: Is nitrogen deposition altering the nitrogen status of northeastern forests?, BioScience, 53, 375–389, https://doi.org/10.1641/0006-3568(2003)053[0375:INDATN]2.0.CO;2, 2003.
Adams, M. B., DeWalle, D. R., and Hom, J. L. (Eds.): The Fernow Watershed Acidification Study, Springer Netherlands, Dordrecht, https://doi.org/10.1007/978-1-4020-4615-5, 2006.
Argiroff, W. A., Zak, D. R., Upchurch, R. A., Salley, S. O., and Grandy, A. S.: Anthropogenic N deposition alters soil organic matter biochemistry and microbial communities on decaying fine roots, Glob. Change Biol., 25, 4369–4382, https://doi.org/10.1111/gcb.14770, 2019.
Bernard, L., Basile-Doelsch, I., Derrien, D., Fanin, N., Fontaine, S., Guenet, B., Karimi, B., Marsden, C., and Maron, P. A.: Advancing the mechanistic understanding of the priming effect on soil organic matter mineralisation, Funct. Ecol., 36, 1355–1377, https://doi.org/10.1111/1365-2435.14038, 2022.
Bond-Lamberty, B., Bailey, V. L., Chen, M., Gough, C. M., and Vargas, R.: Globally rising soil heterotrophic respiration over recent decades, Nature, 560, 80–83, https://doi.org/10.1038/s41586-018-0358-x, 2018.
Carrara, J. E., Walter, C. A., Hawkins, J. S., Peterjohn, W. T., Averill, C., and Brzostek, E. R.: Interactions among plants, bacteria, and fungi reduce extracellular enzyme activities under long-term N fertilization, Glob. Change Biol., 24, 2721–2734, https://doi.org/10.1111/gcb.14081, 2018.
Carreiro, M. M., Sinsabaugh, R. L., Repert, D. A., and Parkhurst, D. F.: Microbial Enzyme Shifts Explain Litter Decay Responses to simulated nitrogen deposition, Ecology, 81, 2359–2365, https://doi.org/10.1890/0012-9658(2000)081[2359:MESELD]2.0.CO;2, 2000.
Chen, J., Luo, Y., Van Groenigen, K. J., Hungate, B. A., Cao, J., Zhou, X., and Wang, R.-W.: A keystone microbial enzyme for nitrogen control of soil carbon storage, Sci. Adv., 4, 2–8, https://doi.org/10.1126/sciadv.aaq1689, 2018.
Cotrufo, M. F., Soong, J. L., Horton, A. J., Campbell, E. E., Haddix, M. L., Wall, D. H., and Parton, W. J.: Formation of soil organic matter via biochemical and physical pathways of litter mass loss, Nat. Geosci., 8, 776–779, https://doi.org/10.1038/ngeo2520, 2015.
Cotrufo, M. F., Ranalli, M. G., Haddix, M. L., Six, J., and Lugato, E.: Soil carbon storage informed by particulate and mineral-associated organic matter, Nat. Geosci., 12, 989–994, https://doi.org/10.1038/s41561-019-0484-6, 2019.
Craine, J. M., Morrow, C., and Fierer, N.: Microbial nitrogen limitation increases decomposition, Ecology, 88, 2105–2113, https://doi.org/10.1890/06-1847.1, 2007.
Craine, J. M., Elmore, A. J., Wang, L., Aranibar, J., Bauters, M., Boeckx, P., Crowley, B. E., Dawes, M. A., Delzon, S., Fajardo, A., Fang, Y., Fujiyoshi, L., Gray, A., Guerrieri, R., Gundale, M. J., Hawke, D. J., Hietz, P., Jonard, M., Kearsley, E., Kenzo, T., Makarov, M., Marañón-Jiménez, S., McGlynn, T. P., McNeil, B. E., Mosher, S. G., Nelson, D., Peri, P. L., Roggy, J. C., Sanders-Demott, R., Song, M., Szpak, P., Templer, P. H., Van der Colff, D., Werner, C., Xu, X., Yang, Y., Yu, G., and Zmudczyńska-Skarbek, K.: Isotopic evidence for oligotrophication of terrestrial ecosystems, Nat. Ecol. Evol., 2, 1735–1744, https://doi.org/10.1038/s41559-018-0694-0, 2018.
Danabasoglu, G., Lamarque, J. F., Bacmeister, J., Bailey, D. A., DuVivier, A. K., Edwards, J., Emmons, L. K., Fasullo, J., Garcia, R., Gettelman, A., Hannay, C., Holland, M. M., Large, W. G., Lauritzen, P. H., Lawrence, D. M., Lenaerts, J. T. M., Lindsay, K., Lipscomb, W. H., Mills, M. J., Neale, R., Oleson, K. W., Otto-Bliesner, B., Phillips, A. S., Sacks, W., Tilmes, S., van Kampenhout, L., Vertenstein, M., Bertini, A., Dennis, J., Deser, C., Fischer, C., Fox-Kemper, B., Kay, J. E., Kinnison, D., Kushner, P. J., Larson, V. E., Long, M. C., Mickelson, S., Moore, J. K., Nienhouse, E., Polvani, L., Rasch, P. J., and Strand, W. G.: The Community Earth System Model Version 2 (CESM2), J. Adv. Model. Earth Sy., 12, 1–35, https://doi.org/10.1029/2019MS001916, 2020.
De Kauwe, M. G., Medlyn, B. E., Zaehle, S., Walker, A. P., Dietze, M. C., Wang, Y. P., Luo, Y., Jain, A. K., El-Masri, B., Hickler, T., Wårlind, D., Weng, E., Parton, W. J., Thornton, P. E., Wang, S., Prentice, I. C., Asao, S., Smith, B., Mccarthy, H. R., Iversen, C. M., Hanson, P. J., Warren, J. M., Oren, R., and Norby, R. J.: Where does the carbon go? A model-data intercomparison of vegetation carbon allocation and turnover processes at two temperate forest free-air CO2 enrichment sites, New Phytol., 203, 883–899, https://doi.org/10.1111/nph.12847, 2014.
de Vries, W., Du, E., and Butterbach-Bahl, K.: Short and long-term impacts of nitrogen deposition on carbon sequestration by forest ecosystems, Curr. Opin. Env. Sust., 9, 90–104, https://doi.org/10.1016/j.cosust.2014.09.001, 2014.
Dowle, M. and Srinivasan, A.: data.table: Extension on “data.frame”, https://cran.r-project.org/package=data.table (last access: November 2023), 2020.
Du, E. and de Vries, W.: Nitrogen-induced new net primary production and carbon sequestration in global forests, Environ. Pollut., 242, 1476–1487, https://doi.org/10.1016/j.envpol.2018.08.041, 2018.
Eastman, B. A., Adams, M. B., Brzostek, E. R., Burnham, M. B., Carrara, J. E., Kelly, C., McNeil, B. E., Walter, C. A., and Peterjohn, W. T.: Altered plant carbon partitioning enhanced forest ecosystem carbon storage after 25 years of nitrogen additions, New Phytol., 230, 1435–1448, https://doi.org/10.1111/nph.17256, 2021.
Eastman, B. A., Adams, M. B., and Peterjohn, W. T.: The path less taken: Long-term N additions slow leaf litter decomposition and favor the physical transfer pathway of soil organic matter formation, Soil Biol. Biochem., 166, 108567, https://doi.org/10.1016/j.soilbio.2022.108567, 2022.
Fernández-Martínez, M., Vicca, S., Janssens, I. A., Sardans, J., Luyssaert, S., Campioli, M., Chapin III, F. S., Ciais, P., Malhi, Y., Obersteiner, M., Papale, D., Piao, S. L., Reichstein, M., Rodá, F., and Peñuelas, J.: Nutrient availability as the key regulator of global forest carbon balance, Nat. Clim. Change, 4, 471–476, 2014.
Fernández-Martínez, M., Vicca, S., Janssens, I. A., Ciais, P., Obersteiner, M., Bartrons, M., Sardans, J., Verger, A., Canadell, J. G., Chevallier, F., Wang, X., Bernhofer, C., Curtis, P. S., Gianelle, D., Grünwald, T., Heinesch, B., Ibrom, A., Knohl, A., Laurila, T., Law, B. E., Limousin, J. M., Longdoz, B., Loustau, D., Mammarella, I., Matteucci, G., Monson, R. K., Montagnani, L., Moors, E. J., Munger, J. W., Papale, D., Piao, S. L., and Peñuelas, J.: Atmospheric deposition, CO2, and change in the land carbon sink, Sci. Rep., 7, 9632, https://doi.org/10.1038/s41598-017-08755-8, 2017.
Frey, S. D., Ollinger, S., Nadelhoffer, K., Bowden, R., Brzostek, E., Burton, A., Caldwell, B. A., Crow, S., Goodale, C. L., Grandy, A. S., Finzi, A., Kramer, M. G., Lajtha, K., LeMoine, J., Martin, M., McDowell, W. H., Minocha, R., Sadowsky, J. J., Templer, P. H., and Wickings, K.: Chronic nitrogen additions suppress decomposition and sequester soil carbon in temperate forests, Biogeochemistry, 121, 305–316, https://doi.org/10.1007/s10533-014-0004-0, 2014.
Friedlingstein, P., O'Sullivan, M., Jones, M. W., Andrew, R. M., Gregor, L., Hauck, J., Le Quéré, C., Luijkx, I. T., Olsen, A., Peters, G. P., Peters, W., Pongratz, J., Schwingshackl, C., Sitch, S., Canadell, J. G., Ciais, P., Jackson, R. B., Alin, S. R., Alkama, R., Arneth, A., Arora, V. K., Bates, N. R., Becker, M., Bellouin, N., Bittig, H. C., Bopp, L., Chevallier, F., Chini, L. P., Cronin, M., Evans, W., Falk, S., Feely, R. A., Gasser, T., Gehlen, M., Gkritzalis, T., Gloege, L., Grassi, G., Gruber, N., Gürses, Ö., Harris, I., Hefner, M., Houghton, R. A., Hurtt, G. C., Iida, Y., Ilyina, T., Jain, A. K., Jersild, A., Kadono, K., Kato, E., Kennedy, D., Klein Goldewijk, K., Knauer, J., Korsbakken, J. I., Landschützer, P., Lefèvre, N., Lindsay, K., Liu, J., Liu, Z., Marland, G., Mayot, N., McGrath, M. J., Metzl, N., Monacci, N. M., Munro, D. R., Nakaoka, S.-I., Niwa, Y., O'Brien, K., Ono, T., Palmer, P. I., Pan, N., Pierrot, D., Pocock, K., Poulter, B., Resplandy, L., Robertson, E., Rödenbeck, C., Rodriguez, C., Rosan, T. M., Schwinger, J., Séférian, R., Shutler, J. D., Skjelvan, I., Steinhoff, T., Sun, Q., Sutton, A. J., Sweeney, C., Takao, S., Tanhua, T., Tans, P. P., Tian, X., Tian, H., Tilbrook, B., Tsujino, H., Tubiello, F., van der Werf, G. R., Walker, A. P., Wanninkhof, R., Whitehead, C., Willstrand Wranne, A., Wright, R., Yuan, W., Yue, C., Yue, X., Zaehle, S., Zeng, J., and Zheng, B.: Global Carbon Budget 2022, Earth Syst. Sci. Data, 14, 4811–4900, https://doi.org/10.5194/essd-14-4811-2022, 2022.
Gill, A. L. and Finzi, A. C.: Belowground carbon flux links biogeochemical cycles and resource-use efficiency at the global scale, Ecol. Lett., 19, 1419–1428, https://doi.org/10.1111/ele.12690, 2016.
Groffman, P. M., Driscoll, C. T., Durán, J., Campbell, J. L., Christenson, L. M., Fahey, T. J., Fisk, M. C., Fuss, C., Likens, G. E., Lovett, G., Rustad, L., and Templer, P. H.: Nitrogen oligotrophication in northern hardwood forests, Biogeochemistry, 141, 523–539, https://doi.org/10.1007/s10533-018-0445-y, 2018.
Guenet, B., Eglin, T., Vasilyeva, N., Peylin, P., Ciais, P., and Chenu, C.: The relative importance of decomposition and transport mechanisms in accounting for soil organic carbon profiles, Biogeosciences, 10, 2379–2392, https://doi.org/10.5194/bg-10-2379-2013, 2013.
Hartley, I. P., Hill, T. C., Chadburn, S. E., and Hugelius, G.: Temperature effects on carbon storage are controlled by soil stabilisation capacities, Nat. Commun., 12, 5392–5403, https://doi.org/10.1038/s41467-021-27101-1, 2021.
Janssens, I. A. A., Dieleman, W., Luyssaert, S., Subke, J., Reichstein, M., Ceulemans, R., Ciais, P., Dolman, A. J., Grace, J., Matteucci, G., Papale, D., Piao, S. L., Schulze, E.-D., Tang, J., and Law, B. E.: Reduction of forest soil respiration in response to nitrogen deposition, Nat. Geosci., 3, 315–322, https://doi.org/10.1038/ngeo844, 2010.
Jian, J., Bond-Lamberty, B., Hao, D., Sulman, B. N., Patel, K. F., Zheng, J., Dorheim, K., Pennington, S. C., Hartman, M. D., Warner, D., and Wieder, W. R.: Leveraging observed soil heterotrophic respiration fluxes as a novel constraint on global-scale models, Glob. Change Biol., 27, 1–12, https://doi.org/10.1111/gcb.15795, 2021.
Jobbágy, E. G. and Jackson, R. B.: the Vertical Distribution of Soil Organic Carbon and Its, Ecol. Appl., 10, 423–436, https://doi.org/10.1890/1051-0761(2000)010[0423:TVDOSO]2.0.CO;2, 2000.
Kochenderfer, J. N.: Fernow and the Appalachian Hardwood Region, in: The Fernow Watershed Acidification Study, vol. 11, edited by: Adams, M. B., DeWalle, D. R., and Hom, J. L., Springer, 17–39, https://doi.org/10.1007/978-1-4020-4615-5_2, 2006.
Kochenderfer, J. N. and Wendel, G. W.: Plant succession and hydrologic recovery on a deforested and herbicided watershed, Forest Science, 29, 545–558, 1983.
Koven, C. D., Chambers, J. Q., Georgiou, K., Knox, R., Negron-Juarez, R., Riley, W. J., Arora, V. K., Brovkin, V., Friedlingstein, P., and Jones, C. D.: Controls on terrestrial carbon feedbacks by productivity versus turnover in the CMIP5 Earth System Models, Biogeosciences, 12, 5211–5228, https://doi.org/10.5194/bg-12-5211-2015, 2015.
Kyker-Snowman, E., Wieder, W. R., Frey, S. D., and Grandy, A. S.: Stoichiometrically coupled carbon and nitrogen cycling in the MIcrobial-MIneral Carbon Stabilization model version 1.0 (MIMICS-CN v1.0), Geosci. Model Dev., 13, 4413–4434, https://doi.org/10.5194/gmd-13-4413-2020, 2020.
Lavallee, J. M., Soong, J. L., and Cotrufo, M. F.: Conceptualizing soil organic matter into particulate and mineral-associated forms to address global change in the 21st century, Glob. Change Biol., 26, 261–273, https://doi.org/10.1111/gcb.14859, 2020.
Lawrence, D. M., Fisher, R. A., Koven, C. D., Oleson, K. W., Swenson, S. C., Bonan, G., Collier, N., Ghimire, B., van Kampenhout, L., Kennedy, D., Kluzek, E., Lawrence, P. J., Li, F., Li, H., Lombardozzi, D., Riley, W. J., Sacks, W. J., Shi, M., Vertenstein, M., Wieder, W. R., Xu, C., Ali, A. A., Badger, A. M., Bisht, G., van den Broeke, M., Brunke, M. A., Burns, S. P., Buzan, J., Clark, M., Craig, A., Dahlin, K., Drewniak, B., Fisher, J. B., Flanner, M., Fox, A. M., Gentine, P., Hoffman, F., Keppel-Aleks, G., Knox, R., Kumar, S., Lenaerts, J., Leung, L. R., Lipscomb, W. H., Lu, Y., Pandey, A., Pelletier, J. D., Perket, J., Randerson, J. T., Ricciuto, D. M., Sanderson, B. M., Slater, A., Subin, Z. M., Tang, J., Thomas, R. Q., Val Martin, M., and Zeng, X.: The Community Land Model Version 5: Description of New Features, Benchmarking, and Impact of Forcing Uncertainty, J. Adv. Model. Earth Sy., 11, 4245–4287, https://doi.org/10.1029/2018MS001583, 2019.
Lehmann, J. and Kleber, M.: The contentious nature of soil organic matter, Nature, 528, 60–68, https://doi.org/10.1038/nature16069, 2015.
Litton, C. M., Raich, J. W., and Ryan, M. G.: Carbon allocation in forest ecosystems, Glob. Change Biol., 13, 2089–2109, https://doi.org/10.1111/j.1365-2486.2007.01420.x, 2007.
Mikutta, R., Turner, S., Schippers, A., Gentsch, N., Meyer-Stüve, S., Condron, L., Peltzer, D., Richardson, S., Eger, A., Hempel, G., Kaiser, K., Klotzbücher, T., and Guggenberger, G.: Microbial and abiotic controls on mineral-associated organic matter in soil profiles along an ecosystem gradient, Sci. Rep., 9, 10294, https://doi.org/10.1038/s41598-019-46501-4, 2019.
Moore, J. A. M., Anthony, M. A., Pec, G. J., Trocha, L. K., Trzebny, A., Geyer, K. M., van Diepen, L. T. A., and Frey, S. D.: Fungal community structure and function shifts with atmospheric nitrogen deposition, Glob. Change Biol., 27, 1349–1364, https://doi.org/10.1111/gcb.15444, 2021.
Norby, R. J., Warren, J. M., Iversen, C. M., Medlyn, B. E., and McMurtrie, R. E.: CO2 enhancement of forest productivity constrained by limited nitrogen availability, P. Natl. Acad. Sci. USA, 107, 19368–19373, https://doi.org/10.1073/pnas.1006463107, 2010.
Pan, Y., Birdsey, R. A., Fang, J., Houghton, R., Kauppi, P. E., Kurz, W. A., Phillips, O. L., Shvidenko, A., Lewis, S. L., Canadell, J. G., Ciais, P., Jackson, R. B., Pacala, S. W., McGuire, A. D., Piao, S., Rautiainen, A., Sitch, S., and Hayes, D.: A large and persistent carbon sink in the world's forests, Science, 333, 988–993, https://doi.org/10.1126/science.1201609, 2011.
Parton, W. J., Hanson, P. J., Swanston, C., Torn, M., Trumbore, S. E., Riley, W., and Kelly, R.: ForCent model development and testing using the Enriched Background Isotope Study experiment, J. Geophys. Res.-Biogeo., 115, 1–15, https://doi.org/10.1029/2009JG001193, 2010.
Potter, C. S., Randerson, J. T., Field, C. B., Matson, P. A., Vitousek, P. M., Mooney, H. A., and Klooster, S. A.: Terrestrial ecosystem production: A process model based on global satellite and surface data, Global Biogeochem. Cy., 7, 811–841, https://doi.org/10.1029/93GB02725, 1993.
Pregitzer, K. S., Burton, A. J., Zak, D. R., and Talhelm, A. F.: Simulated chronic nitrogen deposition increases carbon storage in Northern Temperate forests, Glob. Change Biol., 14, 142–153, https://doi.org/10.1111/j.1365-2486.2007.01465.x, 2008.
R Core Team: R: A Language and Environment for Statistical Computing, https://www.r-project.org/ (last access: November 2023), 2020.
Ramirez, K. S., Craine, J. M., and Fierer, N.: Consistent effects of nitrogen amendments on soil microbial communities and processes across biomes, Glob. Change Biol., 18, 1918–1927, https://doi.org/10.1111/j.1365-2486.2012.02639.x, 2012.
Randerson, J. T., Thompson, M. V., Malmstrom, C. M., Field, C. B., and Fung, I. Y.: Substrate limitations for heterotrophs: Implications for models that estimate the seasonal cycle of atmospheric CO2, Global Biogeochem. Cy., 10, 585–602, https://doi.org/10.1029/96GB01981, 1996.
Rocci, K. S., Barker, K. S., Seabloom, E. W., Borer, E. T., Hobbie, S. E., Bakker, J. D., MacDougall, A. S., McCulley, R. L., Moore, J. L., Raynaud, X., Stevens, C. J., and Cotrufo, M. F.: Impacts of nutrient addition on soil carbon and nitrogen stoichiometry and stability in globally-distributed grasslands, Biogeochemistry, 159, 353–370, https://doi.org/10.1007/s10533-022-00932-w, 2022.
Schulte-Uebbing, L. and de Vries, W.: Global-scale impacts of nitrogen deposition on tree carbon sequestration in tropical, temperate, and boreal forests: A meta-analysis, Glob. Change Biol., 24, 416–431, https://doi.org/10.1111/gcb.13862, 2018.
Shi, M., Fisher, J. B., Brzostek, E. R., and Phillips, R. P.: Carbon cost of plant nitrogen acquisition: Global carbon cycle impact from an improved plant nitrogen cycle in the Community Land Model, Glob. Change Biol., 22, 1299–1314, https://doi.org/10.1111/gcb.13131, 2016.
Shi, M., Fisher, J. B., Phillips, R. P., and Brzostek, E. R.: Neglecting plant–microbe symbioses leads to underestimation of modeled climate impacts, Biogeosciences, 16, 457–465, https://doi.org/10.5194/bg-16-457-2019, 2019.
Sokol, N. W., Sanderman, J., and Bradford, M. A.: Pathways of mineral-associated soil organic matter formation: Integrating the role of plant carbon source, chemistry, and point of entry, Glob. Change Biol., 25, 12–24, https://doi.org/10.1111/gcb.14482, 2019.
Sulman, B. N., Phillips, R. P., Oishi, A. C., Shevliakova, E., and Pacala, S. W.: Microbe-driven turnover offsets mineral-mediated storage of soil carbon under elevated CO2, Nat. Clim. Change, 4, 1099–1102, https://doi.org/10.1038/nclimate2436, 2014.
Sulman, B. N., Brzostek, E. R., Medici, C., Shevliakova, E., Menge, D. N. L., and Phillips, R. P.: Feedbacks between plant N demand and rhizosphere priming depend on type of mycorrhizal association, Ecol. Lett., 20, 1043–1053, https://doi.org/10.1111/ele.12802, 2017.
Sulman, B. N., Moore, J., Abramoff, R., Averill, C., Kivlin, S., Georgiou, K., Sridhar, B., Hartman, M., Wang, G., Wieder, W., Bradford, M., Luo, Y., Mayes, M., Morrison, E., Riley, W., Salazar, A., Schimel, J. P., Tang, J., and Classen, A.: Multiple models and experiments underscore large uncertainty in soil carbon dynamics, Biogeochemistry, 141, 109–123, https://doi.org/10.1007/s10533-018-0509-z, 2018.
Tan, X., Machmuller, M. B., Cotrufo, M. F., and Shen, W.: Shifts in fungal biomass and activities of hydrolase and oxidative enzymes explain different responses of litter decomposition to nitrogen addition, Biol. Fert. Soils, 56, 423–438, https://doi.org/10.1007/s00374-020-01434-3, 2020.
Thomas, R. Q., Canham, C., Weathers, K., and Goodale, C.: Increased tree carbon storage in response to nitrogen deposition in the US, Nat. Geosci., 3, 13–17, https://doi.org/10.1038/ngeo721, 2010.
Thomas, R. Q., Brookshire, E. N. J., and Gerber, S.: Nitrogen limitation on land: How can it occur in Earth system models?, Glob. Change Biol., 21, 1777–1793, https://doi.org/10.1111/gcb.12813, 2015.
Treseder, K. K.: A meta-analysis of mycorrhizal responses to nitrogen, phosphorus, and atmospheric CO2 in field studies, New Phytol., 164, 347–355, https://doi.org/10.1111/j.1469-8137.2004.01159.x, 2004.
Varney, R. M., Chadburn, S. E., Burke, E. J., and Cox, P. M.: Evaluation of soil carbon simulation in CMIP6 Earth system models, Biogeosciences, 19, 4671–4704, https://doi.org/10.5194/bg-19-4671-2022, 2022.
Venterea, R. T., Groffman, P. M., Castro, M. S., Verchot, L. V., Fernandez, I. J., and Adams, M. B.: Soil emissions of nitric oxide in two forest watersheds subjected to elevated N inputs, Forest Ecol. Manage., 196, 335–349, https://doi.org/10.1016/j.foreco.2004.03.028, 2004.
Vicca, S., Luyssaert, S., Peñuelas, J., Campioli, M., Chapin, F. S., Ciais, P., Heinemeyer, A., Högberg, P., Kutsch, W. L., Law, B. E., Malhi, Y., Papale, D., Piao, S. L., Reichstein, M., Schulze, E. D., and Janssens, I. A.: Fertile forests produce biomass more efficiently, Ecol. Lett., 15, 520–526, https://doi.org/10.1111/j.1461-0248.2012.01775.x, 2012.
Vitousek, P. M. and Howarth, R. W.: Nitrogen Limitation on Land and in the Sea: How Can It Occur?, Biogeochemistry, 13, 87–115, 1991.
Von Lützow, M., Kögel-Knabner, I., Ludwig, B., Matzner, E., Flessa, H., Ekschmitt, K., Guggenberger, G., Marschner, B., and Kalbitz, K.: Stabilization mechanisms of organic matter in four temperate soils: Development and application of a conceptual model, J. Plant Nutr. Soil Sc., 171, 111–124, https://doi.org/10.1002/jpln.200700047, 2008.
Wang, Y. P., Law, R. M., and Pak, B.: A global model of carbon, nitrogen and phosphorus cycles for the terrestrial biosphere, Biogeosciences, 7, 2261–2282, https://doi.org/10.5194/bg-7-2261-2010, 2010.
Whalen, E. D., Grandy, A. S., Sokol, N. W., Keiluweit, M., Ernakovich, J., Smith, R. G., and Frey, S. D.: Clarifying the evidence for microbial- and plant-derived soil organic matter, and the path toward a more quantitative understanding, Glob. Change Biol., 28, 7167–7185, https://doi.org/10.1111/gcb.16413, 2022.
Wickham, H.: stringr: Simple, consistent, wrapper for common string operations, https://cran.r-project.org/package=stringr (last access: November 2023), 2019.
Wickham, H. and Seidel, D.: scales: Scales functions for visualization, https://cran.r-project.org/package=scales (last access: November 2023), 2020.
Wickham, H., Averick, M., Bryan, J., Chang, W., McGowan, L., François, R., Grolemund, G., Hayes, A., Henry, L., Hester, J., Kuhn, M., Pedersen, T., Miller, E., Bache, S., Müller, K., Ooms, J., Robinson, D., Seidel, D., Spinu, V., Takahashi, K., Vaughan, D., Wilke, C., Woo, K., and Yutani, H.: Welcome to the Tidyverse, J. Open Source Softw., 4, 1686, https://doi.org/10.21105/joss.01686, 2019.
Wieder, W. and Hartman, M.: Version testbed-CN, wwieder/biogeochem_testbed: v2.0.0, Zenod [data set], https://doi.org/10.5281/zenodo.7636495, 2023.
Wieder, W. R., Bonan, G. B., and Allison, S. D.: Global soil carbon projections are improved by modelling microbial processes, Nat. Clim. Change, 3, 909–912, https://doi.org/10.1038/nclimate1951, 2013.
Wieder, W. R., Grandy, A. S., Kallenbach, C. M., and Bonan, G. B.: Integrating microbial physiology and physio-chemical principles in soils with the MIcrobial-MIneral Carbon Stabilization (MIMICS) model, Biogeosciences, 11, 3899–3917, https://doi.org/10.5194/bg-11-3899-2014, 2014.
Wieder, W. R., Cleveland, C. C., Lawrence, D. M., and Bonan, G. B.: Effects of model structural uncertainty on carbon cycle projections: Biological nitrogen fixation as a case study, Environ. Res. Lett., 10, 044016, https://doi.org/10.1088/1748-9326/10/4/044016, 2015a.
Wieder, W. R., Cleveland, C. C., Smith, W. K., and Todd-Brown, K.: Future productivity and carbon storage limited by terrestrial nutrient availability, Nat. Geosci., 8, 441–444, https://doi.org/10.1038/NGEO2413, 2015b.
Wieder, W. R., Grandy, A. S., Kallenbach, C. M., Taylor, P. G., and Bonan, G. B.: Representing life in the Earth system with soil microbial functional traits in the MIMICS model, Geosci. Model Dev., 8, 1789–1808, https://doi.org/10.5194/gmd-8-1789-2015, 2015c.
Wieder, W. R., Hartman, M. D., Sulman, B. N., Wang, Y. P., Koven, C. D., and Bonan, G. B.: Carbon cycle confidence and uncertainty: Exploring variation among soil biogeochemical models, Glob. Change Biol., 24, 1563–1579, https://doi.org/10.1111/gcb.13979, 2018.
Wieder, W. R., Lawrence, D. M., Fisher, R. A., Bonan, G. B., Cheng, S. J., Goodale, C. L., Grandy, A. S., Koven, C. D., Lombardozzi, D. L., Oleson, K. W., and Thomas, R. Q.: Beyond static benchmarking: Using experimental manipulations to evaluate land model assumptions, Global Biogeochem. Cy., 33, 1289–1309, https://doi.org/10.1029/2018GB006141, 2019a.
Wieder, W. R., Sulman, B. N., Hartman, M. D., Koven, C. D., and Bradford, M. A.: Arctic Soil Governs Whether Climate Change Drives Global Losses or Gains in Soil Carbon, Geophys. Res. Lett., 46, 14486–14495, https://doi.org/10.1029/2019GL085543, 2019b.
Xia, M., Talhelm, A. F., and Pregitzer, K. S.: Long-term simulated atmospheric nitrogen deposition alters leaf and fine root decomposition, New Phytol., 21, 1–14, https://doi.org/10.1007/s10021-017-0130-3, 2017.
Zak, D. R., Holmes, W. E., Burton, A. J., Pregitzer, K. S., and Talhelm, A. F.: Simulated atmospheric deposition increases organic matter by slowing decomposition, Ecol. Appl., 18, 2016–2027, https://doi.org/10.1890/07-1743.1, 2008.