the Creative Commons Attribution 4.0 License.
the Creative Commons Attribution 4.0 License.
 | 08 May 2024
Drought and radiation explain fluctuations in Amazon rainforest greenness during the 2015–2016 drought
Yi Y. Liu
Albert I. J. M. van Dijk
Patrick Meir
Tim R. McVicar
The 2015–2016 Amazon drought was characterized by below-average regional precipitation for an entire year, which distinguishes it from the dry-season-only droughts in 2005 and 2010. Studies of vegetation indices (VIs) derived from optical remote sensing over the Amazonian forests indicated three stages in canopy response during the 2015–2016 drought, with below-average greenness during the onset and end of the drought, and above-average greenness during the intervening months. To date, a satisfactory explanation for this broad temporal pattern has not been found. A better understanding of rainforest behaviors during this unusually long drought should help predict their response to future droughts. We hypothesized that negative VI anomalies could be caused by water and heat stress exceeding the tolerance ranges of the rainforest. To test our hypothesis, based on monthly observations of terrestrial water storage (TWS), land surface temperature (LST), and vapor pressure deficit (VPD) for January 2003 to December 2016, we proposed an approach to categorize regions into two groups: (1) those exceeding normal hydrological and thermal ranges and (2) those within normal ranges. Accordingly, regions exceeding normal ranges during different stages of the 2015–2016 event were delineated. The results showed a gradual southward shift in these regions: from the northeastern Amazon during August to October 2015 to the north–central part during November 2015 to February 2016 and finally to the southern Amazon in July 2016. Over these regions exceeding normal ranges during droughts, negative VI anomalies were expected, irrespective of radiation anomalies. Over the regions within normal ranges, VI anomalies were assumed to respond positively to radiation anomalies, as is expected under normal conditions. We found that our proposed approach can explain more than 70 % of the observed spatiotemporal patterns in VI anomalies during the 2015–2016 drought. These results suggest that our “exceeding normal ranges”-based approach combining (i) water storage, (ii) temperature, and (iii) atmospheric moisture demand drivers can reasonably identify the most likely drought-affected regions at monthly to seasonal timescales. Using observation-based hydrological and thermal condition thresholds can help with interpreting the response of the Amazon rainforest to future drought events.
- Article
(19341 KB) - Full-text XML
- BibTeX
- EndNote


The Amazon rainforest is the largest contiguous area of tropical rainforest in the world and plays a crucial role in the water cycle and carbon budget, both regionally and globally (Tian et al., 1998; Pan et al., 2011; Ahlström et al., 2015). In little more than one decade, three record-breaking droughts have hit the region: in 2005, 2010 (Marengo and Espinoza, 2016), and 2015–2016 (Jiménez-Muñoz et al., 2016). Hydro-meteorological signals observed in the 2005 and 2010 droughts include a strong precipitation deficit during the extended dry season (Liu et al., 2018), low river discharge and total water storage (Xu et al., 2011), high canopy temperatures (Toomey et al., 2011), and enhanced atmospheric moisture demand (Lee et al., 2013). These signals resulted in widespread reductions in canopy photosynthesis and canopy water content (Xu et al., 2011; Saatchi et al., 2012; Lee et al., 2013; Liu et al., 2018), a slowdown in forest growth, and increased tree mortality (Phillips et al., 2009; Lewis et al., 2011; Gatti et al., 2014; Feldpausch et al., 2016; Hubau et al., 2020).
The 2005 and 2010 droughts occurred primarily during the extended dry season, from May through October (Liu et al., 2018). In contrast, during the 2015–2016 drought, below-average regional precipitation and above-average radiation occurred for a full year, from August 2015 through July 2016, i.e., from the dry season of 2015 to the dry season of 2016 (Yang et al., 2018). The 2015–2016 drought was also characterized by high temperatures (Yue et al., 2017) and low water storage (Erfanian et al., 2017). Long- and short-term responses to drought by tropical forests may differ in key respects (Meir et al., 2018). An analysis of the Amazon forest response during the unusually prolonged drought of 2015–2016, in comparison with previous, shorter droughts, may provide new insights into the underlying mechanisms and help predict forest response in a changing climate at monthly to inter-annual timescales.
Two vegetation indices (VIs), the normalized difference vegetation index (NDVI) and enhanced vegetation index (EVI), have been derived from the optical Moderate Resolution Imaging Spectroradiometer (MODIS) instruments on NASA's Terra and Aqua satellites, and are the most commonly used data to characterize Amazon rainforest canopy dynamics (Xiao et al., 2006; Anderson et al., 2010; Atkinson et al., 2011; Galvao et al., 2011; Samanta et al., 2012; Hilker et al., 2015; Maeda et al., 2016). Both vegetation indices (VIs) provide measures of canopy “greenness” that have been shown to correlate well to canopy photosynthetic capacity, which itself is the combined result of leaf chlorophyll, leaf age, canopy cover, and structure (Ramachandran et al., 2011). While the NDVI is sensitive to chlorophyll abundance, the EVI is more responsive to canopy structural variations, and the two indices are to some degree complementary in detecting vegetation change (Huete et al., 2002). An important feature of MODIS VIs is that they capture widespread canopy greening in response to increased solar radiation during the dry season of non-drought years (Huete et al., 2006). This phenological response has been confirmed by field measurements (Restrepo-Coupe et al., 2013; Saleska et al., 2016; Wu et al., 2018; Gonçalves et al., 2023).
Previous studies used MODIS VIs to examine the dynamics of Amazon rainforest greenness during the 2015–2016 drought (Yang et al., 2018; Yan et al., 2019). Over the 12-month period of August 2015 to July 2016, the spatial patterns of greenness and radiation anomalies were positively correlated (Fig. 1a and b) (Yang et al., 2018). The NDVI may exhibit the signal saturation issue over high biomass regions (Huete et al., 2002). We examined the anomaly in the NDVI and EVI separately, and found that their spatial distributions are similar (Fig. D1). Therefore, we combined the NDVI and EVI to quantify the greenness anomalies in this study. However, at shorter timescales, the agreement breaks down (Fig. 1c–l). Regional greenness appeared below average at the start (August to October 2015) and end (July 2016) of the 12-month drought, but above or close to average during the intervening 8 months (Fig. 1c). This temporal pattern was also found by Yang et al. (2018) and Yan et al. (2019), despite slight differences in the VI products used and study periods. The 12 months (i.e., August 2015 to July 2016) can be divided into four stages according to greenness anomaly: below average during August to October 2015 (Stage I), close to average during November 2015 to February 2016 (Stage II), above average during March to June 2016 (Stage III), and below average in July 2016 (Stage IV). Meanwhile, radiation remained above average for most of the 2015–2016 event, though it was close to average during Stage III (Fig. 1d). Spatially, the discrepancy between the anomalies in greenness and radiation was the most striking in stages I and IV, i.e., below-average greenness but above-average radiation over the northeast during August to October 2015 (Fig. 1e and f) and south in July 2016 (Fig. 1k and l). This discrepancy suggests that other factors, in addition to radiation, played a role in controlling greenness in the first and last months of the 2015–2016 drought event. Several potential driving factors could be expected to be correlated, including radiation, moisture availability, and temperature. This makes it challenging to identify their individual contributions. Better understanding of their interactions during the 2015–2016 drought should help improve our capacity to predict canopy responses to future droughts, which may become more frequent, severe, and/or longer (Malhi et al., 2008; Meir and Woodware, 2010).
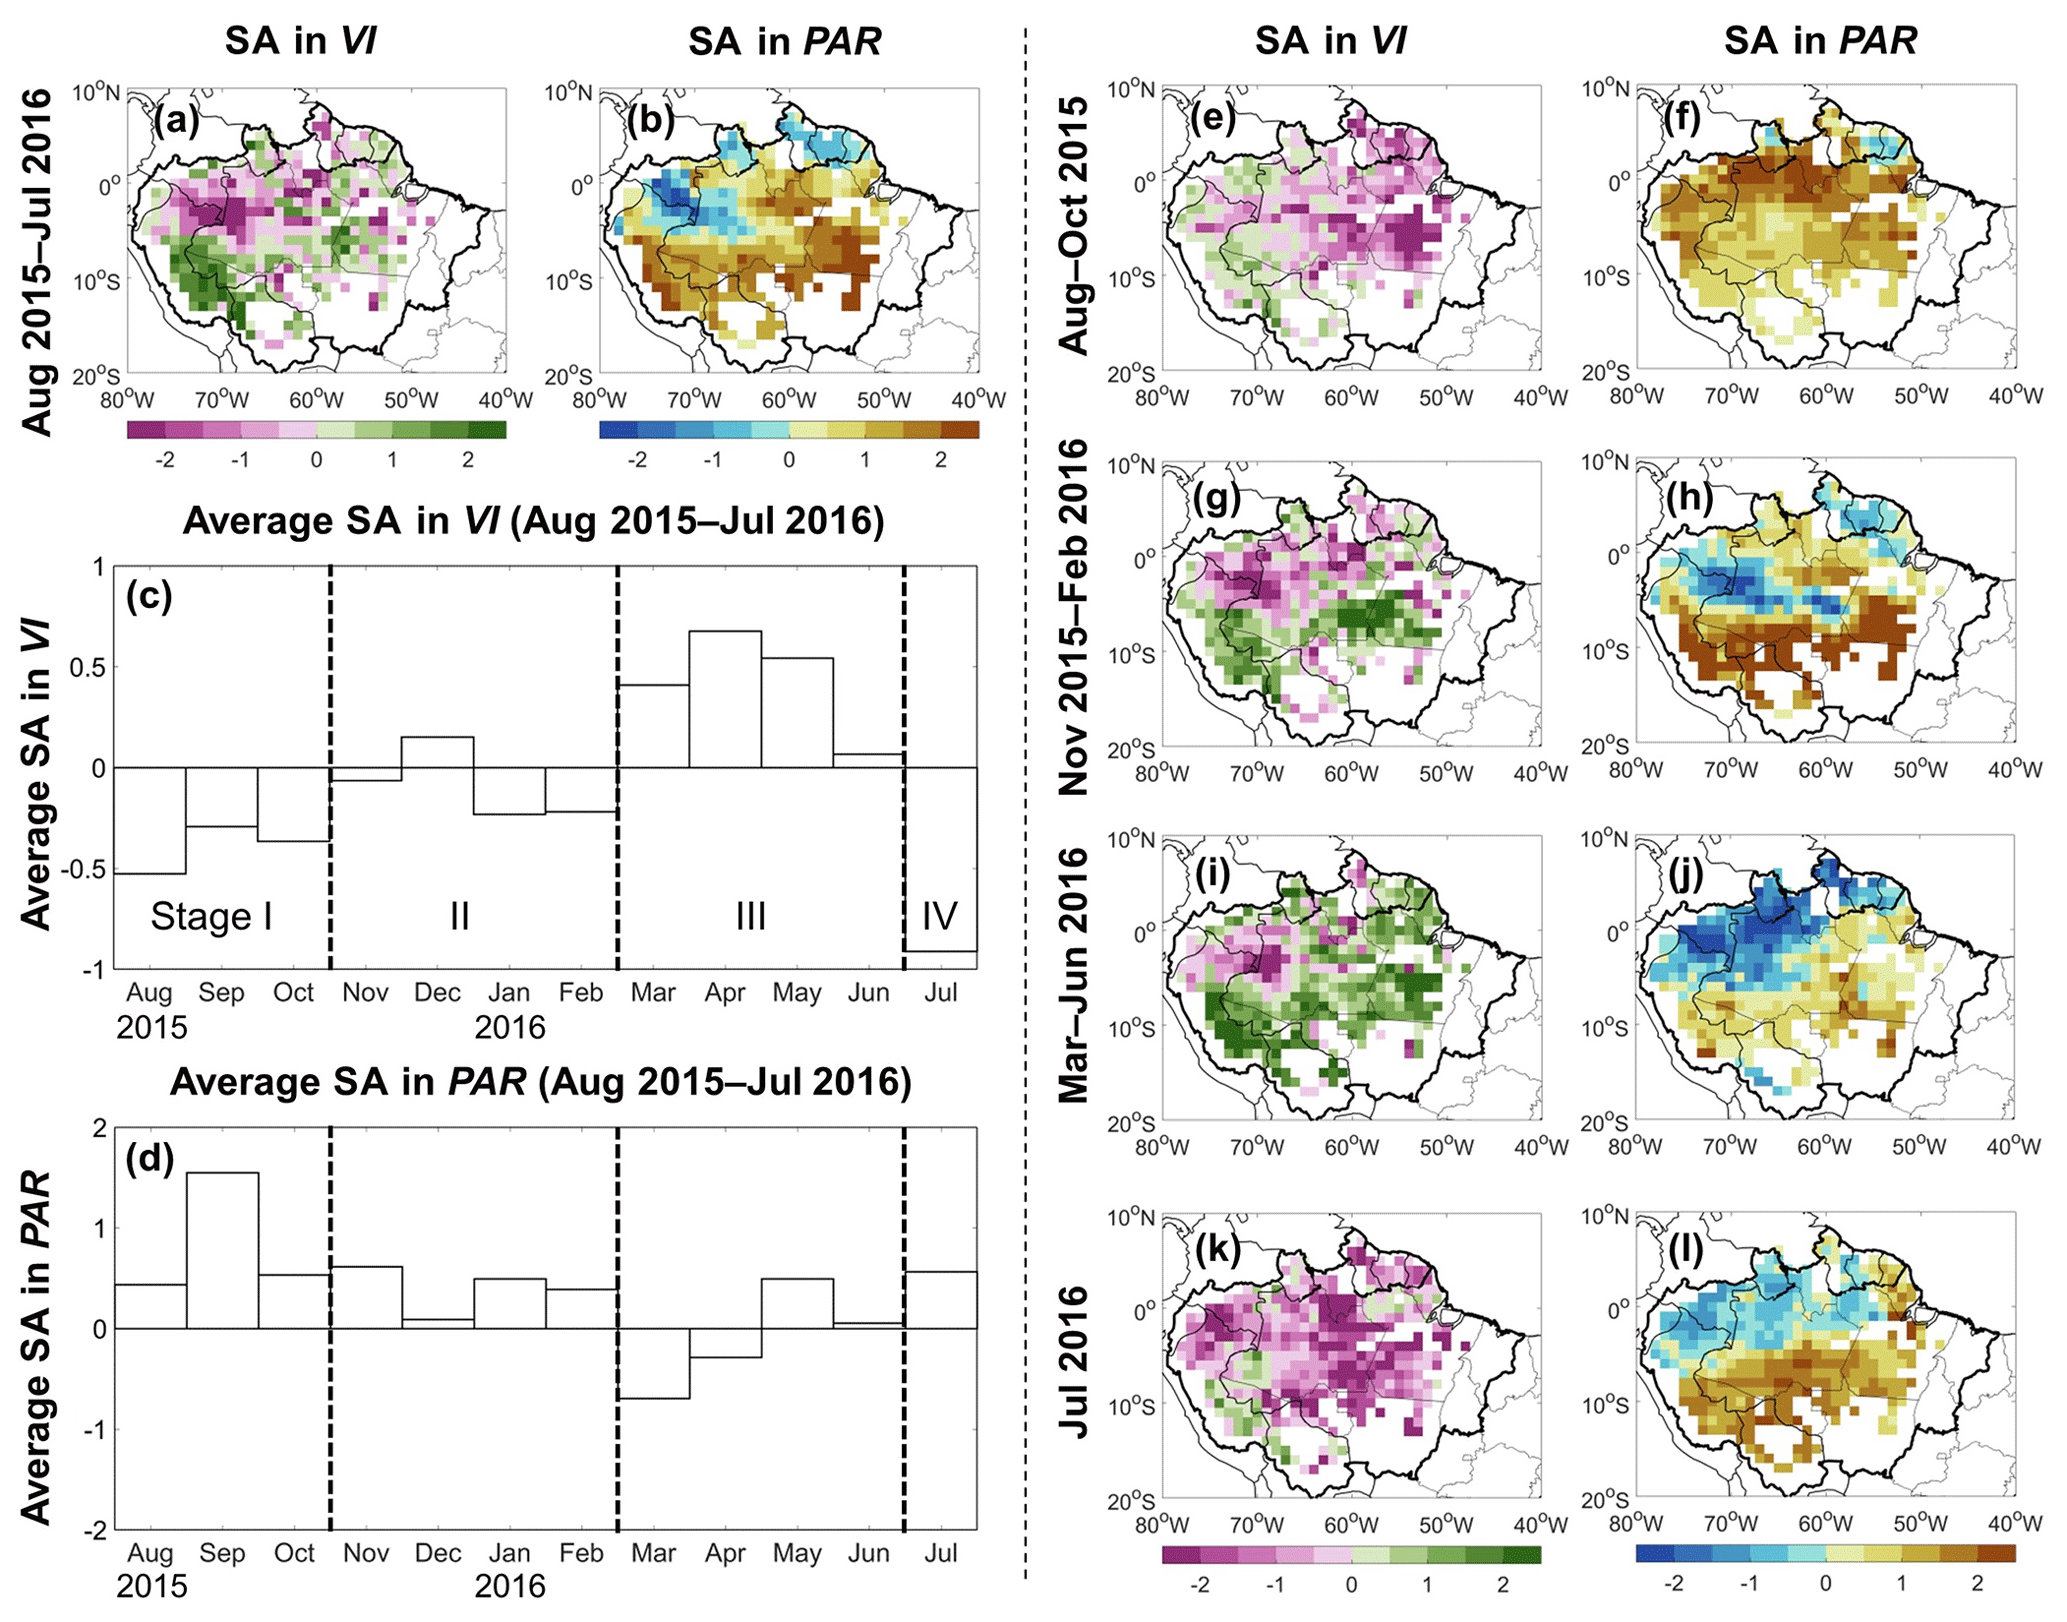
Figure 1Standardized anomalies (SA) in vegetation indices (VIs) and photosynthetically active radiation (PAR) during the 2015–2016 Amazon drought over the 1° grid cells with more than 80 % covered by evergreen broadleaf forests. Panels (a) and (b) are the spatial distribution of standardized anomalies in VIs and PAR for the 12 months between August 2015 and July 2016, respectively. Units measure how many standard deviations from the non-drought years' average (i.e., 2003–2016, excluding 4 drought years 2005, 2010, 2015, and 2016). Standardized anomaly in the EVI was calculated for each grid cell first; the same for the NDVI. We took the mean value of these two standardized anomalies and considered it as the standardized anomaly in VIs, as the EVI and NDVI provide complementary information to each other (Huete et al., 2002). Panels (c) and (d) show the regional average standardized anomaly in VIs and PAR for each month from August 2015 through July 2016. These 12 months can be divided into four stages based on the anomaly directions of VIs. Panels (e)–(l) are the spatial distribution of standardized anomalies in VIs and PAR for each of the four stages defined in panel (c). More details about data sources and pre-processing of VIs and PAR can be found in Table 1 and the Methods section, respectively.
Interpretation of the EVI and NDVI over the Amazon rainforest has been challenging as their temporal variation is small and influenced by sun–target–sensor geometry changes as well as clouds and aerosols (Samanta et al., 2010; Morton et al., 2014; Saleska et al., 2016). Based on the EVI and NDVI derived from the MODIS, widespread below-average greenness was observed in the dry season (July to September) during the 2010 Amazon drought (Atkinson et al., 2011; Xu et al., 2011). However, using the same data, there has been debate around greenness anomalies in the dry season of the 2005 drought (Saleska et al., 2007; Samanta et al., 2010). Considerable efforts have been made to apply more accurate atmospheric correction, cloud detection, improved sensor calibration, and sun–target–sensor geometry correction (Lyapustin et al., 2011a, b, 2012), but some noise may still persist (Bi et al., 2016; Maeda et al., 2016). In addition to vegetation observations, independent satellite observations of, among others, precipitation, temperature, and terrestrial water storage (TWS) have also been available since around 2000. This provides an opportunity to draw on multiple lines of evidence and characterize the hydro-meteorological drivers of rainforest response. Spatiotemporal consistency among these independent observations may increase the certainty of interpretation, thus indicating the most likely eco-hydrological mechanisms involved.
Table 1Major characteristics of the datasets used herein for January 2003 to December 2016.

Field experiments suggest that the Amazon rainforest has water and heat threshold limits beyond which normal physiological behavior is adversely affected (Meir et al., 2015). In the dry season of non-drought years, soil water is found sufficient for both sap flow and transpiration to occur even when soil water content reaches its annual minimum value (Fisher et al., 2006, 2007; Nepstad et al., 2007; Meir et al., 2009; Wu et al., 2016; da Costa et al., 2018; Meir et al., 2018; Meng et al., 2022). This indicates that the soil profile can supply enough water during a normal dry season, probably assisted by deeper root systems (Nepstad et al., 1994; Yang et al., 2016). However, when the dry season coincides with a drought, there can be a limit to this capacity. For example, in an experiment preventing 50 % of precipitation from falling through the canopy from infiltrating into the soil, soil water availability was apparently below the minimum for non-drought years (Meir et al., 2015). As a result, sap flow was reduced considerably (Fisher et al., 2007; da Costa et al., 2018). In addition, there appear to be similar thresholds in canopy temperature and vapor pressure deficit (VPD, a measure of atmospheric moisture demand) (Tan et al., 2017; Pau et al., 2018; Grossiord et al., 2019). Photosynthesis and sap flow rate thus tend to increase with temperature and VPD while these remain below the threshold, but decrease beyond it. In non-drought years, Amazon rainforests experience maximum temperature and VPD during the dry season (Hutyra et al., 2007). At the same time, new leaf flush occurs and ecosystem photosynthesis can be maintained or increased if dry-season radiation is high and soil moisture supply is sufficient (Carswell et al., 2002).
Accordingly, we hypothesized that the below-average greenness during the 2015–2016 drought year was most likely caused by an exceedance of moisture deficit and/or heat tolerance limits, particularly in stages I and IV. To test our hypothesis, we used data on terrestrial water storage (TWS), land surface temperature (LST), and vapor pressure deficit (VPD) for 2003–2016, which includes both drought and non-drought years. We identified the range of TWS, LST, and VPD averaged during non-drought years (i.e., defined as 2003–2016, excluding 4 drought years: 2005, 2010, 2015, and 2016) for each grid cell, and used these as an estimate of the normal hydrological and thermal range. Subsequently, we mapped when and where this “normal” range was exceeded during the 2015–2016 drought. By comparing their spatiotemporal patterns with those in radiation and greenness anomalies, we sought to explain observed differences in greenness response during the event.
2.1 Data sources
Several eco-hydrological variables were used to characterize the spatiotemporal patterns of greenness and drought during the 2015–2016 event (Table 1). They include (i) greenness represented by the enhanced vegetation index (EVI) (Huete et al., 1994, 1997) and normalized difference vegetation index (NDVI) (Tucker, 1979) from the MODIS instrument on board Aqua (Didan 2015), (ii) photosynthetically active radiation (PAR; in W m−2) from the Clouds and Earth's Radiant Energy System (CERES; SYN1deg Ed4.1 version) on board Aqua and Terra (Wielicki et al., 1996), (iii) precipitation (P; i mm/month) derived from the Tropical Rainfall Measuring Mission (TRMM 3B43 v7) (Huffman et al., 2007), (iv) terrestrial water storage (TWS; in mm) from the Gravity Recovery and Climate Experiment (GRACE Mascons) (Watkins et al., 2015; Wiese et al., 2016; Save et al., 2016; Loomis et al., 2019), (v) volumetric soil water (SW; in m3 m−3) obtained from the ERA5-Land reanalysis (Muñoz-Sabater et al., 2021), (vi) land surface temperature (LST; in degrees k) from the daytime overpasses (13:30 local time) of the Atmospheric Infrared Sounder (AIRS) on board Aqua (version 7) (Kahn et al., 2014; Susskind et al., 2014; Ding et al., 2020), and (vii) 2 m dewpoint temperature (Tdew; in degrees k) and 2 m temperature (Tair; in degrees k) obtained from the ERA5-Land reanalysis (Copernicus Climate Change Service, 2019), all of which were used to calculate the atmospheric vapor pressure deficit (VPD; in kPa).
2.2 Data pre-processing
All data were available at monthly temporal resolution for January 2003 to December 2016. All datasets have full 168-month coverage except TWS. Occasional months (21 out of 168 months during 2003–2016, the longest gap being 3 consecutive months) were missing in the original TWS dataset. Missing TWS data are commonly filled using linear interpolation (Chen et al., 2013; Solander et al., 2017) on the assumption that missing data were not local maxima or minima. To avoid this assumption, instead, we gap-filled the missing values by considering their correlation to precipitation and radiation (see Appendix A for details).
Vapor pressure deficit (VPD; in kPa) is the difference between the vapor pressure when the air is saturated (es) and actual vapor pressure (ea). Here VPD was calculated as es–ea with the availability of surface dewpoint temperature (Tdew; in °C) and surface air temperature (Tair; in °C) from ERA5-Land reanalysis:
To allow direct comparison, all datasets were resampled to 1° resolution by aggregation. The spatial extent of Amazon rainforest was delineated based on the 0.05° MODIS land cover type product (MCD12C1.006) for 2015. To minimize the influence of non-forest vegetation signals, our analysis was limited to 1° grid cells with more than 80 % of 0.05° grid cells classified as “evergreen broadleaf forests” following the International Geosphere-Biosphere Programme (IGBP) classification (Friedl et al., 2010).
3.1 Overview of the experimental design
We conducted a comparative analysis between the outcomes derived from two distinct approaches (see Fig. 2), which are described below.
In the first approach (Approach #1), it was assumed that vegetation index (VI) anomalies are exclusively driven by PAR anomalies (Nemani et al., 2003; Huete et al., 2006; Saleska et al., 2016), leading to changes in the same direction. Accordingly, we created a map depicting the predicted direction of VI anomalies (either positive or negative) for each grid cell across the Amazonian forests.
In the second approach (Approach #2), we first utilized the non-drought years' extreme values of TWS, LST, and VPD to categorize regions into two groups: (a) those within historical observed normal ranges and (b) those exceeding those normal ranges. For regions within normal ranges, we hypothesized that VI anomalies would align with PAR anomalies, exhibiting changes in the same direction. In regions exceeding the normal ranges during droughts, negative VI anomalies are expected, irrespective of the direction of PAR anomalies. Accordingly, we generated another map illustrating the predicted direction of VI anomalies (either positive or negative) for each grid cell.
By comparing the predicted VI anomalies from both approaches independently with MODIS-observed VI anomalies for all grid cells, we calculated the percentage of observed VI anomalies aligning with the predicted direction in both approaches. This comparative analysis allowed us to determine whether the incorporation of the “exceeding normal ranges”-based method better explained the MODIS-observed VI anomalies.
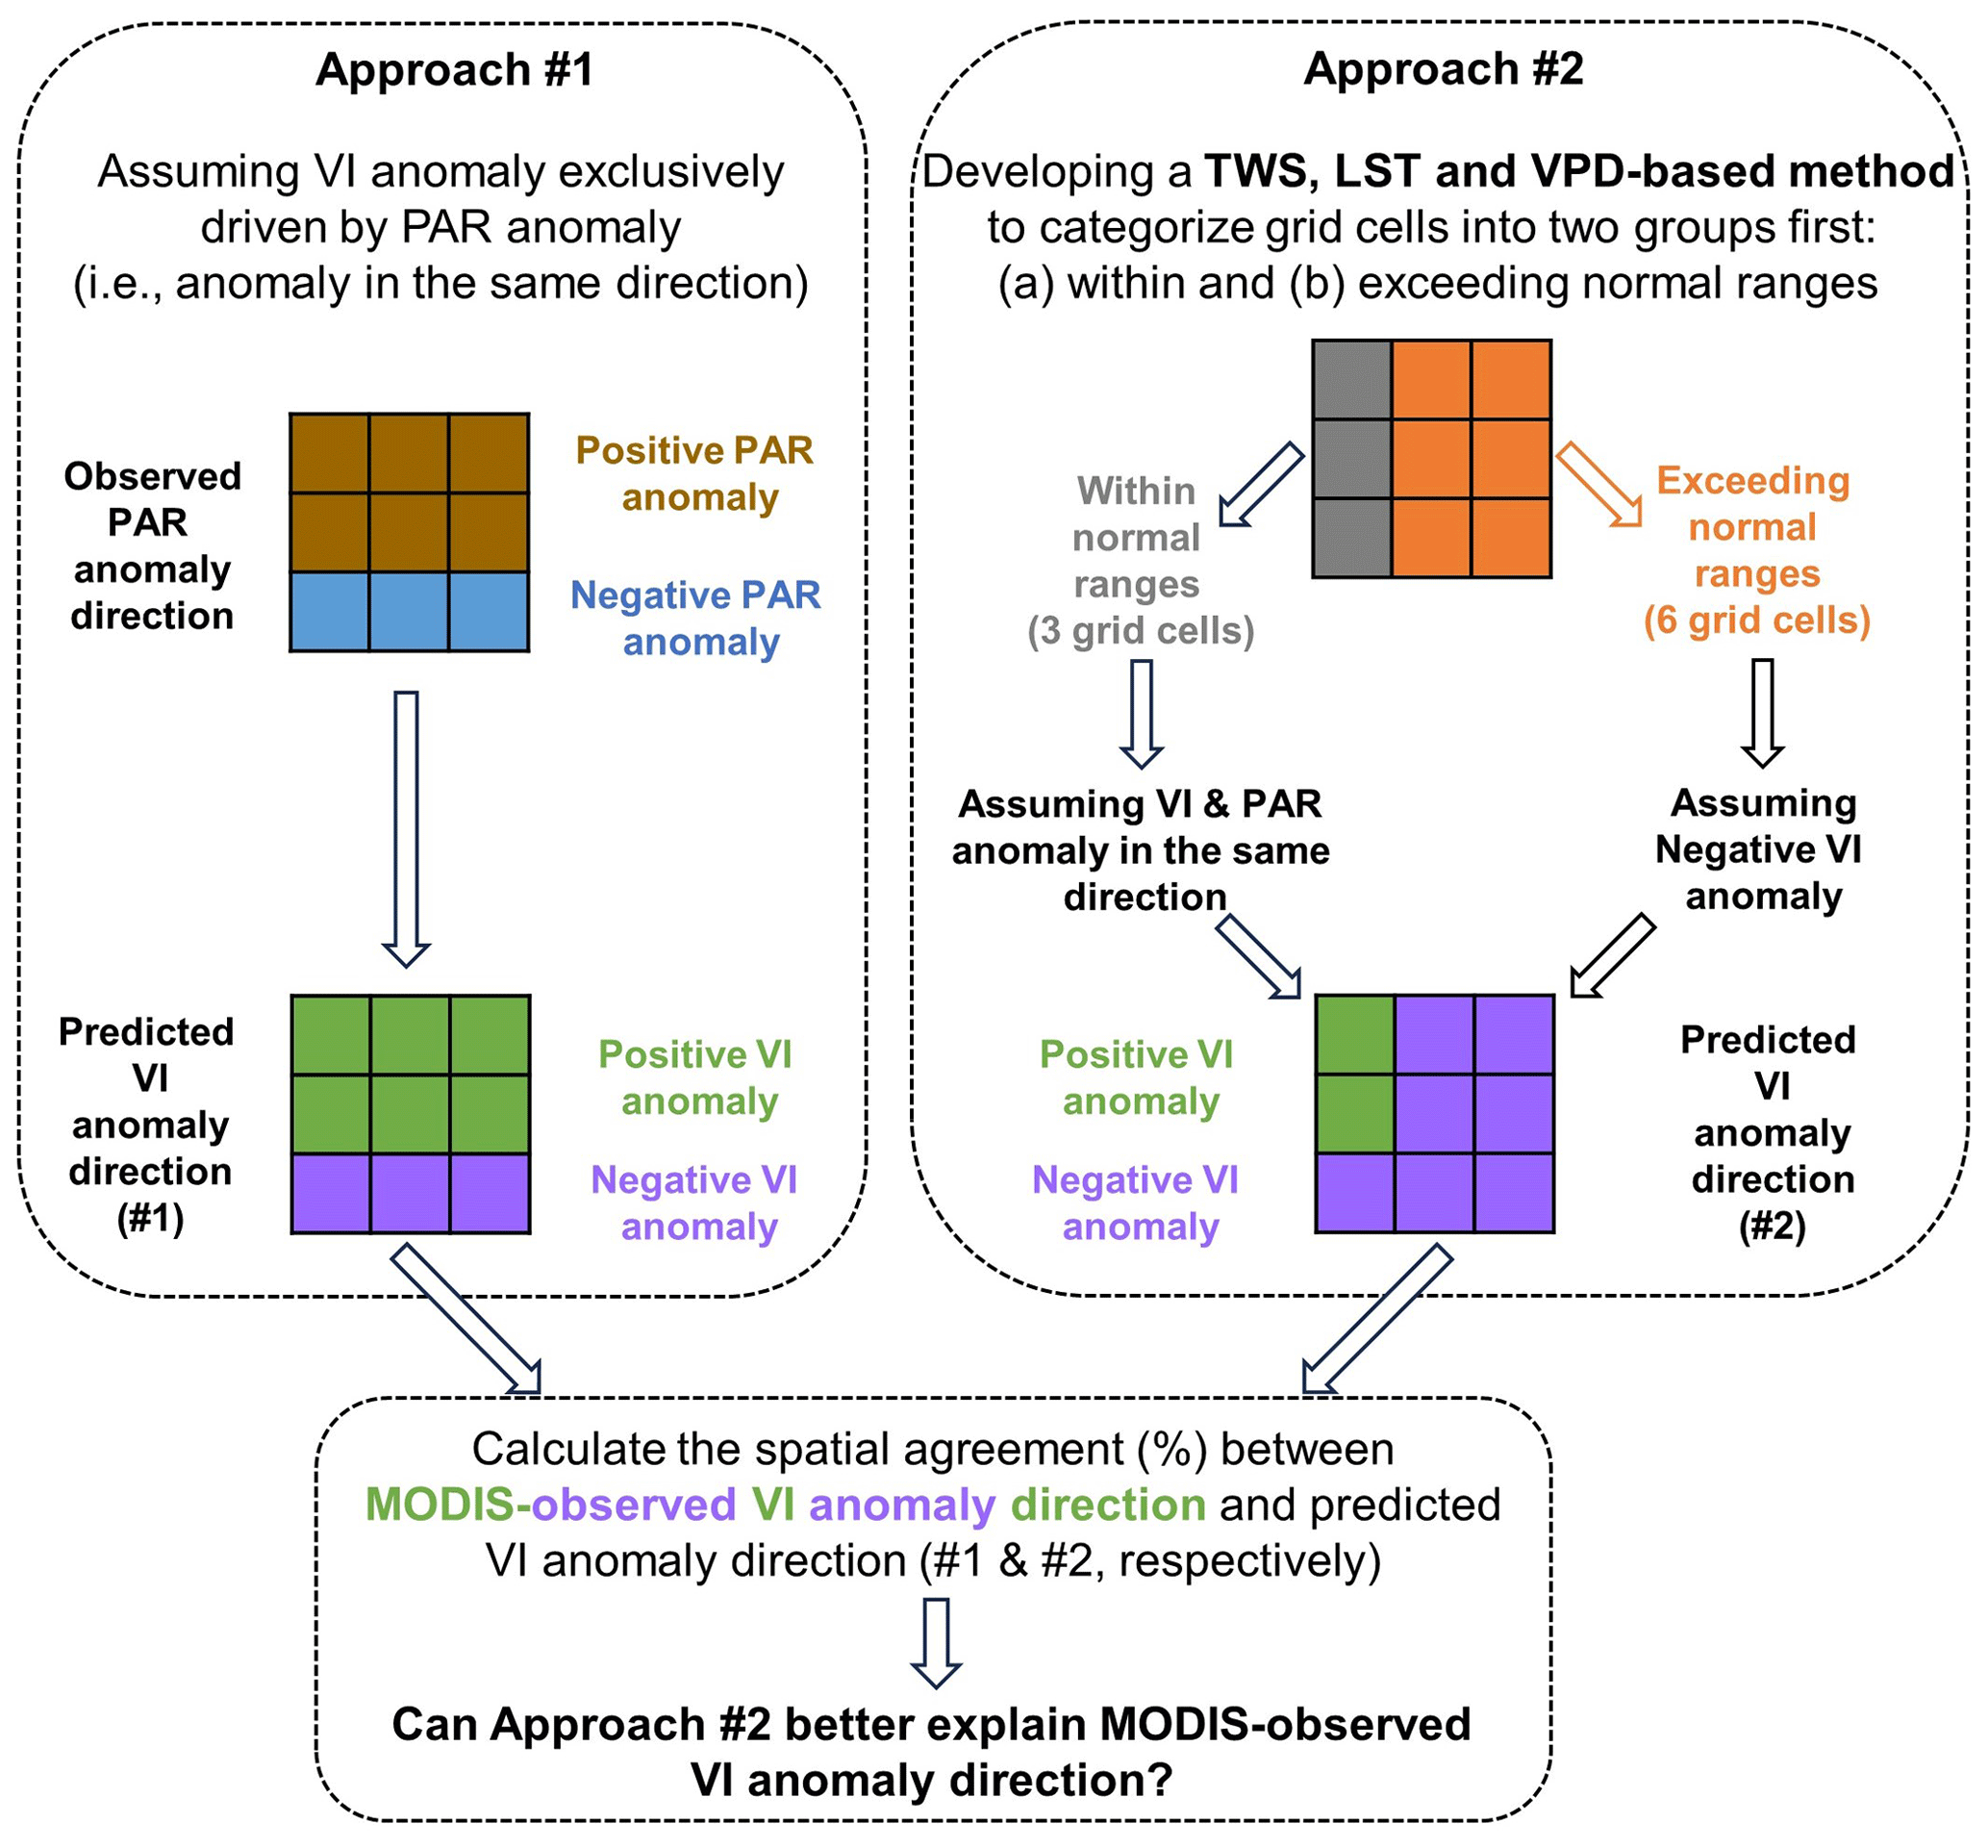
Figure 2Overview of the experimental design implemented herein. Examples with nine grid cells are used here to illustrate how the directions of VI anomalies were predicted for each grid cell in these two approaches. Developing the terrestrial water storage (TWS)-, land surface temperature (LST)-, and vapor pressure deficit (VPD)-based methods to categorize grid cells into two groups in Approach #2 is the focus of the Methods section. The impact of precipitation variability (e.g., total annual precipitation and length of dry season) is accounted for by these three variables, and therefore, precipitation is not included in the method in Approach #2.
3.2 Development of TWS-, LST-, and VPD-based methods
This section focuses on how we developed the TWS-, LST-, and VPD-based methods to categorize grid cells into two groups: (1) within and (2) exceeding normal ranges.
3.2.1 How to calculate non-drought years' average and extreme values
Here we calculated the non-drought years' average and extreme values of the three variables (TWS, LST, and VPD) for every grid cell. A detailed example is shown in Fig. 3. For example, we took the average of TWS values in August of all non-drought years and derived the non-drought years' average TWS in August (i.e., TWSND-Ave in August). We performed the same calculation for the other 11 months and obtained TWSND-Ave in September, October, November, December, January, February, March, April, May, June, and July, respectively. In total, there are 12 TWSND-Ave values, and the lowest one of these 12 values was taken as the extreme TWS value (i.e., TWSMin). Following the same process, we obtained 12 LSTND-Ave and 12 VPDND-Ave values, and the highest one of them was taken as the extreme LST and VPD values (i.e., LSTMax and VPDMax, respectively). Applying this procedure to all grid cells over the Amazon rainforest, we derived 12 maps each of TWSND-Ave, LSTND-Ave, and VPDND-Ave, as well as one map of each TWSMin, LSTMax, and VPDMax.
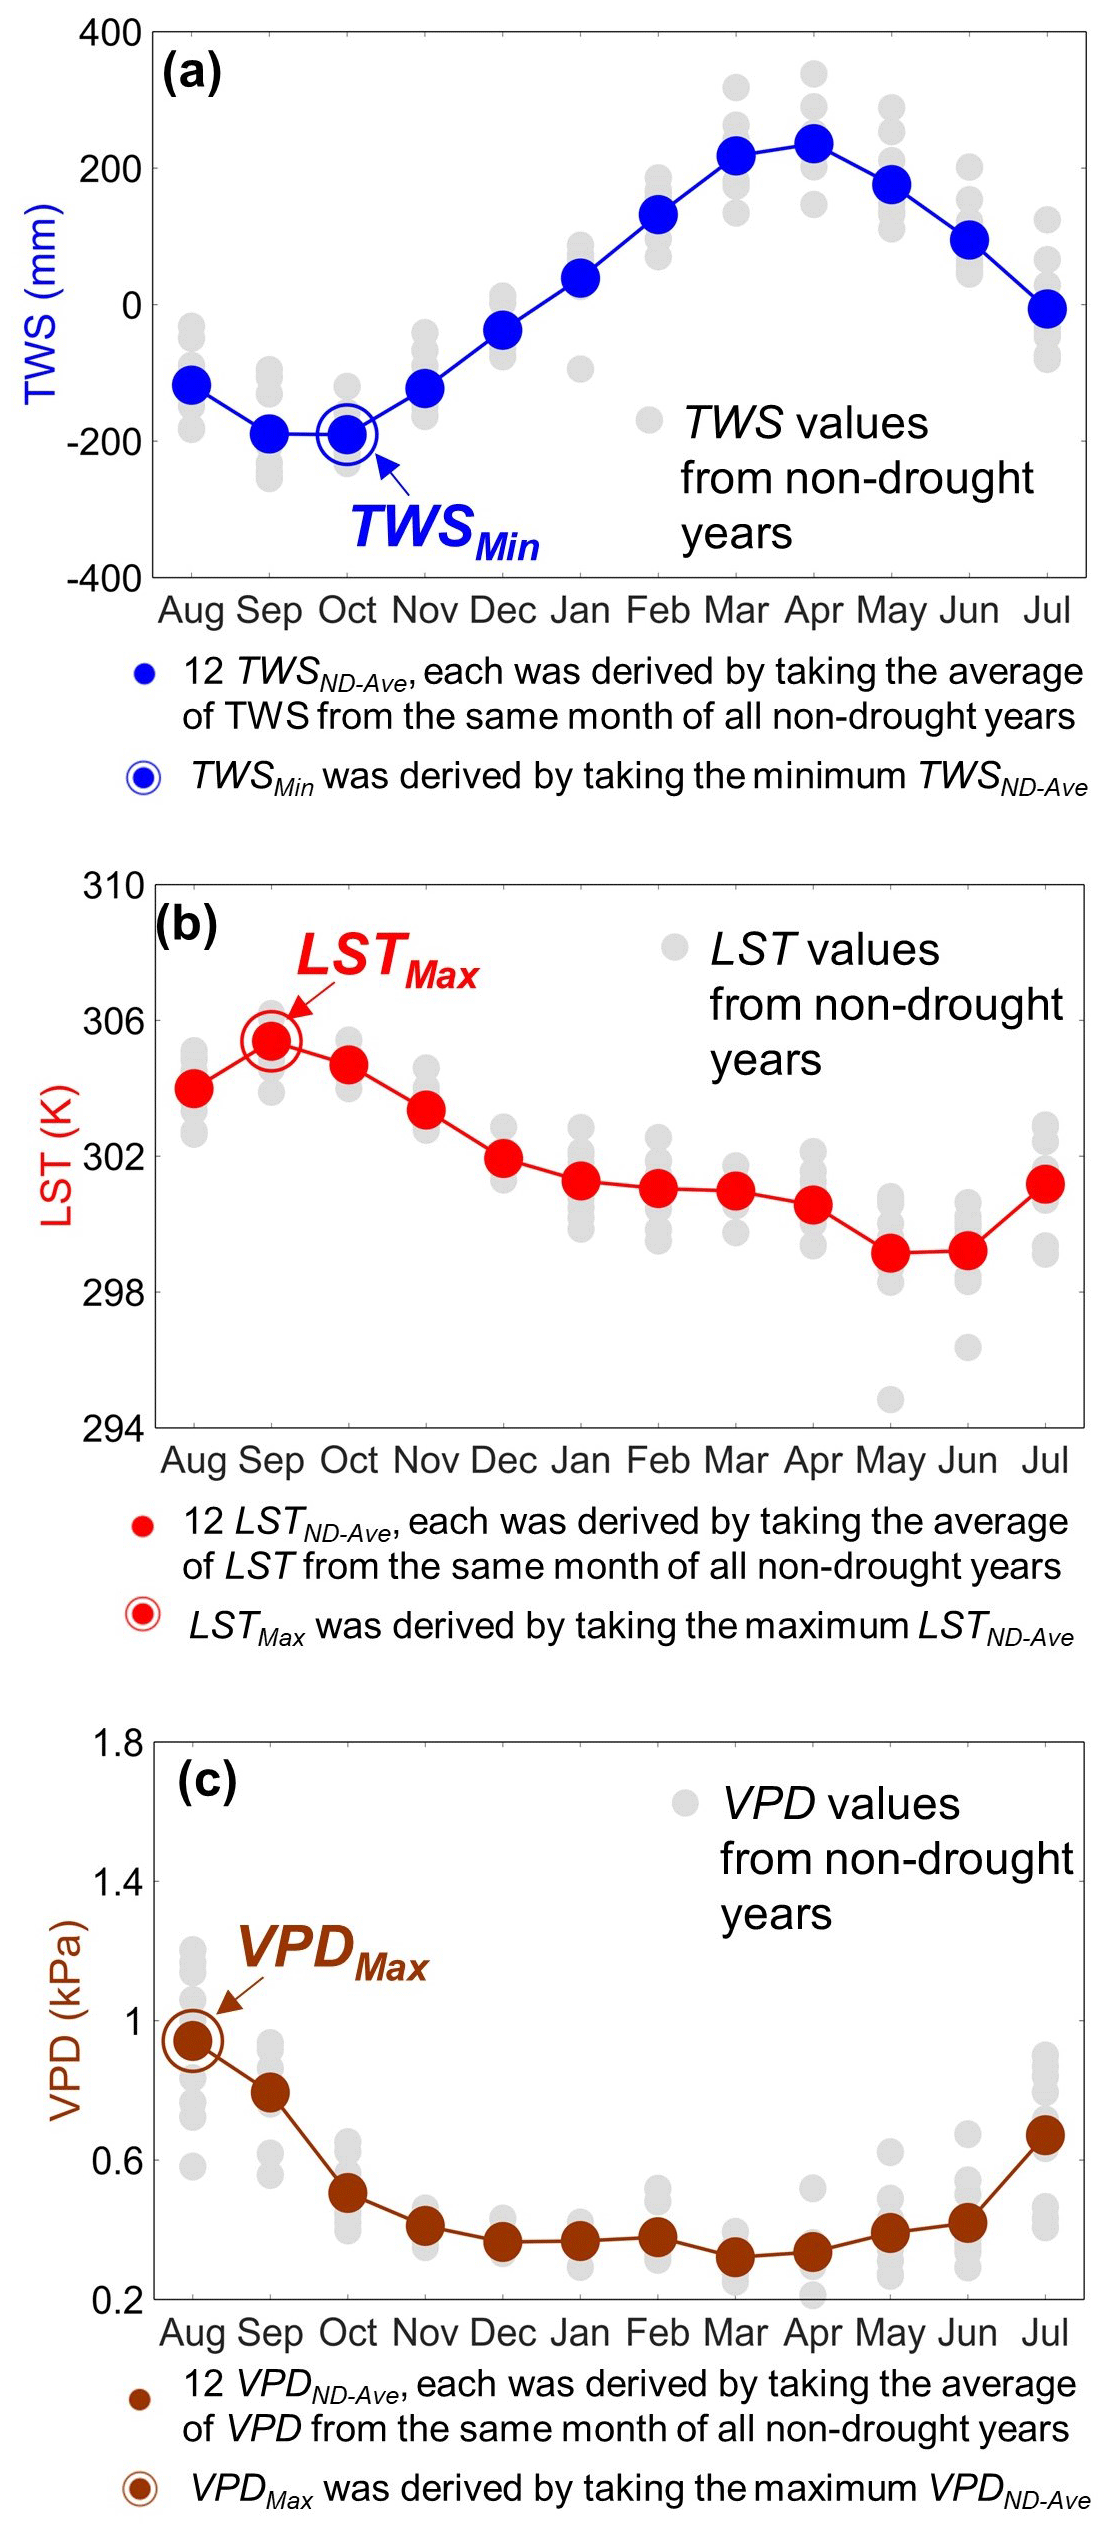
Figure 3Example illustrating how to derive (1) non-drought years' average and (2) non-drought years' extreme values of TWS, LST, and VPD using the 1° grid cell centered at 9.5° S, 69.5° W. Panel (a) shows how we derived the non-drought years' average and extreme TWS values. Taking August, for example, each gray dot represents the August TWS value from 1 non-drought year, and there are 10 non-drought years (i.e., 2003–2016, but excluding 2005, 2010, 2015, and 2016). The average of these 10 TWS values is considered as the non-drought years' average in August (i.e., TWSND-Ave in August). Following the same process, we derived TWSND-Ave for the other 11 months. The minimum value of 12 TWSND-Ave was taken as the extreme TWS (TWSMin); for this example grid cell, October's TWSND-Ave was chosen as TWSMin. Panels (b) and (c) show the same as (a), but for LST and VPD. The extreme values of LST and VPD are LSTMax and VPDMax, respectively, which were reached in September and August during non-drought years for this example grid cell.
3.2.2 How to determine a grid cell “exceeding normal ranges”
Based on the findings from previous field experiments over the Amazon rainforest (Fisher et al., 2006, 2007; Nepstad et al., 2007; Meir et al., 2009, 2015; Wu et al., 2016; Tan et al., 2017; da Costa et al., 2018; Meir et al., 2018; Pau et al., 2018; Grossiord et al., 2019; Meng et al., 2022), we considered that at least one variable from TWS, LST, and VPD was “beyond the non-drought years' extreme values” (i.e., TWSMin, LSTMax, and VPDMax) when the hydrological and thermal conditions exceeded normal ranges. Here we tested three ways to determine a grid cell “exceeding normal ranges” as described below.
- –
Approach #2A: two or three variables of TWS, LST, and VPD are “beyond the non-drought years' extreme values”. In the example shown in Fig. 4, August, September, and October were considered as “exceeding normal ranges” accordingly.
- –
Approach #2B: one variable of TWS, LST, and VPD is “beyond the non-drought years' extreme value”, while the other two variables are “significantly (p<0.05) different from the same months of the non-drought years”. The non-parametric Wilcoxon signed rank test was used to determine the significance level (Gibbons and Chakraborti, 2011). As many hydrological variables are not normally distributed, using the non-parametric Wilcoxon rank test offers the advantage of not assuming that data are normally distributed. Accordingly, September, October, and November were considered as “exceeding normal ranges” (Fig. 4). September and October met the selection criteria of both #2A and #2B.
- –
Approach #2C: the combination of Approach #2A and #2B. In the example of Fig. 4, all 4 months from August to November were considered as “exceeding normal ranges” here.
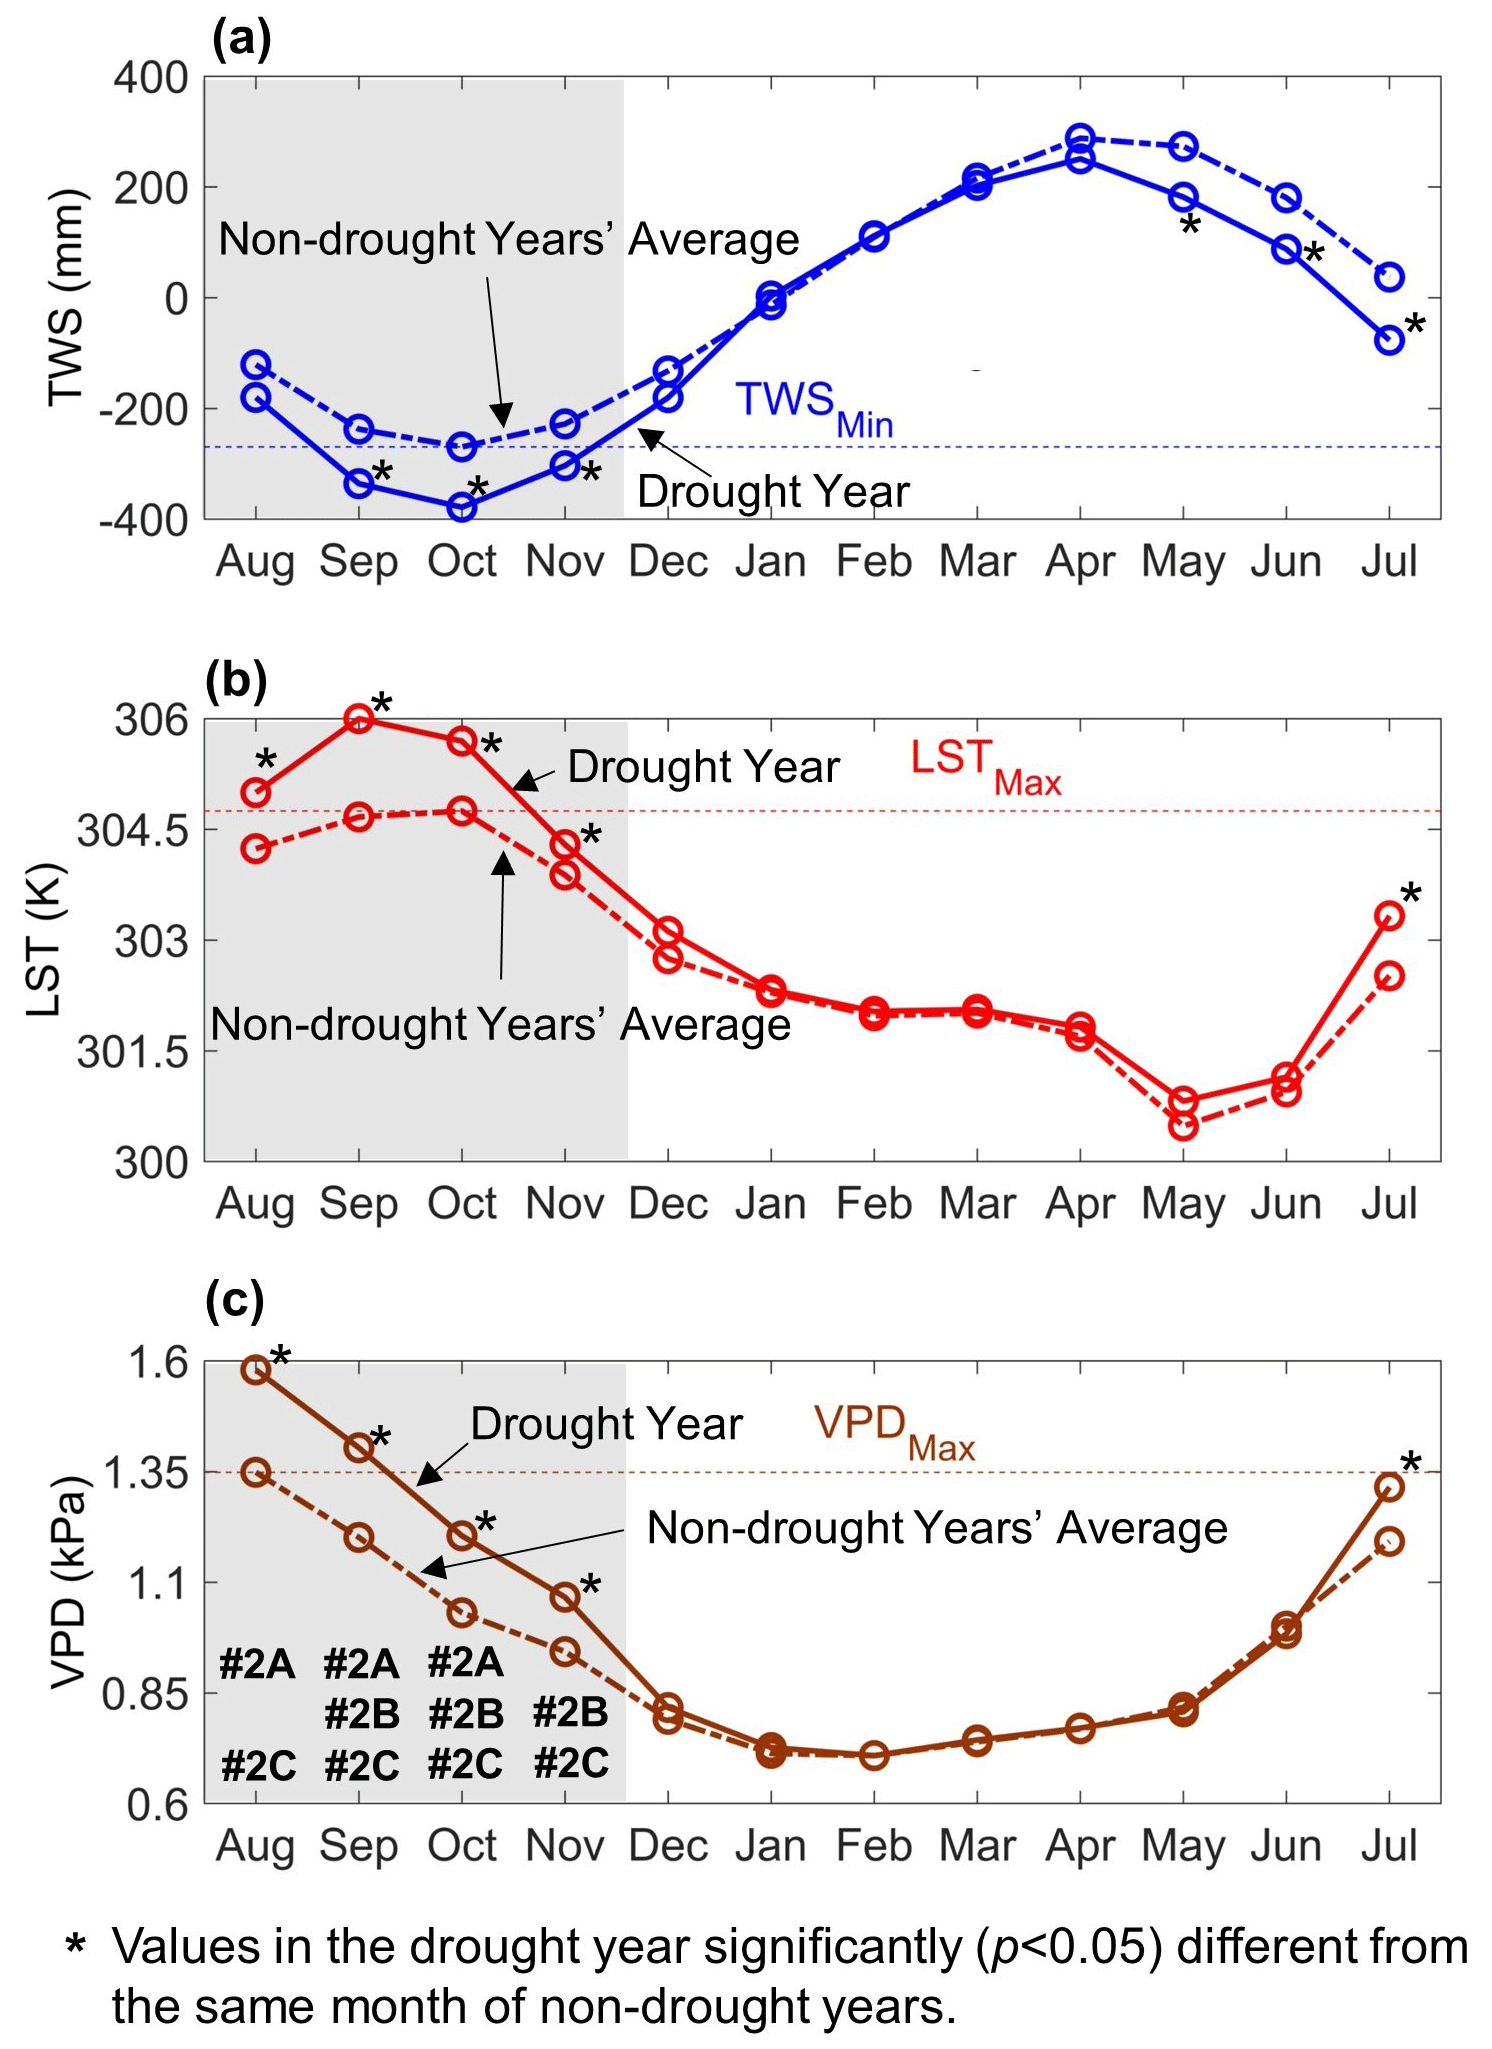
Figure 4Example illustrating (1) the difference between “significantly (p<0.05) different from the same months of non-drought years” and “beyond non-drought years' extreme values”, and (2) how to determine the hydrological and thermal conditions “exceeding normal ranges” in Approach #2A, #2B, and #2C, respectively. In (a), terrestrial water storage (TWS) values in the drought year are “significantly (p<0.05) different from the same months of non-drought years” for 6 months (i.e., September, October, November, May, June, and July), but “beyond non-drought years' extreme values” (i.e., TWS < TWSMin) for only 3 months (September, October and November). In (b) and (c) the same is shown for land surface temperature (LST) and vapor pressure deficit (VPD), respectively. The months marked as #2A in (c) are considered as “exceeding normal ranges” according to Approach #2A. Same for #2B and #2C, for their respective approaches, marked in (c).
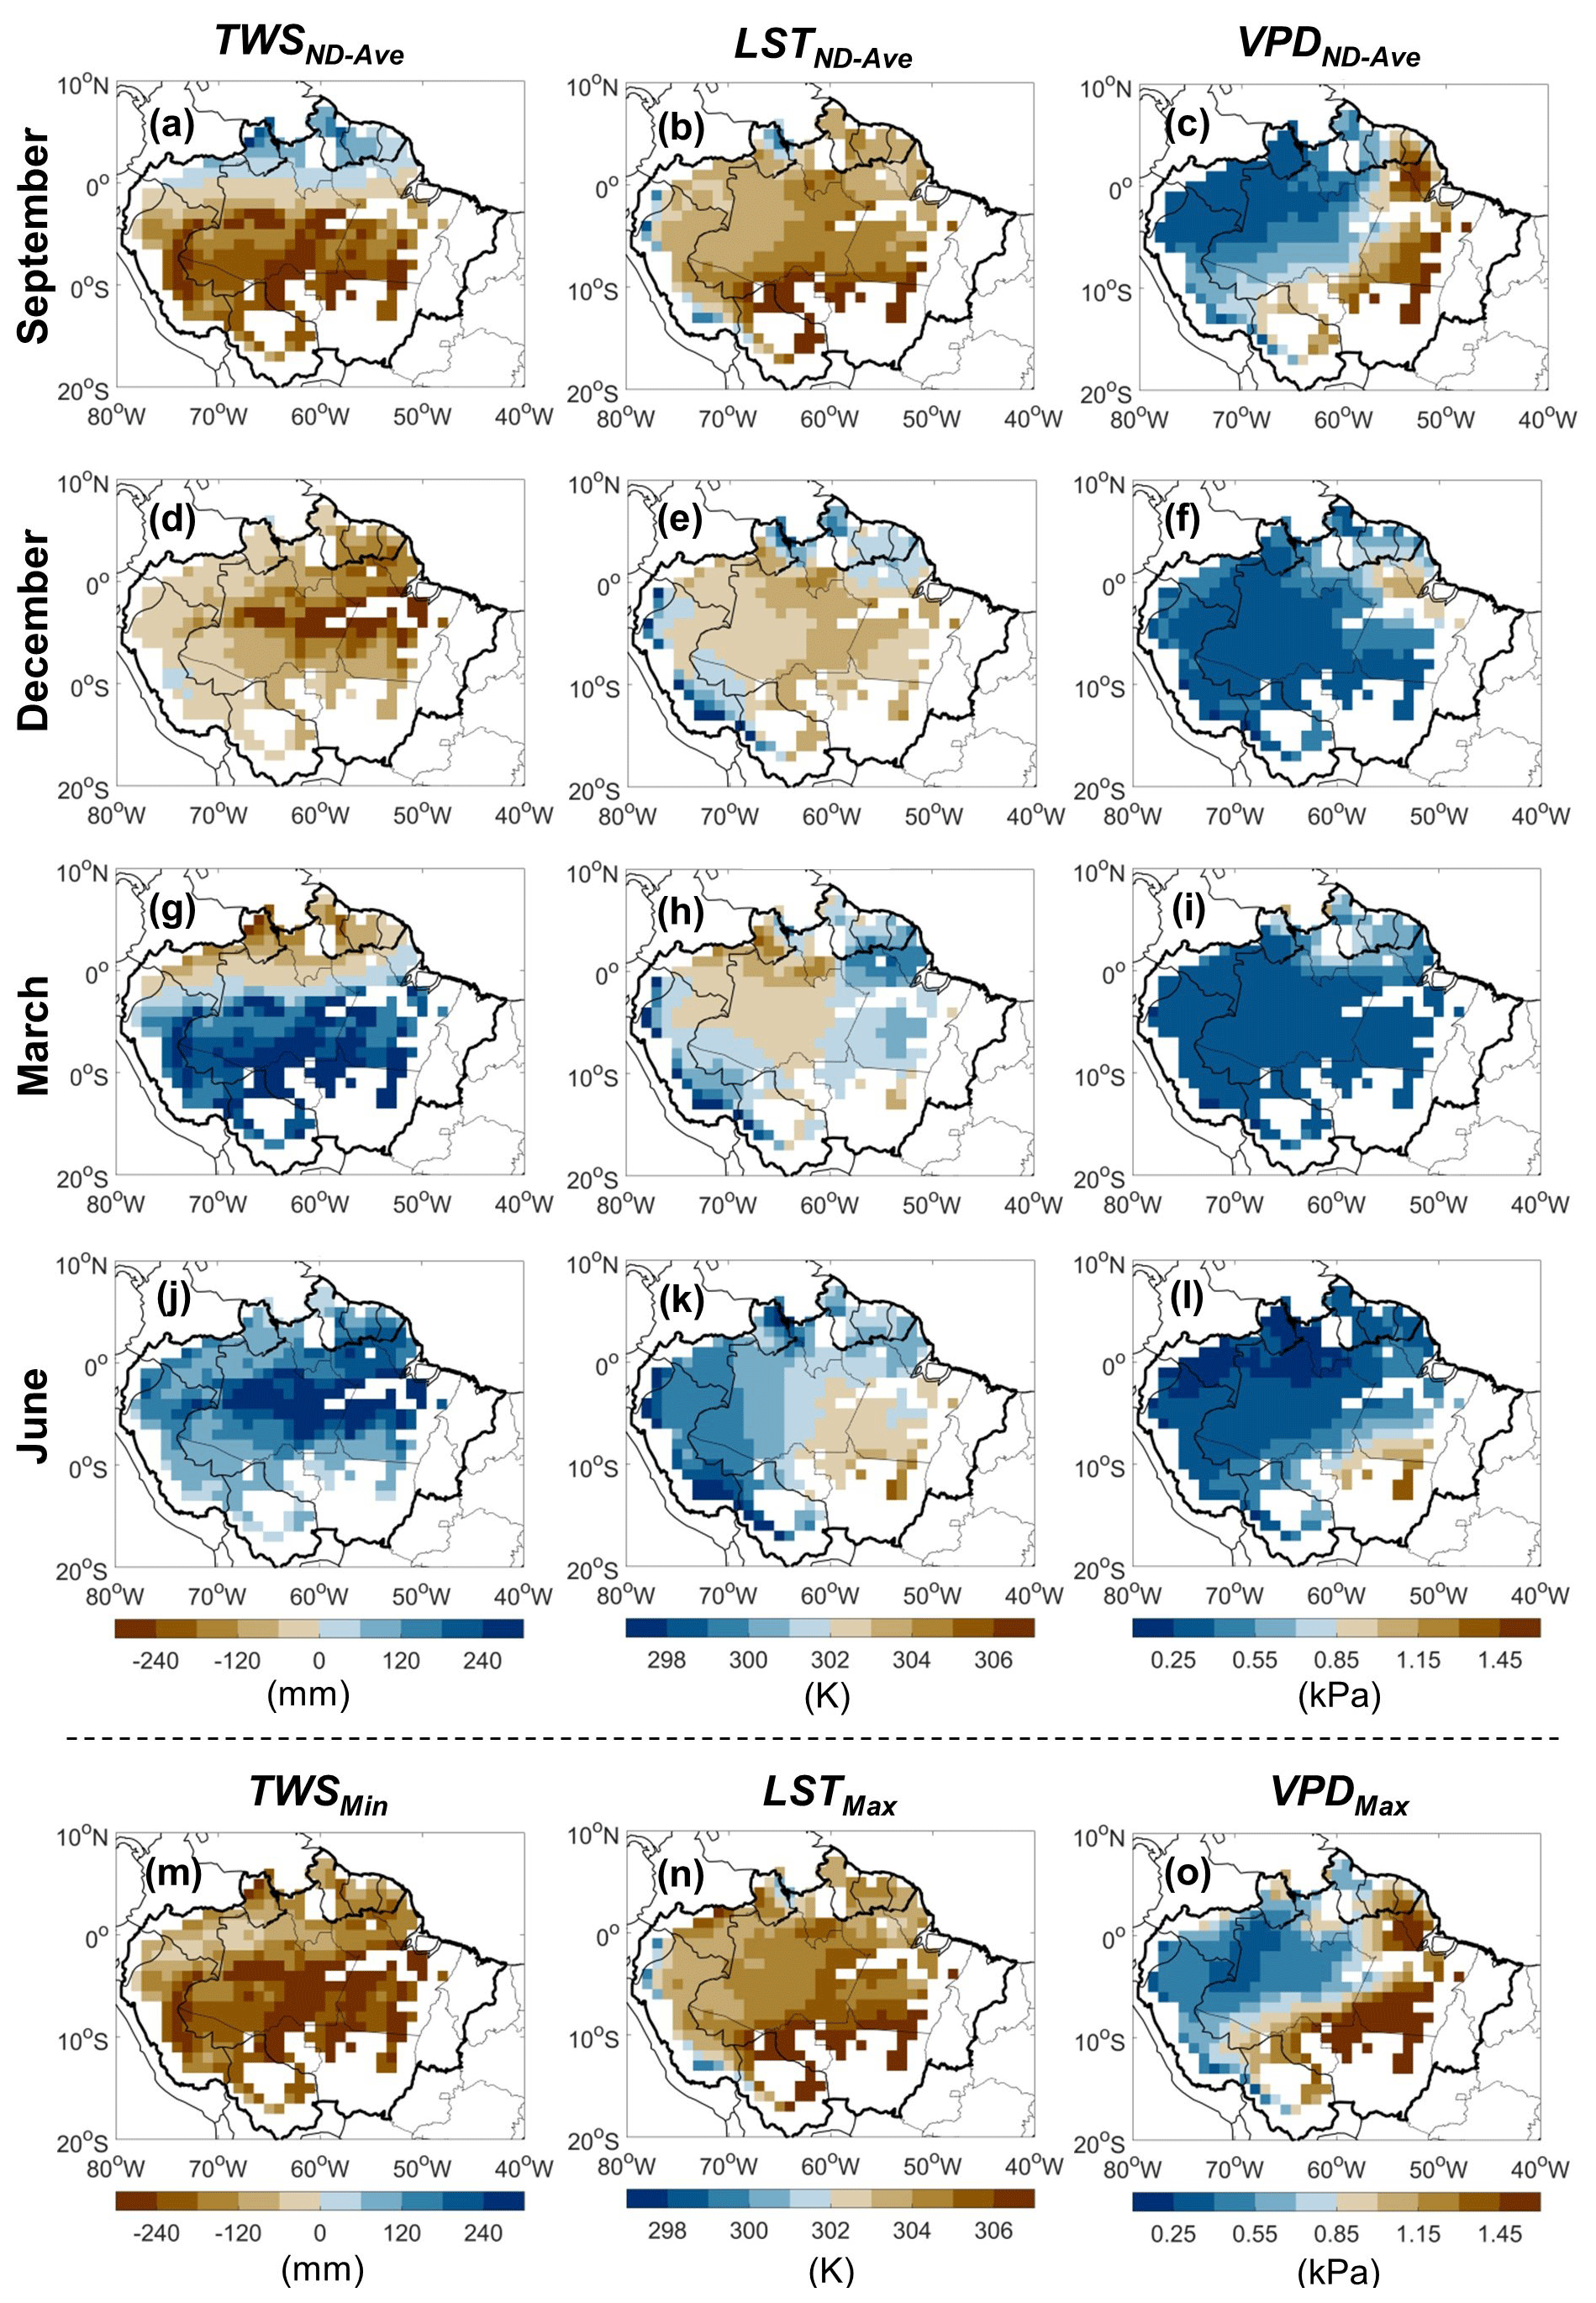
Figure 5Spatial distribution of monthly average of non-drought years (ND) and extreme value of non-drought years' average over the 1° grid cells with more than 80 % covered by evergreen broadleaf forests. Panels (a)–(l) provide the spatial distribution of the average values of non-drought years, i.e., TWSND-Ave, LSTND-Ave, and VPDND-Ave for September, December, March, and June, respectively. Panels (m)–(o) show the spatial distribution of TWSMin, LSTMax, and VPDMax, respectively.
We found strong spatial and seasonal variations in the TWS, LST, and VPD for non-drought years (Fig. 5). The minimum TWSND-Ave (i.e., TWSMin) was observed around September in the south of the Amazon, and from December to March in the north (Fig. 5m–o). The maximum LSTND-Ave (LSTMax) was observed around September for nearly all grid cells. Maximum VPD values (VPDMax) occurred around September in the southeast of the Amazon and from December to March for part of the northwest.
The greatest departures of monthly TWS, LST, and VPD during the 2015–2016 drought occurred in different months (Fig. 6). TWS declined throughout the first half of the drought (Fig. 6a). Regional mean TWS was slightly above non-drought years' average during the first 2 months due to the carryover of stored water from the wet preceding months (Fig. B1). TWS reached its lowest value in December 2015 and started to increase afterwards. Regional mean LST and VPD showed similar temporal dynamics (Fig. 6b and c). Both were higher than the non-drought years' average values throughout the full 12 months. The greatest LST and VPD anomaly departures occurred during Stage I (August to October 2015) and exceeded the “normal” range. They subsequently declined to within “normal” range during Stage II (November 2015 to February 2016) and moved closer to average values during Stage III (March to June 2016) before increasing again during Stage IV (July 2016).
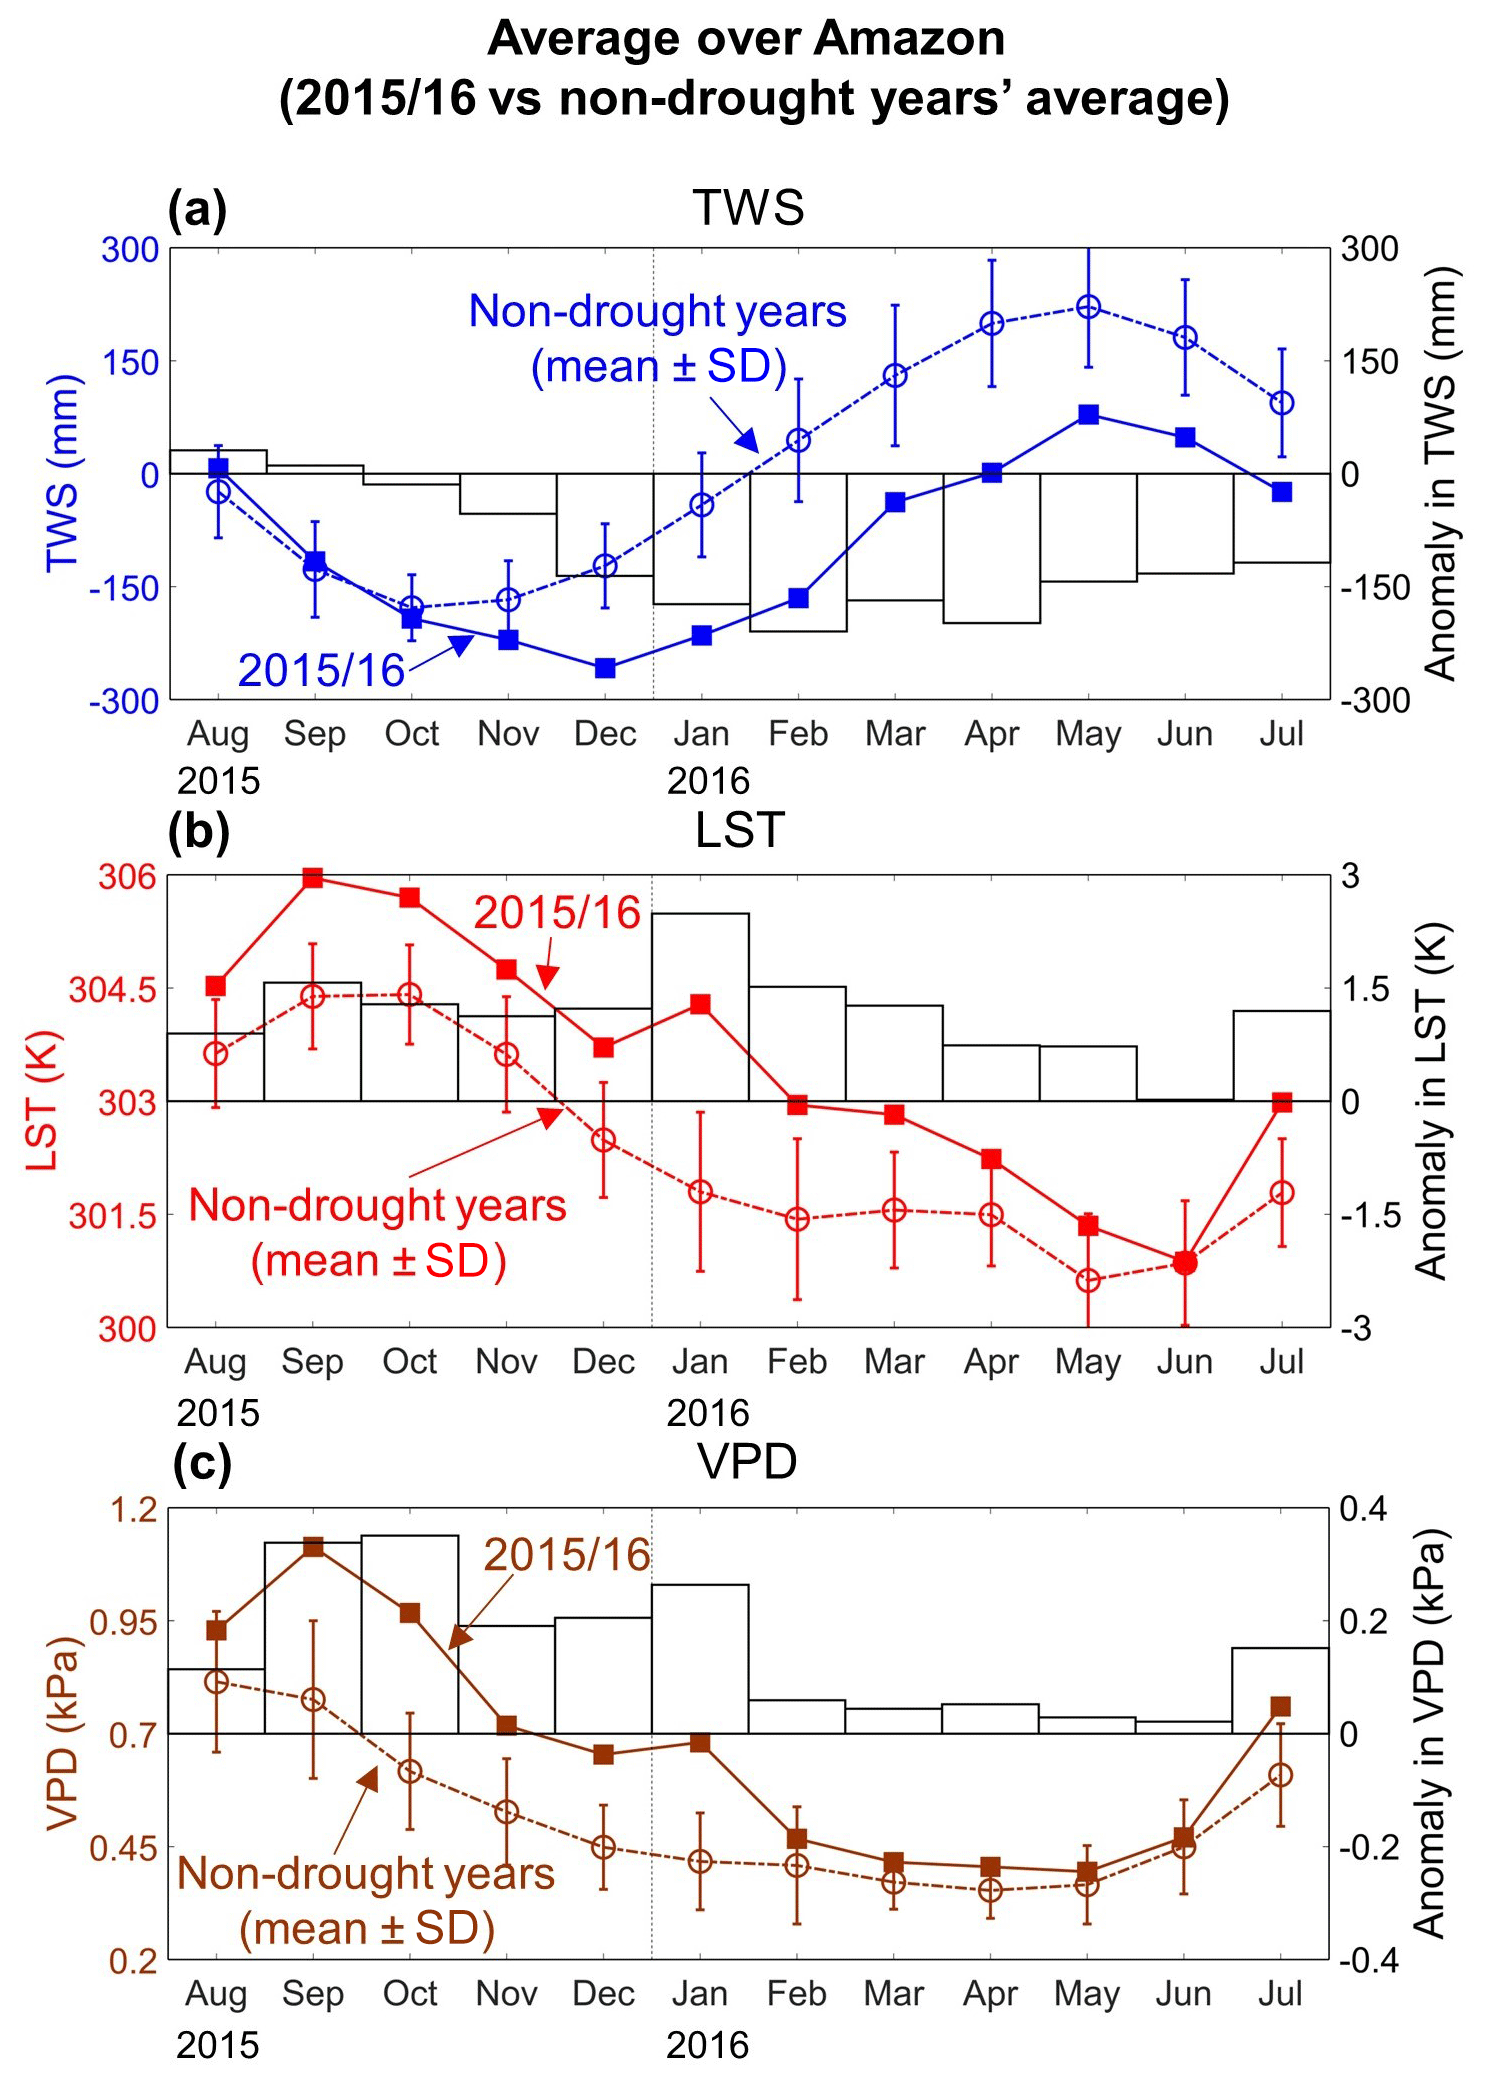
Figure 6Temporal patterns of terrestrial water storage (TWS), land surface temperature (LST), and vapor pressure deficit (VPD) anomalies during the 2015–2016 drought event. Panel (a) shows the regional average (i.e., average over all grid cells) TWS for each month from August 2015 to July 2016 as well as for the non-drought years' average (± standard deviation) (plot on left y axis) and differences between TWS values during 2015–2016 and non-drought years' average (bar on right y axis). It is noted that we first calculated the regional average TWS for each month from January 2003 through December 2016 and then derived non-drought years' average and standard deviation. Panels (b) and (c) are the same as (a), but for LST and VPD, respectively.
Grid cells and drought stages were identified where TWS, LST, and VPD were (1) “significantly (p<0.05) different from the same months of non-drought years” or (2) “beyond non-drought years' extreme values” of TWS, LST, and VPD (Fig. 7). During Stage I, LST exceeded LSTMax across the region, while VPD exceeded VPDMax over the central and northeast regions of the Amazon. Stage II showed strong anomalies in TWS, LST, and VPD, and all three were “beyond non-drought years' extreme values” in the north–central region. During Stage III, only a small area with TWS < TWSMin occurred in the northeast. During Stage IV, LST and VPD were “beyond non-drought years' extreme values” in the south of the Amazon. Thus, there was a gradual southwards movement of the regions “exceeding normal ranges”, from the northeast during August to October 2015, to the central–north during November 2015 to February 2016, and finally to the south by July 2016.
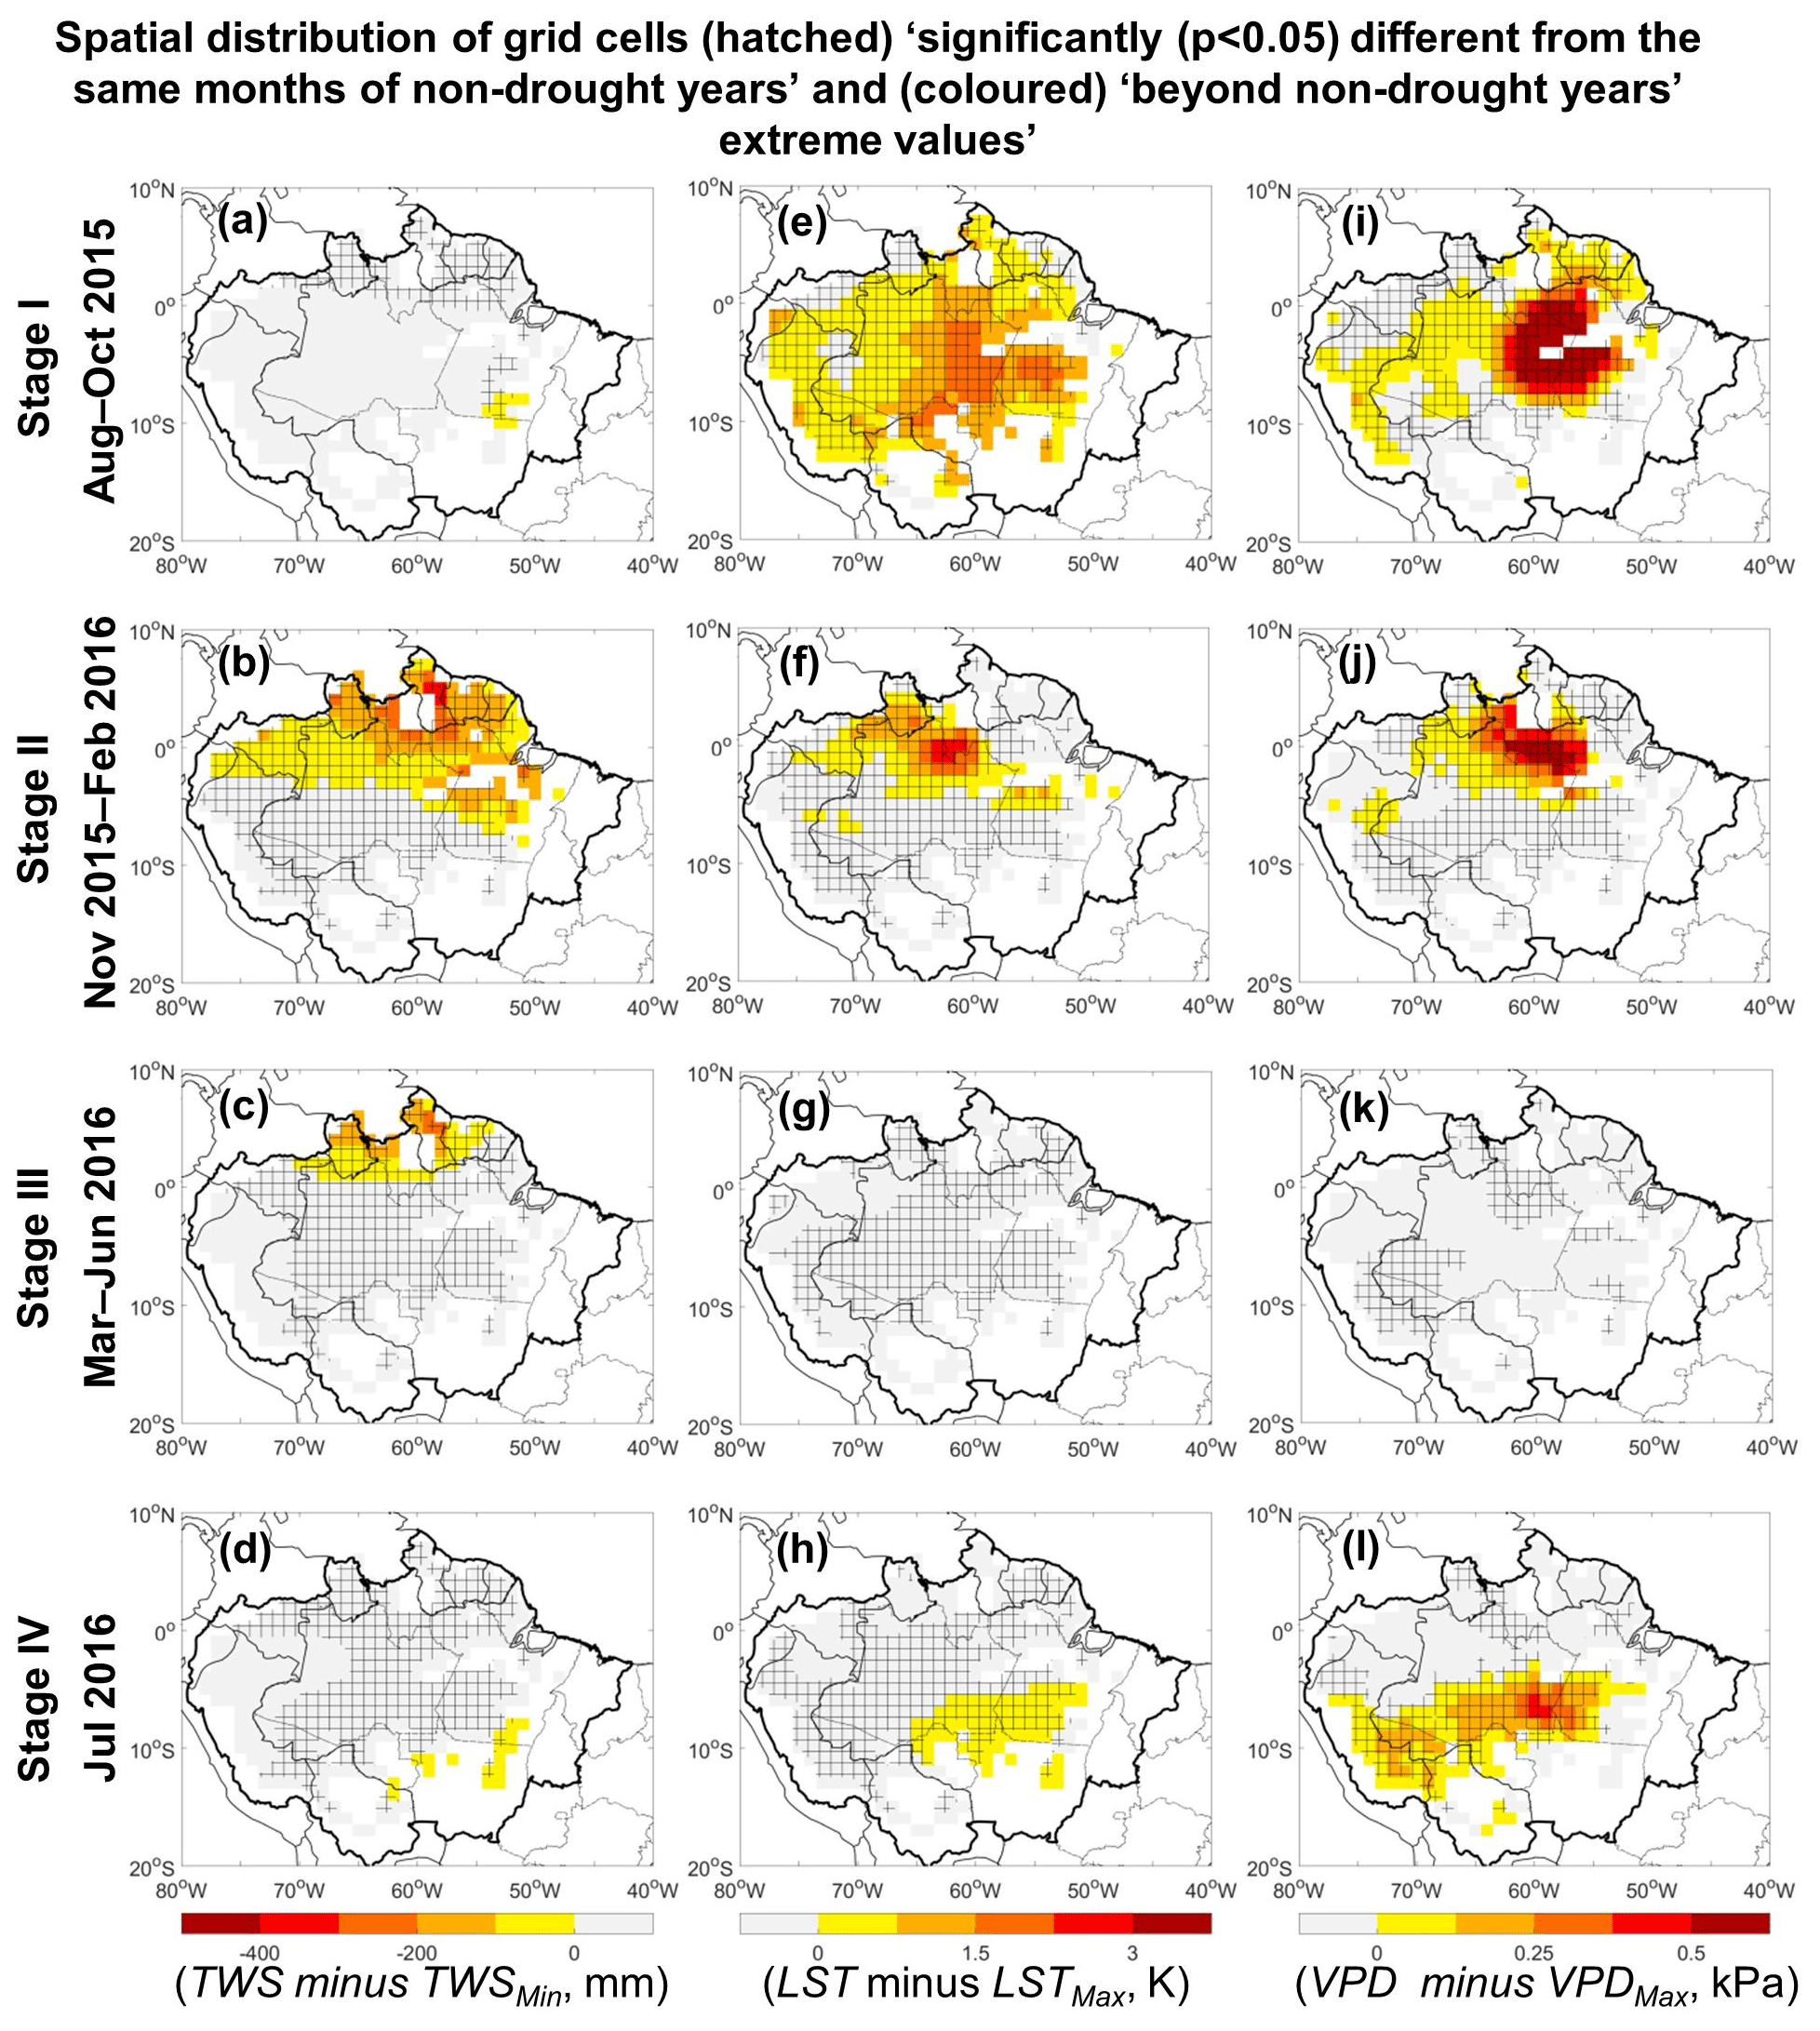
Figure 7Spatial distribution of terrestrial water storage (TWS), land surface temperature (LST), and vapor pressure deficit (VPD) anomalies for four stages over the 1° grid cells with more than 80 % covered by evergreen broadleaf forests. Colored grid cells denote TWS, LST, and VPD values are “beyond non-drought years' extreme values” (i.e., TWS < TWSMin or LST > LSTMax or VPD > VPDMax). Hatched grid cells mean they are statistically significantly (p<0.05) different from the same months of non-drought years.
Spatial distributions of predicted VI anomaly direction (derived from Approach #1, #2A, #2B, and #2C), as well as MODIS-observed VI anomaly direction for the four stages from August 2015 through July 2016, are shown in Fig. 8. Their spatial agreements ( %) are shown in Table 2. When compared with Approach #1, all three #2 approaches have better spatial agreement with MODIS observations, with the best performance derived from Approach #2C. When we replaced TWS with a soil water product from ERA5-Land and performed the same analysis, similar results were obtained (Tables 2 and 3). This suggests that the choice of “wetness” product does not essentially change the results of this study, which further demonstrates the robustness of the “exceeding normal ranges”-based method developed in this study.
Table 2Spatial agreement (%) between predicted VI anomaly direction derived from different approaches and MODIS-observed VI anomaly direction. There are 390 1° grid cells over the Amazon with more than 80 % covered by evergreen broadleaf forests considered in these statistics.
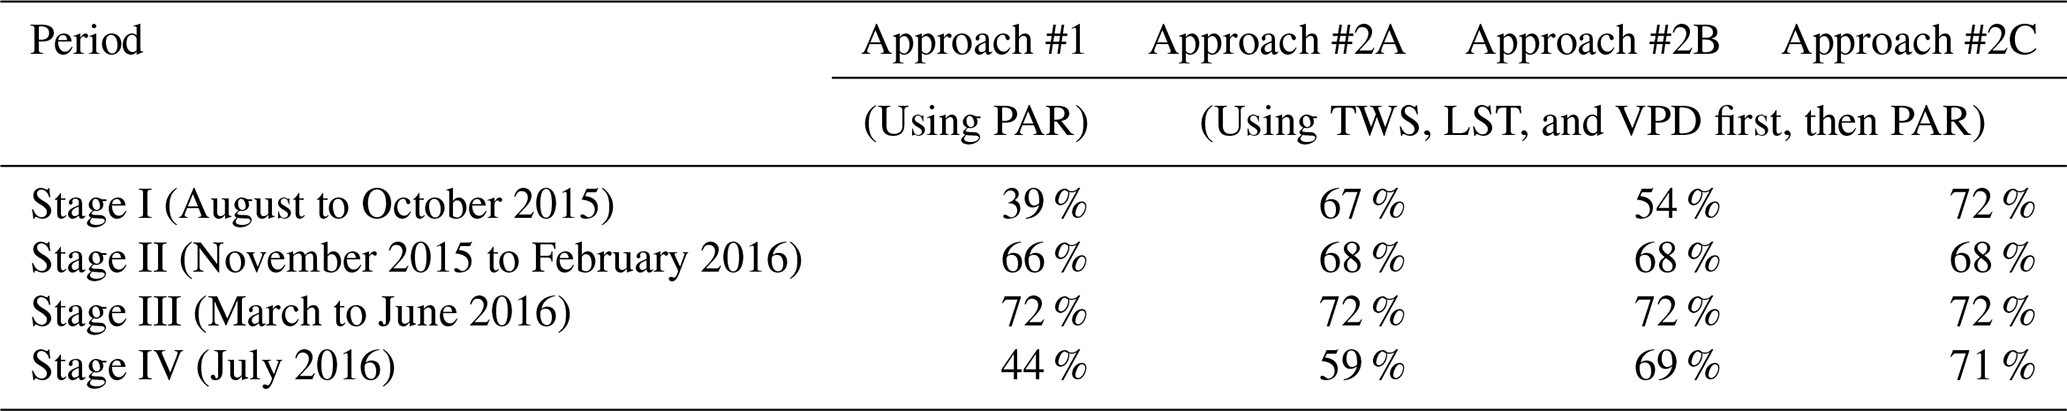
Table 3Spatial agreement (%) between predicted VI anomaly direction derived from different approaches and MODIS-observed VI anomaly direction. Same as Table 2, but TWS was replaced by soil water.
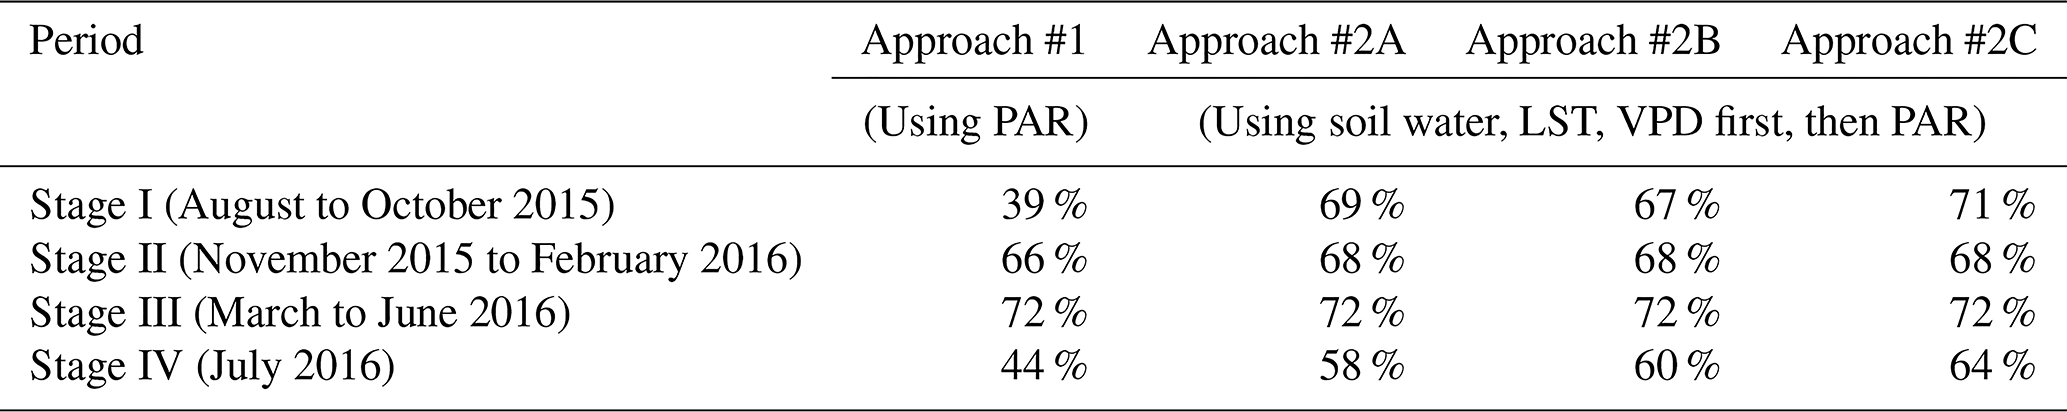

Figure 8Spatial distributions of predicted VI anomaly direction from Approach #1, #2A, #2B, and #2C (first to fourth columns), respectively, and MODIS-observed VI anomaly direction (fifth column) for the four stages from August 2015 through July 2016.
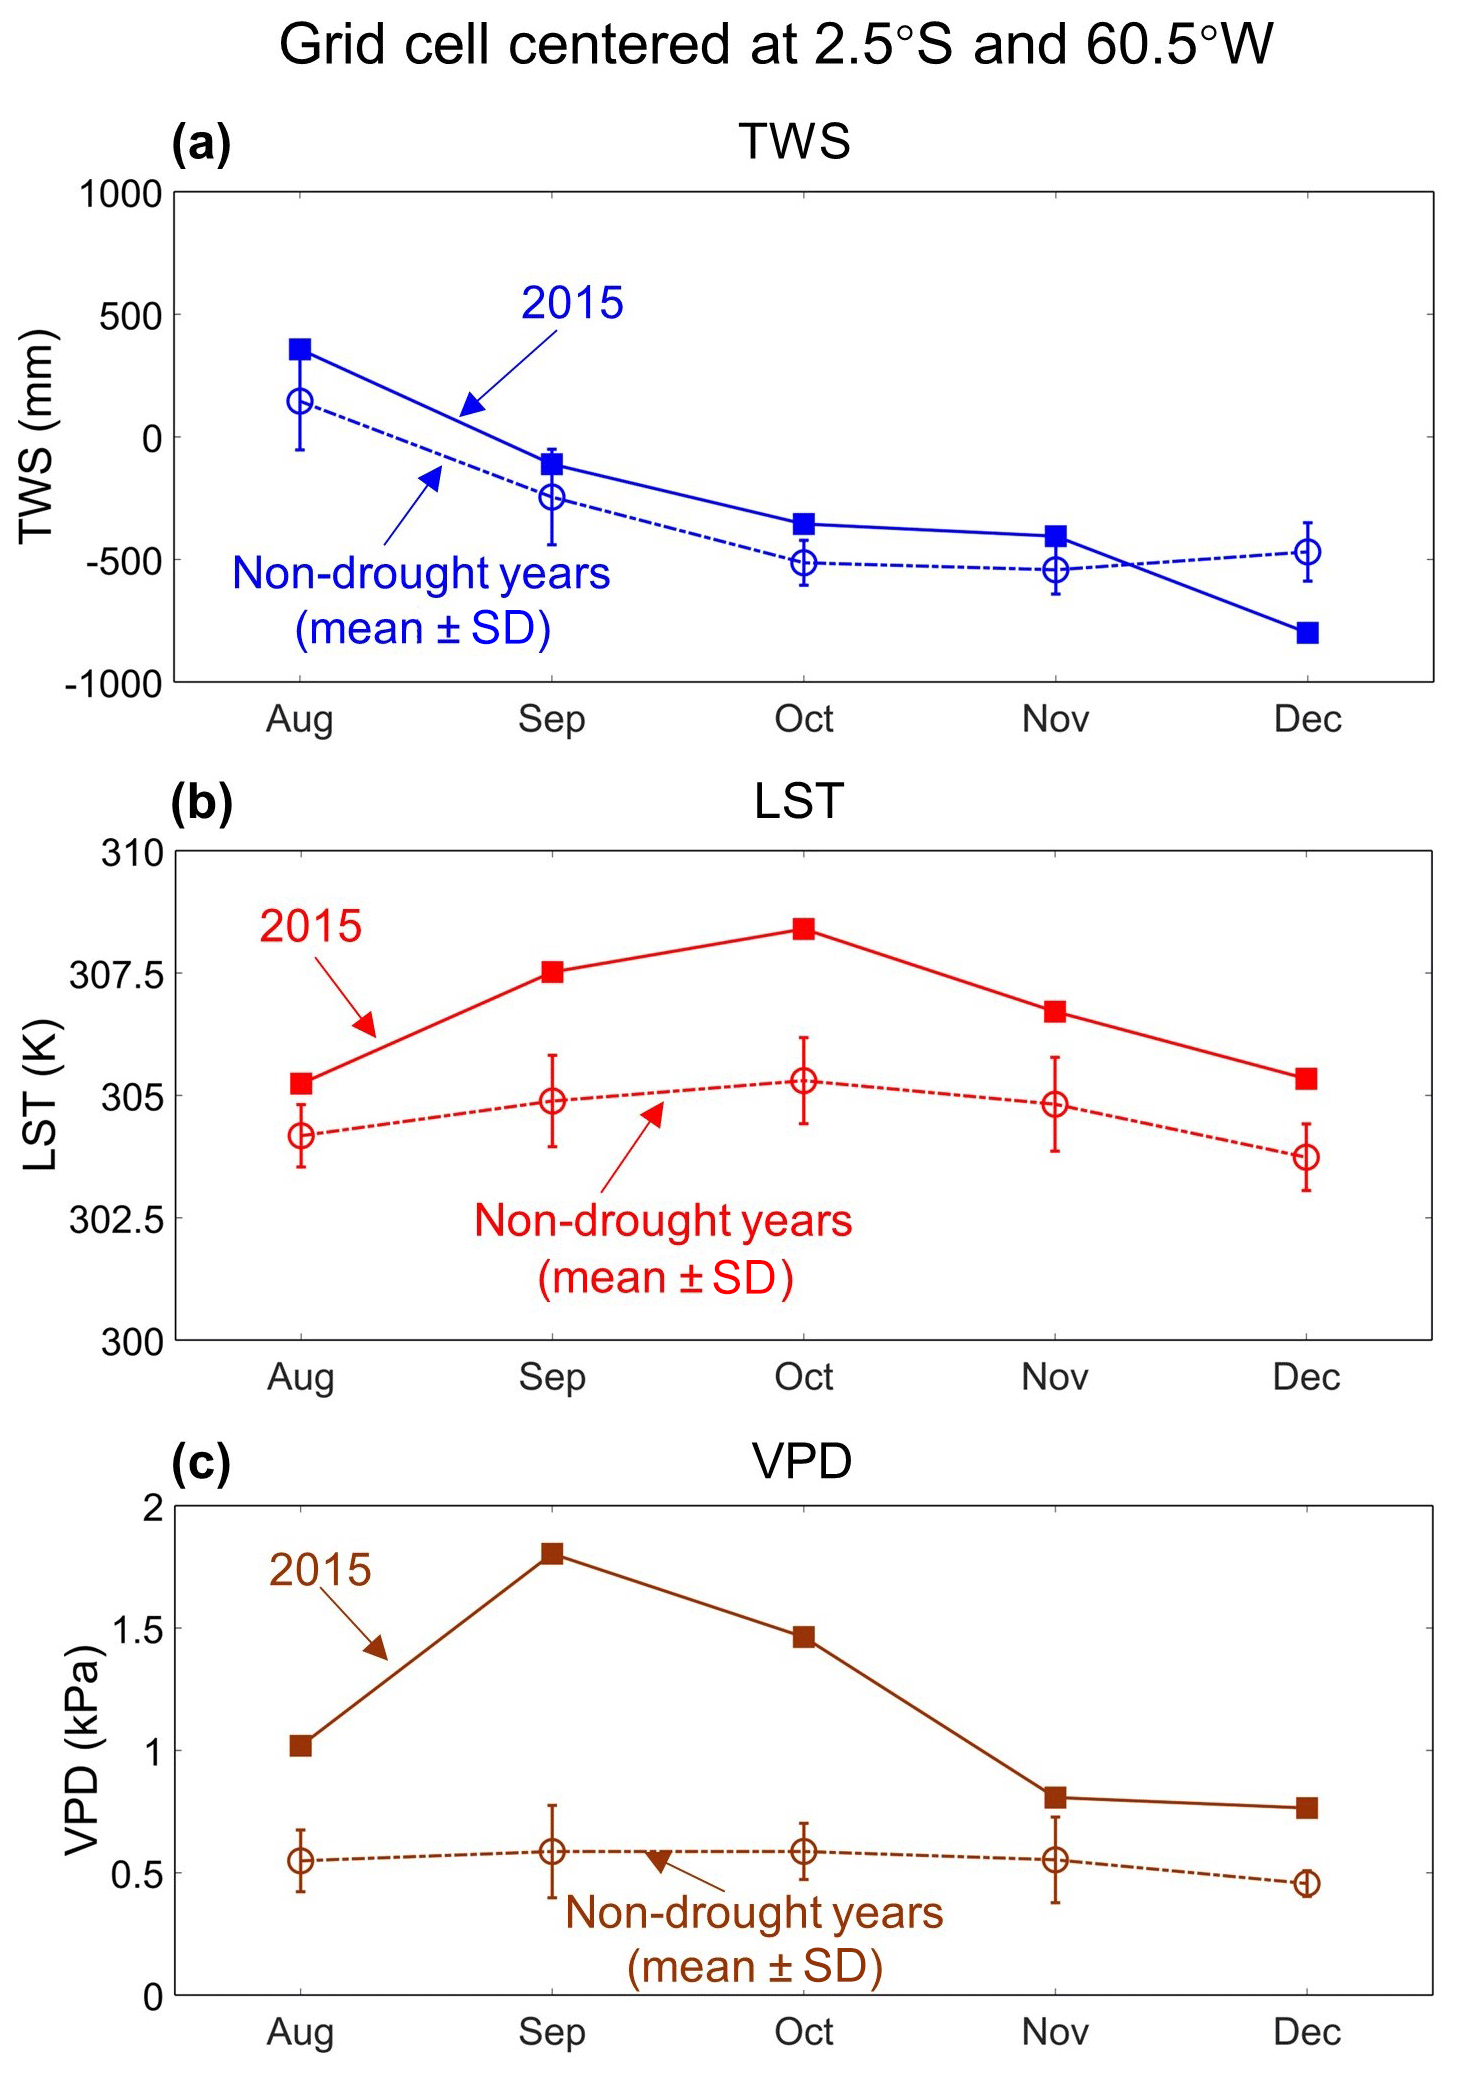
Figure 9Temporal patterns of terrestrial water storage (TWS), land surface temperature (LST), and vapor pressure deficit (VPD) anomalies during August to December 2015 for the 1° grid cell centered at 2.5° S, 60.5° W. Panel (a) shows TWS for each month from August to December 2015 as well as for the non-drought years' average (± standard deviation). Panels (b) and (c) are the same as (a), but for LST and VPD, respectively.
The spatiotemporal patterns of the canopy greenness anomaly during the 2015–2016 drought discussed herein agree well with other independent satellite- and field-based vegetation observations. From the perspective of satellite observations, Koren et al. (2018) used the newly developed satellite-based sun-induced fluorescence (SIF) product (2007–2016) to examine the impact of the 2015–2016 Amazon drought. Temporally, it was found that the regional mean SIF was below its climatological average at the beginning and end of the drought, but above the average in the first half of 2016. Spatially, the eastern part of the Amazon experienced much larger reductions in SIF than the western part. Petchiappan et al. (2022) used the Advanced Scatterometer (ASCAT) backscatter (2007–2016) and found large-scale negative anomalies in backscatter over the Amazon rainforest and savannah in late 2015, with a stronger magnitude over the eastern part of the region. From the perspective of field measurements, Santos et al. (2018) measured leaf gas exchange, chlorophyll, and nutrient content in canopy leaves in the central Amazon throughout 2015 and during the dry season of 2016. They found that, during the extremely dry season of 2015 under conditions of extremely high LST and VPD, the light-saturated photosynthetic rate decreased 28 % relative to other 2015 seasons and the dry season of 2016. However, with precipitation returning after the dry season of 2015, the photosynthetic rate increased to “normal” conditions again. Meanwhile, massively new leaf flushing occurred, leading to above-average canopy greenness in the first half of 2016 (Gonçalves et al., 2020). As for the possible causes for the quick recovery of the photosynthetic rate, Santos et al. (2018) found that the photosynthesis reduction under extreme drought and high temperature in the 2015 dry season was primarily due to stomatal closure, which can reverse when water becomes available.
Findings from field measurements also support our TWS-, LST-, and VPD-based threshold approach, developed herein, during the 2015–2016 Amazon drought. Fontes et al. (2018) found that leaf and xylem safety margins (LXSMs) of central Amazonian trees showed a sharp drop in the months with unusually high canopy temperature and VPD from August to December 2015. LXSMs were significantly negatively (p<0.05) correlated with VPD, but not with soil water storage. Moreover, the high values of predawn leaf water potential from 2015 through 2017 suggested that soil water supply was not limiting during their study period. These results indicate that the atmospheric demand could be the main driver for decreasing plants' LXSMs. We examined the anomalies of TWS, LST, and VPD over Fontes' grid cell for the same period (August to December 2015) (Fig. 9). Strong positive anomalies in LST and VPD agree with the field measurements in Fontes et al. (2018). Moreover, TWS from August to November 2015 was higher than in the same months of non-drought years, suggesting that sufficient soil water was available during this period.
Our “exceeding normal ranges”-based method developed herein can help resolve the debate around greenness anomalies in the dry season (July to September) of the 2005 drought (Saleska et al., 2007; Samanta et al., 2010). When we examined the MODIS-observed VI anomalies from May to October over the southern Amazon, both 2005 and 2010 witnessed a two-stage process: positive VI anomalies followed by negative VI anomalies (Fig. 10a and d). According to our method, the number of grid cells “exceeding normal ranges” was very low in May, June, and July of both years (Fig. 10b and e), which means VI anomalies were primarily driven by PAR anomalies (Fig. 10c and f). Therefore, positive VI anomalies were observed during these months, with the strongest positive VI anomalies found in May 2005. With the progress of droughts, more than 50 % of southern Amazon was found “exceeding normal ranges” in August, September, and October 2005, while this number was greater than 75 % in 2010. Therefore, stronger negative VI anomalies were observed in August, September, and October 2010, irrespective of radiation anomalies. When calculating the average VI anomalies for the transition months from positive to negative VI anomalies (i.e., average over July to September), we are very likely to obtain positive VI anomalies in 2005 but negative VI anomalies in 2010. Our results suggest that examining the hydrological, thermal, and radiation conditions from the onset to the termination of droughts will enable us to better understand the responses of the Amazon rainforest.
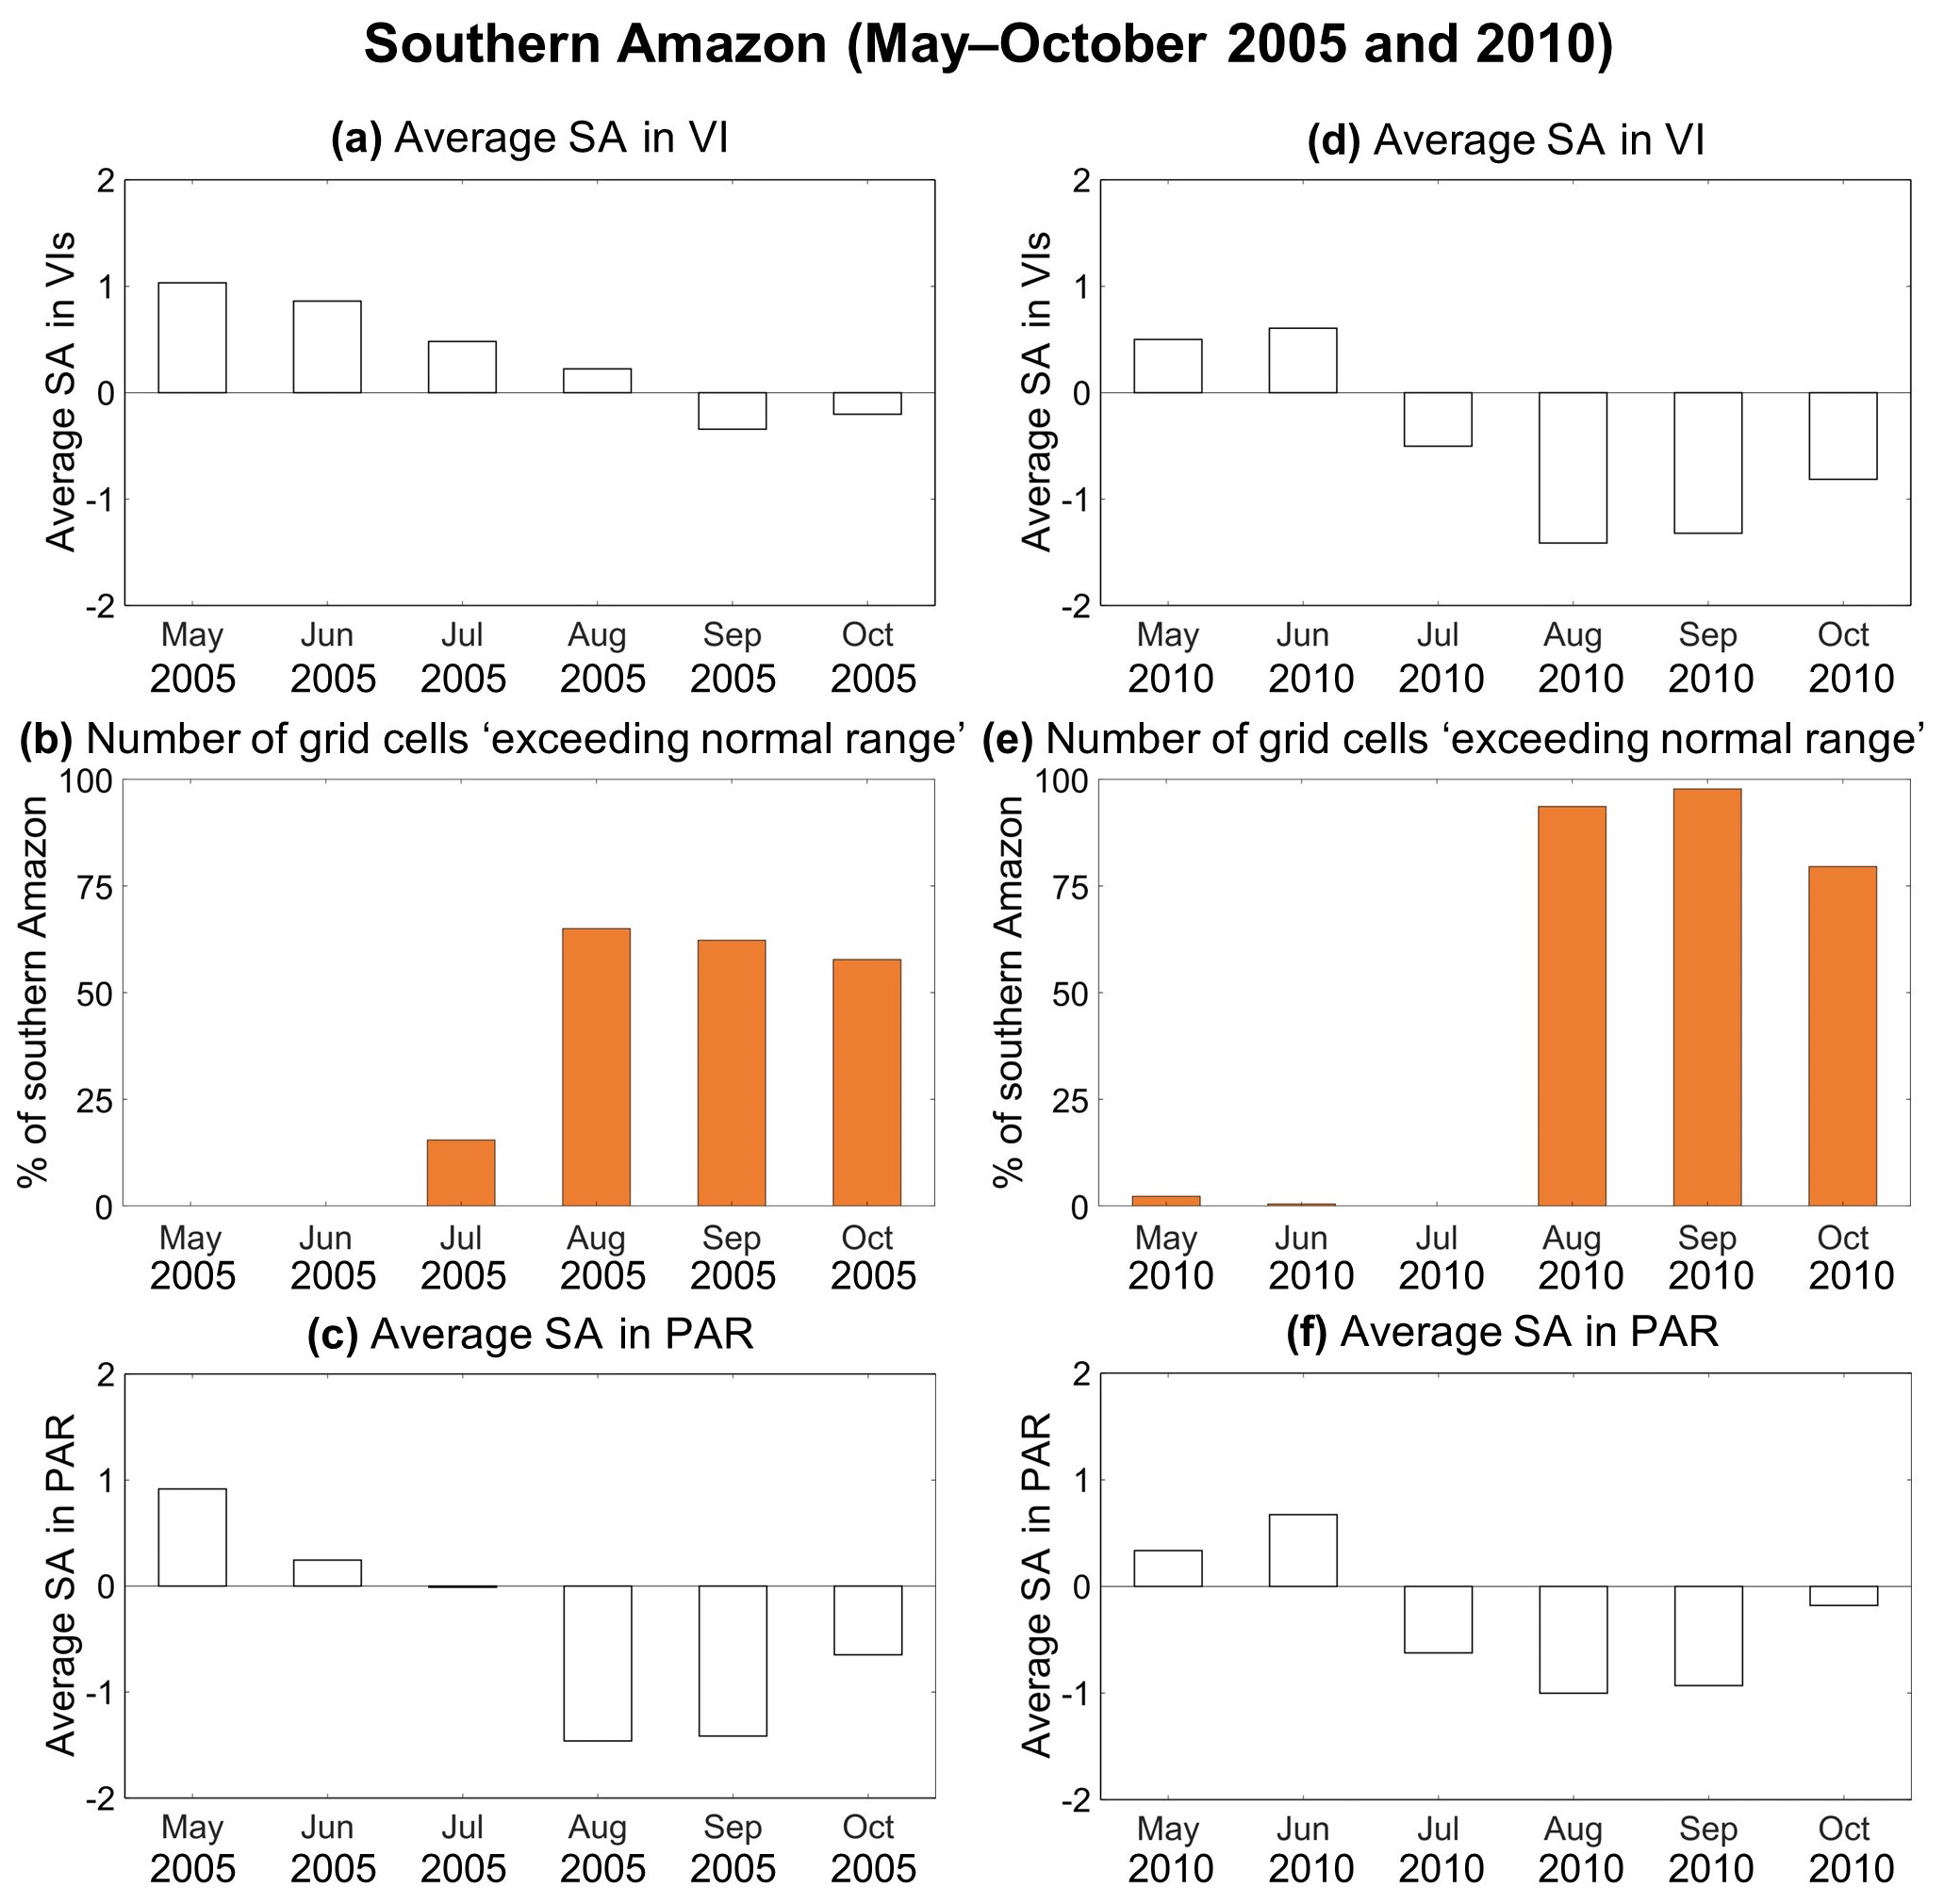
Figure 10Temporal patterns of (a) standardized anomalies in vegetation indices (VIs), (b) percentage of rainforest “exceeding normal ranges” according to Approach #2C, and (c) standardized anomalies in photosynthetically active radiation (PAR) from May to October in 2005 over the southern Amazon. Panels (d)–(f) same as (a)–(c), but for the year 2010.
The spatiotemporal analysis approach developed here shows both similarities and differences with the maximum climatological water deficit (MCWD) approach commonly used to characterize water stress during droughts at large scale across Amazon rainforest (Aragão et al., 2007; Lewis et al., 2011; Aragão et al., 2018). An important difference is that MCWD is calculated using a simple bucket model approach, with a running water balance from monthly precipitation and an assumed constant actual evapotranspiration of 100 mm per month (da Rocha et al., 2004; Guan et al., 2015; Maeda et al., 2017). It makes no assumption of soil water storage in calculating a water “deficit”. When monthly precipitation is below 100 mm, the calculated water deficit of that month is the difference between precipitation and evapotranspiration (negative value). When monthly precipitation is above 100 mm, water deficit of that month is calculated as the difference between precipitation and evapotranspiration (positive value) plus the water deficit of the previous month; if this sum is above zero, it is set to zero. Accordingly, calculated in this way without any soil water storage term (Meir et al., 2015), the water deficit can become a very strongly negative value when precipitation is below 100 mm for several months in a row. The MCWD corresponds to the maximum value of the water deficit reached for a grid cell within the year. The MCWD anomaly, i.e., the difference in MCWD between drought and non-drought years, is used to characterize the severity of water stress. The MCWD approach is therefore a measure of deficit in the water “flux” during the drought year, i.e., how much less water falls into the soil consecutively over time, whereas the method we present here focuses on the water storage “status” at monthly to seasonal timescales, i.e., when and where the water storage is below the minimum level of non-drought years. These two approaches provide complementary information. To illustrate the differences that arise from the two approaches, we calculated the MCWD anomaly over the Amazon for the 2015–2016 drought year following Aragão et al. (2007) (Fig. C1). The strongest calculated MCWD anomaly occurred over the north–central Amazon, which agrees with the location of anomalies in our observation-based water availability data (TWS < TWSMin) during stages II and III (Fig. 7). Considering both fully independent information sources together provides corroborating evidence and supports a more robust characterization of water availability during drought. A further difference is that we also took LST and VPD conditions into account. We identified regions where high LST and VPD, rather than a water deficit per se, appeared to be the main drivers associated with below-average canopy greenness during stages I and IV (Fig. 7).
Our results demonstrate that comparing values of TWS, LST, and VPD to their non-drought years' ranges can help delineate the most likely drought-affected regions and explain spatiotemporal patterns in greenness anomalies. There are several caveats to the method and data used, and these may be responsible for some of the remaining 30 % of unexplained greenness anomalies. Firstly, each of the datasets used has its uncertainties. These definitely include uncertainties in vegetation indices due to sun–target–sensor geometry and atmospheric effects, but also uncertainties in the other data used. Secondly, we used the range of TWS, LST, and VPD in non-drought years as an estimate of the tolerance thresholds of the rainforest. This is a simplified representation, as a sharp threshold is not to be expected given the ecological and physiographic complexity of the large areas covered by each grid cell. It is also possible that the observed non-drought years' ranges of variables were exceeded without, in fact, exceeding physiological and ecological tolerance thresholds in the vegetation. In that case, for example, higher VPD would act to enhance rather than limit photosynthesis and lead to above- rather than below-average greenness. Thirdly, additional local factors controlling greenness may not be captured in the satellite and reanalysis data record. Finally, the non-drought years' range defined here is based on a relatively short record in relation to the effect of the lifespan of the dominant rainforest vegetation and how natural selection may act to alter the related ecological thresholds, so this “normal” range should be considered a qualitative estimate. With the availability of longer and more reliable satellite records, along with increasing ground-based observations, it should become possible to develop a more sophisticated approach to quantify, predict, and interpret the response of the Amazon rainforest to combined water, heat, and radiation conditions during future droughts.
We developed a “normal” range-based approach to delineate the regions where the normal hydrological and thermal ranges during non-drought years were exceeded during the 2015–2016 Amazon drought, focusing on three variables: terrestrial water storage, land surface temperature, and atmospheric moisture demand records covering 2003–2016. We found a gradual southwards shift in these regions from (1) the northeastern Amazon during August to October 2015, mainly due to high temperatures and high atmospheric moisture demand, to (2) the north–central Amazon during November 2015 to February 2016 where soil water deficit, high temperatures, and high atmospheric moisture demand co-existed simultaneously, and to (3) the southern Amazon in July 2016, caused by high temperatures and high atmospheric moisture demand again. Within these regions, most grid cells were characterized by negative greenness anomalies determined from the MODIS vegetation index. Outside of these regions, greenness anomalies and radiation anomalies were generally in phase, which is expected to occur under normal conditions. Combined, drought impact and radiation anomalies can explain more than 70 % of the observed fluctuation pattern in the regional greenness, i.e., negative greenness anomalies during the onset and end of the drought but positive anomalies during the intervening months. These results suggest that our method of combining water storage, temperature, and atmospheric moisture demand together can reasonably identify the most likely drought-affected regions at monthly to seasonal timescales during an event such as the 2015–2016 El Niño–Southern Oscillation. Our analysis also highlights the necessity of considering whether the long-term normal hydrological and thermal ranges were exceeded when interpreting the response of the Amazon rainforest to droughts in the future.
We gap-filled the missing values in the original terrestrial water storage (TWS) dataset over the Amazon individually for each 1° spatial resolution grid cell. A time series of monthly precipitation (P), photosynthetically active radiation (PAR), and original terrestrial water storage (TWS) from January 2003 through December 2016 for an example grid cell from the southern Amazon is shown in Fig. A1. There are 168 months in total for this 14-year period and TWS values are missing for 21 months. The gap-filling of missing TWS values is based on the principle that the change in TWS (i.e., time step t minus time step t−1) is highly related with P and PAR at the time step t. Here a multiple linear regression equation is used to establish the relationship of these variables for each grid cell:
There are 131 valid values of “change in TWS” for the example grid cell (i.e., N=131). By fitting the multiple linear equation, the values for parameters a, b, and c are 0.47, −0.48, and −41.5, respectively, with the resulting correlation coefficient (R) of 0.89 and root mean square error (RMSE) of 34.8 mm (Fig. A2a). After moving the term TWS(t−1) to the right of the equation, we can compare the observed TWS (i.e., TWS(t)) with the estimated TWS based on P(t), PAR(t), and TWS(t−1) (see Fig. A2b). The R and RMSE values between them are 0.98 and 32.5 mm, respectively. The missing TWS values at time step t can then be estimated according to the formula , and the gap-filled TWS time series is shown in Fig. A2c. Our approach is able to estimate and gap-fill the maximum and minimum monthly value of a year (e.g., in 2013, 2015, and 2016), which is difficult for a linear interpolation approach.
When we applied this gap-filling approach to each grid cell over the Amazon rainforest independently, the estimated TWS values that we obtained were highly correlated with observed TWS, with R values higher than 0.90 over 90 % and higher than 0.8 over 99 % of the Amazon region (Fig. A3a). For the RMSE between observed and estimated TWS, one-third of the Amazon has a value below 40 mm and two-thirds below 50 mm (Fig. A3b). Higher RMSE values are found along the major rivers where the dynamic ranges of TWS are also higher (Fig. A3b and c). Overall, the estimated TWS values for the missing time steps, based on P, PAR, and observed TWS from the previous time step, are reasonable.

Figure A1Example illustrating the monthly time series of (a) precipitation (P), photosynthetically active radiation (PAR), and (b) original terrestrial water storage (TWS) from January 2003 through December 2016 for the grid cell centered at 7.5° S and 55.5° W. Over this 168-month period, TWS values are missing for 21 months (the longest gap is 3 months), while no P or PAR are missing.

Figure A2Panel (a) is a scatterplot of observed TWS (y axis) and estimated TWS (x axis) according to P, PAR, and observed TWS from the previous time step. Panel (b) shows a time series of gap-filled TWS by combining observed TWS and estimated TWS.

Figure A3Spatial distribution of (a) R and (b) RMSE between observed TWS and estimated TWS, as shown in Fig. A2a, and (c) standard deviation value of monthly TWS from 2003 to 2016, over 1° grid cells having more than 80 % of 0.05° IGBP grid cells classified as “evergreen broadleaf forests”.

Figure B1Spatial distribution of anomaly in precipitation and TWS during (a, b) May to July 2015, (c, d) August 2015, (e, f) September 2015, and (g, h) October 2015, respectively. It can be seen that although precipitation was below average during August to October 2015, above-average TWS was still observed over the western Amazon due to the carryover effect of above-average TWS from May to July 2015.
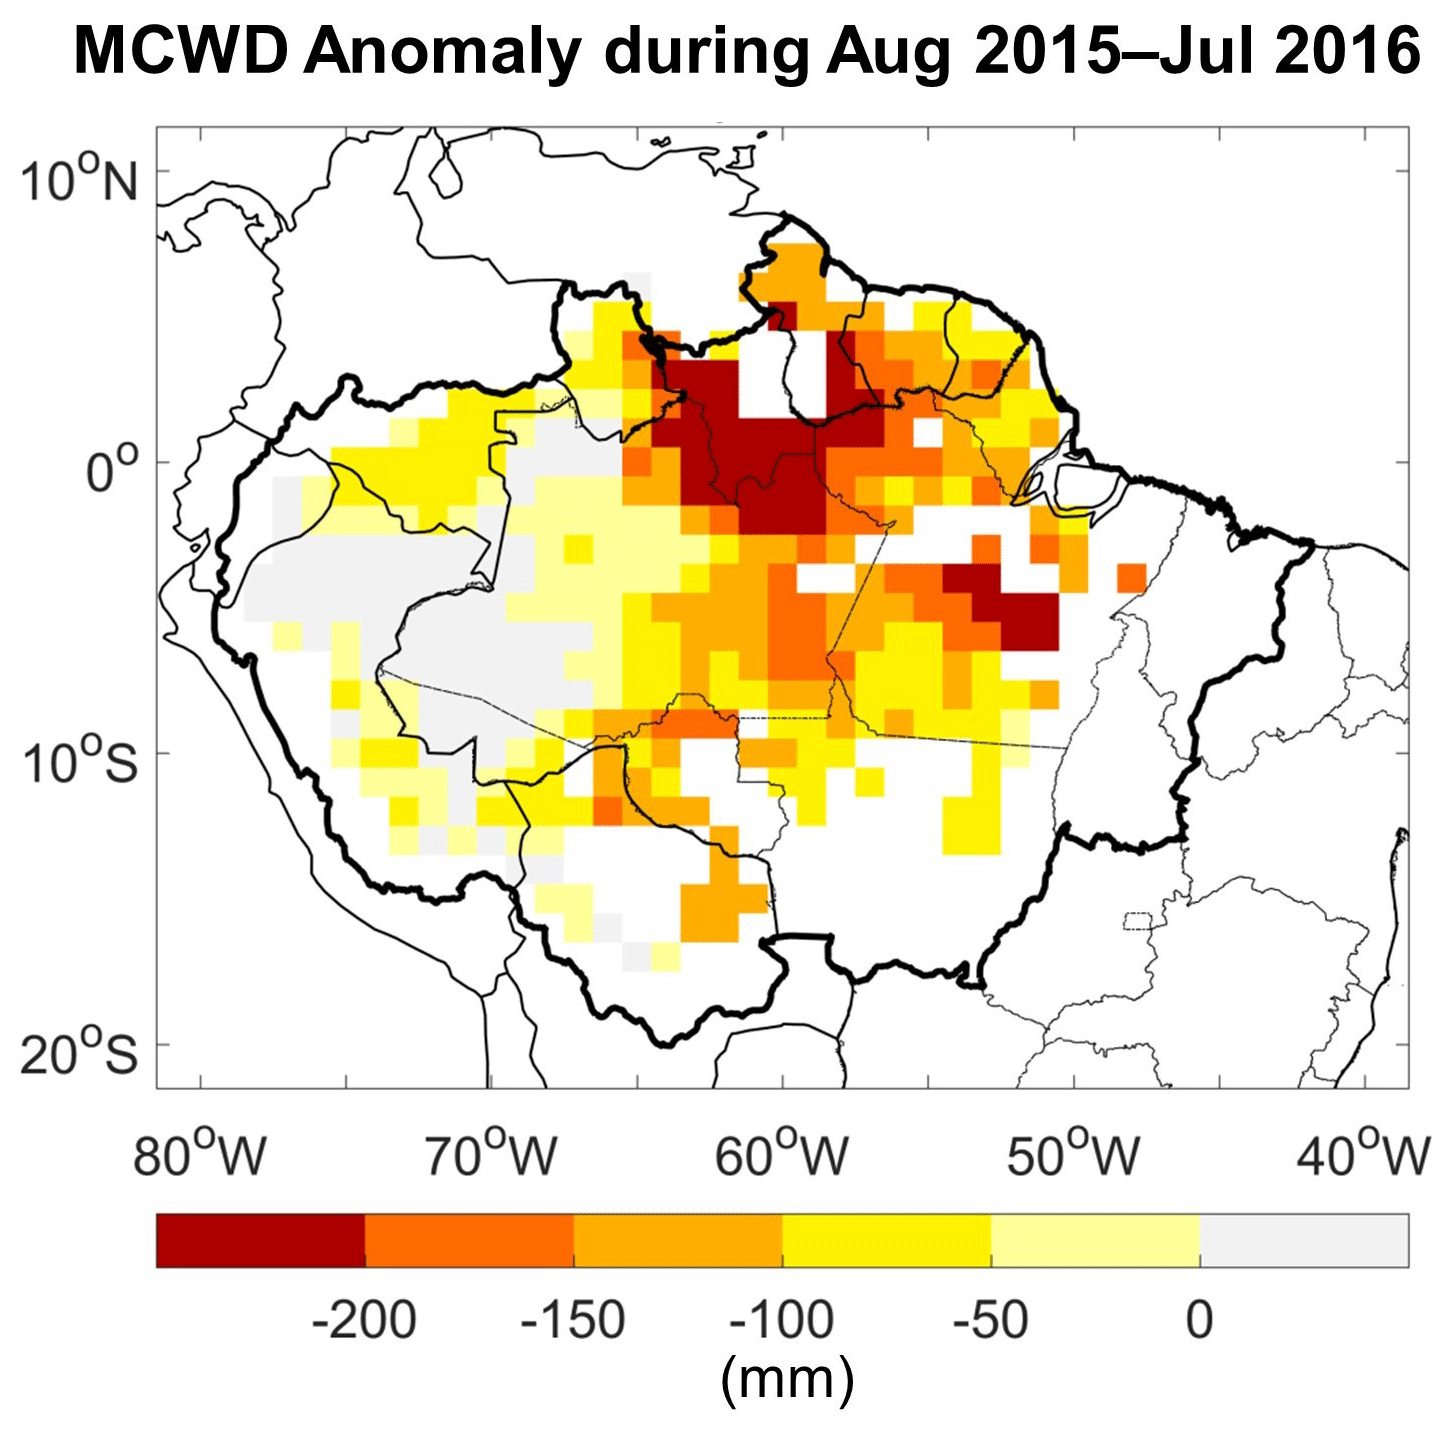
Figure C1The difference between the maximum climatological water deficit (MCWD) during August 2015 to July 2016 and the mean MCWD of non-drought years (2003–2016, excluding 2005, 2010, 2015, and 2016) over the 1° grid cells with more than 80 % covered by evergreen broadleaf forests. The MCWD calculation can be found in Aragão et al. (2007). The monthly precipitation data used here are derived from TRMM (TRMM 3B43 v7; see Table 1).
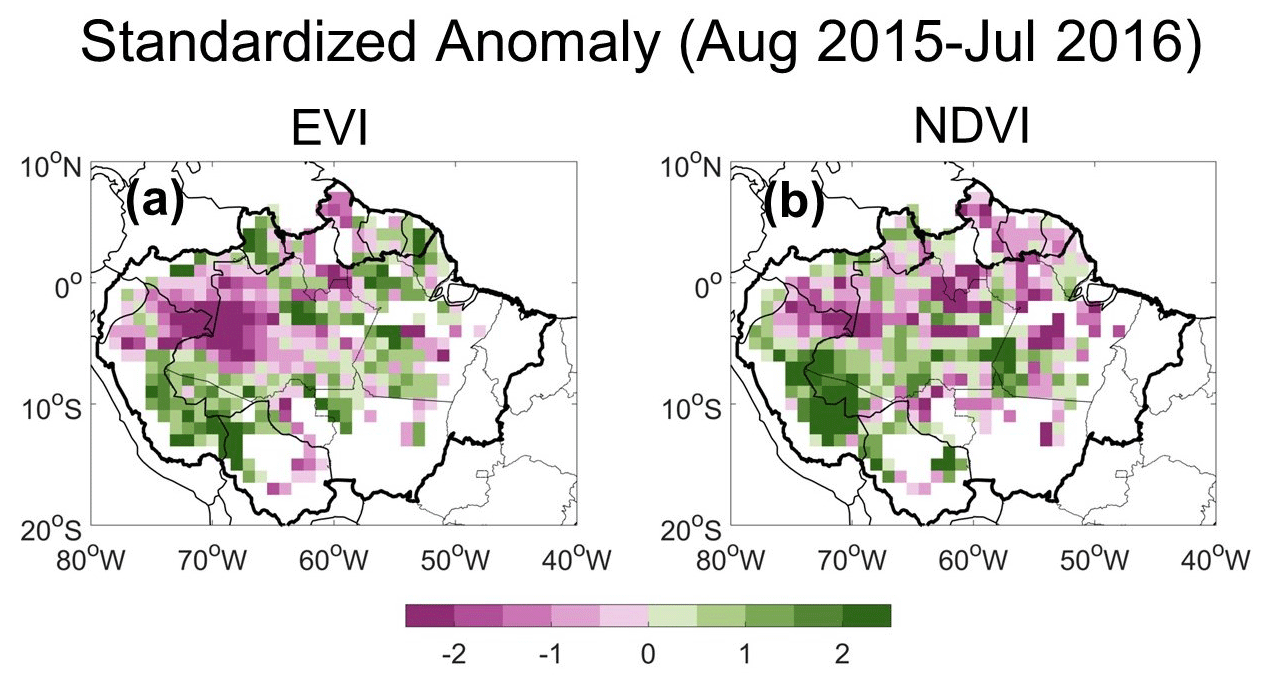
Figure D1Standardized anomalies in (a) the EVI and (b) the NDVI during the 2015–2016 Amazon drought over the 1° grid cells with more than 80 % covered by evergreen broadleaf forests. The EVI and NDVI anomalies show the same anomaly direction over 70 % of these grid cells.
All data used in this paper are present in Table 1 with download links provided. Additional information associated with the paper is available from the corresponding author upon request.
All authors conceptualized the study. YYL conducted the analysis and wrote the first draft of the manuscript, with subsequent additions and improvements by all authors.
The contact author has declared that none of the authors has any competing interests.
Publisher’s note: Copernicus Publications remains neutral with regard to jurisdictional claims made in the text, published maps, institutional affiliations, or any other geographical representation in this paper. While Copernicus Publications makes every effort to include appropriate place names, the final responsibility lies with the authors.
This article is part of the special issue “Drought, society, and ecosystems (NHESS/BG/GC/HESS inter-journal SI)”. It is not associated with a conference.
We thank Ian Baker and one anonymous reviewer for their valuable comments that improved our paper.
This research has been supported by the Australian Research Council (grant no. FT230100209).
This paper was edited by Noemi Vergopolan and reviewed by Ian Baker and one anonymous referee.
Ahlström, A., Raupach, M. R., Schurgers, G., Smith, B., Arneth, A., Jung, M., Reichstein, M., Canadell, J. G., Friedlingstein, P., Jain, A. K., Kato, E., Poulter, B., Sitch, S., Stocker, B. D., Viovy, N., Wang, Y. P., Wiltshire, A., Zaehle, S., and Zeng, N.: The dominant role of semi-arid ecosystems in the trend and variability of the land CO2 sink, Science, 348, 895–899, https://doi.org/10.1126/science.aaa1668, 2015.
Anderson, L. O., Malhi, Y., Aragao, L. E. O. C., Ladle, R., Arai, E., Barbier, N., and Phillips, O.: Remote sensing detection of droughts in Amazonian forest canopies, New Phytol., 187, 733–750, https://doi.org/10.1111/j.1469-8137.2010.03355.x, 2010.
Aragão, L. E. O. C., Malhi, Y., Roman-Cuesta, R. M., Saatchi, S., Anderson, L. O., and Shimabukuro, Y. E.: Spatial patterns and fire response of recent Amazonian droughts, Geophys. Res. Lett., 34, L07701, https://doi.org/10.1029/2006GL028946, 2007.
Aragão, L. E. O. C., Anderson, L. O., Fonseca, M. G., Rosan, T. M., Vedovato, L. B., Wagner, F. H., Silva, C. V. J., Silva Junior, C. H. L., Arai, E., Aguiar, A. P., Barlow, J., Berenguer, E., Deeter, M. N., Domingues, L. G., Gatti, L., Gloor, M., Malhi, Y., Marengo, J. A., Miller, J. B., Philips, O. L., and Saatchi, S.: 21st Century drought-related fires counteract the decline of Amazon deforestation carbon emissions, Nat. Commun., 9, 536, https://doi.org/10.1038/s41467-017-02771-y, 2018.
Atkinson, P. M., Dash, J., and Jeganathan, C.: Amazon vegetation greenness as measured by satellite sensors over the last decade, Geophys. Res. Lett., 38, L19105, https://doi.org/10.1029/2011GL049118, 2011.
Bi, J., Myneni, R., Lyapustin, A., Wang, Y., Park, T., Chi, C., Yan, K., and Knyazikhin, Y.: Amazon forests' response to droughts: a perspective from the MAIAC product, Remote Sens.-Basel, 8, 356, https://doi.org/10.3390/rs8040356, 2016.
Carswell, F. E., Costa, A. L., Palheta, M., Malhi, Y., Meir, P., de Costa, J. P. R., de Ruivo, M. L., do Leal, L. S. M., Costa, J. M. N., Clement, R. J., and Grace, J.: Seasonality in CO2 and H2O flux at an eastern Amazonian rain forest, J. Geophys. Res.-Atmos., 107, 8076, https://doi.org/10.1029/2000JD000284, 2002.
Chen, Y., Velicogna, I., Famiglietti, J. S., and Randerson, J. T.: Satellite observations of terrestrial water storage provide early warning information about drought and fire season severity in the Amazon, J. Geophys. Res-Biogeo., 118, 495–504, https://doi.org/10.1002/jgrg.20046, 2013.
da Costa, A. C. L., Rowland, L., Oliveira, R. S., Oliveira, A. A. R., Binks, O. J., Salmon, Y., Vasconcelos, S. S., Junior, J. A. S., Ferreira, L. V., Poyatos, R., Mencuccini, M., and Meir, P.: Stand dynamics modulate water cycling and mortality risk in droughted tropical forest, Glob. Change Biol., 24, 249–258, https://doi.org/10.1111/gcb.13851, 2018.
da Rocha, H. R., Goulden, M. L., Miller, S. D., Menton, M. C., Pinto, L. D. V. O., de Freitas, H. C., and Silva Figueira, A. M. E.: Seasonality of water and heat fluxes over a tropical forest in eastern Amazonia, Ecol. Appl., 14, S22–S32, 2004.
Ding, F., Savtchenko, A., Hearty, T. J., Wei, J., Theobald, M., Vollmer, B., Tian, B. J., and Fetzer, E. J.: Assessing the impacts of two averaging methods on AIRS level 3 monthly products and multi-year monthly means, J. Atm. Oc. Tech., 37, 1027–1050, 2020.
Erfanian, A., Wang, G., and Fomenko, L.: Unprecedented drought over tropical South America in 2016: significantly under-predicted by tropical SST, Sci. Rep.-UK, 7, 5811, https://doi.org/10.1038/s41598-017-05373-2, 2017.
Feldpausch, T. R., Phillips, O. L., Brienen, R. J. W., Gloor, E., Lloyd, J., Lopez-Gonzalez, G., Monteagudo-Mendoza, A., Malhi, Y., Alarcón, A., Dávila, E. A., Alvarez-Loayza, P., Andrade, A., Aragao, L. E. O. C., Arroyo, L., Aymard C. G. A., Baker, T. R., Baraloto, C., Barroso, J., Bonal, D., Castro, W., Chama, V., Chave, J., Domingues, T. F., Fauset, S., Groot, N., Coronado, E. H., Laurance, S., Laurance, W. F., Lewis, S. L., Licona, J. C., Marimon, B. S., Marimon-Junior, B. H., Bautista, C. M., Neill, D. A., Oliveira, E. A., dos Santos, C. O., Camacho, N. C. P., Pardo-Molina, G., Prieto, A., Quesada, C. A., Ramírez, F., Ramírez-Angulo, H., Réjou-Méchain, M., Rudas, A., Saiz, G., Salomão, R. P., Silva-Espejo, J. E., Silveira, M., ter Steege, H., Stropp, J., Terborgh, J., Thomas-Caesar, R., van der Heijden, G. M. F., Martinez, R. V., Vilanova, E., and Vos, V. A.: Amazon forest response to repeated droughts, Global Biogeochem. Cy., 30, 964–982, https://doi.org/10.1002/2015GB005133, 2016.
Fisher, R. A., Williams, M., Do Vale, R. L., Da Costa, A. L., and Meir, P.: Evidence from Amazonian forests is consistent with isohydric control of leaf water potential, Plant Cell Environ., 29, 151–165, https://doi.org/10.1111/j.1365-3040.2005.01407.x, 2006.
Fisher, R. A., Williams, M., Da Costa, A. L., Malhi, Y., Da Costa, R. F., Almeida, S., and Meir, P.: The response of an Eastern Amazonian rain forest to drought stress: results and modelling analyses from a throughfall exclusion experiment, Glob. Change Biol., 13, 2361–2378, https://doi.org/10.1111/j.1365-2486.2007.01417.x, 2007.
Fontes, C. G., Dawson, T. E., Jardine, K., McDowell, N., Gimenez, B. O., Anderegg, L., Negrón-Juárez, R., Higuchi, N., Fine, P. V. A., Araújo, A. C., and Chambers, J. Q.: Dry and hot: the hydraulic consequences of a climate change–type drought for Amazonian trees, Philos. T. R. Soc. B., 373, 20180209, https://doi.org/10.1098/rstb.2018.0209, 2018.
Friedl, M. A., Sulla-Menashe, D., Tan, B., Schneider, A., Ramankutty, N., Sibley, A., and Huang, X.: MODIS Collection 5 global land cover: Algorithm refinements and characterization of new datasets, Remote Sens. Environ., 114, 168–182, https://doi.org/10.1016/j.rse.2009.08.016, 2010.
Galvao, L. S., dos Santos, J. R., Roberts, D. A., Breunig, F. M., Toomey, M., and de Moura, Y. M.: On intra-annual EVI variability in the dry season of tropical forest: A case study with MODIS and hyperspectral data, Remote Sens. Environ., 115, 2350–2359, https://doi.org/10.1016/j.rse.2011.04.035, 2011.
Gatti, L. V., Gloor, M., Miller, J. B., Doughty, C. E., Malhi, Y., Domingues, L. G., Basso, L. S., Martinewski, A., Correia, C. S. C., Borges, V. F., Freitas, S., Braz, R., Anderson, L. O., Rocha, H., Grace, J., Phillips, O. L., and Lloyd, J.: Drought sensitivity of Amazonian carbon balance revealed by atmospheric measurements, Nature, 506, 76–80, https://doi.org/10.1038/nature12957, 2014.
Gibbons, J. D. and Chakraborti, S.: Nonparametric Statistical Inference, 5th Revised Edn., Boca Raton, FL, United States: Taylor & Francis Ltd., https://doi.org/10.1201/9781439896129, 2011.
Gonçalves, N. B., Lopes, A. P., Dalagnol, R., Wu, J., Pinho, D. M., and Nelson, B. W.: Both near-surface and satellite remote sensing confirm drought legacy effect on tropical forest leaf phenology after 2015/2016 ENSO drought, Remote Sens. Environ., 237, 111489, https://doi.org/10.1016/j.rse.2019.111489, 2020.
Gonçalves, N. B., Dalagnol, R., Wu, J., Lopes, A. P., Stark, S. C., and Nelson, B. W.: Amazon forest spectral seasonality is consistent across sensor resolutions and driven by leaf demography, ISPRS J. Photogramm., 196, 93–104, https://doi.org/10.1016/j.isprsjprs.2022.12.001, 2023.
Grossiord, C., Christoffersen, B., Alonso-Rodriguez, A. M., Anderson-Teixeira, K., Asbjornsen, H., Aparecido, L. M. T., Berry, Z. C., Baraloto, C., Bonal, D., Borrego, I., Burban, B., Chambers, J. Q., Christianson, D. S., Detto, M., Faybishenko, B., Fontes, C. G., Fortunel, C., Gimenez, B. O., Jardine, K. J., Kueppers, L., Miller, G. R., Moore, G. W., Negron-Juarez, R., Stahl, C., Swenson, N. G., Trotsiuk, V., Varadharajan, C., Warren, J. M., Wolfe, B. T., Wei, L., Wood, T. E., Xu, C., and McDowell, N. G.: Precipitation mediates sap flux sensitivity to evaporative demand in the neotropics, Oecologia, 191, 519–530, https://doi.org/10.1007/s00442-019-04513-x, 2019.
Guan, K., Pan, M., Li, H., Wolf, A., Wu, J., Medvigy, D., Caylor, K. K., Sheffield, J., Wood, E. F., Malhi, Y., Liang, M., Kimball, J. S., Saleska, S. R., Berry, J., Joiner, J., and Lyapustin, A. I.: Photosynthetic seasonality of global tropical forests constrained by hydroclimate, Nat. Geosci., 8, 284–289, https://doi.org/10.1038/ngeo2382, 2015.
Hubau, W., Lewis, S. L., Phillips, O. L., Affum-Baffoe, K., Beeckman, H., Cuní-Sanchez, A., Daniels, A. K., Ewango, C. E. N., Fauset, S., Mukinzi, J. M., Sheil, D., Sonké, B., Sullivan, M. J. P., Sunderland, T. C. H., Taedoumg, H., Thomas, S. C., White, L. J. T., Abernethy, K. A., Adu-Bredu, S., Amani, C. A., Baker, T. R., Banin, L. F., Baya, F., Begne, S. K., Bennett, A. C., Benedet, F., Bitariho, R., Bocko, Y. E., Boeckx, P., Boundja, P., Brienen, R. J. W., Brncic, T., Chezeaux, E., Chuyong, G. B., Clark, C. J., Collins, M., Comiskey, J. A., Coomes, D. A., Dargie, G. C., de Haulleville, T., Kamdem, M. N. D., Doucet, J., Esquivel-Muelbert, A., Feldpausch, T. R., Fofanah, A., Foli, E. G., Gilpin, M., Gloor, E., Gonmadje, C., Gourlet-Fleury, S., Hall, J. S., Hamilton, A. C., Harris, D. J., Hart, T. B., Hockemba, M. B. N., Hladik, A., Ifo, S. A., Jeffery, K. J., Jucker, T., Yakusu, E. K., Kearsley, E., Kenfack, D., Koch, A., Leal, M. E., Levesley, A., Lindsell, J. A., Lisingo, J., Lopez-Gonzalez, G., Lovett, J. C., Makana, J., Malhi, Y., Marshall, A. R., Martin, J., Martin, E. H., Mbayu, F. M., Medjibe, V. P., Mihindou, V., Mitchard, E. T. A., Moore, S., Munishi, P. K. T., Bengone, N. N., Ojo, L., Ondo, F. E., Peh, K. S.-H., Pickavance, G. C., Poulsen, A. D., Poulsen, J. R., Qie, L., Reitsma, J., Rovero, F., Swaine, M. D., Talbot, J., Taplin, J., Taylor, D. M., Thomas, D. W., Toirambe, B., Mukendi, J. T., Tuagben, D., Umunay, P. M., van der Heijden, G. M. F., Verbeeck, H., Vleminckx, J., Willcock, S., Wöll, H., Woods, J. T., and Zemagho, L.: Asynchronous carbon sink saturation in African and Amazonian tropical forests, Nature, 579, 80–87, https://doi.org/10.1038/s41586-020-2035-0, 2020.
Hilker, T., Lyapustin, A. I., Hall, F. G., Myneni, R., Knyazikhin, Y., Wang, Y. J., Tucker, C. J., and Sellers, P. J.: On the measurability of change in Amazon vegetation from MODIS, Remote Sens. Environ., 166, 233–242, https://doi.org/10.1016/j.rse.2015.05.020, 2015.
Huete, A., Didan, K., Miura, T., Rodriguez, E. P., Gao, X., and Ferreira, L. G.: Overview of the radiometric and biophysical performance of the MODIS vegetation indices, Remote Sens. Environ., 83, 195–213, 2002.
Huete, A., Justice, C., and Liu, H.: Development of vegetation and soil indices for MODIS-EOS, Remote Sens. Environ., 49, 224–234, 1994.
Huete, A., Didan, K., Shimabukuro, Y., Ratana, P., Saleska, S., Hutyra, L., Yang, W., Nemani, R. R., and Myneni, R.: Amazon rainforests green-up with sunlight in dry season, Geophys. Res. Lett., 33, L06405, https://doi.org/10.1029/2005GL025583, 2006.
Huete, A. R., Liu, H. Q., Batchily, K., and van Leeuwen, W.: A comparison of vegetation indices over a global set of TM images for EOS-MODIS, Remote Sens. Environ., 59, 440–451, https://doi.org/10.1016/S0034-4257(96)00112-5, 1997.
Huffman, G. J., Adler, R. F., Bolvin, D. T., Gu, G. J., Nelkin, E. J., Bowman, K. P., Hong, Y., Stocker, E. F., and Wolff, D. B.: The TRMM multisatellite precipitation analysis (TMPA): Quasi-global, multiyear, combined-sensor precipitation estimates at fine scales, J. Hydrometeorol., 8, 38–55, https://doi.org/10.1175/JHM560.1, 2007.
Hutyra, L. R., Munger, J. W., Saleska, S. R., Gottlieb, E., Daube, B. C., Dunn, A. L., Amaral, D. F., de Camargo, P. B., and Wofsy, S. C.: Seasonal controls on the exchange of carbon and water in an Amazonian rain forest, J. Geophys. Res.-Biogeo., 112, G03008, https://doi.org/10.1029/2006JG000365, 2007.
Jiménez-Muñoz, J. C., Mattar, C., Barichivich, J., Santamaría-Artigas, A., Takahashi, K., Malhi, Y., Sobrino, J. A., and van der Schrier, G.: Record-breaking warming and extreme drought in the Amazon rainforest during the course of El Niño 2015–2016, Sci. Rep.-UK, 6, 33130, https://doi.org/10.1038/srep33130, 2016.
Kahn, B. H., Irion, F. W., Dang, V. T., Manning, E. M., Nasiri, S. L., Naud, C. M., Blaisdell, J. M., Schreier, M. M., Yue, Q., Bowman, K. W., Fetzer, E. J., Hulley, G. C., Liou, K. N., Lubin, D., Ou, S. C., Susskind, J., Takano, Y., Tian, B., and Worden, J. R.: The Atmospheric Infrared Sounder version 6 cloud products, Atmos. Chem. Phys., 14, 399–426, https://doi.org/10.5194/acp-14-399-2014, 2014.
Koren, G., van Schavik, E., Araujo, A. C., Boersma, K. F., Gartner, A., Killaars, L., Kooreman, M. L., Kruijt, B., van der Laan-Luijkx, I. T., von Randow, C., Smith, N. E., and Peters, W.: Widespread reduction in sun-induced fluorescence from the Amazon during the 2015/2016 El Nino, Philos. T. R. Soc. B., 373, https://doi.org/10.1098/rstb.2017.0408, 2018.
Lee, J. E., Frankenberg, C., van der Tol, C., Berry, J. A., Guanter, L., Boyce, C. K., Fisher, J. B., Morrow, E., Worden, J. R., Asefi, S., Badgley, G., and Saatchi, S.: Forest productivity and water stress in Amazonia: observations from GOSAT chlorophyll fluorescence, P. R. Soc. B., 280, 20130171, https://doi.org/10.1098/rspb.2013.0171, 2013.
Lewis, S. L., Brando, P. M., Phillips, O. L., van der Heijden, G. M. F., and Nepstad, D.: The 2010 Amazon Drought, Science, 331, 554–554, https://doi.org/10.1126/science.1200807, 2011.
Liu, Y. Y., van Dijk, A. I. J. M., Miralles, D. G., McCabe, M. F., Evans, J. P., de Jeu, R. A. M., Gentine, P., Huete, A., Parinussa, R. M., Wang, L., Guan, K., Berry, J., and Restrepo-Coupe, N.: Enhanced canopy growth precedes senescence in 2005 and 2010 Amazonian droughts, Remote Sens. Environ., 211, 26–37, https://doi.org/10.1016/j.rse.2018.03.035, 2018.
Loomis, B. D., Luthcke, S. B. and Sabaka, T. J.: Regularization and error characterization of GRACE mascons, J. Geod., 93, 1381–1398, https://doi.org/10.1007/s00190-019-01252-y, 2019.
Lyapustin, A., Martonchik, J., Wang, Y., Laszlo, I., and Korkin, S.: Multiangle implementation of atmospheric correction (MAIAC): 1. Radiative transfer basis and look-up tables, J. Geophys. Res.-Atmos., 116, D03210, https://doi.org/10.1029/2010JD014985, 2011a.
Lyapustin, A., Wang, Y., Laszlo, I., Kahn, R., Korkin, S., Remer, L., Levy, R., and Reid, J. S.: Multiangle implementation of atmospheric correction (MAIAC): 2. Aerosol algorithm, J. Geophys. Res.-Atmos., 116, D03211, https://doi.org/10.1029/2010JD014986, 2011b.
Lyapustin, A. I., Wang, Y., Laszlo, I., Hilker, T., Hall, F. G., Sellers, P. J., Tucker, C. J., and Korkin, S. V.: Multi-angle implementation of atmospheric correction for MODIS (MAIAC): 3. Atmospheric correction, Remote Sens. Environ., 127, 385–393, https://doi.org/10.1016/j.rse.2012.09.002, 2012.
Maeda, E. E., Moura, Y. M., Wagner, F., Hilker, T., Lyapustin, A. I., Wang, Y. J., Chave, J., Mottus, M., Aragao, L. E. O. C., and Shimabukuro, Y.: Consistency of vegetation index seasonality across the Amazon rainforest, Int. J. Appl. Earth Obs., 52, 42–53, https://doi.org/10.1016/j.jag.2016.05.005, 2016.
Maeda, E. E., Ma, X., Wagner, F. H., Kim, H., Oki, T., Eamus, D., and Huete, A.: Evapotranspiration seasonality across the Amazon Basin, Earth Syst. Dynam., 8, 439–454, https://doi.org/10.5194/esd-8-439-2017, 2017.
Malhi, Y., Roberts, J. T., Betts, R. A., Killeen, T. J., Li, W. H., and Nobre, C. A.: Climate change, deforestation, and the fate of the Amazon, Science, 319, 169–172, https://doi.org/10.1126/science.1146961, 2008.
Marengo, J. A. and Espinoza, J. C.: Extreme seasonal droughts and floods in Amazonia: causes, trends and impacts, Int. J. Climatol., 36, 1033–1050, https://doi.org/10.1002/joc.4420, 2016.
Meng, L., Chambers, J., Koven, C., Pastorello, G., Gimenez, B., Jardine, K., Tang, Y., McDowell, N., Negron-Juarez, R., Longo, M., Araujo, A., Tomasella, J., Fontes, C., Mohan, M., and Higuchi, N.: Soil moisture thresholds explain a shift from light-limited to water-limited sap velocity in the Central Amazon during the 2015–2016 El Nino drought, Environ. Res. Lett., 17, 064023, https://doi.org/10.1088/1748-9326/ac6f6d, 2022.
Meir, P. and Woodward, F.: Amazonian rain forests and drought: response and vulnerability, New Phytol., 187, 553–557. https://doi.org/10.1111/j.1469-8137.2010.03390.x, 2010.
Meir, P., Brando, P. M., Nepstad, D.,Vasconcelos, S., Costa, A. C. L., Davidson, E., Almeida, S., Fisher, R. A., Sotta, E. D., Zarin, D., and Cardinot, G.: The effects of drought on Amazonian rain forests, in: Amazonia and Global Change, edited by: Gash, J., Keller, M., Bustamante, M., and Silva Dias, P., Geophysics Monograph Series, Washington, DC, USA, AGU, 186, 429–449, https://doi.org/10.1029/2009GM000882, 2009.
Meir, P., Wood, T. E., Galbraith, D. R., Brando, P. M., Da Costa, A. C. L., Rowland, L., and Ferreira, L. V.: Threshold responses to soil moisture deficit by trees and soil in tropical rain forests: Insights from field experiments, Bioscience, 65, 882–892, https://doi.org/10.1093/biosci/biv107, 2015.
Meir, P., Mencuccini, M., Binks, O., da Costa, A. L., Ferreira, L., and Rowland, L.: Short-term effects of drought on tropical forest do not fully predict impacts of repeated or long-term drought: gas exchange versus growth, Philos. T. R. Soc. B., 373, 20170311, https://doi.org/10.1098/rstb.2017.0311, 2018.
Morton, D. C., Nagol, J., Carabajal, C. C., Rosette, J., Palace, M., Cook, B. D., Vermote, E. F., Harding, D. J., and North, P. R. J.: Amazon forests maintain consistent canopy structure and greenness during the dry season, Nature, 506, 221–224, https://doi.org/10.1038/nature13006, 2014.
Muñoz-Sabater, J., Dutra, E., Agustí-Panareda, A., Albergel, C., Arduini, G., Balsamo, G., Boussetta, S., Choulga, M., Harrigan, S., Hersbach, H., Martens, B., Miralles, D. G., Piles, M., Rodríguez-Fernández, N. J., Zsoter, E., Buontempo, C., and Thépaut, J.-N.: ERA5-Land: a state-of-the-art global reanalysis dataset for land applications, Earth Syst. Sci. Data, 13, 4349–4383, https://doi.org/10.5194/essd-13-4349-2021, 2021.
Nemani, R. R., Keeling, C. D., Hashimoto, H., Jolly, W. M., Piper, S. C., Tucker, C. J., Myneni, R. B., and Running, S. W.: Climate-driven increases in global terrestrial net primary production from 1982 to 1999, Science, 300, 1560–1563, https://doi.org/10.1126/science.1082750, 2003.
Nepstad, D. C., Decarvalho, C. R., Davidson, E. A., Jipp, P. H., Lefebvre, P. A., Negreiros, G. H., da Silva, E. D., Stone, T. A., Trumbore, S. E., and Vieira, S.: The role of deep roots in the hydrological and carbon cycles of Amazonian forests and pastures, Nature, 372, 666–669, https://doi.org/10.1038/372666a0, 1994.
Nepstad, D. C., Tohver, I. M., Ray, D., Moutinho, P., and Cardinot, G.: Mortality of large trees and lianas following experimental drought in an amazon forest, Ecology, 88, 2259–2269, https://doi.org/10.1890/06-1046.1, 2007.
Pan, Y. D., Birdsey, R. A., Fang, J. Y., Houghton, R., Kauppi, P. E., Kurz, W. A., Phillips, O. L., Shvidenko, A., Lewis, S. L., Canadell, J. G., Ciais, P., Jackson, R. B., Pacala, S. W., McGuire, A. D., Piao S., Rautiainen, A., Sitch, S., and Hayes, D.: A Large and Persistent Carbon Sink in the World's Forests, Science, 333, 988–993, https://doi.org/10.1126/science.1201609, 2011.
Pau, S., Detto, M., Kim, Y., and Still, C. J.: Tropical forest temperature thresholds for gross primary productivity, Ecosphere, 9,e02311, https://doi.org/10.1002/ecs2.2311, https://doi.org/10.1002/ecs2.2311, 2018.
Petchiappan, A., Steele-Dunne, S. C., Vreugdenhil, M., Hahn, S., Wagner, W., and Oliveira, R.: The influence of vegetation water dynamics on the ASCAT backscatter-incidence angle relationship in the Amazon, Hydrol. Earth Syst. Sc., 26, 2997–3019, https://doi.org/10.5194/hess-26-2997-2022, 2022.
Phillips, O. L., Aragao, L. E. O. C., Lewis, S. L., Fisher, J. B., Lloyd, J., Lopez-Gonzalez, G., Malhi, Y., Monteagudo, A., Peacock, J., Quesada, C. A., van der Heijden, G., Almeida, S., Amaral, I., Arroyo, L., Aymard, G., Baker, T. R., Bánki, O., Blanc, L., Bonal, D., Brando, P., Chave, J., de Oliveira, A. C. A., Cardozo, N. D., Czimczik, C. I., Feldpausch, T. R., Freitas, M. A., Gloor, E., Higuchi, N., Jiménez, E., Lloyd, G., Meir, P., Mendoza, C., Morel, A., Neill, D. A., Nepstad, D., Patiño, S., Peñuela, M. C., Prieto, A., Ramírez, F., Schwarz, M., Silva, J., Silveira, M., Thomas, A. S., Steege, H. T., Stropp, J., Vásquez, R., Zelazowski, P., Dávila, E. A., Andelman, S., Andrade, A., Chao, K., Erwin, T., Fiore, A. D., Honorio, C. E., Keeling, H., Killeen, T. J., Laurance, W. F., Cruz, A. P., Pitman, N. C. A., Vargas, P. N., Ramírez-Angulo, H., Rudas, A., Salamão, R., Silva, N., Terborgh, J., and Torres-Lezama, A.: Drought sensitivity of the Amazon rainforest, Science, 323, 1344–1347, https://doi.org/10.1126/science.1164033, 2009.
Ramachandran, B., Justice, C. O., and Abrams, M. J. (Eds.): Land Remote Sensing and Global Environmental Change, Sioux Falls, SD, USA, Springer, https://doi.org/10.1007/978-1-4419-6749-7, 2011.
Restrepo-Coupe, N., da Rocha, H. R., Hutyra, L. R., da Araujo, A. C., Borma, L. S., Christoffersen, B., Cabral, O. M. R., de Camargo, P. B., Cardoso, F. L., da Costa, A. C. L., Fitzjarrald, D. R., Goulden, M. L., Kruijt, B., Maia, J. M. F., Malhi, Y. S., Manzi, A. O., Miller, S. D., Nobre, A. D., von Randow, C., Abreu Sa, L. D., and Saleska, S. R.: What drives the seasonality of photosynthesis across the Amazon basin? A cross-site analysis of eddy flux tower measurements from the Brasil flux network, Agr. Forest Meteorol., 182, 128–144, https://doi.org/10.1016/j.agrformet.2013.04.031, 2013.
Saatchi, S., Asefi-Najafabady, S., Malhi, Y., Aragão, L. E. O. C., Anderson, L. O., Myneni, R. B., and Nemani, R.: Persistent effects of a severe drought on Amazonian forest canopy, P. Natl. Acad. Sci. USA, 110, 565–570, https://doi.org/10.1073/pnas.1204651110, 2012.
Saleska, S. R., Didan, K., Huete, A. R., and da Rocha, H. R.: Amazon forests green-up during 2005 drought, Science, 318, 612–612, https://doi.org/10.1126/science.1146663, 2007.
Saleska, S. R., Wu, J., Guan, K., Araujo, A. C., Huete, A., Nobre, A. D., and Restrepo-Coupe, N.: Dry-season greening of Amazon forests, Nature, 531, E4–E5, https://doi.org/10.1038/nature16457, 2016.
Samanta, A., Ganguly, S., Hashimoto, H., Devadiga, S., Vermote, E., Knyazikhin, Y., Nemani, R. R., and Myneni, R. B.: Amazon forests did not green-up during the 2005 drought, Geophys. Res. Lett., 37, L05401, https://doi.org/10.1029/2009gl042154, 2010.
Samanta, A., Ganguly, S., Vermote, E., Nemani, R. R., and Myneni, R. B.: Interpretation of variations in MODIS-measured greenness levels of Amazon forests during 2000 to 2009, Environ. Res. Lett., 7, 024018, https://doi.org/10.1088/1748-9326/7/2/024018, 2012.
Santos, V. A. H. F. D., Ferreira, M. J., Rodrigues, J. V. F. C., Garcia, M. N., Ceron, J. V. B., Nelson, B. W., and Saleska, S. R.: Causes of reduced leaf-level photosynthesis during strong El Niño drought in a Central Amazon forest, Glob. Change Biol., 24, 4266–4279, https://doi.org/10.1111/gcb.14293, 2018.
Save, H., Bettadpur, S., and Tapley, B. D.: High resolution CSR GRACE RL05 mascons, J. Geophys. Res.-Sol. Ea., 121, 7547–7569, https://doi.org/10.1002/2016JB013007, 2016.
Solander, K. C., Reager, J. T., Wada, Y., Famiglietti, J. S., and Middleton, R. S.: GRACE satellite observations reveal the severity of recent water over-consumption in the United States, Sci. Rep.-UK, 7, 8723, https://doi.org/10.1038/s41598-017-07450-y, 2017.
Susskind, J., Blaisdell, J. M., and Iredell, L.: Improved methodology for surface and atmospheric soundings, error estimates, and quality control procedures: the atmospheric infrared sounder science team version-6 retrieval algorithm, J. Appl. Remote Sens., 8, 084994, https://doi.org/10.1117/1.JRS.8.084994, 2014.
Tan, Z. H., Zeng, J., Zhang, Y. J., Slot, M., Gamo, M., Hirano, T., Kosugi, Y., da Rocha, H. R., Saleska, S. R., Goulden, M. L., Wofsy, S. C., Miller, S. D., Manzi, A. O., Nobre, A. D., de Camargo, P. B., and Restrepo-Coupe, N.: Optimum air temperature for tropical forest photosynthesis: mechanisms involved and implications for climate warming, Environ. Res. Lett., 12, 054022, https://doi.org/10.1088/1748-9326/aa6f97, 2017.
Tian, H., Melillo, J. M., Kicklighter, D. W., McGuire, A. D., Helfrich III, J. V. K., Moore III, B., and Vörösmarty, C. J.: Effect of interannual climate variability on carbon storage in Amazonian ecosystems, Nature, 396, 664–667, https://doi.org/10.1038/25328, 1998.
Toomey, M., Roberts, D. A., Still, C., Goulden, M. L., and McFadden, J. P.: Remotely sensed heat anomalies linked with Amazonian forest biomass declines, Geophys. Res. Lett., 38, L19704, https://doi.org/10.1029/2011GL049041, 2011.
Tucker, C. J.: Red and photographic infrared linear combinations for monitoring vegetation, Remote Sens. Environ., 8, 127–150, https://doi.org/10.1016/0034-4257(79)90013-0, 1979.
Watkins, M. M., Wiese, D. N., Yuan, D. N., Boening, C., and Landerer, F. W.: Improved methods for observing Earth's time variable mass distribution with GRACE using spherical cap mascons, J. Geophys. Res.-Sol. Ea., 120, 2648–2671, https://doi.org/10.1002/2014JB011547, 2015.
Wielicki, B. A., Barkstrom, B. R., Harrison, E. F., Lee, R. B., Smith, G. L., and Cooper, J. E.: Clouds and the earth's radiant energy system (CERES): An earth observing system experiment, B. Am. Meteorol. Soc., 77, 853–868, https://doi.org/10.1175/1520-0477, 1996.
Wiese, D. N., Landerer, F. W., and Watkins, M. M.: Quantifying and reducing leakage errors in the JPL RL05M GRACE mascon solution, Water Resour. Res., 52, 7490–7502, https://doi.org/10.1002/2016WR019344, 2016.
Wu, J., Albert, L. P., Lopes, A. P., Restrepo-Coupe, N., Hayek, M., Wiedemann, K. T., Guan, K., Stark, S. C., Christoffersen, B., Prohaska, N., Tavares, J. V., Marostica, S., Kobayashi, H., Ferreira, M. L., Campos, K. S., da Silva, R., Brando, P. M., Dye, D. G., Huxman, T. E., Huete, A. R., Nelson, B. W., and Saleska, S. R.: Leaf development and demography explain photosynthetic seasonality in Amazon evergreen forests, Science, 351, 972–976, https://doi.org/10.1126/science.aad5068, 2016.
Wu, J., Kobayashi, H., Stark, S. C., Meng, R., Guan, K. Y., Tran, N. N., Gao, S., Yang, W., Restrepo-Coupe, N., Miura, T., Oliviera, R. C., Rogers, A., Dye, D. G., Nelson, B. W., Serbin, S. P., Huete, A. R., and Saleska, S. R.: Biological processes dominate seasonality of remotely sensed canopy greenness in an Amazon evergreen forest, New Phytol., 217, 1507–1520, https://doi.org/10.1111/nph.14939, 2018.
Xiao, X. M., Hagen, S., Zhang, Q. Y., Keller, M., and Moore, B.: Detecting leaf phenology of seasonally moist tropical forests in South America with multi-temporal MODIS images, Remote Sens. Environ., 103, 465–473, https://doi.org/10.1016/j.rse.2006.04.013, 2006.
Xu, L. A., Samanta, A., Costa, M. H., Ganguly, S., Nemani, R. R., and Myneni, R. B.: Widespread decline in greenness of Amazonian vegetation due to the 2010 drought, Geophys. Res. Lett., 38, L07402, https://doi.org/10.1029/2011GL046824, 2011.
Yan, H., Wang, S., Huete, A., and Shugart, H. H.: Effects of light component and water stress on photosynthesis of Amazon rainforests during the 2015/2016 El Niño drought, J. Geophys. Res-Biogeo., 124, 1574–1590, https://doi.org/10.1029/2018JG004988, 2019.
Yang, J., Tian, H., Pan, S., Chen, G., Zhang, B., and Dangal, S.: Amazon droughts and forest responses: Largely reduced forest photosynthesis but slightly increased canopy greenness during the extreme drought of 2015/2016, Glob. Change Biol., 24, 1919–1934, https://doi.org/10.1111/gcb.14056, 2018.
Yang, Y., Donohue, R. J., and McVicar, T. R.: Global estimation of effective plant rooting depth: Implications for hydrological modeling, Water Resour. Res., 52, 8260–8276, https://doi.org/10.1002/2016WR019392, 2016.
Yue, C., Ciais, P., Bastos, A., Chevallier, F., Yin, Y., Rödenbeck, C., and Park, T.: Vegetation greenness and land carbon-flux anomalies associated with climate variations: a focus on the year 2015, Atmos. Chem. Phys., 17, 13903–13919, https://doi.org/10.5194/acp-17-13903-2017, 2017.
- Abstract
- Introduction
- Data
- Methods
- Results
- Discussion
- Conclusions
- Appendix A: Gap-filling of TWS
- Appendix B: TWS anomaly immediately preceding the 2015–2016 drought
- Appendix C: MCWD anomaly during August 2015 to July 2016
- Appendix D: Anomalies in the EVI and NDVI
- Data availability
- Author contributions
- Competing interests
- Disclaimer
- Special issue statement
- Acknowledgements
- Financial support
- Review statement
- References