the Creative Commons Attribution 4.0 License.
the Creative Commons Attribution 4.0 License.
 | 14 May 2024
Monitoring the impact of forest changes on carbon uptake with solar-induced fluorescence measurements from GOME-2A and TROPOMI for an Australian and Chinese case study
Juliëtte C. S. Anema
Klaas Folkert Boersma
Piet Stammes
Gerbrand Koren
William Woodgate
Philipp Köhler
Christian Frankenberg
Jacqui Stol
Reliable and robust monitoring tools are crucial to assess the effectiveness of land mitigation techniques (LMTs) in enhancing carbon uptake, enabling informed decision making by policymakers. This study, addressing one of the scientific goals of the EU Horizon 2020 Land Use Based Mitigation for Resilient Climate Pathways (LANDMARC) project, examines the feasibility of using satellite solar-induced fluorescence (SIF) in combination with other satellite data as a monitoring proxy to evaluate the effects of LMTs on carbon uptake. Two distinct cases are explored: (1) instantaneous vegetation destruction caused by a 2019 eucalyptus wildfire in southeast Australia and (2) gradual forest gain resulting from reforestation efforts in northern China in 2007–2012. The cases are monitored using SIF from the TROPOspheric Monitoring Instrument (TROPOMI) and Global Ozone Monitoring Experiment-2A (GOME-2A), respectively. Comparing the temporal variability in SIF across the affected areas and nearby reference areas reveals that vegetation dynamics changed as a consequence of the land-use changes in both cases. Specifically, in the Australia case, TROPOMI demonstrated an immediate reduction in the SIF signal of 0.6 mW m−2 sr−1 nm−1 (−72 %) over the eucalypt forest right after the fire. Exploiting the strong correspondence between TROPOMI SIF and gross primary productivity (GPP) at the nearby representative eddy covariance Tumbarumba site and through the FluxSat product, we estimate that the Australian fire led to a loss in GPP of 130–200 GgC in the first 8 months after the fire. Over the northern Chinese provinces of Gansu, Shaanxi, Sichuan, Chongqing, and Shanxi, we report an increase in GOME-2A summertime SIF of 0.1–0.2 mW m−2 sr−1 nm−1, coinciding with reforestation efforts between 2007 and 2012. This increase in the SIF signal is likely driven by a combination of increasingly favourable natural conditions and by the reforestation effort itself. A multivariate model that takes into account growth factors such as water availability and maximum temperature as well as satellite-derived forest-cover data explains the observed variability in GOME-2A SIF in the Chinese case reasonably well (R2=0.72). The model suggests that increases in both forest cover and soil moisture have led, in step, to the observed increase in vegetation activity over northern China. In that region, for every 100 km2 of additional forest cover, SIF increases by 0.1 mW m−2 sr−1 nm−1 between 2007 and 2012. Our study highlights that the use of satellite-based SIF, together with supporting in situ, modelled, and satellite data, allows us to monitor the impact of LMT implementation on regional carbon uptake as long as the scale of the LMT is of sufficient spatial extent.
- Article
(3775 KB) - Full-text XML
-
Supplement
(979 KB) - BibTeX
- EndNote


Photosynthetic carbon uptake by the terrestrial biosphere plays a crucial part in the carbon cycle and is the largest flux that contributes to the carbon sink. Over the last 60 years, the terrestrial biosphere captured an amount of carbon equivalent to approximately 32 % of the total anthropogenic emissions in that period (Friedlingstein et al., 2020). However, the ongoing efficacy of this photosynthetic carbon flux, or gross primary productivity (GPP), is not assured due to feedback mechanisms driven by climate change and human activity (e.g. Brook et al., 2013; Huntzinger et al., 2017). Preserving the terrestrial biosphere's pivotal role in dampening the rise in atmospheric CO2 concentrations is crucial to address the current climate crisis. In response to this urgency, land mitigation techniques (LMTs) play a key role as negative carbon technology in national climate strategies (United Nations, 2016) and in the climate pathways of the Intergovernmental Panel on Climate Change (Rogelj et al., 2018). These techniques include a variety of practices, such as reforestation and fire management, aimed at enhancing the land's carbon assimilation and preventing carbon stock loss.
The potential of large-scale LMT implementation is exemplified by observed greening trends over actively reforested areas across central to northern China (Chu et al., 2019; Gerlein-Safdi et al., 2020). However, persisting uncertainty regarding the LMTs' effectiveness in enhancing GPP and carbon sequestration in the long term limits their widespread implementation (e.g. Harper et al., 2018). The need for robust quantification of changing GPP following land-cover change is further emphasized by the uncertain impacts of rising atmospheric CO2 concentrations and climate change itself on the terrestrial biosphere (Schimel et al., 2015; Smith et al., 2020; Duffy et al., 2021; Schurgers et al., 2018). Understanding the efficiency and applicability of LMTs is essential for effective climate action. Therefore, the Horizon 2020 LANDMARC (Land Use Based Mitigation for Resilient Climate Pathways) project (https://www.landmarc2020.eu/, last access: 8 June 2023) has developed monitoring tools, including satellite-based remote sensing, to study the feasibility of negative emission monitoring using multiple LMT cases worldwide as test cases.
The recent development of satellite-based measurements of solar-induced chlorophyll fluorescence (SIF) from atmospheric sensors has opened up promising opportunities to monitor the GPP dynamics (Frankenberg et al., 2011; Joiner et al., 2011). Chlorophyll fluorescence (660–850 nm) is the re-emission of the absorbed photosynthetically active radiation (APAR) by the leaf chlorophyll during photosynthesis (Frankenberg and Berry, 2017). The emission of fluorescence dissipates part of the excitation energy from APAR that is not transported to and used by the photochemical reactions in the plant – making both fluorescence and GPP dependent on APAR (Porcar-Castell et al., 2014). SIF measurements depict the captured chlorophyll photons integrated over the canopy within the field of view and thus directly follow the dynamics of photosynthetic activity. Therefore, SIF follows GPP more consistently than traditional greenness parameter observations such as NDVI (e.g. Magney et al., 2019; Gerlein-Safdi et al., 2020).
As part of one of the research objectives of the LANDMARC project, the main goal of this study is to assess the feasibility of satellite-based SIF in combination with other satellite data to monitor the effect of land mitigation techniques (LMTs) on carbon uptake. Monitoring tools could potentially benefit from the ability of SIF to track GPP dynamics consistently across various biomes and scales (Zhang and Schwärzel, 2017; Verma et al., 2017; Dechant et al., 2020) and from its demonstrated sensitivity to climate stress (Song et al., 2018; Ač et al., 2015). Previous studies indicated the ability of SIF to evaluate changes in land cover (Gerlein-Safdi et al., 2020; Guo et al., 2021). However, to our knowledge, the use of SIF aligned with supporting satellite data to quantify the isolated effect of land-use change on GPP has not been assessed.
Here, we use TROPOMI and GOME-2A SIF to monitor two cases of forest-cover change. First, we use monthly TROPOMI SIF to track the aftermath of a 2019 wildfire in southeast Australia, impacting around 210 km2 of eucalypt forest. Next, we use summertime GOME-2A SIF to monitor multi-year reforestation efforts in northern China from 2007–2012. The Australian case acts as a proof of concept due to its immediate and distinct single-cause land-cover change, while the Chinese case tests how SIF can be used to monitor the combined effect of gradual forest-cover change and variability in growth conditions (water and radiation availability) (Gao et al., 2019; Lin et al., 2020; Wang et al., 2022). Satellite-based data, including MODIS burned-area data and Landsat-derived annual land-cover data, are used to evaluate the spatial and temporal extent of the changed forest cover in both cases. Subsequently, a comparative analysis between the impacted and reference areas was conducted.
Our study addresses the following research questions. (1) Is it possible to monitor changes in vegetation dynamics that are linked to instantaneous or gradual land-cover changes over scales that can be resolved by the TROPOMI and GOME-2A sensors? (2) How can we quantify the impact of instantaneous land-use change on carbon uptake? (3) How can we use remotely sensed metrics to improve our understanding of climate variability and forest-cover change on interannual SIF?
2.1 Space-based SIF observations
Satellite measurements of SIF are powerful proxies for vegetation growth, and they have been used in many studies to monitor the changes in GPP. Retrieval of SIF from satellite measurements, e.g. from GOME-2A and TROPOMI that offer near-daily global coverage, relies on the relative filling in of solar Fraunhofer lines in the Earth's radiance spectra. The apparent depth of the Fraunhofer lines is not affected by scattering or reflection from clouds or by the Earth's surface. However, if vegetation is present on the surface, the addition of solar-induced fluorescence (SIF) as a spectrally continuous surface light source dampens the relative depth of the lines, and this (relative) filling in of the Fraunhofer lines is a measure of the strength of fluorescence (Joiner et al., 2011; Frankenberg et al., 2011). The spectral-fitting window is made wide enough to cover multiple strong Fraunhofer lines and sufficiently narrow as to limit the presence of atmospheric absorption features. Spectral-basis functions derived from observations over vegetation-free non-fluorescent areas are used to describe the impact of atmospheric interaction and possible instrumental artefacts – the reference set. Accordingly, the SIF signal is computed by fitting the satellite-observed spectrum with a modelled reflectance spectrum assembled from the spectral-basis functions. Uncertainty in the SIF data emerges from measurement noise, the presence of optically thick clouds in the satellite field of view, and the fitting procedure, the latter depending on the quality and representativeness of the spectral-basis functions. To mitigate uncertainty, SIF observations with cloud cover fractions below 0.2 are used.
2.1.1 SIF retrieved from TROPOMI
In this study, we use level-2 SIF (740 nm) data retrieved from the TROPOspheric Monitoring Instrument (TROPOMI) by Caltech (Köhler et al., 2018). TROPOMI is an atmospheric spectrometer on board the Sentinel-5 Precursor that performs in a wide spectral range from the ultraviolet to the shortwave-infrared. The instrument was launched on 13 October 2017 and flies in a low-Earth polar sun-synchronous orbit with equatorial crossing at 13:30 local solar time (LST) and with a repeat cycle of 17 d (Veefkind et al., 2012). The 2600 km wide swath enables almost daily global coverage. TROPOMI SIF, with a spatial resolution of 7 × 3.5 km2 at nadir, is retrieved from a subset of the NIR band with a selected window ranging from 743 to 758 nm. TROPOMI SIF has a single-pixel 1σ uncertainty in the range of 0.3–0.5 mW m−2 sr−1 nm−1 (Köhler et al., 2018).
TROPOMI SIF has been previously used to track photosynthetic activity following extreme precipitation events in the US (Turner et al., 2021), during the dry season in the Amazon forest (Doughty et al., 2019), and over evergreen forests (Magney et al., 2019). Furthermore, it is extensively validated with GPP from multiple eddy covariance towers and with Orbiting Carbon Observatory-2 (OCO-2) SIF (Li and Xiao, 2022; Köhler et al., 2018). Until ESA's FLEX mission with a spatial resolution of 300 m (Drusch et al., 2016) is launched (in 2025), TROPOMI SIF is arguably the most appropriate data product to track photosynthetic activity from vegetation on a global scale from space. The main limiters in detecting the impact of LMTs on vegetation activity are the spatial scale of a TROPOMI pixel ( ± 20 km2) and the data not being available before April 2018.
2.1.2 SIF retrieved from GOME-2A
We also use clear-sky, gridded (level-3) SIF data from the Royal Netherlands Meteorological Institute (KNMI) Sun-Induced Fluorescence of Terrestrial Ecosystems Retrieval (SIFTER) v2 product (Kooreman et al., 2020; Van Schaik et al., 2020) retrieved from the Global Ozone Monitoring Experiment-2A (GOME-2A) sensor. The data have a spatial resolution of 0.5° × 0.5°. GOME-2A was launched on 6 November 2006 aboard the Meteorological Operational (Metop-A) satellite and flies in a sun-synchronous orbit with equatorial crossing at 09:30 LST. The GOME-2A swath covers 1920 km, resulting in a spatial resolution of 80 × 40 km2 at nadir. Due to a swath reduction on 15 July 2013, the spectral resolution thereafter was 40 × 40 km2. Despite the 160-times-coarser resolution of GOME-2A in comparison to TROPOMI, the GOME-2A SIF data are of relevance due to the long temporal record, starting from 2007. The GOME-2A SIF product is retrieved from a subset of band 4 with a selected window ranging from 734 to 758 nm, and the SIFTER retrieval principle is similar to that of TROPOMI SIF. GOME-2A SIF has a single-pixel uncertainty on the order of 0.6 mW m−2 sr−1 nm−1 (Van Schaik et al., 2020). The retrieval is considered most reliable in the period before the sensor switch in July 2013 (Van Schaik et al., 2020). After the July 2013 switch, degradation of the GOME-2A sensor and subsequent calibration updates in different level-1 data versions have posed difficulties in deriving a consistent, bias-free data record. Post hoc degradation corrections introduced in Van Schaik et al. (2020) have (at least partly) improved the consistency of the GOME-2A SIF data record in the post-2013 years.
We exclusively use the GOME-2A data from the years 2007–2012 for two main reasons. Firstly, this enables a constant satellite viewing geometry throughout the analysed time series. Secondly, we limit level-1 calibration issues associated with strong instrument degradation and unresolved differences in level-1 calibration post-processing within the dataset (Van Schaik et al., 2020; Gerlein-Safdi et al., 2020). Additionally, we applied a year-specific multiplicative correction to the SIF data, addressing the effect of instrument degradation on SIF. The corrections are determined over China's Gobi Desert, where vegetation is mostly absent and a constant near-zero SIF signal is expected. Supplement S1 describes the correction procedure in detail, and we note here that the (multiplicative) correction factors have values between 0.85 and 1.12 and that their application improves the correspondence between GOME-2A SIF and FluxSat GPP over northern China (Fig. S3).
Various applications have shown the data to be of good use for detecting the effects of heatwaves on GPP in Europe (Wang et al., 2020), quantifying GPP over Africa (Getachew Mengistu et al., 2021), and mapping the impact of El Niño on forest productivity in the Amazon (Fancourt et al., 2022). GOME-2A SIF has been validated with GPP from various eddy covariance flux towers in Africa (Getachew Mengistu et al., 2021).
2.2 Gross primary productivity (GPP) data
2.2.1 GPP from Tumbarumba flux tower
This study uses estimated GPP data from the Tumbarumba OzFlux eddy covariance flux tower site as a ground reference to the TROPOMI SIF observations (AU-TUM, 35.66° N, 148.15° E; Stol and Kitchen, 2022). The Tumbarumba site is located in the Bago State Forest and is predominately covered by eucalyptus forest. GPP is not directly measured but is calculated using partitioning methods by the extraction of modelled respiration from the measured net ecosystem exchange (NEE) of CO2. NEE at the site is quantified using the eddy covariance method, which involves simultaneously measuring vertical wind speed and CO2 concentration (Moene and Van Dam, 2014).
For our analysis, we use the quality-checked and gap-filled daily GPP (in gC m2 d−1) from the level-6 data. The Tumbarumba data are processed following the standard tool developed by OzFlux, which is described in more detail in Isaac et al. (2017). To match the recording time of TROPOMI SIF and account for the impact of the Dunn's Road fire that affected the OzFlux site in December 2020, GPP data between February 2018 and November 2020 are used.
2.2.2 FluxSat GPP product
The modelled global FluxSat GPP product is used as independent GPP data to compare against SIF and the OzFlux GPP data for the Australia case study. The dataset contains daily averaged GPP estimates (gC m−2 d−1) at a spatial resolution of 0.05° × 0.05° over the period from March 2000 to August 2020. The FluxSat GPP product was found to agree well with GPP from flux towers (Joiner et al., 2018), and TROPOMI-inferred GPP (Turner et al., 2021) and has previously been used to quantify changes in carbon uptake (e.g. Byrne et al., 2021; Bacour et al., 2019).
The global FluxSat GPP (Joiner et al., 2018) product is derived from the evaluation and training of satellite-data-driven models that are based on the light use efficiency concept (Monteith, 1972), which states that there is a linear relationship between GPP and the absorbed photosynthetically active radiation. The product's objective is to estimate GPP accurately at a high temporal (daily) and spatial resolution. MODIS reflectance (MCD43) data serve as vegetation index inputs for the model. Furthermore, the models are trained and calibrated using a subset of eddy covariance flux data that contains data across various plant types. In addition, GOME-2A SIF (v27; Joiner et al., 2013, 2016), a different SIF product from NASA, is used in the FluxSat calibration procedure to delineate highly productive regions that are not well fitted and are underestimated using the global regression model. Guanter et al. (2014) found that high GPP values from cropland deviated from the linear relationship. Therefore, highly productive regions were trained and calibrated separately using an eddy covariance GPP subset that met the high SIF and GPP criteria (Joiner et al., 2018). As GOME-2A SIF is merely used to identify productive areas, FluxSat GPP estimates remain largely independent from SIF.
We first investigate the case of a 2019 eucalyptus wildfire in southeastern Australia to evaluate the ability of SIF to capture the fire-induced change in vegetation dynamics. Lightning strikes on 16 January 2019 ignited multiple fires across remote forested areas in Victoria, southeast Australia. Strong northwesterly winds propagated and coalesced several individual fires into a clustered eucalyptus fire, which is locally known as the Nunnett–Timbarra River fire due to its extent between the Nunnett State Forest and the Timbarra River. Burning for nearly 4 weeks, the wildfire impacted around 210 km2 of eucalyptus forest spanning from 37.35–37.2° S to 148.0–148.2° E. The impacted area had not previously been affected by wildfires within the 25 years prior to the event (Lindenmayer and Taylor, 2020). The fire has been documented to have caused a sharp reduction in leaf biomass in January 2019 but left eucalypt tree stems and branches mostly intact, according to witness reports by the Australian Forestry Service.
Figure 1 shows the location of the area impacted by the Nunnett–Timbarra River fire in the context of the wider biogeography of southeast Australia. Notably, Fig. 1c and d show that prior to the fire, the area enclosed by the solid line (which would burn down in early 2019) as well as the surrounding area bound by the dashed line (which was spared from the fire) had high levels of SIF and GPP, indicating vigorous growth conditions in both areas under normal circumstances.
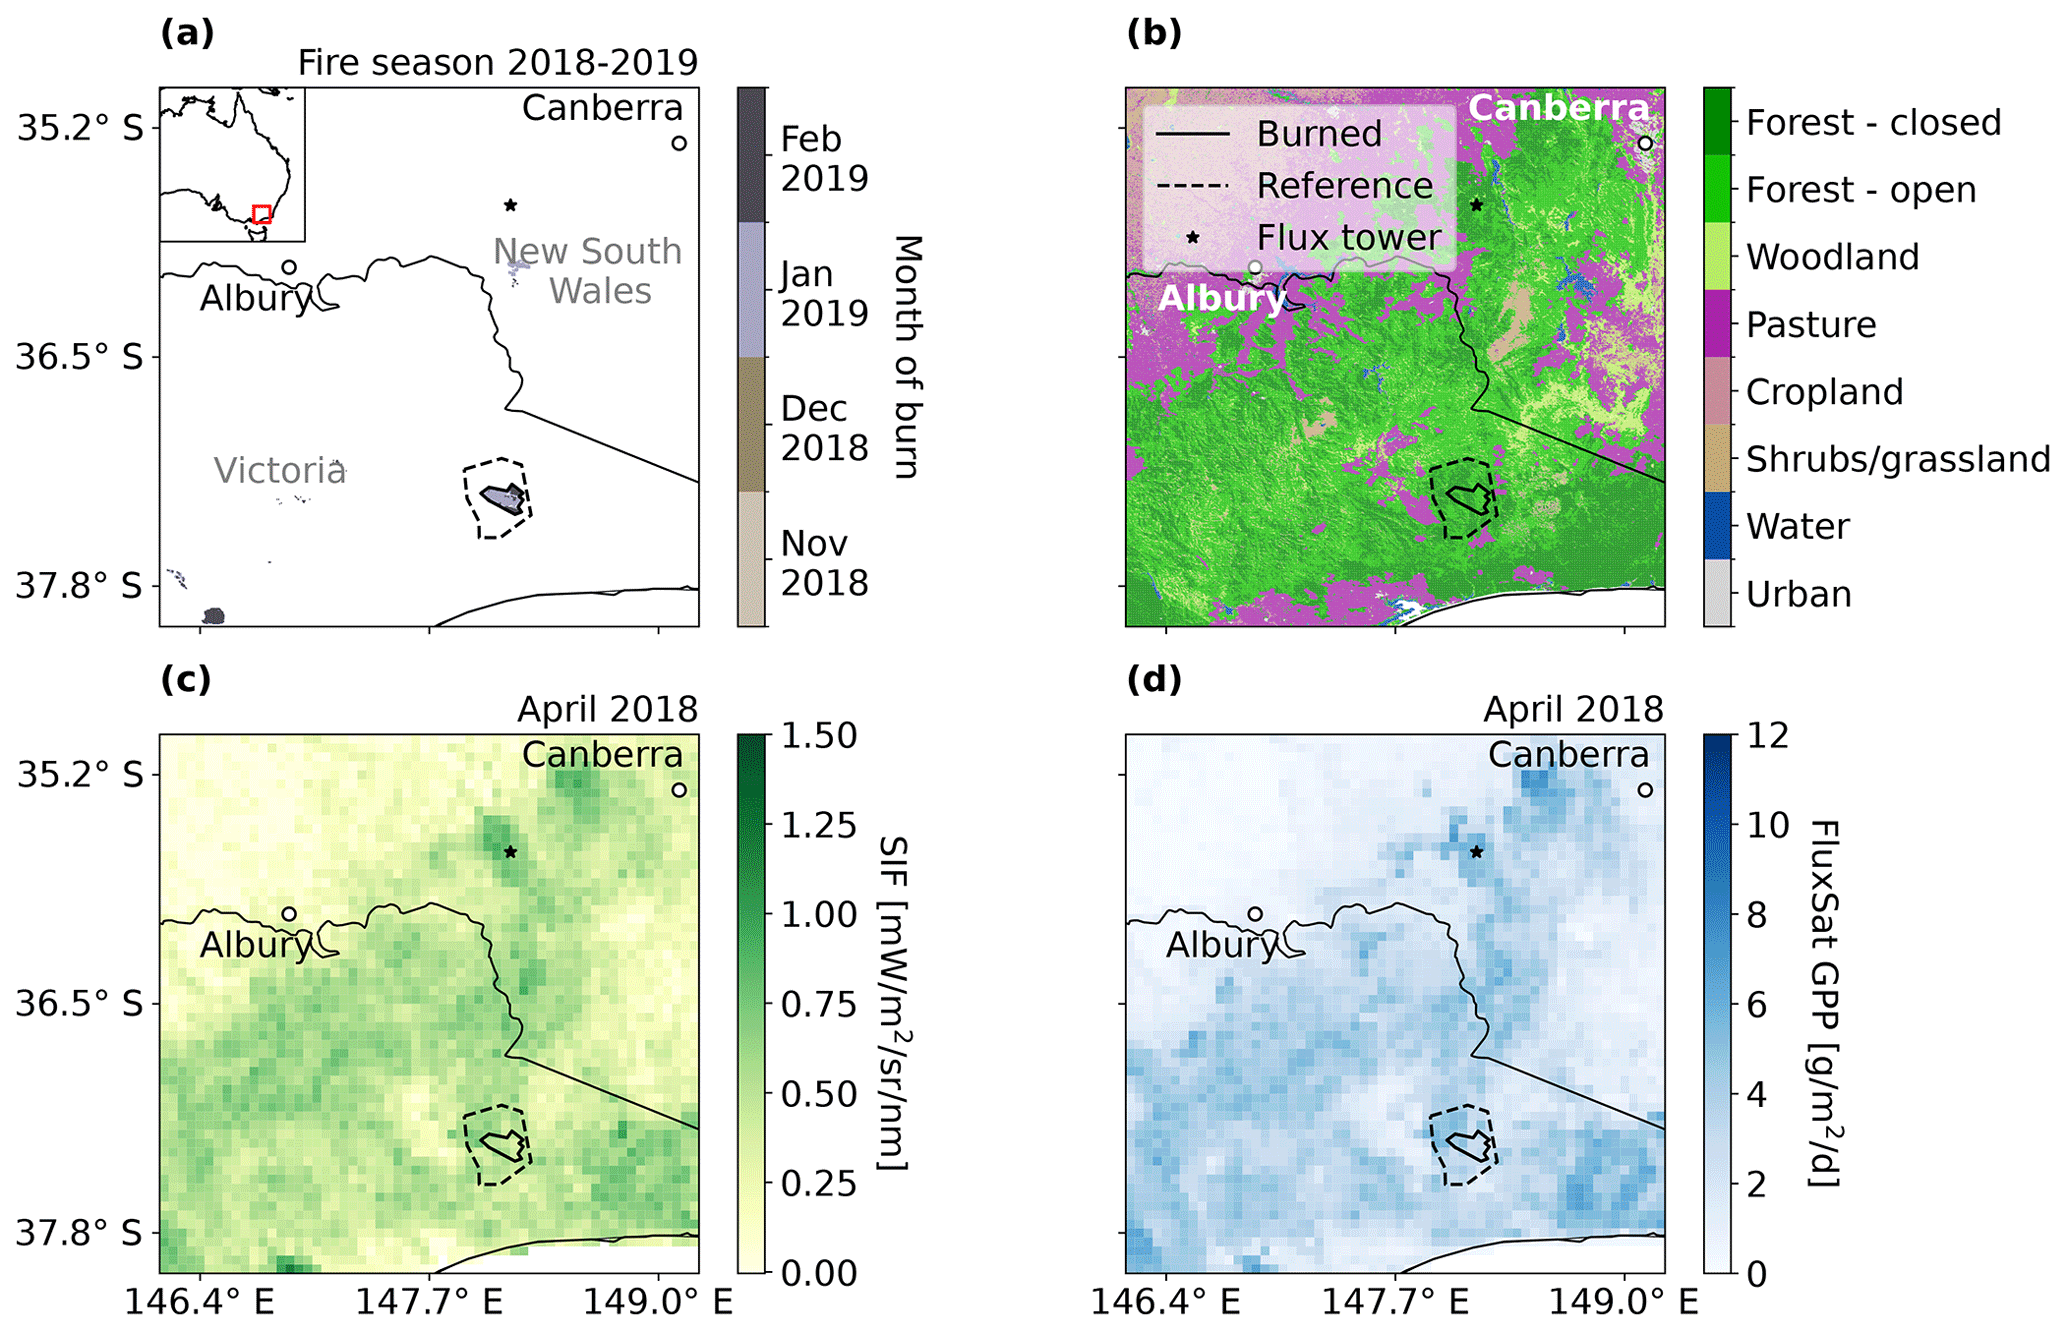
Figure 1Location and extent of the Nunnett–Timbarra River fire and selected reference area. Maps of (a) the burned area per month of burn from the MODIS MCD64A1 Burned Area product (Giglio et al., 2015), (b) dominant land cover over the area with classification based on the 2015 Land Cover Dataset (Lymburner et al., 2015), (c) monthly mean TROPOMI SIF (0.05° × 0.05°), and (d) monthly mean FluxSat GPP (0.05° × 0.05°) in April 2018. The outlines of the burned area (approximately 210 km2) and reference area (approximately 975 km2) are indicated by the solid and dashed lines, respectively. Location of the Tumbarumba OzFlux site (AU-TUM) used in this study is shown as a black star.
3.1 Reduction in SIF following the eucalyptus forest fire
We evaluate the spatial and temporal trends in TROPOMI SIF over the burned area from February 2018 until November 2020. The monitoring period ends in November 2020 to avoid potential interference from subsequent wildfire events that occurred in December 2020 and affected the studied region (Bowman et al., 2021). The extent of the eucalyptus fire is identified using the MODIS MCD64A1 Burned Area monthly product (Giglio et al., 2015) (Fig. 2a), and the impacted burned area is defined as the region encompassing the MODIS burned pixels, indicated by the solid lines in Figs. 1 and 2a and b. Next, for comparison, we carefully selected a reference area surrounding the burned area that remained unaffected by the fire. This reference area was chosen to closely match the biogeography of the impacted area, consisting of a mixture of open and closed eucalyptus forest (Fig. 1b). SIF observations over the reference area are assumed to represent the forest dynamics over the burned area as if the fire had not taken place.
To evaluate temporal trends in SIF over both areas, we categorized TROPOMI level-2 pixels as either “burned” or “reference” based on their spatial overlap with each respective area. Criteria were implemented for each group to ensure pixel exclusivity and minimize interference. Pixels were labelled as burned if the burned-area fraction exceeded 50 %. Pixels were labelled as reference if they comprised less than 30 % of the burned area. Subsequently, within each group, the SIF values were averaged on a monthly basis. Note that throughout the reporting of the results, all uncertainty values are stated in standard error (SE).
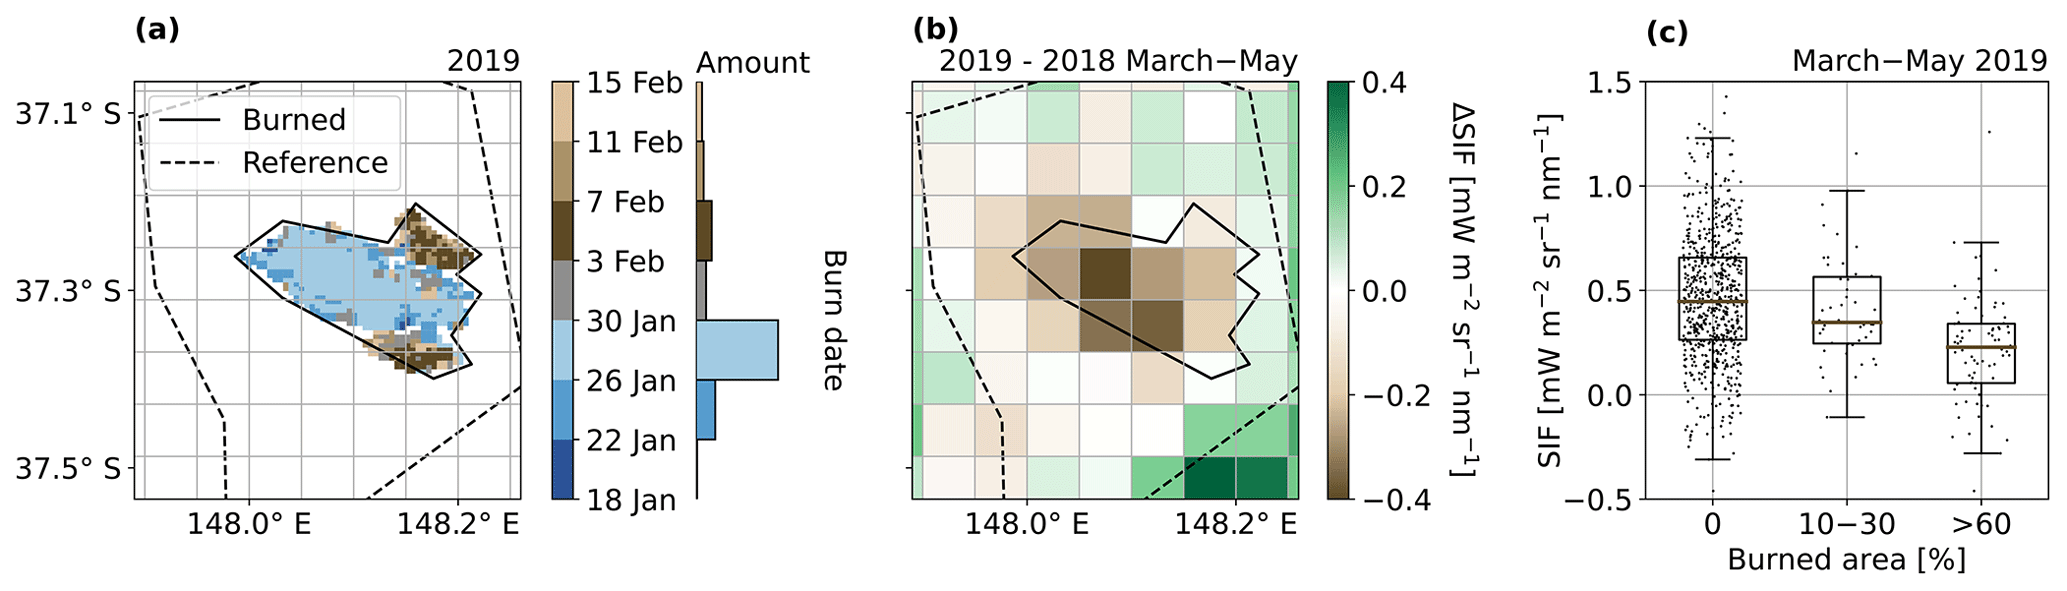
Figure 2Impact of the 2019 eucalyptus fire on TROPOMI SIF over time and in comparison to the unburned reference area and pre-fire conditions. Map of (a) the burned area and specific burn data at a 1 km scale from the MODIS MCD64A1 Burned Area product and (b) the difference in SIF between post- (2019) and pre-fire (2018) conditions in March–May (autumn). Brown indicates higher SIF in 2018 (pre-fire); green indicates higher SIF in 2019 (post-fire). (c) Correlation between SIF in March–May 2019 (post-fire) and the coverage of the 500 m burned-area pixels by the SIF pixels, in percentage.
Figure 2b shows the difference in SIF between autumn 2019 (post-fire) and 2018 (pre-fire). Over the area that burned down, autumnal SIF values in 2019 decreased significantly compared those in to 2018. In contrast, SIF at the reference area remained consistent across both years. Furthermore, the lowest SIF values (0.25 mW m−2 sr−1 nm−1) coincide with pixels with burned-area fractions higher than 60 %, whereas SIF is much higher (0.45 mW m−2 sr−1 nm−1) in pixels that had not burned, as illustrated in Fig. 2c. We conclude that TROPOMI SIF is capable of capturing the strong reduction in vegetation activity over the burned area relative to the unburned reference area, noting that the affected area extends over some 200 km2, equivalent to eight individual TROPOMI pixels.
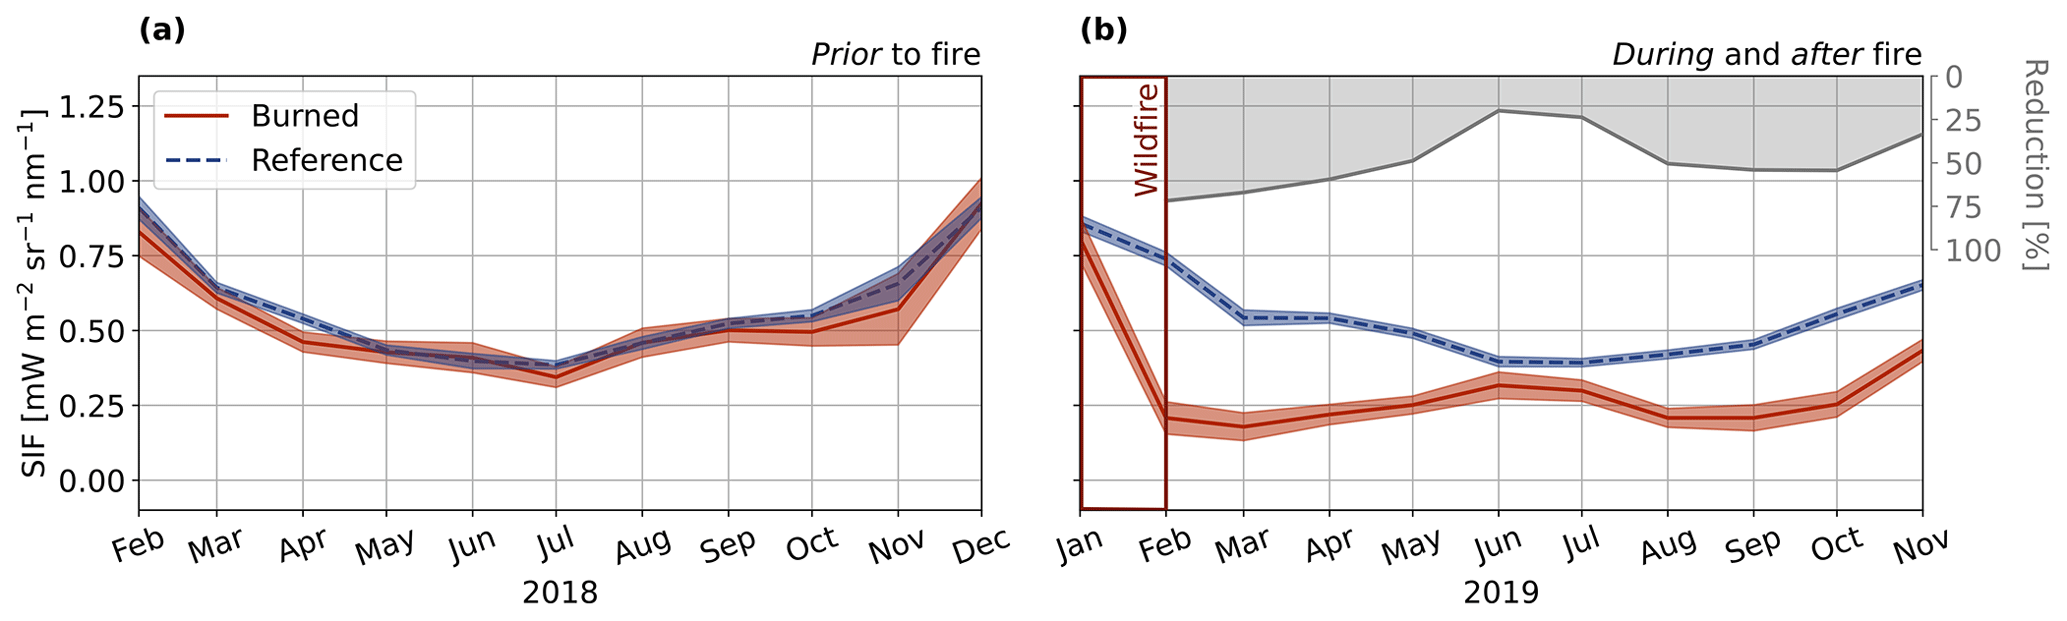
Figure 3Time series of SIF over the burned and reference areas (a) prior to the fire in 2018 and (b) during and after the fire in 2019. The shaded red and blue areas represent the standard error (SE) in monthly SIF over the burned and reference areas, respectively. The right y axis of panel (b) shows the reduction in SIF (in %) over the burned area (FB) as compared to SIF over the reference area (FR), which is calculated as . Prior to monthly averaging, SIF pixels beyond ± 2σ from their respective seasonal group mean were removed.
Figure 3a shows the seasonal cycle in 2018 (pre-fire) inferred from TROPOMI SIF over the to-be-burned and reference areas. Prior to the fire event, the observed SIF values indicate consistency and strong agreement between the two areas (r=0.97; Fig. S4a). However, shortly after the fire, a substantial reduction in SIF over the burned area becomes evident (Fig. 3b). This immediate fire-induced impact is highlighted by a striking 72 % decrease in February SIF values compared to those of the reference area. In the subsequent months, the vegetation activity over the burned area remained low but non-zero, with an averaged SIF of 0.26 ± 0.01 mW m−2 sr−1 nm−1 between February and August 2019. During springtime (September–November), vegetation recovery was noticeable, with SIF values reaching 0.43 ± 0.04 mW m−2 sr−1 nm−1 by November. In fact, SIF grew faster in springtime over the burned area than over the reference area, with respective increases of 208 % and 144 %, hinting at accelerated regrowth in a moderately burned area, a trend which has also been reported in Zambia and Alaska (Chungu et al., 2020; Madani et al., 2021).
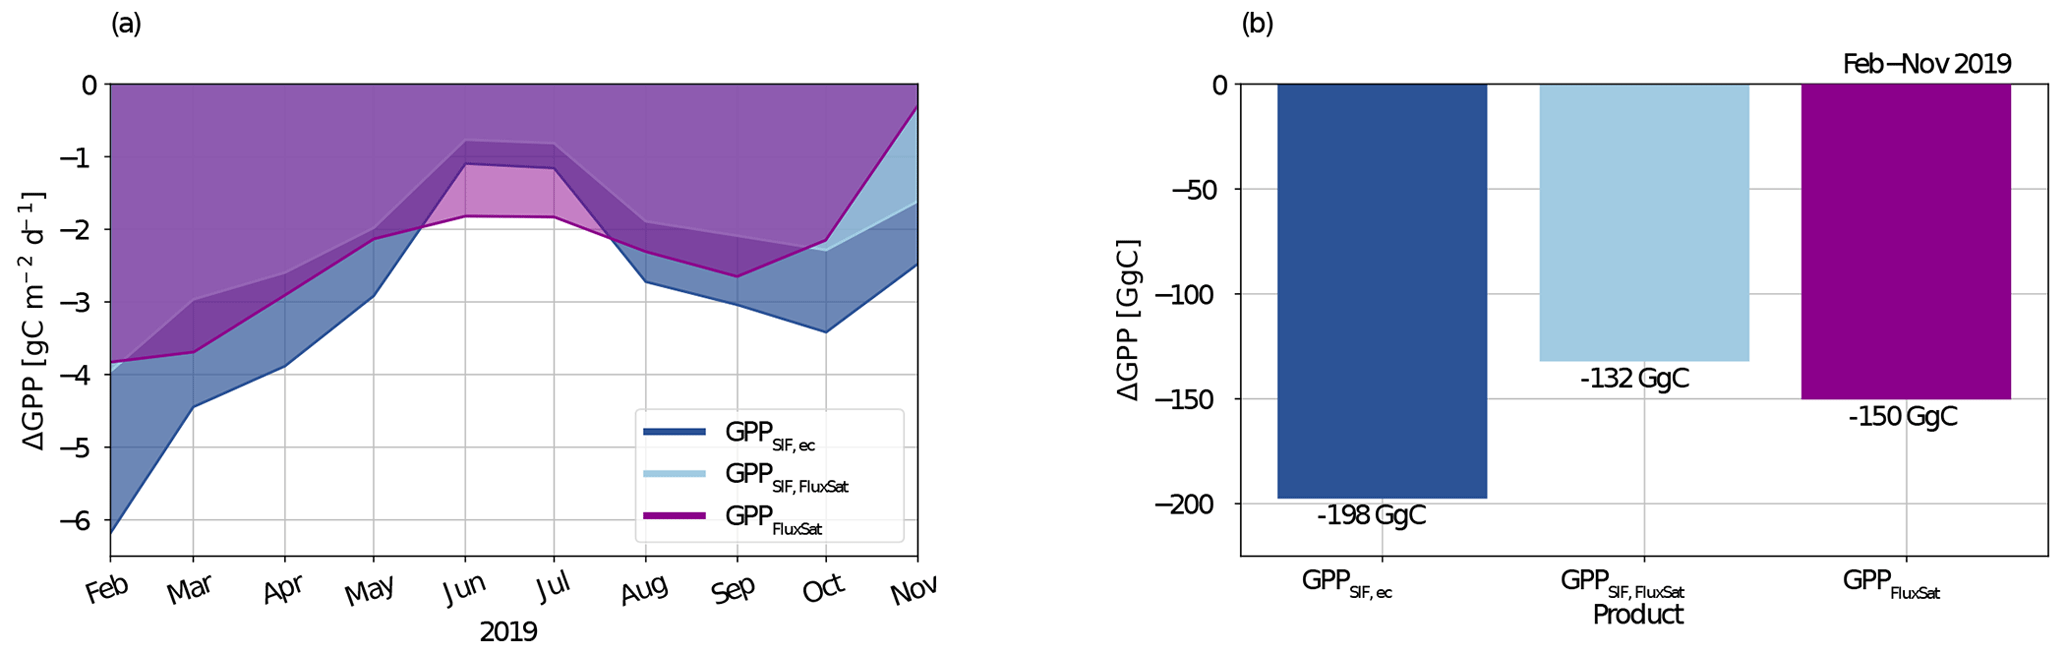
Figure 4Reduction in GPP following the eucalyptus wildfire over the first 8 months post-fire (February–November 2019). (a) Time series of reduced GPP and (b) bar plot of total reduction obtained from SIF-based GPP using data from the Tumbarumba eddy covariance site (GPPSIF, ec), SIF-based GPP using FluxSat GPP (GPPSIF, FluxSat) over Tumbarumba, and FluxSat GPP (GPPFluxSat), shown in dark blue, light blue, and purple, respectively.
3.2 Quantifying the fire-induced reduction in GPP
Next, based on the observed reduction in SIF, we quantify the fire-induced reduction in GPP. Previous studies found space-based SIF observations to be proportional to GPP at the canopy scale. This proportionality is defined by biome-specific linear relationships that are widely used to scale SIF to GPP (e.g. Turner et al., 2020; Liu et al., 2017; Sun et al., 2018). Building upon this recognized relationship between SIF and GPP, we assume that the relative reduction in SIF (Sect. 3.1) represents the loss in GPP (ΔSIF ∝ ΔGPP). Consequently, we express the fire-induced change in GPP over the burned area ΔMB(t) (in gC m−2 d−1) over month t as the product of the relative change in SIF (ΔFB(t)) and the “baseline” GPP (MR (t)) over the reference area (as if no fire had occurred):
To compute the SIF-based GPP over the reference area (MR (t)), we first characterize the SIF–GPP relationship using GPP data from a representative eddy covariance site (see Supplement S2). Specifically, GPP data from the nearby Tumbarumba (AU-TUM) site (Stol and Kitchen, 2022) are used to compare against TROPOMI SIF. We obtain the SIF-based GPP over the reference area using the following equation:
where FR (t) represents the SIF evolution over the reference area and is the local SIF–GPP relationship over the Tumbarumba flux site. We hold the empirical SIF–GPP relationship over Tumbarumba to be applicable to our study area. This is supported by (i) the similar biogeography of lowland eucalyptus forest in both areas (Fig. 1b), (ii) the strong spatiotemporal correlation between TROPOMI SIF over Tumbarumba and over the reference area in the year prior to the fire (r=0.92; Fig. S4b), and (iii) the good correlation between FluxSat GPP estimates over Tumbarumba and over the reference area in the year prior to the fire (r=0.79; Fig. S4c). Moreover, the discrepancy between SIF–GPPFluxSat over Tumbarumba and the Nunnett–Timbarra River area is small: on the order of 4 % (Supplement S2.1)
As an alternative, we also compute SIF–GPP relationships over Tumbarumba using TROPOMI SIF and modelled FluxSat GPP. The temporal dynamics of TROPOMI SIF exhibit strong consistency with both the GPP estimated from eddy covariance flux tower data (r=0.91) and the modelled (FluxSat) GPP (r=0.94), providing some confidence in both estimates. However, the SIF–GPP relationship based on the flux tower GPP measurements is 1.6 times stronger than the relationship based on the FluxSat GPP data (Table S2.1, Fig. S5a). This discrepancy likely arises from higher GPP estimates from the eddy covariance flux tower – nearly twice that of the estimates from FluxSat (Fig. S5b) – and inherited uncertainties and biases in the estimates of the FluxSat GPP product. Our findings are consistent with Joiner et al. (2018), who also observed magnitude differences up to a factor of 2 between FluxSat GPP and independent FLUXNET 2015 GPP data at some sites. Despite differing footprint sizes between the Tumbarumba tower and FluxSat model, this is not expected to significantly impact the uncertainty, given the extensive land cover around the tower (Supplement S2.1).
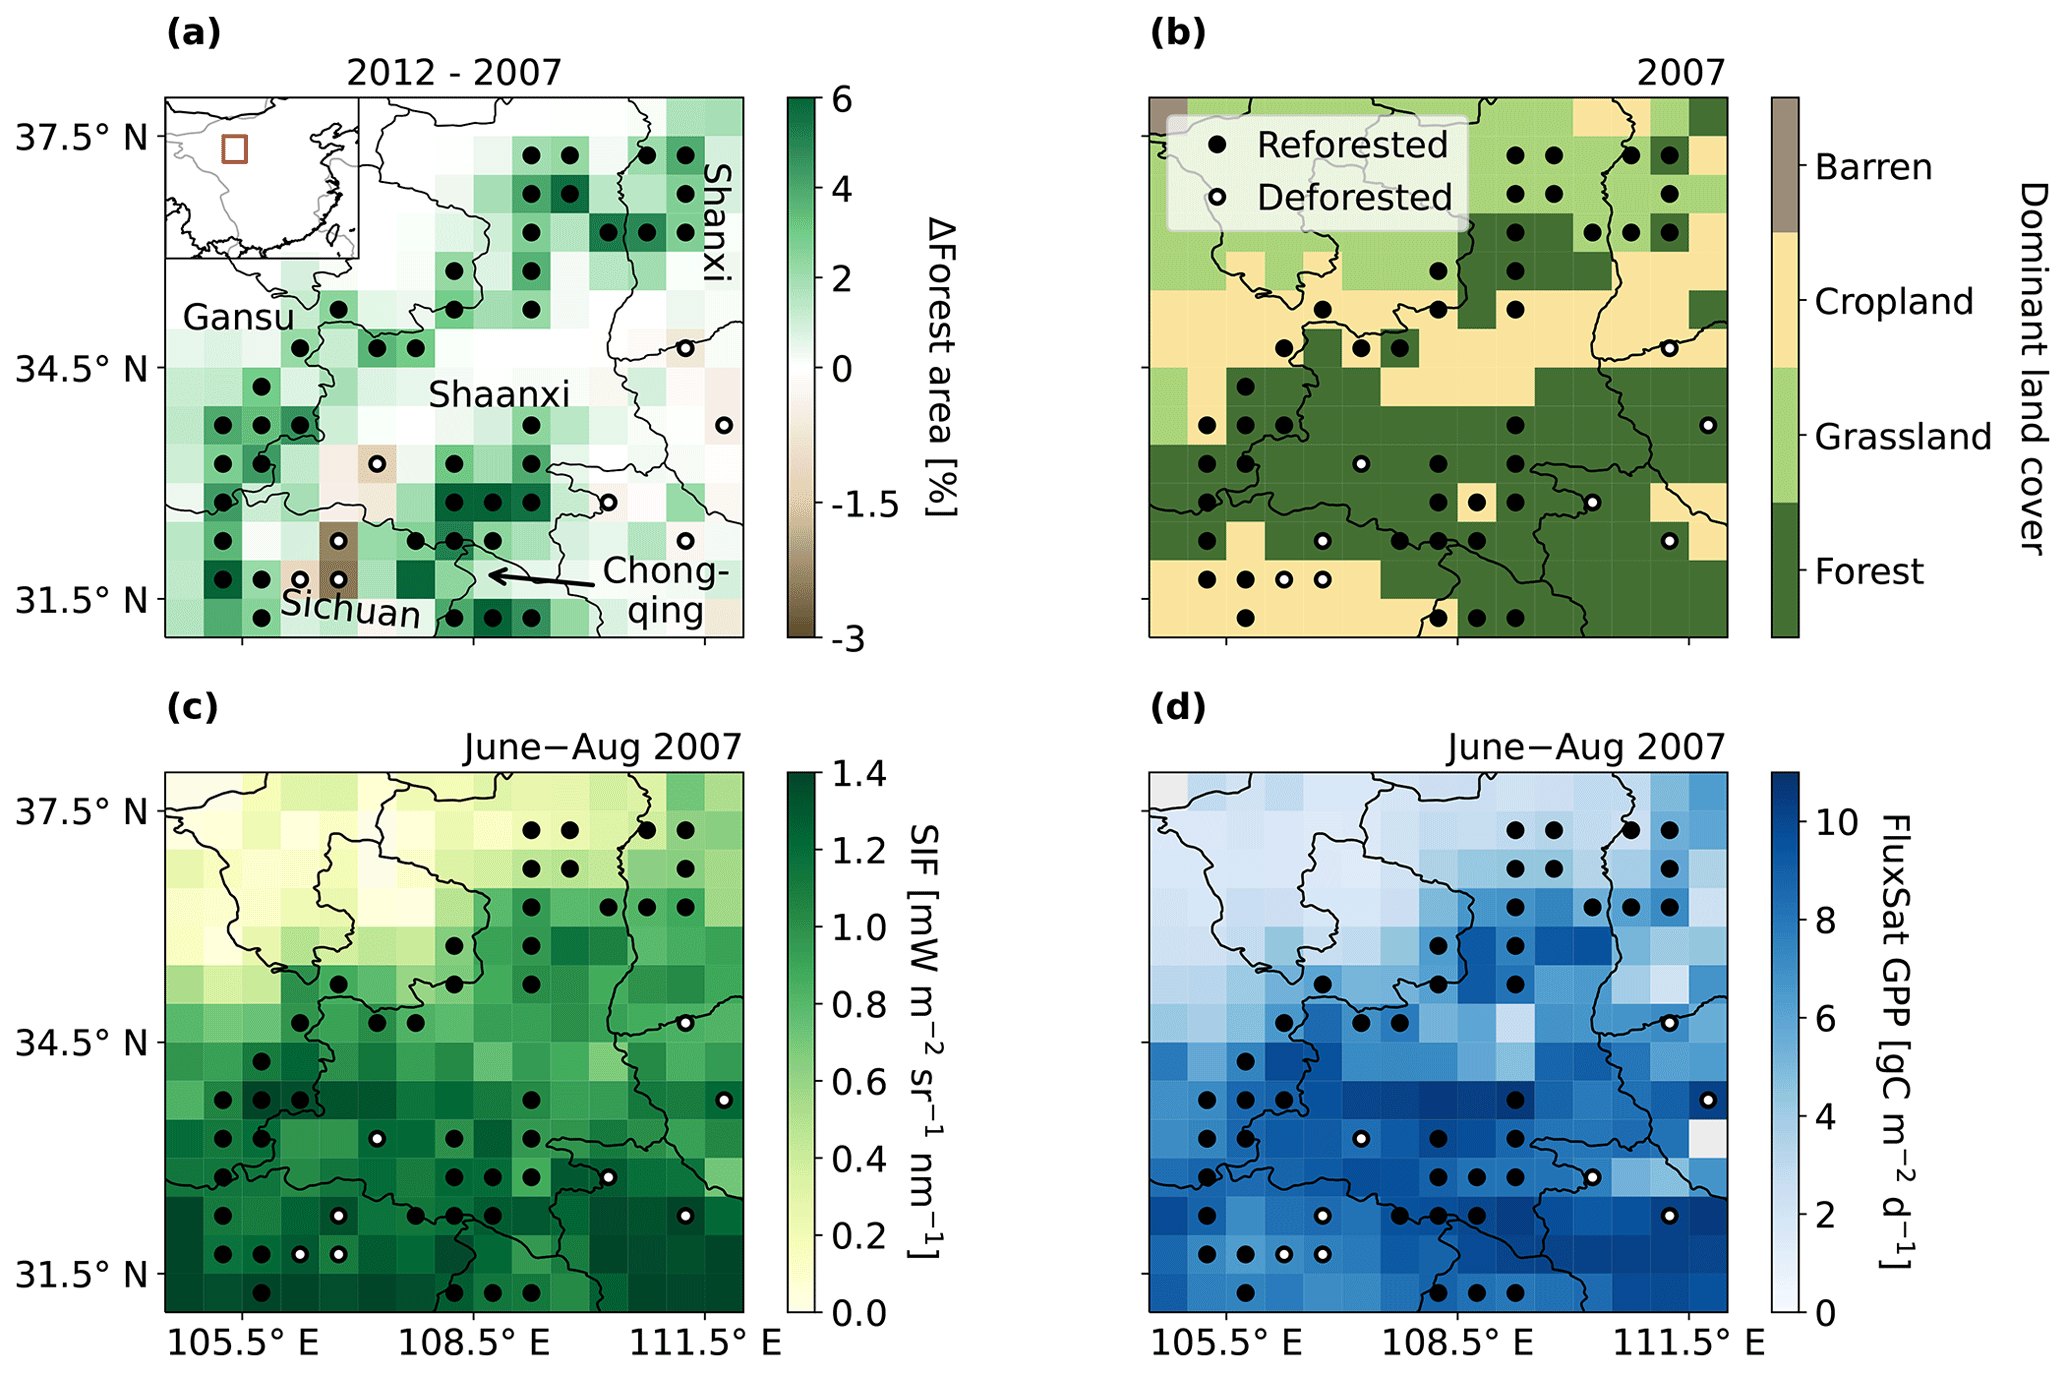
Figure 5Location and extent of the reforestation efforts between 2007 and 2012 over the study region in northern China. Maps of (a) changed forest cover in 2012 with respect to 2007 (in % of cell area) obtained from the China land-cover dataset (CLCD) (Yang and Huang, 2021), with green indicating higher forest coverage in 2012 (reforestation) and brown indicating higher forest coverage in 2007 (deforestation) and (b) dominant land cover in 2007 with classification based on the CLCD, aggregated over the 0.5° × 0.5° GOME-2A SIF grid. Croplands are shown in yellow, grasslands in light green, and forests in dark green. Maps of (c) GOME-2A SIF (Van Schaik et al., 2020) and (d) FluxSat GPP (Joiner et al., 2018), averaged over summertime (June–August) 2007. Selected reforested cells and deforested cells are indicated by black-filled and white-filled circles, respectively.
Finally, we estimate the reduction in GPP employing SIF–GPP relationships that use (1) the eddy covariance GPP data and (2) FluxSat GPP data over Tumbarumba – hereon referred to as GPPSIF, ec and GPPSIF, FluxSat, respectively. Additionally, we compute the reduction in GPP from the FluxSat GPP data directly over the burned and reference areas, referred to as GPPFluxSat. Figure S6 shows an overview of the three approaches to compute ΔGPP.
Figure 4a shows the estimated fire-induced reductions in GPP over time. The SIF-based approaches, GPPSIF, ec and GPPSIF, FluxSat, show a sharp reduction in GPP immediately after the fire. This is followed by smaller GPP deficits in winter, when vegetation activity is low. The FluxSat data (GPPFluxSat) also show a direct local impact of the wildfire on GPP. However, the FluxSat data suggest an almost complete recovery in November, in contrast to our SIF-based results.
When integrated over the period from February to November 2019 and across the burned area, we find SIF-based GPP losses ΔGPPSIF, ec and ΔGPPSIF, FluxSat of 198 and 132 GgC, respectively. The SIF-based GPP losses reflect a reduction of 48 % with respect to GPP over the same period in the reference area. Thus, the estimated SIF-based losses are in the range of 130–200 GgC over the initial 8 months post-fire. For comparison, ΔGPPFluxSat indicates a fire-induced loss of 150 GgC over the burned area between February–November compared to the reference area. The total GPPFluxSat over the burned area during this period is 58 % less than over the same period and area in 2018 (pre-fire conditions).
An uncertainty propagation analysis, described in Supplement S2.1, indicates a total uncertainty of approximately 60 % in the estimated SIF-based GPP losses. This total uncertainty is primarily driven by the use of the SIF–GPP relationship at Tumbarumba, where no fire occurred, to derive our GPP-loss estimate via Eq. (2) over the Nunnett–Timbarra River area that burned down – introducing an estimated uncertainty of 50 %. This uncertainty was determined by comparing SIF and FluxSat GPP relationships under pre-fire and post-fire conditions (see point 2 in Supplement S2.1). We conclude that estimating changes in GPP based on land-cover changes is possible with TROPOMI SIF in combination with empirical SIF–GPP relationships, at least when such land-cover changes occur over a spatial scale of a few hundred km2.
We now turn to examining how GOME-2A can be used to monitor the impact of reforestation on carbon uptake in parts of northern China. Our study area includes Shaanxi province, southwestern Shanxi, eastern Gansu, and part of northern Sichuan and Chongqing. This region spans approximately 31 to 38° N and 105.0 to 111.5° W (Fig. 5a). Over the past 15 years, the area has undergone various greening campaigns like Grain for Green, the Natural Forest Conservation Program, and the Three-North Shelterbelt Program (Delang and Yuan, 2015; Kong et al., 2021). These efforts have led to observable positive trends in vegetation activity (Gerlein-Safdi et al., 2020; Lin et al., 2020; Li et al., 2015; Sun et al., 2015; Cao et al., 2009).
.
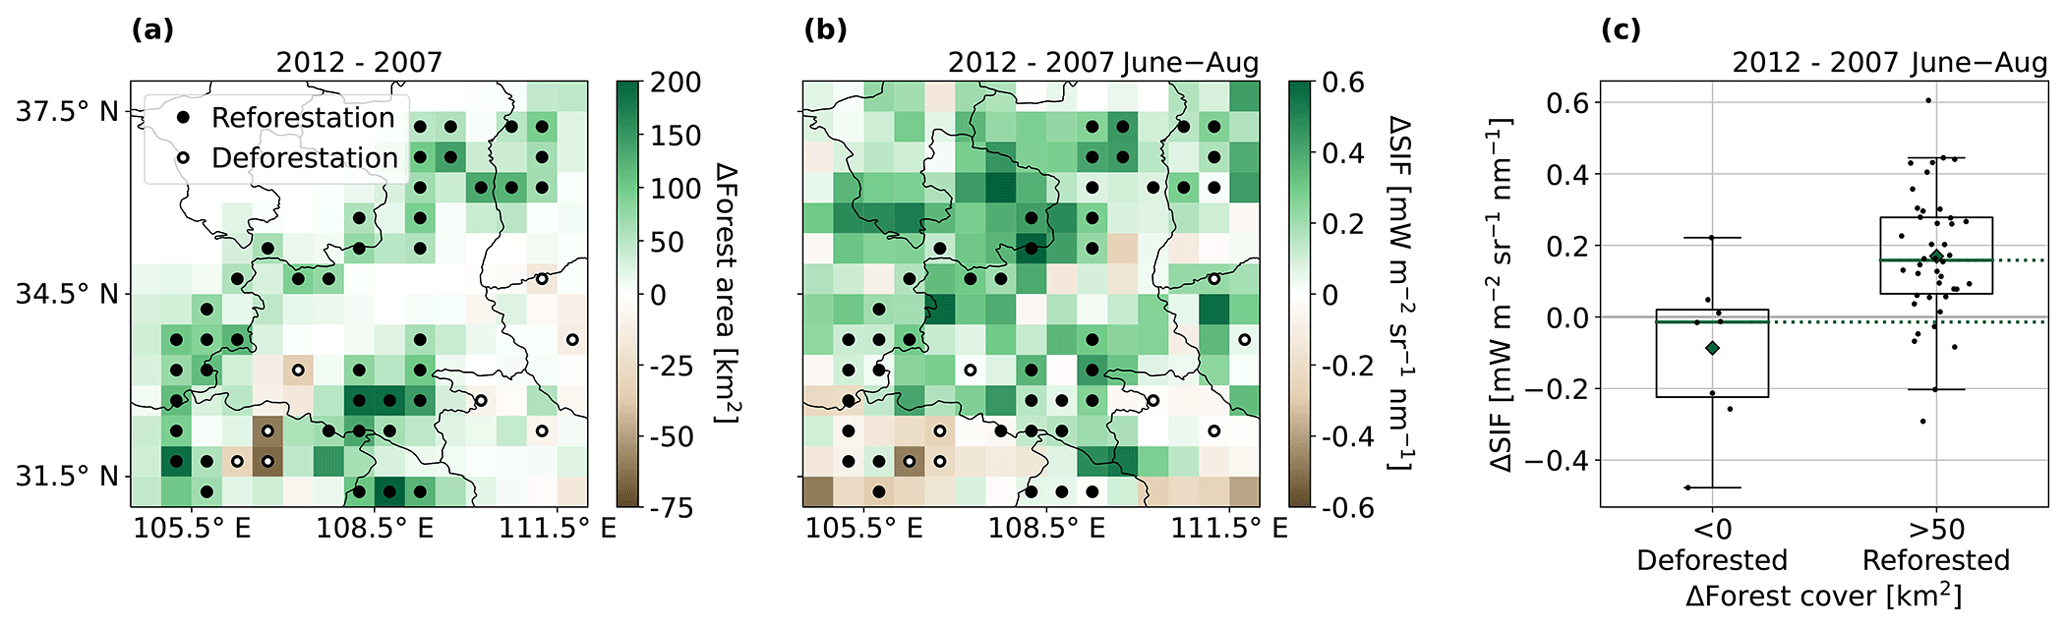
Figure 6Impact of increased forest coverage in northern China between 2007 and 2012. Maps of changed (a) forest coverage (in km2) calculated from the China land-cover dataset (Yang and Huang, 2021) and (b) summertime GOME-2A SIF during the 6 years. Green indicates higher forest coverage/SIF in 2012 and brown indicates higher forest coverage/SIF in 2007. (c) Contrast in GOME-2A SIF trends between 2007 and 2012 over the deforested and reforested cells. The reforested and deforested cells are indicated by black-filled and white-filled circles in (a) and (b). The SIF data are obtained from the GOME-2A SIFTER v2 dataset by Van Schaik et al. (2020)
Figure 5a and b show that most of the forest gain occurred within and at the borders of Shaanxi province, predominantly over areas dominated by forest or cropland cover. Concurrently, Fig. 5c and d show that high SIF and FluxSat GPP values generally occur in the vegetated southern part of the domain, including the regions where reforestation has taken place, with lower average SIF and GPP values observed in the drier northern part of the region.
4.1 Coinciding increase in forest cover and SIF
We first examine the 2007–2012 variability in summertime (June–August) GOME-2A SIF, when vegetation productivity is at a maximum. To evaluate the changes in SIF, we used the first Landsat-derived annual China land-cover dataset (CLCD) (Yang and Huang, 2021). These satellite-based data categorize nine major land types such as cropland, forest, and grassland at a spatial resolution of 30 m. Specifically, we extracted forest-coverage data for each year between 2007 and 2012, aggregated over the 0.5° × 0.5° GOME-2A SIF grid. The conversion to forest, from any type of land cover, was determined by quantifying the change in forest cover relative to the 2007 baseline. We then compared changes in summertime SIF between 2007 and 2012 over two contrasting groups of cells: reforested (n=42) and deforested (n=8). We classify cells as “reforested” if they gained more than 2 % of their area in forest coverage (approximately 50 km2) and as “deforested” (n=8) if they lost forest coverage during this period, as shown in Fig. 6a. Cells in both groups consistently gained or lost forest coverage with every passing year from 2007 to 2012.
The majority of reforested cells showed an increase in average summertime SIF, whereas most deforested cells experienced a decrease (Fig. 6b). Figure 6c shows the clear contrast in SIF trends across cells that gained forest coverage compared to those that lost forest coverage. Reforested cells exhibited a significant increase in SIF of 0.17 ± 0.03 mW m−2 sr−1 nm−1, while SIF decreased by 0.09 ± 0.07 mW m−2 sr−1 nm−1 over the deforested cells between 2007 and 2012. The contrasting trends in vegetation activity indicated by GOME-2A SIF over the reforested and deforested cells are confirmed by co-sampled independent data from the near-infrared reflectance of vegetation (NIRv) and FluxSat GPP (Fig. 7a and b).
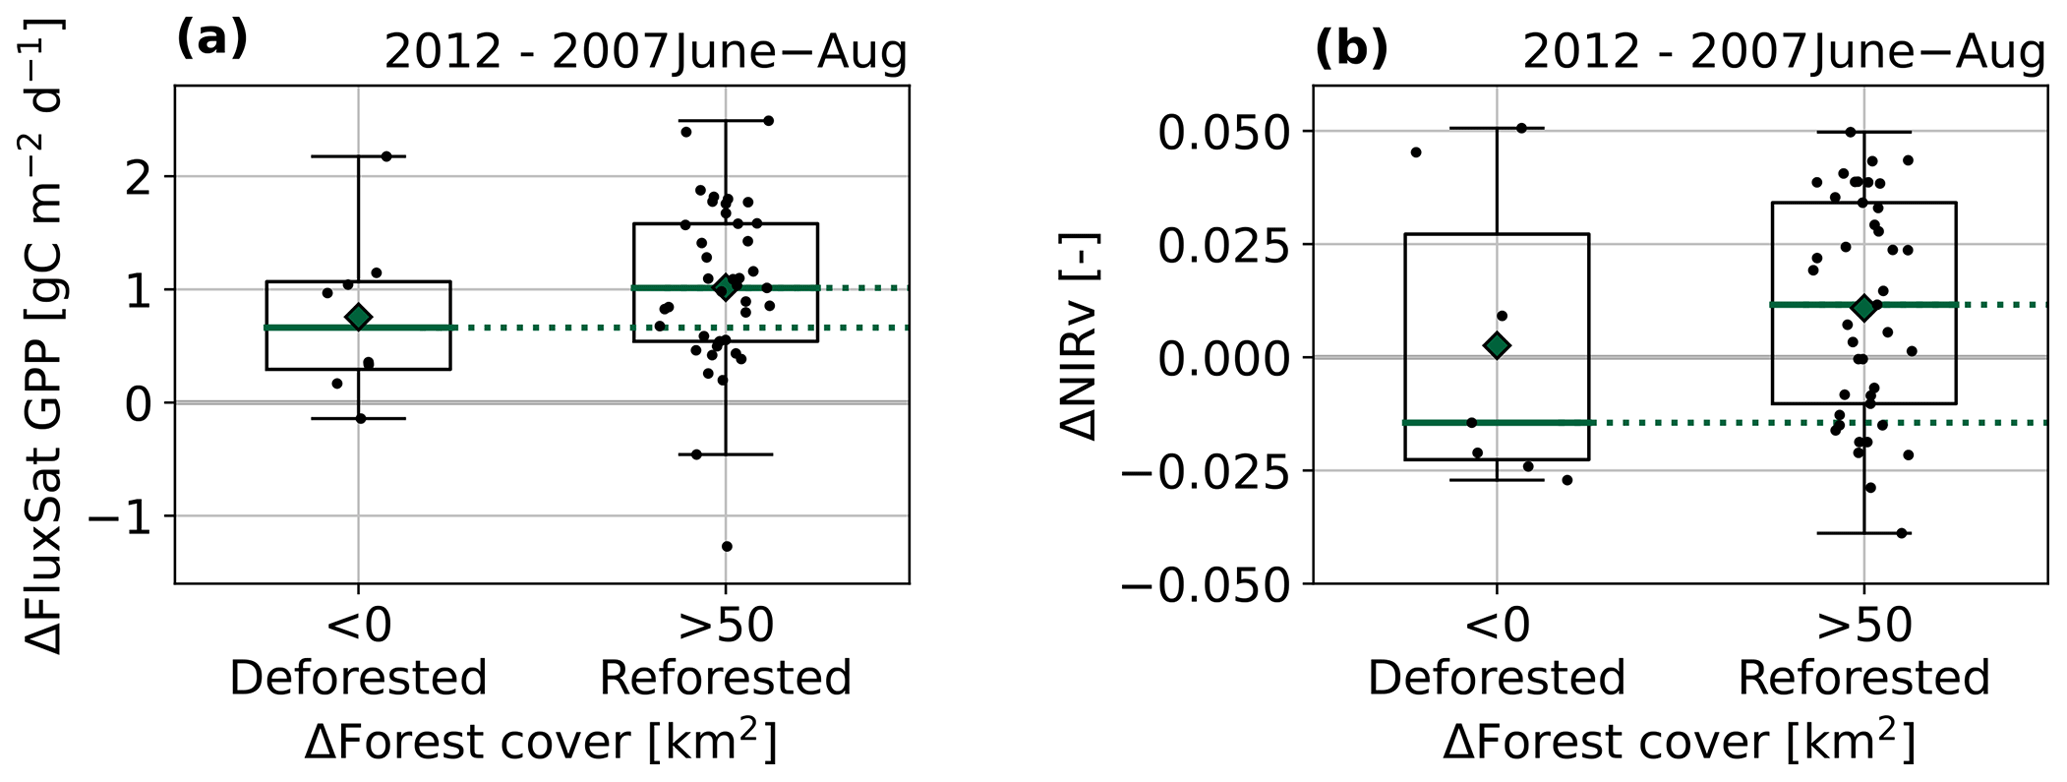
Figure 7Contrast in changed vegetation activity between deforested and reforested cells between 2012 and 2007, shown using (a) FluxSat GPP and (b) the near-infrared reflectance of vegetation (NIRv) retrieved from MODIS.
Temporal SIF variability across northern China is driven not only by reforestation alone but also by co-occurring changes in local climate factors that influence plant growth, such as water availability, heat, and the presence of photosynthetically active radiation (Zhang and Ye, 2021; Gao et al., 2019; Lin et al., 2020). To examine the co-occurring impact of climate variability and changes in forest cover, we use satellite-based soil moisture and maximum temperature. Soil moisture data were obtained from the Surface Soil Moisture (Active) product (Dorigo et al., 2019) and the daily maximum temperature was derived from hourly 2 m temperature from ERA5-Land data (Muñoz Sabater, 2019). Both were aggregated to the 0.5° GOME-2A SIF grid. The summers from 2007 to 2012 in Shaanxi and surrounding provinces are characterized by soil moisture values (50 %–55 %; Fig. S7b) that are generally good for plant growth, showed a slight increase over time (1 % yr−1), and had relatively stable (average) maximum temperatures (Fig. S7a). The summer of 2010 was somewhat of an exception, with a maximum temperature more than 1 °C below the multi-annual mean, which we interpret as indicating lower radiation levels. Overall, we expect that interannual variability in climate factors favoured forest growth between 2007 and 2012 in both the reforested and deforested areas, in line with previous studies (e.g. Zhang et al., 2022). Overall conditions for vegetation growth appear more favourable in cells where reforestation occurred, as maximum temperatures were more moderate (23 °C) and soil moisture was higher (53 %) in the cells with reforestation than in cells with deforestation.
4.2 Interpretation of temporal variability in SIF
We constructed a simple model that expresses the local year-to-year variability in summertime SIF as a linear combination of soil moisture (S; in %), maximum temperature (T; in °C) averaged over spring to summertime (March–August), and the total forest coverage (A; in km2): Eq. (3). This model serves to explore the impact of different climatic drivers on observed SIF, representing vegetation activity, alongside the effect of change in vegetation. The selection of this model is motivated by three factors: (i) soil moisture promotes the thriving of vegetation by enhancing the water availability, (ii) increasing temperature stimulates vegetation activity until an optimal temperature is reached (Gao et al., 2019) and is a proxy for photosynthetic active radiation, and (iii) total photosynthetic carbon uptake increases with increasing vegetation cover. Note that the climate parameters are averaged over the spring and summer period (March–Aug) to account for the concurrent and lagging effects on the vegetation activity over summer (e.g. Sun et al., 2021).
We use a multivariate-least-squares regression to optimize the combined fit coefficients that best explain the observed SIF over the reforested and deforested cells. Modelled SIF as a function of the year (between 2007 and 2012), Fmod (t), is expressed as
where α, β, γ, and δ represent the coefficients that minimize the discrepancies (ϵ) between Fmod (t) and the observed GOME-2A time series Fobs (t). The predictors of soil moisture, maximum temperature, and forest cover are indicated by S(t), T(t), and A(t), respectively, over the year t. To ensure sufficient statistics, we pooled the time series of SIF (n=6) from all 50 selected cells, resulting in a single cell-ensemble fit. Overall, the modelled variability in SIF matches the measured variability reasonably well (R2=0.57; n=300). Figure 8a shows the correlation between the observed (Fobs) and modelled (Fmod) SIF over all cells.
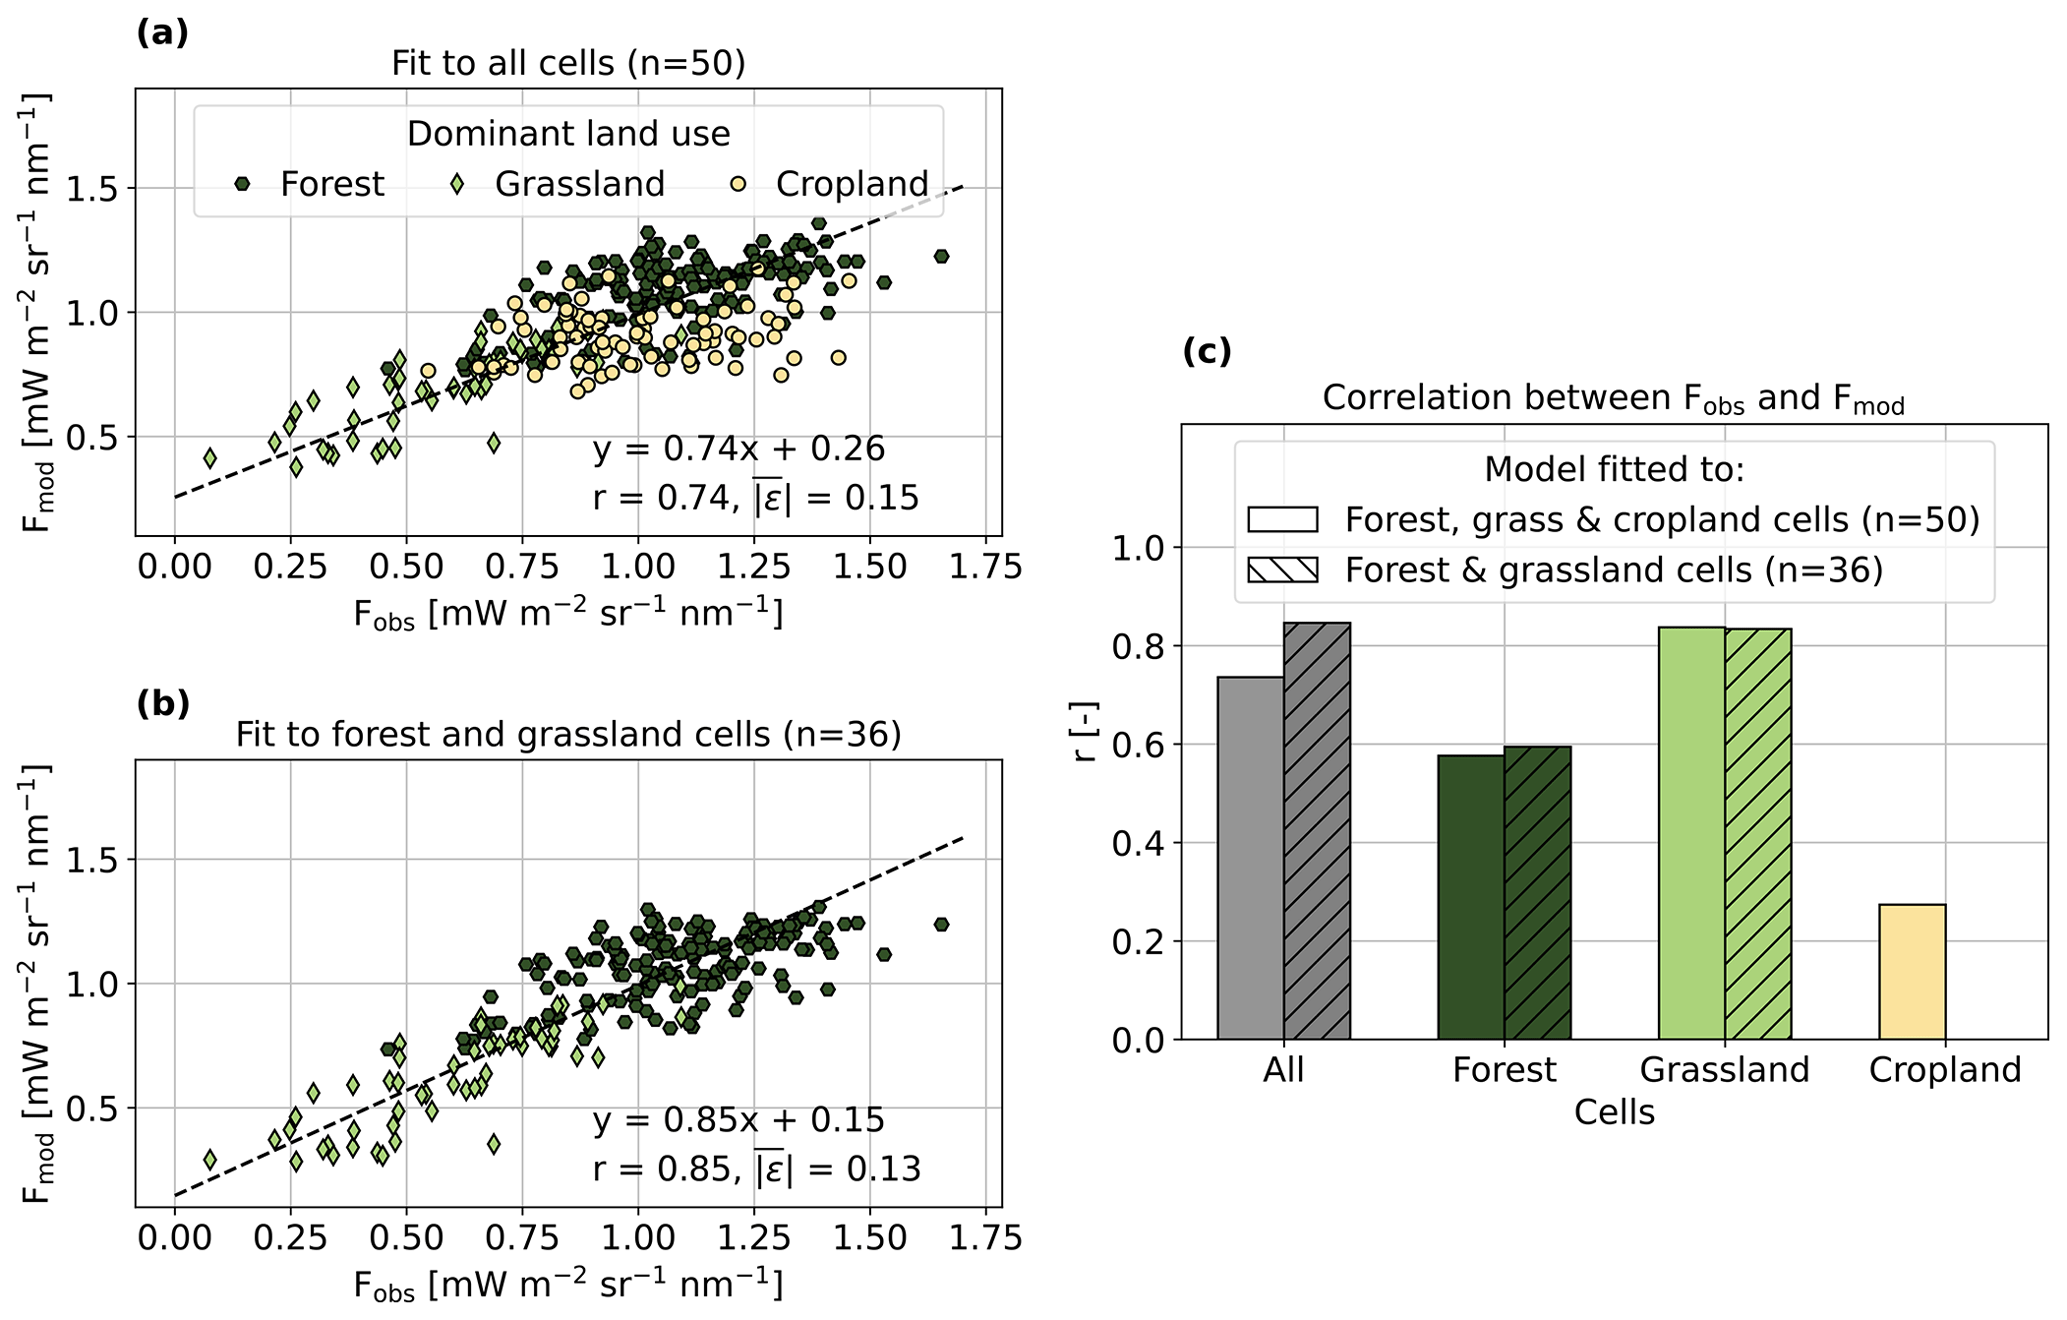
Figure 8Results from the regression model in Eq. (3) fitted to (a) all cells (n=50) and (b) exclusively forest and grassland cells (n=36). Panel (c) shows the correlation between observed (Fobs) and modelled (Fmod) SIF for each dominant land type and for both fits.
However, the model's performance varied by land-use type across the region (Fig. 8c). Notably, it demonstrated good agreement between observed and modelled values for cells dominated by grassland (r=0.84) or forest cover (r=0.58) but struggled to represent the dynamics in cropland cells (r=0.27). This suggests distinct differences in the underlying dynamics and complexities in converting cropland areas into forest. Previous studies reported that croplands were often located in drier areas with less forest cover to begin with, reducing the vigour with which vegetation increases in response to reforestation (Qu et al., 2020).
We therefore exclusively fitted our final model to data from the 36 cells dominated by grassland or forest cover (n=216; Fig. 8b and c). By excluding cropland cells, the fit significantly improved, evident from the higher R2 of 0.72. The improved correlation between the observed and modelled SIF suggests that the model better captures the underlying dynamics. Note that the impact of different factors on the long-term vegetation dynamics is ecosystem-specific; therefore, our model is unique to the fitted area and period. Next, to evaluate the explanatory power of including forest coverage in our model, we constructed an alternative model that solely fits the first two terms on the right-hand side of Eq. (3), i.e. the climate parameters, to the observed summertime SIF. Doing so allows us to compute the adjusted R2 of our model (Eq. 3) and the alternate model to enable fair comparison between the models containing three and two predictors. The alternate model had an adjusted R2 of 0.66. With the inclusion of forest-cover data, the model's performance improved, achieving an adjusted R2 of 0.71 – suggesting the added value of including changed forest coverage in conjunction with climate variability in the model.
Table 1Regression results of the model fitted to GOME-2A summertime SIF temporal variability over reforested and deforested cells with a dominant land use of grassland or forest (n=36). The model was fitted to data spanning 2007–2012. Uncertainty is given in standard error (SE).
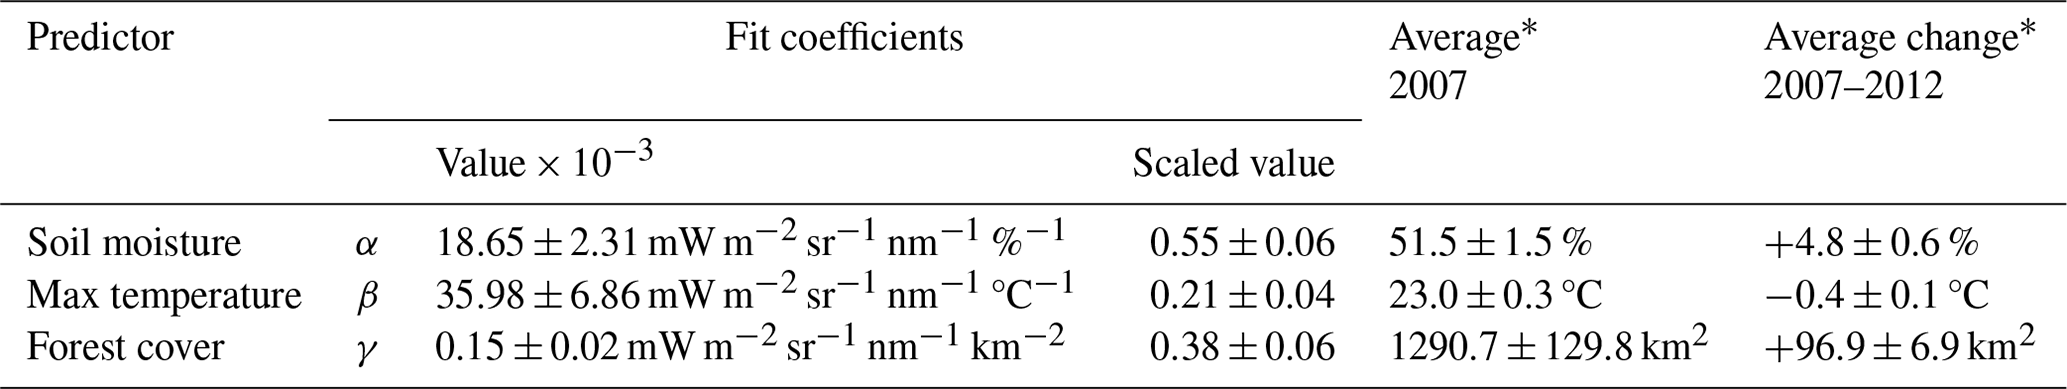
* Over reforested cells (=31).
The model's fit coefficients presented in Table 1 demonstrate, as hypothesized, that increases in the predictors positively influence SIF. Soil moisture and forest-cover variability explain most of the variability in GOME-2A SIF, as indicated by the scaled values of the fit coefficients (which consider predictor standard deviations). This is also expected, given the relatively strong increases in soil moisture (+5 %) and in forest cover (+97 km2) compared to the modest changes in maximum temperature over the provinces from 2007 to 2012. The effect of changes in soil moisture cannot be disentangled from the effect of changes in forest cover on vegetation activity. However, our results show a positive impact of the forest-cover increase on vegetation activity. This is likely occurring in tandem with the changes in soil moisture because soils in regions with increased tree cover tend to hold on to their soil moisture better. We also tested a model including an additional (fourth) interaction term between soil moisture and reforestation, but this did not lead to an improved R2, adjusted between modelled and observed SIF. We conclude that vegetation activity following reforestation efforts increases most over the temperate areas in northern China classified as grassland and forest, with already relatively high soil moisture. On average, these areas show high covariance between changes in soil moisture and changes in forest cover, indicating that both factors explain the increase in summertime SIF.
Satellite-based solar-induced fluorescence (SIF) observations, a measure of plant photosynthesis, emerge as a promising tool to track changes in carbon uptake in response to land-use change. In this study we demonstrated that TROPOMI SIF captures sharp local reductions in vegetation activity – and thus carbon uptake in the aftermath of a large forest fire in southeastern Australia, the Nunnett–Timbarra River fire, in 2019 – and also that TROPOMI SIF tracks rapid recovery of vegetation activity in the affected area. By careful cross-evaluation of TROPOMI SIF with coinciding tower- and model-based estimates of global primary productivity (GPP), we estimate that the Nunnett–Timbarra River fire caused a reduction in SIF by on average 0.2 mW m−2 sr−1 nm−1, corresponding to 130–200 GgC that would otherwise have been stored by the 210 km2 eucalypt forest if no fire had occurred in the first 8 post-fire months. This shows that TROPOMI SIF is capable of monitoring sudden changes in vegetation activity at a scale of some 20 × 10 km2, and this predicts excellent potential for the Fluorescence Explorer (FLEX, to be launched in 2025) to monitor changes in carbon uptake from land management techniques, which often occur at much smaller spatial scales than the Nunnett–Timbarra River fire.
We also found increases in GOME-2A SIF of 0.1–0.2 mW m−2 sr−1 nm−1 over the provinces of Shaanxi, Gansu, Sichuan, and Chonqing in northern China in the period between 2007–2012, when China effectuated a large-scale reforestation programme aimed at reversing desertification. In contrast, in areas where deforestation occurred, GOME-2A SIF showed a reduction in SIF of 0.1 m−2 sr−1 nm−1 over the same period. The possibility of tracking reforestation (and deforestation) with GOME-2A SIF is supported by independent and co-sampled measurements from MODIS NIRv and by the FluxSat model product over the same areas also indicating increased (and decreased) vegetation activity. The relatively coarse-scale GOME-2A SIF measurements (40 × 80 km2) indicate that vegetation activity increased the most in regions with relatively high soil moisture content and substantial reforestation as diagnosed by the China land-cover dataset. This suggests that reforestation is effective in enhancing carbon storage in the relatively wet and temperate regions of northern China but less so in the subtropical parts of the provinces, which are drier and hotter. Interpreting the observed temporal variability in GOME-2A SIF from 2007–2012 with a simple model that accounts for simultaneous spatiotemporal changes in soil moisture, in maximum temperature, and in forest cover, we found that the observed SIF changes in northern China can be explained well (R2=0.72) over areas with forests and grasslands that underwent reforestation. Reforestation efforts, in step with soil moisture increases, appear to be driving the observed increase in SIF. This implies that the impact of reforestation on increases in SIF should be interpreted in the context of simultaneous increases in soil moisture.
Satellite-based SIF observations emerge as a promising method to facilitate the tracking of carbon uptake in response to land-use change. Through the analysis of two distinct cases of forest-cover change, we demonstrated the applicability of SIF as a monitoring tool in combination with satellite data that map the land-use change. The supporting data facilitate the pinpointing of SIF cells aligned with land-cover changes. Our comparative approach revealed distinct changes in SIF dynamics related to shifts in forest coverage. This underscores the capability of SIF to capture the impact of land-cover change, whether driven by distinct abrupt events or gradual transitions, on regional vegetation activity.
Our work underscores the fact that satellite measurements of SIF are useful to monitor changes in carbon uptake following land-use change as long as the spatial and temporal scales at which these occur are sharply demarcated. In this study, the availability of high-resolution MODIS burned-area data (pixel size 1 × 1 km2) and TROPOMI SIF (pixel size 7 × 3.5 km2) made it possible to detect sharp changes in vegetation activity following a devastating fire over a relatively large area. It is also possible to attribute observed increases in GOME-2A SIF to changes that occur much more slowly and on an even larger spatial scale, such as the reforestation efforts in northern China, but this requires the careful selection and co-sampling of explanatory biogeographical data such as soil moisture, temperature, and forest cover.
The code needed to co-sample spatiotemporal changes in SIF and in supporting data is available upon request from the first author.
All data used in this study are publicly available. The GOME-2 SIF data are provided by KNMI within the framework of the EUMETSAT Satellite Application Facility on Atmospheric Composition Monitoring (AC SAF). KNMI GOME-2A SIF data can be downloaded from https://doi.org/10.21944/gome2a-sifter-v2-sun-induced-fluorescence (Kooreman et al., 2020).
The supplement related to this article is available online at: https://doi.org/10.5194/bg-21-2297-2024-supplement.
JCSA and KFB designed the study and led the writing. JCSA performed the data analysis. PS contributed to the interpretation of the results and to the review of all versions of the manuscript and figures. GK provided and conducted the analysis of the MODIS NIRv data over northern China. PK and CF contributed to the interpretation of the results of TROPOMI SIF over Australia. WW and JS provided the OzFlux data and contributed to the determination of the validity of SIF–GPP over Australia. All co-authors reviewed the paper.
The contact author has declared that none of the authors has any competing interests.
Publisher’s note: Copernicus Publications remains neutral with regard to jurisdictional claims made in the text, published maps, institutional affiliations, or any other geographical representation in this paper. While Copernicus Publications makes every effort to include appropriate place names, the final responsibility lies with the authors.
This work received funding from the European Union's Horizon 2020 research and innovations programme under grant agreement no. 869367 (EU LANDMARC project) and from the European Organization for the Exploitation of Meteorological Satellites (EUMETSAT) Atmospheric Composition Satellite Application Facility (AC-SAF). We acknowledge the free use of SIFTER sun-induced fluorescence data from the (GOME-2A) sensor from https://www.temis.nl, last access: 5 October 2022. Furthermore, we would like to thank LANDMARC colleagues Markus Donat from the Barcelona Supercomputing Center (BSC) for the discussion on intercomparison of SIF with climate variables and Moritz Laub from ETH Zürich for the discussion of the wildfire impact on the carbon cycle perturbation.
This research has been supported by the Horizon 2020 research and innovation programme (grant no. 869367) and the European Organization for the Exploitation of Meteorological Satellites (EUMETSAT) Atmospheric Composition Satellite Application Facility (AC-SAF).
This paper was edited by Anja Rammig and reviewed by two anonymous referees.
Ač, A., Malenovský, Z., Olejníčková, J., Gallé, A., Rascher, U., and Mohammed, G.: Meta-analysis assessing potential of steady-state chlorophyll fluorescence for remote sensing detection of plant water, temperature and nitrogen stress, Remote Sens. Environ., 168, 420–436, https://doi.org/10.1016/j.rse.2015.07.022, 2015. a
Bacour, C., Maignan, F., MacBean, N., Porcar-Castell, A., Flexas, J., Frankenberg, C., Peylin, P., Chevallier, F., Vuichard, N., and Bastrikov, V.: Improving Estimates of Gross Primary Productivity by Assimilating Solar-Induced Fluorescence Satellite Retrievals in a Terrestrial Biosphere Model Using a Process-Based SIF Model, J. Geophys. Res.-Biogeo., 124, 3281–3306, https://doi.org/10.1029/2019JG005040, 2019. a
Bowman, D. M., Williamson, G. J., Price, O. F., Ndalila, M. N., and Bradstock, R. A.: Australian forests, megafires and the risk of dwindling carbon stocks, Plant Cell Environ., 44, 347–355, https://doi.org/10.1111/pce.13916, 2021. a
Brook, B. W., Ellis, E. C., Perring, M. P., Mackay, A. W., and Blomqvist, L.: Does the terrestrial biosphere have planetary tipping points?, Trend. Ecol. Evol., 28, 396–401, https://doi.org/10.1016/j.tree.2013.01.016, 2013. a
Byrne, B., Liu, J., Yin, Y., and Bowman, K.: The carbon cycle of southeast Australia during 2019–2020: Drought, fires and subsequent recovery This manuscript is a preprint and has been submitted for publication as a, AGU Adv., 2, 1–31, 2021. a
Cao, S., Chen, L., and Yu, X.: Impact of China's Grain for Green Project on the landscape of vulnerable arid and semi-arid agricultural regions: A case study in northern Shaanxi Province, J. Appl. Ecol., 46, 536–543, https://doi.org/10.1111/j.1365-2664.2008.01605.x, 2009. a
Chu, X. X., Zhan, J., Li, Z., Zhang, F., and Qi, W.: Assessment on forest carbon sequestration in the Three-North Shelterbelt Program region, China, J. Clean. Prod., 215, 382–389, https://doi.org/10.1016/j.jclepro.2018.12.296, 2019. a
Chungu, D., Ng'andwe, P., Mubanga, H., and Chileshe, F.: Fire alters the availability of soil nutrients and accelerates growth of Eucalyptus grandis in Zambia, J. Forestry Res., 31, 1637–1645, https://doi.org/10.1007/s11676-019-00977-y, 2020. a
Dechant, B., Ryu, Y., Badgley, G., Zeng, Y., Berry, J. A., Zhang, Y., Goulas, Y., Li, Z., Zhang, Q., Kang, M., Li, J., and Moya, I.: Canopy structure explains the relationship between photosynthesis and sun-induced chlorophyll fluorescence in crops, Remote Sens. Environ., 241, 111733, https://doi.org/10.1016/j.rse.2020.111733, 2020. a
Delang, C. O. and Yuan, Z.: China's Grain for Green Program, Springer, ISBN 9783319115047, https://doi.org/10.1007/978-3-319-11505-4, 2015. a
Dorigo, W., Preimesberger, W., Reimer, C., Van der Schalie, R., Pasik, A., De Jeu, R., and Paulik, C.: Soil moisture gridded data from 1978 to present, v201912.0.0., https://cds.climate.copernicus.eu/cdsapp#!/dataset/satellite-soil-moisture?tab=overview (last access: 2 September 2022), 2019. a
Doughty, R., Köhler, P., Frankenberg, C., Magney, T. S., Xiao, X., Qin, Y., Wu, X., and Moore, B.: TROPOMI reveals dry-season increase of solar-induced chlorophyll fluorescence in the Amazon forest, P. Natl. Acad. Sci. USA, 116, 22393–22398, https://doi.org/10.1073/pnas.1908157116, 2019. a
Drusch, M., Moreno, J., Del Bello, U., Franco, R., Goulas, Y., Huth, A., Kraft, S., Middleton, E. M., Miglietta, F., Mohammed, G., Nedbal, L., Rascher, U., Schüttemeyer, D., and Verhoef, W.: The FLuorescence EXplorer Mission Concept – ESA's Earth Explorer 8, IEEE Trans. Geosci. Remote Sens., 55, 1273–1284, https://doi.org/10.1109/TGRS.2016.2621820, 2016. a
Duffy, K. A., Schwalm, C. R., Arcus, V. L., Koch, G. W., Liang, L. L., and Schipper, L. A.: How close are we to the temperature tipping point of the terrestrial biosphere?, Sci. Adva., 7, 1–9, https://doi.org/10.1126/sciadv.aay1052, 2021. a
Fancourt, M., Ziv, G., Boersma, K. F., Tavares, J., Wang, Y., and Galbraith, D.: Background climate conditions regulated the photosynthetic response of Amazon forests to the 2015/2016 El Nino-Southern Oscillation event, Commun. Earth Environ., 3, 1–9, https://doi.org/10.1038/s43247-022-00533-3, 2022. a
Frankenberg, C. and Berry, J.: Solar induced chlorophyll fluorescence: Origins, relation to photosynthesis and retrieval, 1986, Elsevier, ISBN 9780128032206, https://doi.org/10.1016/B978-0-12-409548-9.10632-3, 2017. a
Frankenberg, C., Fisher, J. B., Worden, J., Badgley, G., Saatchi, S. S., Lee, J. E., Toon, G. C., Butz, A., Jung, M., Kuze, A., and Yokota, T.: New global observations of the terrestrial carbon cycle from GOSAT: Patterns of plant fluorescence with gross primary productivity, Geophys. Res. Lett., 38, 1–6, https://doi.org/10.1029/2011GL048738, 2011. a, b
Friedlingstein, P., O'Sullivan, M., Jones, M. W., Andrew, R. M., Hauck, J., Olsen, A., Peters, G. P., Peters, W., Pongratz, J., Sitch, S., Le Quéré, C., Canadell, J. G., Ciais, P., Jackson, R. B., Alin, S., Aragão, L. E. O. C., Arneth, A., Arora, V., Bates, N. R., Becker, M., Benoit-Cattin, A., Bittig, H. C., Bopp, L., Bultan, S., Chandra, N., Chevallier, F., Chini, L. P., Evans, W., Florentie, L., Forster, P. M., Gasser, T., Gehlen, M., Gilfillan, D., Gkritzalis, T., Gregor, L., Gruber, N., Harris, I., Hartung, K., Haverd, V., Houghton, R. A., Ilyina, T., Jain, A. K., Joetzjer, E., Kadono, K., Kato, E., Kitidis, V., Korsbakken, J. I., Landschützer, P., Lefèvre, N., Lenton, A., Lienert, S., Liu, Z., Lombardozzi, D., Marland, G., Metzl, N., Munro, D. R., Nabel, J. E. M. S., Nakaoka, S.-I., Niwa, Y., O'Brien, K., Ono, T., Palmer, P. I., Pierrot, D., Poulter, B., Resplandy, L., Robertson, E., Rödenbeck, C., Schwinger, J., Séférian, R., Skjelvan, I., Smith, A. J. P., Sutton, A. J., Tanhua, T., Tans, P. P., Tian, H., Tilbrook, B., van der Werf, G., Vuichard, N., Walker, A. P., Wanninkhof, R., Watson, A. J., Willis, D., Wiltshire, A. J., Yuan, W., Yue, X., and Zaehle, S.: Global Carbon Budget 2020, Earth Syst. Sci. Data, 12, 3269–3340, https://doi.org/10.5194/essd-12-3269-2020, 2020. a
Gao, J., Jiao, K., and Wu, S.: Investigating the spatially heterogeneous relationships between climate factors and NDVI in China during 1982 to 2013, J. Geogr. Sci., 29, 1597–1609, https://doi.org/10.1007/s11442-019-1682-2, 2019. a, b, c
Gerlein-Safdi, C., Keppel-Aleks, G., Wang, F., Frolking, S., and Mauzerall, D. L.: Satellite Monitoring of Natural Reforestation Efforts in China's Drylands, One Earth, 2, 98–108, https://doi.org/10.1016/j.oneear.2019.12.015, 2020. a, b, c, d, e
Getachew Mengistu, A., Mengistu Tsidu, G., Koren, G., Kooreman, M. L., Folkert Boersma, K., Tagesson, T., Ardö, J., Nouvellon, Y., and Peters, W.: Sun-induced fluorescence and near-infrared reflectance of vegetation track the seasonal dynamics of gross primary production over Africa, Biogeosciences, 18, 2843–2857, https://doi.org/10.5194/bg-18-2843-2021, 2021. a, b
Giglio, L., Justice, C., Boschetti, L., and Roy, D.: MCD64A1 MODIS/Terra+Aqua Burned Area Monthly L3 Global 500m SIN Grid V006, NASA EOSDIS Land Processes DAAC [data set], https://doi.org/10.5067/MODIS/MCD64A1.006, 2015. a, b
Guanter, L., Zhang, Y., Jung, M., Joiner, J., Voigt, M., Berry, J. A., Frankenberg, C., Huete, A. R., Zarco-Tejada, P., Lee, J. E., Moran, M. S., Ponce-Campos, G., Beer, C., Camps-Valls, G., Buchmann, N., Gianelle, D., Klumpp, K., Cescatti, A., Baker, J. M., and Griffis, T. J.: Global and time-resolved monitoring of crop photosynthesis with chlorophyll fluorescence, P. Natl. Acad. Sci. USA, 111, E1327–E1333, https://doi.org/10.1073/pnas.1320008111, 2014. a
Guo, M., Li, J., Yu, F., Yin, S., Huang, S., and Wen, L.: Estimation of post-fire vegetation recovery in boreal forests using solar-induced chlorophyll fluorescence (SIF) data, Int. J. Wildland Fire, 30, 365–377, https://doi.org/10.1071/WF20162, 2021. a
Harper, A. B., Powell, T., Cox, P. M., House, J., Huntingford, C., Lenton, T. M., Sitch, S., Burke, E., Chadburn, S. E., Collins, W. J., Comyn-Platt, E., Daioglou, V., Doelman, J. C., Hayman, G., Robertson, E., van Vuuren, D., Wiltshire, A., Webber, C. P., Bastos, A., Boysen, L., Ciais, P., Devaraju, N., Jain, A. K., Krause, A., Poulter, B., and Shu, S.: Land-use emissions play a critical role in land-based mitigation for Paris climate targets, Nat. Commun., 9, 2938, https://doi.org/10.1038/s41467-018-05340-z, 2018. a
Huntzinger, D. N., Michalak, A. M., Schwalm, C., Ciais, P., King, A. W., Fang, Y., Schaefer, K., Wei, Y., Cook, R. B., Fisher, J. B., Hayes, D., Huang, M., Ito, A., Jain, A. K., Lei, H., Lu, C., Maignan, F., Mao, J., Parazoo, N., Peng, S., Poulter, B., Ricciuto, D., Shi, X., Tian, H., Wang, W., Zeng, N., and Zhao, F.: Uncertainty in the response of terrestrial carbon sink to environmental drivers undermines carbon-climate feedback predictions, Sci. Rep., 7, 1–8, https://doi.org/10.1038/s41598-017-03818-2, 2017. a
Isaac, P., Cleverly, J., McHugh, I., Van Gorsel, E., Ewenz, C., and Beringer, J.: OzFlux data: Network integration from collection to curation, Biogeosciences, 14, 2903–2928, https://doi.org/10.5194/bg-14-2903-2017, 2017. a
Joiner, J., Yoshida, Y., Vasilkov, A. P., Yoshida, Y., Corp, L. A., and Middleton, E. M.: First observations of global and seasonal terrestrial chlorophyll fluorescence from space, Biogeosciences, 8, 637–651, https://doi.org/10.5194/bg-8-637-2011, 2011. a, b
Joiner, J., Guanter, L., Lindstrot, R., Voigt, M., Vasilkov, A. P., Middleton, E. M., Huemmrich, K. F., Yoshida, Y., and Frankenberg, C.: Global monitoring of terrestrial chlorophyll fluorescence from moderate-spectral-resolution near-infrared satellite measurements: methodology, simulations, and application to GOME-2, Atmos. Meas. Tech., 6, 2803–2823, https://doi.org/10.5194/amt-6-2803-2013, 2013. a
Joiner, J., Yoshida, Y., Guanter, L., and Middleton, E. M.: New methods for the retrieval of chlorophyll red fluorescence from hyperspectral satellite instruments: Simulations and application to GOME-2 and SCIAMACHY, Atmos. Meas. Tech., 9, 3939–3967, https://doi.org/10.5194/amt-9-3939-2016, 2016. a
Joiner, J., Yoshida, Y., Zhang, Y., Duveiller, G., Jung, M., Lyapustin, A., Wang, Y., and Tucker, C. J.: Estimation of terrestrial global gross primary production (GPP) with satellite data-driven models and eddy covariance flux data, Remote Sens., 10, 1–38, https://doi.org/10.3390/rs10091346, 2018. a, b, c, d, e
Köhler, P., Frankenberg, C., Magney, T. S., Guanter, L., Joiner, J., and Landgraf, J.: Global Retrievals of Solar-Induced Chlorophyll Fluorescence With TROPOMI: First Results and Intersensor Comparison to OCO-2, Geophys. Res. Lett., 45, 10456–10463, https://doi.org/10.1029/2018GL079031, 2018. a, b, c
Kong, Z. H., Stringer, L. C., Paavola, J., and Lu, Q.: Situating China in the global effort to combat desertification, Land, 10, 1–22, https://doi.org/10.3390/land10070702, 2021. a
Kooreman, M. L., Boersma, K. F., van Schaik, E., van Versendaal, R., Cacciari, A., and Tuinder, O. N. E.: SIFTER sun-induced vegetation fluorescence data from GOME-2A (Version 2.0), Royal Netherlands Meteorological Institute (KNMI) [data set], https://doi.org/10.21944/gome2a-sifter-v2-sun-induced-fluorescence, 2020. a, b
Li, S., Yang, S., Liu, X., Liu, Y., and Shi, M.: NDVI-based analysis on the influence of climate change and human activities on vegetation restoration in the shaanxi-gansu-ningxia region, central China, Remote Sens., 7, 11163–11182, https://doi.org/10.3390/rs70911163, 2015. a
Li, X. and Xiao, J.: TROPOMI observations allow for robust exploration of the relationship between solar-induced chlorophyll fluorescence and terrestrial gross primary production, Remote Sens. Environ., 268, 112748, https://doi.org/10.1016/j.rse.2021.112748, 2022. a
Lin, X., Niu, J., Berndtsson, R., Yu, X., Zhang, L., and Chen, X.: Ndvi dynamics and its response to climate change and reforestation in Northern China, Remote Sens., 12, 1–15, https://doi.org/10.3390/rs12244138, 2020. a, b, c
Lindenmayer, D. B. and Taylor, C.: New spatial analyses of Australian wildfires highlight the need for new fire, resource, and conservation policies, P. Natl. Acad. Sci. USA, 117, 12481–12485, https://doi.org/10.1073/pnas.2002269117, 2020. a
Liu, L., Guan, L., and Liu, X.: Directly estimating diurnal changes in GPP for C3 and C4 crops using far-red sun-induced chlorophyll fluorescence, Agr. Forest Meteorol., 232, 1–9, https://doi.org/10.1016/j.agrformet.2016.06.014, 2017. a
Lymburner, L., Tan, P., McIntyre, A., Tankappan, M., and Sixsmith, J.: Dynamic Land Cover Dataset Version 2.1 [data set], https://pid.geoscience.gov.au/dataset/ga/83868 (last access: 30 September 2021), 2015. a
Madani, N., Parazoo, N. C., Kimball, J. S., Reichle, R. H., Chatterjee, A., Watts, J. D., Saatchi, S., Liu, Z., Endsley, A., Tagesson, T., Rogers, B. M., Xu, L., Wang, J. A., Magney, T., and Miller, C. E.: The Impacts of Climate and Wildfire on Ecosystem Gross Primary Productivity in Alaska, J. Geophys. Res.-Biogeo., 126, 1–14, https://doi.org/10.1029/2020JG006078, 2021. a
Magney, T. S., Bowling, D. R., Logan, B. A., Grossmann, K., Stutz, J., Blanken, P. D., Burns, S. P., Cheng, R., Garcia, M. A., Köhler, P., Lopez, S., Parazoo, N. C., Raczka, B., Schimel, D., and Frankenberg, C.: Mechanistic evidence for tracking the seasonality of photosynthesis with solar-induced fluorescence, P. Natl. Acad. Sci. USA, 116, 11640–11645, https://doi.org/10.1073/pnas.1900278116, 2019. a, b
Moene, A. F. and Van Dam, J. C.: Transport in the atmosphere-vegetation-soil continuum, Cambridge University Press, https://doi.org/10.1017/CBO9781139043137, 2014. a
Monteith, J.: Solar Radiation And Productivity in Tropical Ecosystems, Society, 9, 747–766, 1972. a
Muñoz Sabater, J.: ERA5-Land hourly data from 1950 to present, Copernicus Climate Change Service (C3S) Climate Data Store (CDS) [date set], https://doi.org/10.24381/cds.e2161bac (last access: 1 September 2022), 2019. a
Porcar-Castell, A., Tyystjärvi, E., Atherton, J., Van Der Tol, C., Flexas, J., Pfündel, E. E., Moreno, J., Frankenberg, C., and Berry, J. A.: Linking chlorophyll a fluorescence to photosynthesis for remote sensing applications: Mechanisms and challenges, J. Exp. Bot., 65, 4065–4095, https://doi.org/10.1093/jxb/eru191, 2014. a
Qu, S., Wang, L., Lin, A., Yu, D., Yuan, M., and Li, C.: Distinguishing the impacts of climate change and anthropogenic factors on vegetation dynamics in the Yangtze River Basin, China, Ecol. Indic., 108, 105724, https://doi.org/10.1016/j.ecolind.2019.105724, 2020. a
Rogelj, J., Shindell, D., Jiang, K., Fifita, S., Forster, P., Ginzburg, V., Handa, C., Kheshgi, H., Kobayashi, S., Kriegler, E., Mundaca, L., Séférian, R., and Vilariño, M.: Mitigation Pathways Compatible with 1.5 °C in the Context of Sustainable Development. In: Global Warming of 1.5 °C, An IPCC Special Report on the impacts of global warming of 1.5 °C above pre-industrial levels and related global greenhouse gas emission pathw, IPCC special report Global Warming of 1.5 °C, 82 pp., https://www.ipcc.ch/site/assets/uploads/sites/2/2019/02/SR15_Chapter2_Low_Res.pdf (last access: 16 Juni 2023), 2018. a
Schimel, D., Stephens, B. B., and Fisher, J. B.: Effect of increasing CO2 on the terrestrial carbon cycle, P. Natl. Acad. Sci. USA, 112, 436–441, https://doi.org/10.1073/pnas.1407302112, 2015. a
Schurgers, G., Ahlström, A., Arneth, A., Pugh, T. A., and Smith, B.: Climate Sensitivity Controls Uncertainty in Future Terrestrial Carbon Sink, Geophys. Res. Lett., 45, 4329–4336, https://doi.org/10.1029/2018GL077528, 2018. a
Smith, W. K., Fox, A. M., MacBean, N., Moore, D. J., and Parazoo, N. C.: Constraining estimates of terrestrial carbon uptake: new opportunities using long-term satellite observations and data assimilation, New Phytol., 225, 105–112, https://doi.org/10.1111/nph.16055, 2020. a
Song, L., Guanter, L., Guan, K., You, L., Huete, A., Ju, W., and Zhang, Y.: Satellite sun-induced chlorophyll fluorescence detects early response of winter wheat to heat stress in the Indian Indo-Gangetic Plains, Glob. Change Biol., 24, 4023–4037, https://doi.org/10.1111/gcb.14302, 2018. a
Stol, J. and Kitchen, M.: Tumbarumba Flux Data Release 2022_v1 (Version 1.0), Terrestrial Ecosystem Research Network [data set], https://doi.org/10.25901/esrb-5609, 2022. a, b
Sun, H., Wang, J., Xiong, J., Bian, J., Jin, H., Cheng, W., and Li, A.: Vegetation Change and Its Response to Climate Change in Yunnan Province, China, Adv. Meteorol., 2021, 8857589, https://doi.org/10.1155/2021/8857589, 2021. a
Sun, W., Song, X., Mu, X., Gao, P., Wang, F., and Zhao, G.: Spatiotemporal vegetation cover variations associated with climate change and ecological restoration in the Loess Plateau, Agr. Forest Meteorol., 209/210, 87–99, https://doi.org/10.1016/j.agrformet.2015.05.002, 2015. a
Sun, Y., Frankenberg, C., Jung, M., Joiner, J., Guanter, L., Köhler, P., and Magney, T.: Overview of Solar-Induced chlorophyll Fluorescence (SIF) from the Orbiting Carbon Observatory-2: Retrieval, cross-mission comparison, and global monitoring for GPP, Remote Sens. Environ., 209, 808–823, https://doi.org/10.1016/j.rse.2018.02.016, 2018. a
Turner, A. J., Köhler, P., Magney, T. S., Frankenberg, C., Fung, I., and Cohen, R. C.: Extreme events driving year-to-year differences in gross primary productivity across the US, Biogeosciences, 18, 6579–6588, https://doi.org/10.5194/bg-18-6579-2021, 2021. a, b
Turner, A. J., Köhler, P., Magney, T. S., Frankenberg, C., Fung, I., and Cohen, R. C.: A double peak in the seasonality of California's photosynthesis as observed from space, Biogeosciences, 17, 405–422, https://doi.org/10.5194/bg-17-405-2020, 2020. a
United Nations: Conference of the Parties Twenty – second session Marrakech, 7–18 November 2016 Item X of the provisional agenda, Aggregate effect of the intended nationally determined contributions: an update, 07126, 16–7126, http://unfccc.int/resource/docs/2016/cop22/eng/02.pdf (last access: 16 Juni 2023), 2016. a
Van Schaik, E., Kooreman, M. L., Stammes, P., Gijsbert Tilstra, L., Tuinder, O. N., Sanders, A. F., Verstraeten, W. W., Lang, R., Cacciari, A., Joiner, J., Peters, W., and Folkert Boersma, K.: Improved SIFTER v2 algorithm for long-term GOME-2A satellite retrievals of fluorescence with a correction for instrument degradation, Atmos. Meas. Techn., 13, 4295–4315, https://doi.org/10.5194/amt-13-4295-2020, 2020. a, b, c, d, e, f, g
Veefkind, J. P., Aben, I., McMullan, K., Förster, H., de Vries, J., Otter, G., Claas, J., Eskes, H. J., de Haan, J. F., Kleipool, Q., van Weele, M., Hasekamp, O., Hoogeveen, R., Landgraf, J., Snel, R., Tol, P., Ingmann, P., Voors, R., Kruizinga, B., Vink, R., Visser, H., and Levelt, P. F.: TROPOMI on the ESA Sentinel-5 Precursor: A GMES mission for global observations of the atmospheric composition for climate, air quality and ozone layer applications, Remote Sens. Environ., 120, 70–83, https://doi.org/10.1016/j.rse.2011.09.027, 2012. a
Verma, M., Schimel, D., Evans, B., Frankenberg, C., Beringer, J., Drewry, D. T., Magney, T., Marang, I., Hutley, L., Moore, C., and Eldering, A.: Effect of environmental conditions on the relationship between solar-induced fluorescence and gross primary productivity at an OzFlux grassland site, J. Geophys. Res.-Biogeo., 122, 716–733, https://doi.org/10.1002/2016JG003580, 2017. a
Wang, S., Zhang, Y., Ju, W., Porcar-Castell, A., Ye, S., Zhang, Z., Brümmer, C., Urbaniak, M., Mammarella, I., Juszczak, R., and Folkert Boersma, K.: Warmer spring alleviated the impacts of 2018 European summer heatwave and drought on vegetation photosynthesis, Agr. Forest Meteorol., 295, 108195, https://doi.org/10.1016/j.agrformet.2020.108195, 2020. a
Wang, S., Li, R., Wu, Y., and Zhao, S.: Effects of multi-temporal scale drought on vegetation dynamics in Inner Mongolia from 1982 to 2015, China, Ecol. Indic., 136, 108666, https://doi.org/10.1016/j.ecolind.2022.108666, 2022. a
Yang, J. and Huang, X.: The 30 m annual land cover dataset and its dynamics in China from 1990 to 2019, Earth Syst. Sci. Data, 13, 3907–3925, https://doi.org/10.5194/essd-13-3907-2021, 2021. a, b, c
Zhang, L. and Schwärzel, K.: China's land resources dilemma: Problems, outcomes, and options for sustainable land restoration, Sustainability, 9, 2362, https://doi.org/10.3390/su9122362, 2017. a
Zhang, W., Wei, F., Horion, S., Fensholt, R., Forkel, M., and Brandt, M.: Global quantification of the bidirectional dependency between soil moisture and vegetation productivity, Agr. Forest Meteorol., 313, 108735, https://doi.org/10.1016/j.agrformet.2021.108735, 2022. a
Zhang, Y. and Ye, A.: Quantitatively distinguishing the impact of climate change and human activities on vegetation in mainland China with the improved residual method, GISci. Remote Sens., 58, 235–260, https://doi.org/10.1080/15481603.2021.1872244, 2021. a
- Abstract
- Introduction
- Data
- Forest loss following the eucalyptus fire in southeast Australia
- Reforestation in north-central China
- Conclusions and discussion
- Code availability
- Data availability
- Author contributions
- Competing interests
- Disclaimer
- Acknowledgements
- Financial support
- Review statement
- References
- Supplement