the Creative Commons Attribution 4.0 License.
the Creative Commons Attribution 4.0 License.
 | 14 May 2024
Modeling microbial carbon fluxes and stocks in global soils from 1901 to 2016
Liyuan He
Jorge L. Mazza Rodrigues
Melanie A. Mayes
Chun-Ta Lai
David A. Lipson
Soil microbes play a crucial role in the carbon (C) cycle; however, they have been overlooked in predicting the terrestrial C cycle. We applied a microbial-explicit Earth system model – the Community Land Model-Microbe (CLM-Microbe) – to investigate the dynamics of soil microbes during 1901 to 2016. The CLM-Microbe model was able to reproduce the variations of gross (GPP) and net (NPP) primary productivity, heterotrophic (HR) and soil (SR) respiration, microbial (MBC) biomass C in fungi (FBC) and bacteria (BBC) in the top 30 cm and 1 m, and dissolved (DOC) and soil organic C (SOC) in the top 30 cm and 1 m during 1901–2016. During the study period, simulated C variables increased by approximately 12 PgC yr−1 for HR, 25 PgC yr−1 for SR, 1.0 PgC for FBC and 0.4 PgC for BBC in 0–30 cm, and 1.2 PgC for FBC and 0.7 PgC for BBC in 0–1 m. Increases in microbial C fluxes and pools were widely found, particularly at high latitudes and in equatorial regions, but we also observed their decreases in some grids. Overall, the area-weighted averages of HR, SR, FBC, and BBC in the top 1 m were significantly correlated with those of soil moisture and soil temperature in the top 1 m. These results suggested that microbial C fluxes and pools were jointly governed by vegetation C input and soil temperature and moisture. Our simulations revealed the spatial and temporal patterns of microbial C fluxes and pools in response to environmental change, laying the foundation for an improved understanding of soil microbial roles in the global terrestrial C cycle.
- Article
(10336 KB) - Full-text XML
-
Supplement
(6446 KB) - BibTeX
- EndNote


The atmospheric concentration of carbon dioxide (CO2) has been drastically increased due to fossil fuel combustion and land-use change since the Industrial Revolution (IPCC, 2001, 2013; Lal, 2004, 2008). The radiative forcing caused by the CO2 enrichment in the atmosphere has led to an increase in the global surface temperature, known as climate warming (IPCC, 2001). The increases of atmospheric CO2 and induced warming climate have induced cascading environmental issues and impacted the carbon (C) cycle (Matson et al., 2002; Meeran et al., 2021; Soong et al., 2021).
Previous studies have assessed the effects of climate change on the global C cycle using Earth system models (ESMs) (Bonan et al., 2019; Todd-Brown et al., 2013). For example, Bonan et al. (2019) compared vegetation productivity, heterotrophic respiration, and vegetation and soil C stocks in the Community Land Model (CLM) forced by two climate reconstructions (CRUNCEPv7 and GSWP3v1) (Dirmeyer et al., 2006; Viovy, 2018). These models, however, were developed with an implicit representation of microbial processes, assuming that respired CO2 is proportional to the soil C stock and leaving unspecified the role of microbes in decomposition processes. Given the critical role of soil microorganisms in soil biogeochemical processes and their sensitivity to environmental changes, explicit incorporation of soil microbial respiration and activities in decomposition processes into ESMs is essential to improve the prediction of global C cycling (He et al., 2021a; Wang et al., 2015, 2017; Wieder et al., 2013). Recently, researchers have applied microbial-explicit models in investigating responses of global C cycle to environmental change. For example, Wieder et al. (2015) examined the responses of soil, vegetation, and litter C pools to environmental change using the MIMICS model. Wang et al. (2017) also investigated the impacts of environmental change on enzymes, soil, and microbial biomass C pools using the TRIPLEX-MICROBE model. However, the validation of microbial biomass at coarse scales (e.g., global or biome levels) may introduce uncertainties in the model, particularly in soil microbial biomass and microbe-mediated processes, which can further affect the predicted soil C cycle in those models.
Fungi and bacteria, the two major soil microbial groups, respond differently to environmental change, and differences in their physiological traits concerning biogeochemical processes have been incorporated into the CLM-Microbe model (He et al., 2021a, b). For example, fungi decrease more than bacteria under N fertilization (Demoling et al., 2008), whereas fungi are less sensitive than bacteria to water stress (Manzoni et al., 2012). Therefore, validating fungal and bacterial biomass in the CLM-Microbe model at the grid level instead of coarse comparisons at global or biome levels may reduce uncertainties in model predictions. Changes in fungal and bacterial abundance can primarily affect terrestrial C cycling considering their distinct roles in biogeochemical processes such as the decomposition of organic materials (Bailey et al., 2002; Boer et al., 2005; Hršelová et al., 1999). Predicting changes in the spatial pattern of fungi and bacteria at the global scale and identifying their controls are essential for understanding the impacts of environmental changes on the global terrestrial C cycle.
To fill the gaps, we investigated the effects of environmental change on the global C cycle using the CLM-Microbe model. The CLM-Microbe model, mechanistically representing microbial mechanisms of soil C cycling and differentiating the physiology of two major microbial functional groups (i.e., fungi and bacteria), provides a feasible way to investigate the effects of environmental change on soil C cycling mediated by soil microbes and reveal the roles of different kingdoms of microbes on C cycling (He et al., 2021a). In this study, we aimed to investigate the effects of environmental change on the soil microbial C fluxes and pools from 1901 to 2016. We first evaluated the performance of the CLM-Microbe model in reproducing soil, vegetation, and microbial C variables, including gross (GPP) and net (NPP) primary productivity, fungal (FBC) and bacterial (BBC) biomass C in the top 30 cm and 1 m, heterotrophic (HR) and soil (SR) respiration, and dissolved organic C (DOC) and soil organic C (SOC) in the top 30 cm and 1 m. Then, we investigated the effects of environmental change on the temporal trend of microbial C fluxes and stocks including HR, SR, and FBC and BBC in the top 30 cm and top 1 m from 1901 to 2016. Finally, we investigated spatial patterns and external environmental controls of changes in those fluxes and pools from 1901 to 2016.
2.1 Model representation of fungal and bacterial biomass
The CLM-Microbe model was built on the model framework developed by Xu et al. (2014) and the default CLM4.5 (hereafter CLM4.5) (Koven et al., 2013). It has been coupled with a microbial functional group-based methane module (Wang et al., 2019, 2022; Xu et al., 2015). Also, it has been applied to reproduce fungal and bacterial biomass dynamics and investigate fungal and bacterial macroecology and microbial seasonality impacts on soil C emission in natural ecosystems (He et al., 2021a, b, 2023). Taken together, the CLM-Microbe model has unique modules of microbe-mediated decomposition cascades and microbial functional group-mediated methane cycle, with other biogeochemical, thermal, and hydrological processes the same as the CLM4.5. The CLM-Microbe model classifies litter into three pools, i.e., litter 1 (labile), litter 2 (cellulose), and litter 3 (lignin), and soil organic matter (SOM), materials left during later stages of organic C decay, into four pools, i.e., SOM 1, SOM 2, SOM 3, and SOM 4 (low–high recalcitrance). The three litter pools and four SOM pools differ in base decomposition rate (τ), with turnover times of litter pools ranging from 20 h to 71 d and turnover times of SOM pools ranging from 14 d to 27 years (Fig. S1). Coarse woody debris (CWD) is fragmented, decomposed, and gradually transferred into litter pools and further from litter to SOM pools (Thornton et al., 2007; Koven et al., 2013). In addition to eight C pools (three litter, four SOM, and CWD pools) in the CLM4.5, we introduced dissolved organic matter (DOM) and fungal and bacterial biomass pools in the CLM-Microbe model. The code for the CLM-Microbe model has been archived at GitHub since 2015. The model version used in this study was checked out on 1 May 2021 and was archived at Xu et al. (2022). More details about the CLM-Microbe model can be found in our previous publications about the model development and model applications (Xu et al., 2014; Wang et al., 2019; He et al., 2021a, b; Wang et al., 2022; Zuo et al., 2022; He et al., 2023).
In the CLM-Microbe model, fungal and bacterial biomasses are the balance between C assimilation (C flow from the decomposition of SOM, DOM, and litter) and C loss through microbial lysis and microbial respiration. Specifically, fungi and bacteria receive C through the transitions from litter, DOM, and SOM pools; fungi and bacteria lose C through the transitions from fungal and bacterial biomass pools to DOM and SOM pools and the atmosphere. The conceptual diagram of the CLM-Microbe model and major parameters are in Fig. S1 and Table S1, respectively.
The decomposition rates of SOM, DOM, and litter are controlled by both their potential decomposition rates and environmental conditions. The decomposition processes in the CLM-Microbe model are defined following the below equations:
where DC is the rate of substrate (e.g., SOM, DOM, and litter) breakdown (in per day); k is the potential decomposition rate (in per day); represents the environmental modifier determined by soil oxygen concentration (unitless); rdepth is the environmental modifier determined by soil depth (unitless); rwater is environmental modifier determined by soil moisture (unitless); means the environmental modifier determined by soil temperature (unitless); z means soil depth (in m); zτ is the e-folding depth for decomposition (in m); Tsoil, j is soil temperature at layer j (in kelvin); Tref is the reference temperature for decomposition (in kelvin), which is set as a kelvin temperature equals to 25 °C; Q10 indicates the temperature dependence of decomposition, which is the ratio of the rate at a specific temperature to that at 10 °C lower (unitless); Ψj is the soil water potential in layer j (in MPa); Ψmin is a lower limit for soil water potential control on decomposition rate (set to −10 MPa); rwater will be set as 0 if Ψj is lower than Ψmin (in MPa); Ψmax is the upper limit for soil water potential control on decomposition, which equals to the saturated soil matric potential; rwater will be set as 1 if Ψj is higher than Ψmax; wsoil, j means soil water content in layer j(in MPa); fr is the rooting fraction by soil depth (unitless); finun means the fraction of inundated area (unitless); O represents the oxygen available to that demanded by roots and aerobic microbes in unsaturated area (unitless); O denotes the ratio between minimum anaerobic decomposition rate and potential aerobic decomposition rate in soil (set to 0.2) (unitless); O represents the oxygen available to that demanded by roots and aerobic microbes in saturated area (unitless); will be set as 1 in oxic conditions, while it will be estimated as the weighted average of oxygen stress in saturated and unsaturated areas in anoxic conditions (unitless).
Carbon use efficiency (CUE) of soil microbes for assimilating three litter pools in the CLM-Microbe model is determined following the equation in Sinsabaugh et al. (2013). In addition, CUE is reported to vary with temperature, showing a coefficient of −0.012 with increasing temperature (Devêvre and Horwáth, 2000). Therefore, we assumed that CUE decreased compared with the ambient thermal regime of microbes' habitats following the equation as below (Xu et al., 2014):
where CUE is carbon use efficiency, which is defined as the growth-to-assimilation ratio for soil microbes; CUEmax is the maximum value of C use efficiency; CUET is the coefficient indicating the dependence of C use efficiency on temperature; TCUEref is the reference temperature of C use efficiency, which is defined as 15 °C in the CLM-Microbe model; MC : N means the C : N ratio of soil microbial biomass, which is defined as 8 in the CLM-Microbe model; SC : N represents C : N ratio of the substrate (e.g., litter).
The C flow from litter and SOM pools to soil microbes will be partitioned by fungal and bacterial biomass pools based on the C : N ratio of fungal and bacterial biomass. The fraction factor quantifying bacteria C gain from litter and SOM is calculated based on the weighted average of assimilation efficiency of fungi and bacteria following the equation as below:
where fb is the fraction of C flowing into bacteria; ff is the fraction of C flowing into fungi; BC : N means the C : N ratio of BBC; FC : N means the C : N ratio of FBC; SC : N represents C : N ratio of substrates (e.g., litter and SOM).
Fungi and bacteria have different turnover times; hence, different lysis rate constants were adopted for fungi and bacteria in the CLM-Microbe model (He et al., 2021a). In addition, bacterial and fungal growth is highly sensitive to environmental conditions, such as soil moisture and temperature. As a result, in the CLM-Microbe model, fungal and bacterial biomass lysis is represented as the interactive effects of their lysis rate constants and environmental factors, i.e., , rwater, , and rdepth, as described above. Microbial respiration is widely affected by multiple abiotic and biotic factors, such as substrate concentration and availability, soil moisture, and soil temperature (Gomez-Casanovas et al., 2012; Zhang et al., 2013). Therefore, in the CLM-Microbe model, fungal and bacterial respirations are represented as the interactive effects of substrates (i.e., DOM, SOM, and litter), environmental factors (i.e., , rwater, and ), and fraction factors quantifying C being respired by fungi and bacteria in transitions (Table S1). Fungal and bacterial biomass turnover and microbial respiration are defined following below equations:
where L denotes the lysis rate of fungal and bacterial biomass (in per day); kM is the potential turnover rate of fungal (kfungi) or bacterial (kbacteria) biomass (in per day); R represents the microbial respiration rate (in per day); fresp is the fraction factor defining the proportion of C released as respiration during decomposition (unitless).
The CLM-Microbe model treats N in the same framework as CLM4.5; it fully coupled C and nitrogen (N) dynamics in land components. Net N mineralization, the inorganic N supply in the soil for plant uptake, is heavily dependent on microbial immobilization of N. Microbial immobilization of N during decomposition steps depends on C : N ratio of organic materials for decomposition, the C : N ratio of fungal and bacterial biomass, and microbial CUE. The sum of potential immobilization over all immobilization in the biogeochemistry cascade is used to estimate microbial demand of mineral N. For each time step, such microbial mineral N demand is in competition with the total plant N demand of all plant functional types (PFTs) on a soil column. Once this competition has been resolved, actual immobilization is calculated as a proportion of potential immobilization, with the same proportion applied to all immobilization steps (Thornton et al., 2007). Remaining plant N demand summed over all PFTs indicates the demand-based competition between plants and microbes for soil mineral N resource on a column. Unmet plant N demand results in C supply surplus, which is translated back to the direct downregulation of photosynthetic rate and the reduction of GPP. Unmet plant N demand can also indirectly induce the reduced allocation to new growth on light capture in plants. Such consequences imply impacts of N limitation exerted by microbial competition for mineral N on plants, which can in turn affect soil microbial community through subsequent inputs of organic matter of various qualities.
2.2 Representation of fungal- and bacterial-mediated processes by column
In the CLM-Microbe model, land surface heterogeneity was represented using a hierarchical data structure, which is adapted from CLM4.5. Each land grid cell can contain multiple land units (e.g., glacier, lake, wetland, urban, vegetated land, and cropland), and each land unit can be further divided into multiple soil/snow columns. On the vegetated land units, multiple (up to 16) PFTs distinct in physiology and structure from different climate zones (e.g., needleleaf–evergreen-tree–boreal vs. needleleaf–deciduous-tree–boreal, broadleaf–evergreen-tree–tropical vs. broadleaf–deciduous-tree–tropical, and c3–arctic-grass vs. c3-non-arctic-grass) can occupy space on the column. All vegetation fluxes and state variables were defined at the PFT level, while soil fluxes and state variables were defined at the column level.
In the CLM4.5 and early versions of the CLM-Microbe model (before January 2021), parameters related to soil processes, such as decomposition, were assumed to be homogenous across data structure levels. Our previous work suggested the differences in microbial processes among biomes (He et al., 2021a); the implicitly accounted sub-grid microbial processes may introduce uncertainties in estimating soil and microbial fluxes and state variables. Since soil flux and state variables in the CLM-Microbe model are defined at the column level, we represented the heterogeneity of microbe-mediated processes by column. Each PFT shares similar physical, phylogenetic, and phenological characteristics; we thus assigned the parameter set of microbial properties by PFT. Furthermore, we determined the microbial properties of each column by the relative weight of PFTs occupied on the column, with the parameter set of the most dominant PFT adopted to represent the microbial and soil processes (e.g., fungal and bacterial biomass turnover rate, DOM degradation rate, and fungal and bacterial C assimilation proportion from SOM, litter, and DOM) on the column.
2.3 Model forcing data
The forcing data for the CLM-Microbe model include meteorological variables such as air temperature, relative humidity, incoming solar radiation, longwave radiation, precipitation rate, surface pressure, and surface winds. In this study, we used the CRUNCEP dataset to force the CLM-Microbe model, which has been widely used to force the CLM. The CRUNCEP dataset is a combination of two existing datasets, i.e., the Climate Research Center time-series (CRU TS) dataset of 0.5° × 0.5° at a monthly scale and the National Centers for Environmental Prediction (NCEP) reanalysis dataset of 2.5° × 2.5° at 6-hourly scale. In the CRUNCEP dataset, the diurnal and daily variations of variables such as the air temperature, precipitation, humidity, solar radiation, surface pressure, downward longwave radiation, and wind speed were derived from NCEP dataset, while their monthly means are bias corrected by the CRU TS dataset. This study used the CRUNCEP dataset version 7, with a spatial resolution of 0.5° × 0.5°, spanning from 1901 to 2016, to drive the model simulation (Viovy, 2018).
In addition to the meteorological data, we forced the CLM-Microbe model using time-varying CO2 concentration, N deposition, and aerosol concentration to estimate the C cycle change in the last century, provided by the National Center for Atmospheric Research (NCAR) for forcing the CLM offline simulations. Atmospheric N deposition during 1849–2006 with a spatial resolution of 1.25° longitude × 0.9° latitude was applied for all simulations. The CO2 concentrations remained fixed at 1850 levels (284.7 ppm) for accelerated decomposition and final runs followed by transient historical (1849–2006) changes in the transient run. The aerosol concentration in accelerated decomposition and final runs for offline simulation was prescribed at 1850 level, while aerosol concentration with a spatial resolution of 1.25° longitude × 0.9° latitude during 1765–2005 was used in the transient simulation. The transient land use and land cover change during the historical period is based on the dataset of the UNH Transient Land Use and Land Cover Change Dataset Version 1 (LUHa.v1), covering the period of 1850–2005, which was produced by University of New Hampshire research group (Louise Chini, George Hurtt, Steve Frolking; https://luh.umd.edu/readme_LUHa_v1.shtml, last access: 10 April 2018).
2.4 Model implementation
The model implementation was carried out in three stages, with the spatial resolution of the simulations being 2.5° longitude × 1.9° latitude. First, we ran the accelerated decomposition spinup to allow the system to reach its steady state (Koven et al., 2013; Thornton and Rosenbloom, 2005). We set the model simulations to 1200 years for the accelerated decomposition phase to reach the steady state (Fig. S2). Then, we ran a final spinup of 100 years to ensure the system was ready for transient simulations during 1850–2016. For the model years of 1850–1900 in transient simulations, we cycled atmospheric forcing during 1901–1910 of the CRUNCEP dataset version 7 to force the model. Then, we used the atmospheric data during 1901 to 2016 of the CRUNCEP dataset version 7 to drive the simulation between 1901 and 2016. The CLM-Microbe model was initially parameterized for fungal and bacterial mediated processes using time-series data of fungal and bacterial biomass carbon, HR, and SR by biome. The initial setting for microbial parameters by PFT was adopted from He et al. (2021a) and He et al. (2021b). Specifically, we assigned the same microbial parameters for PFTs found in a biome as their initial setting since our previous parameterizations for microbial processes were biome-specific. For example, broadleaf–evergreen-tree–tropical and broadleaf–deciduous-tree–tropical, belonging to the biome of tropical/subtropical forests, parameter set for tropical/subtropical forests biome, were applied for PFTs of broadleaf–evergreen-tree–tropical and broadleaf–deciduous-tree–tropical in initial simulations.
2.5 Validation data
Several datasets were employed in this study for model validation. To produce realistic soil conditions in the CLM-Microbe model at the grid level, we used datasets of SOC in the top 1 m soil profile from the Harmonized World Soil Database (HWSD) at 0.05° spatial resolution archived at Oak Ridge National Laboratory (Wieder, 2014) and SOC in the top 30 cm from the Global Soil Organic C Map (GSOCmap) version 1.5 at a spatial resolution of 1 km provided by Food and Agriculture Organization of the United Nations (FAO, 2018) to validate the SOC in the top 1 m and 30 cm of the CLM-Microbe model, respectively. To guarantee the reasonability of vegetation productivity, GPP and NPP of MODIS gridded datasets with a spatial resolution of 30 s during 2000–2015 were used to compare with the simulated GPP and NPP, respectively (Zhao et al., 2005). To reproduce the soil C emission flux, SR and HR from Global Gridded 1 km Annual Soil Respiration Database (SRDB) version 3 available at Oak Ridge National Laboratory were used to validate SR and HR, respectively (Warner et al., 2019). For FBC and BBC in the top 30 cm, the dataset of FBC and BBC with a resolution of 0.5° obtained from He et al. (2020) was used to validate FBC and BBC in the top 30 cm in the CLM-Microbe model, respectively. Microbial biomass C (MBC), the sum of FBC and BBC, in the top 1 m of the CLM-Microbe model outputs was compared with Xu et al. (2013) for accuracy. The DOC in 0–30 cm and 0–1 m with a resolution of 0.5° derived from Guo et al. (2020) was compared with that in the top 30 cm and 1 m, respectively, from the CLM-Microbe output for validation. More details about the datasets used for validation can be found in Table S4. Ten-year (2000–2009) averages of simulated soil, vegetation, and microbial variables from the CLM-Microbe output were calculated to compare with those from observed datasets previously described.
To assess the efficacy of the CLM-Microbe model, the available soil and vegetation variables from the CLM4.5, including GPP, NPP, HR, SR, and SOC in the top 30 cm and 1 m, were adopted for comparison. The simulation results during 1850–2014 were forced using CRUNCEP dataset version 7, with environmental changing factors, including N deposition and rising CO2, considered in the historical simulation. The GPP, NPP, HR, SR, and SOC in the top 30 cm and 1 m were from CLM land-only release, provided by Climate Data Gateway at the National Center for Atmospheric Research (NCAR). All variables were at a resolution of 0.9° latitude × 1.25° longitude. The temporal resolutions differed among variables, with GPP, NPP, SR, and HR being saved on a monthly scale, while SOC in 0–30 cm and 0–1 m was saved on a yearly scale. Ten-year (2000–2009) averages of the CLM4.5-simulated GPP, NPP, HR, SR, and SOC (0–30 cm and 0–1 m) were calculated to represent the long-term soil and vegetation status and for comparison with observed variables.
Since observational datasets and model simulations are of different resolutions and 0.5° is the most widely used, we used the function of linint2 in NCAR Command Language to interpolate those datasets and model outputs from their original resolutions to 0.5°. To make the maps comparable, we used the nibble and extracted by mask functions provided by ArcGIS version 10.2 (ESRI, Redlands, California, USA) to make all maps consistent in geographical boundary and missing values.
2.6 Model parameterization
Although most processes in the CLM-Microbe model were adapted from the CLM4.5, the modification of microbe-mediated decomposition cascades and microbial functional group-mediated methane cycle may reduce the applicability of default parameters in the CLM4.5. Therefore, we performed the parameterization against observational data of FBC and BBC in He et al. (2021a) and HR and SR in He et al. (2021b), with at least two sites in each biome (one for calibration and the rest for validation). Before the parameterization, we guaranteed reasonable soil and vegetation conditions by comparing the simulated NPP and SOC with observational data. To calibrate the DOC simulated in the model, we collected reported observational data from previous publications. When selecting the data, we ensured that observational DOC in the top 30 cm and 1 m was from natural biomes, and each biome included at least two sites (Tables S2–3). We calibrated the DOC in the top 30 cm and 1 m by plotting the simulated DOC in the top 30 cm and 1 m against observational data, and we found good performance of the CLM-Microbe in reproducing the observed DOC in both top 30 cm (R2=0.6, P<0.0001) and 1 m (R2=0.6, P<0.0001) (Fig. S3).
Despite the good performance of the CLM-Microbe model in the calibration phase using observational data at the site scale, minor parameter adjustments were necessary to capture variations at the global scale. We optimized the model parameters related to plant, soil, and microbial processes based on SOC in the top 30 cm from the GSOC map and in the top 1 m from the HWSD dataset, vegetation GPP and NPP from MODIS, SR and HR from SRDB, FBC and BBC (0–30 cm) in He et al. (2020), MBC in Xu et al. (2013), and DOC (0–30 cm and 0–1 m) in Guo et al. (2020). We primarily focused on parameters related to plant photosynthesis (e.g., flnr) and e-folding factor for decomposition (e.g., decomp_depth_efolding) to match the reported GPP, NPP, and SOC in the top 0–30 cm and 1 m. To calibrate the model to fit the observed FBC, BBC, and DOC, we adjusted parameters related to soil microbial (k_fungi and k_bacteria) and DOC (k_dom) turnover, microbial C assimilation efficiency (m_rf_s1m, m_ rf_ s2m, m_rf_s3m, and m_rf_s4m), the proportion of C being released as respiration (m_batm_f and m_ fatm_f), plant C allocation (froot_leaf), and the N concentration of plant tissues (leafcn and frootcn) to optimize the model simulations of FBC, BBC, MBC, DOC, SR, and HR.
2.7 Model evaluation
To evaluate the model performance in capturing the spatial variation in soil and vegetation variables, we compared GPP, NPP, HR, SR, FBC, and BBC in the top 30 cm, MBC (0–1 m) and DOC and SOC (0–30 cm and 0–1 m) reported by the observational datasets and simulated averages of these variables during 2000–2009. Due to the non-normality of those variables, Spearman's rank correlation was used to evaluate the overall model performance for those variables. The Spearman's rank correlation coefficient (rs), measuring the strength and direction of association between two ranked variables, was calculated following the equation as below:
where rs is the Spearman's rank correlation coefficient; R(x) means the rankings of variable x; R(y) indicates the rankings of variable y; cov(R(x), R(y)) is the covariance of R(x) and R(y); σ(R(x) and σR(y) are the standard deviations of the rankings of variable x and y, respectively.
2.8 Statistical analysis
Due to the non-normality of simulated and observed GPP, NPP, HR, SR, FBC, and BBC in the top 30 cm, MBC (0–1 m), and DOC and SOC (0–30 cm and 0–1 m), we examined the agreement between variables simulated by the CLM-Microbe model or CLM4.5 during 2000–2009 and corresponding observed values at the grid level using Spearman's rank-order correlation. Such analyses were conducted using the function of cor.test with a method of spearman in “stats” package in R (R Core Team, 2013). The differences in soil, vegetation, litter, and microbial variables between decadal averages of 1901–1910 and 2007–2016 were examined using an independent t test, conducted with the function of t.test in “stats” package in R (R Core Team, 2013) by continents and with the function of ttest in NCAR Command Language (https://www.ncl.ucar.edu, last access: 10 April 2018) by grid.
To identify external environmental controls of soil, vegetation, litter, and microbial variables, we examined the correlations between vegetation productivity and mean annual temperature (MAT) and precipitation (MAP) and correlations of soil temperature (ST) and moisture (SM) with soil, litter, and microbial variables with respect to their area-weighted averages at the grid level from 1901 to 2016. Considering the consistent but stronger environmental influence on soil and microbial variables in the top 30 cm than in the top 1 m, only correlations between external environmental factors and soil and microbial variables in the top 1 m were assessed for whether an association exists. The correlations between external environmental factors (e.g., MAP, MAT, SM, and ST) and annual averages of GPP, NPP, HR, SR, VegC, FBC, BBC, DOC, SOC, and litter C (LitC) in the top 1 m at the global level during 1901 to 2016 were estimated using the Pearson's correlation. These statistical analyses above were performed, and relevant figures (Figs. 1–4 and 8) were plotted using “graphics” (R Core Team, 2013) and “ggcorrplot” (Kassambara and Kassambara, 2019) packages in R.
To estimate the changing rate of GPP, NPP, HR, SR, FBC, and BBC in the top 30 cm, FBC, BBC, DOC, LitC, and SOC in the top 1 m, and VegC during 1901 to 2016, we conducted linear regression models for these variables with time at the grid level, with the changing rate indicated by the slope of the regression model. In addition, correlations between environmental factors (e.g., MAT, MAP, ST, and SM) and vegetation, soil, litter, and microbial variables including GPP, NPP, HR, SR, VegC, FBC, BBC, DOC, SOC, and LitC in the top 1 m at the grid level were estimated using Pearson's correlation. Such statistical analyses were performed using NCAR Command Language (https://www.ncl.ucar.edu, last access: 10 April 2018). Relevant figures (Figs. 5–7 and 9) were produced using MATLAB version 2021b (The MathWorks, Inc.).
3.1 Model validation and comparison with the CLM4.5
The CLM-Microbe produced comparable results with most observed data and performed comparably to or slightly better than the CLM4.5 with respect to the global C budget (Table 1), latitudinal trend (Figs. 1 and S4), and individual grid (Figs. 2 and S5). The CLM-Microbe model and the CLM4.5 overestimated the GPP by 15.7 % and 7.3 %, respectively (Table 1). However, NPP simulated by the CLM-Microbe model and the CLM4.5 was overestimated by 1.3 % and underestimated by 8.1 %, respectively. Similarly, SR was overestimated in the CLM-Microbe (15.6 %) and the CLM4.5 (4.0 %) models. HR in the CLM-Microbe and CLM4.5 models was overestimated by 1.7 % and underestimated by 4.4 %, respectively. Both the CLM-Microbe model and the CLM4.5 underestimated SOC (0–30 cm) by 8.5 % and 22.4 %, respectively, while SOC (0–1 m) in the CLM-Microbe model and the CLM4.5 was overestimated by 32.4 % and underestimated by 21.4 %, respectively. The FBC, BBC, MBC, and DOC, only available in the CLM-Microbe model, were better predicted in the top 30 cm than 1 m. The simulated FBC, BBC, and DOC in the top 30 cm were underestimated by 3.3 % and overestimated by 26.7 % and 24.9 %, respectively, while MBC and DOC in the top 1 m were overestimated by 69.5 % and 75.0 %, respectively.
Table 1Annual flux of GPP, NPP, HR, and SR and carbon stocks of FBC in the top 30 cm, BBC in the top 30 cm, MBC (0–1 m), DOC in the top 30 cm, SOC in the top 30 cm, and SOC in the top 1 m by observed datasets and by simulations of the CLM-Microbe model and CLM4.5 at the global scale.
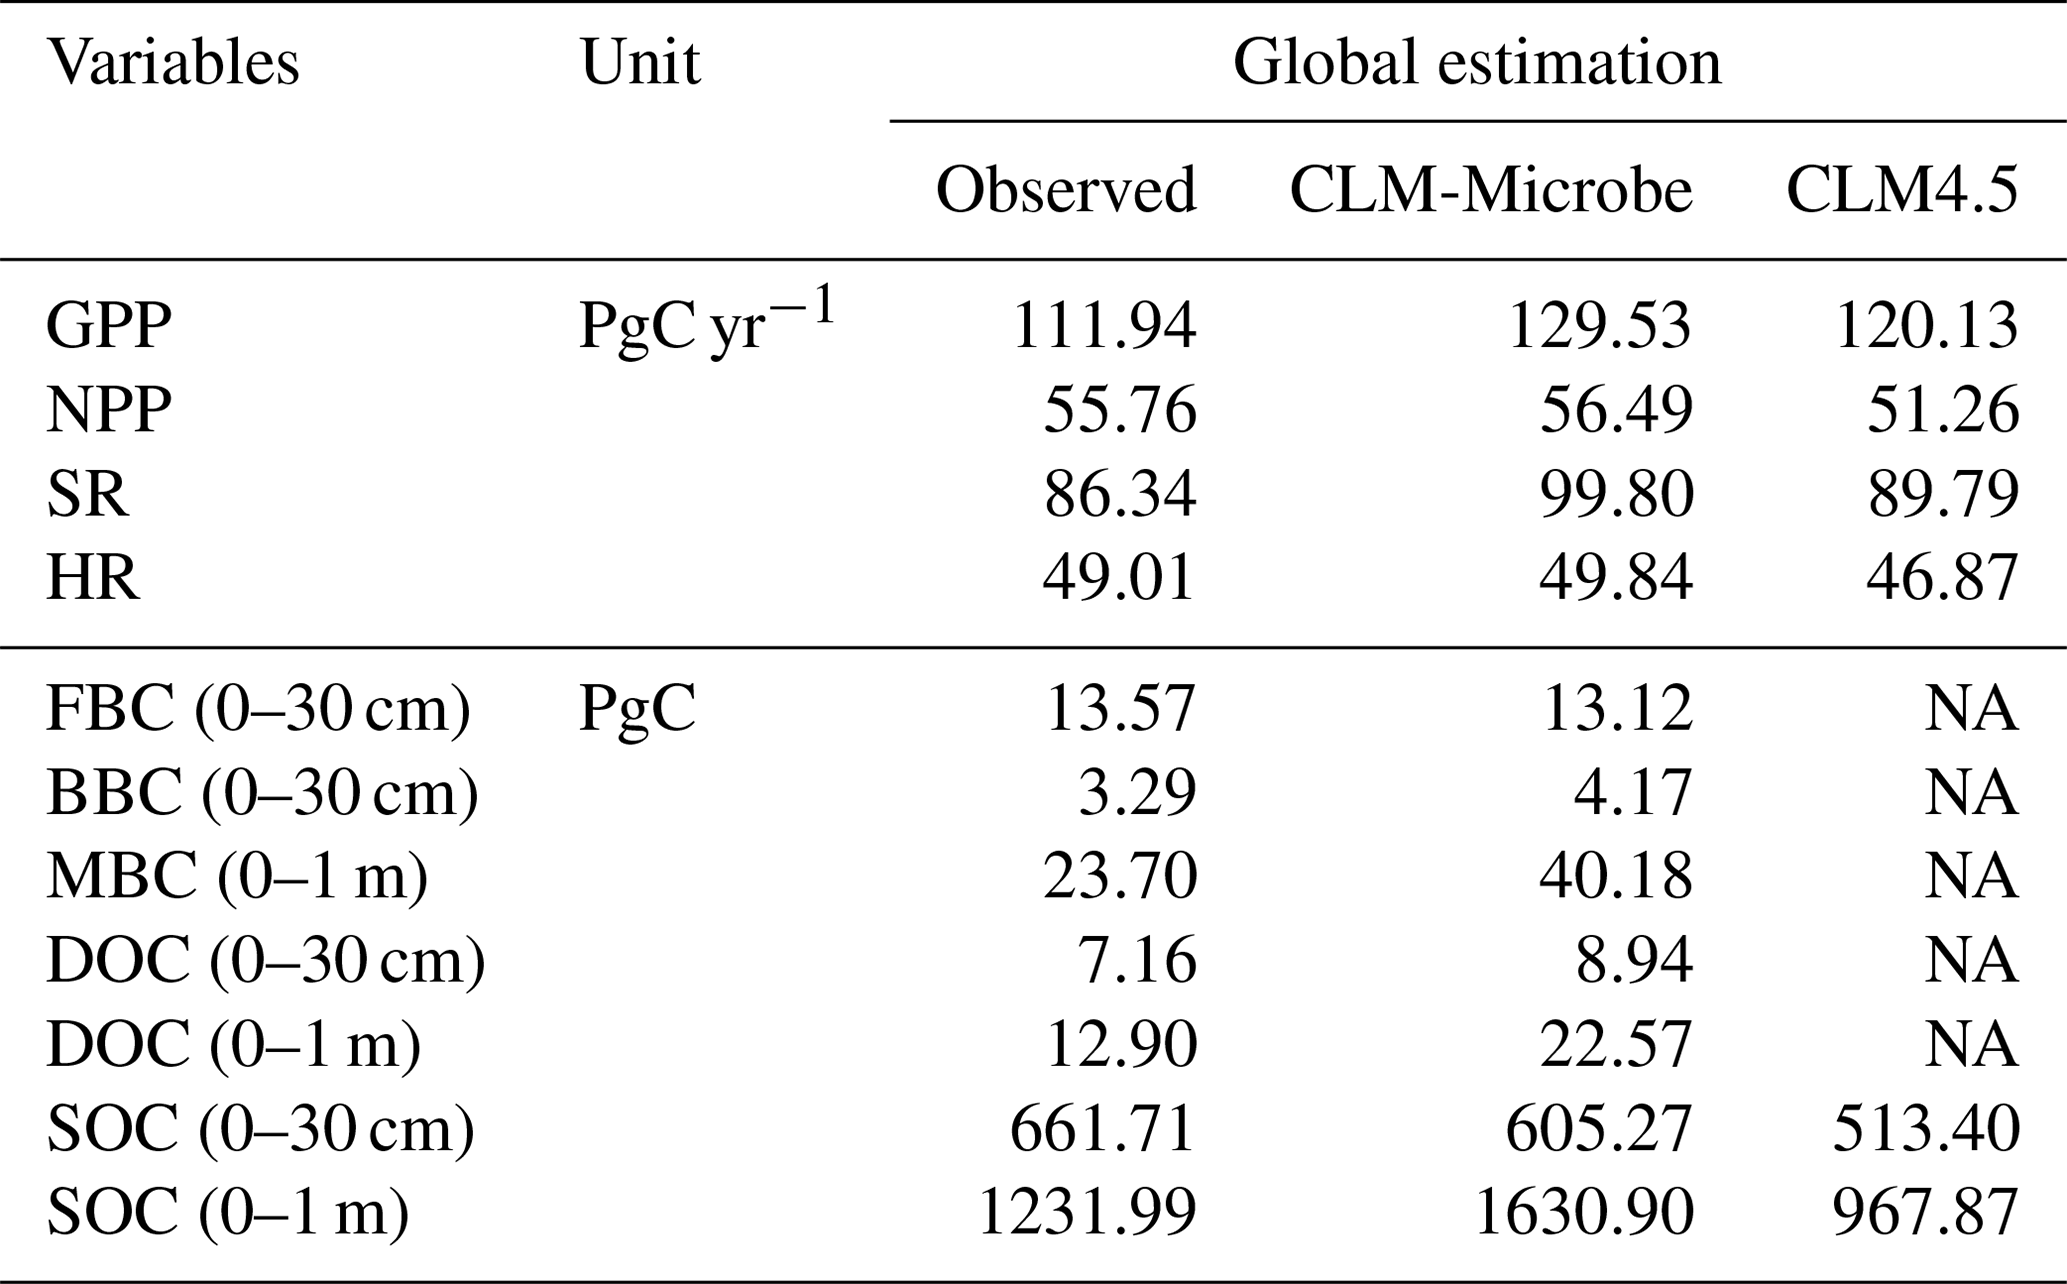
GPP: gross primary productivity; NPP: net primary productivity; HR: heterotrophic respiration; SR: soil respiration; DOC: dissolved organic carbon; SOC: soil organic carbon; FBC: fungal biomass carbon; BBC: bacterial biomass carbon; MBC: microbial biomass carbon. NA: not available. The SOC (0–1 m) data are from the Harmonized World Soil Database (HWSD, https://daac.ornl.gov/cgi-bin/dsviewer.pl?ds_id=1247, last access: 10 April 2018); the SOC (0–30 cm) data are from the Global Soil Organic Carbon Map (GSOCmap) version 1.5; GPP and NPP data are from MODIS gridded datasets (http://files.ntsg.umt.edu/data/NTSG_Products/, last access: 10 April 2018); the SR and HR data are from Global Gridded 1 km Annual Soil Respiration Database (SRDB) version 3 (https://daac.ornl.gov/CMS/guides/CMS_Global_Soil_Respiration.html, last access: 10 April 2018); the FBC and BBC in the top 30 cm are from He et al. (2020); MBC (0–1 m) is compared with Xu et al. (2013); the DOC (0–30 cm and 0–1 m) is derived from Guo et al. (2020). Output of the CLM-Microbe model during 2000–2009 (decadal average) is used to compare with observational data.
The CLM-Microbe model can reasonably reproduce the latitudinal trends of vegetation, soil, and microbial variables, with the model performance varied among variables and along soil depth (Fig. 1). The latitudinal trends of both GPP and NPP in the CLM-Microbe model agreed with observed data with a slight overestimation at northern latitudes and in equatorial regions, but NPP was slightly underestimated in the Southern Hemisphere (Fig. 1a and b). Both HR and SR simulated by the CLM-Microbe model agreed well with observed data in the Southern Hemisphere but were overestimated in equatorial regions and at mid-high latitudes and underestimated at low latitudes in the Northern Hemisphere (Fig. 1c and d). Similar latitudinal trends of HR and SR were also observed in the CLM4.5 simulation (Fig. S4c and d). Soil C pools showed similar latitudinal patterns across soil depths (Fig. 1e–k). Specifically, DOC (0–30 cm and 0–1 m) was overestimated in equatorial regions but underestimated in northern temperate regions (Fig. 1e–f). Meanwhile, the CLM-Microbe model overestimated SOC (0–30 cm and 0–1 m) in equatorial and northern high-latitude regions but underestimated in northern mid-latitude regions (Fig. 1g and h). As opposed to the CLM-Microbe model, the CLM4.5 consistently underestimated SOC (0–30 cm and 0–1 m) along latitudes, except for SOC (0–1 m) at latitudes of > 60° N. Similarly, both FBC and BBC in the top 30 cm were overestimated in equatorial regions and at northern high latitudes but underestimated in northern mid-latitude regions (Fig. 1i and j). Overall, FBC (0–30 cm) at southern latitudes was well predicted by the CLM-Microbe model, but BBC (0–30 cm) in that region was underestimated, while MBC (0–1 m) was overestimated across latitudinal gradients (Fig. 1k).
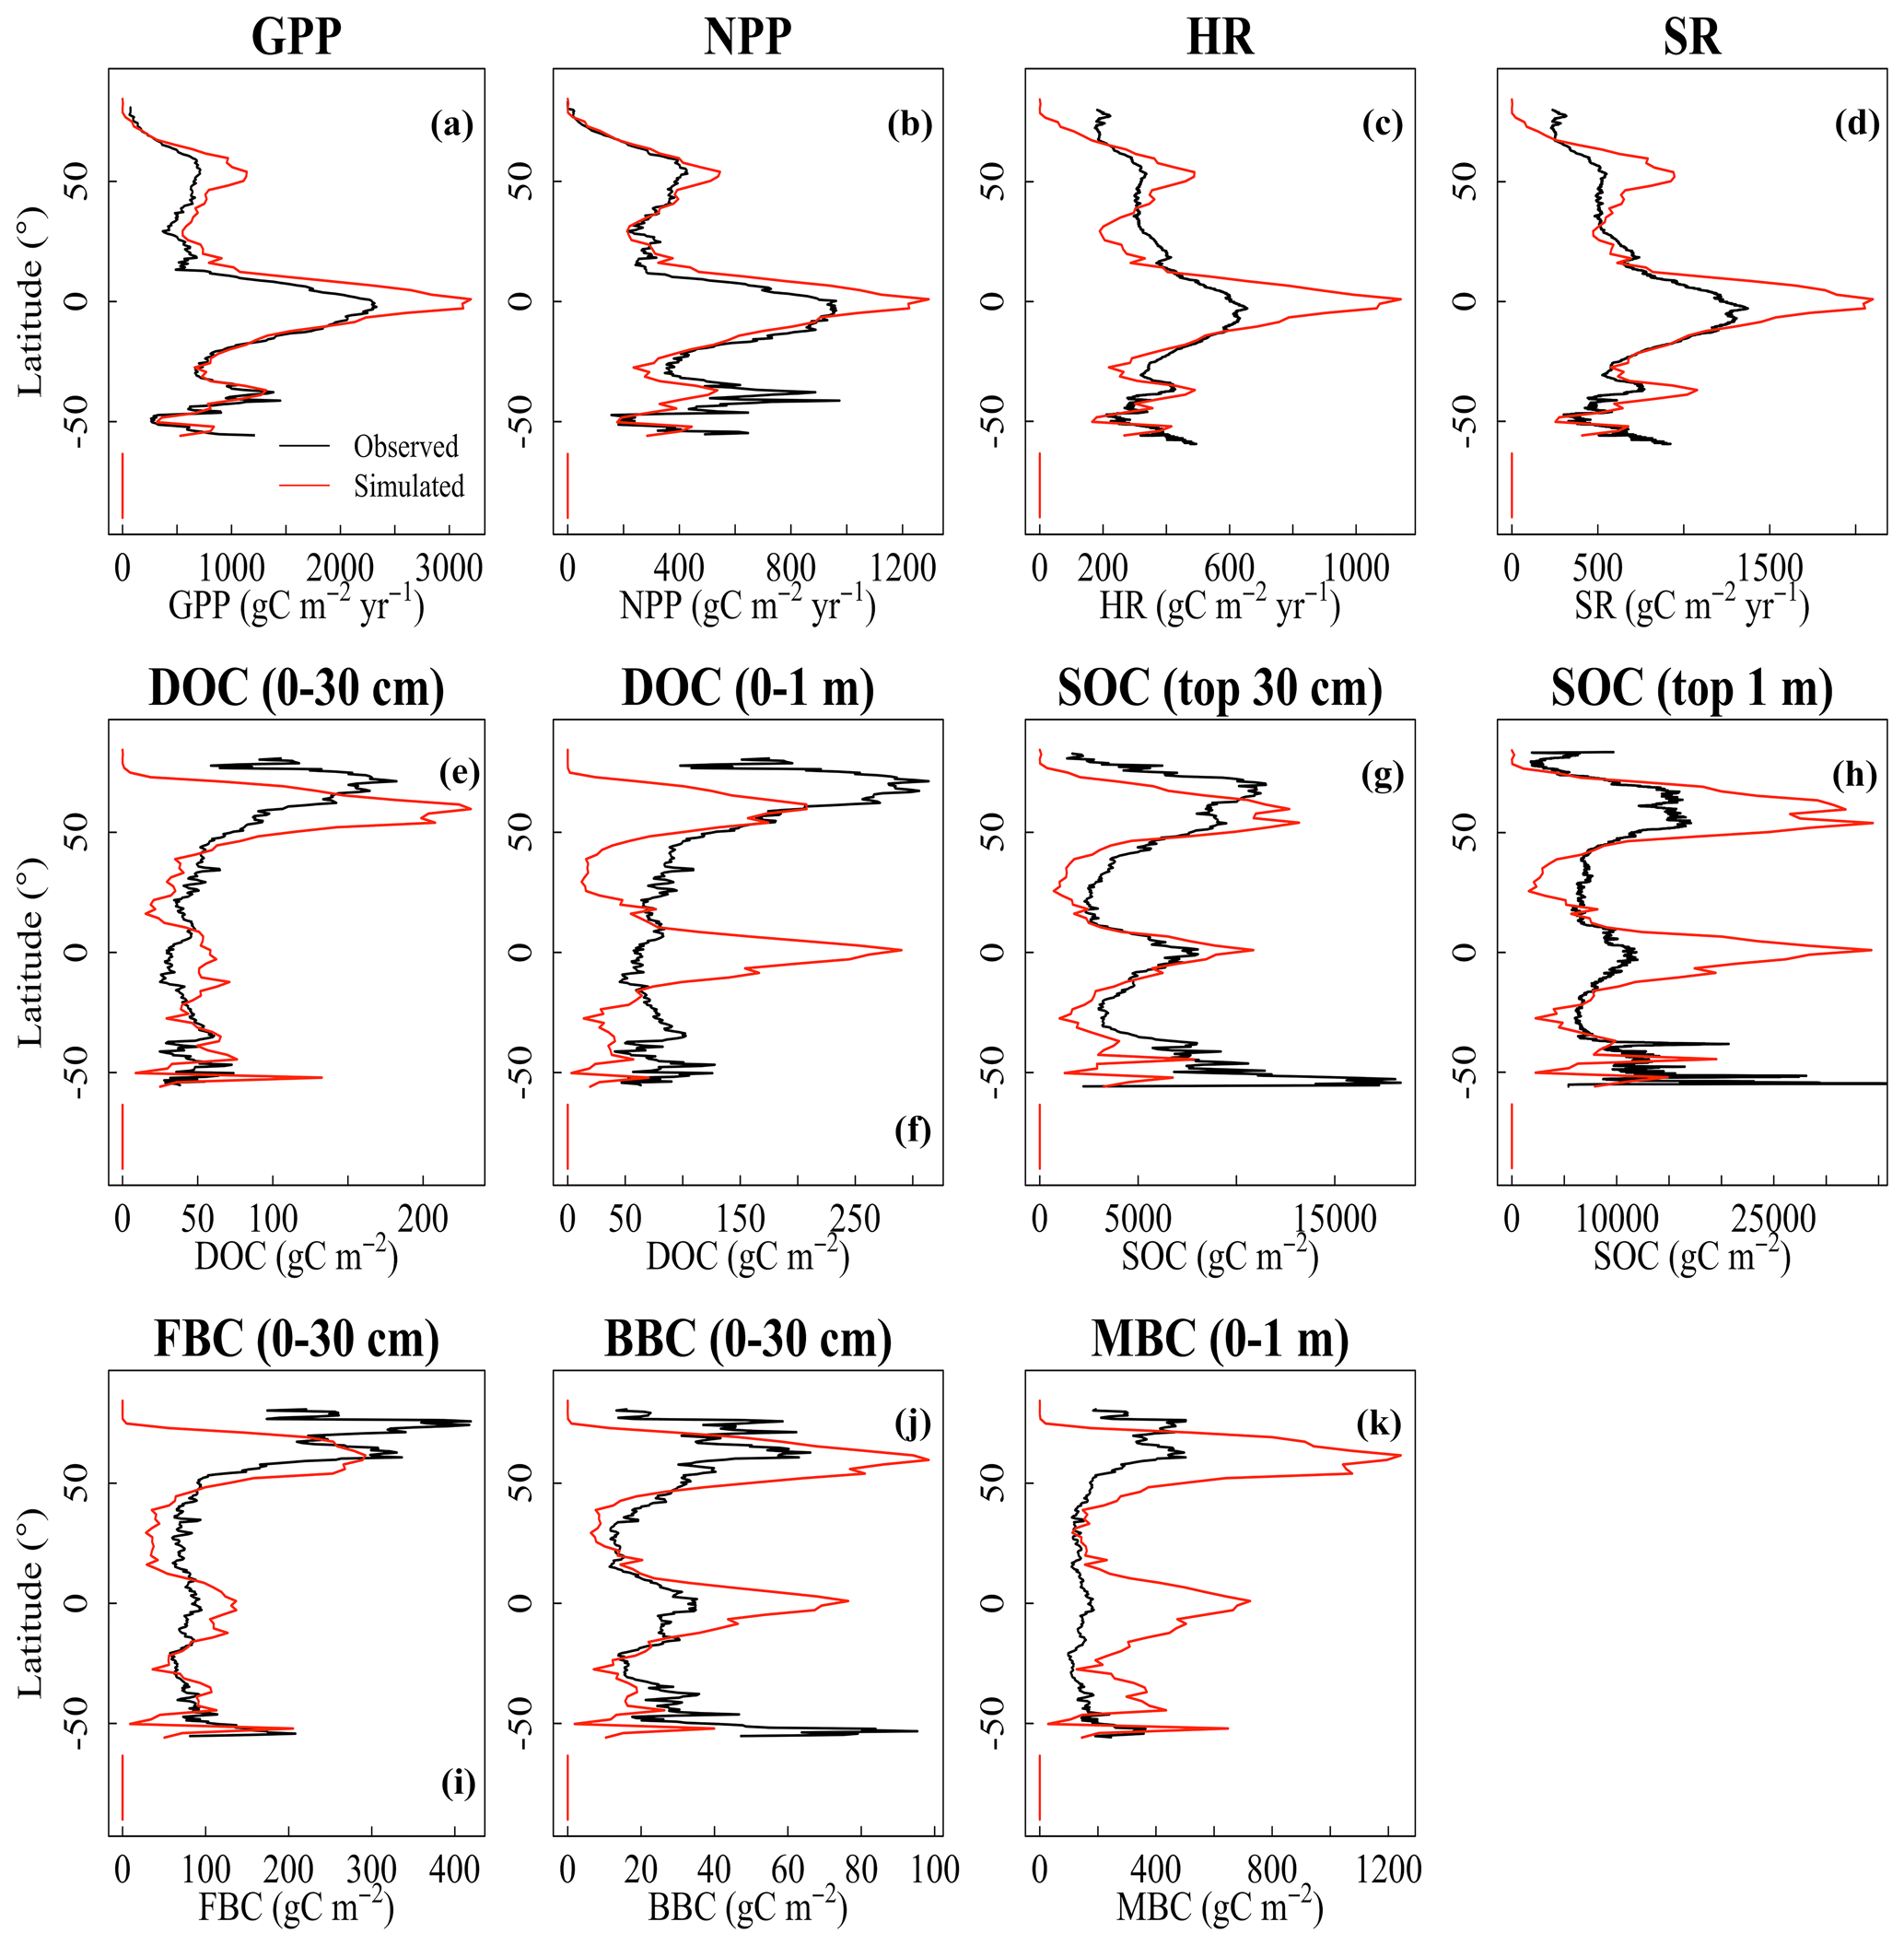
Figure 1Latitudinal comparison between observed (black line) and the CLM-Microbe-simulated (red line) (a) GPP, (b) NPP, (c) HR, (d) SR, and (e) DOC in the top 30 cm, (f) DOC in the top 1 m, (g) SOC in the top 30 cm, (h) SOC in the top 1 m, (i) FBC in the top 30 cm, (j) BBC in the top 30 cm, and (k) MBC (0–1 m). GPP: gross primary productivity; NPP: net primary productivity; HR: heterotrophic respiration; SR: soil respiration; DOC: dissolved organic carbon; SOC: soil organic carbon; FBC: fungal biomass carbon; BBC: bacterial biomass carbon; MBC: microbial biomass carbon.
At the grid scale, the simulated values of vegetation, soil, and microbial variables with the CLM-Microbe model were significantly consistent with the observational results (P<0.05; Fig. 2). The CLM4.5 also indicated significant consistency between simulated and observed vegetation and soil variables (P<0.05; Fig. 2). Overall, the CLM-Microbe model and CLM4.5 performed well at simulating GPP and NPP compared to simulating soil and/or microbial variables. The simulated GPP (rs=0.91) and NPP (rs=0.86) with the CLM-Microbe model were significantly and positively related to their observed values (Fig. 2a and b). The GPP (rs=0.88) and NPP (rs=0.82) in the CLM4.5 were also significantly and positively associated with observed values (Fig. S5a and b). The SR tended to be better predicted than HR in both the CLM-Microbe model (rs=0.70 for SR vs. rs=0.68 for HR) and the CLM4.5 (rs=0.68 for SR vs. rs=0.64 for HR) (Fig. 2c and d and Fig. S5c and d). The DOC in 0–1 m (rs=0.36) was slightly better reproduced than in 0–30 cm (rs=0.34) in the CLM-Microbe model (Fig. 2e and f), while both the CLM-Microbe model (rs=0.68 for 0–30 cm vs. rs=0.63 for 0–1 m) and CLM4.5 (rs=0.63 for 0–30 cm vs. rs=0.59 for 0–1 m) performed better at simulating SOC in the top 30 cm than in the top 1 m (Figs. 2g and h, S5e and f). Similarly, the CLM-Microbe model performed better in simulating FBC and BBC in the top 30 cm than MBC in the top 1 m (rs=0.43) (Fig. 2i–k). In addition, BBC (rs=0.53) was better reproduced than FBC (rs=0.46) in the top 30 cm.
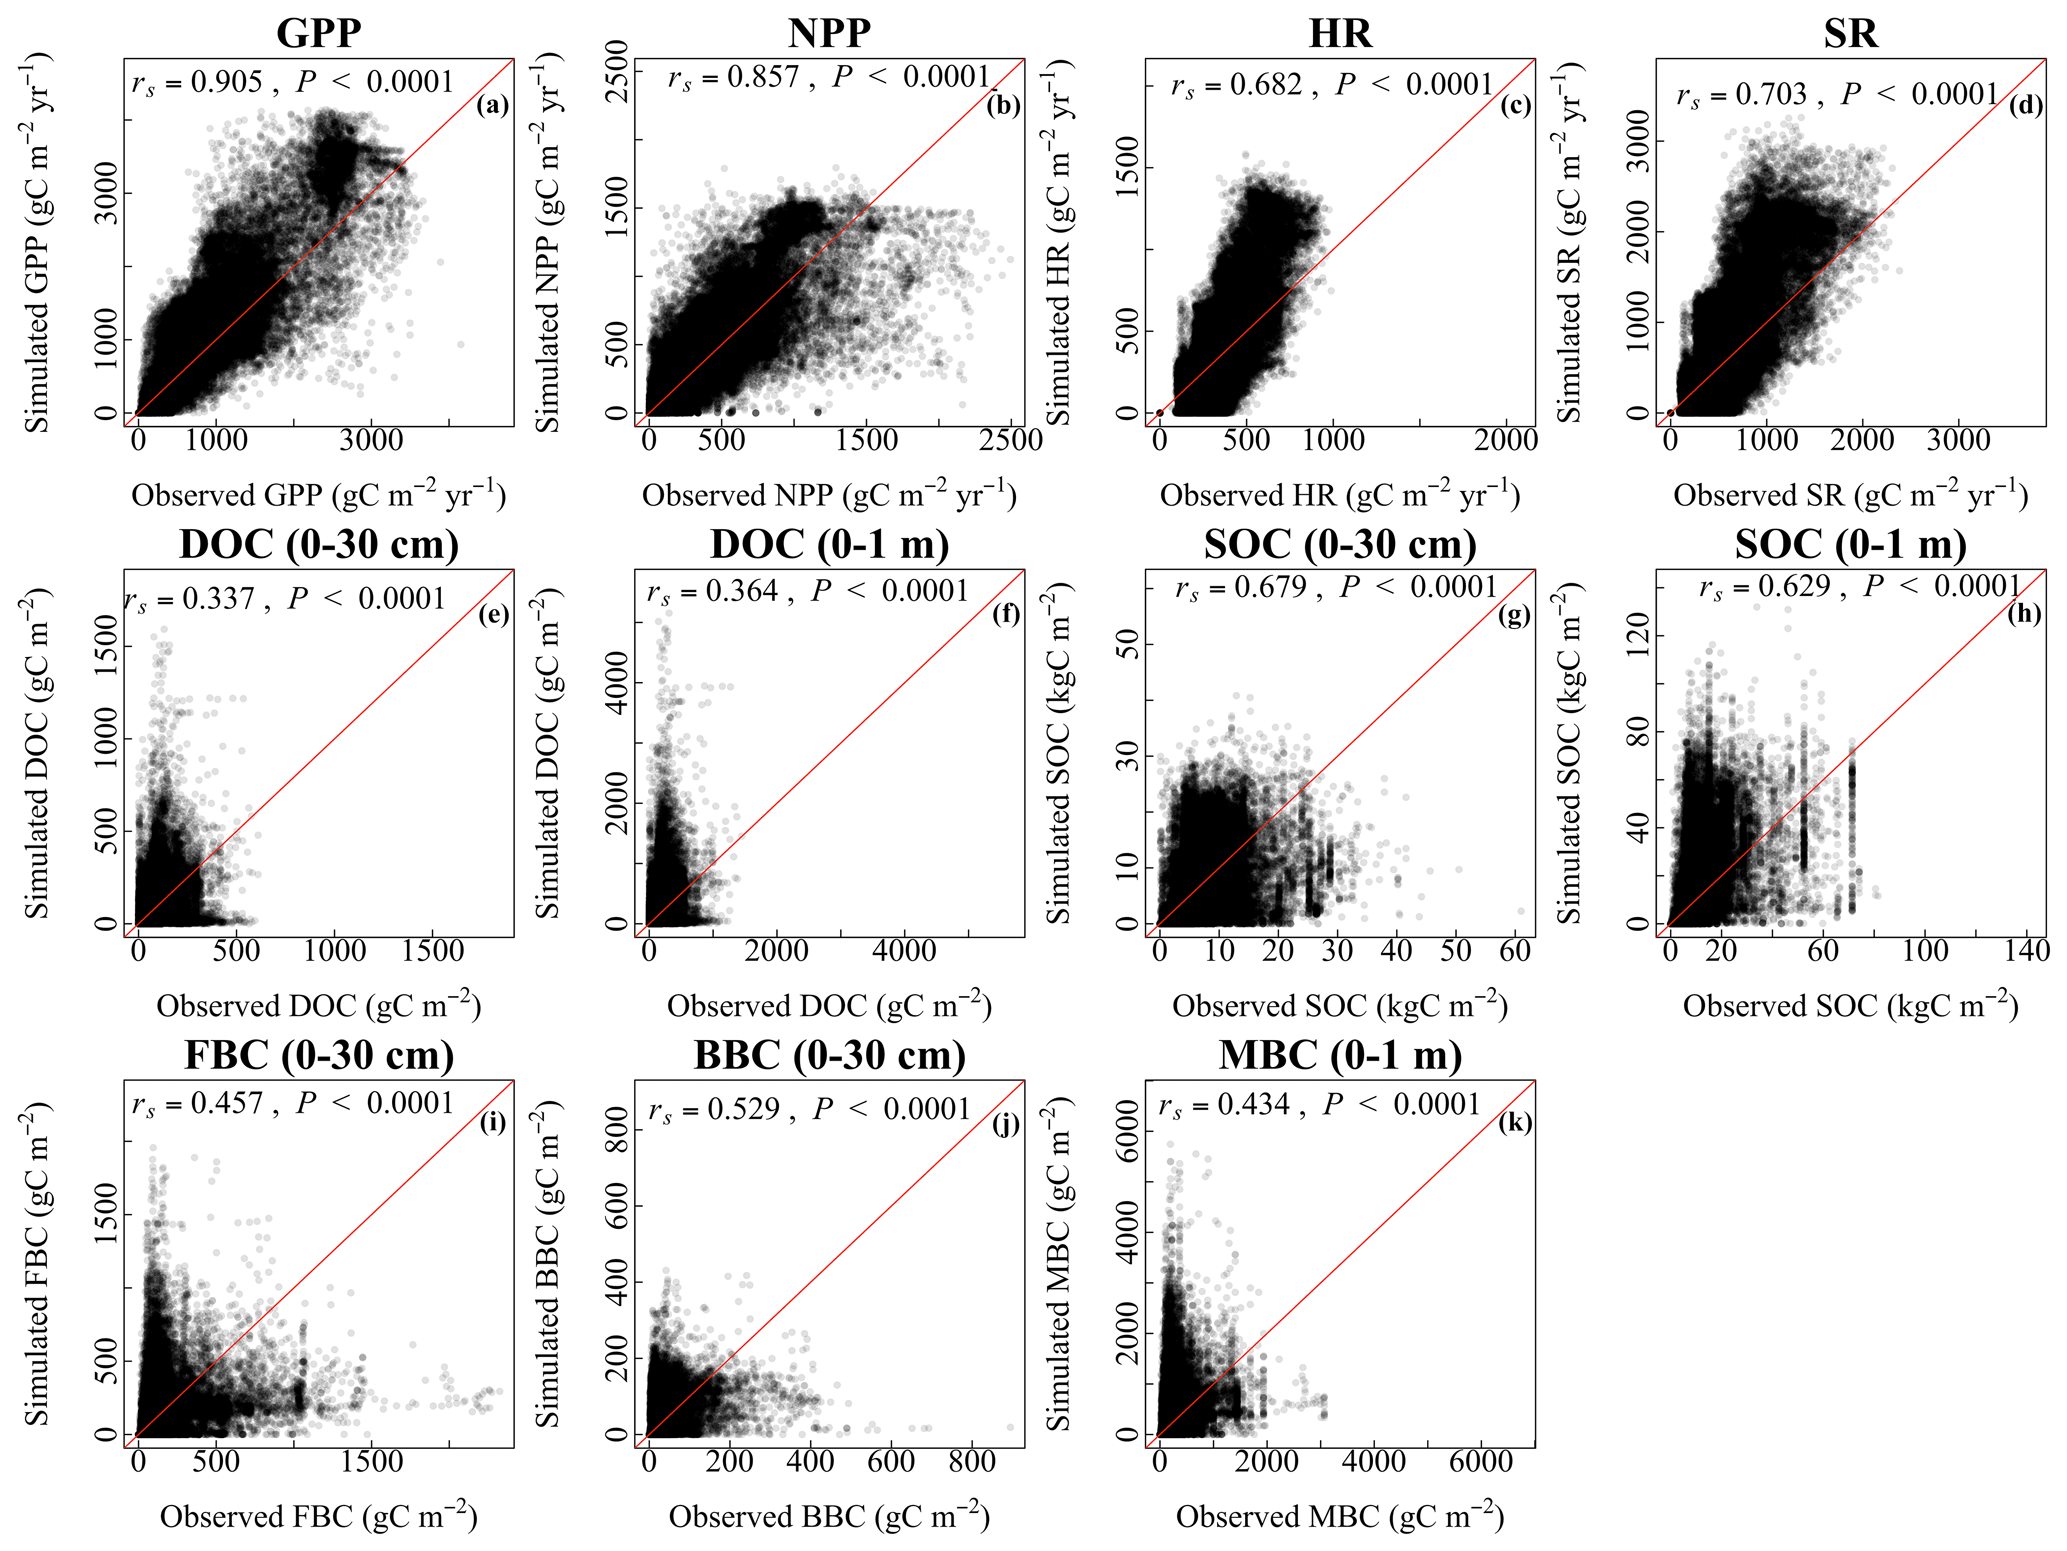
Figure 2Grid-by-grid comparison between observed and the CLM-Microbe-simulated (a) GPP, (b) NPP, (c) HR, (d) SR, and (e) DOC in the top 30 cm, (f) DOC in the top 1 m, (g) SOC in the top 30 cm, (h) SOC in the top 1 m, (i) FBC in the top 30 cm, (j) BBC in the top 30 cm, and (k) MBC (0–1 m). Red lines are 1:1 line. GPP: gross primary productivity; NPP: net primary productivity; HR: heterotrophic respiration; SR: soil respiration; DOC: dissolved organic carbon; SOC: soil organic carbon; FBC: fungal biomass carbon; BBC: bacterial biomass carbon; MBC: microbial biomass carbon.
3.2 Carbon fluxes and pools associated with soil microbes
The HR and SR displayed increasing trends from 1901 to 2016 (Fig. 3a–b), with different magnitudes among variables. By 2016, the increase of SR (25 PgC yr−1) was about twice that of HR (12 PgC yr−1). Their increasing rates showed variations with time. We observed a relatively modest increase in HR and SR during 1901–1980, whereas their increases were more rapid from 1981–2016. In addition, microbial C pools increased from 1901 to 2016 despite the year-to-year variability (Fig. 3c–f). The FBC and BBC in the top 30 cm and FBC and BBC in the top 1 m increased by about 1.0, 0.4, 1.2, and 0.7 PgC, respectively, from 1901 to 2016. However, the temporal trends of those variables varied during 1901 to 2016. The FBC (0-30 cm and 0–1 m) decreased from 1901–1940 and increased after 1940 (Fig. 3c–d). The BBC (0–30 cm and 0–1 m) exhibited little change during 1901–1940 but increased rapidly during 1941–2016 (Fig. 3e–f).
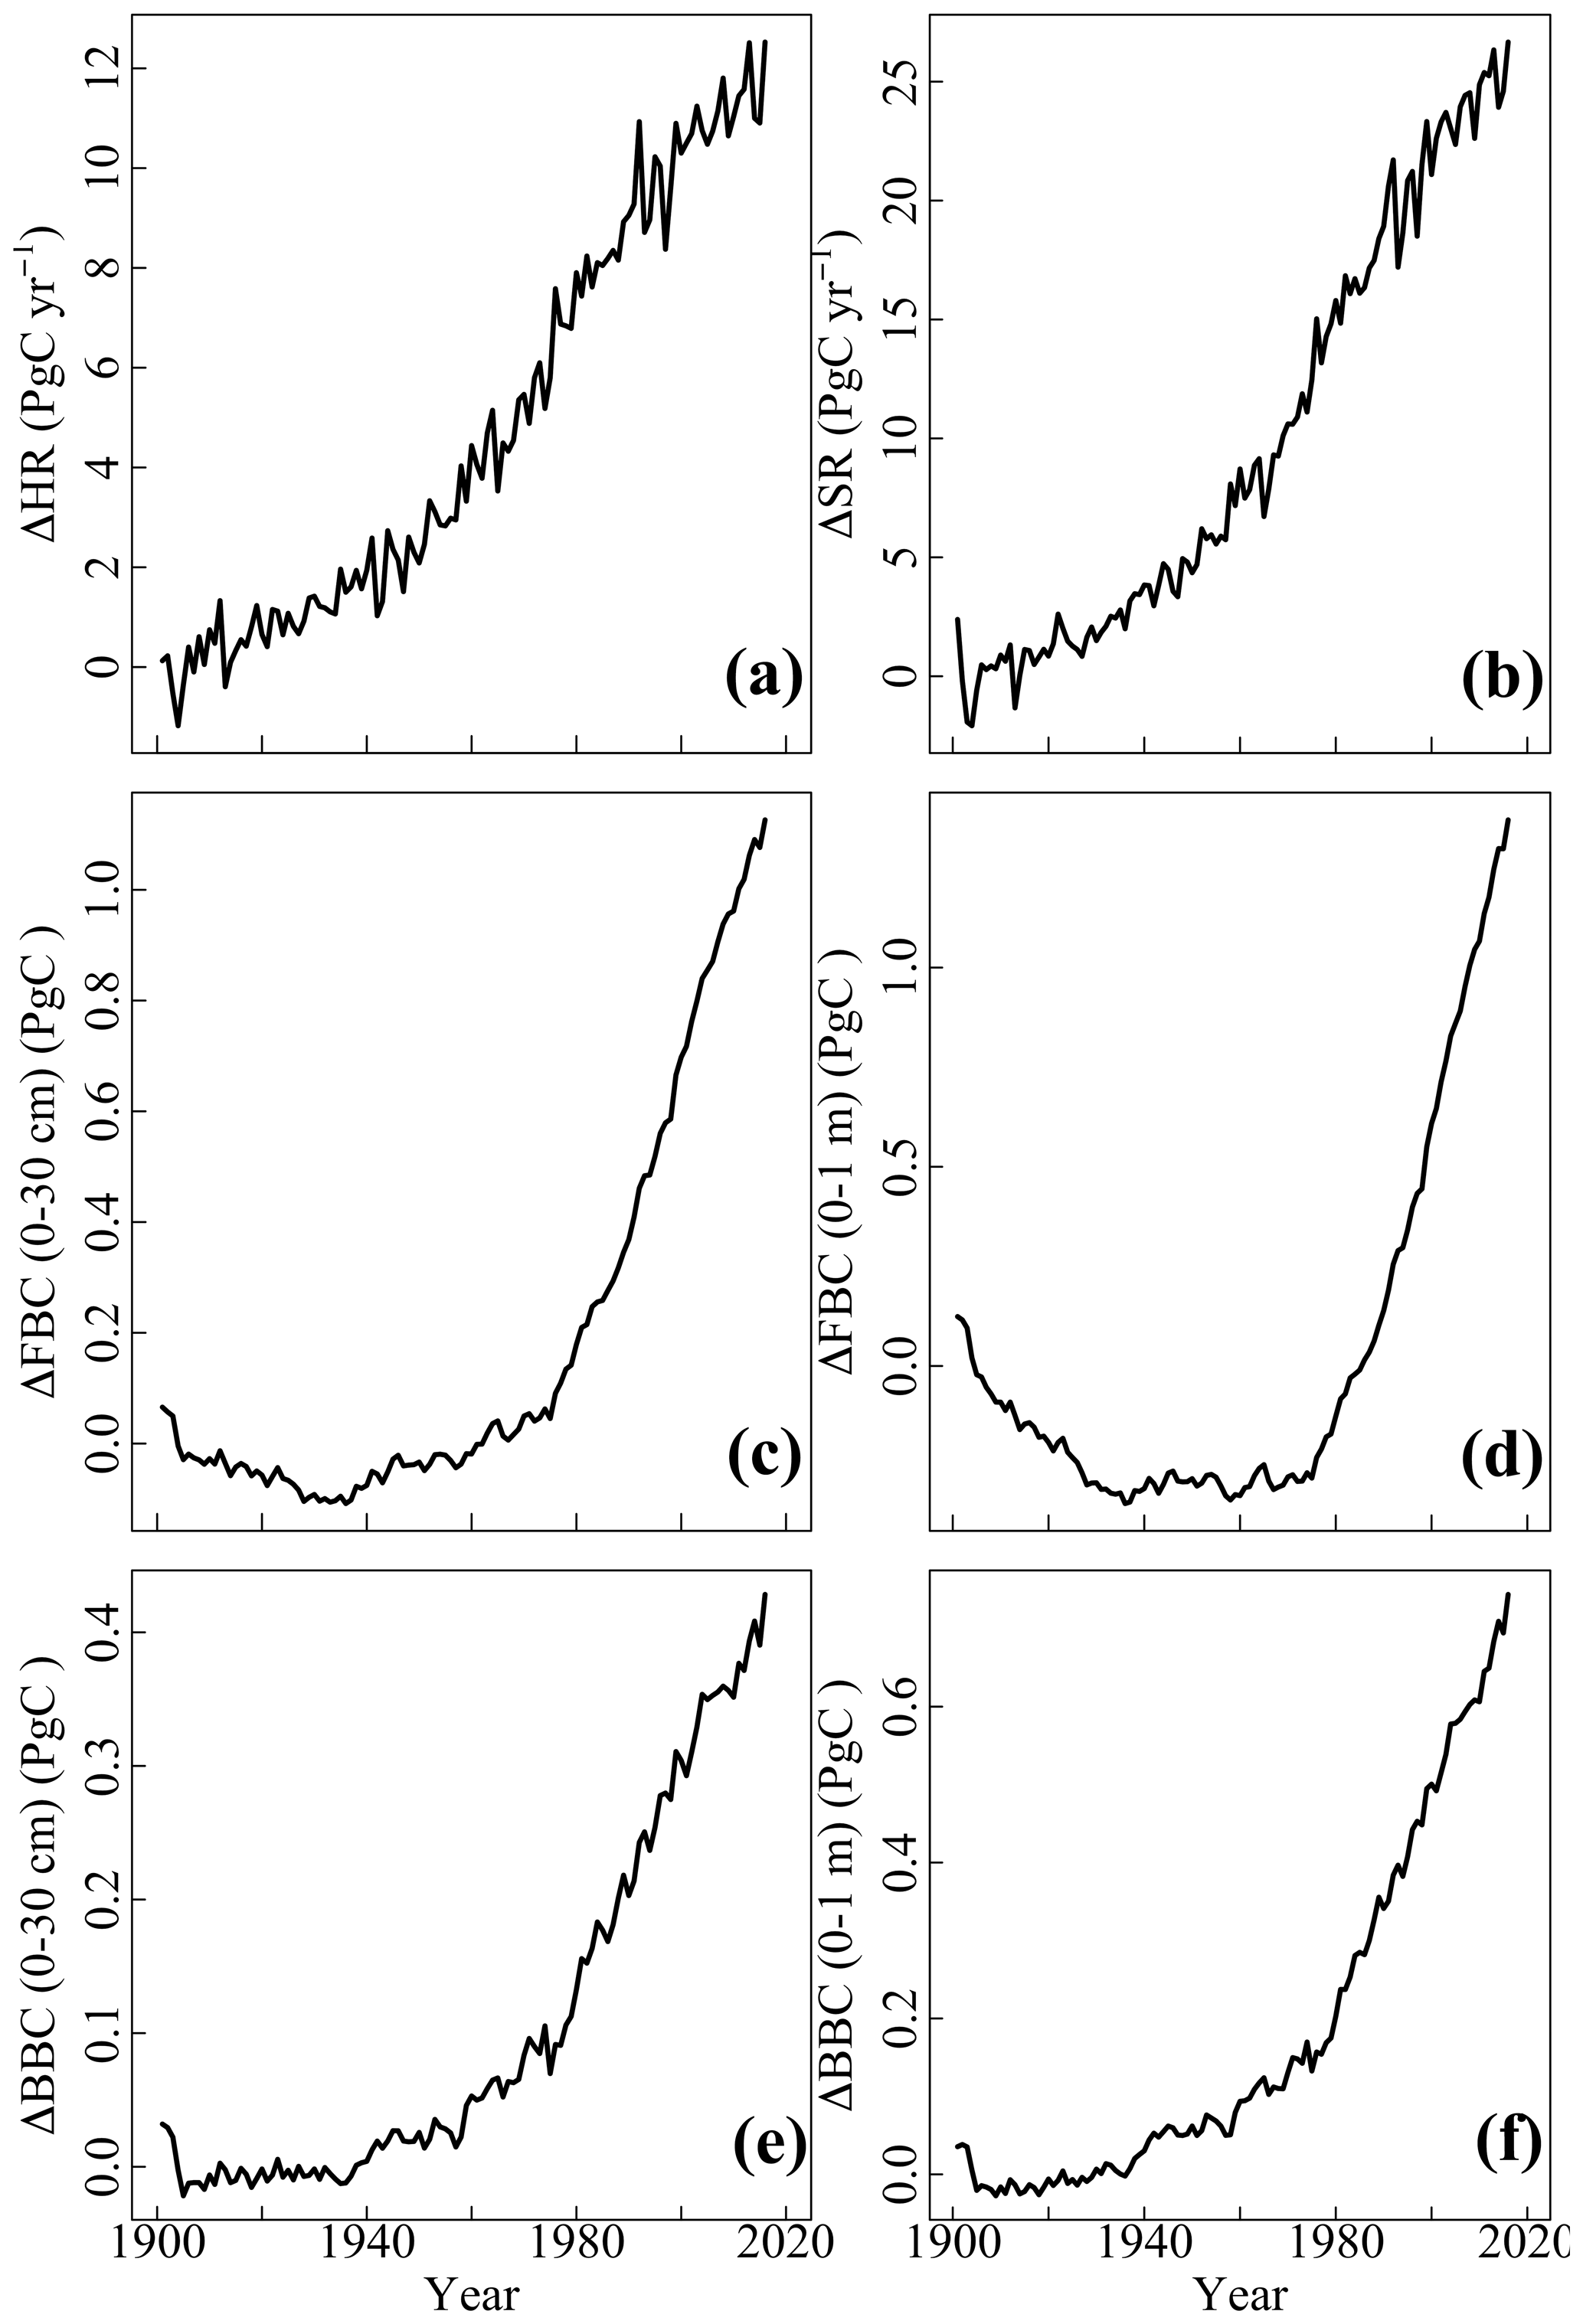
Figure 3Evolution of annual carbon flux of area-weighted (a) HR and (b) SR and carbon stock of (c) FBC in the top 30 cm, (d) FBC in the top 1 m, (e) BBC in the top 30 cm, and (f) BBC in the top 1 m simulated by the CLM-Microbe model since 1901. The baseline was the 10-year average of corresponding variables during 1901–1910. HR: heterotrophic respiration; SR: soil respiration; FBC: fungal biomass carbon; BBC: bacterial biomass carbon; MBC: microbial biomass carbon.
3.3 Spatial pattern of microbial carbon fluxes and stocks
Compared with 1901–1910, HR and SR increased across latitudinal gradients in 2007–2016 (Fig. 4a–b). However, the magnitude of the increase differed among latitudinal gradients. Specifically, increases in HR and SR were larger and more prominent at northern latitudes and equatorial regions than at southern latitudes. Similar to C fluxes, microbial C pools increased across latitudinal gradients from 1901–1910 to 2007–2016 (Fig. 4c–f). Overall, FBC and BBC in the top 30 cm and top 1 m showed a small but different extent of increase across latitudinal gradients. Specifically, the increases were more prominent at northern high latitudes and equatorial regions than at other latitudes.
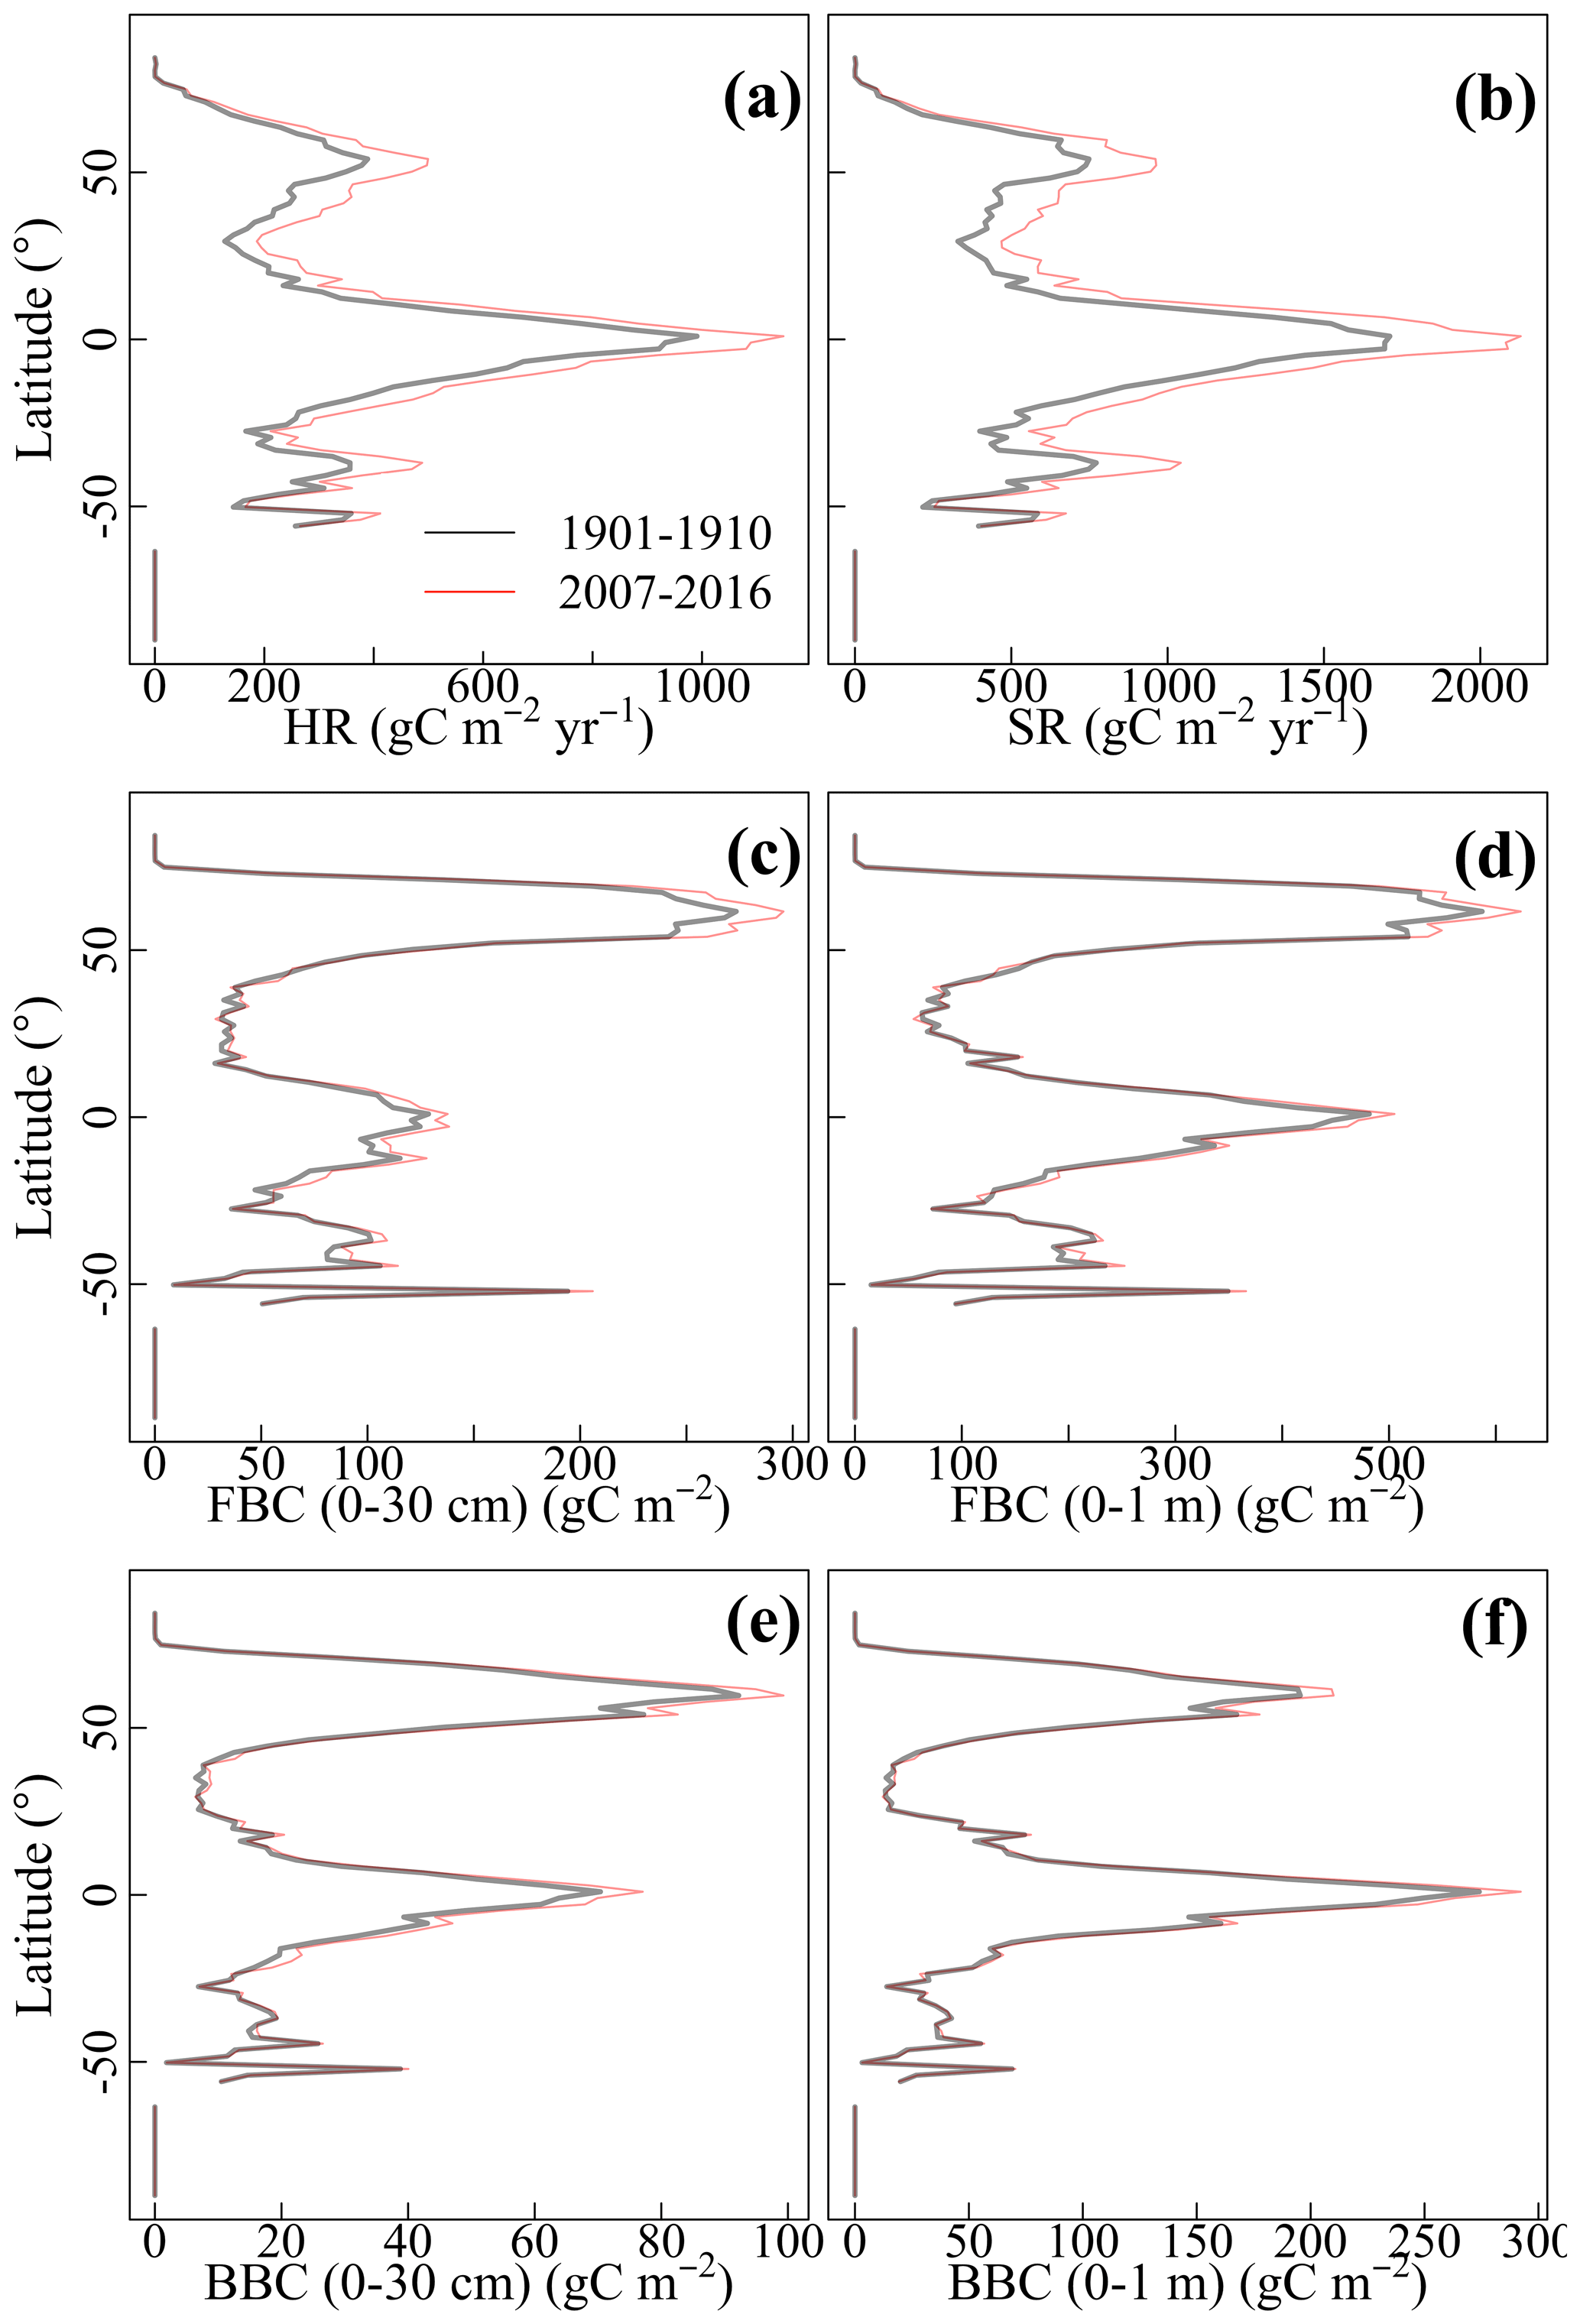
Figure 4Latitudinal gradients of the CLM-Microbe model simulated 10-year averages of (a) HR, (b) SR, and (c) FBC in the top 30 cm, (d) FBC in the top 1 m, (e) BBC in the top 30 cm, and (f) BBC in the top 1 m during 1901–1910 and 2007–2016. HR: heterotrophic respiration; SR: soil respiration; FBC: fungal biomass carbon; BBC: bacterial biomass carbon; MBC: microbial biomass carbon.
Across the globe, HR and SR showed similar spatial patterns, and increases in most grids across the globe were statistically significant (P<0.05; Fig. 5a, b, d, and e). Correspondingly, we observed positive relative change in most areas from 1901–1910 to 2007–2016 (Fig. 5c and f). However, we also observed decreases in HR and SR in the grids of South Asia. The HR and SR displayed similar spatial patterns of changing rates (Fig. 9). At the global scale, FBC and BBC in the top 30 cm and 1 m showed similar spatial patterns and widely increased from 1901–1910 to 2007–2016 (Fig. 6a and b, d and e, g and h, and j and k). Correspondingly, we observed positive relative changes in FBC and BBC in the top 30 cm and 1 m in those regions from 1901–1910 to 2007–2016 (Fig. 6c, f, i, and l).
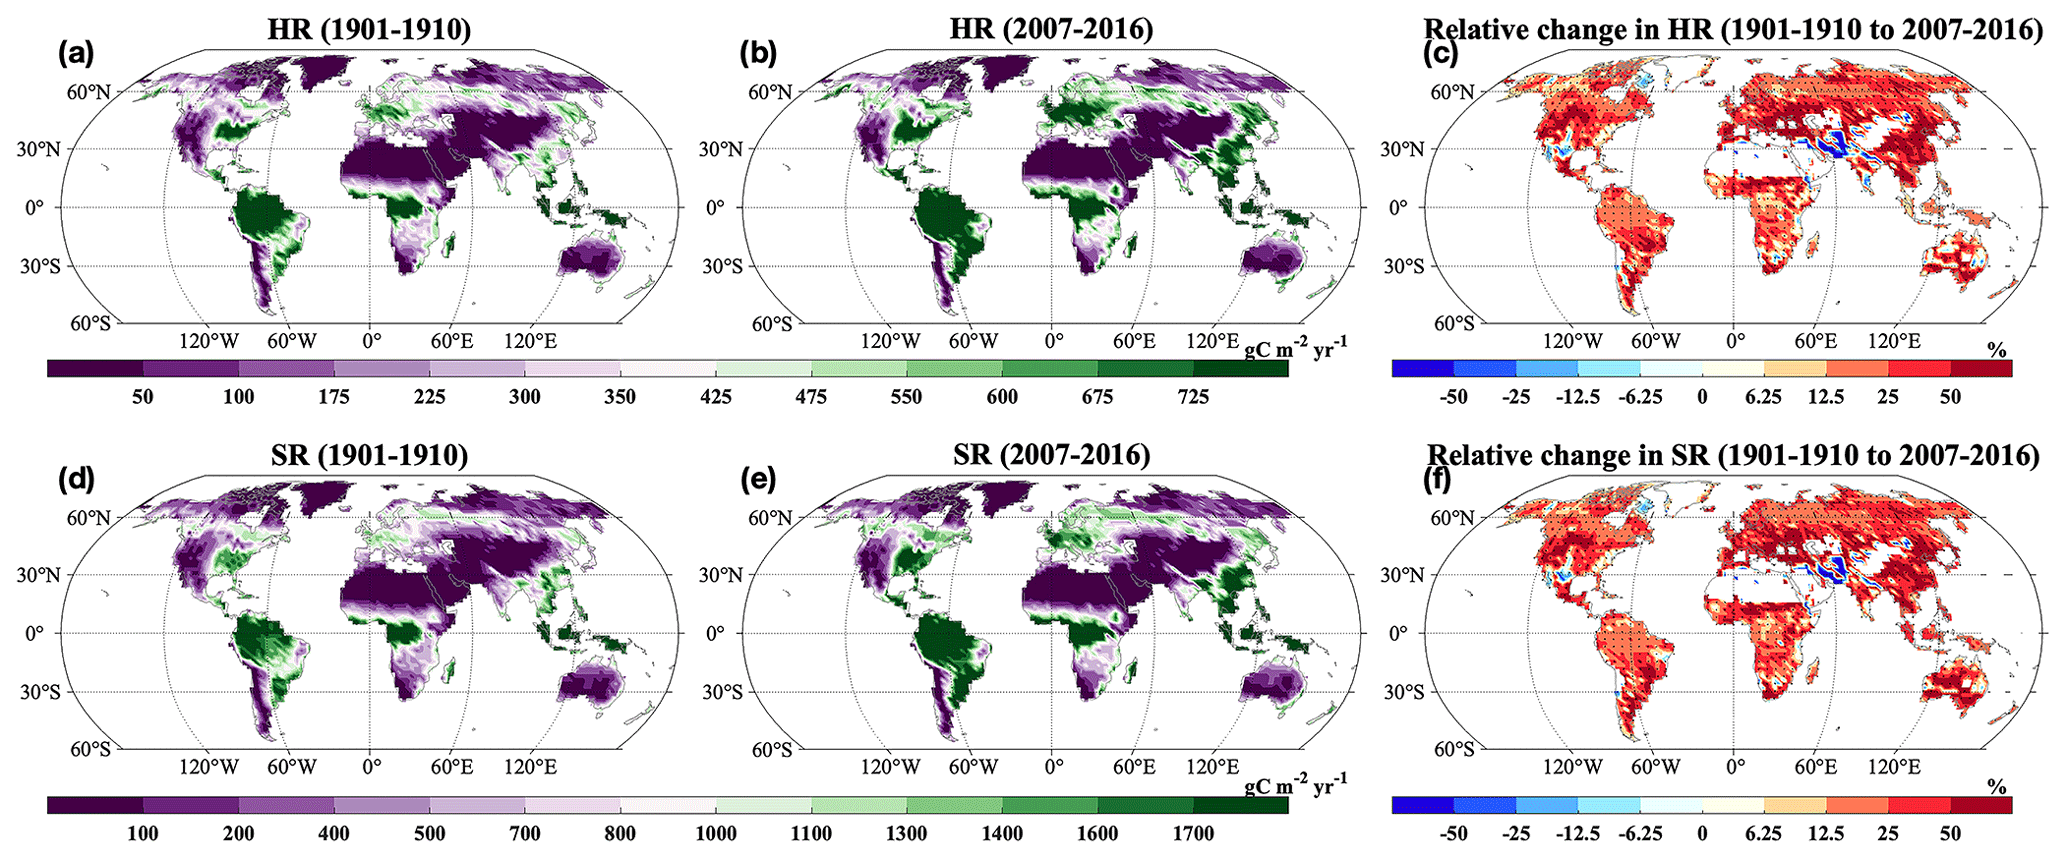
Figure 5Spatial distributions of decadal averages of (a–b) HR and (d–e) SR during (a, d) 1901–1910 and (b, e) 2007–2016 and relative changes in (c) HR and (f) SR by 2007–2016 relative to 1901–1910. HR: heterotrophic respiration; SR: soil respiration. Black dot in each grid indicates significant changes (P<0.05).
Consistent with the spatial patterns of absolute and relative changes, we widely observed significant and positive changing rates of HR and SR from 1901 to 2016 (Fig. 7a–b; P<0.05). However, we also found significant negative changing rates of HR and SR in grids of South Asia (P<0.05). Similarly, increasing temporal trends of FBC and BBC in the top 30 cm and 1 m were widely observed across the globe (Fig. 7c–f). However, we also observed decreases of those variables in South Asia (Figs. 5–7). In addition, we observed decreases of FBC and BBC in the top 30 cm and 1 m in grids of central North America (Figs. 6 and 7c–f).
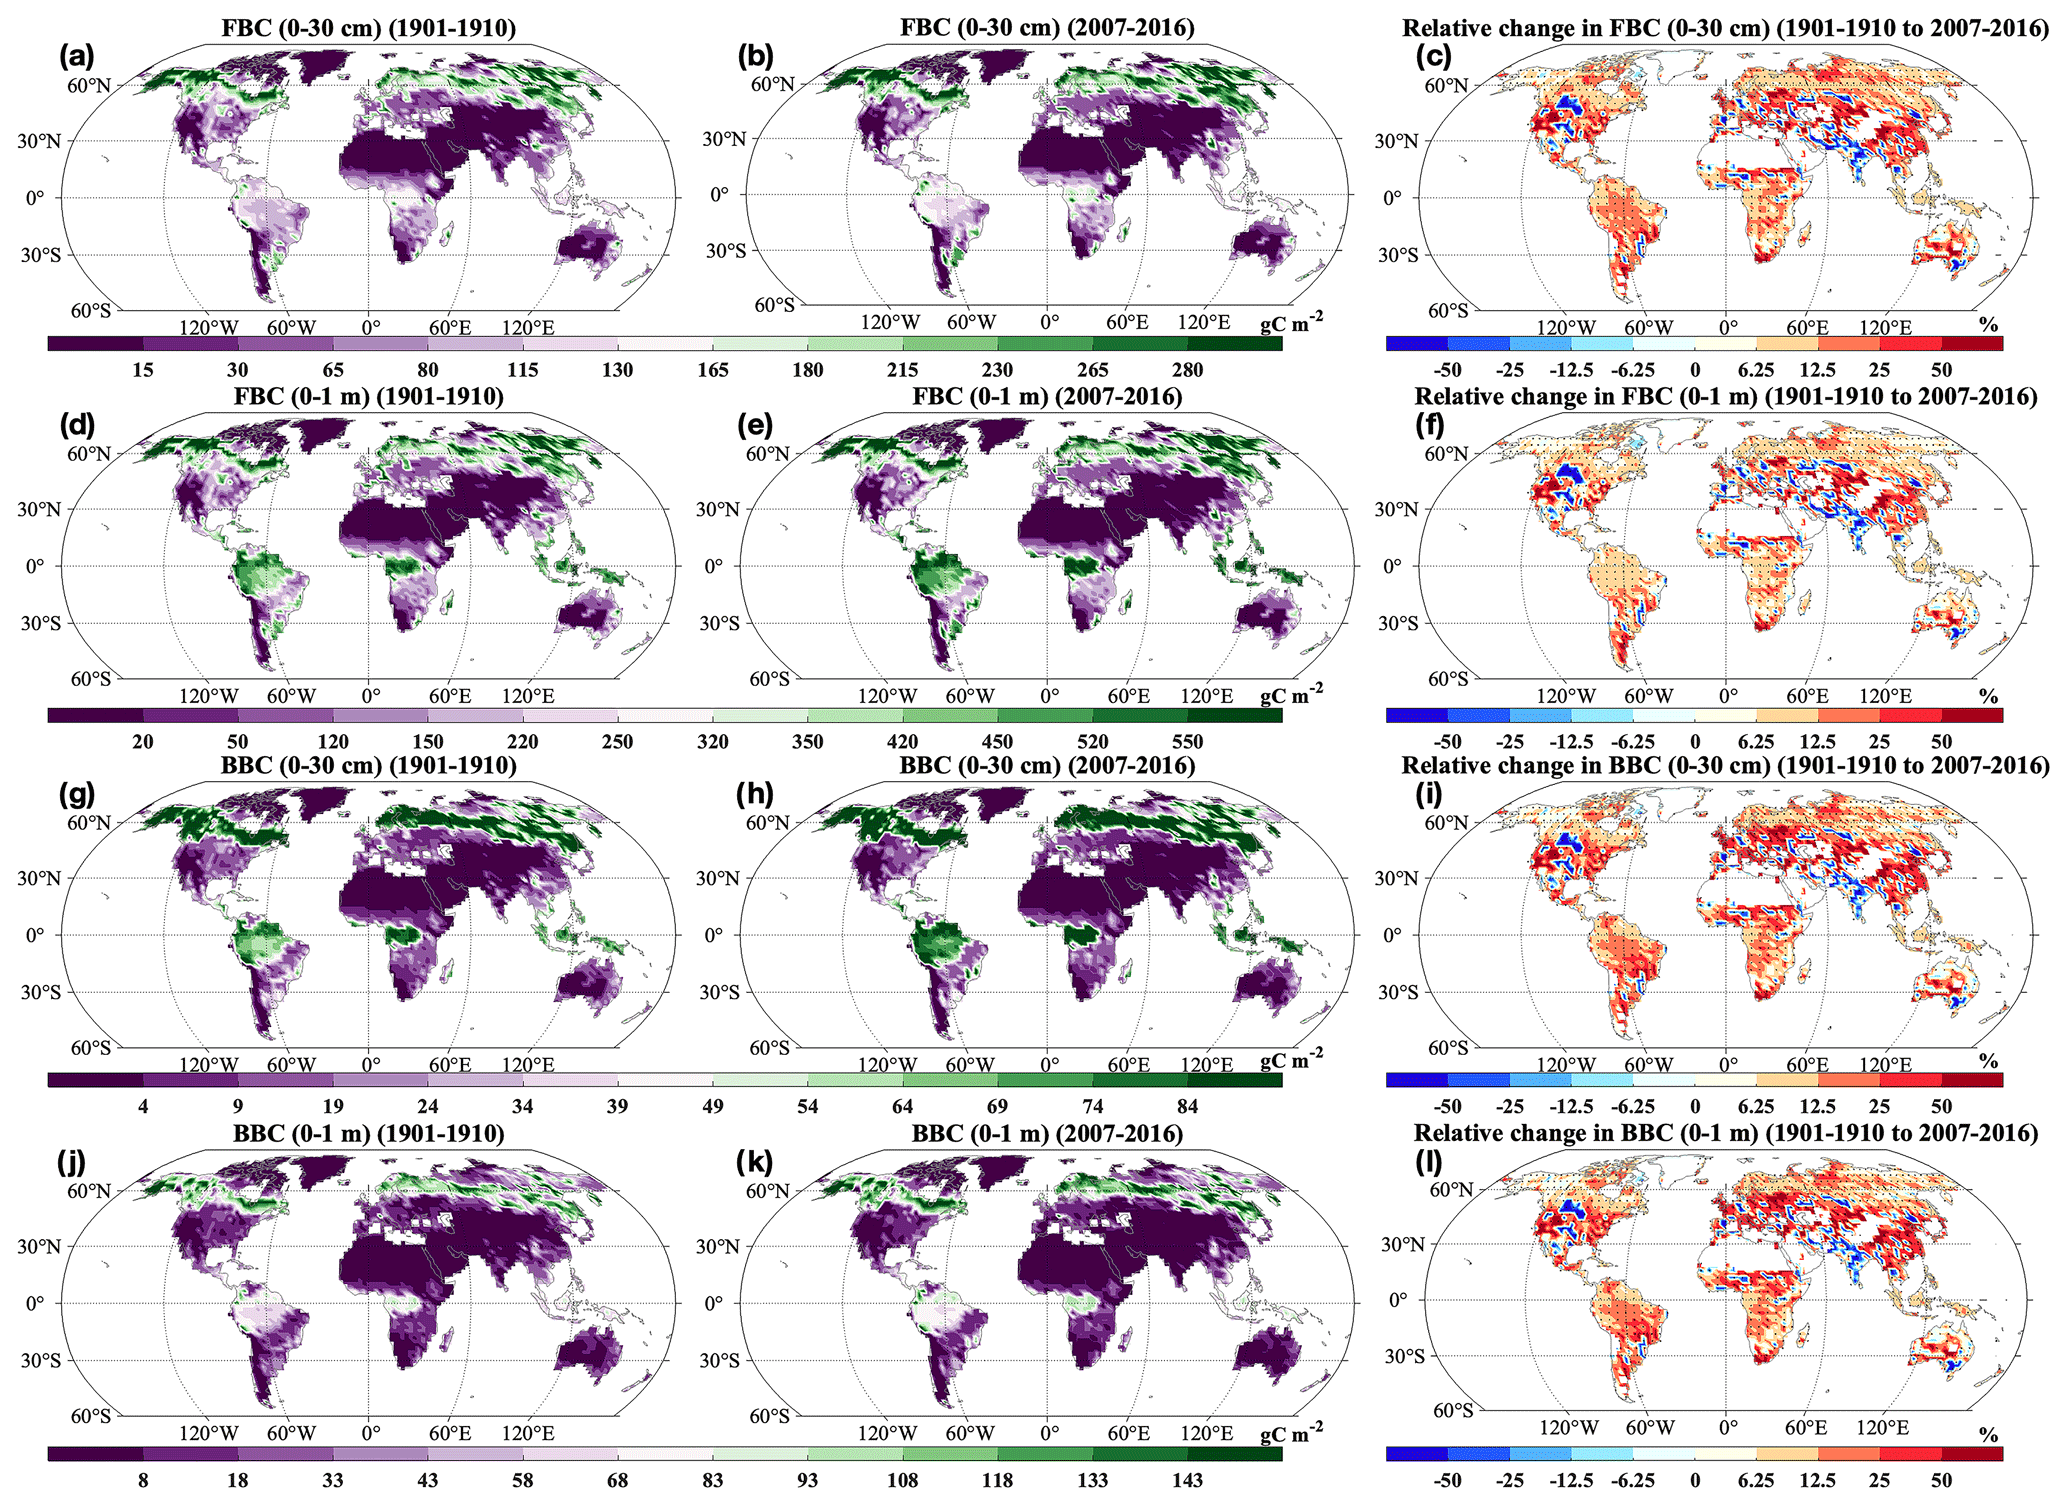
Figure 6Spatial distributions of decadal averages of (a–b) FBC in the top 30 cm, (d–e) FBC in the top 1 m, (g–h) BBC in the top 30 cm, and (j–k) BBC in the top 1 m during (a, d, g, j) 1901–1910 and (b, e, h, k) 2007–2016 and relative changes in (c) FBC in the top 30 cm, (f) FBC in the top 1 m, (i) BBC in the top 30 cm, and (l) BBC in the top 1 m by 2007–2016 relative to 1901–1910. FBC: fungal biomass carbon; BBC: bacterial biomass carbon. Black dot in each grid indicates significant changes (P<0.05).

Figure 7Changing rates of the CLM-Microbe model simulated (a) HR, (b) SR, and (c) FBC in the top 30 cm, (d) FBC in the top 1 m, (e) BBC in the top 30 cm, and (f) BBC in the top 1 m from 1901 to 2016. HR: heterotrophic respiration; SR: soil respiration; FBC: fungal biomass carbon; BBC: bacterial biomass carbon. Black dot in each grid indicates significant regression (P<0.05).
3.4 External environmental controls on C cycling
The area-weighted average of HR, SR, and FBC and BBC in the top 1 m were significantly correlated with that of ST and SM in the top 1 m (P<0.05; Fig. 8). However, the strengths of correlations depended on both environmental controls (ST and SM in the top 1 m) and variables (HR, SR, and FBC and BBC in the top 1 m). For example, correlations of HR and SR with ST and SM in the top 1 m were of the same magnitude, while the FBC and BBC were more strongly correlated with ST than with SM in the top 1 m.
Across the globe, microbial carbon fluxes and stocks were more widely and positively correlated with ST than with SM in the top 1 m (Fig. 9). Correlations of ST (0–1 m) with HR and SR were similar in spatial patterns. We widely observed significant positive correlations of HR and SR with ST (0–1 m) (P<0.05; Fig. 9a and c). On the other hand, negative correlations of HR and SR with ST (0–1 m) were found in South Asia, southeast North America, central North America, central Africa, and central and northern Australia/Oceania. Correlations of FBC and BBC in the top 1 m displayed similar spatial patterns. We found significant and positive correlations of FBC and BBC with ST in the top 1 m in most grids across the globe (P<0.05; Fig. 9b, d, f, and h). However, we also found some grids with negative correlations in central North America, Europe, Asia, South America, Africa, and Australia/Oceania. Correlations of HR, SR, and FBC and BBC in the top 1 m were similar in spatial patterns, with significant and positive correlations widely observed (P<0.05). But we also observed negative correlations at middle and low latitudes in North America, Europe, and Asia, the east coast of South America and Africa, and southern Australia/Oceania.
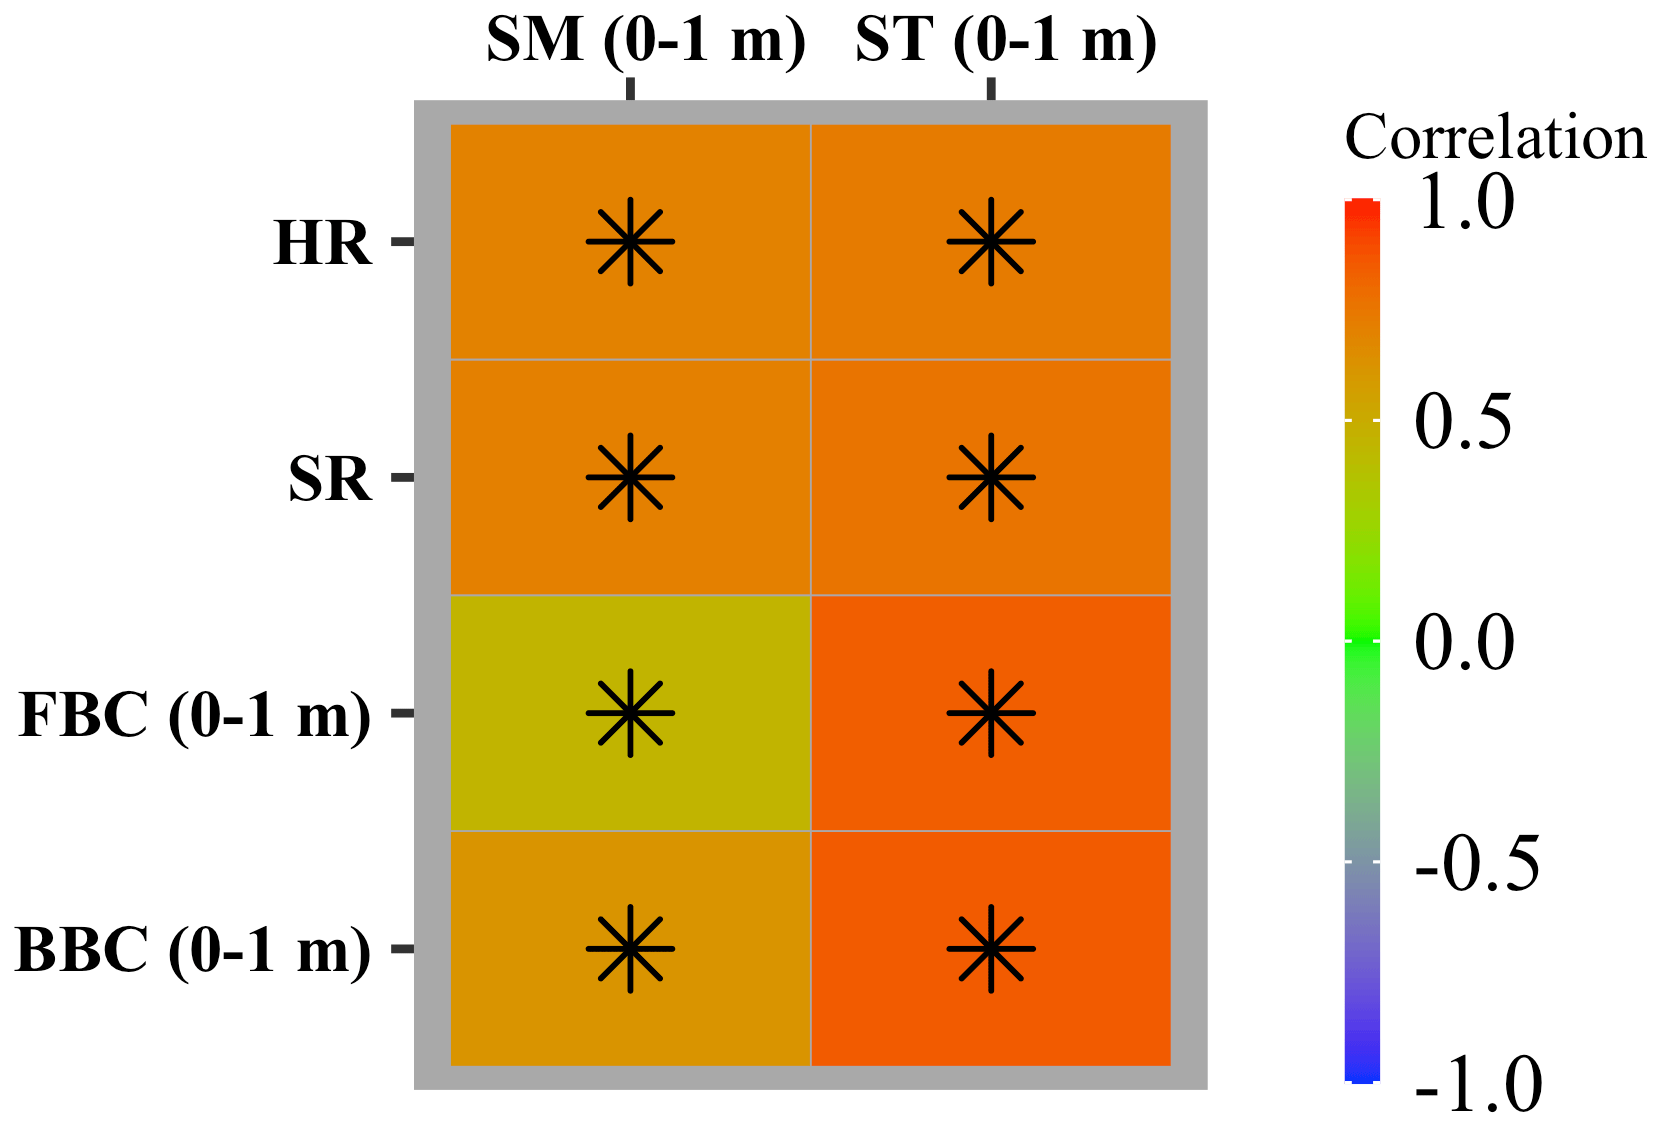
Figure 8Heatmap showing Pearson’s correlation between the CLM-Microbe model simulated microbial carbon fluxes and pools (HR, SR, FBC in the top 1 m, and BBC in the top 1 m) and soil environments (SM and ST in the top 1 m) from 1901 to 2016. GPP: gross primary productivity; NPP: net primary productivity; HR: heterotrophic respiration; SR: soil respiration; DOC: dissolved organic carbon; SOC: soil organic carbon; FBC: fungal biomass carbon; BBC: bacterial biomass carbon; VegC: vegetation carbon; LitC: litter carbon; MAT: mean annual temperature; MAP: mean annual precipitation; ST: soil temperature; SM: soil moisture. Black asterisks indicate significant correlations (P<0.05).
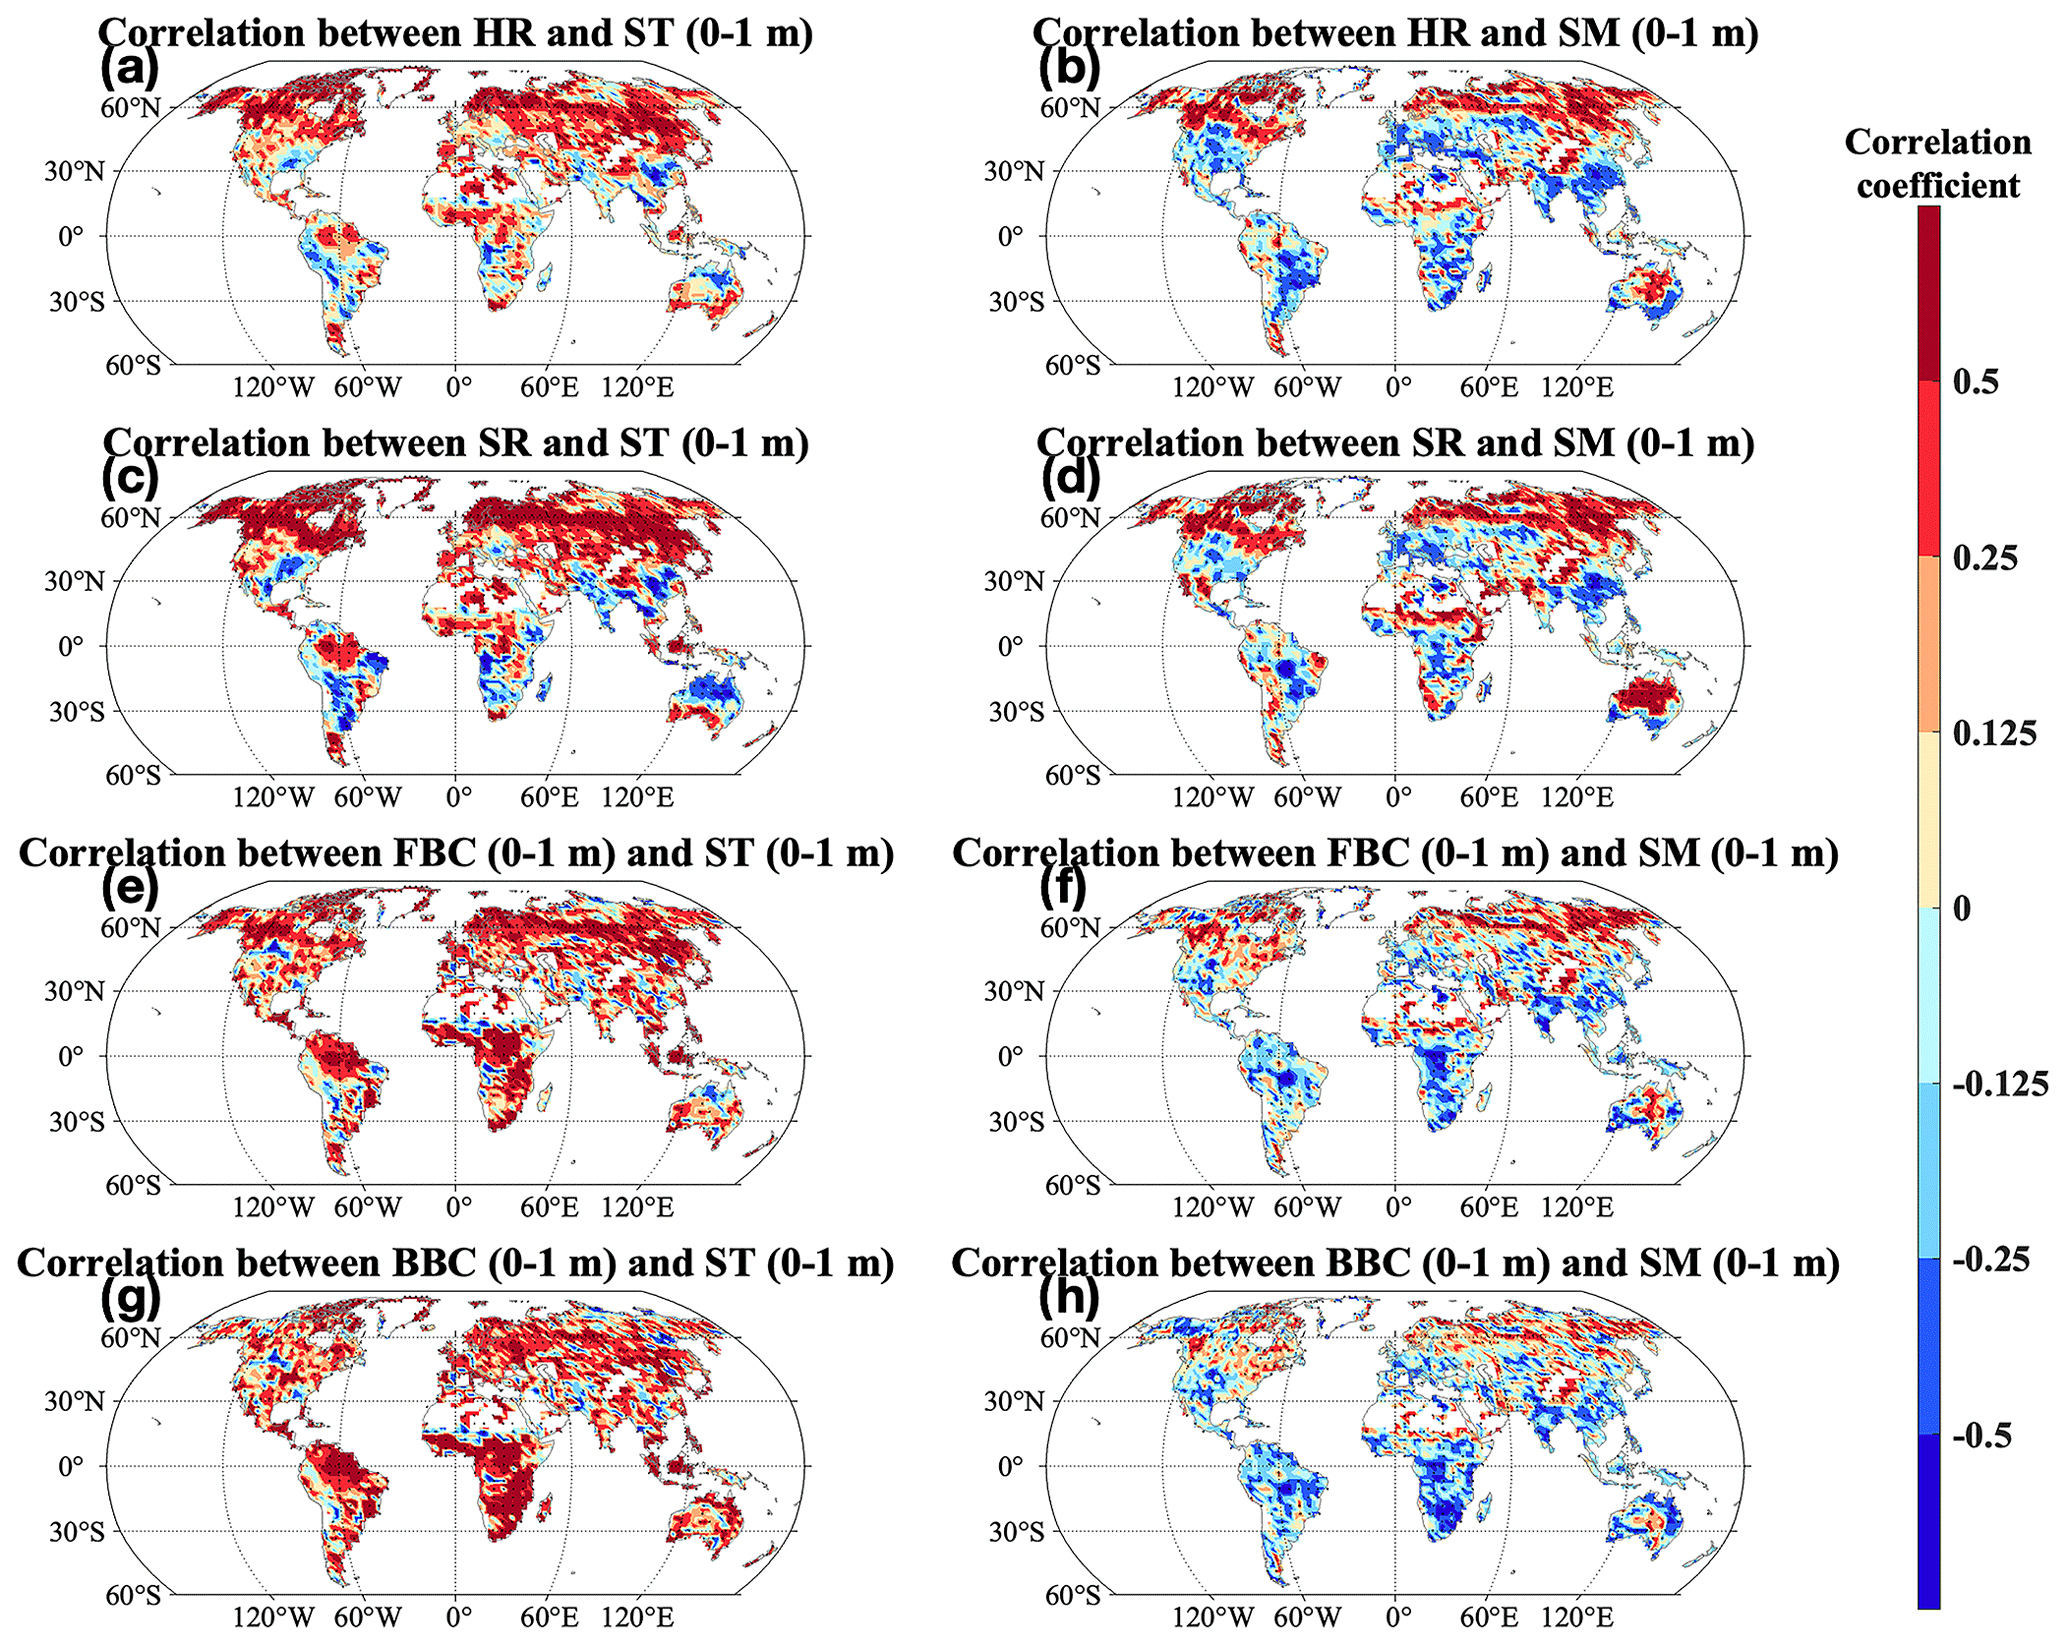
Figure 9Pearson's correlation between the CLM-Microbe model simulated (a–b) HR, (c–d) SR, and (e–f) FBC in the top 1 m, (g–h) BBC in the top 1 m, and (a, c, e, g) ST and (b, d, f, h) SM in the top 1 m from 1901 to 2016. Black dot in each grid indicates significant correlation (P<0.05). HR: heterotrophic respiration; SR: soil respiration; FBC: fungal biomass carbon; BBC: bacterial biomass carbon; ST: soil temperature; SM: soil moisture.
4.1 Comparison with previous studies
The latitudinal trends and grid-level distribution of GPP, NPP, HR, SR, FBC, and BBC in the top 30 cm and FBC, BBC, DOC, and SOC in the top 1 m were well-reproduced in the CLM-Microbe model (Figs. 1 and 2). The CLM-Microbe model performed better than or comparable to the CLM4.5 in simulating the spatial distribution of vegetation, soil, and microbial variables (Figs. 2 and S5). In line with our results, multiple models captured the spatial variation of GPP, NPP, HR, and SR (Delire et al., 2020; Kim et al., 2019; Wiltshire et al., 2021; Zheng et al., 2020). Wieder et al. (2015) reported a high spatial correlation (r=0.46) of SOC (0–1 m) between MIMICS outputs and HWSD. In addition, Wang et al. (2017) observed the high consistency in SOC (0–1 m) (R2=0.96; P<0.01) between the TRIPLEX-MICROBE model and HWSD by vegetation type. Huang et al. (2021) also found good performance of the ORCHIMIC v2.0 in reproducing SOC by comparing the simulated values with multiple SOC datasets. The well-developed plant physiology and environmental controls in the model may explain their good performance in simulating vegetation and soil processes (Flato, 2011; Mathieu and O'Neill, 2008). However, the latitudinal trends and grid-level distribution of DOC, SOC, and MBC (sum of FBC and BBC) in the top 1 m were relatively worse reproduced than those in the top 30 cm (panels e–k of Figs. 1 and 2, panels e–f of Figs. S4 and S5), indicating that the vertical distribution of processes related to decomposition, microbial turnover, and plant C input needs further improvements. Although parameters classifying the active decomposition depth and biological function to perturbation were defined in the CLM-Microbe model, the gradual change of microbial turnover and activity defined along the soil profile may need to be improved in future models (Preusser et al., 2019; Zhu et al., 2021). In addition, processes or parameters related to the active layer for decomposition and perturbation caused by biological (e.g., nematode) and abiotic (e.g., drying and rewetting) activities can cause uncertainties in the vertical distribution of C cycle, which needs further efforts and attention in model development (Ettema and Wardle, 2002; Gabet et al., 2003; Kuzyakov and Blagodatskaya, 2015; Schimel, 2018).
We estimated global annual averages of 129.5, 56.5, 99.8, and 49.8 PgC yr−1 for GPP, NPP, HR, and SR, respectively (Table 1). Consistent with our results, previous studies reported similar values of GPP, NPP, HR, and SR (Cramer et al., 1999; Hashimoto et al., 2015; Huang et al., 2020; Lu et al., 2021; Nemani et al., 2003; Zhao et al., 2017; Zheng et al., 2020). The consistent simulations and reasonable estimations of GPP, NPP, HR, and SR across models may indicate the convergent plant physiology among models and well-defined soil and microbial processes in the CLM-Microbe model. In addition, compared with observed data, the CLM-Microbe model produced more consistent NPP and HR but overestimated GPP and SR (Table 1). The overestimation of GPP and SR may be due to the lower ecosystem-scale CUE in the CLM-Microbe model. The vegetation physiology module in the CLM-Microbe model is adapted from CLM4.5. The ecosystem-scale CUEs between the CLM-Microbe model (0.44) and CLM4.5 (0.43) were comparable but lower than in MODIS (0.5). Correspondingly, we observed a higher contribution of roots to total SR in the CLM-Microbe model (0.5) and the CLM4.5 (0.48) than in the observed SRDB dataset (0.43). Therefore, the well-simulated NPP and HR but higher predicted GPP and SR in the CLM-Microbe model were attributed to the low ecosystem-scale CUE. Increasing ecosystem-scale CUE in the CLM-Microbe model will improve the modeling performance of GPP and SR in model development.
The CLM-Microbe model can reasonably predict FBC, BBC, and DOC in the top 30 cm well globally, indicating the well-represented microbial processes in surface soils (Table 1). However, MBC and DOC in the top 1 m were vastly overestimated, with MBC and DOC in the top 1 m overestimated by 69.5 % and 75.0 %, respectively. Inconsistent with our results, previous studies suggested the underestimation of MBC (0–1 m) in their models. For example, Wang et al. (2017) estimated the global MBC as 21 PgC in the TRIPLEX-MICROBE model. Wieder et al. (2015) suggested the steady-state MBC (0–1 m) of 16.3 Pg in the MIMICS. The relatively poor performance of the CLM-Microbe model in simulating DOC and MBC in the top 1 m and the discrepancy in simulated MBC (0–1 m) among studies may result from three aspects. First, the hydrologically active layer in the CLM-Microbe model may not be sufficient to define soil microbial processes along soil profiles. We observed better performance of the CLM-Microbe model in simulating FBC, BBC, and DOC in the top 30 cm relative to MBC and DOC in the top 1 m, indicating that the representation of microbial and soil processes along soil profiles may need improvements. Second, the difference in calibration for MBC may cause a discrepancy between studies. The SOC in Wieder et al. (2015) was calibrated to observed data but not MBC. Wang et al. (2017) calibrated the MBC (0–1 m) in the TRIPLEX-MICROBE by vegetation types, while we calibrated both MBC and SOC in 0–30 cm and 0–1 m by grid in the CLM-Microbe model. The differences in variables and depths calibrated between studies can partly explain the discrepancy. Third, the difference in simulated vegetation, litter, and soil C pools among studies can result in the discrepancy. Vegetation C as litter and volatile organic compounds, DOC, and SOC are the C source for microbial C assimilation through decomposition (Fig. S1). Consequently, the overestimation of SOC and DOC can partly explain the overestimation of MBC in the top 1 m (Table 1).
The CLM-Microbe model indicated an underestimation of 8.5 % for SOC (0–30 cm) and an overestimation of 32 % for SOC (0–1 m) when comparing with observed data (Table 1). Compared with the CLM4.5, the CLM-Microbe predicted larger stocks of SOC (0–30 cm and 0–1 m). Previous studies suggest large variations in simulated SOC (0–1 m) among models. For example, Todd-Brown et al. (2013) reported the SOC (0–1 m) stock ranging from 510 to 3040 PgC among 11 CMIP5 ESMs. The TRIPLEX-MICROBE modeled the global SOC (0–1 m) stock as 1195 PgC (Wang et al., 2017). Wieder et al. (2015) documented the steady-state SOC pool in the MIMICS as 1530 PgC. Delire et al. (2020) reported the SOC (0-1 m) as 1611 and 1520 PgC in the new (ISBA_bgc6) and old (ISBA_bgc5) versions, respectively, of ISBA-CTRIP. Given the wide range (510 to 3040 PgC) of simulated SOC (0–1 m) in models, the CLM-Microbe model thus predicted reasonable SOC stocks.
4.2 Temporal trends of carbon fluxes and stocks of soil microbes
The area-weighted average of HR and SR in the CLM-Microbe model increased by 12 and 25 PgC yr−1, respectively, from 1901 to 2016 (Fig. 3). Consistent with our findings, Bonan et al. (2019) observed the increase of about 8 PgC yr−1 of HR from 1850 to 2014 in the CLM4.5. The global increasing rate of SR was estimated as 0.04–0.14 PgC yr−1 by Huang et al. (2020). The rising ST (0–1 m) may explain the observed increase in HR considering the positive relationship between ST (0–1 m) and HR (Figs. 8 and S6c). The increase in HR can partly explain the rising SR from 1901 to 2016 given its critical contribution to SR. In addition to HR, the increase in root respiration due to increasing C availability and rising temperature accounted for a crucial proportion of the SR increase (Bond-Lamberty and Thomson, 2010; Hashimoto et al., 2015; Piñeiro et al., 2017; Zhou et al., 2016). We observed increases of GPP and NPP associated with environmental changes such as increasing N deposition and rising CO2 concentration and temperature (Dusenge et al., 2019; Piñeiro et al., 2017). Evidenced by increasing VegC and LitC, indicating the C stock of vegetation biomass and C loss of vegetation biomass, respectively, C input from plants increased during the historical period at the global scale (Fig. S8e–f). Therefore, increases in vegetation C sequestration, together with rising ST and SM in the top 1 m, enhanced HR and SR in the last century.
The area-weighted FBC and BBC in 0–30 cm increased by 1.0 and 0.4 PgC and those in 0–1 m increased by 1.2 and 0.7 PgC, respectively, from 1901 to 2016 in the CLM-Microbe model (Fig. 3c–f). Soil microbes are sensitive to environmental change, and rising temperature was reported to induce lower microbial biomass due to the negative impacts of temperature on microbial biomass maintenance through facilitating microbial turnover (Joergensen et al., 1990; He and Xu, 2021). We observed an increasing trend of ST (0–1 m) from 1901 to 2016 (Fig. S6c), indicating negative impacts of temperature on FBC and BBC in 0–30 cm and 0–1 m. In addition to temperature, microbial biomass is influenced by substrate and water availability, with significant and positive effects of SOC and MAP recorded on microbial biomass (Chen et al., 2022). Litter, SOM, and DOC are three C sources for soil microbes in the CLM-Microbe model (“Materials and methods”; Fig. S1). We observed increases of DOC (2.4 PgC), LitC (4 PgC), and SOC (34 PgC) in the top 1 m from 1901 to 2016, indicating more C available for soil fungi and bacteria during the historical period (Fig. S8c, d, and f). In addition, MAP and SM (0–1 m) increased from 1901 to 2016 (Fig. S6b and d). Therefore, the increasing substrates (DOC, LitC, and SOC) and soil water availability can explain the increase in FBC and BBC in the CLM-Microbe model.
The annual averages of microbial C fluxes (HR and SR) and pools (FBC and BBC in the top 30 cm and 1 m) have exhibited more rapid increases since 1980 (Fig. 3). Concurrently, we observed a more rapid increase in MAT, MAP, and ST and SM in the top 1 m since 1980 (Fig. S6). In line with this study, Cheng et al. (2017) analyzed SM simulations during historical (1920–2005) and future (2006–2080) periods in the CESM from CIMP5; they also found 1980 as a transition for a subsequent increase of variation during 1920–2005, indicating more rapid changes in SM after 1980. We observed significant correlations of HR, SR, FBC (0–1 m), and BBC (0–1 m) with ST and SM in the top 1 m (Fig. 8). Therefore, more rapid increases in MAT, MAP, and ST and SM in the top 1 m after 1980 may explain the more rapid increases of such variables since 1980.
4.3 Changes in microbial carbon fluxes and stocks over the space and their controls
The HR and SR showed an increase across latitudinal gradients and the globe in the study period (Figs. 4a and b and 5). Consistent with our findings, Huang et al. (2020) observed a globally significant increase in SR, particularly in boreal and tropical regions (e.g., northern Asia, central South America, and central and southern Africa), from 2000–2014. Bond-Lamberty et al. (2018) also observed an increase in HR in multiple biomes during 2000–2015. In addition, we observed similar spatial patterns of increases (e.g., higher increases at northern high latitudes and in equatorial regions) in HR and SR with those of GPP and NPP (Fig. S10). These results indicated that soil C fluxes largely depended on vegetation productivity, which can enhance soil C fluxes due to high C allocation to belowground (Pendall et al., 2004; Prescott et al., 2020). In addition, soil C fluxes can be further increased due to facilitated decomposition in a warming world (Noh et al., 2017; Zhou et al., 2007). Temperature and water availability have a profound influence on root respiration and HR (Bond-Lamberty and Thomson, 2010; Hashimoto et al., 2015; Sinsabaugh et al., 2016). We also found significant correlations of HR and SR with ST and SM in the top 1 m (Fig. 9). The increases in HR and SR can be explained by the increases in SM and ST in the top 1 m, considering their significant correlations (Fig. S6c and d). However, we also observed decreases in HR and SR in South Asia (Fig. 5). Vegetation C fixation is the major C source for ecosystems; the decreases of GPP and NPP in such regions can largely explain the decrease in HR and SR (Fig. S10).
The FBC and BBC in the top 30 cm and 1 m increased across latitudes during 2007–2016 compared with 1901–1910 (Fig. S4c–f). In addition, the FBC and BBC in the top 30 cm and 1 m widely increased across the globe (Figs. 6 and 7c–f). Vegetation is the major C source for soil microbes in terrestrial ecosystems, determining the total amount of C available for microbes by regulating microbial C assimilation through SOC, DOC, and litter (Schimel, 1995; Vance and Chapin, 2001; Xu et al., 2014). The spatial patterns of GPP and NPP change could explain the wide increases of FBC and BBC in the top 30 cm and 1 m in such areas, as well as their larger increases at high latitudes and in equatorial regions (Figs. S10 and S12a–b). However, we also found slight decreases of FBC and BBC in the top 1 m in regions such as southern Australia/Oceania (Figs. 6 and S7c–f). As a critical C source for soil microbes in the CLM-Microbe model, the decrease in DOC (0–1 m) may explain the widespread decrease in FBC and BBC of 30 cm and 1 m in southern Australia/Oceania (Figs. S1, S11a–c, and S12c). Meanwhile, in the top 1 m, FBC and BBC were negatively correlated with ST and positively correlated to SM in southern Australia/Oceania (Fig. 9e–h). The increase in ST and SM in the top 1 m can explain the decrease in FBC and BBC in 0–30 cm and 0–1 m in southern Australia/Oceania (Fig. S7c and d). In addition, we found decreases of FBC and BBC in the top 30 cm and 1 m in South Asia and central North America (Figs. 6 and 7c–f). Since vegetation productivity is the primary C source for terrestrial ecosystems, decreases in vegetation C input as GPP and NPP can explain their decreases in South Asia (Figs. S10 and S12a and b). In addition, microbial activities are affected by soil temperature and water availability. We observed negative correlations of FBC and BBC in the top 1 m with SM (0–1 m) in South Asia and with ST (0–1 m) in central North America. Increases of SM (0–1 m) and ST (0–1 m) in corresponding regions from 1901–1910 to 2007–2016 may contribute to decreases in FBC and BBC in the top 30 cm and 1 m in such areas (Figs. 9e–h and S7c and d).
Correlations of microbial C fluxes (HR and SR) with SM and ST in the top 1 m varied across space (Fig. 9a–d). Specifically, the association between respiration fluxes, HR and SR, and soil climatic factors (ST and SM) in the top 1 m were positive in the majority of land area (P<0.05; Fig. 9a–d) but were negative in central North America and South America, South Asia, central Africa, and central and northern Australia/Oceania. Studies found positive effects of rising temperature and increasing water availability on microbial activities (Nyberg and Hovenden, 2020; Tecon and Or, 2017); therefore, the widely increases of ST and SM in the top 1 m can explain the increases of HR at the global scale (Fig. S7c and d). In addition to soil moisture and temperature, HR is positively related to substrates and microbial biomass (Wei et al., 2015). Therefore, the reduction in HR in South Asia can be explained by decreases in DOC, LitC, SOC, FBC, and BBC in the top 1 m, while decreasing SM (0–1 m) and ST (0–1 m) may contribute to the reduced HR in central Africa and central and northern Australia/Oceania, respectively (Figs. 6, 7c–f, S11–12, and S7c–d). Since HR contributed over 50 % to SR, factors determining correlations of HR with SM and ST in the top 1 m were expected to be responsible for those of SR across space. In addition, the reduction in root respiration would enhance the negative correlations of HR with SM and ST in top 1 m in South Asia considering its decreasing vegetation productivity (Figs. S10 and S12a–b). Water availability impacts on microbial activities are affected by other factors such as temperature and substrate availability (Moyano et al., 2013; Tecon and Or, 2017). We observed decreasing SM (0–1 m) at middle and low latitudes in North America, Europe, and Asia, the east coast of South America and Africa, and southern Australia/Oceania (Fig. S7d). However, HR and SR and FBC and BBC in the top 1 m widely increased due to the positive effects of temperature and substrate availability (Figs. 5–7). Therefore, negative correlations of HR, SR, and FBC and BBC with SM in the top 1 m at middle and low latitudes in North America, Europe, Asia, the east coast of South America and Africa, and southern Australia/Oceania resulted from the facilitating effects of temperature and substrate availability on HR, SR, and FBC and BBC in the top 1 m even with decreasing SM (0–1 m).
Microbial C pools showed varied correlations with SM and ST in the top 1 m across space (Fig. 9). Specifically, FBC and BBC mostly showed significant positive correlations with ST and SM in the top 1 m (P<0.05; Fig. 9e–h). But we also observed negative correlations of FBC and BBC in the top 1 m with ST (0–1 m) in central North America and South America and with SM (0–1 m) at middle and low latitudes in North America, Europe, Asia, the east coast of South America and Africa, and southern Australia/Oceania. Temperature negatively impacts microbial biomass due to enhanced microbial turnover with rising temperature, but such a relationship depends on environmental conditions (Joergensen et al., 1990; He and Xu, 2021; Yuste et al., 2007). Water availability enhances microbial biomass. The positive correlations of FBC and BBC with SM in the top 1 m at middle and high latitudes in Asia, Europe, and North America contributed to positive correlations of FBC and BBC with ST in the top 1 m in such regions. In addition, substrate availability is critical for soil microbes. Increases in DOC, SOC, and LitC in the top 1 m can explain the widely found positive correlations of FBC and BBC with ST (0–1 m) across space (Figs. S11–12). Water can affect soil microbes in distinct ways, affected by other factors such as temperature and substrate availability (Moyano et al., 2013; Tecon and Or, 2017). We observed decreasing SM (0–1 m) at middle and low latitudes in North America, Europe, Asia, the east coast of South America and Africa, and southern Australia/Oceania (Fig. S7d). However, FBC and BBC in the top 1 m widely increased due to the positive effects of temperature and substrate availability (Figs. 6 and 7c–f). Therefore, negative correlations of FBC and BBC with SM in the top 1 m at middle and low latitudes in North America, Europe, Asia, the east coast of South America and Africa, and southern Australia/Oceania resulted from the facilitating effects of temperature and substrate availability on FBC and BBC in the top 1 m despite decreasing water availability.
4.4 Future improvements
Although the CLM-Microbe model can well reproduce the global distribution of C in vegetation, soil, and microbes, four key improvements are identified for future work. First, soil and microbial processes along soil profiles need to be better defined. Soil and microbial variables such as DOC, SOC, FBC, and BBC in 0–30 cm were better simulated than those in 0–1 m (Table 1; Figs. 1–2), indicating that soil and microbial processes in the deeper soil profile are not adequately modeled. Therefore, better defining soil and microbial processes with depth can help improve the model efficacy in capturing soil and microbial processes and further reduce uncertainties in future projections of the C cycle. Second, land-use change needs to be considered in future work. In addition to changes in environmental factors, land-use change also has profound influences on the plant, soil, and microbial processes. Drastic changes in vegetation, soil, and microbial processes due to land-use change can occur at small scales, and the spatial pattern of those processes can also be changed (Pascual et al., 1997; Sampaio et al., 2007; Stevenson et al., 2016). Therefore, considering the impacts of land-use change in the CLM-Microbe model can help improve the model efficiency in capturing spatial patterns of C density and stocks in terrestrial ecosystems. The global biogeographic patterns of soil microbes and their functions have been recognized (Xu et al., 2020). This modeling study has made progress toward a full investigation of microbial patterns and mechanisms, and a community-wide microbial data system is needed to facilitate more data–model integration to improve microbial models. Lastly, factorial analysis to attribute the variations in terrestrial C fluxes will be addressed in our future work. Variations in terrestrial C fluxes and pools are driven by multiple environmental change factors that contribute individually or in combination. Attributing the variations in terrestrial C fluxes and pools to environmental change factors is important for the understanding of terrestrial C flux and pool dynamics (Xu et al., 2010).
The ESMs incorporating microbial processes are expected to represent uncertainties in the terrestrial C cycle more comprehensively. The CLM-Microbe model can reproduce the distribution of vegetation (GPP, NPP, and VegC), soil (HR, SR, DOC, and SOC), and microbial (FBC, BBC, and MBC) variables. In addition, microbial fluxes (HR and SR) and pools (FBC and BBC in top 30 cm and 1 m) increased from 1901 to 2016. We observed increases of such variables in most of the land but slight decreases of FBC and BBC in the top 1 m in Australia/Oceania. The increases in HR, SR, and fungal and bacterial biomass C were closely associated with increasing vegetation C input and SM and ST in the top 1 m.
This study represents one of the first attempts to simulate the spatial and temporal variations in C fluxes and pool sizes of soil microbes during the last century using a microbial-explicit model – the CLM-Microbe model. As the community is moving towards a microbial-explicit Earth system model, this study provides robust support for microbial model development and application for predicting microbial roles in the C–climate feedback. The variations in soil microbial community over historical periods and across space simulated by the CLM-Microbe model provide a crucial foundation to study the impacts of soil microbes on terrestrial biogeochemical processes.
The sources of observational data for model validation have been clearly cited in the main text. The CLM-Microbe used in this study is available in the GitHub repository: https://github.com/email-clm/clm-microbe, last access: 1 May 2021. The model version used in this study has been archived (Xu et al., 2022). The model outputs have been archived at Dryad: https://doi.org/10.5061/dryad.612jm6471 (He and Xu, 2024). The CRUNCEP dataset version 7 is available at https://rda.ucar.edu/datasets/ds314.3/ (Viovy, 2018). The GPP, NPP, HR, SR, and SOC in the top 30 cm and 1 m were from CLM land-only release, which can be found at https://www.earthsystemgrid.org/dataset/ucar.cgd.ccsm4.CLM_LAND_ONLY.html (Oleson et al., 2019). Any other request can be directed to the corresponding author.
The supplement related to this article is available online at: https://doi.org/10.5194/bg-21-2313-2024-supplement.
LH carried out model simulation, analyzed the model output, drafted the manuscript, and finalized reviewing and editing with contributions from other authors. JLMR, MAM, CTL, and DAL contributed to the experimental design and editing of the final version of the manuscript. XX developed the early version of the model, acquired funding, and contributed to model simulation design, result interpretation, and editing the manuscript.
The contact author has declared that none of the authors has any competing interests.
Publisher’s note: Copernicus Publications remains neutral with regard to jurisdictional claims made in the text, published maps, institutional affiliations, or any other geographical representation in this paper. While Copernicus Publications makes every effort to include appropriate place names, the final responsibility lies with the authors.
This study has been supported by an NSF CAREER project (2145130), an NSF RAPID award (2154746), and the CSU Program for Education and Research in Biotechnology. Support for this work for Melanie A. Mayes was provided by an Early Career Award through the U.S. Department of Energy (DOE) Biological and Environmental Research Program. Oak Ridge National Laboratory is managed by UT-Battelle, LLC, under contract DE-AC05-00OR22725 with the U.S. DOE.
This article has been authored by UT-Battelle, LLC, under contract no. DE-AC05-00OR22725 with the US Department of Energy (DOE). The US government retains and the publisher, by accepting the article for publication, acknowledges that the US government retains a nonexclusive, paid-up, irrevocable, worldwide license to publish or reproduce the published form of this manuscript or allow others to do so, for US government purposes. DOE will provide public access to these results of federally sponsored research in accordance with the DOE Public Access Plan (https://www.energy.gov/doe-public-access-plan, last access: 9 March 2022).
This research has been supported by the Directorate for Biological Sciences (grant nos. 2145130 and 2154746) and the Biological and Environmental Research (grant no. DE-AC05-00OR22725).
This paper was edited by Anja Rammig and reviewed by three anonymous referees.
Bailey, V. L., Smith, J. L., and Bolton, H.: Fungal-to-bacterial ratios in soils investigated for enhanced C sequestration, Soil Biol. Biochem., 34, 997–1007, https://doi.org/10.1016/S0038-0717(02)00033-0, 2002.
Boer, W. d., Folman, L. B., Summerbell, R. C., and Boddy, L.: Living in a fungal world: impact of fungi on soil bacterial niche development, FEMS Microbiol. Rev., 29, 795–811, https://doi.org/10.1016/j.femsre.2004.11.005, 2005.
Bonan, G. B., Lombardozzi, D. L., Wieder, W. R., Oleson, K. W., Lawrence, D. M., Hoffman, F. M., and Collier, N.: Model structure and climate data uncertainty in historical simulations of the terrestrial carbon cycle (1850–2014), Global Biogeochem. Cy., 33, 1310–1326, 2019.
Bond-Lamberty, B. and Thomson, A.: Temperature-associated increases in the global soil respiration record, Nature, 464, 579–582, 2010.
Bond-Lamberty, B., Bailey, V. L., Chen, M., Gough, C. M., and Vargas, R.: Globally rising soil heterotrophic respiration over recent decades, Nature, 560, 80–83, https://doi.org/10.1038/s41586-018-0358-x, 2018.
Chen, Q., Yang, F., and Cheng, X.: Effects of land use change type on soil microbial attributes and their controls: Data synthesis, Ecol. Indic., 138, 108852, https://doi.org/10.1016/j.ecolind.2022.108852, 2022.
Cheng, S., Huang, J., Ji, F., and Lin, L.: Uncertainties of soil moisture in historical simulations and future projections, J. Geophys. Res.-Atmos., 122, 2239–2253, 2017.
Cramer, W., Kicklighter, D. W., Bondeau, A., Iii, B. M., Churkina, G., Nemry, B., Ruimy, A., Schloss, A. L., and Intercomparison, T. P. O. F. T. P. N. M.: Comparing global models of terrestrial net primary productivity (NPP): overview and key results, Glob. Change Biol., 5, 1–15, https://doi.org/10.1046/j.1365-2486.1999.00009.x, 1999.
Delire, C., Séférian, R., Decharme, B., Alkama, R., Calvet, J.-C., Carrer, D., Gibelin, A.-L., Joetzjer, E., Morel, X., and Rocher, M.: The global land carbon cycle simulated with ISBA-CTRIP: Improvements over the last decade, J. Adv. Model. Earth Syst., 12, e2019MS001886, https://doi.org/10.1029/2019MS001886, 2020.
Demoling, F., Nilsson, L. O., and Bååth, E.: Bacterial and fungal response to nitrogen fertilization in three coniferous forest soils, Soil Biol. Biochem., 40, 370–379, 2008.
Devêvre, O. C. and Horwáth, W. R.: Decomposition of rice straw and microbial carbon use efficiency under different soil temperatures and moistures, Soil Biol. Biochem., 32, 1773–1785, 2000.
Dirmeyer, P. A., Gao, X., Zhao, M., Guo, Z., Oki, T., and Hanasaki, N.: GSWP-2: Multimodel Analysis and Implications for Our Perception of the Land Surface, Bull. Am. Meteorol. Soc., 87, 1381–1398, https://doi.org/10.1175/BAMS-87-10-1381, 2006.
Dusenge, M. E., Duarte, A. G., and Way, D. A.: Plant carbon metabolism and climate change: elevated CO2 and temperature impacts on photosynthesis, photorespiration and respiration, New Phytol., 221, 32–49, 2019.
Ettema, C. H. and Wardle, D. A.: Spatial soil ecology, Trends Ecol. Evol., 17, 177–183, https://doi.org/10.1016/S0169-5347(02)02496-5, 2002.
FAO: Global Soil Organic Carbon Map (GSOCmap): Technical Report, FAO, Rome, Italy, 167 pp., https://doi.org/10.4060/ca7597en, 2018.
Flato, G. M.: Earth system models: an overview, Wiley Interdiscip, Rev. Clim. Change, 2, 783–800, 2011.
Gabet, E. J., Reichman, O. J., and Seabloom, E. W.: The effects of bioturbation on soil processes and sediment transport, Annu. Rev. Earth Planet. Sci., 31, 249–273, 2003.
Gomez-Casanovas, N., Matamala, R., Cook, D. R., and Gonzalez-Meler, M. A.: Net ecosystem exchange modifies the relationship between the autotrophic and heterotrophic components of soil respiration with abiotic factors in prairie grasslands, Glob. Change Biol., 18, 2532–2545, 2012.
Guo, Z., Wang, Y., Wan, Z., Zuo, Y., He, L., Li, D., Yuan, F., Wang, N., Liu, J., and Song, Y.: Soil dissolved organic carbon in terrestrial ecosystems: Global budget, spatial distribution and controls, Glob. Ecol. Biogeogr., 29, 2159–2175, https://doi.org/10.1111/geb.13186, 2020.
Hashimoto, S., Carvalhais, N., Ito, A., Migliavacca, M., Nishina, K., and Reichstein, M.: Global spatiotemporal distribution of soil respiration modeled using a global database, Biogeosciences, 12, 4121–4132, https://doi.org/10.5194/bg-12-4121-2015, 2015.
He, L. and Xu, X.: Mapping soil microbial residence time at the global scale, Glob. Change Biol., 27, 6484–6497, https://doi.org/10.1111/gcb.15864, 2021.
He, L., Rodrigues, J. L. M., Soudzilovskaia, N. A., Barceló, M., Olsson, P. a. A., Song, C., Tedersoo, L., Yuan, F., Yuan, F., Lipson, D. A., and Xu, X.: Global biogeography of fungal and bacterial biomass carbon in topsoil, Soil Biol. Biochem., 151, 108024, https://doi.org/10.1016/j.soilbio.2020.108024, 2020.
He, L., Lai, C.-T., Mayes, M. A., Murayama, S., and Xu, X.: Microbial seasonality promotes soil respiratory carbon emission in natural ecosystems: a modeling study, Glob. Change Biol., 27, 3035–3051, https://doi.org/10.1111/gcb.15627, 2021a.
He, L., Lipson, D. A., Rodrigues, J. L. M., Mayes, M., Björk, R. G., Glaser, B., Thornton, P., and Xu, X.: Dynamics of Fungal and Bacterial Biomass Carbon in Natural Ecosystems: Site-level Applications of the CLM-Microbe Model, J. Adv. Model. Earth Syst., 13, e2020MS002283, https://doi.org/10.1029/2020MS002283, 2021b.
He, L., Viovy, N., and Xu, X.: Macroecology Differentiation Between Bacteria and Fungi in Topsoil Across the United States, Global Biogeochem. Cy., 37, e2023GB007706, https://doi.org/10.1029/2023GB007706, 2023.
He, L. and Xu, X.: Terrestrial carbon cycle during 1901–2016 as simulated by the CLM-Microbe model, [data set], https://datadryad.org/stash/share/8lCFkeT5UCvyJ1xAN4sM8XISIUCviK71L0b49Qlk7bA (last access: 15 November 2022), 2024.
Hršelová, H., Chvátalová, I., Vosátka, M., Klír, J., and Gryndler, M.: Correlation of abundance of arbuscular mycorrhizal fungi, bacteria and saprophytic microfungi with soil carbon, nitrogen and phsophorus, Folia Microbiol., 44, 683–687, 1999.
Huang, N., Wang, L., Song, X.-P., Black, T. A., Jassal, R. S., Myneni, R. B., Wu, C., Wang, L., Song, W., and Ji, D.: Spatial and temporal variations in global soil respiration and their relationships with climate and land cover, Sci. Adv., 6, eabb8508, https://doi.org/10.1126/sciadv.abb8508, 2020.
Huang, Y., Guenet, B., Wang, Y. L., and Ciais, P.: Global Simulation and Evaluation of Soil Organic Matter and Microbial Carbon and Nitrogen Stocks Using the Microbial Decomposition Model ORCHIMIC v2.0, Global Biogeochem. Cy., 35, e2020GB006836, https://doi.org/10.1029/2020GB006836, 2021.
IPCC: Climate change 2001: the scientific basis, Contribution of Working Group I to the Third Assessment Report of the Intergovernmental Panel on Climate Change, edited by: Houghton, J., Ding, Y., Griggs, D. J., Noguer, M., van der Linden, P. J., Xiaosu, D., 1–881, Cambridge University Press, Cambridge, ISBN: 0521 80767 0 hardback, 0521 01495 6 paperback, 2001.
IPCC: Summary for policymakers, Retrieved from Cambridge, United Kingdom and New York, NY, USA, edited by: Stocker, T. F., Qin, D., Plattner, G.-K., Tignor, M., Allen, S. K., Boschung, J., Nauels, A., Xia, Y., Bex, V., and Midgley, P. M., 1–29, Cambridge University Press, Cambridge, United Kingdom and New York, NY, USA, https://doi.org/10.1017/CBO9781107415324.005, 2013.
Joergensen, R. G., Brookes, P. C., and Jenkinson, D. S.: Survival of the soil microbial biomass at elevated temperatures, Soil Biol. Biochem., 22, 1129–1136, 1990.
Kassambara, A. and Kassambara, M. A.: Package “ggcorrplot”, R package version 0.1, 3, O'Reilly Media, Inc. ISBN: 9781098134945, 2019.
Kim, D., Lee, M.-I., and Seo, E.: Improvement of soil respiration parameterization in a dynamic global vegetation model and its impact on the simulation of terrestrial carbon fluxes, J. Clim., 32, 127–143, 2019.
Koven, C. D., Riley, W. J., Subin, Z. M., Tang, J. Y., Torn, M. S., Collins, W. D., Bonan, G. B., Lawrence, D. M., and Swenson, S. C.: The effect of vertically resolved soil biogeochemistry and alternate soil C and N models on C dynamics of CLM4, Biogeosciences, 10, 7109–7131, https://doi.org/10.5194/bg-10-7109-2013, 2013.
Kuzyakov, Y. and Blagodatskaya, E.: Microbial hotspots and hot moments in soil: Concept and review, Soil Biol. Biochem., 83, 184–199, https://doi.org/10.1016/j.soilbio.2015.01.025, 2015.
Lal, R.: Soil carbon sequestration to mitigate climate change, Geoderma, 123, 1–22, 2004.
Lal, R.: Promise and limitations of soils to minimize climate change, J. Soil Water Conserv., 63, 113A–118A, https://doi.org/10.2489/jswc.63.4.113A, 2008.
Lu, H., Li, S., Ma, M., Bastrikov, V., Chen, X., Ciais, P., Dai, Y., Ito, A., Ju, W., and Lienert, S.: Comparing machine learning-derived global estimates of soil respiration and its components with those from terrestrial ecosystem models, Environ. Res. Lett., 16, 054048, https://doi.org/10.1088/1748-9326/abf526, 2021.
Manzoni, S., Schimel, J. P., and Porporato, A.: Responses of soil microbial communities to water stress: results from a meta-analysis, Ecology, 93, 930–938, 2012.
Mathieu, P.-P. and O'Neill, A.: Data assimilation: From photon counts to Earth System forecasts, Remote Sens. Environ., 112, 1258–1267, https://doi.org/10.1016/j.rse.2007.02.040, 2008.
Matson, P., Lohse, K. A., and Hall, S. J.: The globalization of nitrogen deposition: consequences for terrestrial ecosystems, Ambio, 113–119, 2002.
Meeran, K., Ingrisch, J., Reinthaler, D., Canarini, A., Müller, L., Pötsch, E. M., Richter, A., Wanek, W., and Bahn, M.: Warming and elevated CO2 intensify drought and recovery responses of grassland carbon allocation to soil respiration, Glob. Change Biol., 27, 3230–3243, https://doi.org/10.1111/gcb.15628, 2021.
Moyano, F. E., Manzoni, S., and Chenu, C.: Responses of soil heterotrophic respiration to moisture availability: An exploration of processes and models, Soil Biol. Biochem., 59, 72–85, https://doi.org/10.1016/j.soilbio.2013.01.002, 2013.
Nemani, R. R., Keeling, C. D., Hashimoto, H., Jolly, W. M., Piper, S. C., Tucker, C. J., Myneni, R. B., and Running, S. W.: Climate-driven increases in global terrestrial net primary production from 1982 to 1999, Science, 300, 1560–1563, 2003.
Noh, N. J., Kuribayashi, M., Saitoh, T. M., and Muraoka, H.: Different responses of soil, heterotrophic and autotrophic respirations to a 4-year soil warming experiment in a cool-temperate deciduous broadleaved forest in central Japan, Agr. Forest Meteorol., 247, 560–570, 2017.
Nyberg, M. and Hovenden, M. J.: Warming increases soil respiration in a carbon-rich soil without changing microbial respiratory potential, Biogeosciences, 17, 4405–4420, https://doi.org/10.5194/bg-17-4405-2020, 2020.
Oleson, K., Lawrence, D., Lombardozzi, D., and Wieder, W.: CLM land-only release, NCAR [data set], https://doi.org/10.5065/d6154fwh, 2019.
Pascual, J. A., García, C., Hernandez, T., and Ayuso, M.: Changes in the microbial activity of an arid soil amended with urban organic wastes, Biol. Fert. Soils, 24, 429–434, https://doi.org/10.1007/s003740050268, 1997.
Pendall, E., Bridgham, S., Hanson, P. J., Hungate, B., Kicklighter, D. W., Johnson, D. W., Law, B. E., Luo, Y., Megonigal, J. P., Olsrud, M., Ryan, M. G., and Wan, S.: Below-ground process responses to elevated CO2 and temperature: a discussion of observations, measurement methods, and models, New Phytol., 162, 311–322, https://doi.org/10.1111/j.1469-8137.2004.01053.x, 2004.
Piñeiro, J., Ochoa-Hueso, R., Delgado-Baquerizo, M., Dobrick, S., Reich, P. B., Pendall, E., and Power, S. A.: Effects of elevated CO2 on fine root biomass are reduced by aridity but enhanced by soil nitrogen: A global assessment, Sci. Rep., 7, 1–9, 2017.
Prescott, C. E., Grayston, S. J., Helmisaari, H.-S., Kaštovská, E., Körner, C., Lambers, H., Meier, I. C., Millard, P., and Ostonen, I.: Surplus carbon drives allocation and plant–soil interactions, Trends Ecol. Evol., 35, 1110–1118, 2020.
Preusser, S., Poll, C., Marhan, S., Angst, G., Mueller, C. W., Bachmann, J., and Kandeler, E.: Fungi and bacteria respond differently to changing environmental conditions within a soil profile, Soil Biol. Biochem., 137, 107543, https://doi.org/10.1016/j.soilbio.2019.107543, 2019.
R Core Team: R: A language and environment for statistical computing, Vienna, Austria: R Foundation for Statistical Computing, R Foundation for Statistical Computing, Vienna, Austria ISBN: 3-900051-07-0, 2013.
Sampaio, G., Nobre, C., Costa, M. H., Satyamurty, P., Soares-Filho, B. S., and Cardoso, M.: Regional climate change over eastern Amazonia caused by pasture and soybean cropland expansion, Geophys. Res. Lett., 34, L17709, https://doi.org/10.1029/2007GL030612, 2007.
Schimel, D. S.: Terrestrial ecosystems and the carbon cycle, Glob. Change Biol., 1, 77–91, 1995.
Schimel, J. P.: Life in dry soils: effects of drought on soil microbial communities and processes, Annu. Rev. Ecol. Evol. Syst., 49, 409–432, 2018.
Sinsabaugh, R. L., Manzoni, S., Moorhead, D. L., and Richter, A.: Carbon use efficiency of microbial communities: stoichiometry, methodology and modelling, Ecol. Lett., 16, 930–939, https://doi.org/10.1111/ele.12113, 2013.
Sinsabaugh, R. L., Turner, B. L., Talbot, J. M., Waring, B. G., Powers, J. S., Kuske, C. R., Moorhead, D. L., and Follstad Shah, J. J.: Stoichiometry of microbial carbon use efficiency in soils, Ecol. Monogr., 86, 172–189, 2016.
Soong, J. L., Castanha, C., Pries, C. E. H., Ofiti, N., Porras, R. C., Riley, W. J., Schmidt, M. W. I., and Torn, M. S.: Five years of whole-soil warming led to loss of subsoil carbon stocks and increased CO2 efflux, Sci. Adv., 7, eabd1343, https://doi.org/10.1126/sciadv.abd1343, 2021.
Stevenson, B. A., Sarmah, A. K., Smernik, R., Hunter, D. W. F., and Fraser, S.: Soil carbon characterization and nutrient ratios across land uses on two contrasting soils: Their relationships to microbial biomass and function, Soil Biol. Biochem., 97, 50–62, https://doi.org/10.1016/j.soilbio.2016.02.009, 2016.
Tecon, R. and Or, D.: Biophysical processes supporting the diversity of microbial life in soil, FEMS Microbiol. Rev., 41, 599–623, https://doi.org/10.1093/femsre/fux039, 2017.
Thornton, P. E. and Rosenbloom, N. A.: Ecosystem model spin-up: Estimating steady state conditions in a coupled terrestrial carbon and nitrogen cycle model, Ecol. Model., 189, 25–48, 2005.
Thornton, P. E., Lamarque, J.-F., Rosenbloom, N. A., and Mahowald, N. M.: Influence of carbon-nitrogen cycle coupling on land model response to CO2 fertilization and climate variability, Global Biogeochem. Cy., 21, GB4018, https://doi.org/10.1029/2006GB002868, 2007.
Todd-Brown, K. E. O., Randerson, J. T., Post, W. M., Hoffman, F. M., Tarnocai, C., Schuur, E. A. G., and Allison, S. D.: Causes of variation in soil carbon simulations from CMIP5 Earth system models and comparison with observations, Biogeosciences, 10, 1717–1736, https://doi.org/10.5194/bg-10-1717-2013, 2013.
Vance, E. D. and Chapin, I. F. S.: Substrate limitations to microbial activity in taiga forest floors, Soil Biol. Biochem., 33, 173–188, 2001.
Viovy, N.: CRUNCEP Version 7 – Atmospheric Forcing Data for the Community Land Model, Research Data Archive at the National Center for Atmospheric Research, Computational and Information Systems Laboratory [data set], https://doi.org/10.5065/PZ8F-F017, 2018.
Wang, G., Jagadamma, S., Mayes, M. A., Schadt, C. W., Steinweg, J. M., Gu, L., and Post, W. M.: Microbial dormancy improves development and experimental validation of ecosystem model, ISME J., 9, 226–237, 2015.
Wang, K., Peng, C., Zhu, Q., Zhou, X., Wang, M., Zhang, K., and Wang, G.: Modeling global soil carbon and soil microbial carbon by integrating microbial processes into the ecosystem process model TRIPLEX-GHG, J. Adv. Model. Earth Syst., 9, 2368–2384, https://doi.org/10.1002/2017MS000920, 2017.
Wang, Y., Yuan, F., Yuan, F., Gu, B., Hahn, M. S., Torn, M. S., Ricciuto, D. M., Kumar, J., He, L., Zona, D., and Xu, X.: Mechanistic modeling of microtopographic impacts on CO2 and CH4 Fluxes in an Alaskan tundra ecosystem using the CLM-Microbe model, J. Adv. Model. Earth Syst., 11, 4288–4304, https://doi.org/10.1029/2019MS001771, 2019.
Wang, Y., Yuan, F., Arndt, K. A., Liu, J., He, L., Zuo, Y., Zona, D., Lipson, D. A., Oechel, W. C., Ricciuto, D. M., Wullschleger, S. D., Thornton, P. E., and Xu, X.: Upscaling Methane Flux From Plot Level to Eddy Covariance Tower Domains in Five Alaskan Tundra Ecosystems, Front. Environ. Sci., 10, 939238, https://doi.org/10.3389/fenvs.2022.939238, 2022.
Warner, D. L., Bond-Lamberty, B. P., Jian, J., Stell, E., and Vargas, R.: Global Gridded 1-km Annual Soil Respiration and Uncertainty Derived from SRDB V3, ORNL distributed active archive center, https://doi.org/10.3334/ORNLDAAC/1736, 2019.
Wei, H., Chen, X., Xiao, G., Guenet, B., Vicca, S., and Shen, W.: Are variations in heterotrophic soil respiration related to changes in substrate availability and microbial biomass carbon in the subtropical forests?, Sci. Rep., 5, 18370, https://doi.org/10.1038/srep18370, 2015.
Wieder, W.: Regridded Harmonized World Soil Database v1.2, ORNL distributed active archive center, https://doi.org/10.3334/ORNLDAAC/1247, 2014.
Wieder, W. R., Bonan, G. B., and Allison, S. D.: Global soil carbon projections are improved by modelling microbial processes, Nat. Clim. Chang., 3, 909–912, https://doi.org/10.1038/nclimate1951, 2013.
Wieder, W. R., Grandy, A. S., Kallenbach, C. M., Taylor, P. G., and Bonan, G. B.: Representing life in the Earth system with soil microbial functional traits in the MIMICS model, Geosci. Model Dev., 8, 1789–1808, https://doi.org/10.5194/gmd-8-1789-2015, 2015.
Wiltshire, A. J., Burke, E. J., Chadburn, S. E., Jones, C. D., Cox, P. M., Davies-Barnard, T., Friedlingstein, P., Harper, A. B., Liddicoat, S., Sitch, S., and Zaehle, S.: JULES-CN: a coupled terrestrial carbon–nitrogen scheme (JULES vn5.1), Geosci. Model Dev., 14, 2161–2186, https://doi.org/10.5194/gmd-14-2161-2021, 2021.
Xu, X. F., Tian, H. Q., Zhang, C., Liu, M. L., Ren, W., Chen, G. S., Lu, C. Q., and Bruhwiler, L.: Attribution of spatial and temporal variations in terrestrial methane flux over North America, Biogeosciences, 7, 3637–3655, https://doi.org/10.5194/bg-7-3637-2010, 2010.
Xu, X., Thornton, P. E., and Post, W. M.: A global analysis of soil microbial biomass carbon, nitrogen and phosphorus in terrestrial ecosystems, Glob. Ecol. Biogeogr., 22, 737–749, https://doi.org/10.1111/geb.12029, 2013.
Xu, X., Schimel, J. P., Thornton, P. E., Song, X., Yuan, F., and Goswami, S.: Substrate and environmental controls on microbial assimilation of soil organic carbon: a framework for Earth system models, Ecol. Lett., 17, 547–555, https://doi.org/10.1111/ele.12254, 2014.
Xu, X., Elias, D. A., Graham, D. E., Phelps, T. J., Carroll, S. L., Wullschleger, S. D., and Thornton, P. E.: A microbial functional group-based module for simulating methane production and consumption: Application to an incubated permafrost soil, J. Geophys. Res.-Biogeo., 120, 1315–1333, https://doi.org/10.1002/2015JG002935, 2015.
Xu, X., Wang, N., Lipson, D., Sinsabaugh, R., Schimel, J., He, L., Soudzilovskaia, N. A., and Tedersoo, L.: Microbial macroecology: In search of mechanisms governing microbial biogeographic patterns, Glob. Ecol. Biogeogr., 29, 1870–1886, https://doi.org/10.1111/geb.13162, 2020.
Xu, X., He, L., and Wang, Y.: CLM-Microbe v1.0, Zenodo [code], https://doi.org/10.5281/zenodo.7439312, 2022.
Yuste, C. J., Baldocchi, D. D., Gershenson, A., Goldstein, A., Misson, I., and Wong, S.: Microbial soil respiration and its dependency on carbon inputs, soil temperature and moisture, Glob. Change Biol., 13, 2018–2035, https://doi.org/10.1111/j.1365-2486.2007.01415.x, 2007.
Zhang, Q., Lei, H.-M., and Yang, D.-W.: Seasonal variations in soil respiration, heterotrophic respiration and autotrophic respiration of a wheat and maize rotation cropland in the North China Plain, Agr. Forest Meteorol., 180, 34–43, 2013.
Zhao, M., Heinsch, F. A., Nemani, R. R., and Running, S. W.: Improvements of the MODIS terrestrial gross and net primary production global data set, Remote Sens. Environ., 95, 164–176, https://doi.org/10.1016/j.rse.2004.12.011, 2005.
Zhao, Z., Peng, C., Yang, Q., Meng, F.-R., Song, X., Chen, S., Epule, T. E., Li, P., and Zhu, Q.: Model prediction of biome-specific global soil respiration from 1960 to 2012, Earth's Future, 5, 715–729, https://doi.org/10.1002/2016EF000480, 2017.
Zheng, Y., Shen, R., Wang, Y., Li, X., Liu, S., Liang, S., Chen, J. M., Ju, W., Zhang, L., and Yuan, W.: Improved estimate of global gross primary production for reproducing its long-term variation, 1982–2017, Earth Syst. Sci. Data, 12, 2725–2746, https://doi.org/10.5194/essd-12-2725-2020, 2020.
Zhou, L., Zhou, X., Shao, J., Nie, Y., He, Y., Jiang, L., Wu, Z., and Hosseini Bai, S.: Interactive effects of global change factors on soil respiration and its components: a meta-analysis, Glob. Change Biol., 22, 3157–3169, 2016.
Zhou, X., Wan, S., and Luo, Y.: Source components and interannual variability of soil CO2 efflux under experimental warming and clipping in a grassland ecosystem, Glob. Change Biol., 13, 761–775, 2007.
Zhu, X., Zhang, L., Zuo, Y., Liu, J., Yu, J., Yuan, F., Wang, N., He, L., Wang, Y., Guo, Z., Sun, Y., Song, Y., Song, C., Guo, D., and Xu, X.: Wetland reclamation homogenizes microbial properties along soil profiles, Geoderma, 395, 115075, https://doi.org/10.1016/j.geoderma.2021.115075, 2021.
Zuo, Y., Wang, Y., He, L., Wang, N., Liu, J., Yuan, F., Li, K., Guo, Z., Sun, Y., Zhu, X., Zhang, L., Song, C., Sun, L., and Xu, X.: Modeling methane dynamics in three wetlands in Northeastern China by using the CLM-Microbe model, Ecosyst. Health Sustain., 8, 2074895, https://doi.org/10.1080/20964129.2022.2074895, 2022.