the Creative Commons Attribution 4.0 License.
the Creative Commons Attribution 4.0 License.
 | 22 May 2024
Hydrodynamic and biochemical impacts on the development of hypoxia in the Louisiana–Texas shelf – Part 1: roles of nutrient limitation and plankton community
Yanda Ou
A three-dimensional coupled hydrodynamic–biogeochemical model with multiple nutrient and plankton functional groups was developed and adapted to the Gulf of Mexico to investigate the role of nutrients and the complexity of plankton community in dissolved oxygen (DO) dynamics. A 15-year hindcast was achieved covering the period of 2006–2020. Extensive model validation against in situ data demonstrates that the model was capable of reproducing vertical distributions of DO and spatial distributions of bottom DO concentration, as well as their interannual variations. The study demonstrates that bottom DO dynamics and hypoxia evolution are significantly influenced by both physical processes and local biochemistry, with sedimentary oxygen consumption and vertical diffusion identified as key contributors. Summer hydrodynamics play a critical role in nutrient distribution and limitation: a notable expansion of Si limitation was simulated when coastal currents shifted eastward or northward. This effect, especially pronounced on the western part of the Louisiana–Texas shelf, underscores the importance of nutrient limitation in shaping DO dynamics. The model identifies a bi-peak primary production pattern in spring and early summer, aligned with satellite chlorophyll a variations, attributed to the complexity of the plankton community and interactions among different plankton groups. Our findings emphasize the necessity of integrating sophisticated plankton community dynamics into biogeochemical models to understand primary production variability and its impact on bottom hypoxia.
- Article
(22575 KB) - Full-text XML
- BibTeX
- EndNote


The Louisiana–Texas (LaTex) shelf in the northern Gulf of Mexico (nGoM) has one of the most notorious recurring hypoxia zones in the world (bottom dissolved oxygen (DO) < 2 mg L−1, Rabalais et al., 2002; Rabalais et al., 2007a; Justić and Wang, 2014). Historical observations show that hypoxia usually emerges in mid-May and persists through mid-September (Rabalais et al., 1999, 2002). The hypoxic zone can cover as much as 23 000 km2 and has a volume of up to 140 km3 (Rabalais and Turner, 2019; Rabalais and Baustian, 2020). Although nitrogen (N) is the ultimate limiting nutrient, phosphorus (P) load reduction also leads to a significant reduction of the hypoxia area (Fennel and Laurent, 2018). Transient P limitation on the shelf (Laurent et al., 2012; Sylvan et al., 2007) was deemed to be associated with the delayed onset and reduction of the hypoxia area. Sensitivity experiments with hypoxia area reduction to different nutrient reduction strategies suggested that to meet the hypoxic area reduction goal (< 5000 km2 in a 5-year running average) set by the Mississippi River/Gulf of Mexico Watershed Nutrient Task Force (2008), a dual-nutrient strategy with a reduction of 48 % of total N and inorganic P would be the most effective way (Fennel and Laurent, 2018).
Coastal eutrophication in the LaTex shelf leads to a high rate of microbial respiration and depletion of DO (Rabalais et al., 2007b). Incubation studies in the LaTex shelf have suggested that sediment oxygen consumption (SOC) accounted for 20 ± 4 % (Murrell and Lehrter, 2011) to 25 ± 5.3 % (McCarthy et al., 2013) of below-pycnocline respiration, nearly 7-fold greater than the corresponding percentage in waters overlying sediments (3.7 ± 0.8 %, about 20 cm above sediments in McCarthy et al., 2013). The numerical study by Fennel et al. (2013) calculated the corresponding SOC fraction, which reached 60 % when applying the water respiration rates of Murrell and Lehrter (2011) and sediment respiration rates of Rowe et al. (2002). Another numerical study (Yu et al., 2015) also pointed out that on the LaTex shelf, oxygen consumption at the bottom water layer was more associated with SOC than water column respiration. According to in situ data and statistical analysis, SOC can be estimated using the bottom temperature and DO concentration (e.g., Hetland and DiMarco, 2008). Nevertheless, many numerical studies have treated SOC as only associated with the abundance of organic matter in the sediment (e.g., Justić and Wang, 2014; Fennel et al., 2006, 2011). An instantaneous remineralization parameterization by Fennel et al. (2006, 2011) estimated SOC as a function of sediment detritus and phytoplankton. Using this scheme, Große et al. (2019) found that the simulated SOC was supported by Mississippi N supply (51 ± 9 %), Atchafalaya N supply (33 ± 9 %), and open-boundary N supply (16 ± 2 %). However, the instantaneous remineralization parameterization tends to overestimate SOC at the peak of phytoplankton blooms while underestimating SOC after the blooms. In a realistic environment, there should be a lag between the blooms and the peak SOC (Fennel et al., 2013). Developments of coupled sediment–water models have emphasized the importance of biogeochemical processes in sediments for SOC dynamics and evolution of bottom hypoxia in the shelf (Moriarty et al., 2018; Laurent et al., 2016). However, coupled sediment–water models are computationally more expensive than a simplified parameterization of SOC. Especially for long-term simulations and time-sensitive forecasts, it is crucial to balance the model's efficiency with its complexity.
In addition to SOC and excess nutrient supply from the rivers, water column stratification also plays an important role in regulating the variability of bottom DO concentration in the LaTex shelf. Strong stratification prohibits DO ventilation and thus reduces DO supply to the bottom water layer (Hetland and DiMarco, 2008; Bianchi et al., 2010; Fennel et al., 2011, 2013, 2016; Justić and Wang, 2014; Wang and Justić, 2009; Feng et al., 2014; Yu et al., 2015; Laurent et al., 2018). On the shelf, the Mississippi plume and the Atchafalaya plume introduce buoyancy, leading to a stable water column and weak DO ventilation processes (Mattern et al., 2013; Fennel and Testa, 2019). Due to the different distances from major river mouths, the influence of freshwater-induced buoyancy varies along the shelf. Moreover, the transport and deposition processes of organic matter are affected by the coastal alongshore current systems, resulting in an SOC gradient across the shelf. For instance, Hetland and DiMarco (2008) pointed out that in the west of Terrebonne Bay, where stratification is usually weak, bottom hypoxia is mainly controlled by bottom respiration.
The phytoplankton blooms on the LaTex shelf mainly result from cyanobacteria and diatoms (Wawrik and Paul, 2004; Schaeffer et al., 2012; Chakraborty et al., 2017). In the Mississippi River plume, diatoms were found to be the most diverse algal class, accounting for over 42 % of all unique genotypes observed (Wawrik and Paul, 2004). Cruise data in the nGoM indicated that diatoms accounted for ∼ 50 % to ∼ 65 % (inner-shelf) and ∼ 33 % to ∼ 64 % (mid-shelf) of chlorophyll a in winter and spring and ∼ 30 % to ∼ 46 % (inner-shelf) during summer and fall, respectively (Chakraborty and Lohrenz, 2015). A field survey documented the fact that the biovolume contribution of diatoms to the total phytoplankton could have been as high as 80 % and 70 % during the upwelling seasons in 2013 and 2014, respectively (Anglès et al., 2019). While a lot of existing studies indicate that N and P were more limited than silicon (Si) on the shelf (e.g., for cruises in 2004 in Quigg et al., 2011; for cruises in 2012 in Zhao and Quigg, 2014; for cruises in 1984, 1994, 2005, 2010, and 2011 in Turner and Rabalais, 2013), Si limitation has also been reported in both plume and shelf water. A bioassay study on sampled collected in spring and summer 2004 showed signs of co-limitation of N, P, and Si at multiple sites (Quigg et al., 2011). Based on cruise studies in the plume of the Mississippi River in 1992 and 1993, strong Si limitation in spring was found due to the increasing N : Si ratio in the Mississippi River water (Nelson and Dortch, 1996). Cruise measurements in 1987 and 1988 also suggested the likelihood of Si limitation, which sometimes overwhelmed the N limitation (Dortch and Whitledge, 1992).
Numerical studies for hypoxia in the LaTex shelf were developed mostly incorporating nutrient flows of N and P only (e.g., Fennel et al., 2006, 2011, 2013; Laurent et al., 2012; Laurent and Fennel, 2014; Fennel and Laurent, 2018; Justić et al., 2003, 2007; Justić and Wang, 2014; Große et al., 2019; Moriarty et al., 2018). In addition, many existing models utilized an oversimplified lower-trophic-level model (one phytoplankton + one zooplankton function group or only one phytoplankton group). The recycling of nutrients in water columns and the associated biogeochemical processes, which may be important to hypoxia evolution (e.g., in the Chesapeake Bay by Testa and Kemp, 2012), could be oversimplified. Moreover, we noticed that there was a bi-peak primary production pattern observed by satellite and modeled by Gomez et al. (2018) (see comparisons of modeled and satellite-derived chlorophyll a concentration in that work). Their biogeochemical model incorporated a more complex community (two phytoplankton + three zooplankton function groups) than other oversimplified models where the bi-peak pattern was hardly captured (e.g., Fennel et al., 2011). The temporal variation of shelf primary production can further induce corresponding changes in DO concentration and in the bottom hypoxia. In this study, we aimed to investigate the possible Si limitation and to assess the impacts of the complexity of the plankton community on DO dynamics and bottom hypoxia development. We adapted and modified a coupled physical–biogeochemical model covering the entire Gulf of Mexico (GoM) by introducing the oxygen and P cycles to the North Pacific Ecosystem Model for Understanding Regional Oceanography (NEMURO, Kishi et al., 2007). The model has two phytoplankton and three zooplankton functional groups for a more comprehensive representation of the plankton community. We also modified the instantaneous remineralization parameterization by adding a conceptual sedimentary organic pool (represented by a sedimentary particulate organic N pool, PONsed; Fig. 1) to allow the accumulation of organic matter in the sediment. The influence of the community is represented in the biogeochemical processes in water columns and sediments and will eventually be reflected in the bottom DO variability.
2.1 Coupled hydrodynamic–biogeochemical model
We adapted the three-dimensional, free-surface, topography-following community model, the Regional Ocean Model System (ROMS, version 3.7), on the platform of Coupled Ocean–Atmosphere–Wave–Sediment Transport (COAWST) modeling system (Warner et al., 2010) to the GoM (Gulf–COAWST). ROMS solves finite-difference approximations of Reynolds-averaged Navier–Stokes equations by applying hydrostatic and Boussinesq approximations with a split explicit time-stepping algorithm (Haidvogel et al., 2000; Shchepetkin and McWilliams, 2005, 2009). The biogeochemical model applied is primarily based on NEMURO developed by Kishi et al. (2007). NEMURO is a concentration-based, lower-trophic-level ecosystem model developed and parameterized for the North Pacific. The original NEMURO has 11 concentration-based state variables, including nitrate (NO3), ammonium (NH4), small and large phytoplankton biomass (PS and PL), microzooplankton biomass, mesozooplankton biomass, predatory zooplankton biomass (ZS, ZL, and ZP), particulate and dissolved organic N (PON and DON), particulate silica (Opal), and silicic acid (Si(OH)4). NEMURO is known for its capability to distinguish ZS, ZL, and ZP and to provide a detailed analysis of the dynamics of different functional groups. It was widely used in studies of plankton biomass on regional scales (Fiechter and Moore 2009; Gomez et al., 2018; Shropshire et al., 2020). The embedded Si cycle permits the inclusion of a diatom group (i.e., PL), one of the dominant phytoplankton groups in the LaTex shelf.
2.2 Model modification
In a recent effort, Shropshire et al. (2020) adapted and modified NEMURO to the GoM with five structural changes. (1) The grazing pathway of ZL on PS was removed since, in the GoM, the PS group is predominated by cyanobacteria and picoeukaryotes, which are too small for direct feeding by most mesozooplankton (i.e., ZL). (2) A linear function of mortality was applied for PS, PL, ZS, and ZL, while quadratic mortality was used for ZP, accounting for predation pressure of unmodeled predators, like planktivorous fish. (3) The ammonium inhibition term in the nitrate limitation function was no longer considered exponentially but followed the parameterization by Parker (1993). (4) Light limitation on photosynthesis was replaced with the Platt et al. (1980) functional form, which was also implemented in the newer version of NEMURO. (5) A constant C : Chl ratio was replaced with a variable C : Chl model according to the formulation by Li et al. (2010).
Neither the modified (Shropshire et al., 2020) nor the original (Kishi et al., 2007) NEMURO considered P and oxygen cycles. In this study, we introduced a P cycle into NEMURO, including three concentration-based state variables: phosphate (PO4), particulate organic P (POP), and dissolved organic P (DOP). The P limitation on phytoplankton growth was introduced using the Michaelis–Menten formula. In NEMURO, N serves as the common “currency” when measuring the plankton concentration (mmol N m−3). In the river-dominated LaTex shelf, rivers supply inorganic and organic nutrients. In our model, riverine PO4 (Fig. C1c), DOP, and POP were prescribed based on water quality measurements at river gages. When no measurement was available, the PO4, DOP, and POP were approximated using total nitrate + nitrite (NO3 + NO2), dissolved organic N (DON), and particulate organic N (PON) measurements, respectively, via the Redfield ratio of P : N . We neglected the POP settling process but preserved these pools by introducing the stoichiometric ratio between P and N instead. In other words, the sinking process of POP is implicitly included by building linkages between PON and POP concentrations, as the sinking of PON is considered in the model. Governing equations for P state variables are given according to Eqs. (1)–(3). Please also refer to the appendices for more details on expressions of modified terms (Appendix A), state variables (Appendix Table B1), source and sink terms (Appendix Table B2), and values of parameters (Appendix Table B4).
We further adapted the oxygen cycle developed by Fennel et al. (2006, 2013) to NEMURO for hypoxia simulations. However, our model's biogeochemical processes are slightly different due to the different plankton functional groups considered. Sources for oxygen are contributed by the photosynthesis of two phytoplankton functional groups. In comparison, the sinks are attributed to respirations of two phytoplankton functional groups, metabolism of three zooplankton functional groups, light-dependent nitrification (Olson, 1981; Fennel et al., 2006), aerobic decomposition of particulate and dissolved organic matter (measured as PON, and DON, respectively), and SOC. Oxygen air–sea flux was estimated following parameterizations by Wanninkhof (1992). The biogeochemical dynamics of oxygen were adopted as follows (Eq. 4; also see detailed descriptions of variables and parameters in Appendix A–B).
A PONsed pool due to vertical sinking processes of PON was introduced for parameterization of SOC. The SOC scheme (Fennel et al., 2006) is known as the instantaneous consumption of DO. As soon as the PON falls into the sediment bed, PON will be decomposed instantaneously. This scheme tends to overestimate SOC at the peak of blooms and to underestimate SOC after blooms since the lag in SOC demand is neglected (Fennel et al., 2013). We considered such temporal delays in SOC by introducing a PONsed pool. A portion of the PON ends with PONsed, while the rest is buried (PONburial) and removed from the system. The parameterization is shown in the following. (1) Organic matter settling down at the conceptual sediment layer is remineralized at a temperature-dependent aerobic remineralization rate, KP2N. (2) Sediment oxygen is consumed only in the oxidation of sedimentary organic matter (represented by PONsed) and the nitrification of ammonium to nitrate (Fennel et al., 2006). (3) Oxygen consumption at the conceptual sediment layer directly contributes to oxygen concentration decreases only at the bottom water column. (4) Sediment denitrification is linearly related to SOC according to observational-based estimates by Seitzinger and Giblin (1996), but the relationship was modified by Fennel et al. (2006) with a slightly smaller slope of denitrification on SOC rate, i.e.,
(5) Aerobic decomposition of PONsed, sediment nitrification, and denitrification follow chemical equations according to (Fennel et al., 2006)
(6) Nitrate produced in sediments (Reaction R2) is used for denitrification (Reaction R3). The linear assumption of denitrification and SOC (Eq. 5) implicitly builds relationships among the aerobic decomposition of PONsed (Reaction R1), sediment nitrification (Reaction R2), and denitrification (Reaction R3). Let us assume that the production rate of NH4 by aerobic decomposition (Reaction R1) of organic matter is M mmol m−3 d−1 and that the fraction of denitrification-produced CO2 (Reaction R3) to the total CO2 production (Reactions R1 and R3) is x. According to the linear assumption mentioned above, the consumption rate of NO3 during denitrification (Reaction R3) is proportional to the total consumption rate of O2 in the sediment (Reactions R1 and R2), yielding and further x≈0.1425. The oxygen consumption rate (Eq. 6) and organic matter consumption rate (Eq. 7) due to the coupled aerobic decomposition, nitrification, and denitrification processes can be obtained by substituting the x value into the stoichiometric ratios according to Reactions (R1)–(R3).
Accordingly, the SOC and consumption rate of PONsed are given, respectively, as follows:
where
We further added light inhibition to nitrification and aerobic decomposition. These parameterizations were applied following descriptions by Fennel et al. (2006, 2013). For the oxygen-dependent term, an oxygen threshold is specified below which no aerobic respiration or nitrification occurred. Detailed equations are listed in Appendix A. The structure of the newly modified NEMURO is shown in a schematic diagram in Fig. 1.
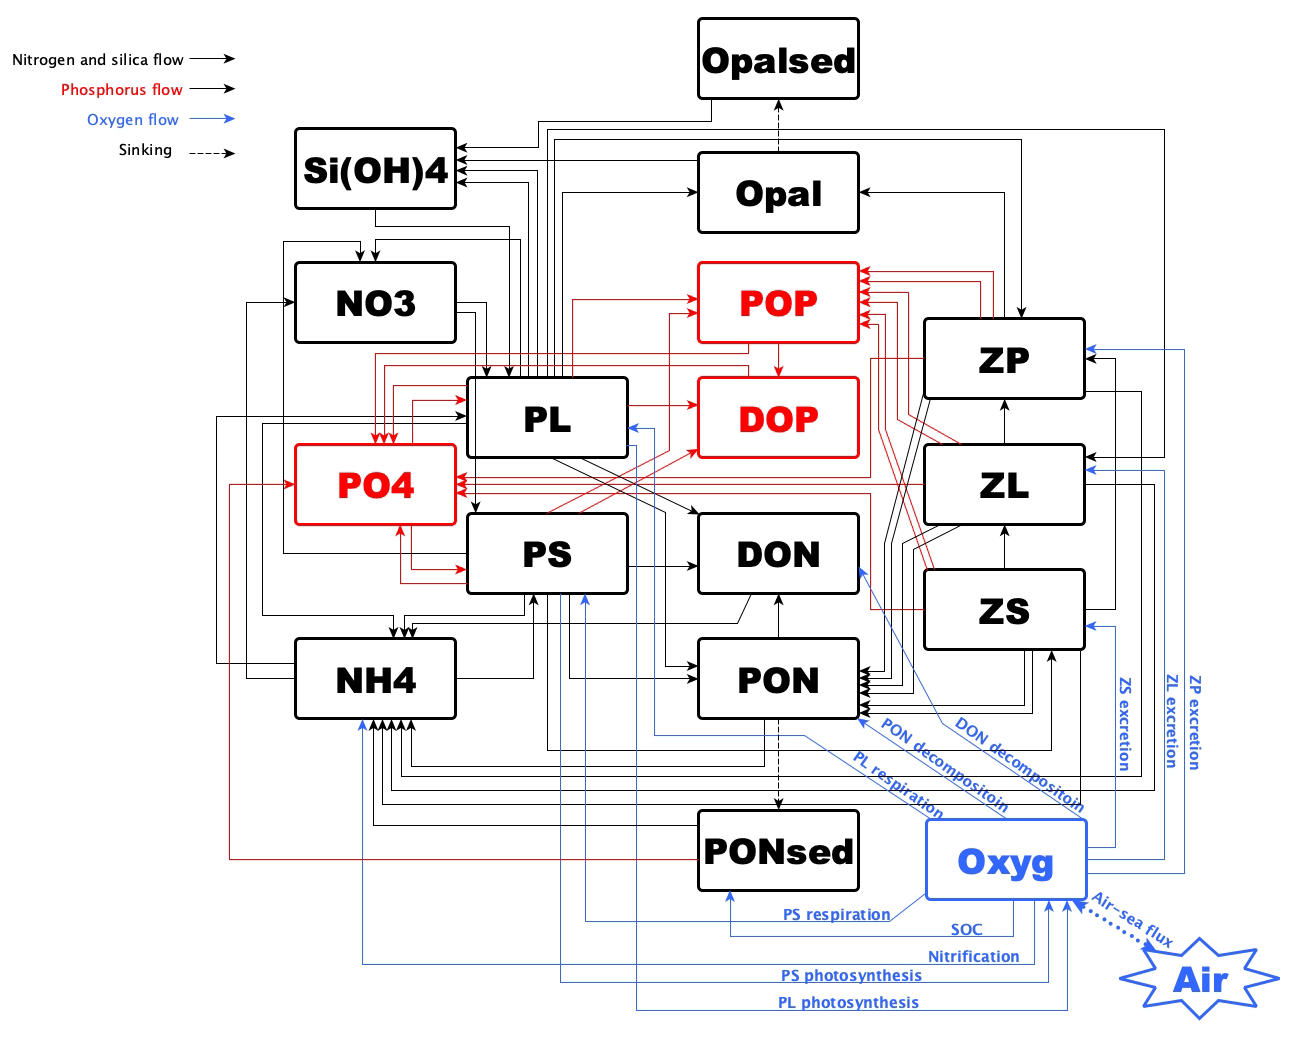
Figure 1Schematic diagram of the modified NEMURO. Note that the P flow and the oxygen flow are two newly added flows to the original NEMURO.
2.3 Model setups
The coupled model was applied to the GoM using an Arakawa C-grid with a horizontal resolution of ∼ 5 km (Fig. 2a). There are 334 and 357 interior ρ points in the east–west and north–south directions, respectively. The model includes 36 σ layers vertically. The wetting and drying scheme (Warner et al., 2013) was implemented to provide a more accurate representation of shallow water. The computational time step (i.e., baroclinic time step) was set to 240 s, while the number of barotropic time steps between each baroclinic time step was set to 30. Model hindcast was carried out from 1 August 2006 to 26 August 2020, with the first 5 months as a spin-up period. Model historical and averaged results were output at a daily interval, while the historical fields were output at 00:00 UTC each day.
The physical model setups largely followed an earlier Gulf–COAWST application (Zang et al., 2018, 2019, 2020). Open boundaries were set at the south and east forced by daily water level, horizontal components of 3D current velocity, horizontal components of depth-integrated current velocity, 3D water salinity, and 3D water temperature derived from the Hybrid Coordinate Ocean Model (HYCOM) global analysis products (Bleck and Boudra, 1981; Bleck, 2002) with data assimilated via the Navy Coupled Ocean Data Assimilation system (Cummings, 2005; Cummings and Smedstad, 2013; Fox et al., 2002; Helber et al., 2013). For lateral boundary conditions, we utilized Chapman implicit for the free surface and water level (Chapman, 1985), Flather for depth-integrated momentum (Flather, 1976), gradient for mixing total kinetic energy, and mixed radiation nudging conditions for 3D momentum, temperature, and salinity (Marchesiello et al., 2001). The nudging time steps for the mixed radiation nudging condition were set to 1 d for inflows and 30 d for outflows. The boundary nudging technique was performed at the computational grids along the open boundary. The boundary condition types for passive biological and chemical tracers (i.e., PS, PL, ZS, ZL, ZP, NO3, NH4, PON, DON, Si(OH)4, Opal, PO4, POP, DOP, and Oxyg) were all prescribed as radiation.
Initial conditions for water level, horizontal components of 3D current velocity, horizontal components of depth-integrated current velocity, 3D water salinity, and 3D water temperature were provided by the same HYCOM products as well. Initial conditions for concentrations of NO3, PO4, and Si(OH)4 were interpolated from measurements provided by the World Ocean Database (WOD, Boyer et al., 2018). Initial conditions for DO concentration were given by the World Ocean Atlas (WOA, Garcia et al., 2019). At the sediment layer, PONsed, PONburial, Opalsed, and Opalburial were initialized as 0.1 mmol m−3. Other biological and chemical tracers were initialized as 0.1 mmol m−3 due to the lack of observations.
Atmospheric forcings, including surface wind velocity at 10 m height above sea level, net longwave radiation flux, net shortwave radiation flux, precipitation rate, air temperature 2 m above sea level, sea surface air pressure, and relative humidity 2 m above sea level, were derived from the National Centers for Environmental Prediction (NCEP) Climate Forecast System Reanalysis (CFSR) 6-hourly products (for years prior to 2011, Saha et al., 2010) and NCEP CFS Version 2 (CFSv2) 6-hourly products (for years starting from 2011, Saha et al., 2011) with a horizontal resolution of ∼ 35 and ∼ 22 km, respectively. In our model, 63 rivers were considered to be horizontal point-source forcings along the coastal GoM. They were split into 280 point (red dots in Fig. 2a) sources transporting time-varying salinity (nearly zero), temperature, 3D horizontal momentum (based on the magnitude of river discharges), nutrients (NO3, NH4, PO4, Si(OH)4, PON, DON, POP, and DOP; Fig. C1), and DO to the computational domain. Locations of river point sources of the Mississippi and the Atchafalaya rivers are shown as red dots in Fig. 2b. For reconstructions of time series of river forcing terms, we composed measurements from various sources, including the US Geological Survey (USGS) National Water Information System (NWIS), National Oceanic and Atmospheric Administration (NOAA) Tides and Currents System (TCS), NOAA National Estuarine Research Reserve System (NERRS), and Mexico National Water Commission (CONAGUA, for rivers in Mexico's territory). Daily averaged river discharges were given based on measurements by USGS NWIS and CONAGUA. The magnitude of river discharges was multiplied by 1.4 to account for adjacent watershed areas and the lateral inflow of tributaries (Warner et al., 2005). River temperature and salinity time series were reconstructed from measurements by USGS NWIS, NOAA TCS, and NOAA NERRS. River nutrient concentrations were provided monthly by USGS NWIS and NOAA NERRS and were extended to daily time series with values in the corresponding months. Riverine DO concentration was set to be a constant (258 mmol m−3), assuming that riverine DO was saturated at 25 °C under 1 atm. In addition, tidal forcings were introduced in the hydrodynamic model, taking into account the influences of tidal elevations and tidal currents. There were 13 tidal constituents considered in the model including M2, S2, N2, K2, K1, O1, P1, Q1, MF, MM, M4, MS4, and MN4.
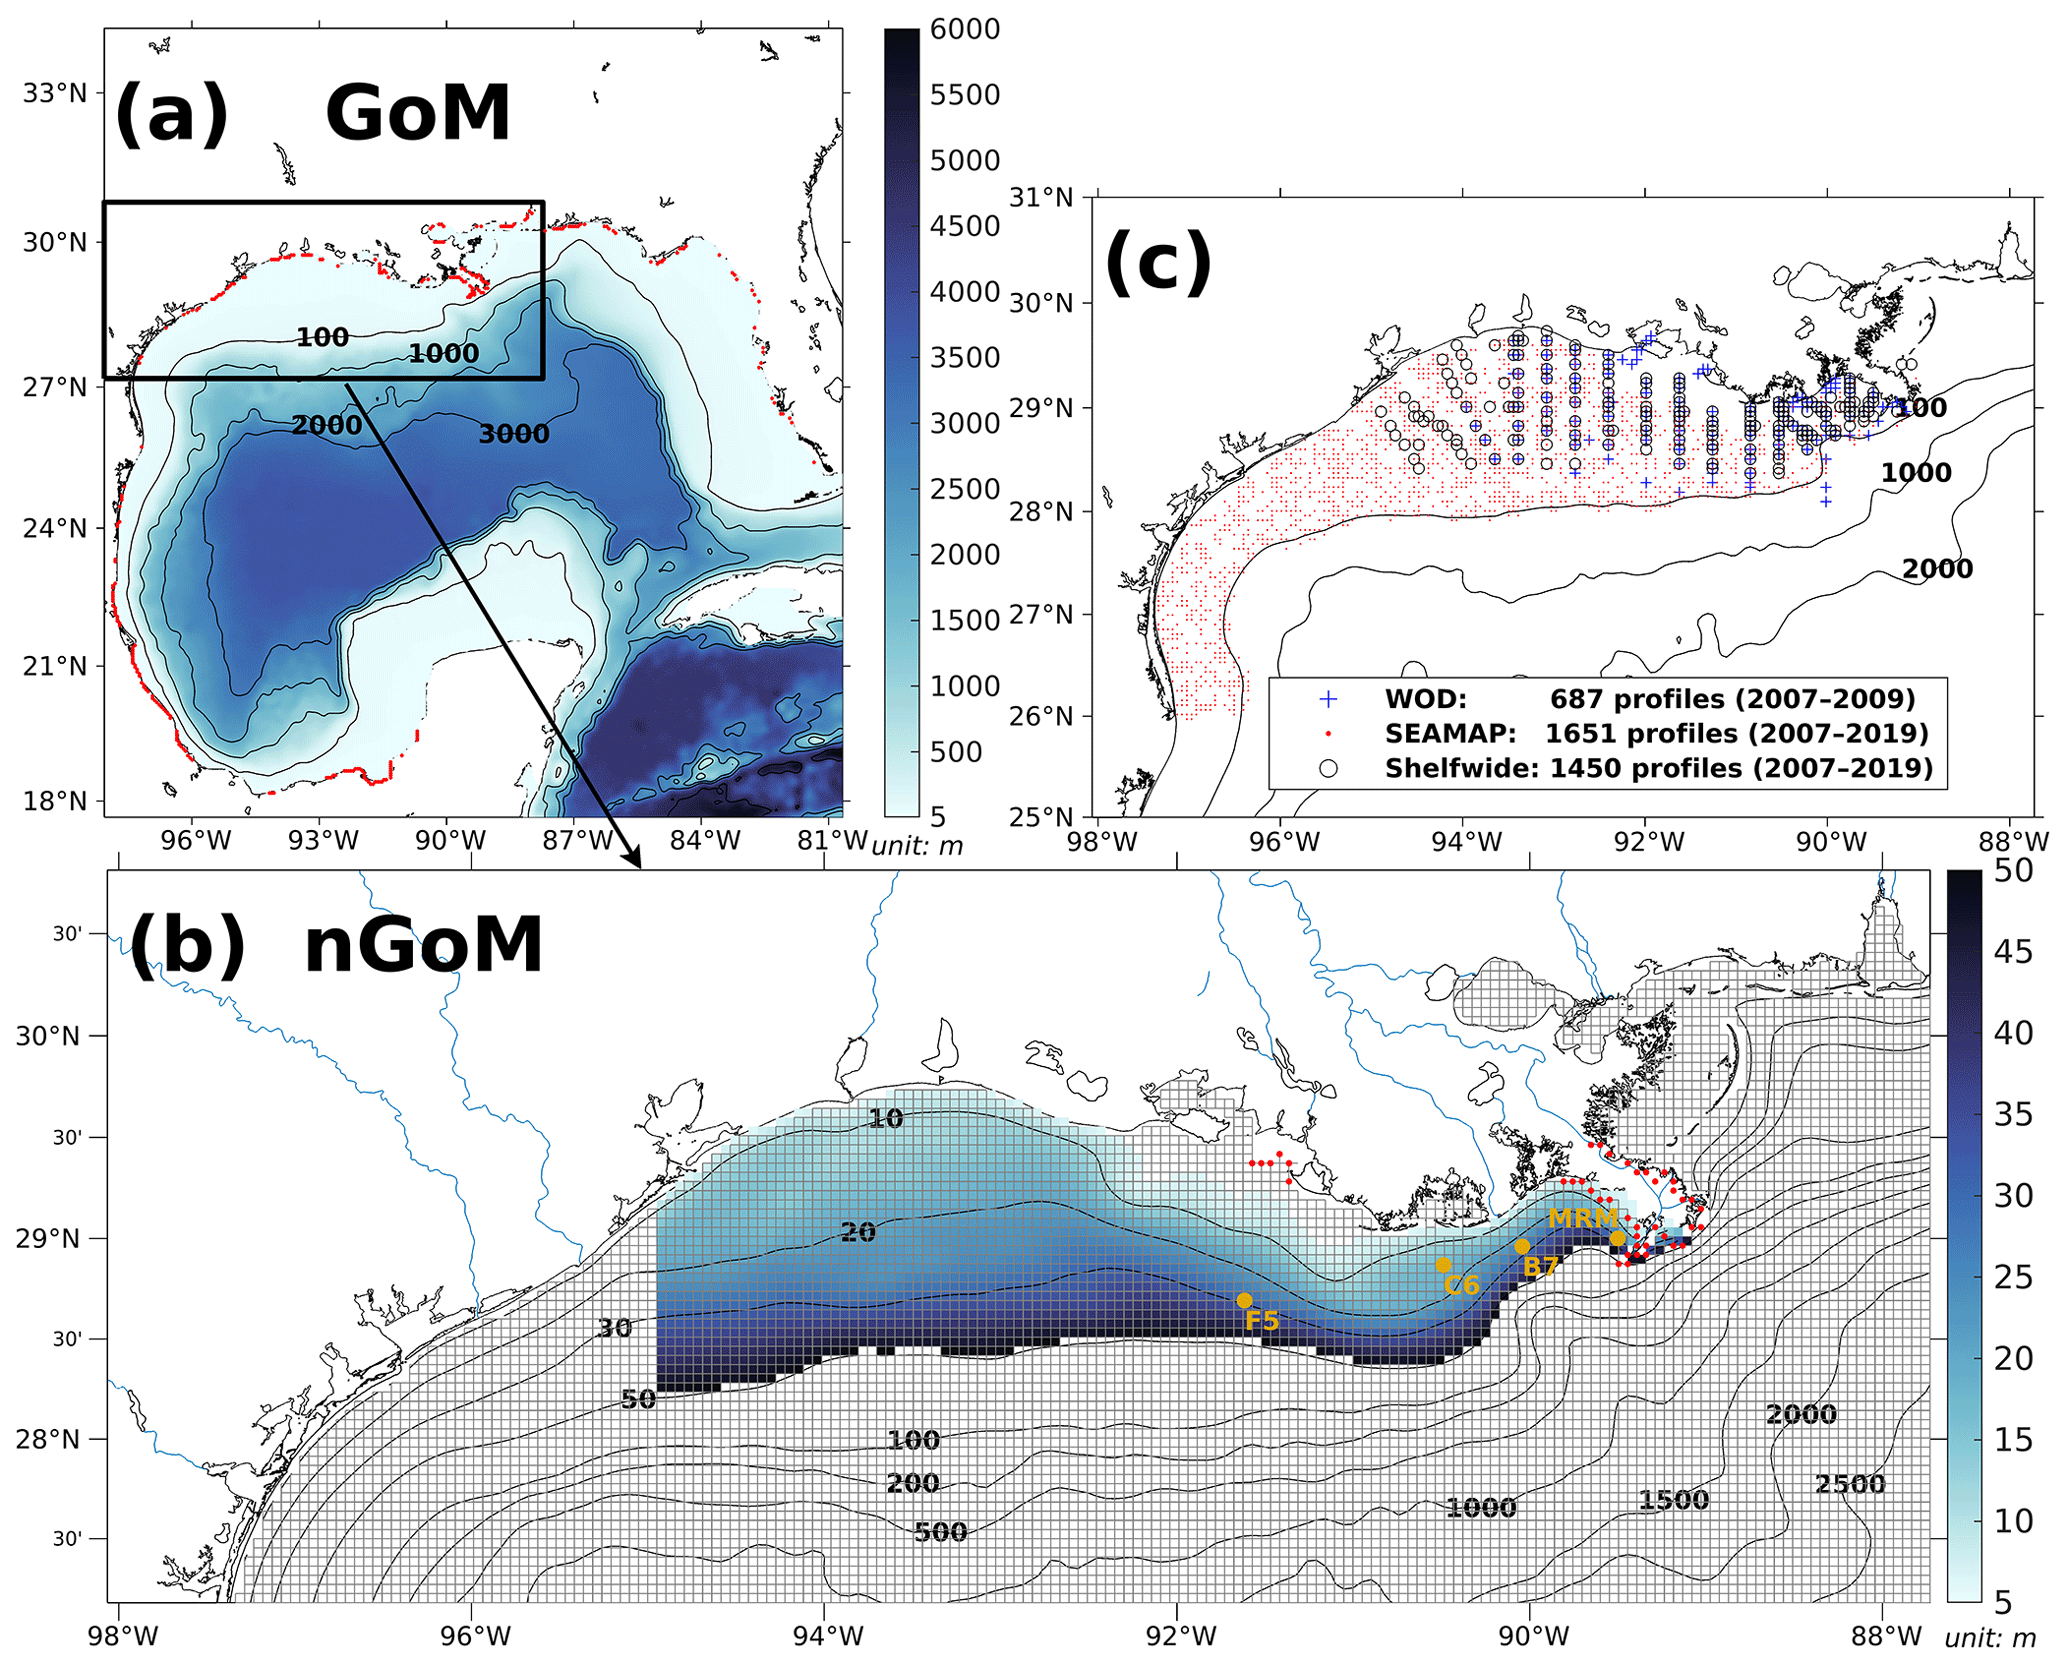
Figure 2(a) Bathymetry of the entire domain of the Gulf–COAWST, (b) zoomed-in bathymetry plot of the northern Gulf of Mexico (nGoM), and (c) locations of observed inorganic nutrient and DO profiles derived from WOD, SEAMAP, and NOAA's shelf-wide cruises. In (a), locations of river point sources are denoted by red dots. In (b), only bathymetry between 6 and 50 m is mapped with colors; computational meshes are split by solid gray lines; main river channels are denoted by solid blue curves; locations of river point sources of the Mississippi and Atchafalaya rivers are indicated by red dots; sampling locations for SOC and overlying water respiration measurements by McCarthy et al. (2013) are denoted by dark yellow dots.
3.1 Available measurements
In this section, biogeochemical model validations are conducted for surface inorganic nutrient concentration (i.e., NO3, PO4, and Si(OH)4), types of limited nutrients, ratios of diatoms to total phytoplankton, SOC, DO concentration profiles, spatial distributions of bottom DO concentration, and temporal variability of the hypoxic area against multiple field and lab datasets. Validation of the hydrodynamic model can be found in Zang et al. (2019).
Inorganic nutrient concentrations from WOD and NOAA's shelf-wide cruises were used for model validation. WOD measurements cover the period from 11 January 2007 to 5 July 2009, while the shelf-wide records cover the 2007–2019 period. The types of limited nutrients across the LaTex shelf were discussed based on multiple bioassay studies (Turner and Rabalais, 2013; Quigg et al., 2011; Smith and Hitchcock, 1994; Sylvan et al., 2006, 2007; Zhao and Quigg, 2014; Nelson and Dortch, 1996). The diatom percentage of total phytoplankton was derived from measurements by Chakraborty and Lohrenz (2015) and Schaeffer et al. (2012). The SOC measurements were provided by an incubation study (McCarthy et al., 2013). Available DO concentration profiles were obtained from NOAA-supported midsummer shelf-wide cruises and the Summer Groundfish Survey in GoM supported by the Southeast Area Monitoring and Assessment Program (SEAMAP) conducted annually by the Gulf States Marine Fisheries Commission. The shelf-wide cruises provided 1450 measured profiles with 70 401 available records from 2007 to 2019. There were at least 83 DO profiles for each summer (June–August, except 2016) from the shelf-wide cruise observations. The selected SEAMAP DO dataset covers a time range from 2007 to 2019 with measurements including 1651 profiles with 94 200 sampled records. Locations of the selected profiles from different archives are shown in Fig. 2c. Summer measurements by the shelf-wide cruises were used to validate spatial patterns of bottom DO concentration and time series of summer hypoxic areas. Estimated hypoxic areas by the cruises are available from 2007 to 2020, with a range from 5480 to 22 720 km2.
3.2 Surface nutrient concentration
One-to-one comparisons for surface nutrient concentration validation were seldom carried out in previous numerical studies, where spatially averaged or temporally averaged matrices were frequently validated. To provide a more detailed quantification of model performance in surface nutrients, we performed one-to-one differences between simulations and measurements at each sampling location on specific dates. Modeled results showed good agreement with the cruise measurements from both shelf-wide and WOD records (Fig. 3) in terms of magnitudes. A total of 86 % of surface NO3 differences are within a range of ± 10 mmol m−3, with most biases ranging from −2.5 to 0 mmol m−3 (56 %, Fig. 3a). It indicates a slight underestimation, which is mostly found in the middle and western shelf (> 150 km from the Mississippi River mouth, Fig. 3b). Surface NO3 biases exhibit a higher variance near the mouth than in other regions. A total of 92 % of surface PO4 bias pairs are within ± 1 mmol m−3 (Fig. 3c), exhibiting a more even distribution pattern than the NO3 differences. It results from the model underestimation in the middle and eastern shelf but overestimation in the west (Fig. 3d). A total of 88 % of surface Si(OH)4 differences are within a range of ± 20 mmol m−3, with a slight underestimation (Fig. 3e). We found higher biases near the Mississippi (first to third quartiles within ± 8 mmol m−3 at 0–150 km) and the Atchafalaya (−5 to 7 mmol m−3 at 150–300 km) River mouths (Fig. 3f) than at the western shelf. Mean Mississippi and Atchafalaya riverine PO4 concentrations were 2.7 ± 0.7 and 2.3 ± 0.7 mmol m−3, respectively, and mean riverine Si(OH)4 concentrations were 118 ± 23 and 116 ± 21 mmol m−3, respectively. Thus, the nutrient concentration bias between simulations and observations is acceptable, considering the possible transient influence from the riverine nutrient loads during a survey.
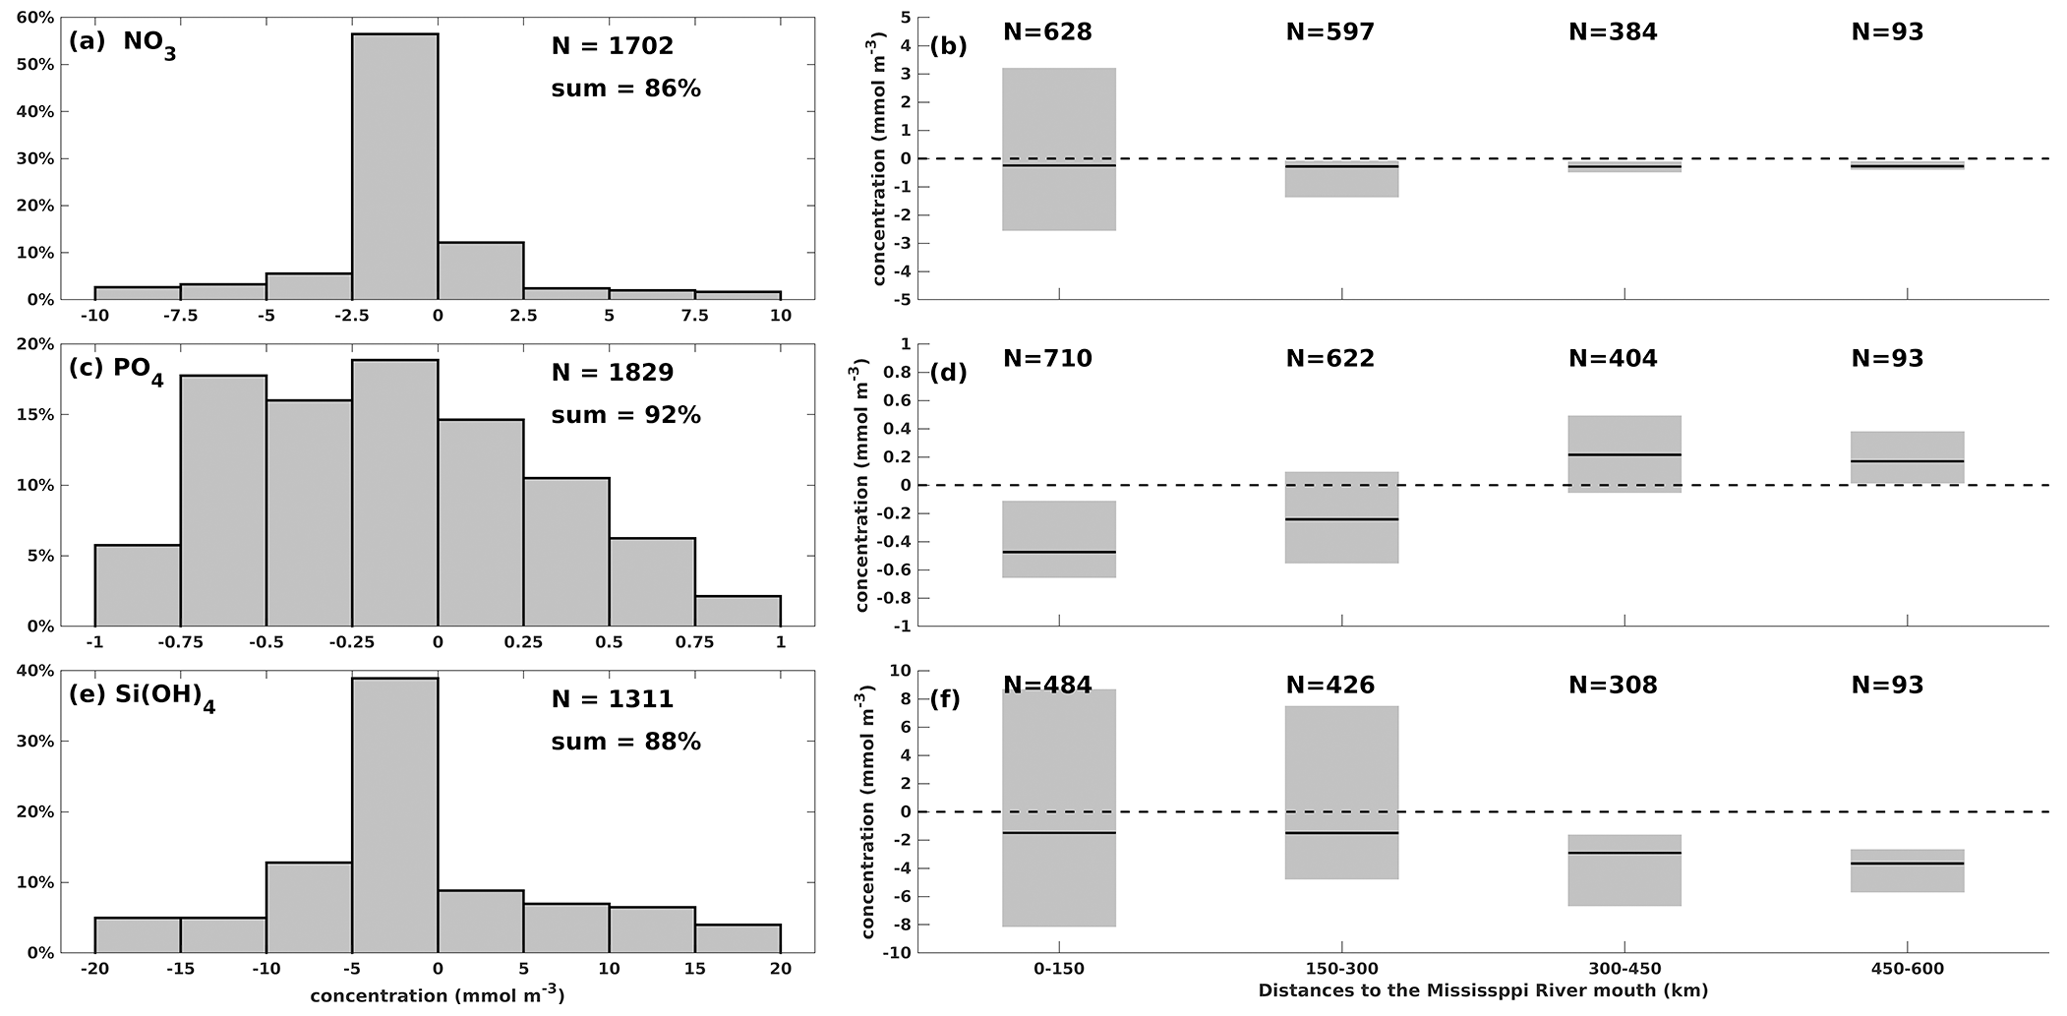
Figure 3Comparison of surface nutrient concentration between model hindcasts and cruise measurements (both shelf-wide and WOD) for (a)–(b) NO3, (c)–(d) PO4, and (e)–(f) Si(OH)4. The left bar graphs illustrate the distribution of concentration differences by percentage within specific concentration ranges, while the right box charts show the first quartiles, third quartiles, and medians of the concentration differences against the distance to the Mississippi River mouth.
3.3 Nutrient limitation
Nutrient limitation could vary among different phytoplankton species with different efficiencies in nutrient uptakes. In our model, the Si limitation was modeled only for the PL growth. Depth-averaged nutrient limitation coefficients (see Eqs. A9–A10) over the surface at 1 m depth were compared to bioassay studies. When a modeled coefficient is lower than 0.75, the water body is defined to be limited by the corresponding nutrient for the corresponding phytoplankton group. A bioassay study by Turner and Rabalais (2013) demonstrated that N limitation was more common than P limitation along transects C and F in June and July 2010 (Fig. 4). All July samples were found to be N-limited, while only some June samples along transect C were found to be P-limited with the rest being N-limited. The model mostly captured the dominant N limitation pattern along both transects. As there was a lack of location information in this bioassay study, we could not pinpoint the location of the observed P limitation in Fig. 4. However, our model indicated that the P limitation was more common around the Mississippi River mouth for both phytoplankton groups. In June 2010, transect C, located at the boundary of the modeled N and P limitation, showed that the model could successfully capture the observed spatial pattern of nutrient limitation.
Dominant P limitation adjacent to the Mississippi River mouth was observed in other bioassay studies (e.g., Quigg et al., 2011; Smith and Hitchcock, 1994; Sylvan et al., 2006, 2007) and was also captured by the model, indicated by high percentage occurrences over the simulation period (2007–2020) (Fig. 5b, e). N limitation was mostly found in the shallow parts of the middle and western shelf during spring (Fig. 5a) and became more widespread offshore and eastward in July (Fig. 5d). This pattern was also seen in earlier bioassay estimates (e.g., Quigg et al., 2011; Sylvan et al., 2007; Zhao and Quigg, 2014). The Si limitation occurrence formed a distinct offshore gradient in spring (Fig. 5c). Bioassay studies have illustrated that Si limitation occurred in the eastern shelf during spring (e.g., Quigg et al., 2011; Nelson and Dortch, 1996; Smith and Hitchcock, 1994). The gradient tilted westward in July, indicating a potential oligotrophic water intrusion from deep waters when the circulation pattern changed during the summer months. However, there is a knowledge gap regarding Si limitation over the western shelf region, where no known bioassay studies have been conducted. We gather some clues from the Dortch and Whitledge (1992) study of spring 1988 and summer 1987 in the Mississippi plume (mostly east of 90° W with depth > 50 m), where they found that Si had higher potential as a limiting nutrient than N in summer in high-salinity waters. Salinity in the western shelf is usually high in July due to the changing predominant current system from westward to eastward or northeastward. The low-salinity and Si-rich plume waters can be replaced by deep waters with higher salinity and lower Si. We expect a more Si-limited environment in the western shelf than in other parts during July, which, however, needs further support from additional bioassay studies.
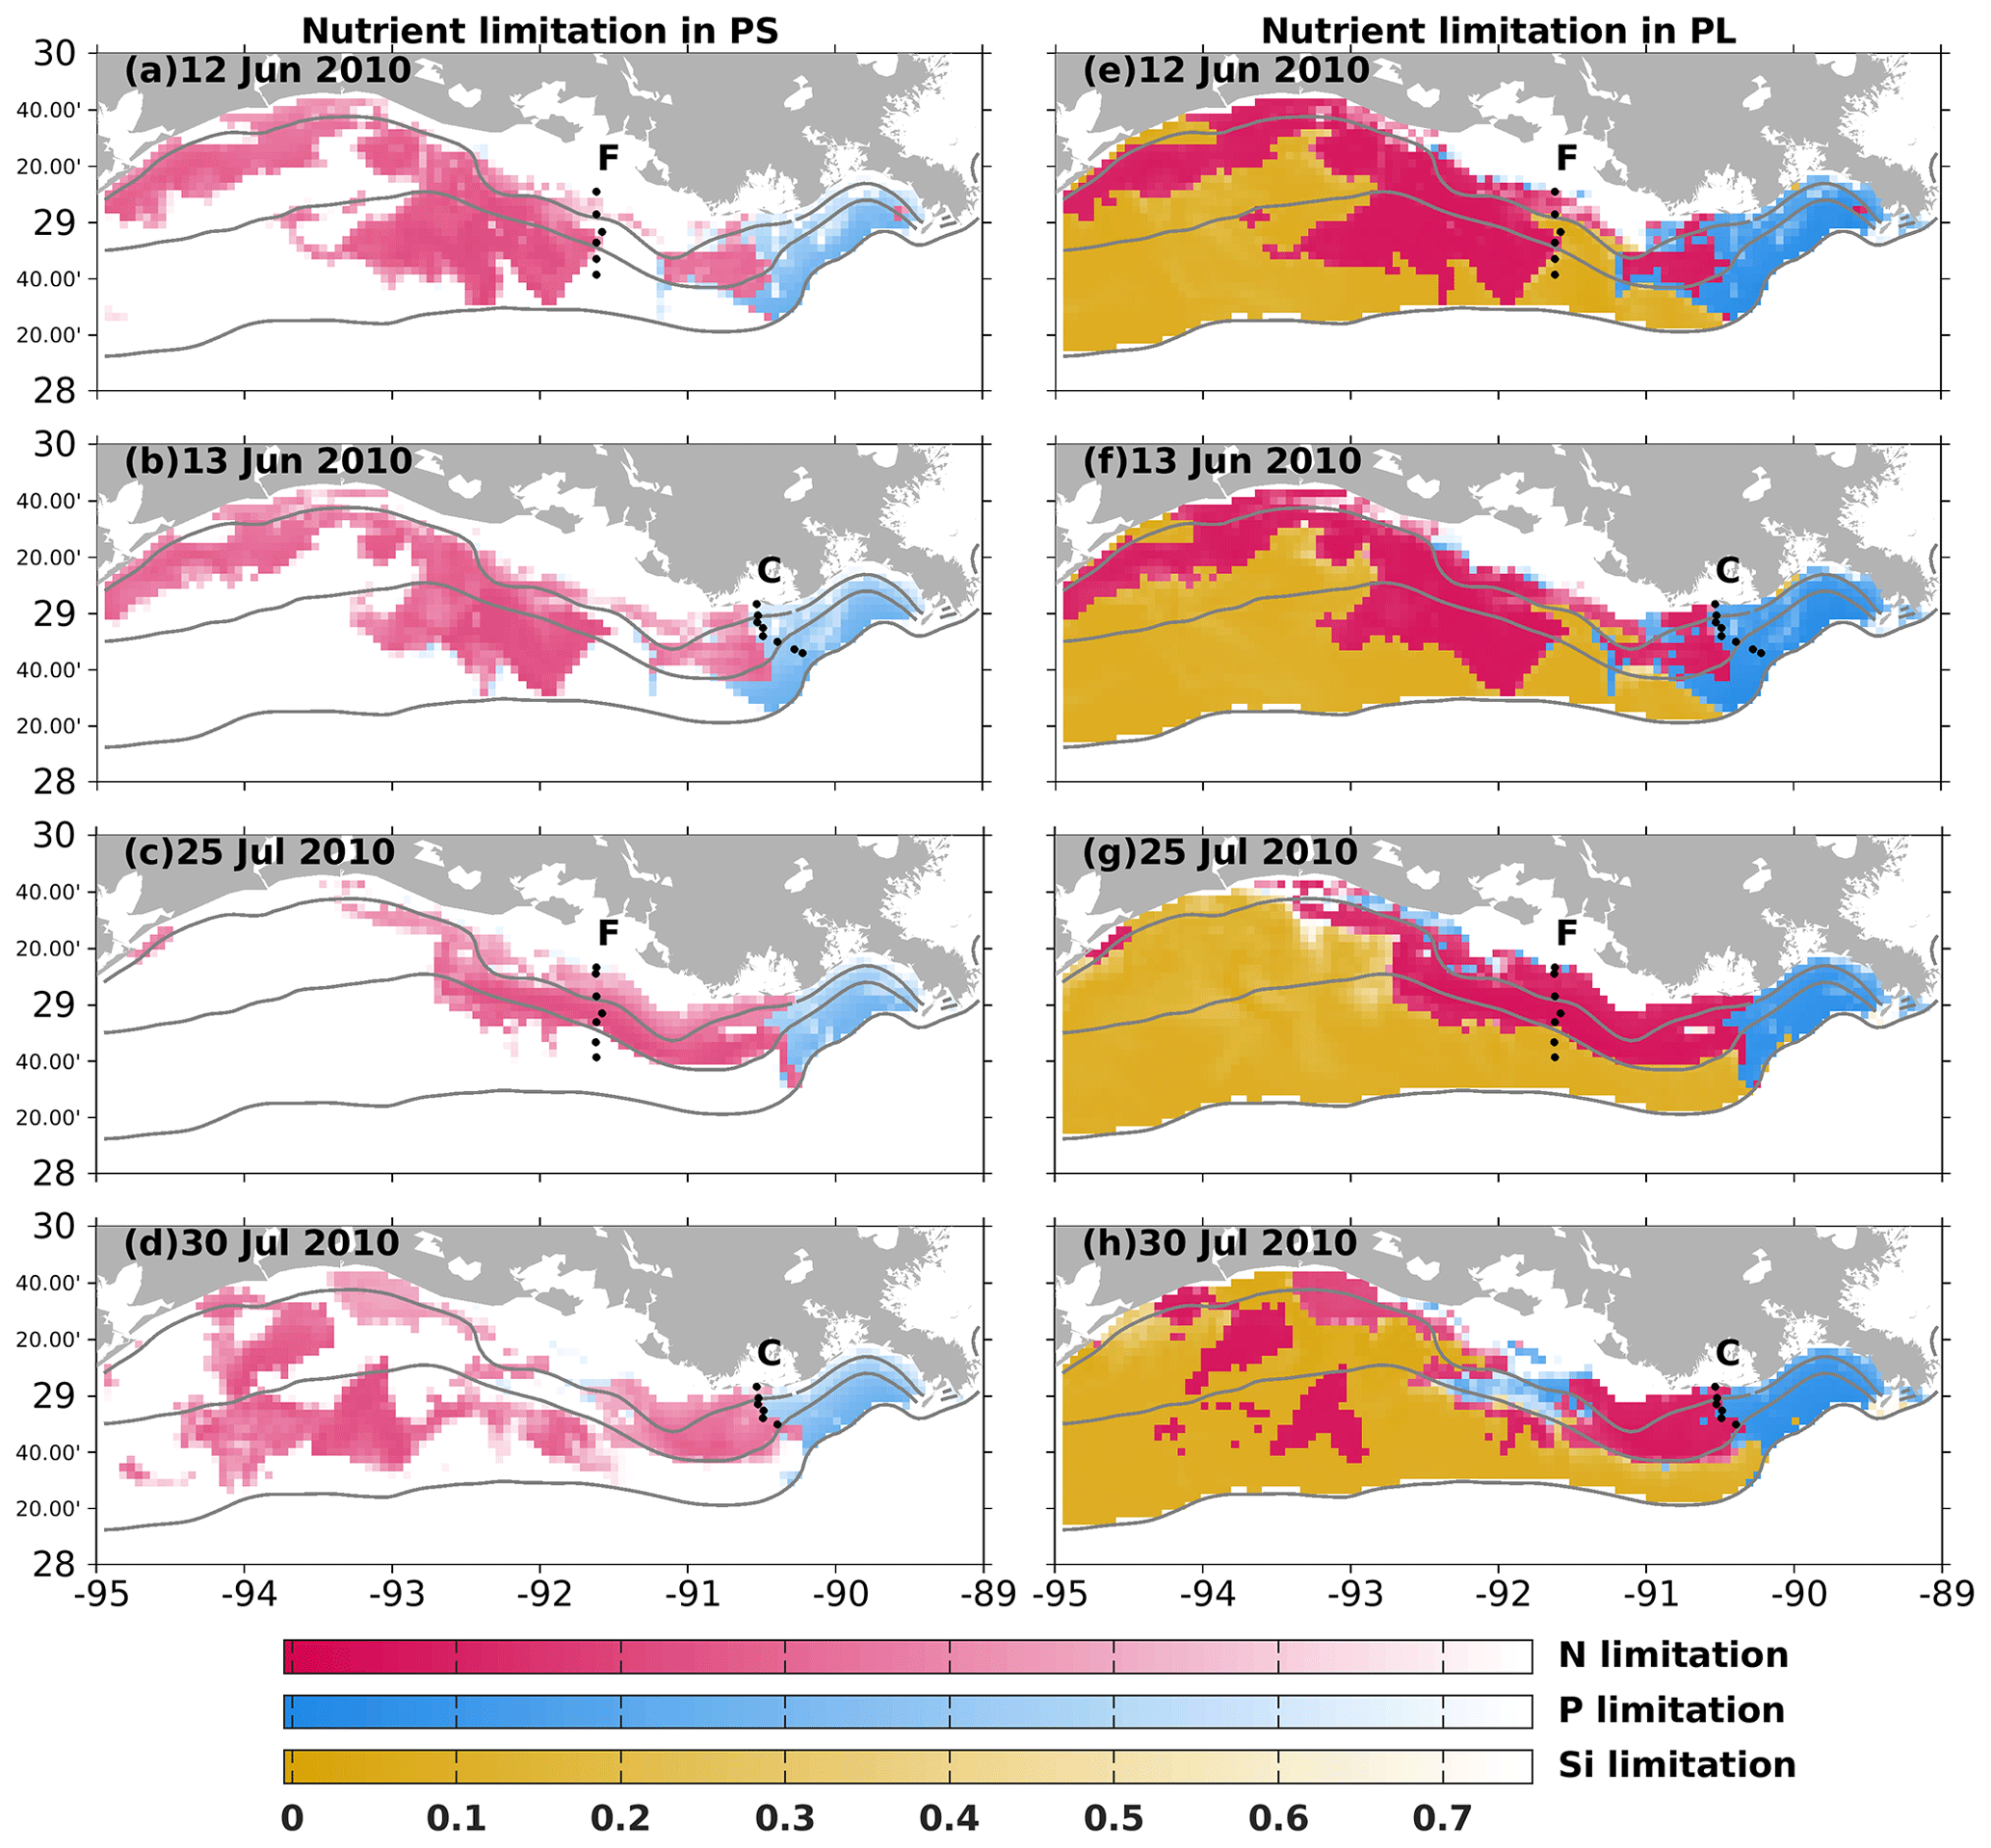
Figure 4Simulated nutrient limitation coefficient patterns (color) and locations of two sampling transects from the 2010 midsummer shelf-wide cruise (black dots). Modeled nutrient limitation coefficients (for PS, left column; for PL, right column) are averaged over the surface at 1 m depth. A lower coefficient indicates the corresponding nutrient is more limited. Limited nutrient types were examined in the June and July water samples from transects C and F in Turner and Rabalais (2013).
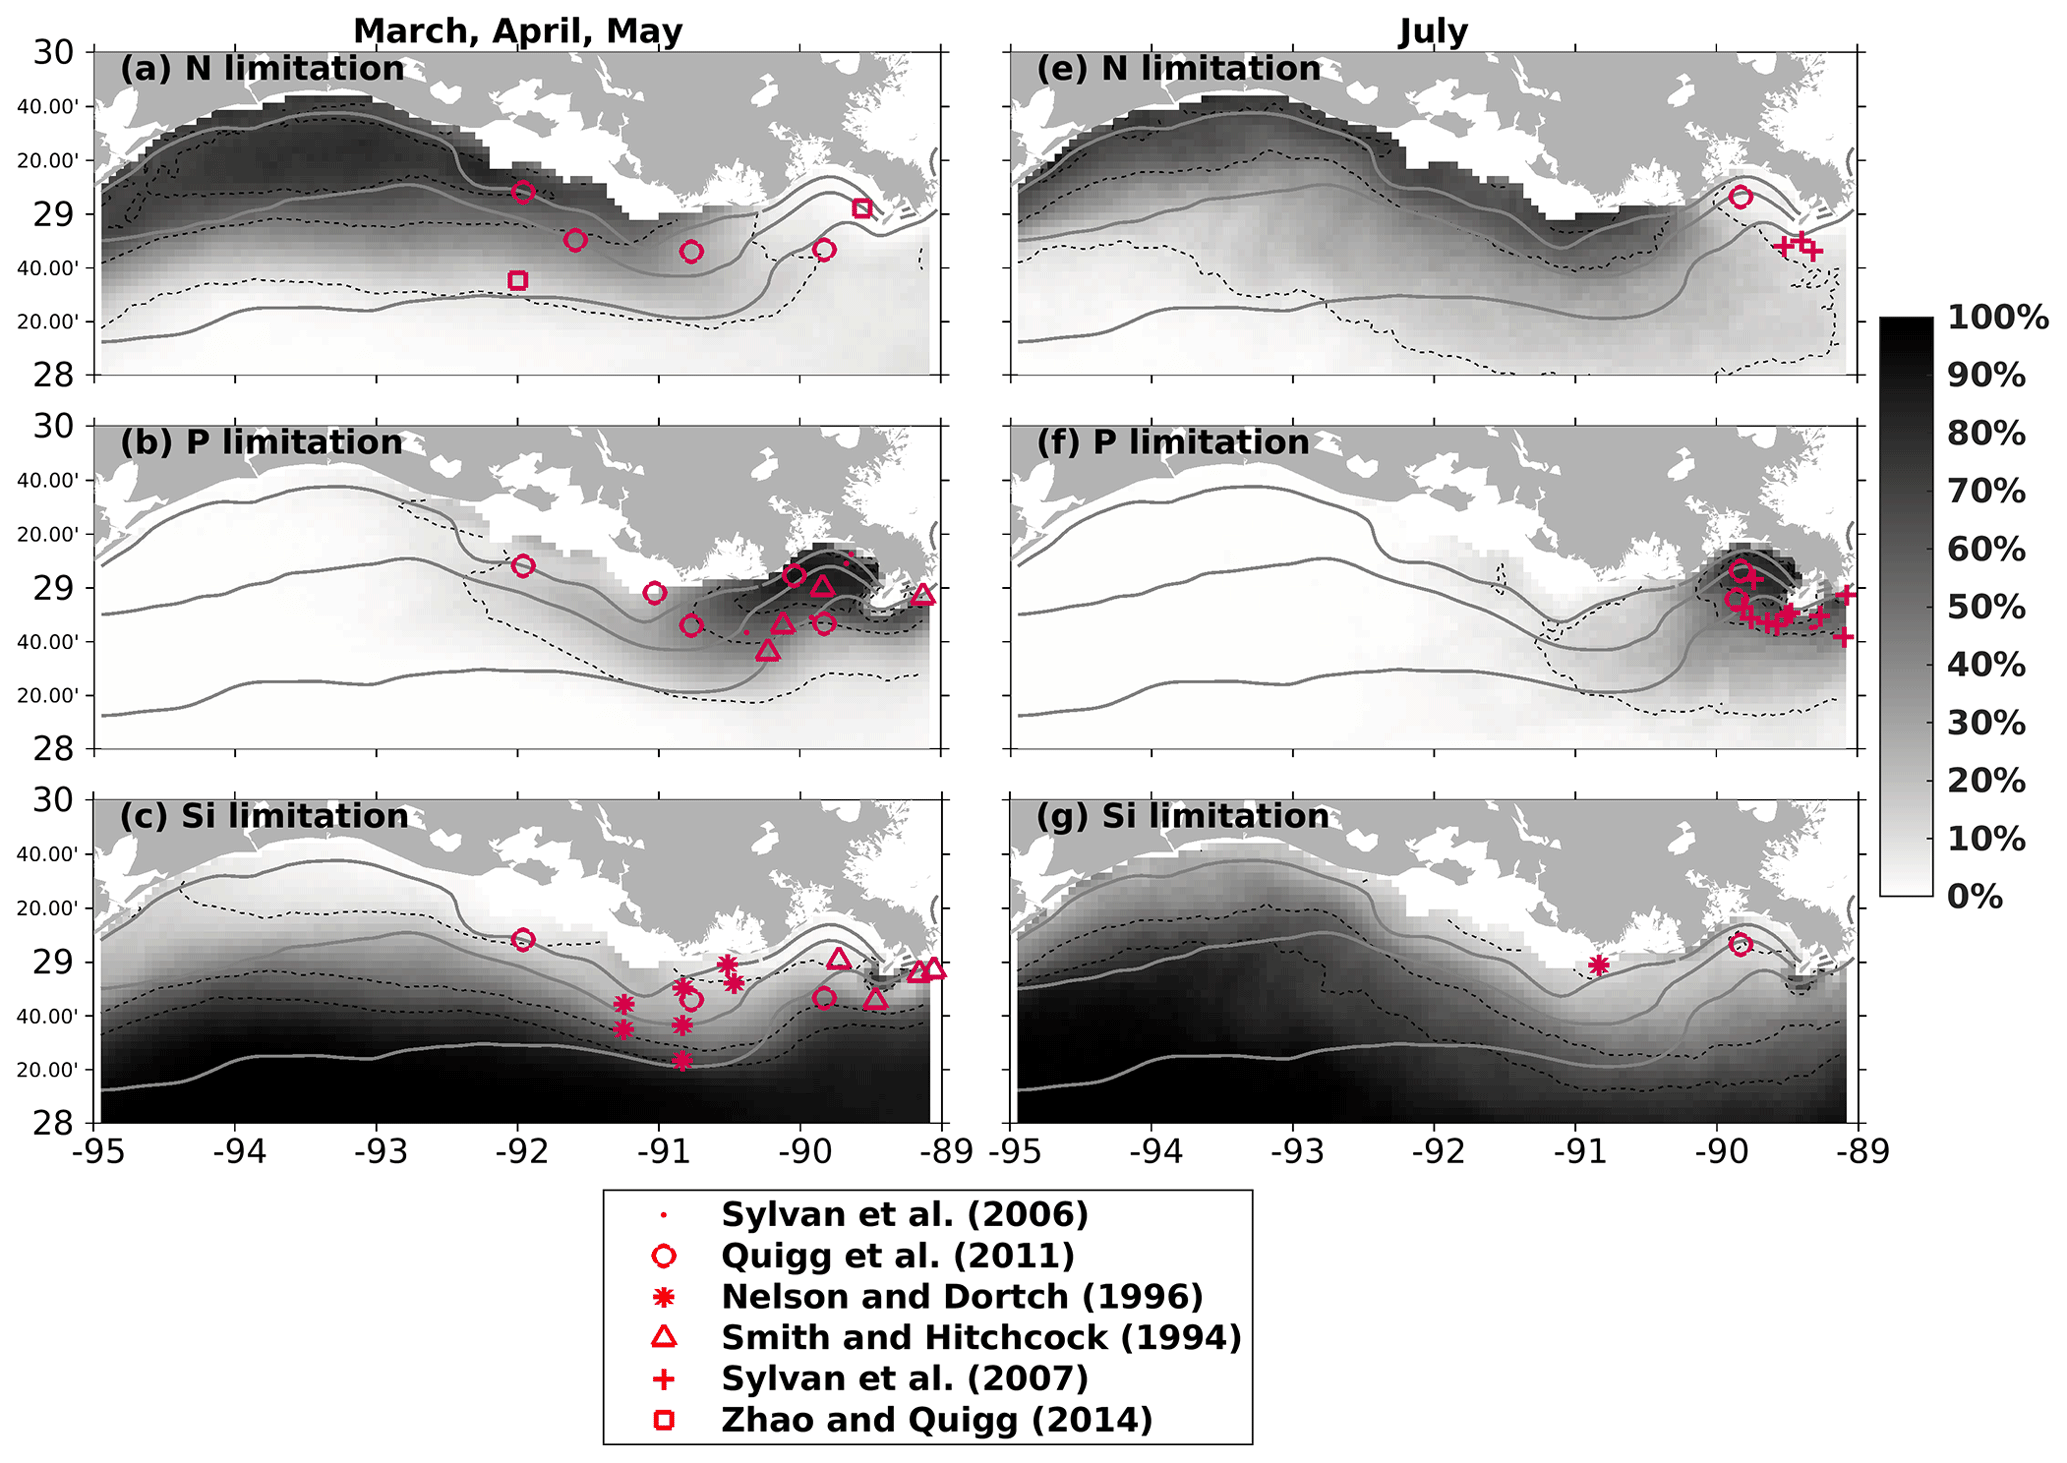
Figure 5Modeled nutrient limitation occurrences (in percentages) overlaid with locations of observed limited nutrients by bioassay studies in spring (a, b, c) and July (e, f, g). Modeled occurrences are obtained based on the entire simulation period (2007–2020). Solid gray lines indicate bathymetry of 10, 20, and 50 m, while dashed black lines represent the contour lines of 10 %, 50 %, and 70 %.
3.4 Diatom ratios
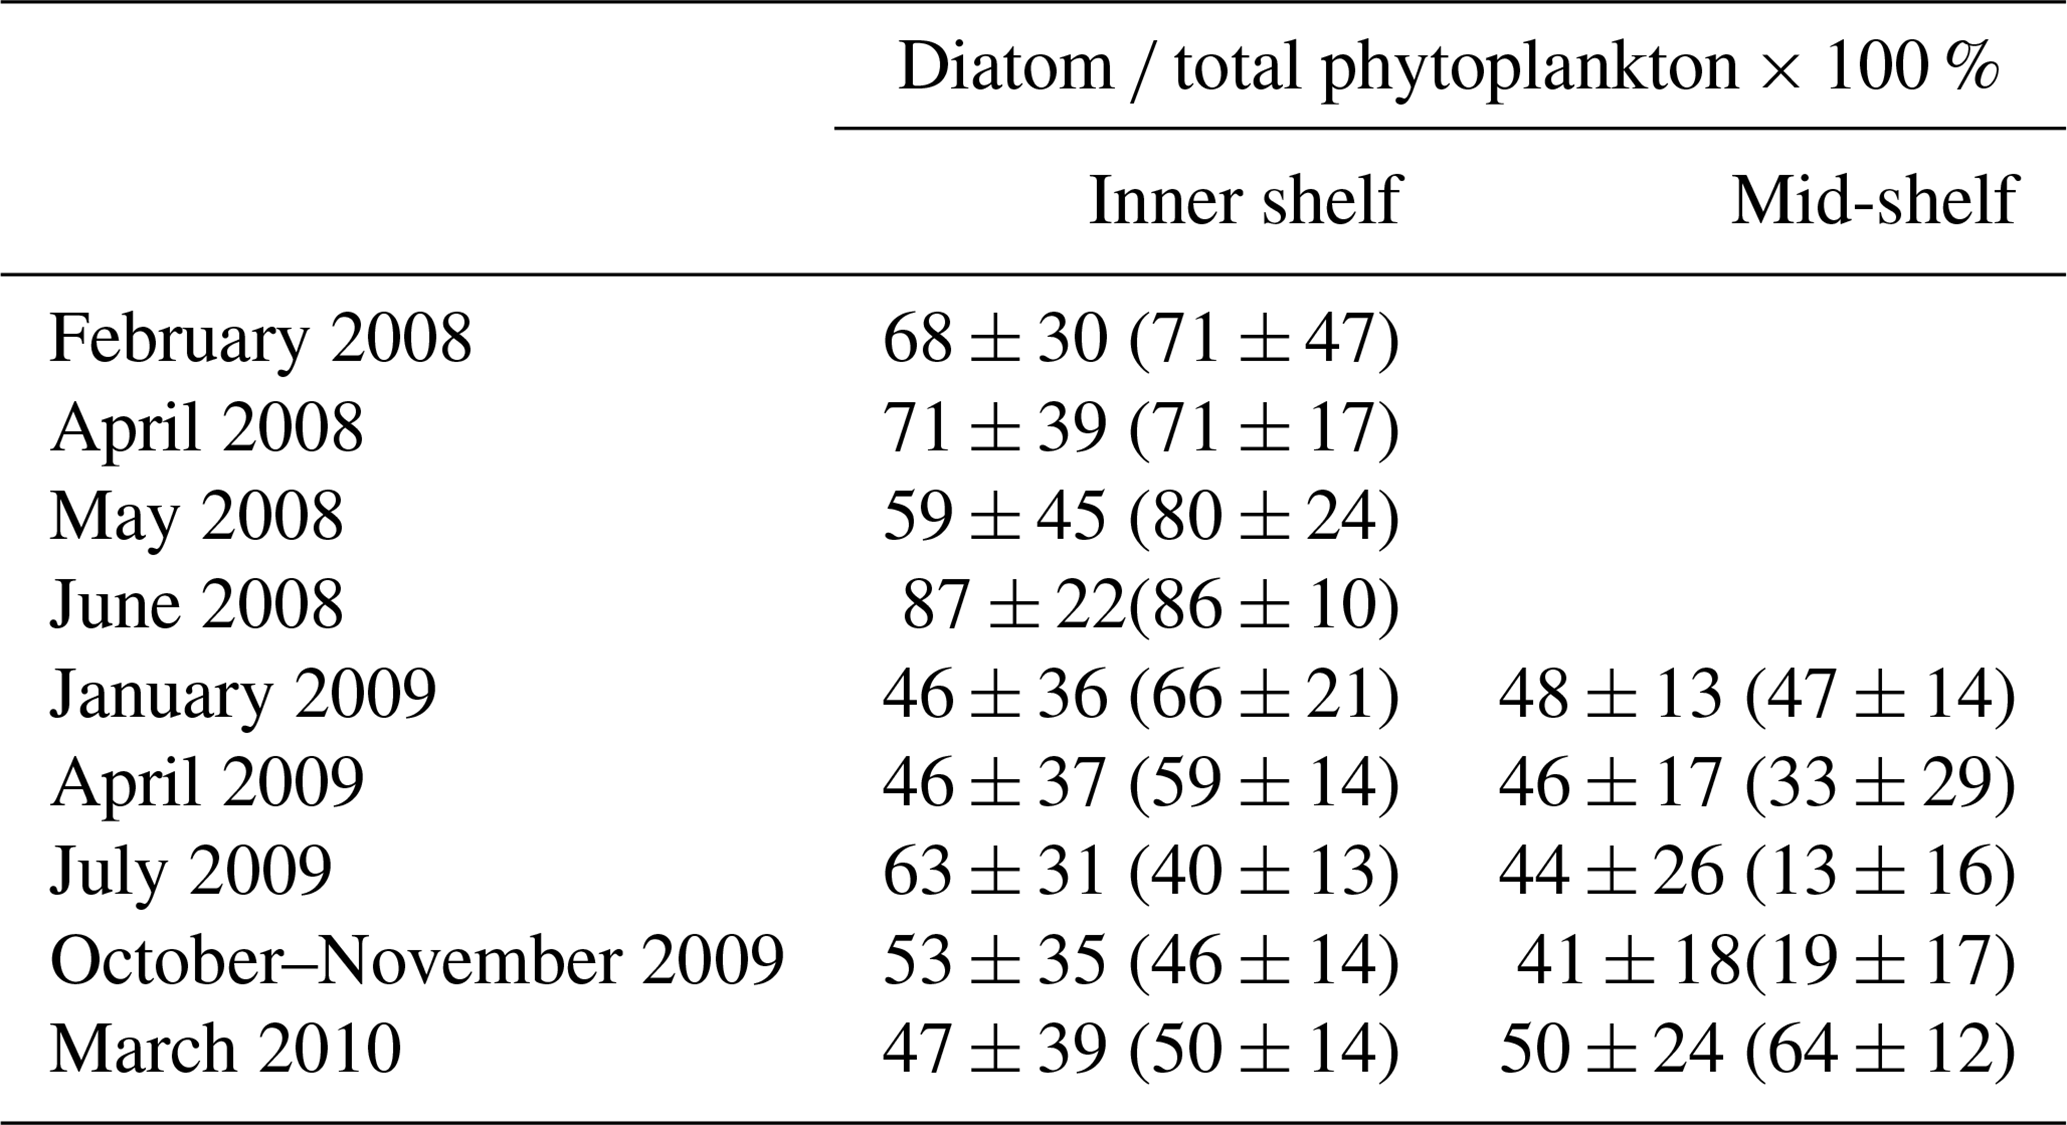
Cruise observations confirmed that diatoms are one of the dominant phytoplankton groups in the LaTex shelf (Schaeffer et al., 2012; Chakraborty and Lohrenz, 2015). When compared to the Schaeffer et al. (2012) measurements, vertical averages of PS and PL concentration over the surface at 0.5 m depth at the sampled points (black dots in Fig. C2) were extracted from the model hindcast. Statistics of modeled diatom ratios were derived from the daily ratios at the selected locations over the cruise months in 2008. When compared to the Chakraborty and Lohrenz (2015) measurements, we only calculated the modeled diatom ratios at the surface, middle, and bottom layers. Statistics of modeled ratios were given based on the daily ratios at these layers over the cruise regions (polygons shown in Fig. C2) and during cruise months in 2009 and 2010. The modeled ratios reasonably reproduced the measured ones in magnitudes, monthly variability, and cross-shelf variability (Table 1). During the cruise periods in 2008, the range of modeled diatom percentage (59 % to 87 %) matched the measurements well (71 % to 86 %) except for May 2008, when underestimations were found. In 2009, our model results agreed well with the measurements in inner-shelf waters but overestimated the measurements in the mid-shelf regions, especially in the summer and fall of 2009. The measured percentages exhibited salient monthly variations with higher values in winter and spring and lower ones in summer and fall. In the cross-shelf direction, the phytoplankton community shifted from highly diatom-dominated in the inner-shelf waters to less diatom-dominated in the mid-shelf waters, especially in summer. It should be noted that high uncertainty was found in the diatom ratio from both hindcast and measurements (comparable standard deviation against mean values). Therefore, model–measurement biases are expected when comparing statistics derived from a whole month (model hindcast) and a few days (cruise measurements). Then, the biases should be acceptable as the magnitudes of modeled and measured statistics are closed.
Table 1Comparison of simulated (mean ± 1 SD) and measured (mean ± 1 SD in parentheses) diatom percentage of the total phytoplankton. Note that the statistics for the simulated percentages were calculated based on concentration values over the cruise months and over regions that cover the cruise sampling locations (Fig. C2). The measured percentages by Schaeffer et al. (2012) (for measurements in 2008) were calculated based on biovolume values, while those by Chakraborty and Lohrenz (2015) (for measurements in 2009 and 2010) were given by chlorophyll a attributed to different phytoplankton groups.
3.5 SOC rates
Modeled SOC rates were compared against a laboratory incubation study by McCarthy et al. (2013) at five shelf sites (for the location see the Fig. 1 in that paper) using sediment and water samples collected during six cruises (i.e., July 2008, September 2008, January 2009, August 2009, May 2010, and May 2011). The modeled SOC was averaged over the cruise months for four shelf sites (i.e., F5, C6, B7, and MRM; Fig. 2b). Our model captured the SOC magnitude well. The model generally overestimated the SOC at all sites except for May 2010 at site C6 and August 2009 at site MRM (Fig. 6). The largest overestimations were found in September 2008 when measurements were carried out shortly after hurricanes Gustav and Ike. These measurements tended to provide a low SOC but a high water column respiration, possibly induced by the mixing incurred by storms. Note that the model results shown in Fig. 6 were averaged over an entire month because no exact cruise date information was reported in McCarthy et al. (2013).
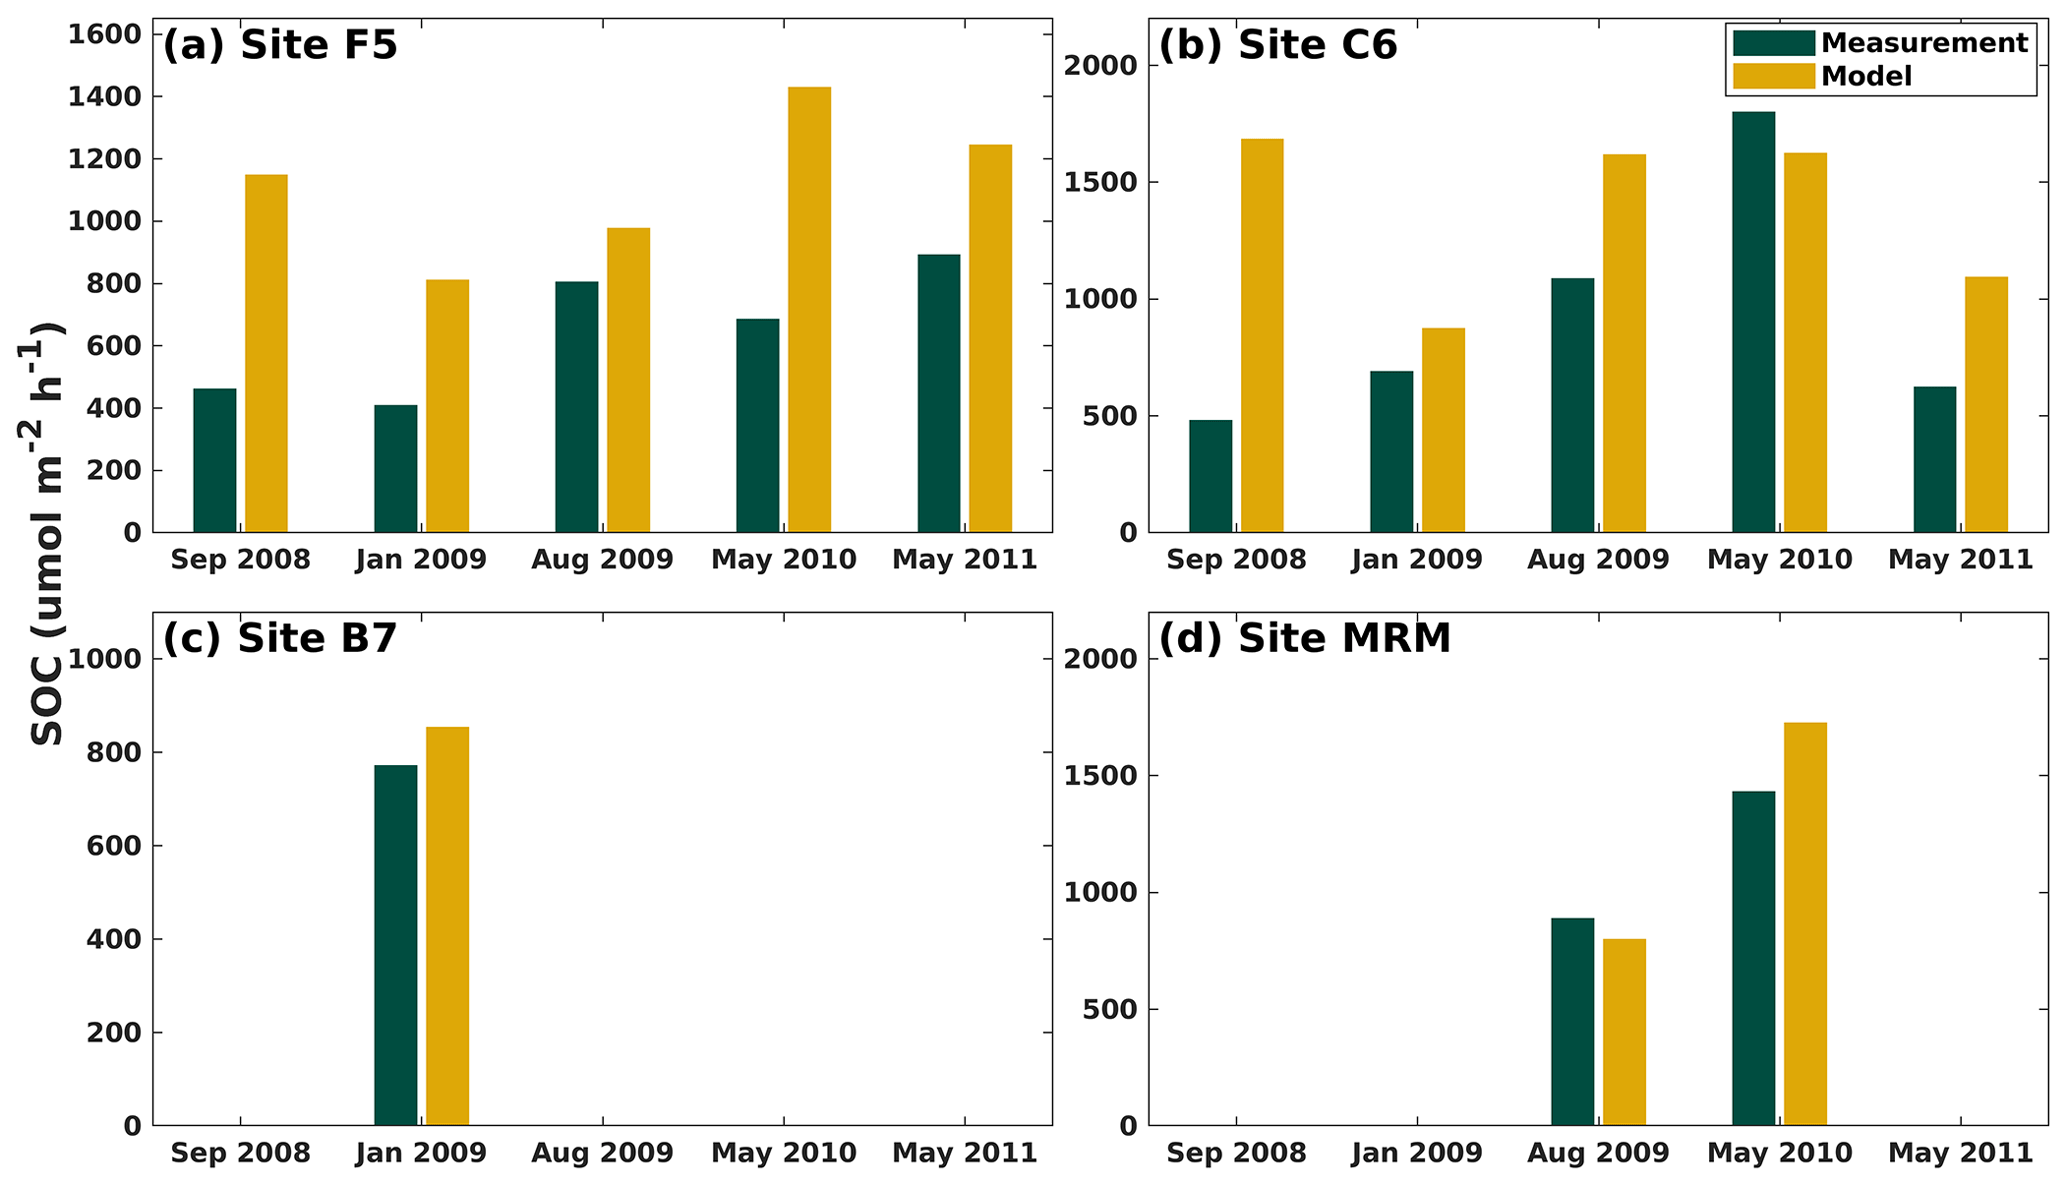
Figure 6Comparison of modeled and measured SOC (unit: µmol m−2 h−1) at four LaTex shelf sites (dark yellow dots in Fig. 2b). Note that the measurements are provided by the McCarthy et al. (2013) incubation study and the modeled SOC for each sampled site is averaged over the specific months.
3.6 DO profiles
Both the shelf-wide and SEAMAP cruise studies provide high-resolution measurements of DO profiles in the vertical direction, with the observed layers ranging from the surface to bottom. The number of observed layers is close to or even more than that of the modeled layers. Therefore, the observed DO profiles were interpolated to the modeled layers using the nearest interpolation method for the one-to-one comparisons between modeled and observed DO profiles. Mean, median, and 25–75th percentile ranges of the model–observation differences were derived and compared against normalized depths ranging from −1 (bottom) to 0 (surface) (Fig. 7). Most of the biases were within ± 1 mg L−1, indicating a robust model performance in reproducing DO profiles. We noticed that the model tended to overestimate the shelf-wide observed DO by more than 1 mg L−1 but less than 2 mg L−1 on average over the upper layers in shallow waters (Fig. 7a). When validating against the SEAMAP profiles, a wider range of biases was also found at near-surface layers of the shallower water (Fig. 7d) than in deeper waters (Fig. 7e and f). On the one hand, in shallow water, cruise measurements seldom resolved the vertical layers finer than the model where 36 layers were designed, which introduced biases when interpolating the measured profiles to the modeled layers. On the other hand, ROMS tends to overmix the water column in shallow water regardless of the vertical mixing parameterizations chosen (Robertson and Hartlipp, 2017). Despite the slight overestimations of DO profiles, our model results performed better than those of previous numerical studies. For example, DO concentration biases against profile measurements in Yu et al. (2015) were mostly within 2 mg L−1.
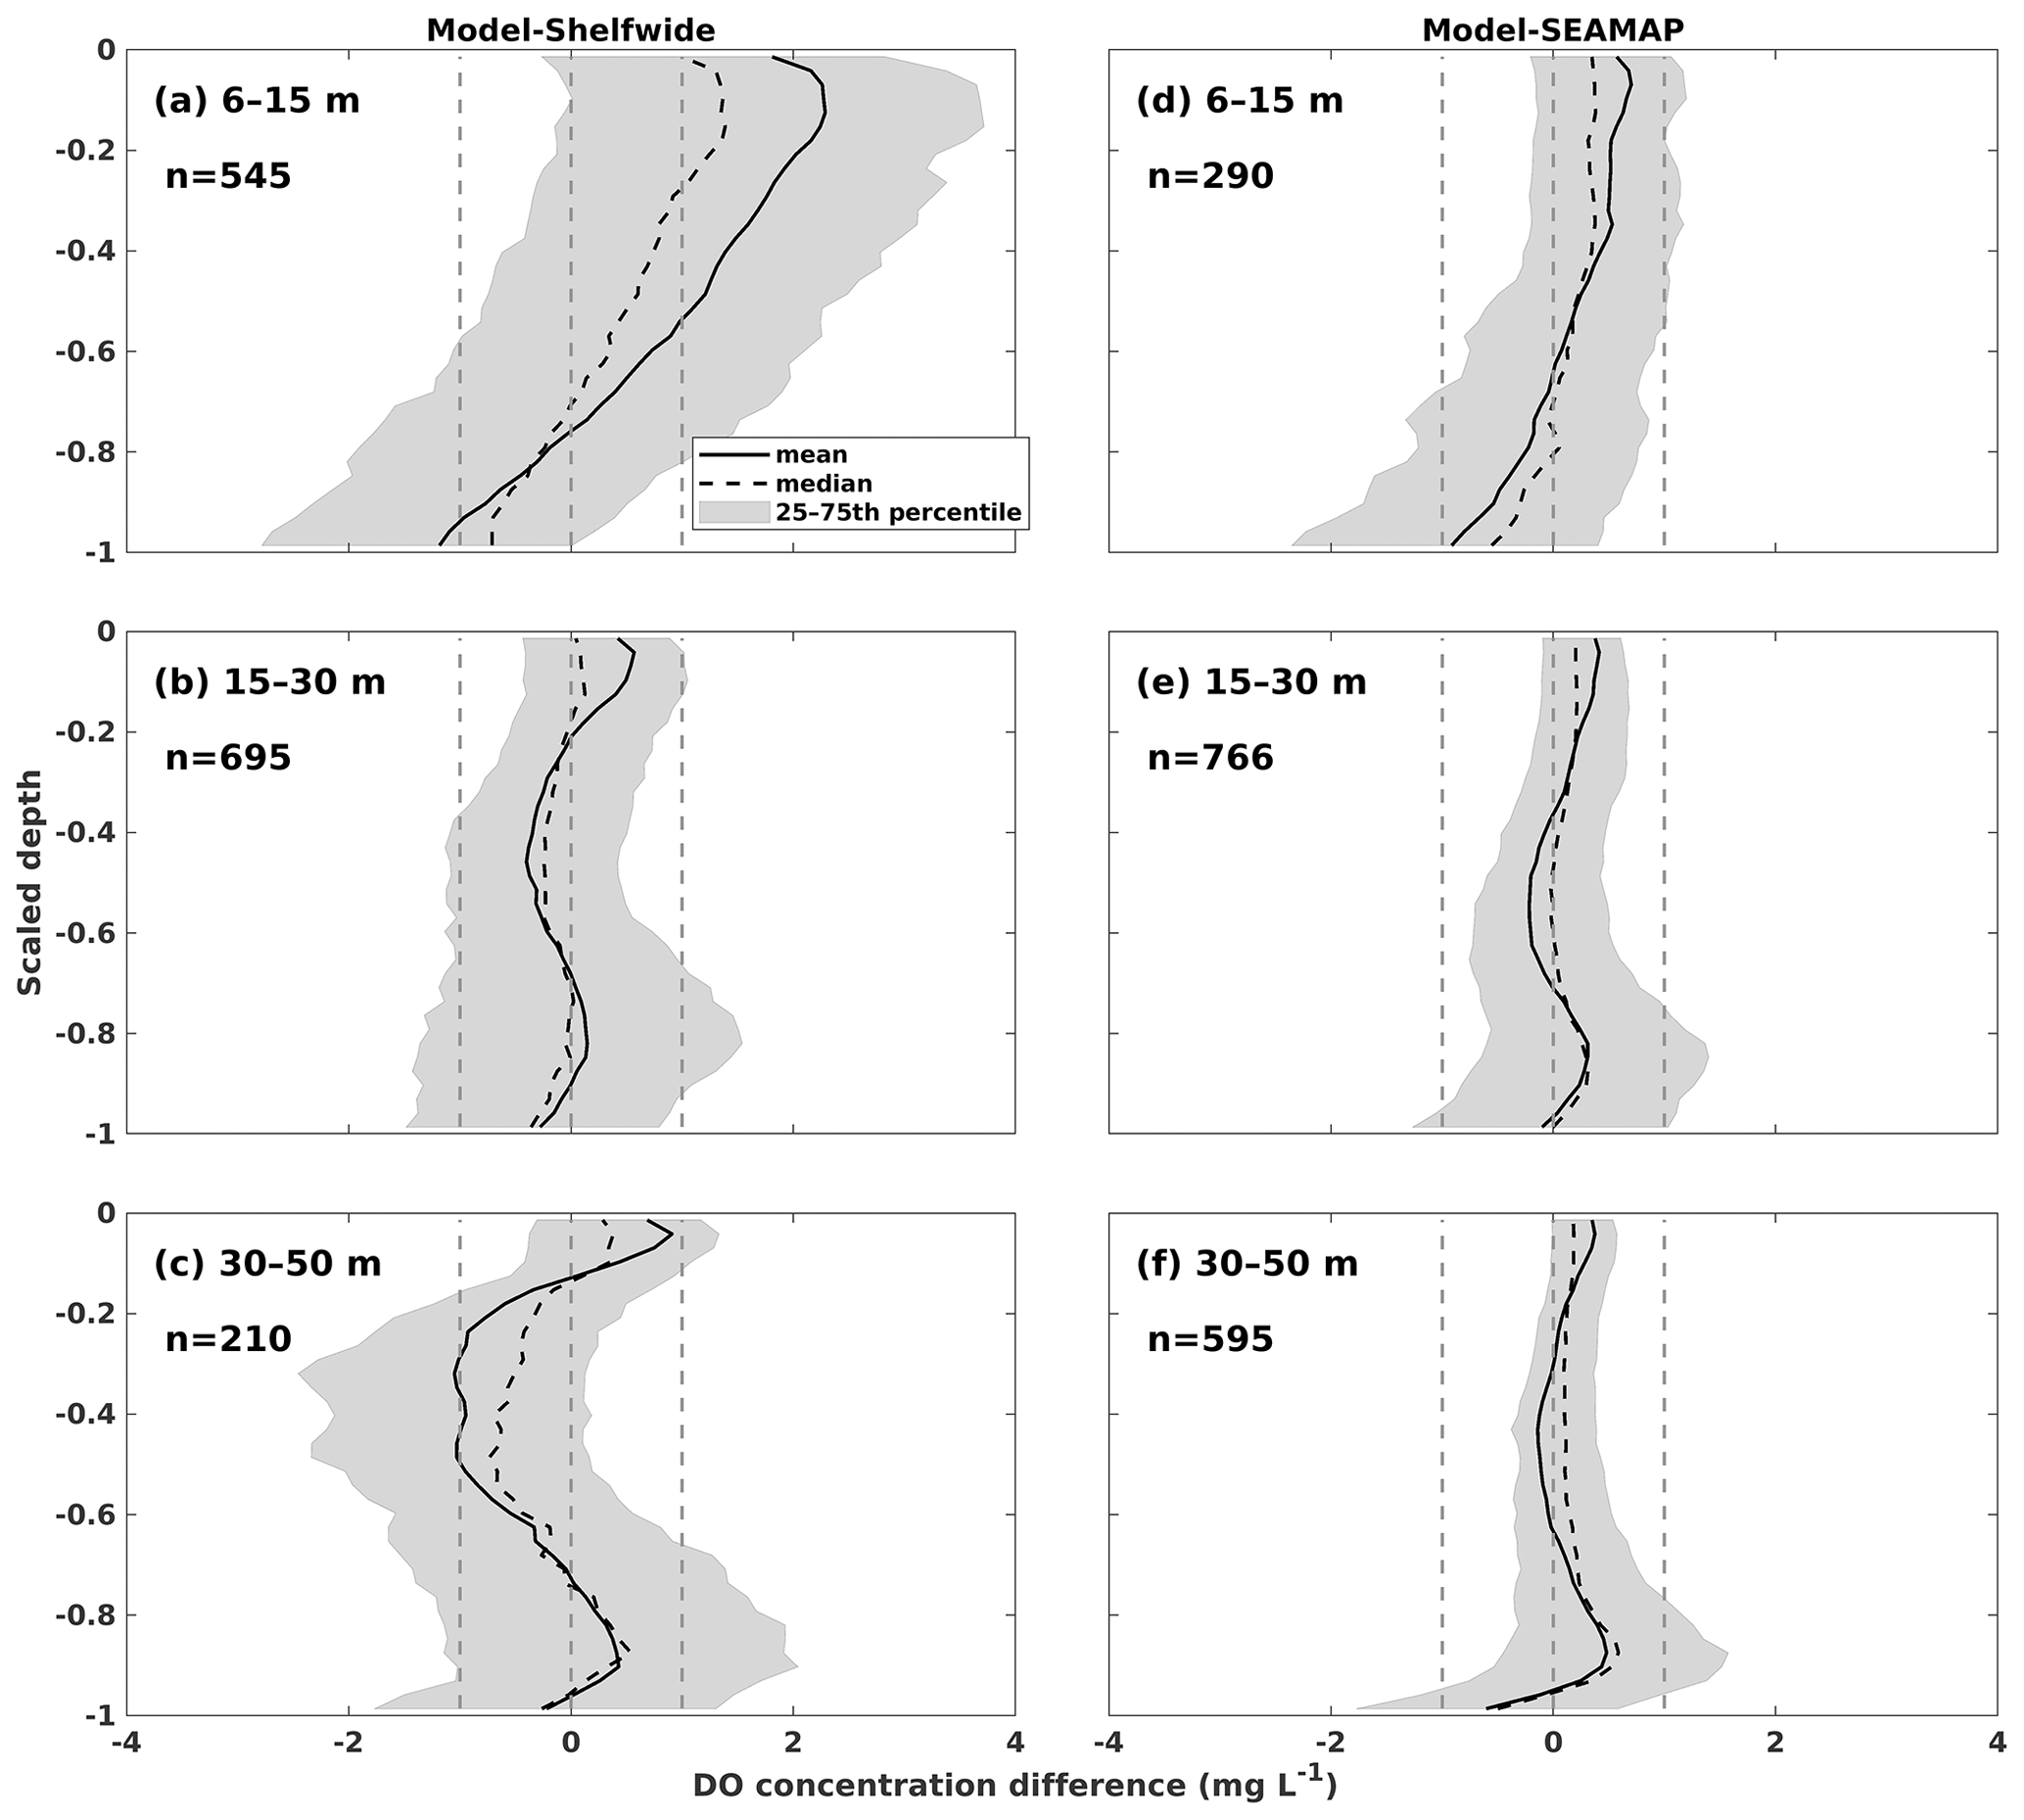
Figure 7Concentration difference statistics of DO profiles between model hindcasts and measurements by (a–c) NOAA's shelf-wide cruises and (d–f) SEAMAP. The statistics are derived from one-to-one differences between hindcasts and measurements for specific sampling locations and dates. The normalized depths of 0 and −1 represent the surface and bottom, respectively. The total counts (n) of profiles within different depth ranges are shown in each panel.
3.7 Spatial distributions of bottom DO and temporal variability of hypoxic area
As the annual NOAA shelf-wide cruises were conducted from the eastern shelf to the west in the summer, the model-simulated bottom DO was resampled following the cruise periods. For example, if the westernmost location of the cruise is 90° W on day 1, the simulated bottom DO concentration over the east of 90° W on that day is extracted. On the following day, if the westernmost location of the cruise is 91° W, the simulation between 91 and 90° W on day 2 is extracted, and so forth. All the extracted frames were blended to reconstruct the spatial distribution of simulated bottom DO concentration during the summer cruise period. Simulated results outside the LaTex shelf and over the deep (> 50 m) and shallow (< 6 m) water regions were excluded since observations were unavailable. Model results showed good agreement with the observations in terms of interannual variability and spatial extent of bottom hypoxic waters (Fig. 8). The spatial distribution of the hypoxic regions varied over different summers. For example, the hypoxic area was small and primarily restricted to nearshore (< 20 m) regions during the summers of 2007, 2009, 2012, 2014, and 2018. The size of the hypoxic zone was more prominent and extended offshore in 2008, 2011, 2013, and 2019. The spatial dispersion of hypoxic waters occurred mostly over the west of the LaTex shelf, where bathymetry gradients were gentle. Over the eastern shelf, the hypoxic water was mostly constrained within a narrow belt. These results suggest that the hypoxia development on the LaTex shelf was complex and generally followed the bathymetry and distances from the major river mouths.
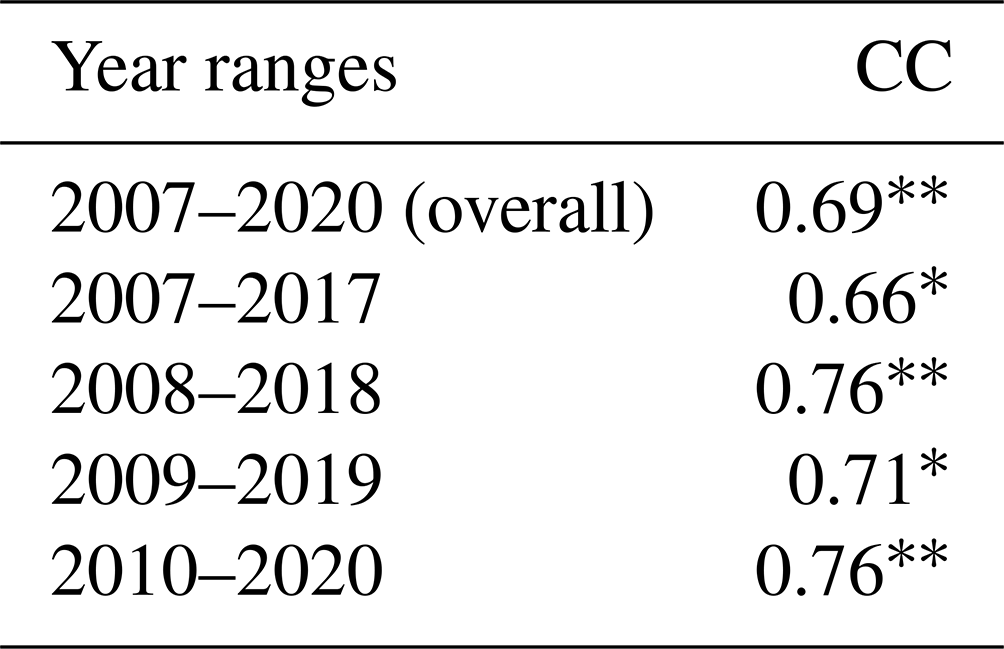
The daily time series of the size of the hypoxic zone was calculated over the LaTex shelf (6–50 m; Fig. 9). There was good agreement between simulated hypoxia zone size and that captured by the shelf-wide cruises in terms of variability and magnitude. The overall correlation coefficient (CC) was 0.69 over the 99 % significant level (Table 2). The 10-year running CCs ranged from 0.66 to 0.76, surpassing at least the 95 % significance threshold. Underestimations were found in 2007, 2008, and 2017 with a root mean squared error (RMSE) of 1693 km2, while there are overestimates in other summers of interest with RMSE = 8084 km2. The model performed an apparent overestimation for 2019 summer. Nevertheless, biases in other summers were acceptable, considering the relative sporadic converge of cruise data.
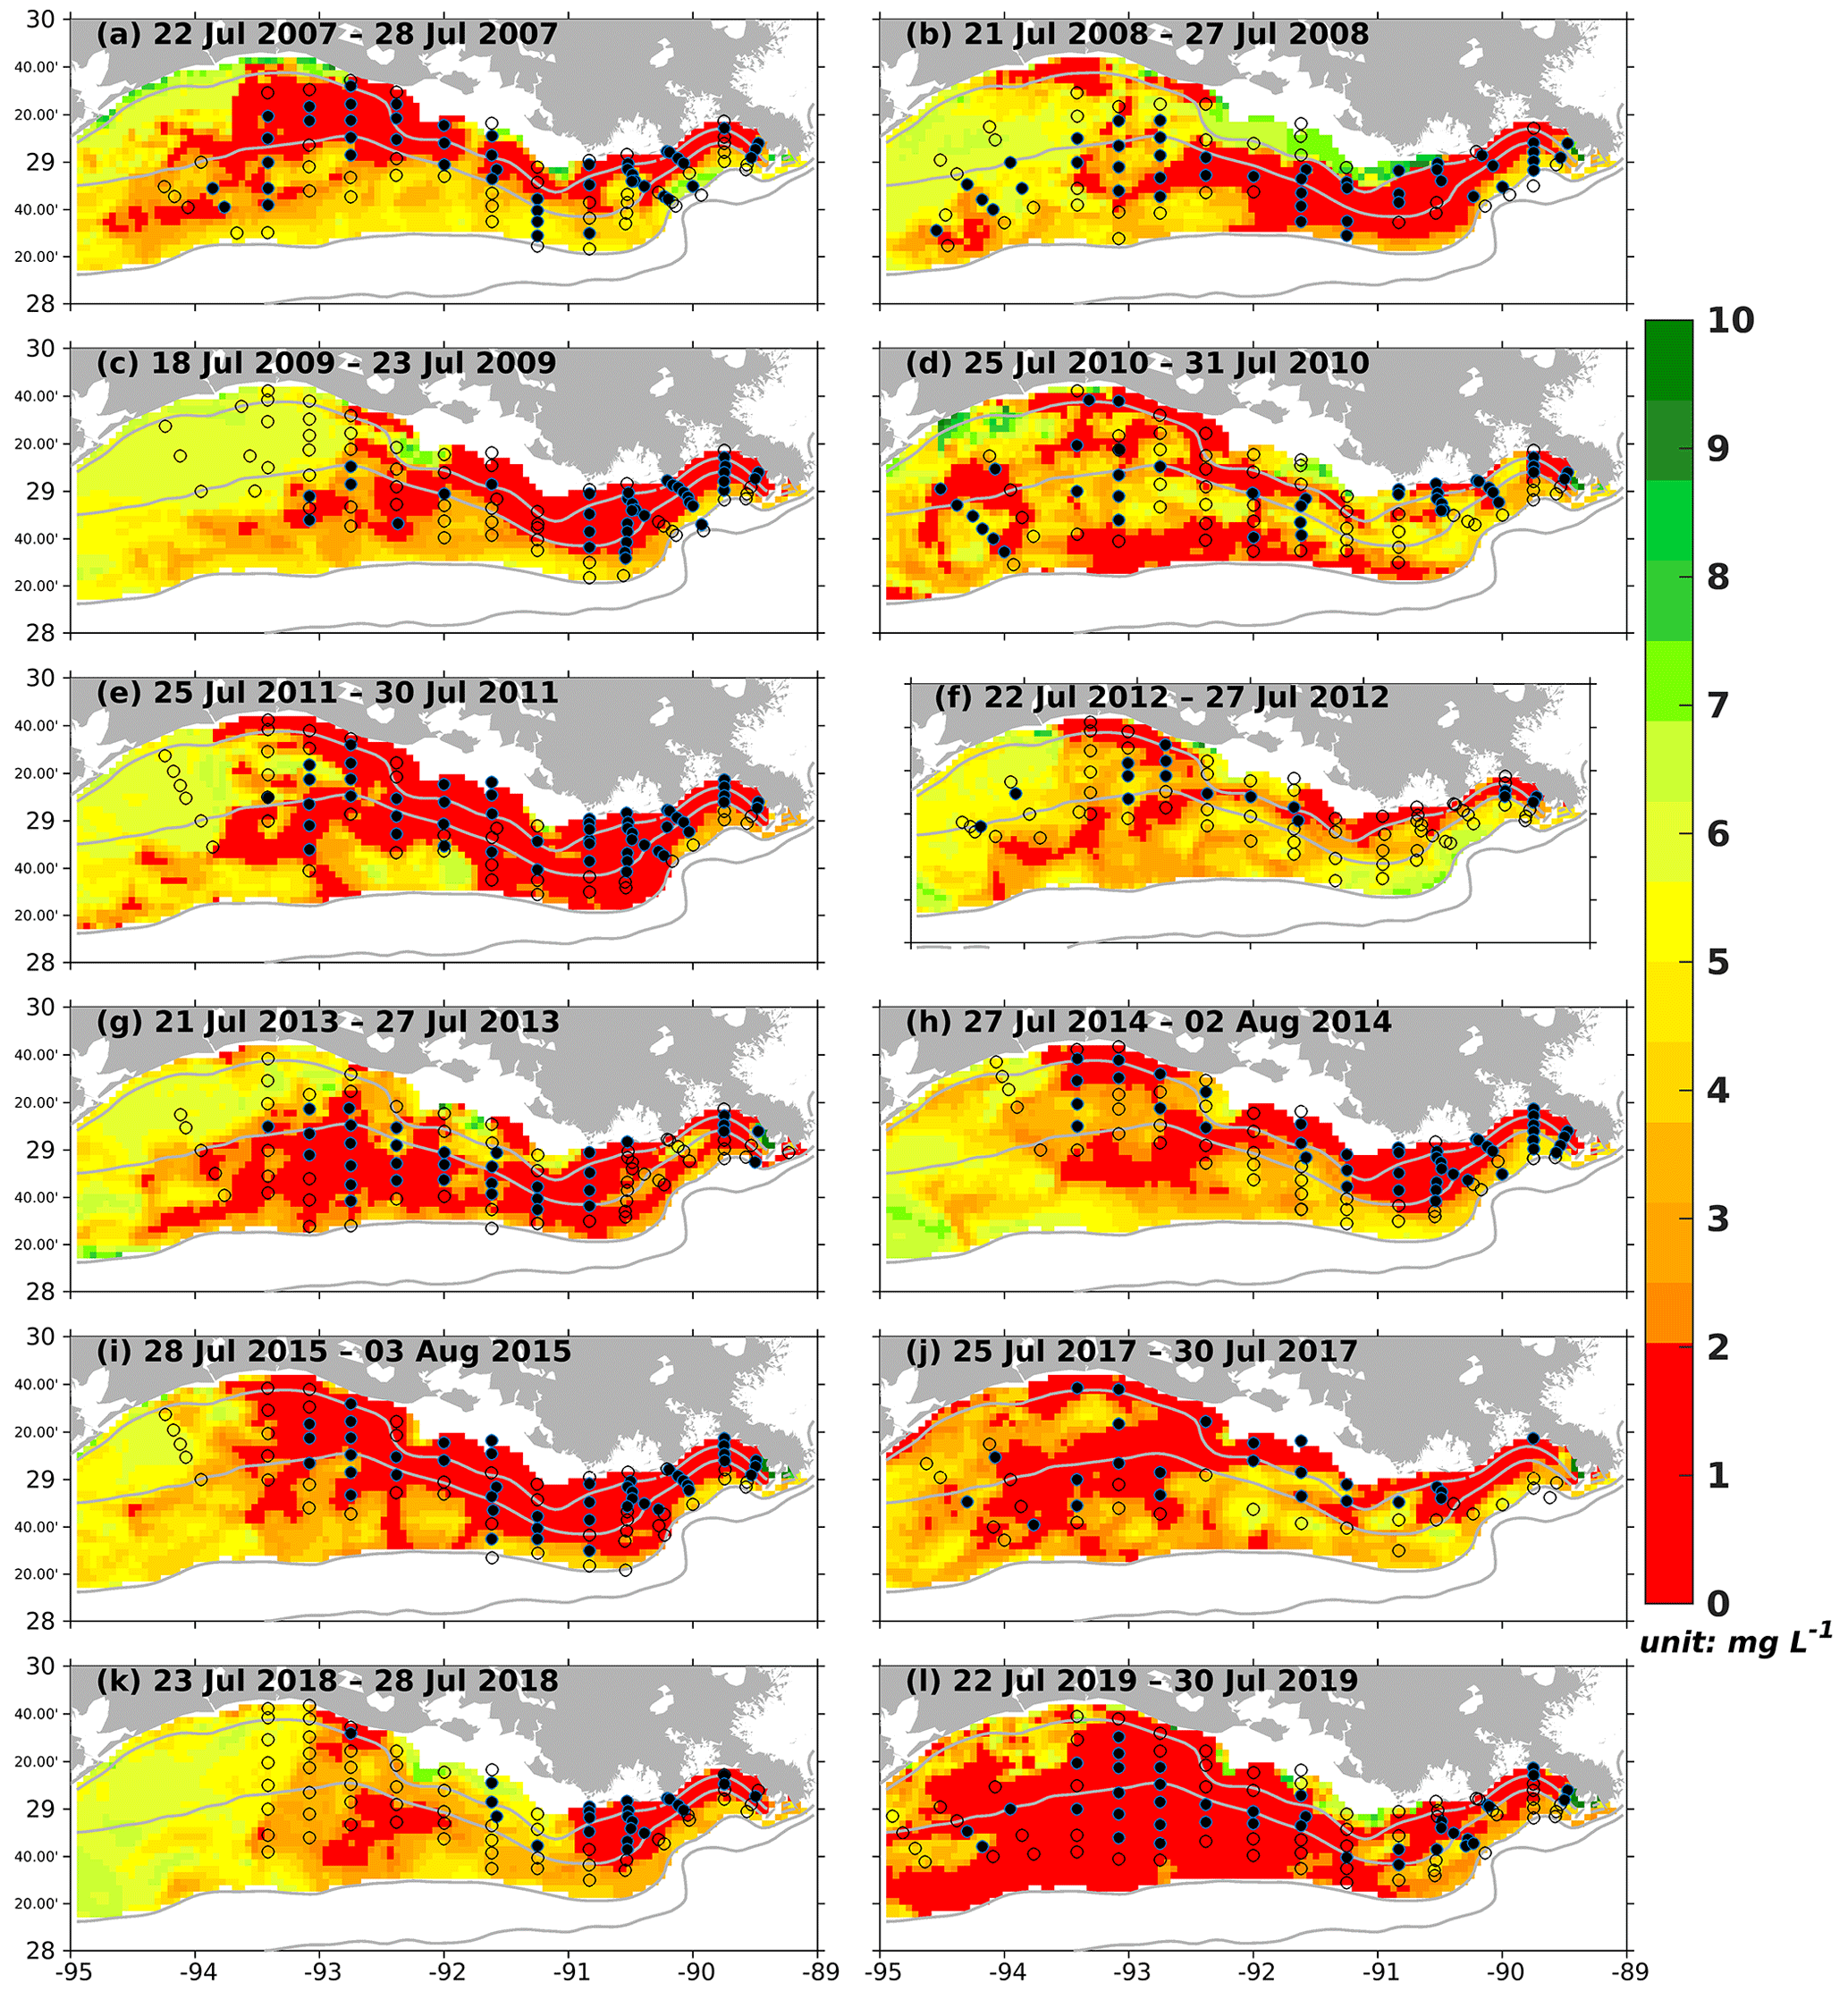
Figure 8Modeled summer bottom DO concentration (colored patches) and NOAA's summer shelf-wide hypoxia observations (black dots and open circles). The black dots and the open circles are indicators of observed bottom hypoxia and normoxia, respectively. The solid gray lines indicate bathymetry of 10, 20, 50, and 100 m.
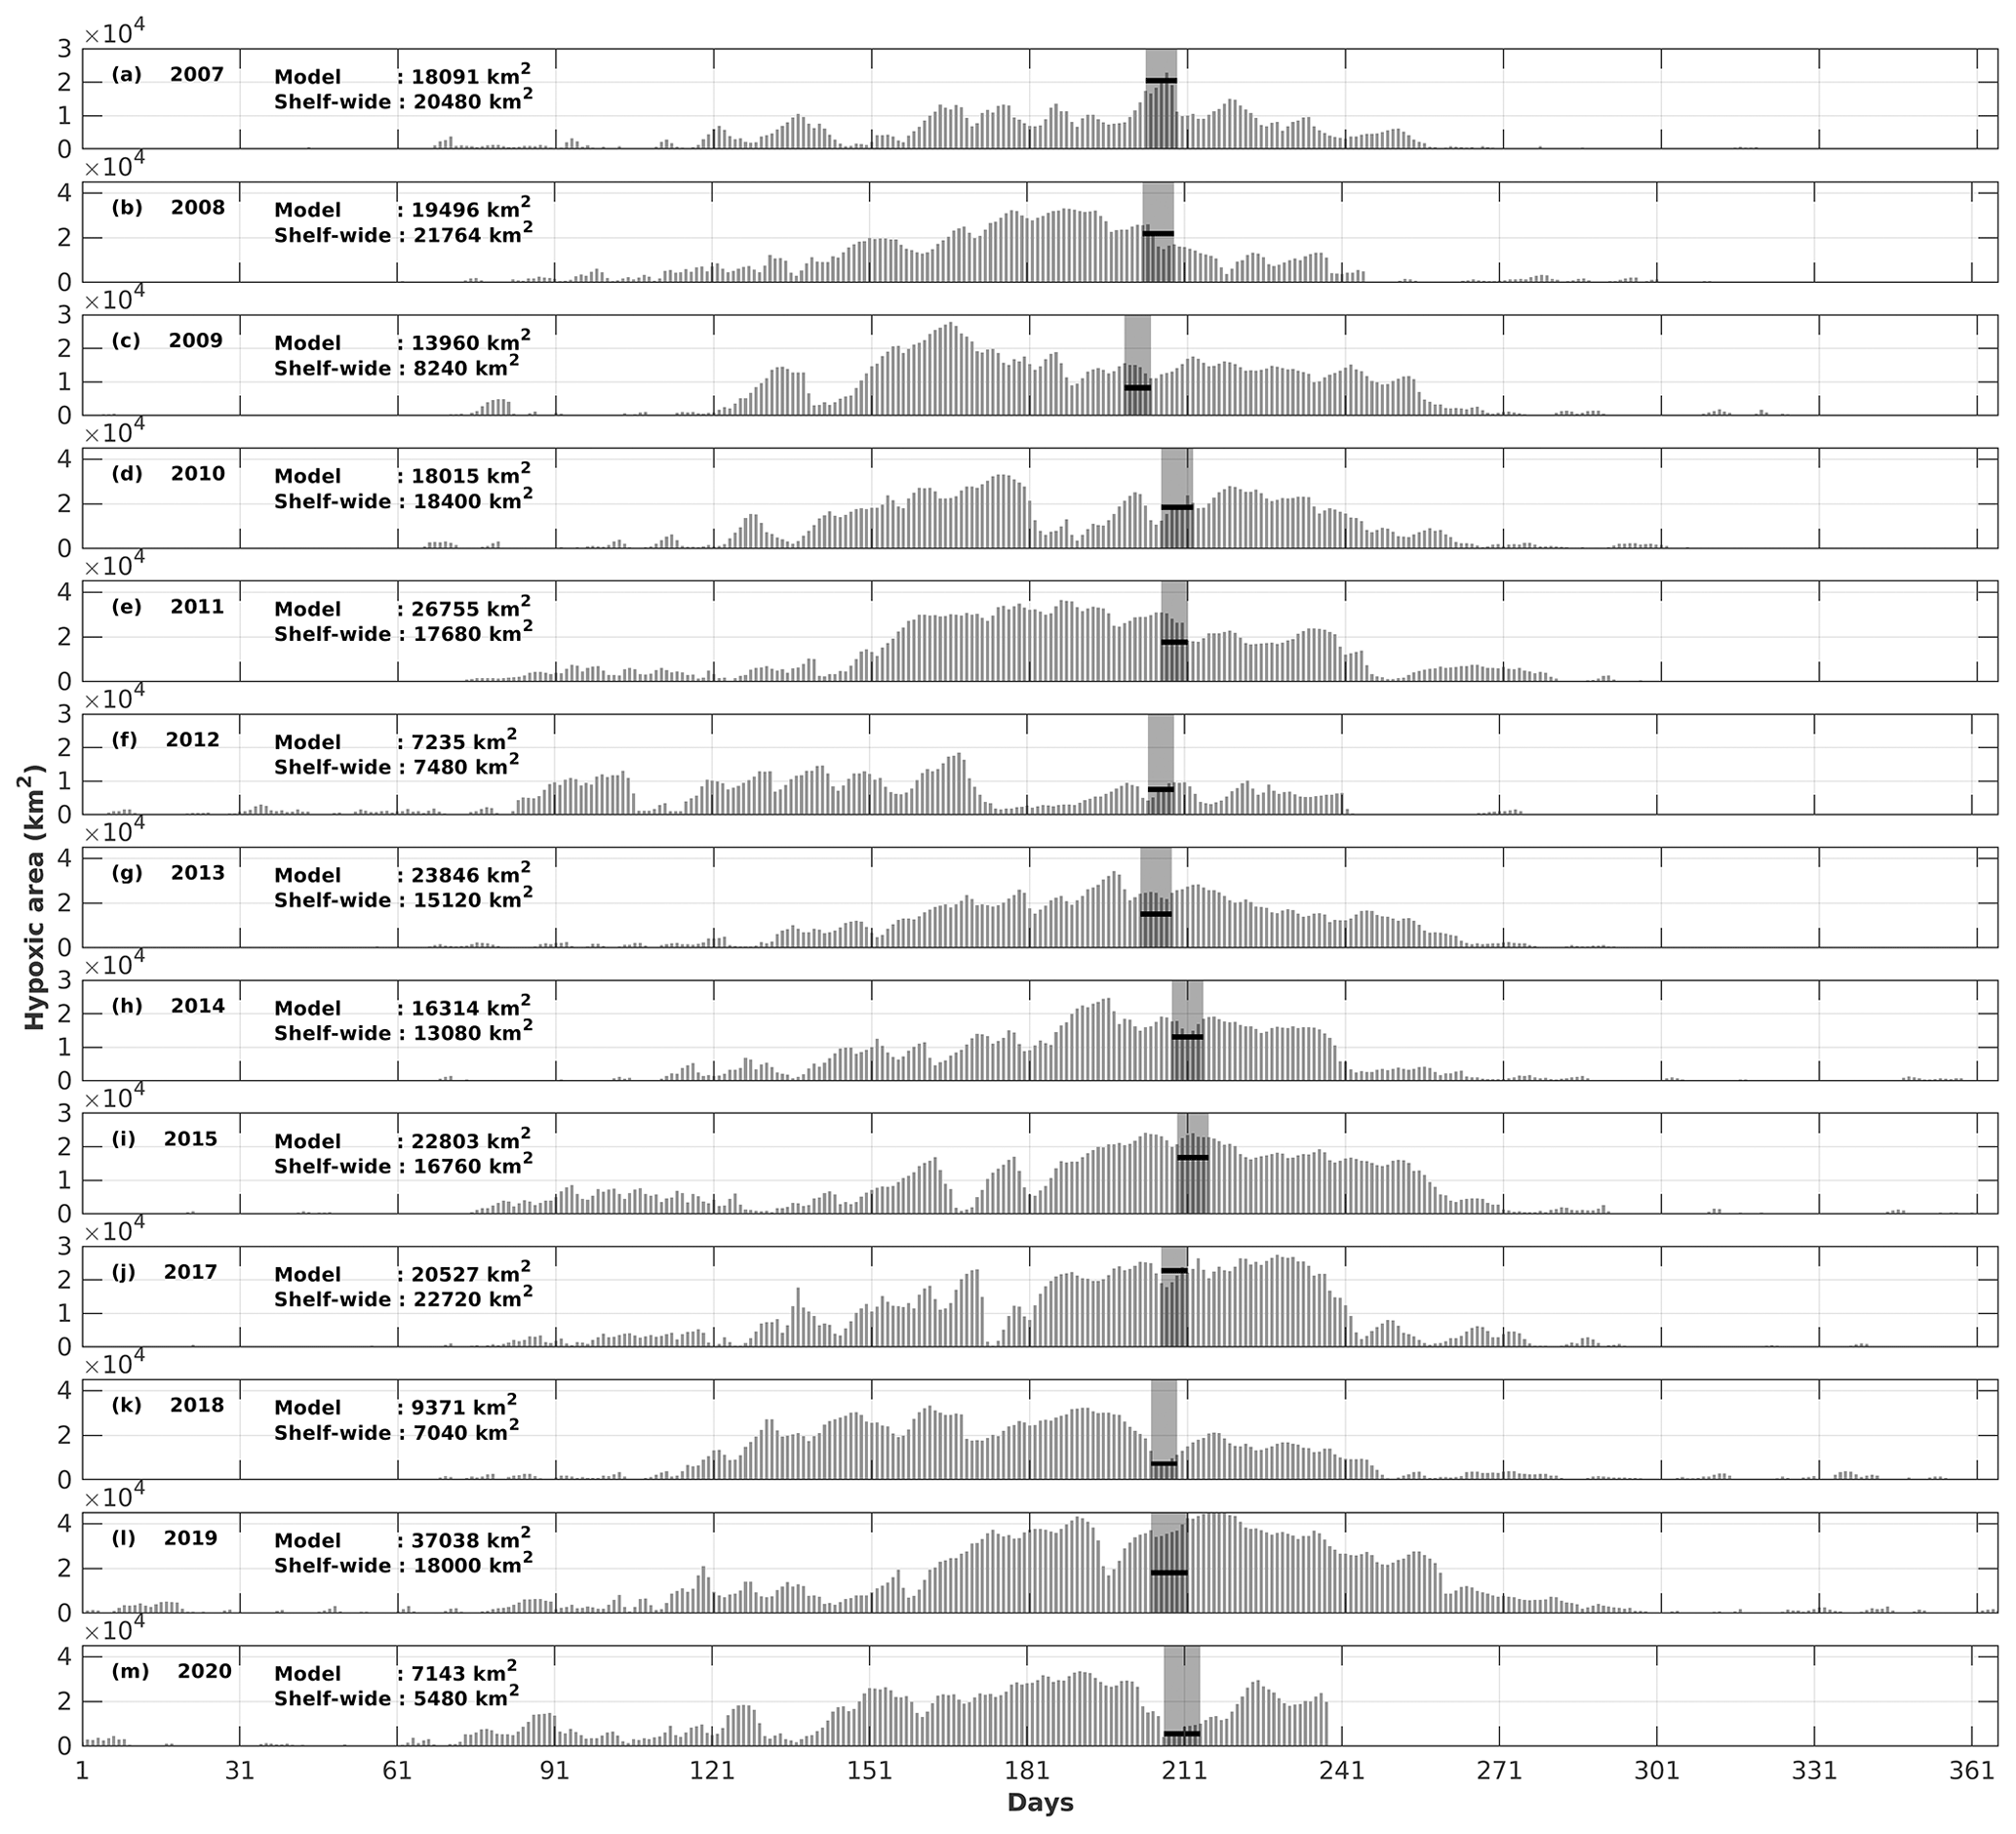
Figure 9Comparison of the hypoxic area (in km2) between model simulations and shelf-wide cruise observations from 2007 to 2020 (except 2016). The gray patches denote the cruise periods, while the solid black lines represent the measured hypoxic area.
Table 2The overall (2007–2020) and 10-year running correlation coefficients (CCs) of summer hypoxic area between model simulations and shelf-wide measurements. Note that the comparison in 2016 is excluded due to the lack of measurement. Superscripts * and indicate that the corresponding CCs are above the 95 % and 99 % significant levels, respectively.
4.1 Nutrient limitation
In this study, the riverine nutrient loads from the Mississippi and Atchafalaya rivers were calculated based on measurements from the USGS NWIS. During the investigated period (2007–2020), the riverine N : P ratio was higher than 16:1 during spring and reached its minimum in midsummer to early fall (Fig. 10a). It indicated that P limitation in the shelf could be more severe in spring than in midsummer and early fall (also seeing Fig. 5). Most riverine N : Si ratios fluctuated between 0.5 and 1 and were slightly higher in late spring and summer than in other seasons (Fig. 10b). The riverine N and Si loads were at a similar level when compared to the Redfield ratio of N : Si = 1:1. However, recent studies have pointed out that marine diatoms require a lower N : P : Si ratio (, Billen and Garnier, 2007; Royer, 2020), indicating that N may be more excessive over Si than previously thought. Riverine Si : P ratios were much higher than 16:1 and 20:1, suggesting that the major river systems transported excessive Si over P to the LaTex shelf. From the perspective of riverine supply, the plume's extent appeared to be more constrained by P availability (see Figs. 4–5) than by N and Si. The limitation effects of N and Si might be relatively similar, given that the N : Si ratio was around 16:20. However, the nutrient limitation is also related to the phytoplankton assimilation efficiency for nutrients (half-saturation coefficients for nutrient uptakes) and the water exchanges between the shelf and the adjacent waters.
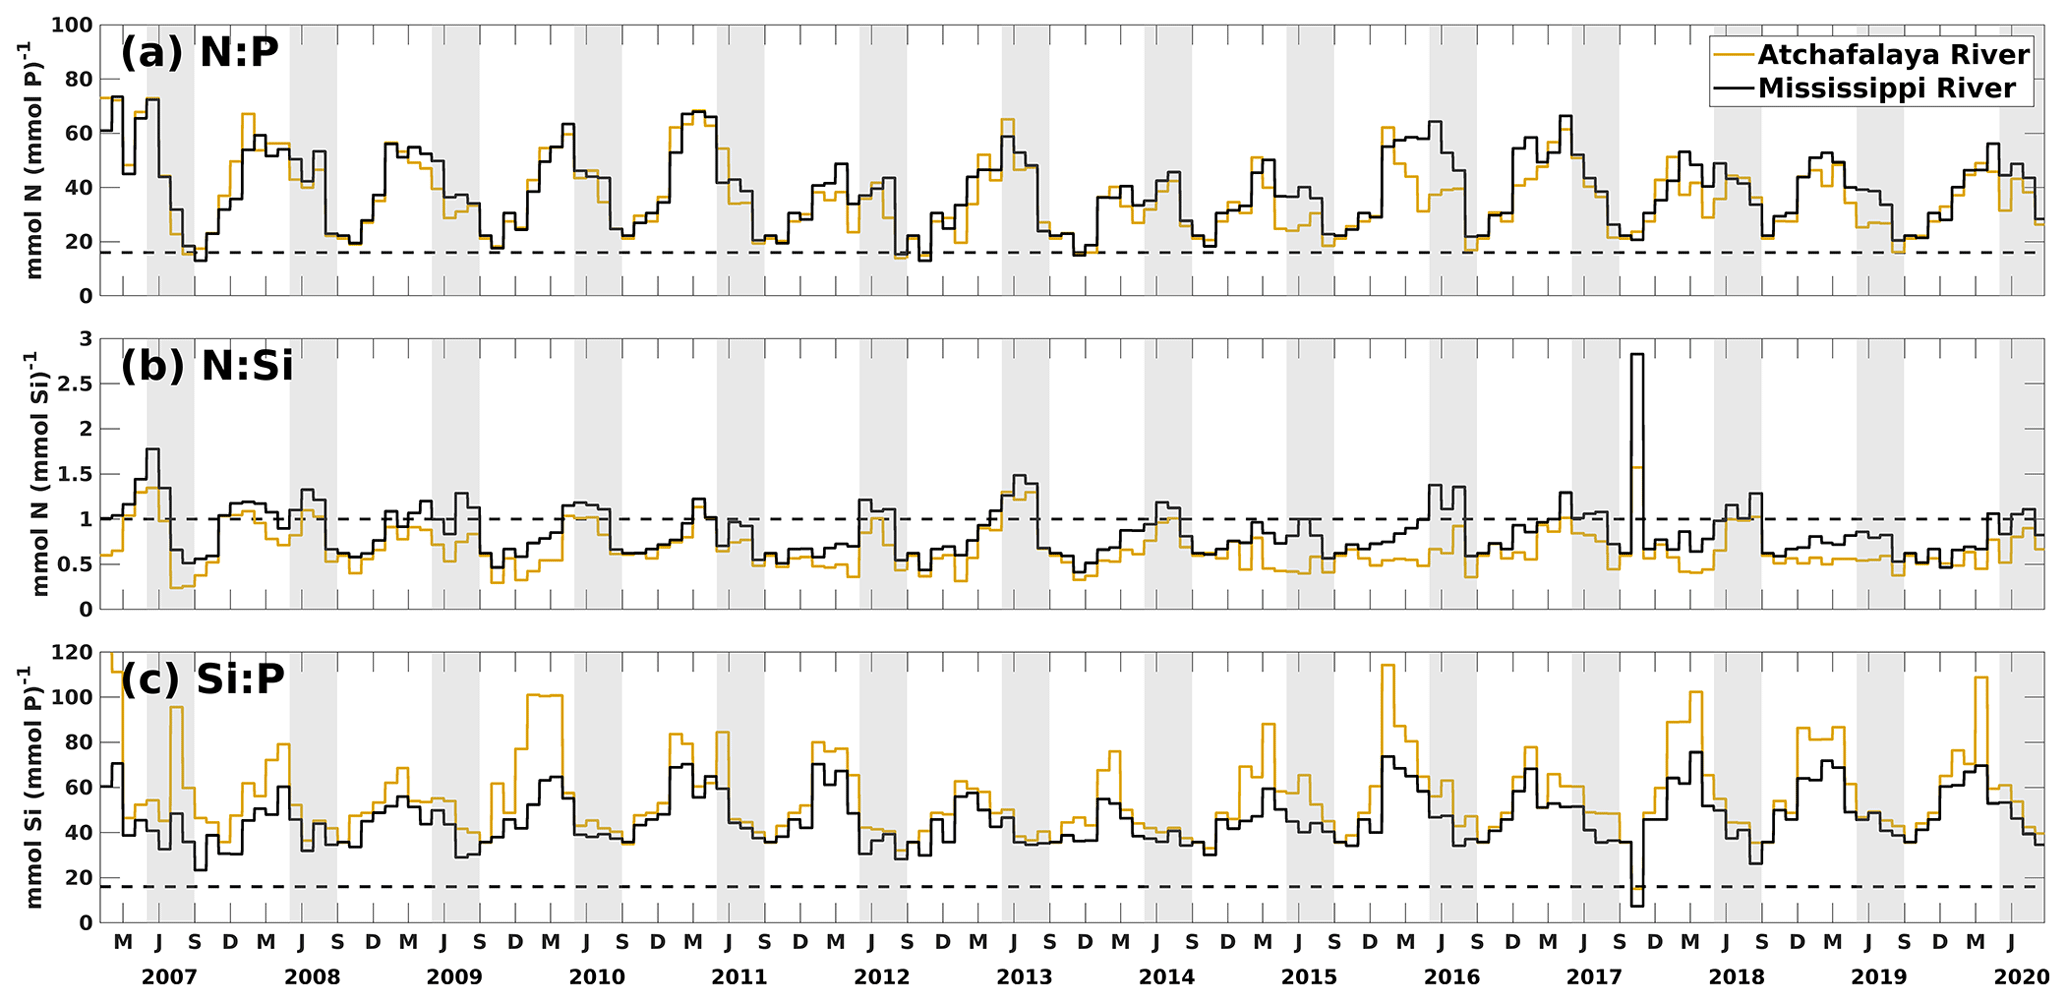
Figure 10Daily time series of ratios of nutrient loads from the Mississippi and Atchafalaya rivers. The dashed black lines denote the nutrient ratios of 16:1, 1:1, and 16:1 in (a), (b), and (c), respectively. The gray patches indicate the late spring and summer (May–August) each year. The capitalized letters M, J, S, and D on the x axis denote the first day of March, June, September, and December, respectively.
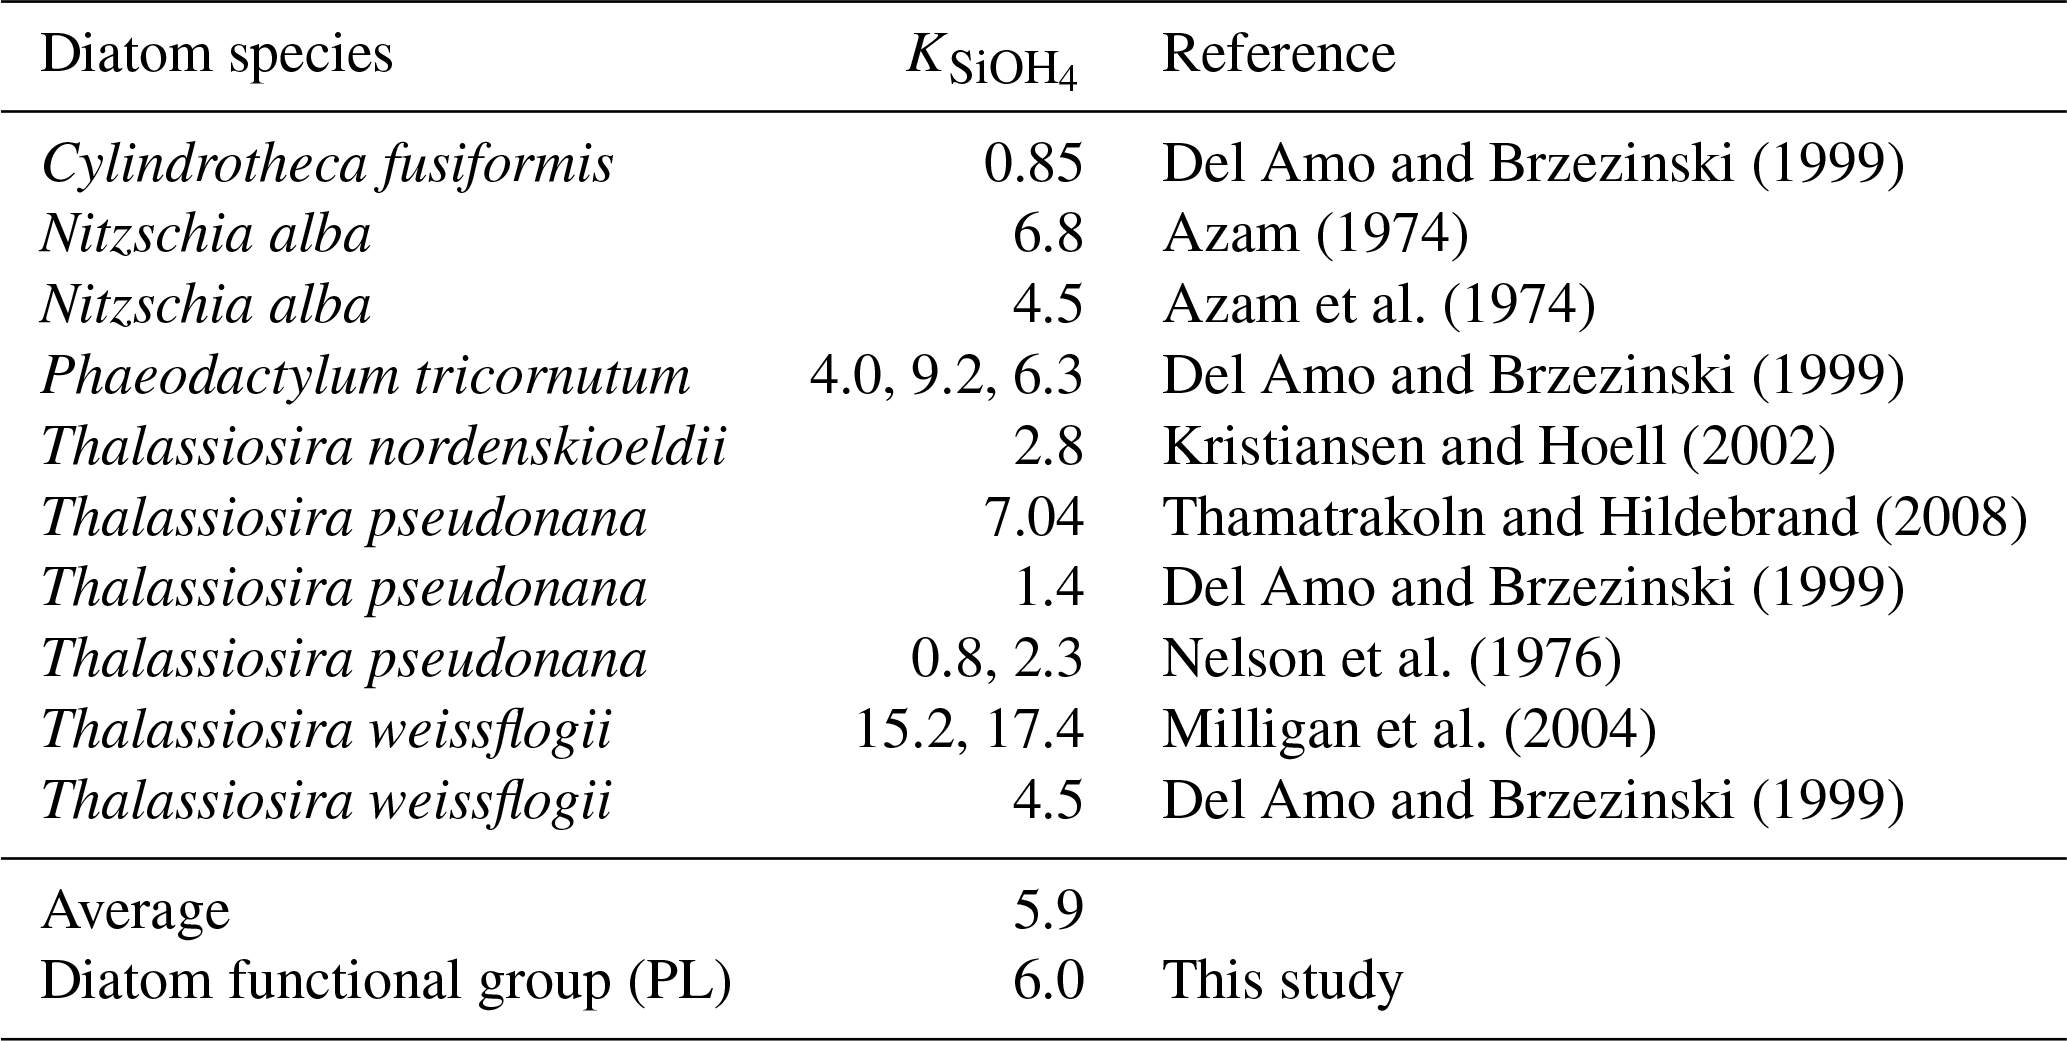
The half-saturation coefficient for phytoplankton nutrient uptake is a critical factor associated with nutrient limitation. In our model, PL was parameterized to be more competitive than PS in nutritious waters with a higher half-saturation coefficient. The half-saturation coefficients for NO3 and NH4 used in this model study (Table B4) followed the parameterization in Shropshire et al. (2020). The half-saturation coefficients for PO4 were set as 0.03125 mmol P m−3for PS and 0.1875 mmol P m−3 for PL, according to the Redfield stoichiometry of N : P = 16:1. This parameterization method was also applied in Laurent et al. (2012) for discussion of P limitation effects in the LaTex shelf. The half-saturation coefficient for Si(OH)4 () was set to be 6.0 mmol Si m−3, mirroring the choice in Shropshire et al. (2020), although there was no discussion on how this parameter was determined. Uptake kinetic studies for different marine diatom species have suggested a wide range of from 0.8 to 17.4 mmol Si m−3 (Table 3). The average, median, and first and third quartile of the measured coefficients in Table 3 were 5.9, 4.5, 2.3, and 7.0 mmol Si m−3, respectively. We opted for the average over the median coefficient in our model, considering the PL group to be a representative marine diatom assemblage. However, the for a diatom assemblage may shift given changing ambient silicate concentration. For example, as pointed out by Nelson and Dortch (1996), for the sampled phytoplankton assemblage (dominated by diatom species) remained low from 0.48 to 1.71 mmol Si m−3 when the ambient silicate concentration was low between 0.13 and 0.41 mmol Si m−3, but it increased to 5.29 mmol Si m−3 when the ambient silicate concentration was 4.72 mmol Si m−3. Along the Mississippi and Atchafalaya River plumes, which deliver silicate-rich waters to the shelf (average concentrations are 118 ± 23 and 116 ± 21 mmol m−3, respectively), the silicate concentration remains high, suggesting a high half-saturation coefficient. We acknowledge that a constant half-saturation coefficient cannot fully capture the dynamics of silicate and diatom outside the plumes, as indicated by Nelson and Dortch (1996). Further investigations and improvements in model parameterization for the dependency of on silicate concentration are needed in future studies.
Table 3Half-saturation coefficient (unit: mmol Si m−3) for silicate uptake by different diatom species according to multiple uptake kinetic studies.
The changing coastal wind and current systems during summer can lead to significant changes in nutrient distribution, alternating the growth of phytoplankton and summer hypoxia development. Here, we show three snapshots in August 2019 (Fig. 11) when seasonal hypoxia reached its maximum (Fig. 9) to demonstrate the highly varying shelf hydrodynamics and the resultant nutrient dispersion patterns. During spring, the westward alongshore current system dominated the LaTex shelf, while in summer, currents shifted eastward and southward, forming a clockwise circulation in the middle and western shelf (Fig. 11a). This shift not only pushed the river plume eastward but also allowed water intrusion from the west and deep gulf. Waters from the outer shelf were typically high in salinity and low in nutrient content with higher N : Si and lower Si : P ratios than local waters (Fig. 11c–e). Although silicate concentration remained high and was usually excessive in the plume area, the intrusion of deep gulf waters led to an enlarging Si limitation domain in the western LaTex shelf (Fig. 11f–g). The PL concentration and primary production (PS + PL) (Fig. 11h–j) in the western shelf decreased pronouncedly after the intrusion of Si-limited waters. Pronounced declines in PONsed concentration (Fig. 11k) in the shallow western shelf were also detected 5 d after the primary production decreased. The SOC was expected to decrease, which could relieve the summer bottom hypoxia in the shallow western shelf.
We also note that the upwelling system along the nearshore far western shelf (> 95° W) and the direct transport of PON from the west could affect the evolution of bottom hypoxia on the LaTex shelf. In the Northern Hemisphere, the clockwise circulation system was favorable for the development of coastal upwelling systems, which induced cooling at the surface along the coast (Fig. 11b) and led to elevated concentrations of surface inorganic nitrogen, phosphate, and silicate along the nearshore western shelf. Total surface primary production remained high roughly along the 20 m isobath, where the water column PON concentration was also elevated. The clockwise circulation system carried the PON offshore and northeastward to the LaTex shelf, inducing an increase in the PONsed pool (around 28° N; Fig. 11k) and SOC. The high alongshore production was limited by N rather than Si or P. However, the N limitation band narrowed around the coastal upwelling zones. Such patterns – including low-Si water intrusion, eastward transport of PON, and a narrow N limitation band in the upwelling zone – were also found in other summer snapshots when the current system changed (e.g., Fig. C3).
Previous bioassay studies suggested the potential Si limitation on the LaTex shelf (Quigg et al., 2011; Nelson and Dortch, 1996; Smith and Hitchcock, 1994; Lohrenz et al., 1999). However, N and P limitations were reported more frequently than Si limitations along the shelf. Part of the reason was that samples collected in previous studies were mainly from the eastern shelf, where N and P typically appeared to be limited. Our understanding of potential nutrient limitations, particularly in the western shelf during the recent decade, still needs to be completed. Nevertheless, this lack of in situ data should not hinder model developments, as indirect evidence supports the potential Si limitation in the western shelf, especially during the summer. For instance, a recent study using in situ incubations and laboratory experiments showed that the oligotrophic open gulf, generally low in N, could also be Si-limited, as indicated by lower maximum growth rates of diatoms compared to other culture and field measurements (Yingling et al., 2022). Additionally, earlier concentration measurements (Dortch and Whitledge, 1992) showed that Si limitation sometimes overwhelmed the N limitation in the deep gulf waters (depth > 50 m). Water exchanges between the LaTex shelf and adjacent deep waters become more pronounced in summer with changes in wind and current systems. The intrusion of low-Si waters can promote the development and expansion of Si limitation, which in turn affects the phytoplankton community and oxygen dynamics. Therefore, the accuracy of the boundary conditions along the LaTex shelf is crucial in biogeochemical modeling. Indeed, earlier numerical studies (e.g., Fennel et al., 2013) emphasized the significance of the correct physical boundary conditions for hypoxia modeling. Our results further illustrate that biogeochemical boundary conditions, such as nutrient concentrations, are as critical as river forcings in influencing the shelf's nutrient distribution, plankton, and oxygen dynamics. These effects have yet to be addressed in numerical studies of the LaTex shelf.
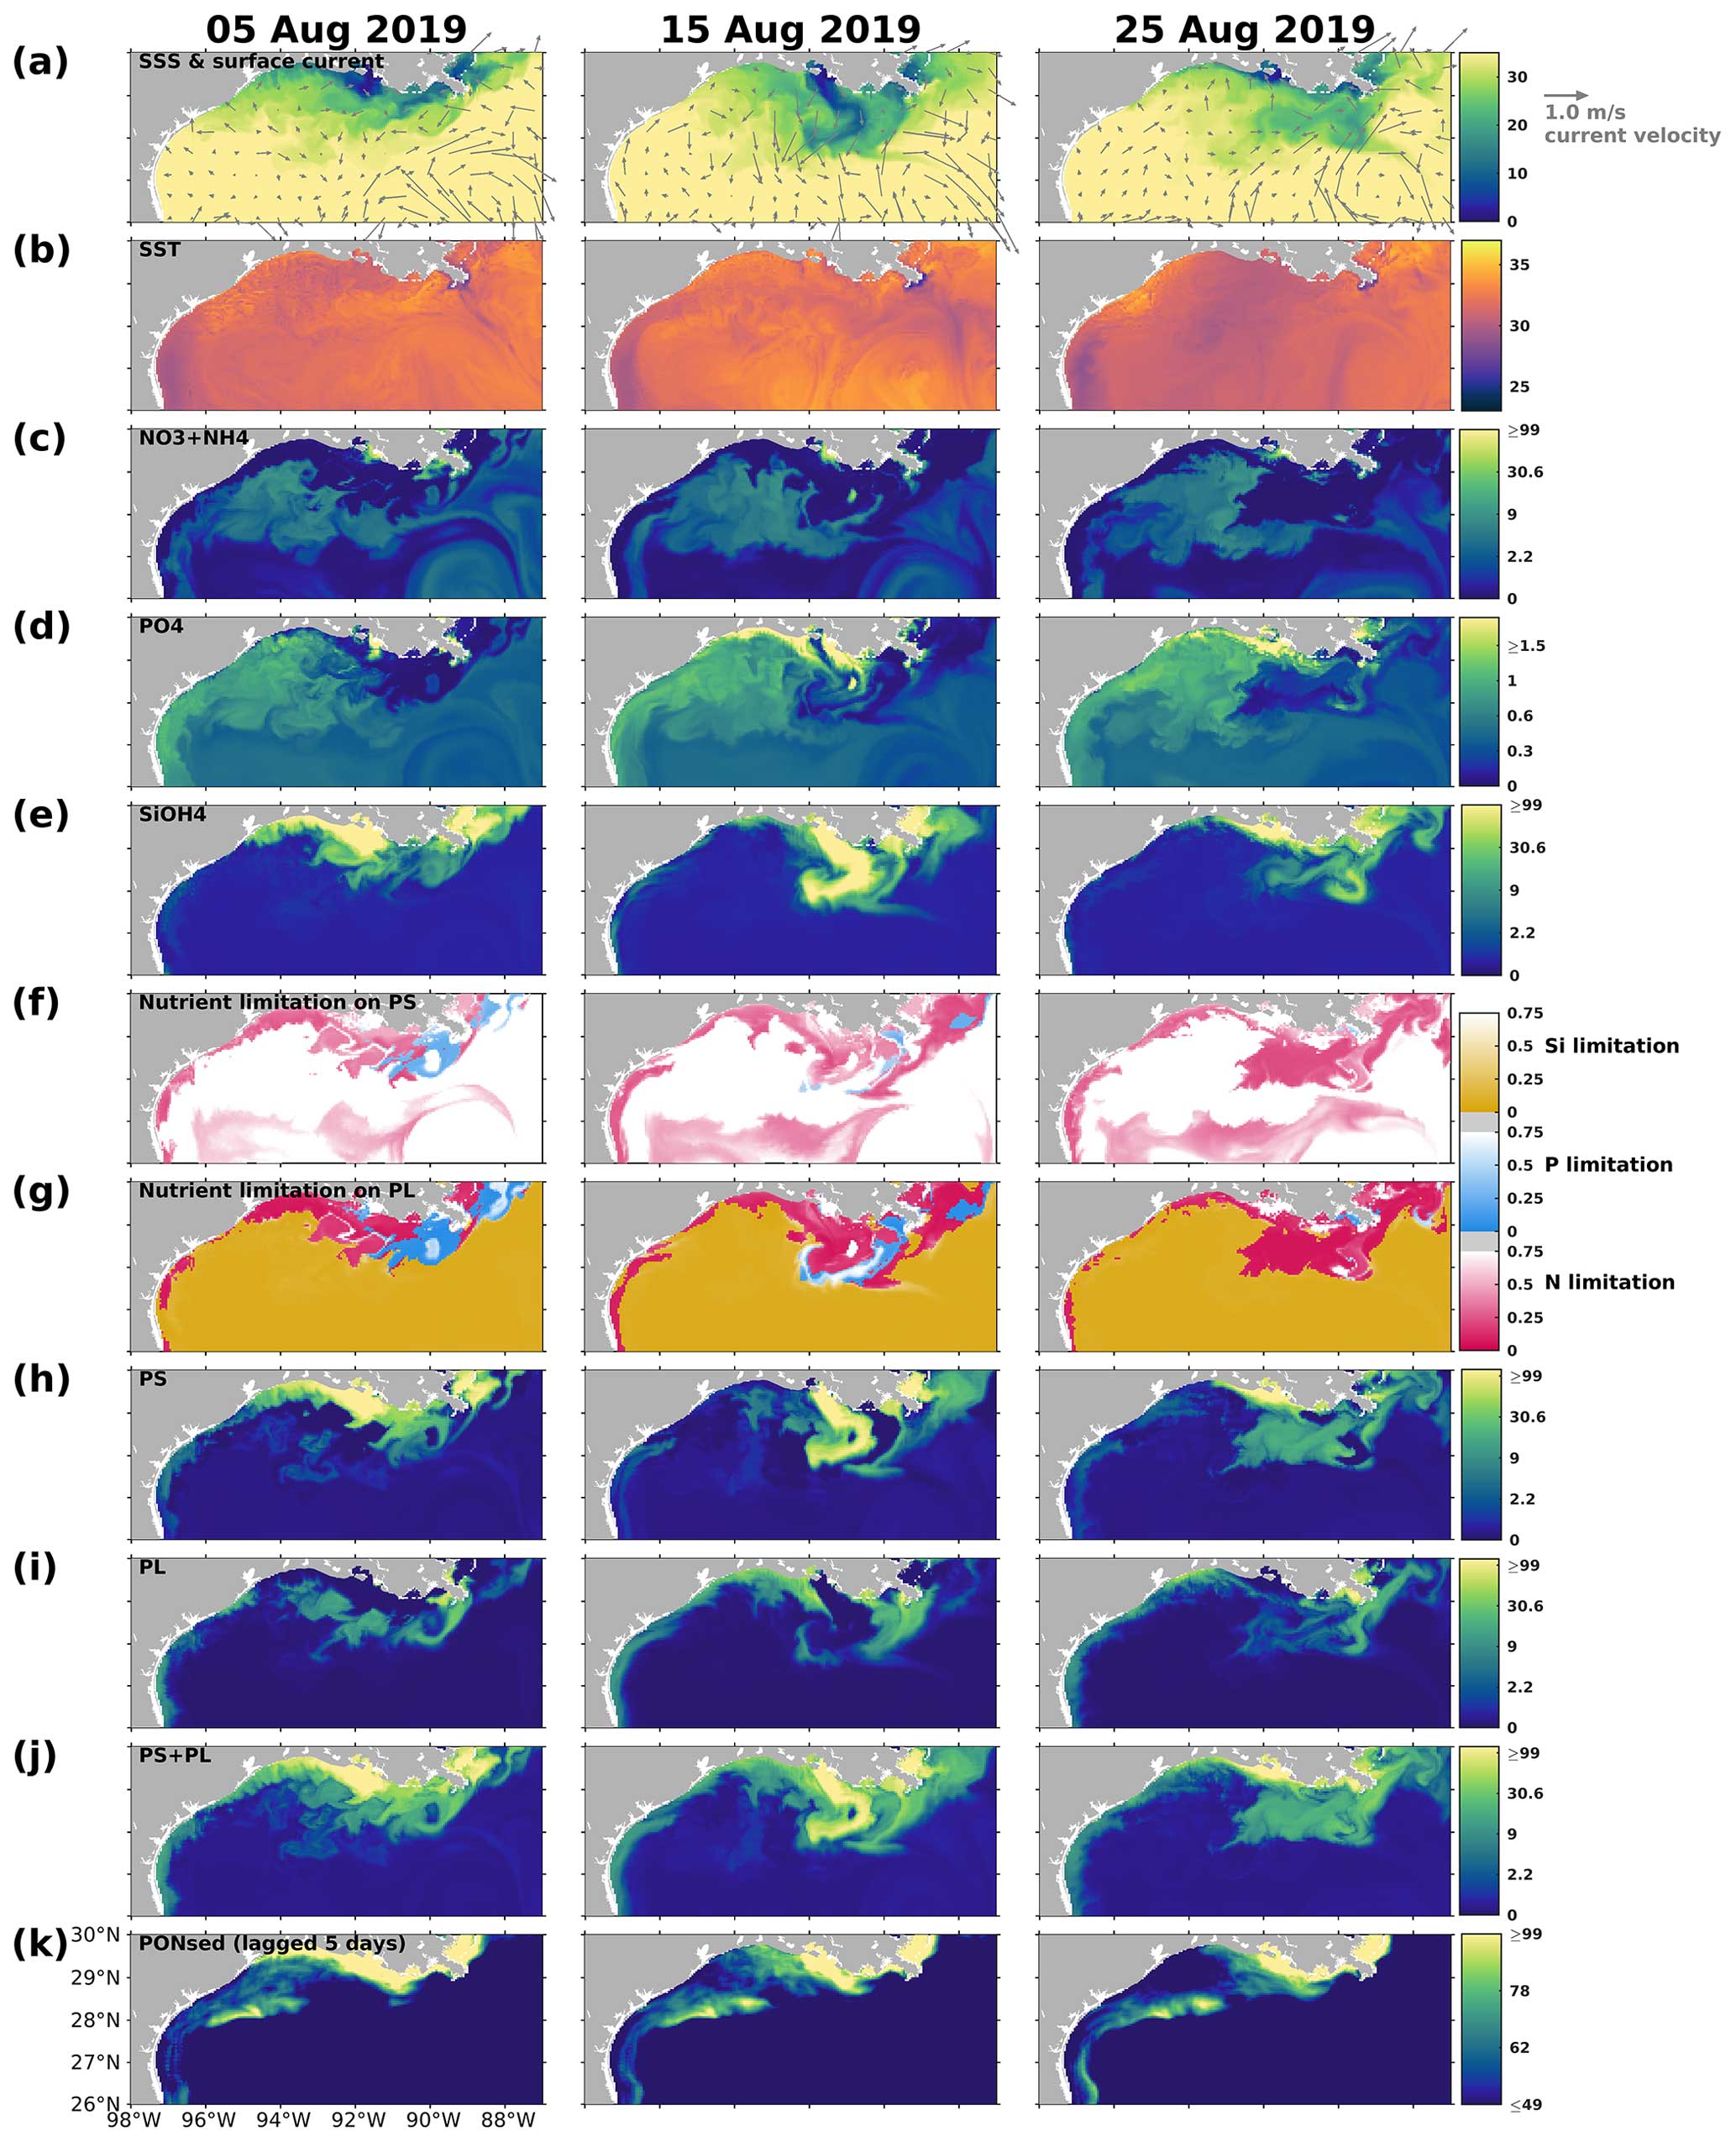
Figure 11Summer snapshots of (a) sea surface salinity (overlaid with surface current velocity), (b) surface temperature (° C), (c) surface total inorganic nitrogen concentration (mmol N m−3), (d) surface phosphate concentration (mmol P m−3), (e) surface silicate concentration (mmol Si m−3), (f–g) surface nutrient limitation coefficients, (h–i) surface phytoplankton concentration (mmol N m−3), and (k) PONsed concentration (mmol N m−3) with a 5 d lag in the nGoM. The nutrient, phytoplankton, and PONsed concentrations are displayed on the log10 scale.
4.2 Plankton community interactions
On the LaTex shelf (Fig. 2b colored area), total production, primarily supported by the primary production (Fig. 12a), exhibited a bi-peak pattern in spring and summer (e.g., 2007, 2009, 2010, 2014, 2015, 2016, 2017, 2019, and 2020) with both peaks being of similar magnitude. This pattern was hardly captured by numerical models featuring a less complex plankton community (e.g., Fennel et al., 2011) and was seldom reported or discussed even in model simulations where this pattern appeared (see comparisons of modeled and satellite-derived chlorophyll a concentration in Gomez et al., 2018). Satellite-derived chlorophyll a concentration from multiple products, averaged over the LaTex shelf, also showed a bi-peak pattern from March to August (Fig. 12a), closely resembling the pattern observed in our hindcast primary production. A cruise study conducted in March, May, and July 2004 similarly depicted a higher chlorophyll a peak in May and a lower one in July (Quigg et al., 2011). The bi-peak pattern shown was attributed to the negative correlation between PS and PL, where a decrease in PS typically coincided with an increase in PL, and vice versa (Fig. 12b). For example, the peaks in primary production and chlorophyll a, observed from March to May 2019, coincided with the transition from a PS peak to a PL peak. The secondary peak, observed from June to July 2019, was attributed to sustained high PS biomass.
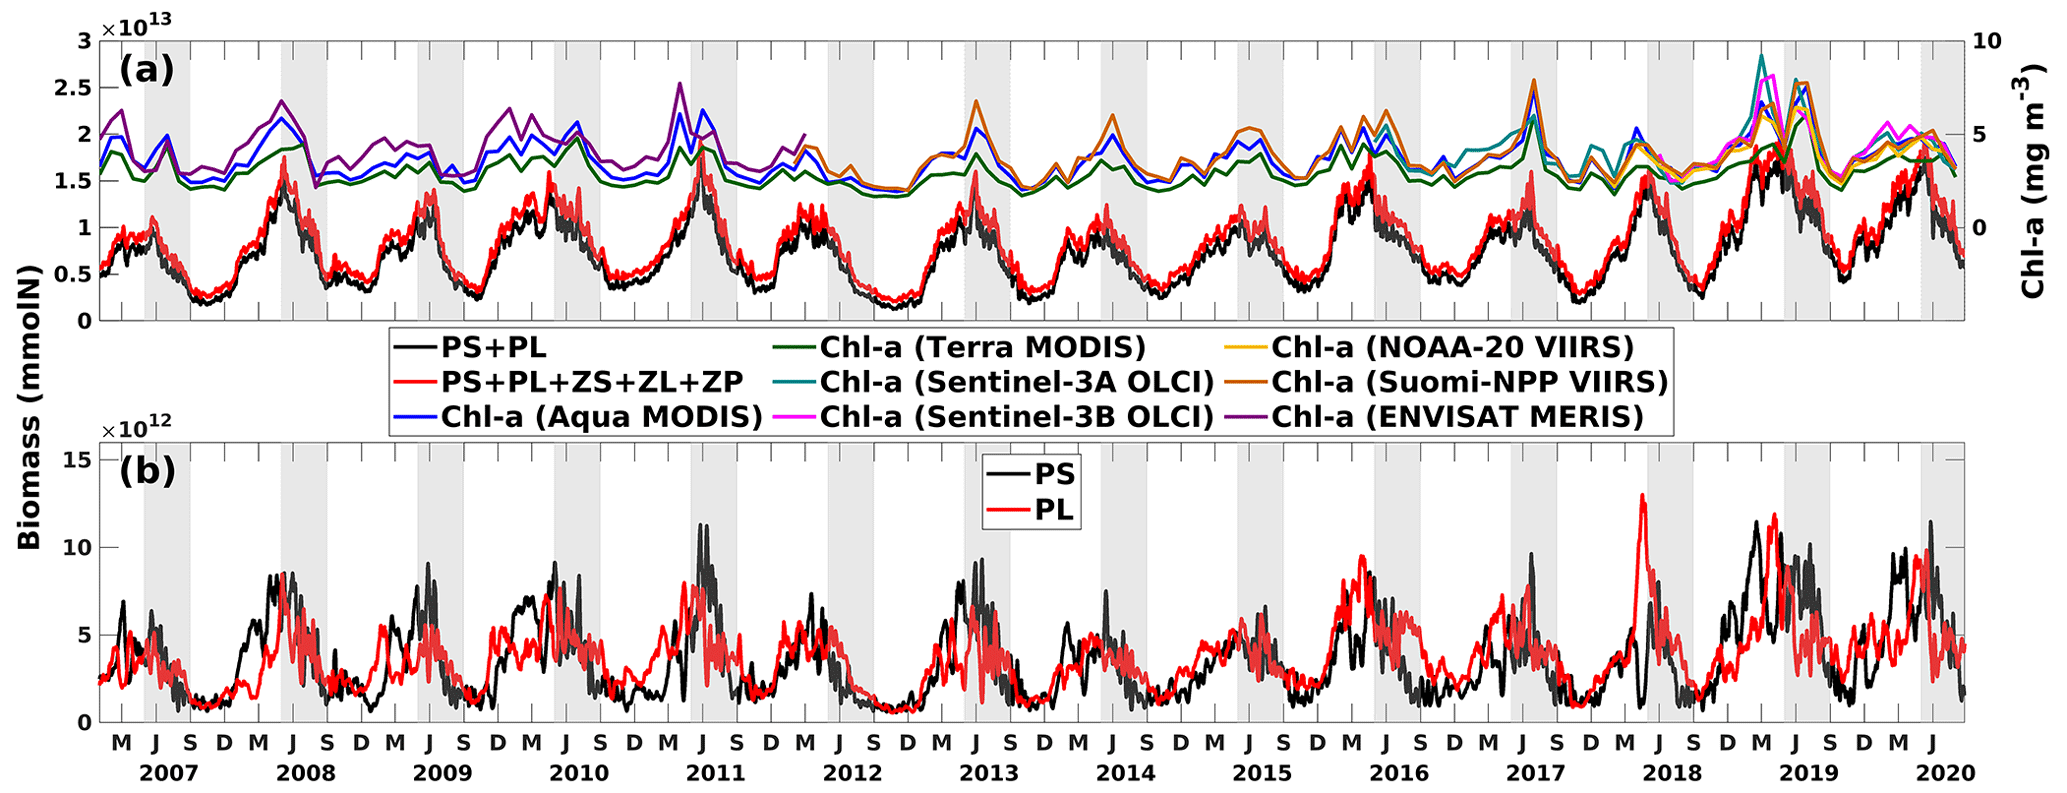
Figure 12Daily time series of (a) PS + PL and PS + PL + ZS + ZL + ZP biomass (represented by mmol N) as well as (b) PS and PL separated and integrated over the LaTex shelf (Fig. 2b colored area). (a) Monthly time series of regionally averaged (over the LaTex shelf) chlorophyll a concentration (in mg m−3) derived from multiple satellite products. The gray patches indicate the late spring and summer (May–August) period of each year. The capitalized letters M, J, S, and D on the x axis denote the first day of March, June, September, and December, respectively.
Competition for nutrients between PS and PL (bottom-up) and grazing pressure from zooplankton (top-down) jointly contribute to the differing fluctuation patterns of PS and PL and the bi-peak total primary production pattern. However, their effects are mostly nonlinear and are not straightforward to explain. We sampled six snapshots around the primary production peaks in the spring (early April) and summer (mid-June) of 2019 to illustrate the responses of both phytoplankton groups to the changing nutrient environments and grazing pressure. Analysis was based on depth averages within the surface at 1 m depth (Figs. 13–14).
In April 2019, a consistent westward current system dominated in the LaTex shelf, corresponding to an east–west elongated river plume region, as indicated by the low-sea-surface-salinity band (Fig. 13a). The spatial pattern of total primary production (PS + PL) followed the plume, within which the PS concentration increased, and PL concentration decreased westward (Fig. 13e–g). These patterns were associated with the nutrient distribution on the shelf (Fig. 13b–d). Inorganic nutrients were abundant around the riverine outlets and diluted and consumed westward following the currents. PL, having a greater half-saturation constant for nutrients than PS, typically achieved higher growth efficiency or reached the maximum growth rate more easily than PS when background nutrients were abundant. By contrast, PS could outcompete PL when nutrient supplies were low. In addition, a downwelling system was established along the shallow coast in the middle and western shelf, leading to decreased nutrient concentrations and allowing PS to outcompete PL. The grazing pressure from the zooplankton group appeared to be minor and did not significantly affect the distribution of PS and PL during these days (Fig. 13h–j).
Pronounced bottom-up and top-down effects on the primary production were found around the biomass peak in June 2019, coinciding with a shift in the coastal current system to a northward direction (Fig. 14a). The northward currents not only constrained the river plume but also introduced oligotrophic deep water, as evidenced by the high surface salinity, to the inner shelf. Note that the discharges of the Mississippi and Atchafalaya rivers remained high from May to July 2019 (Fig. C1). A distinct difference in the patterns of PS and PL was observed between 89 and 93° W and between 93 and 97° W (Fig. 14f–g). In the former region, where constrained river plumes and oligotrophic water intrusions were detected, PS exhibited a higher nutrient uptake efficiency than PL. In contrast, PL concentration was slightly higher than PS concentration in the latter regions, where the plume was pushed offshore. However, two areas of low PS concentration and corresponding high PL concentration were identified between 93 and 96° W, nearshore stretching from southwest to northeast, and between 91 and 92° W, stretching from nearshore to offshore. In these regions, the concentration of ZS, which grazes on PS only (Fig. 14h), was high, exerting strong grazing pressure on PS but inversely allowing PL to bloom (Fig. 14h).
The results indicated that the responses of PS, PL, and PS + PL to the riverine nutrient loads were nonlinear due to the mixing among the waters on the shelf, from the river, and intruding from the deep ocean. The riverine nutrient supplies were much greater in June 2019 than in March–April 2019 (Fig. C1). Higher primary production and PL concentration in June would have been expected if a nutrient-based linear relationship had been applied. However, as shown in the model and the satellite products, primary production was higher in April than in June. This indicates that variations of phytoplankton concentration are affected not only by riverine nutrient inputs but also the current system, which limits the expansion of river plumes, pronounced upwelling or downwelling, and water exchanges with the oligotrophic open ocean. In the April and June 2019 snapshots, mesoscale eddies were found south of the Mississippi River outlets. The intensity and impact area of the June eddy were greater than those of the April eddy, causing a more pronounced northward flow and more constrained river plumes along the shelf in June. These eddy systems are known as loop current eddy (LCE) systems, which can propagate westward and interact with the LaTex shelf waters after the detachment from the GoM Loop Current (LC). A recent study indicated that LCE has distinct bio-optical properties (e.g., temperature, salinity, density, DO concentration, and chlorophyll a concentration) from the surrounding waters, highlighting the importance of open-ocean dynamics to the shelf biogeochemical processes (Zhang et al., 2023). Another recent study analyzing water samples from the LaTex shelf emphasized the significant impact of mesoscale circulation features on the summer planktonic community composition (Anglès et al., 2019). This study revealed that between 20 and 25 June 2013, diatoms proliferated on the western shelf, where upwelling was detected, whereas the flagellate group dominated within the river plumes. From 18 to 23 June 2014, diatoms and flagellates bloomed in proximity to the Mississippi River and Atchafalaya River outlets, respectively. In contrast, blooms on the western shelf were characterized by a mixture of the two phytoplankton groups. Similar patterns were observed in our model results, as depicted in Figs. C4–C5.
In addition to the impacts of upwelling and LCE systems, direct advection of river outflow waters by coastal currents was also found to be significant for phytoplankton community composition, carbon export, and the associated bottom DO conditions based on other field studies in the nGoM (Chakraborty and Lohrenz, 2015) and northeastern GoM (Qian et al., 2003). Our results suggest that the grazing pressure exerted by zooplankton groups can be variable, manifesting as significant in some instances while remaining minimal in others. Laboratory experiments on surface water samples collected around the Mississippi River outlets in May 1993 suggested significant grazing pressures by microzooplankton on phytoplankton growth (Strom and Strom, 1996). However, no salient grazer impact was found on phytoplankton growth according to bioassay studies on the water samples collected around the plumes in April and August 2012 (Zhao and Quigg, 2014). Other unmodeled factors can also affect shelf primary production. For example, a reduction of chlorophyll a between 2011 and 2014 detected in the nGoM was attributed to the Deepwater Horizon oil spill disaster in 2010 (Li et al., 2019). Incorporating a complex community into the model to address the nonlinear interactions among different plankton groups enhances our understanding of the primary production variability and associated DO dynamics on the LaTex shelf (e.g., the bi-peak patterns that were seldom discussed before).
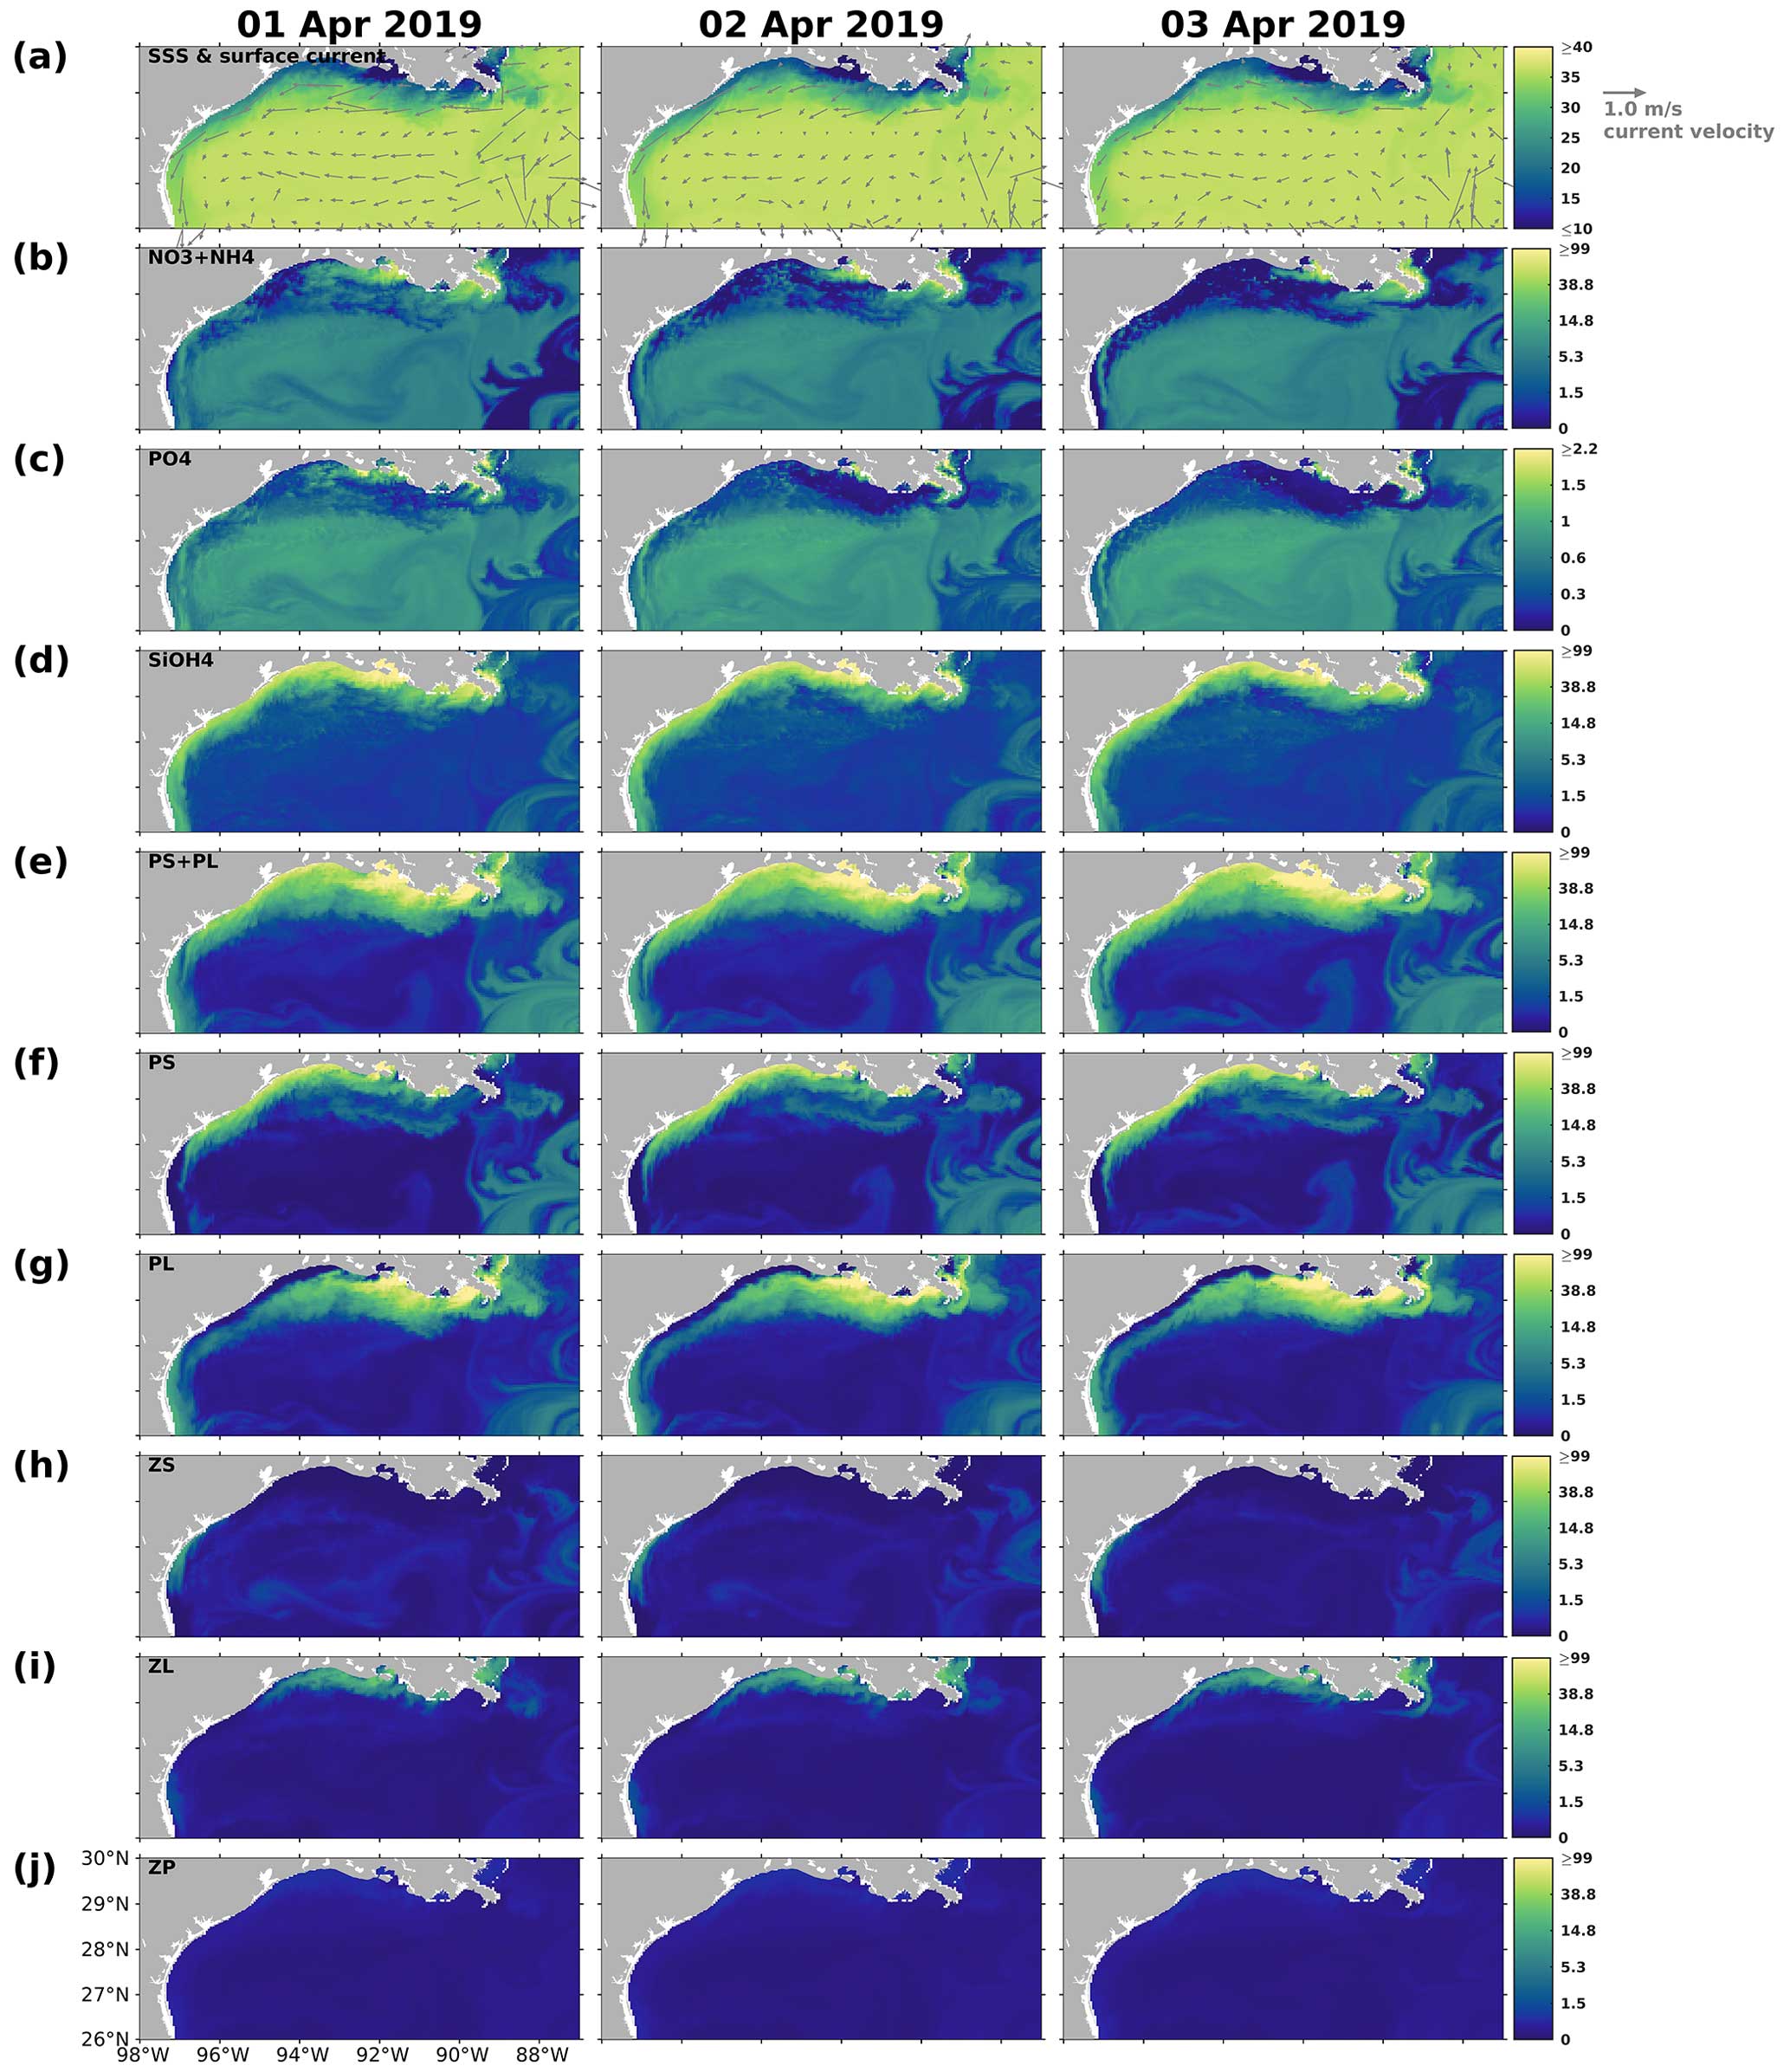
Figure 13Snapshots of (a) sea surface salinity (overlaid with surface current velocity), (b) surface total inorganic nitrogen concentration (mmol N m−3), (c) surface phosphate concentration (mmol P m−3), (d) surface silicate concentration (mmol Si m−3), (e–g) surface phytoplankton concentration (mmol N m−3), and (h–j) surface zooplankton concentration (mmol N m−3). The nutrient and plankton concentrations are displayed on the log10 scale.
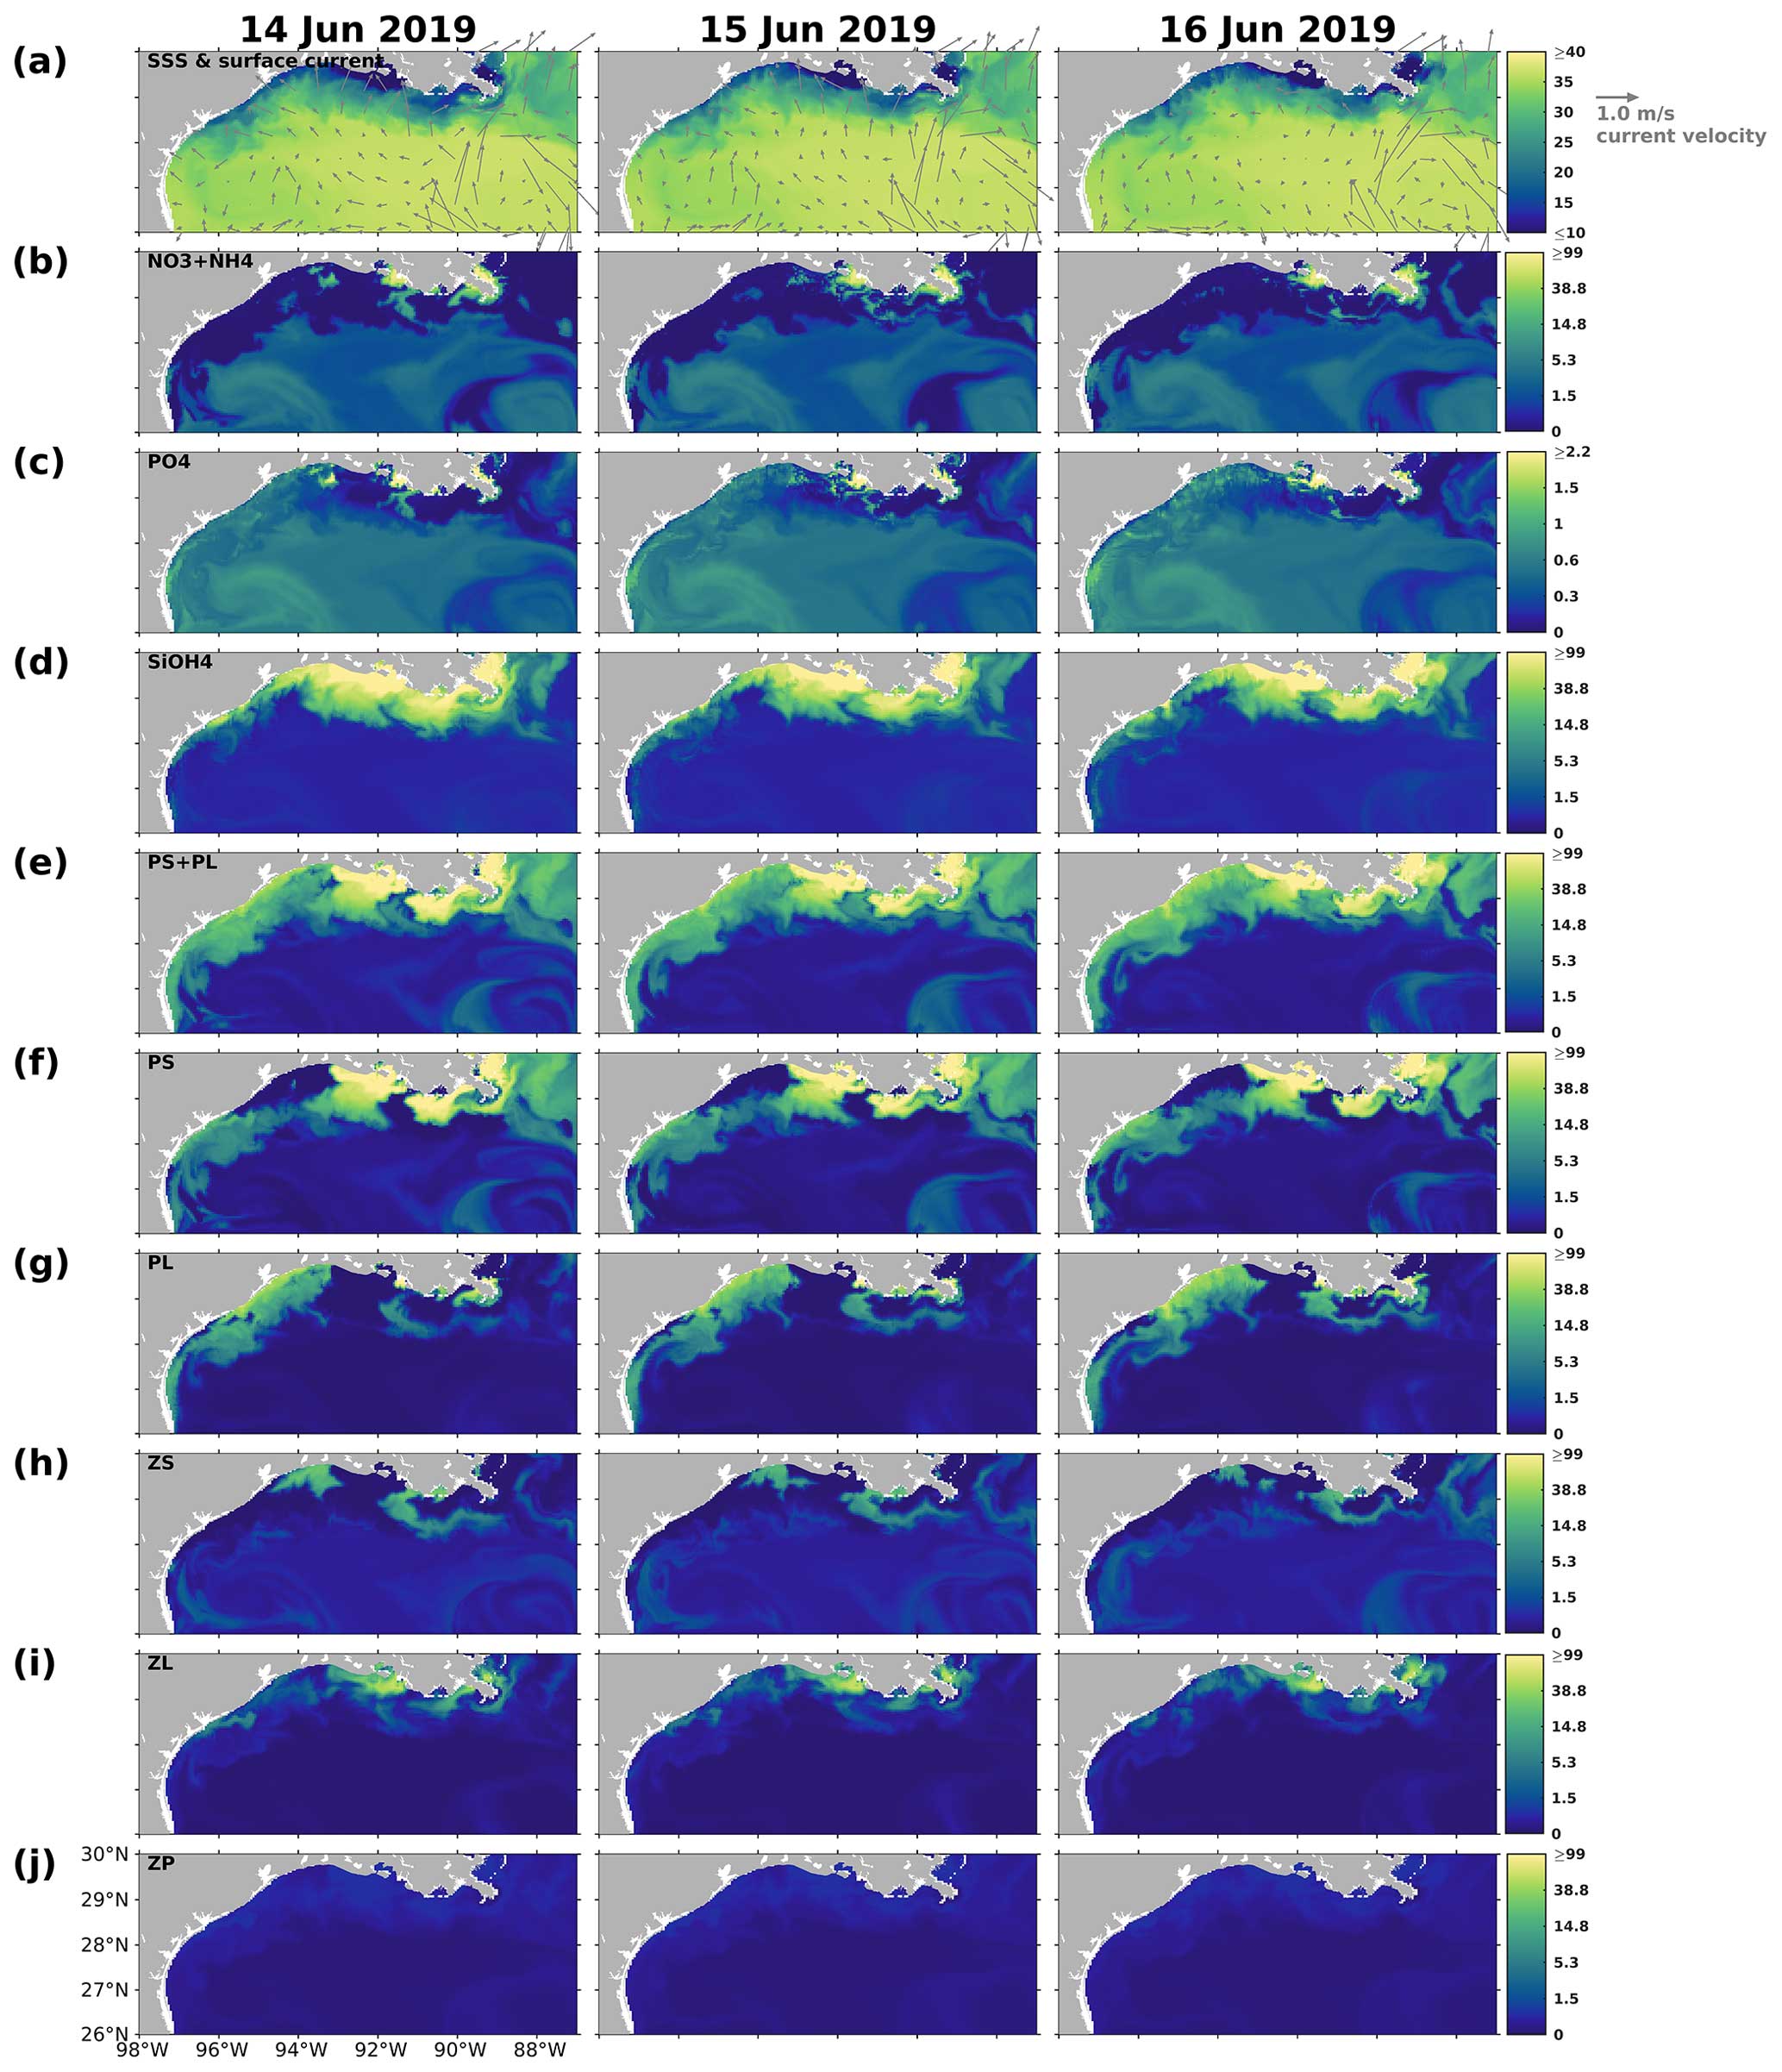
Figure 14Same as Fig. 13, but for snapshots from 14 to 16 June 2019.
4.3 A re-examination of LaTex shelf DO dynamics
In this section, we specify the bottom waters as the layers within 2 m above the sea floor, while the upper waters represent all layers above this 2 m bottom layer. The purpose is to understand the contributions of different processes, including water column biochemistry, air–sea flux (in upper layers), SOC (in bottom layers), and water transports (advection + diffusion), to the daily variations of DO in the LaTex shelf during summers (May–August) of 2007–2020.
In the upper LaTex shelf, daily DO changes were primarily driven by shelf physics and local water column biochemistry (Fig. 15a), as reflected by their significant contributions to the variability and magnitude. The advection and diffusion terms together explained the greatest spatiotemporal variability of total DO changes. The ranges of the first and the third quartiles were closely shown in the total rate of changes (−124 to 107 mmol O2 m−2 d−1) and changes by water transports (−117 to 72 mmol O2 m−2 d−1). Detailed separation of the water transport terms indicated that horizontal advection of DO contributed the most to the variability of the physical terms. The water column biochemistry contributed the second most to total DO variability, with a wide range of first and third quartiles (−41 to 96 mmol O2 m−2 d−1). The phytoplankton groups contributed positively to the upper DO pool, with the majority of the contribution from the PS group. PS biomass was usually higher than PL biomass in summer when the allocation of nutrients was more favorable for the growth of PS. The net DO changes by water column biochemistry could be negative, indicating net metabolism, which was also reported by previous field studies demonstrating consistent net water column heterotrophy across the Louisiana shelf (e.g., Murrell et al., 2013). The air–sea interactions contributed negatively to the total DO changes and accounted for the least contribution. This indicated that the upper LaTex shelf was mostly a source of oxygen to the atmosphere during summer.
In the bottom layers, the DO variability was controlled by SOC and water transports (Fig. 15b). SOC was a steady (narrow range of quartiles) but major DO loss term (median −32 mmol O2 m−2 d−1, first quartile −45 mmol O2 m−2 d−1, and third quartile −24 mmol O2 m−2 d−1), driving the total rate of changes in DO to be negative at most shelf grids during summer (median −8 mmol O2 m−2 d−1, first quartile −32 mmol O2 m−2 d−1, and third quartile 11 mmol O2 m−2 d−1). The advection and diffusion terms together acted as a major source of DO in the bottom layers (median 21 mmol O2 m−2 d−1, first quartile 7 mmol O2 m−2 d−1, and third quartile 48 mmol O2 m−2 d−1). However, they hardly offset the DO loss due to SOC. Such a positive contribution to DO by physical transports was mainly a result of steady and strong net DO supplies through vertical diffusion, as the variability and magnitude of DO changes due to total advection were less pronounced than those due to vertical diffusion. The vertical diffusion of DO is influenced by both water stratification and vertical DO concentration gradient. Water stratification results from multiple processes, including river plume dynamics, tidal dynamics, wind patterns, and surface heating and cooling, and has been identified as an important indicator of bottom DO supply (Hetland and DiMarco, 2008; Bianchi et al., 2010; Fennel et al., 2011, 2013, 2016; Justić and Wang, 2014; Wang and Justić, 2009; Feng et al., 2014; Yu et al., 2015; Laurent et al., 2018). The variation of the vertical gradient was more related to the DO dynamics in the upper layers than in the bottom, as the DO variability is more pronounced in the upper layers (wider range in total rate of changes). Thus, while SOC and water stratification play crucial roles in DO changes in the bottom layers, DO changes in the upper shelf can affect the bottom DO through vertical diffusion.
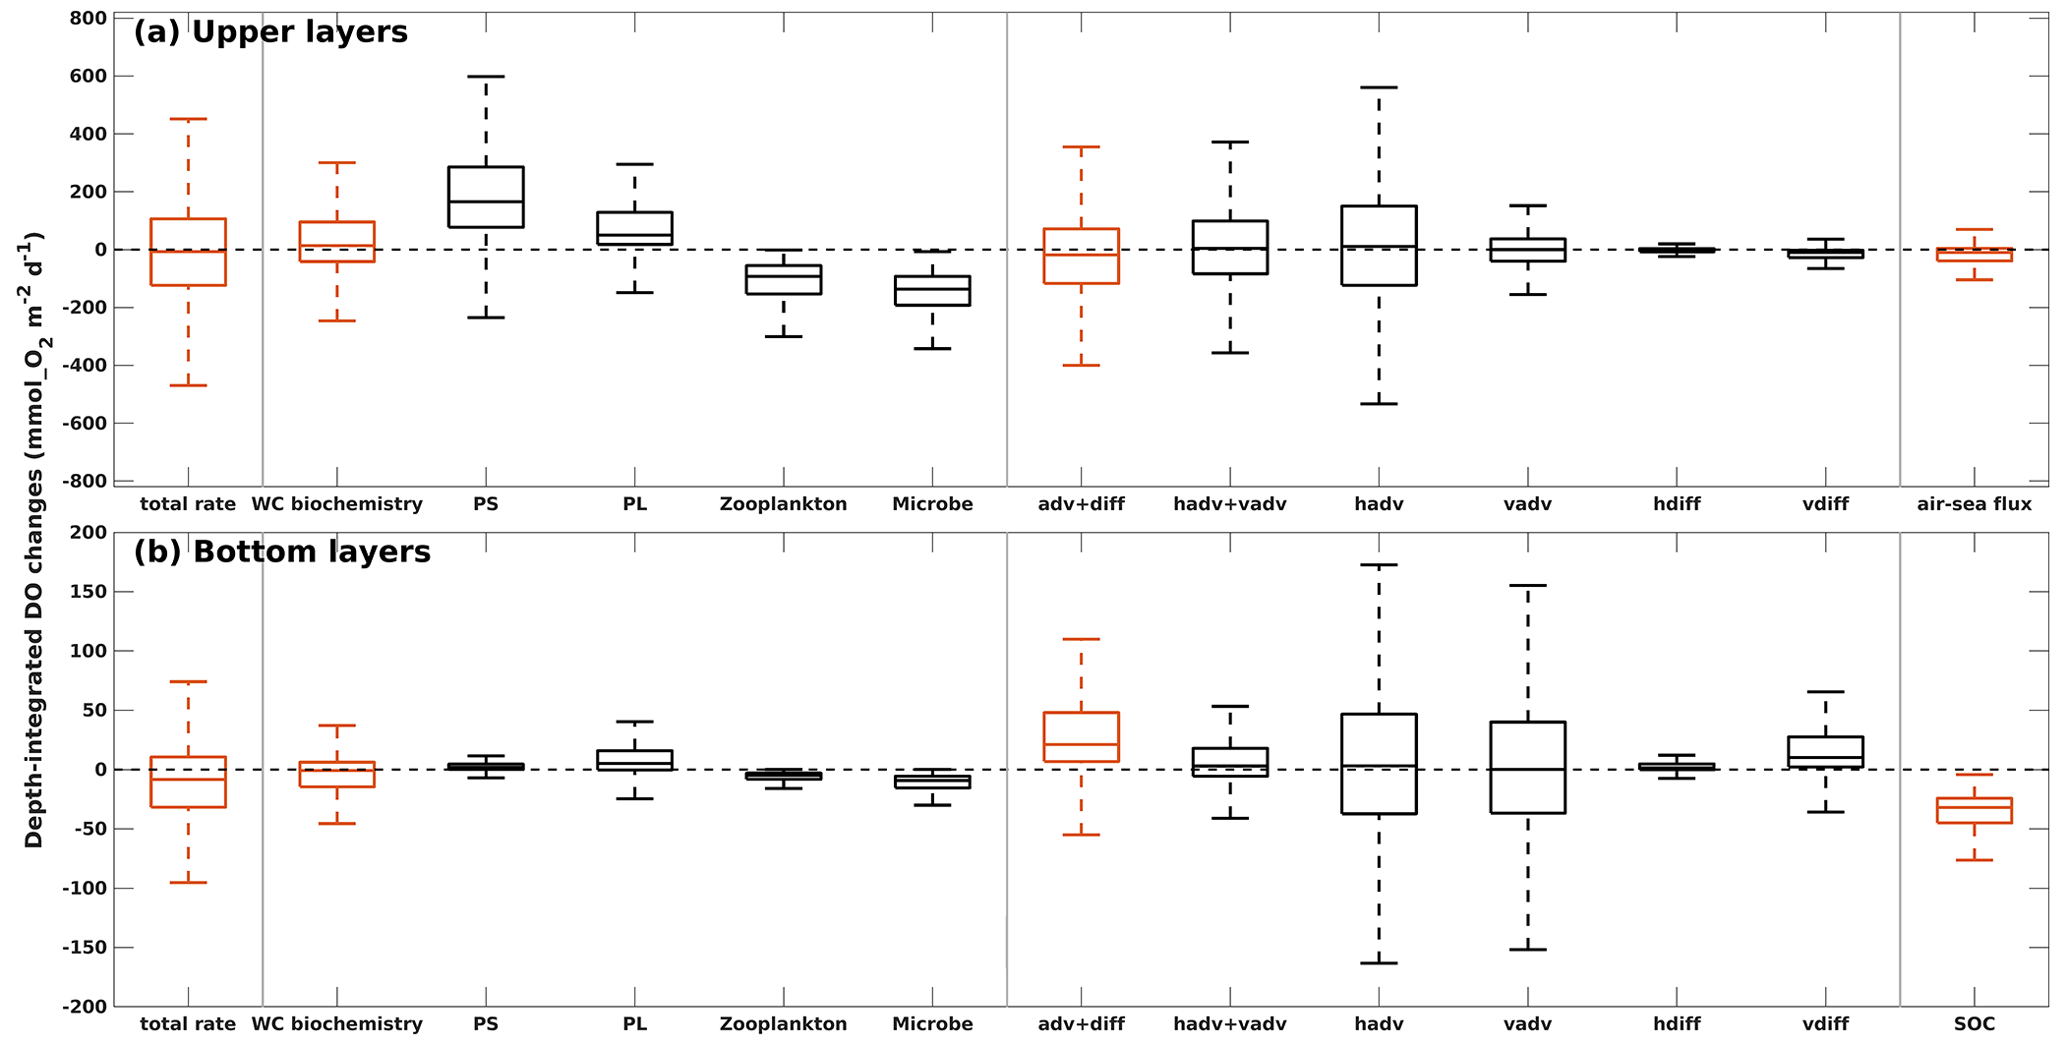
Figure 15Depth-integrated rate of changes in DO due to different modeled processes in (a) the upper layers and (b) the bottom layers. The total rate of changes is the summation of DO sources and sinks by three groups of contributors (water column biochemistry, DO transports, and air–sea flux in upper layers or SOC in bottom layers) separated by vertical gray lines. In each group, DO changes by specific processes are illustrated by black boxes. Boxes represent the first and third quartiles, with lower and upper whiskers extending to the lowest and highest values within the 1.5 interquartile range of the first and third quartiles, respectively. The median is indicated by a black line in the middle of the boxes. Statistics are summarized from the summer (May–August) records of 2007–2020 for all grid cells in the LaTex shelf.
The interactions within the plankton community (e.g., competition for nutrients and grazing pressure), which led to biomass differences, also resulted in different DO patterns at the bottom layer. Such impacts became more apparent when the DO contribution by water biochemistry outweighed that from transport processes in the upper ocean. For illustration, three summer snapshots of 14–16 June 2019 (Figs. 16 and 17) were sampled when widespread bottom hypoxia was detected. The water column biochemical processes contributed more than 50 % of total DO changes in most computational cells in the upper layers (Fig. 16a). First of all, the DO contribution by phytoplankton, zooplankton, and microbes exhibited distinct spatiotemporal patterns, complicating the net DO changes in the upper layers. Generally, the PS and PL groups enhanced DO levels, whereas zooplankton and microbes tended to deplete DO. During 14 June 2019, the DO losses by biochemical processes (Fig. 16b) in the shallow western shelf were mostly attributed to high ZS metabolism (Fig. 16e). The net DO gains between 91.5 and 92.5° W reflected high PL concentrations (Fig. 14g) and the associated high DO supplies (Fig. 16d). The scattered DO losses over the shelf were primarily due to the homogenously high DO consumption by microbes (Fig. 16h). During 15 and 16 June 2019, when DO supplies by PS and PL (Fig. 16c–d) increased, net DO gains predominated in the shelf (Fig. 16b). However, the net DO gains in the western (> 92.5° W) and eastern (< 91.5° W) shelf were mainly contributed by PS, while those in the middle shelf were by PL.
At the same time, changes in upper DO could affect the bottom DO through vertical diffusion, the spatial patterns (mostly positive; Fig. 17b) and daily variability of which aligned with biochemical DO alterations in the upper layers (Fig. 16b). However, water column stratification, as indicated by the potential energy anomaly (PEA; Fig. 17a), resulted in noticeable spatial disparities in the vertical diffusion of DO. On 15 June 2019, for example, the effects of vertical diffusion were weakened in areas that featured strong stratification, as evidenced by high PEA values. In contrast, in regions of weak stratification, such as the shallow waters between 90.5 and 92.5° W, vertical diffusion was markedly stronger. During the sampled period, among various factors (i.e., total advection, horizontal diffusion, water column biochemistry, and SOC), the vertical diffusion term contributed the most to the total rate of changes in bottom DO, especially over the middle shallow shelf. As the rates of changes were daily-averaged and the bottom DO concentration was sampled at 00:00 UTC on each sampled day (Fig. 17i), the elevated bottom DO level and relief of bottom hypoxia in the shallow middle shelf on 16 June 2019 were mainly due to the significant vertical diffusion on the preceding day, driven by high PL-supported DO sources and weak water stratification. Thus, through the interactions within the community in the upper ocean and DO diffusion processes between the upper and bottom layers, the influence of planktonic community complexity on the bottom DO dynamics and the hypoxia evolution is evident.
The influence of SOC and water stratification on bottom hypoxia in the LaTex shelf has been well-documented. Yet, the role of planktonic community complexity has received scant attention in prior numerical and observational studies. This study devoted considerable effort to validating various factors from nutrient dynamics (concentration and limitation types) to phytoplankton composition (diatom ratio and temporal variations in total primary production) and oxygen variables (SOC, DO profiles, and hypoxia patterns). Our findings illustrated how both bottom-up mechanisms (phytoplankton competition for nutrients) and top-down effects (zooplankton grazing on phytoplankton) shape plankton composition, thereby influencing DO levels in the upper water column and affecting subsequent changes in bottom DO and hypoxia patterns through physical transports (e.g., vertical diffusion). The insights obtained suggest that the impacts of planktonic community complexity on bottom DO and hypoxia patterns could be of high importance.
Nonetheless, incorporating a more complex plankton community in the model requires reasonable parameterizations for different groups to represent their interactions. The large number of parameters can sometimes hamper the reliability of a biogeochemical model due to the lack of support from in situ observations or laboratory experiments. This is also a critical reason why prevailing lower-trophic biogeochemical models are often “oversimplified”. Even in complex models, the number of plankton functional groups considered needs to be constrained to avoid over-parameterization. For example, there are two phytoplankton and two zooplankton functional groups in the PISCES (Aumont and Bopp, 2006) and CoSiNE models (Chai et al., 2002), three phytoplankton and two zooplankton functional groups in the PlankTOM5 model (Buitenhuis et al., 2010), and three phytoplankton groups and one zooplankton functional group in the CCSM-BEC model (Moore et al., 2004).
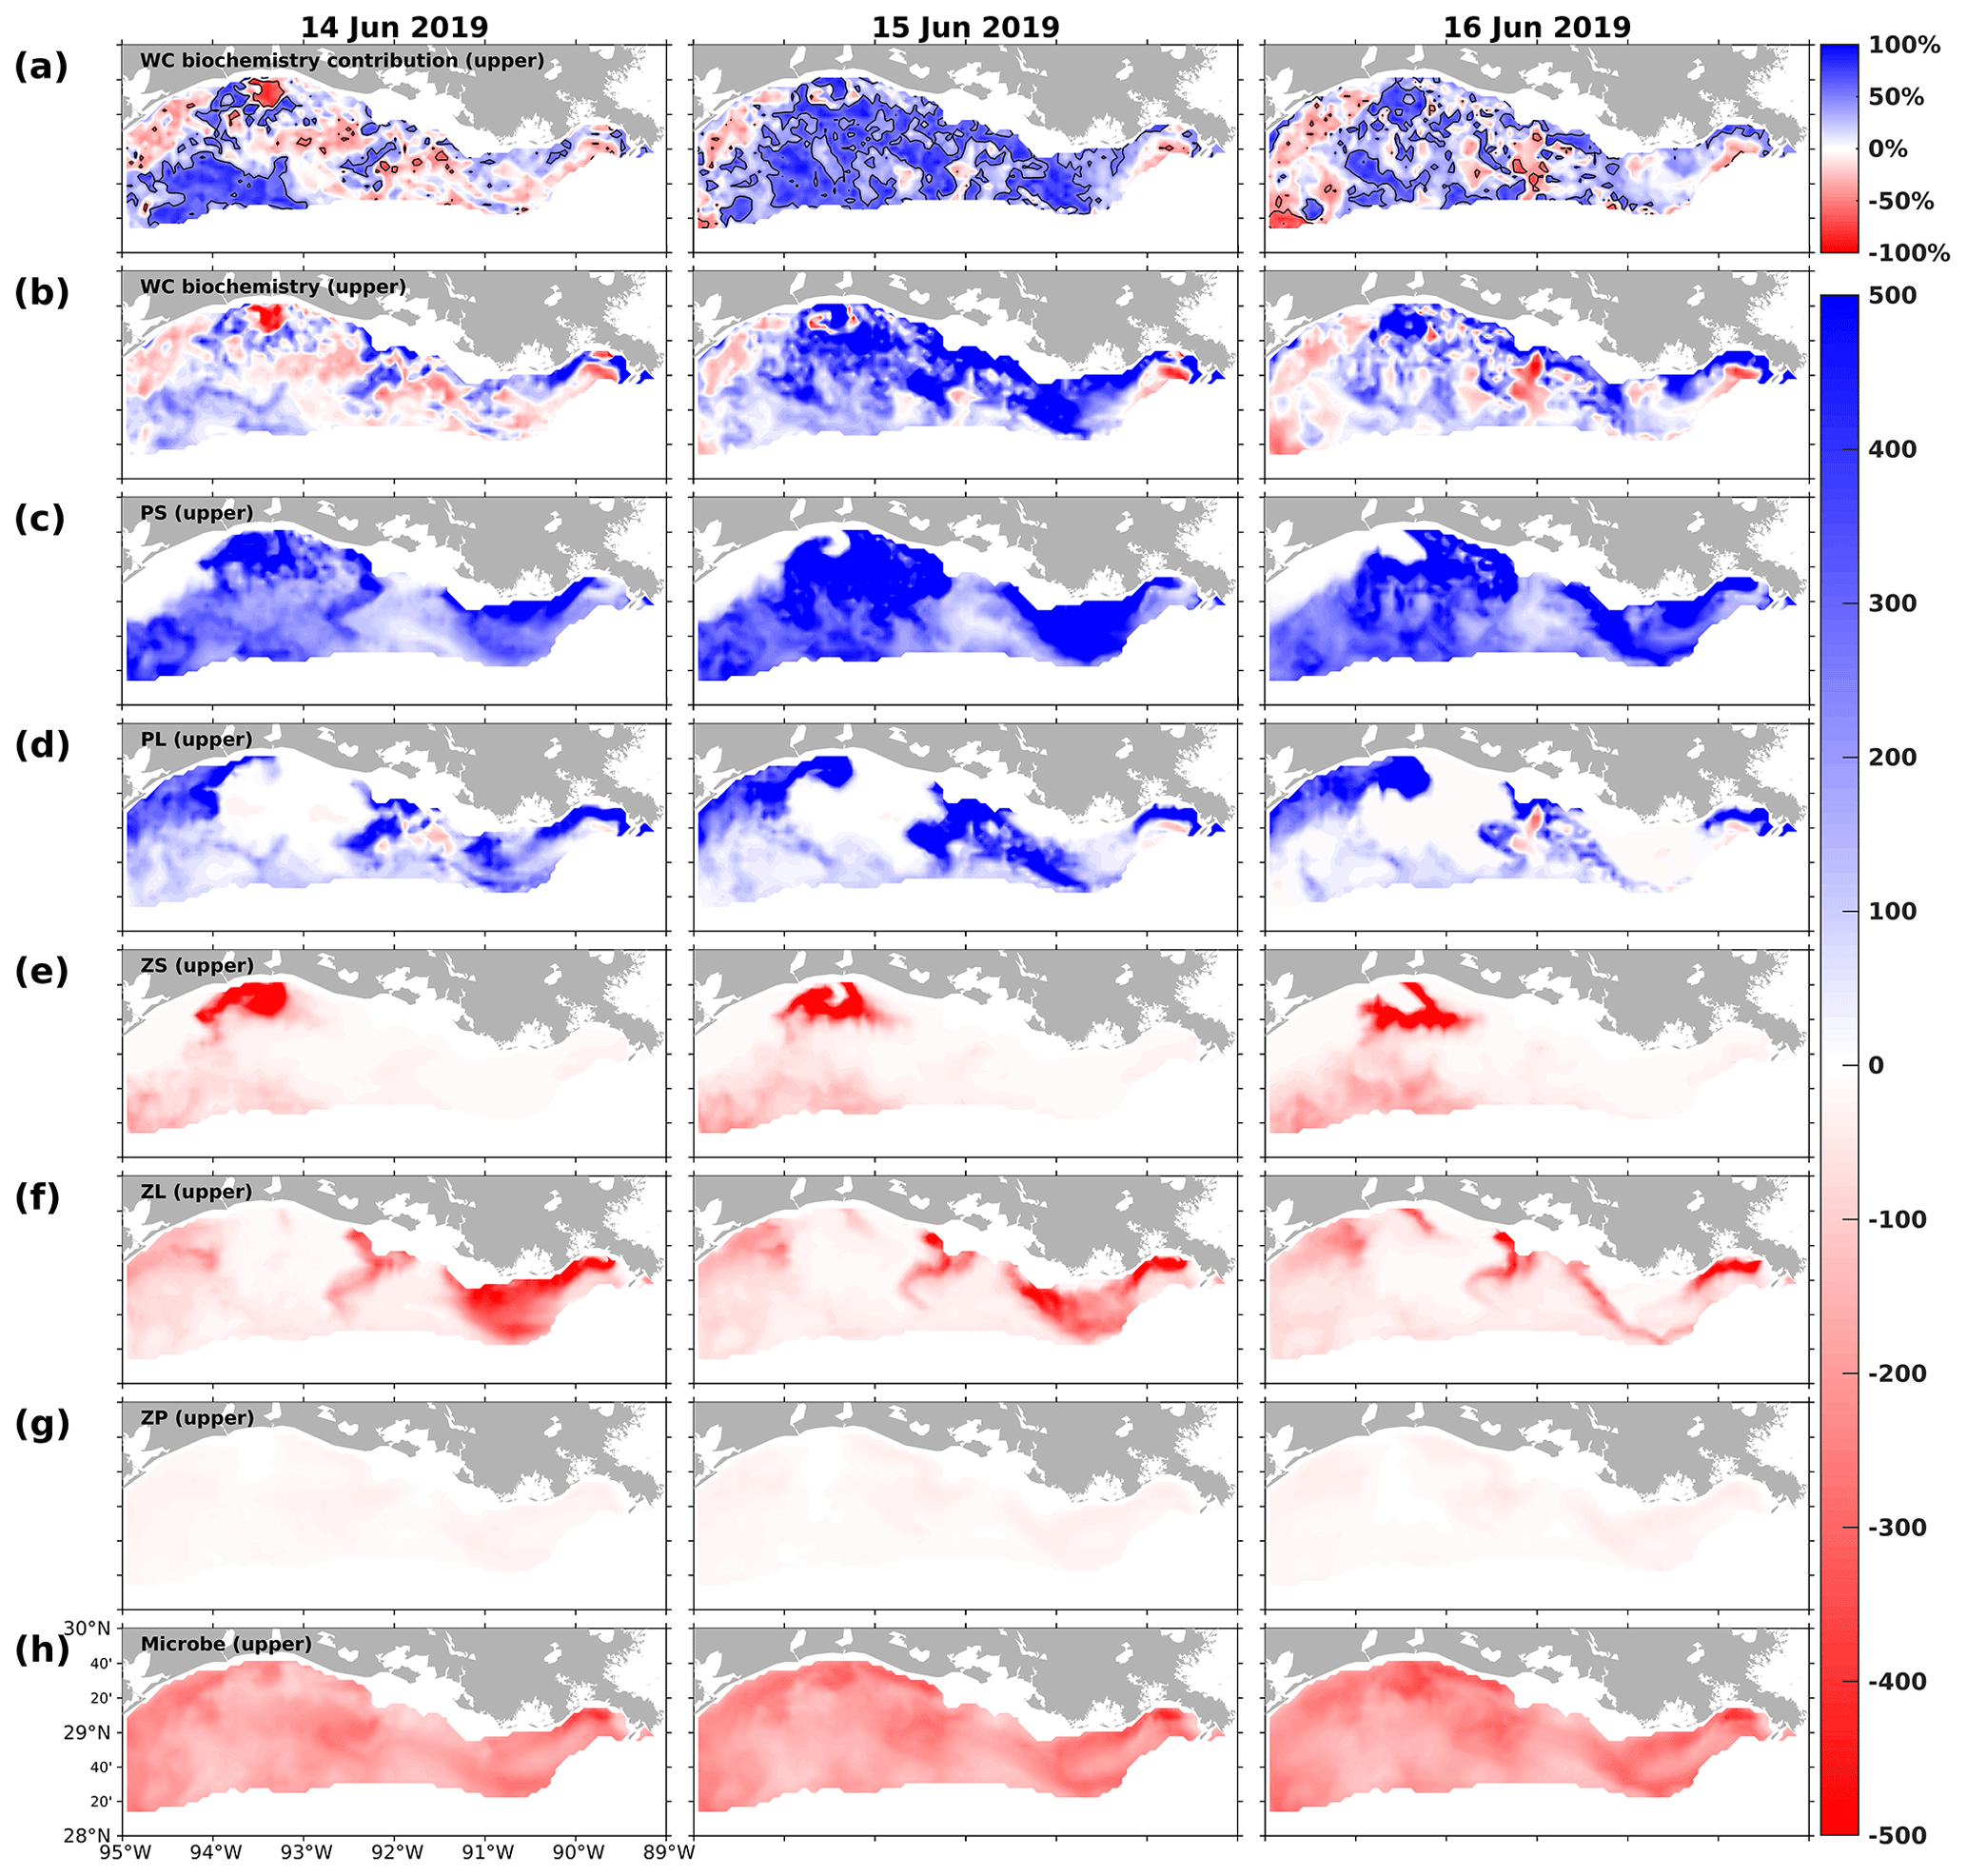
Figure 16Snapshots of DO contribution by the (a) water column biochemical processes (percentages) in the upper layers, DO gain and loss rates (mmol m−2 d−1) due to (b) water column biochemical processes, (c) PS, (d) PL, (e) ZS, (f) ZL, (g) ZP, and (h) microbes in the upper layers. The percentage contribution is related to the sum of absolute DO changes due to water column biochemical processes, water transports (advections and diffusions), and air–sea fluxes in the upper layers. The solid black lines in (a) indicate the −50 % and 50 % contour lines.
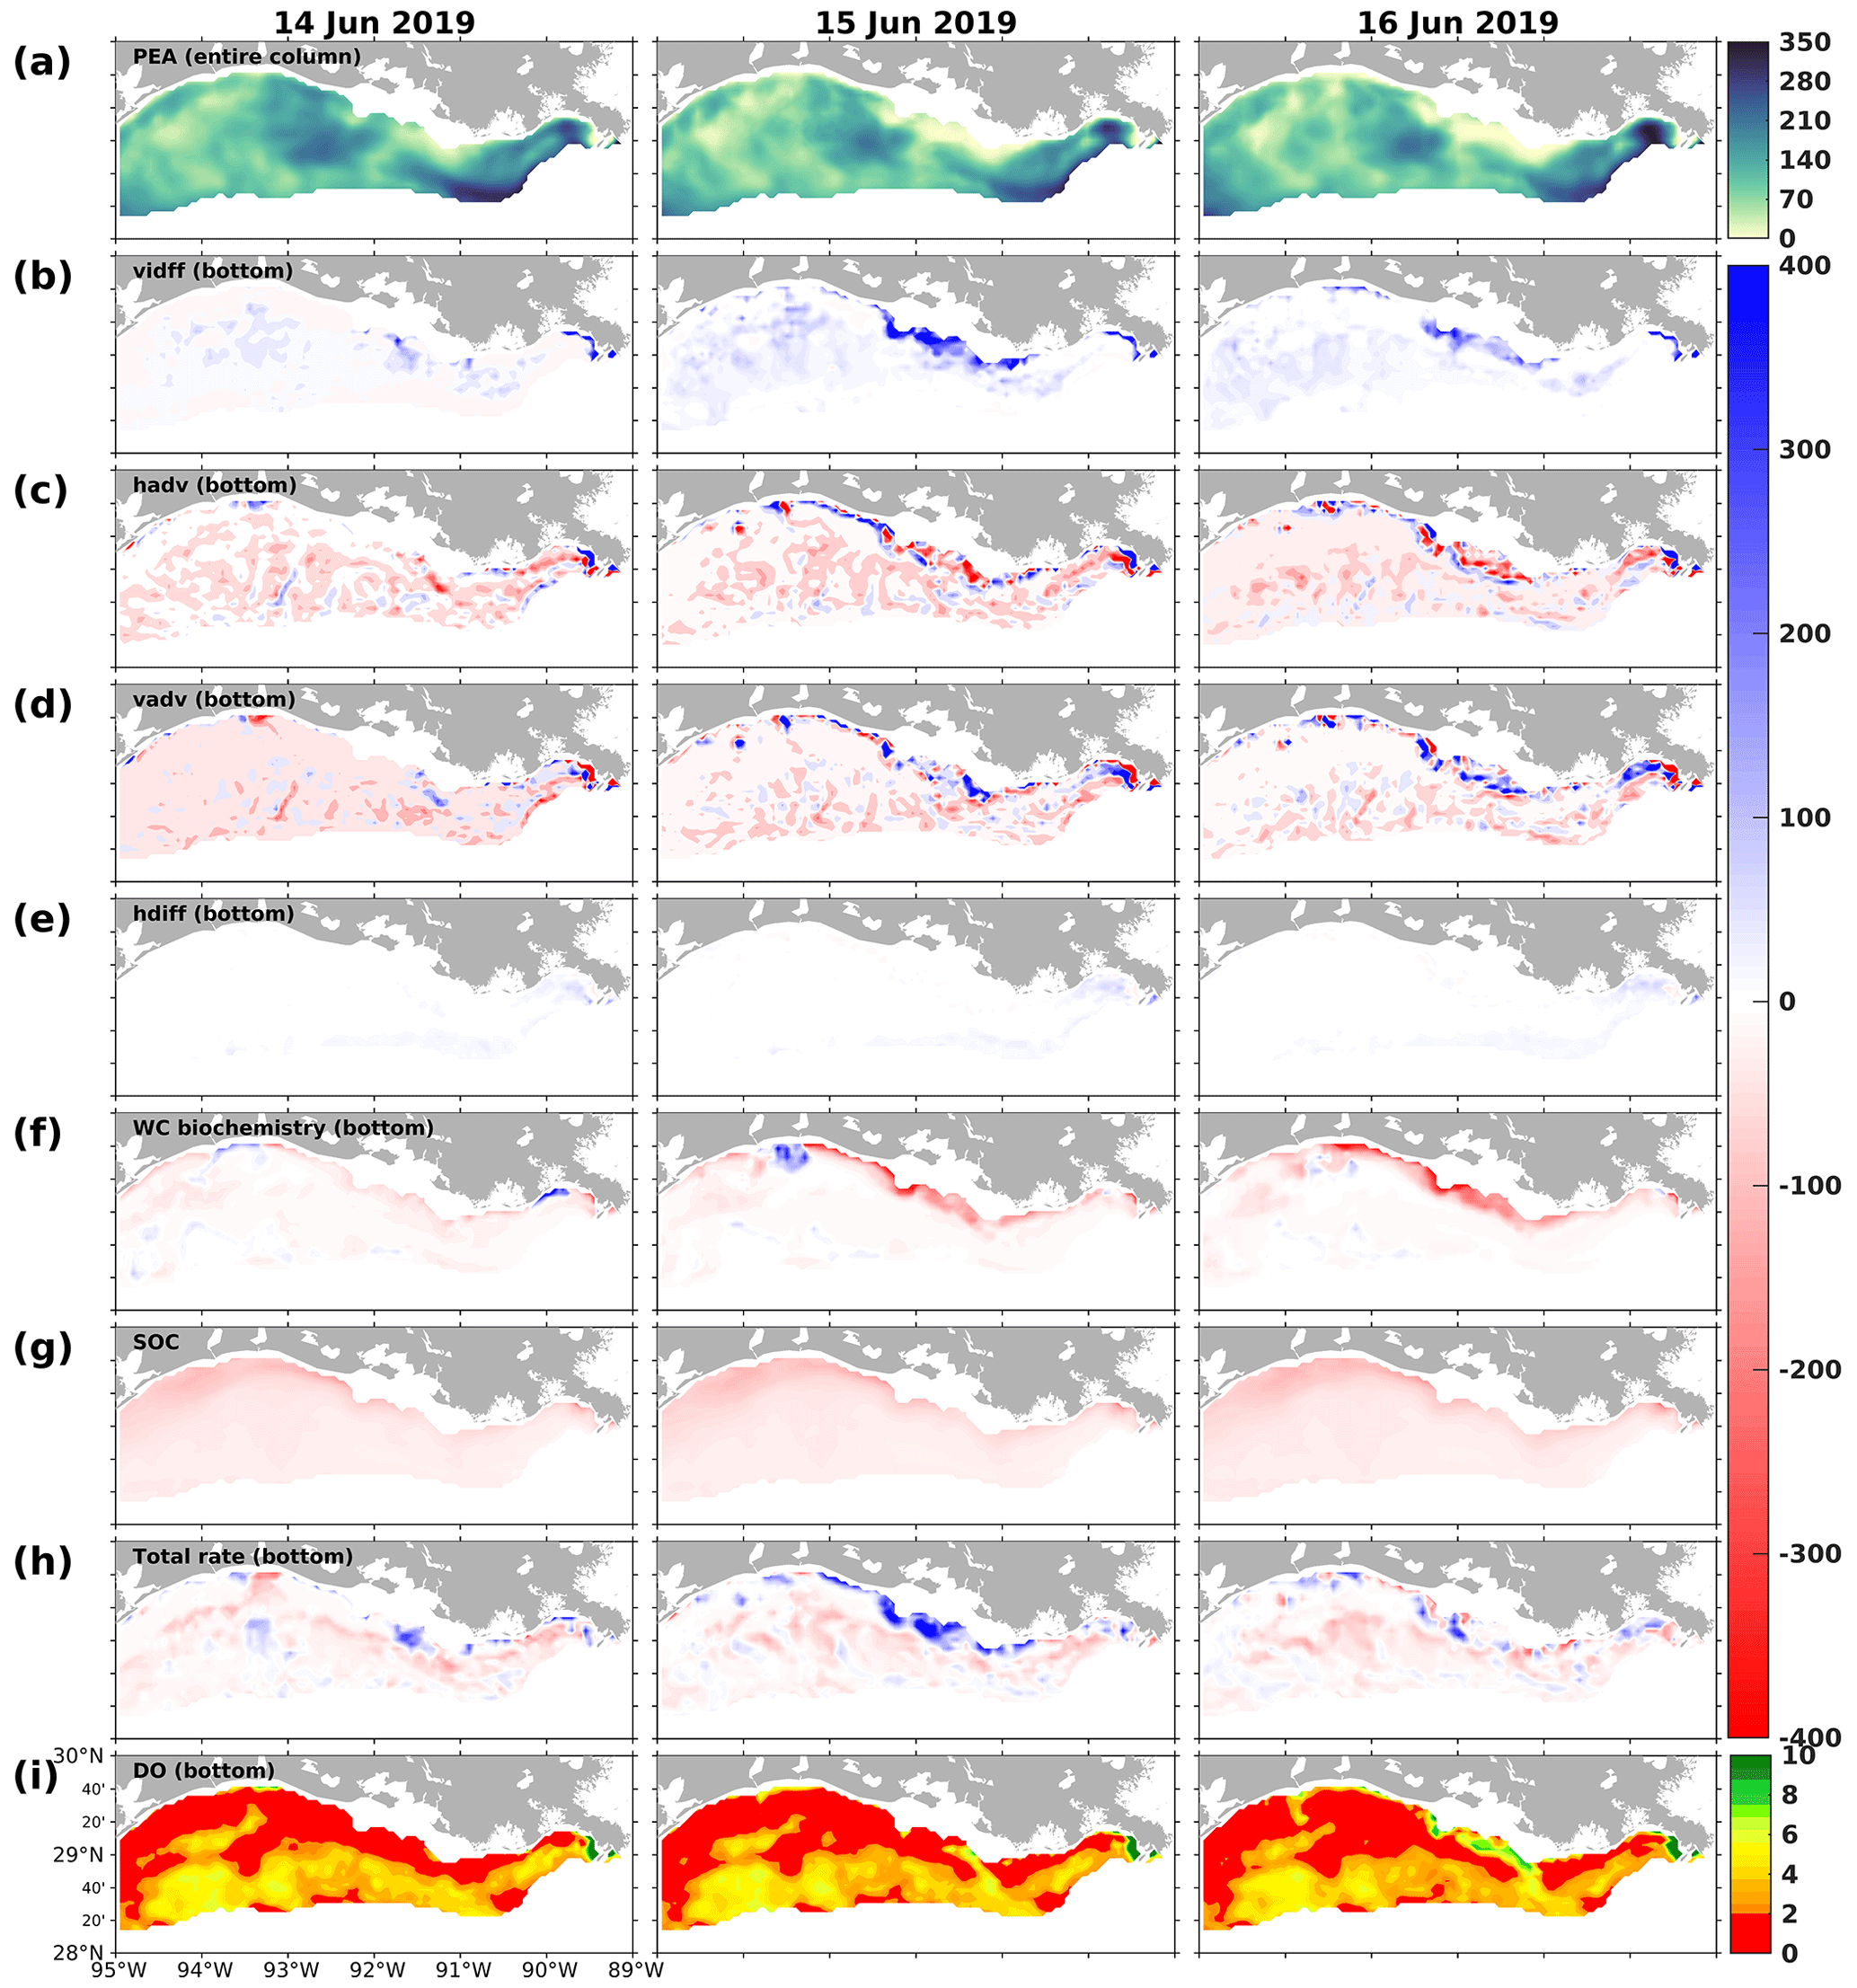
Figure 17Snapshots of (a) potential energy anomaly (PEA; J m−3), DO gain and loss rates (mmol m−2 d−1) due to (b) vertical diffusion (vdiff), (c) horizontal advection (hadv), (d) vertical advection (vadv), (e) horizontal diffusion (hdiff), (f) water column biochemical processes in the bottom layers, (g) SOC, (h) total bottom DO gain and loss rates (mmol m−2 d−1), and (i) bottom DO concentration (mg L−1). Rate snapshots are daily averages, while snapshots of state variables (i.e., PEA and bottom DO concentration) are extracted at 00:00 UTC on each sampled day.
In this study, we modified a three-dimensional coupled hydrodynamic–biogeochemical model (NEMURO) and adapted it to the GoM to investigate the mechanisms of bottom DO variability in the LaTex Shelf from 2007 to 2020. In addition to N and Si, a P flow was embedded into NEMURO to account for the impacts of P limitation on phytoplankton growth rates. Drawing upon the SOC scheme of the instantaneous remineralization developed by Fennel et al. (2006), a pool of sedimentary PON was added to capture temporal delays in SOC relative to the peak of plankton blooms. The model reproduced the surface inorganic nutrient concentration (i.e., nitrate, phosphate, and silicate), nutrient limitation patterns, the ratio of diatom to total phytoplankton, and the magnitude of SOC well. The model's robustness in DO simulation was affirmed via comparison of the DO profiles against cruise observations from two different databases, comparison of spatial distributions of bottom DO, and time series of the hypoxic area against shelf-wide cruise observations.
Model results revealed that the changing dominant current system in summer can significantly alter the distribution of shelf nutrients and types of nutrient limitations. While N limitation and P limitation dominate the Mississippi and Atchafalaya River plume area, Si limitation becomes pronounced as the coastal current system shifts from westward to eastward or northward, facilitating the intrusion of low-Si waters from the west and the deep gulf. This effect, particularly evident on the western shelf, has rarely been addressed in previous studies on nutrient limitation. Model results also indicated that under a westward background current system, upwellings can enhance nearshore surface nutrient content, with the two modeled phytoplankton functional groups, PS and PL, exhibiting distinct responses to the redistribution of surface nutrients.
Our findings underscore the importance of incorporating complex community dynamics and sophisticated nonlinear interactions into biogeochemical models to capture the variability in primary production on the LaTex Shelf. The model identified a bi-peak production pattern in spring and early summer, aligning with satellite-derived chlorophyll a variations – a pattern not commonly reported in earlier research. We linked this bi-peak pattern to plankton community interactions, including both bottom-up and top-down effects, as demonstrated in the sampled spring and summer snapshots. Changes in nutrient distribution arising from interactions between the LaTex shelf and its adjacent waters, the passages of LCE, the formation of upwelling or downwelling systems, and variations in river plume patterns are crucial in influencing plankton interactions, highlighting the important role of open-ocean dynamics and boundary conditions along the LaTex shelf in LaTex biogeochemical modeling.
While the effects of SOC and water stratification on bottom hypoxia are well-recognized, our study illuminates how plankton composition, influenced by bottom-up and top-down effects, can affect DO levels in the upper water column and lead to changes in bottom DO and hypoxia patterns through physical transport processes, such as vertical diffusion. These insights suggest the potential impacts of planktonic community complexity on bottom DO and hypoxia patterns, emphasizing the need for future in situ and modeling efforts.
Detailed descriptions of related terms and parameters are listed in Appendix B.
A1 Update gross primary production of PS and PL due to the additional phosphate limitation
where
A2 Update aerobic decomposition from PON to NH4 and from DON to NH4 due to the introduction of oxygen dependency
where
A3 Update water column nitrification due to the introduction of oxygen dependency and light limitation
where
A4 Additional SOC term
Table B2Descriptions of related terms involved in the phosphorus cycle and nutrient limitation. Superscripts * and + denote the fact that the mathematic expressions of corresponding terms are the same as those in Kishi et al. (2007) and Shropshire et al. (2020), respectively. Expressions of terms with no superscript are updated and reported in Appendix A.
Table B4Descriptions and values of all model parameters. Superscripts S, L, F06, and F13 denote the fact that the corresponding parameters follow Shropshire et al. (2020), Laurent et al. (2012), Fennel et al. (2006), and Fennel et al. (2013), respectively. Superscript * indicates that the corresponding parameters are from this study.
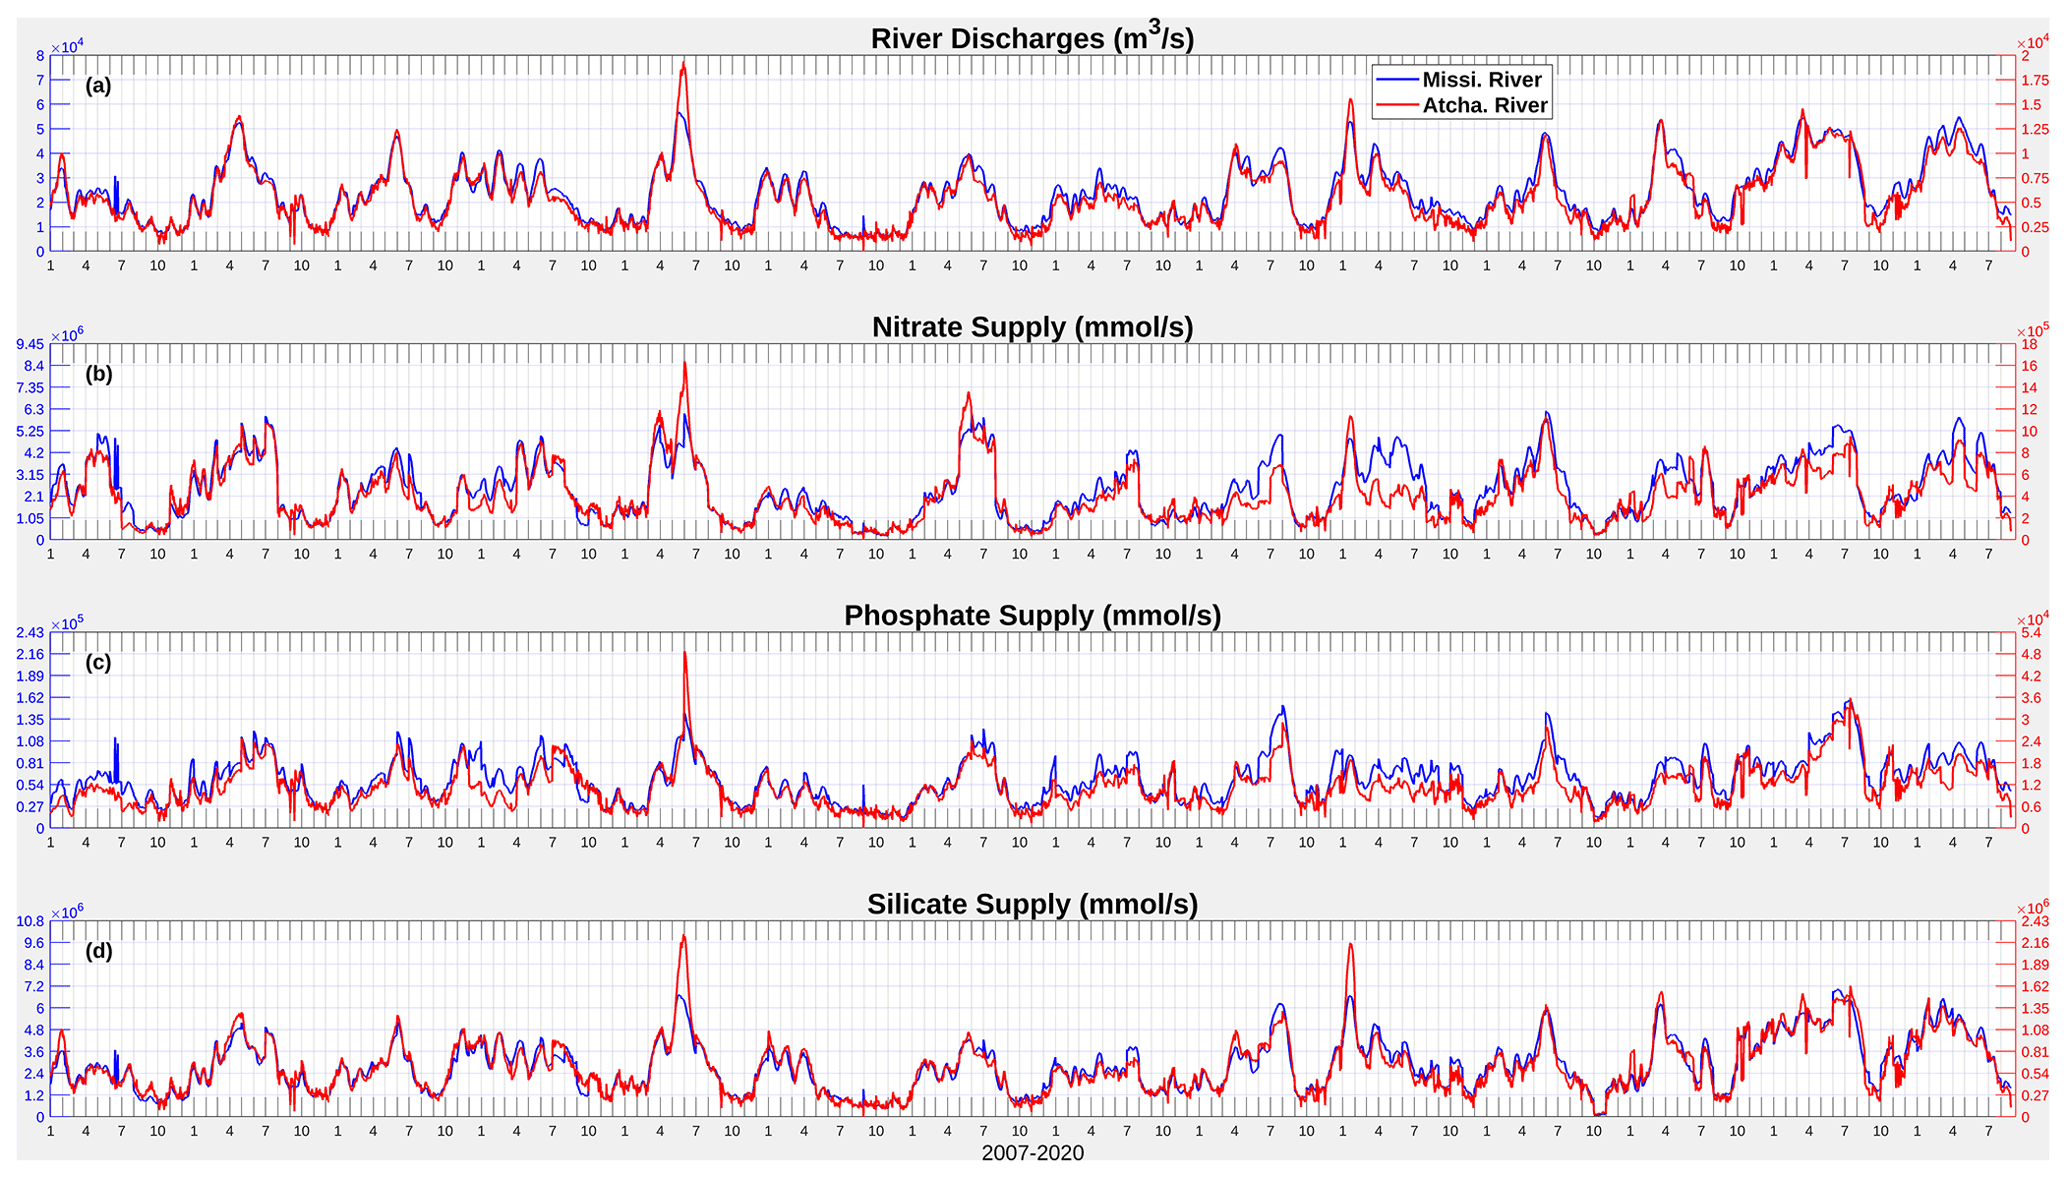
Figure C1Daily time series (2007–2020) of river discharges of freshwater, nitrate, phosphate, and silicate from the Mississippi and Atchafalaya rivers.
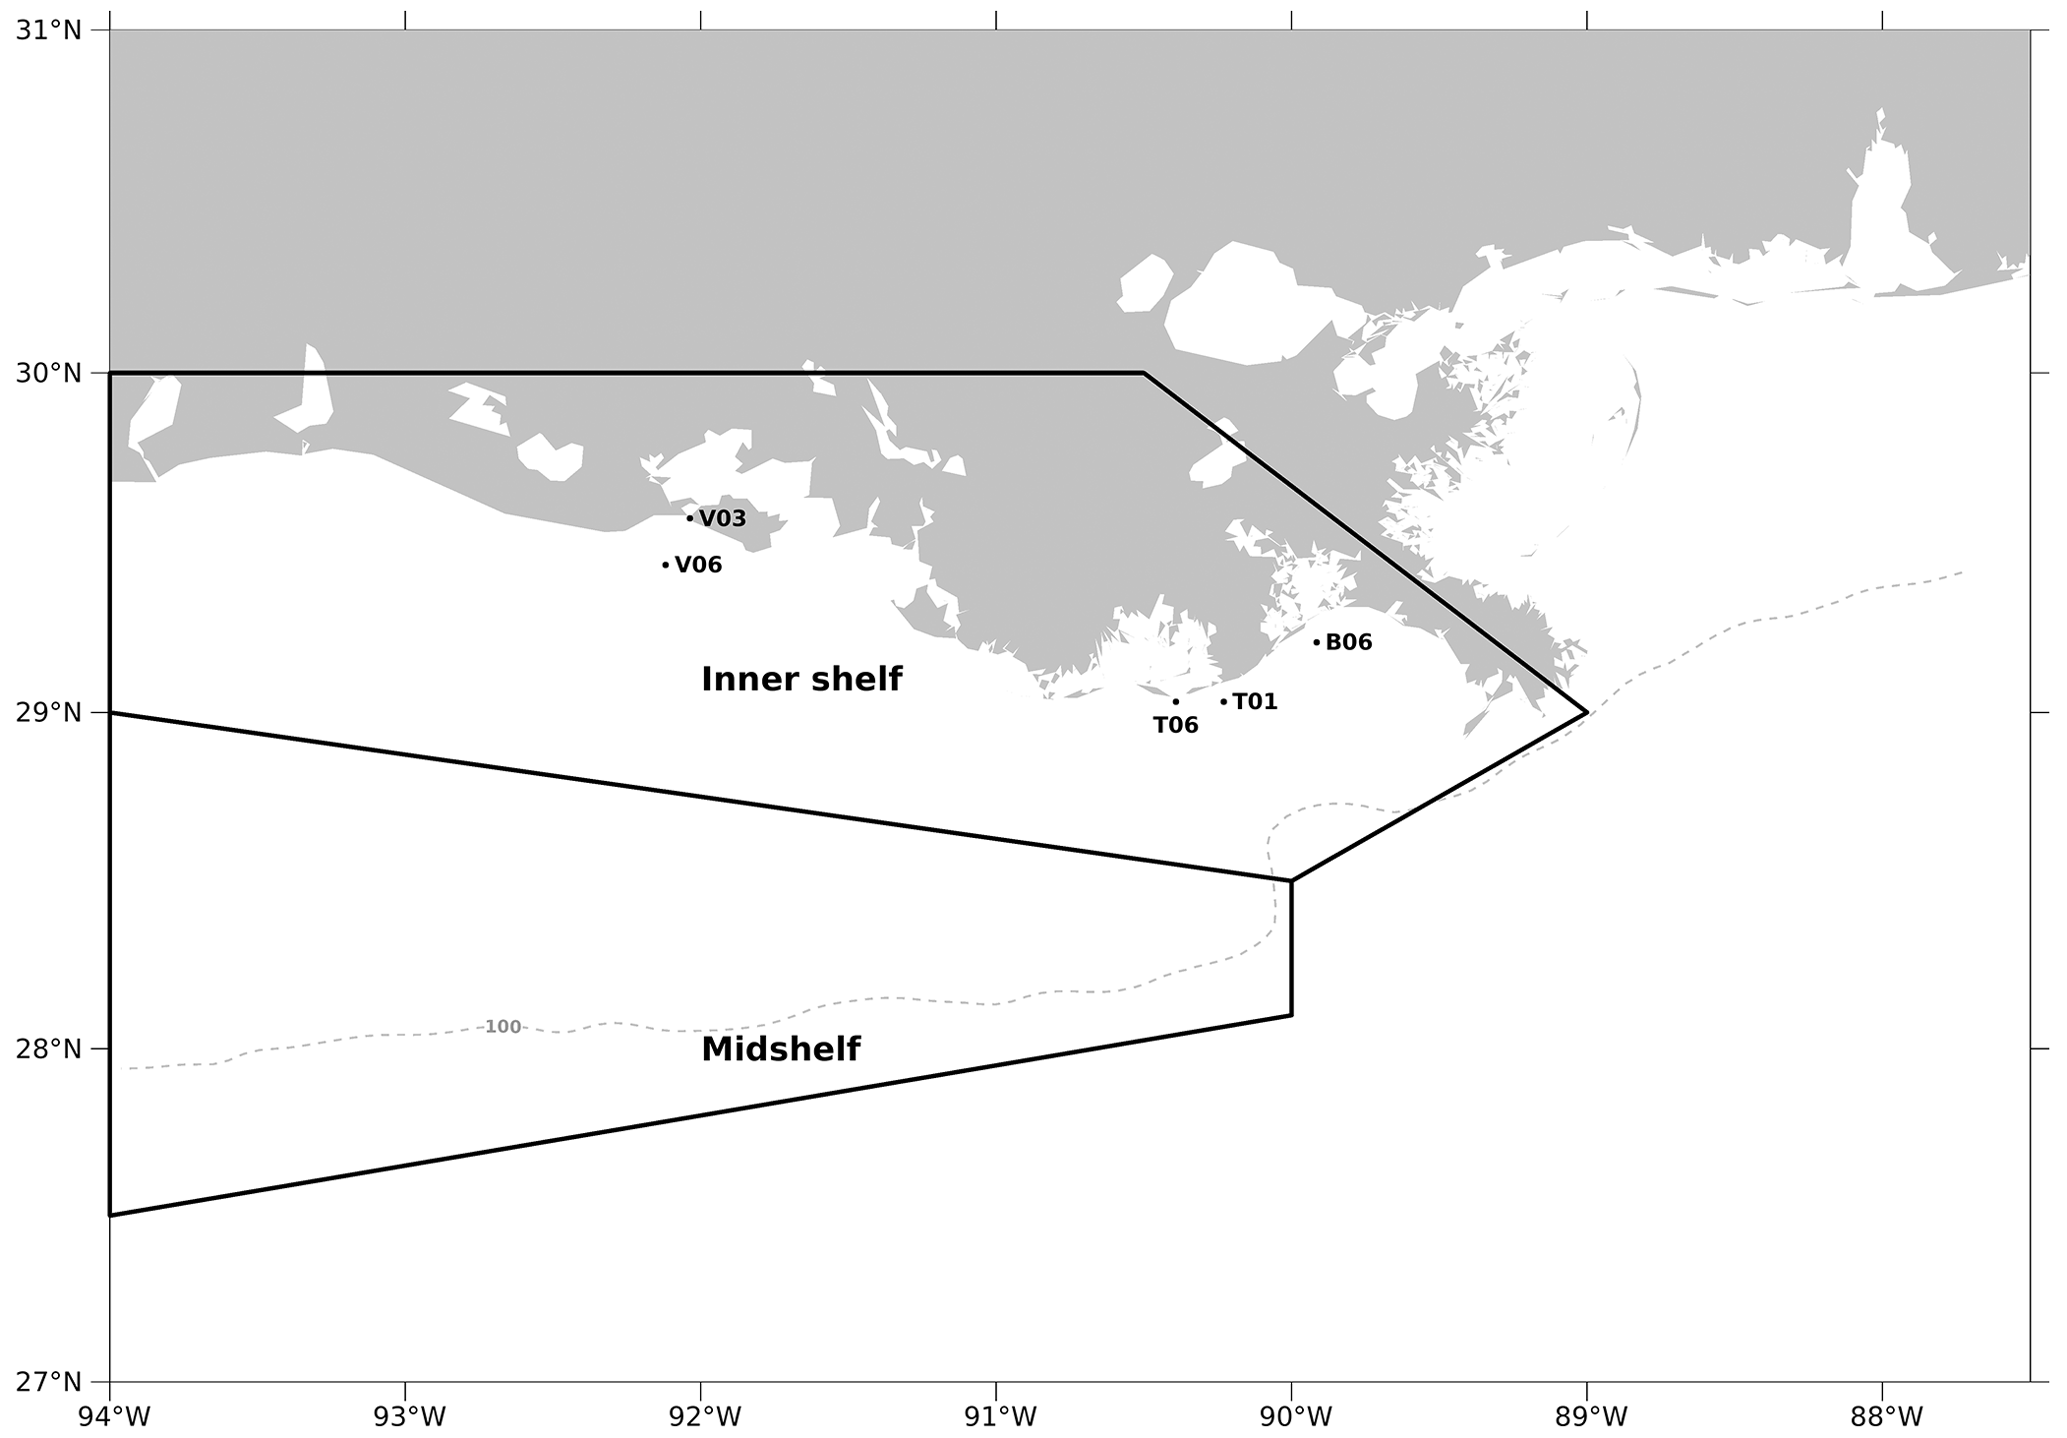
Figure C2The model computational meshes over which the regionally averaged diatom ratios are calculated for validation purposes. Black dots indicate the sampling locations in Schaeffer et al. (2012), while the regions restricted by two black polygons are two regions (i.e., inner shelf and mid-shelf) where samples were collected in the Chakraborty and Lohrenz (2015) study.
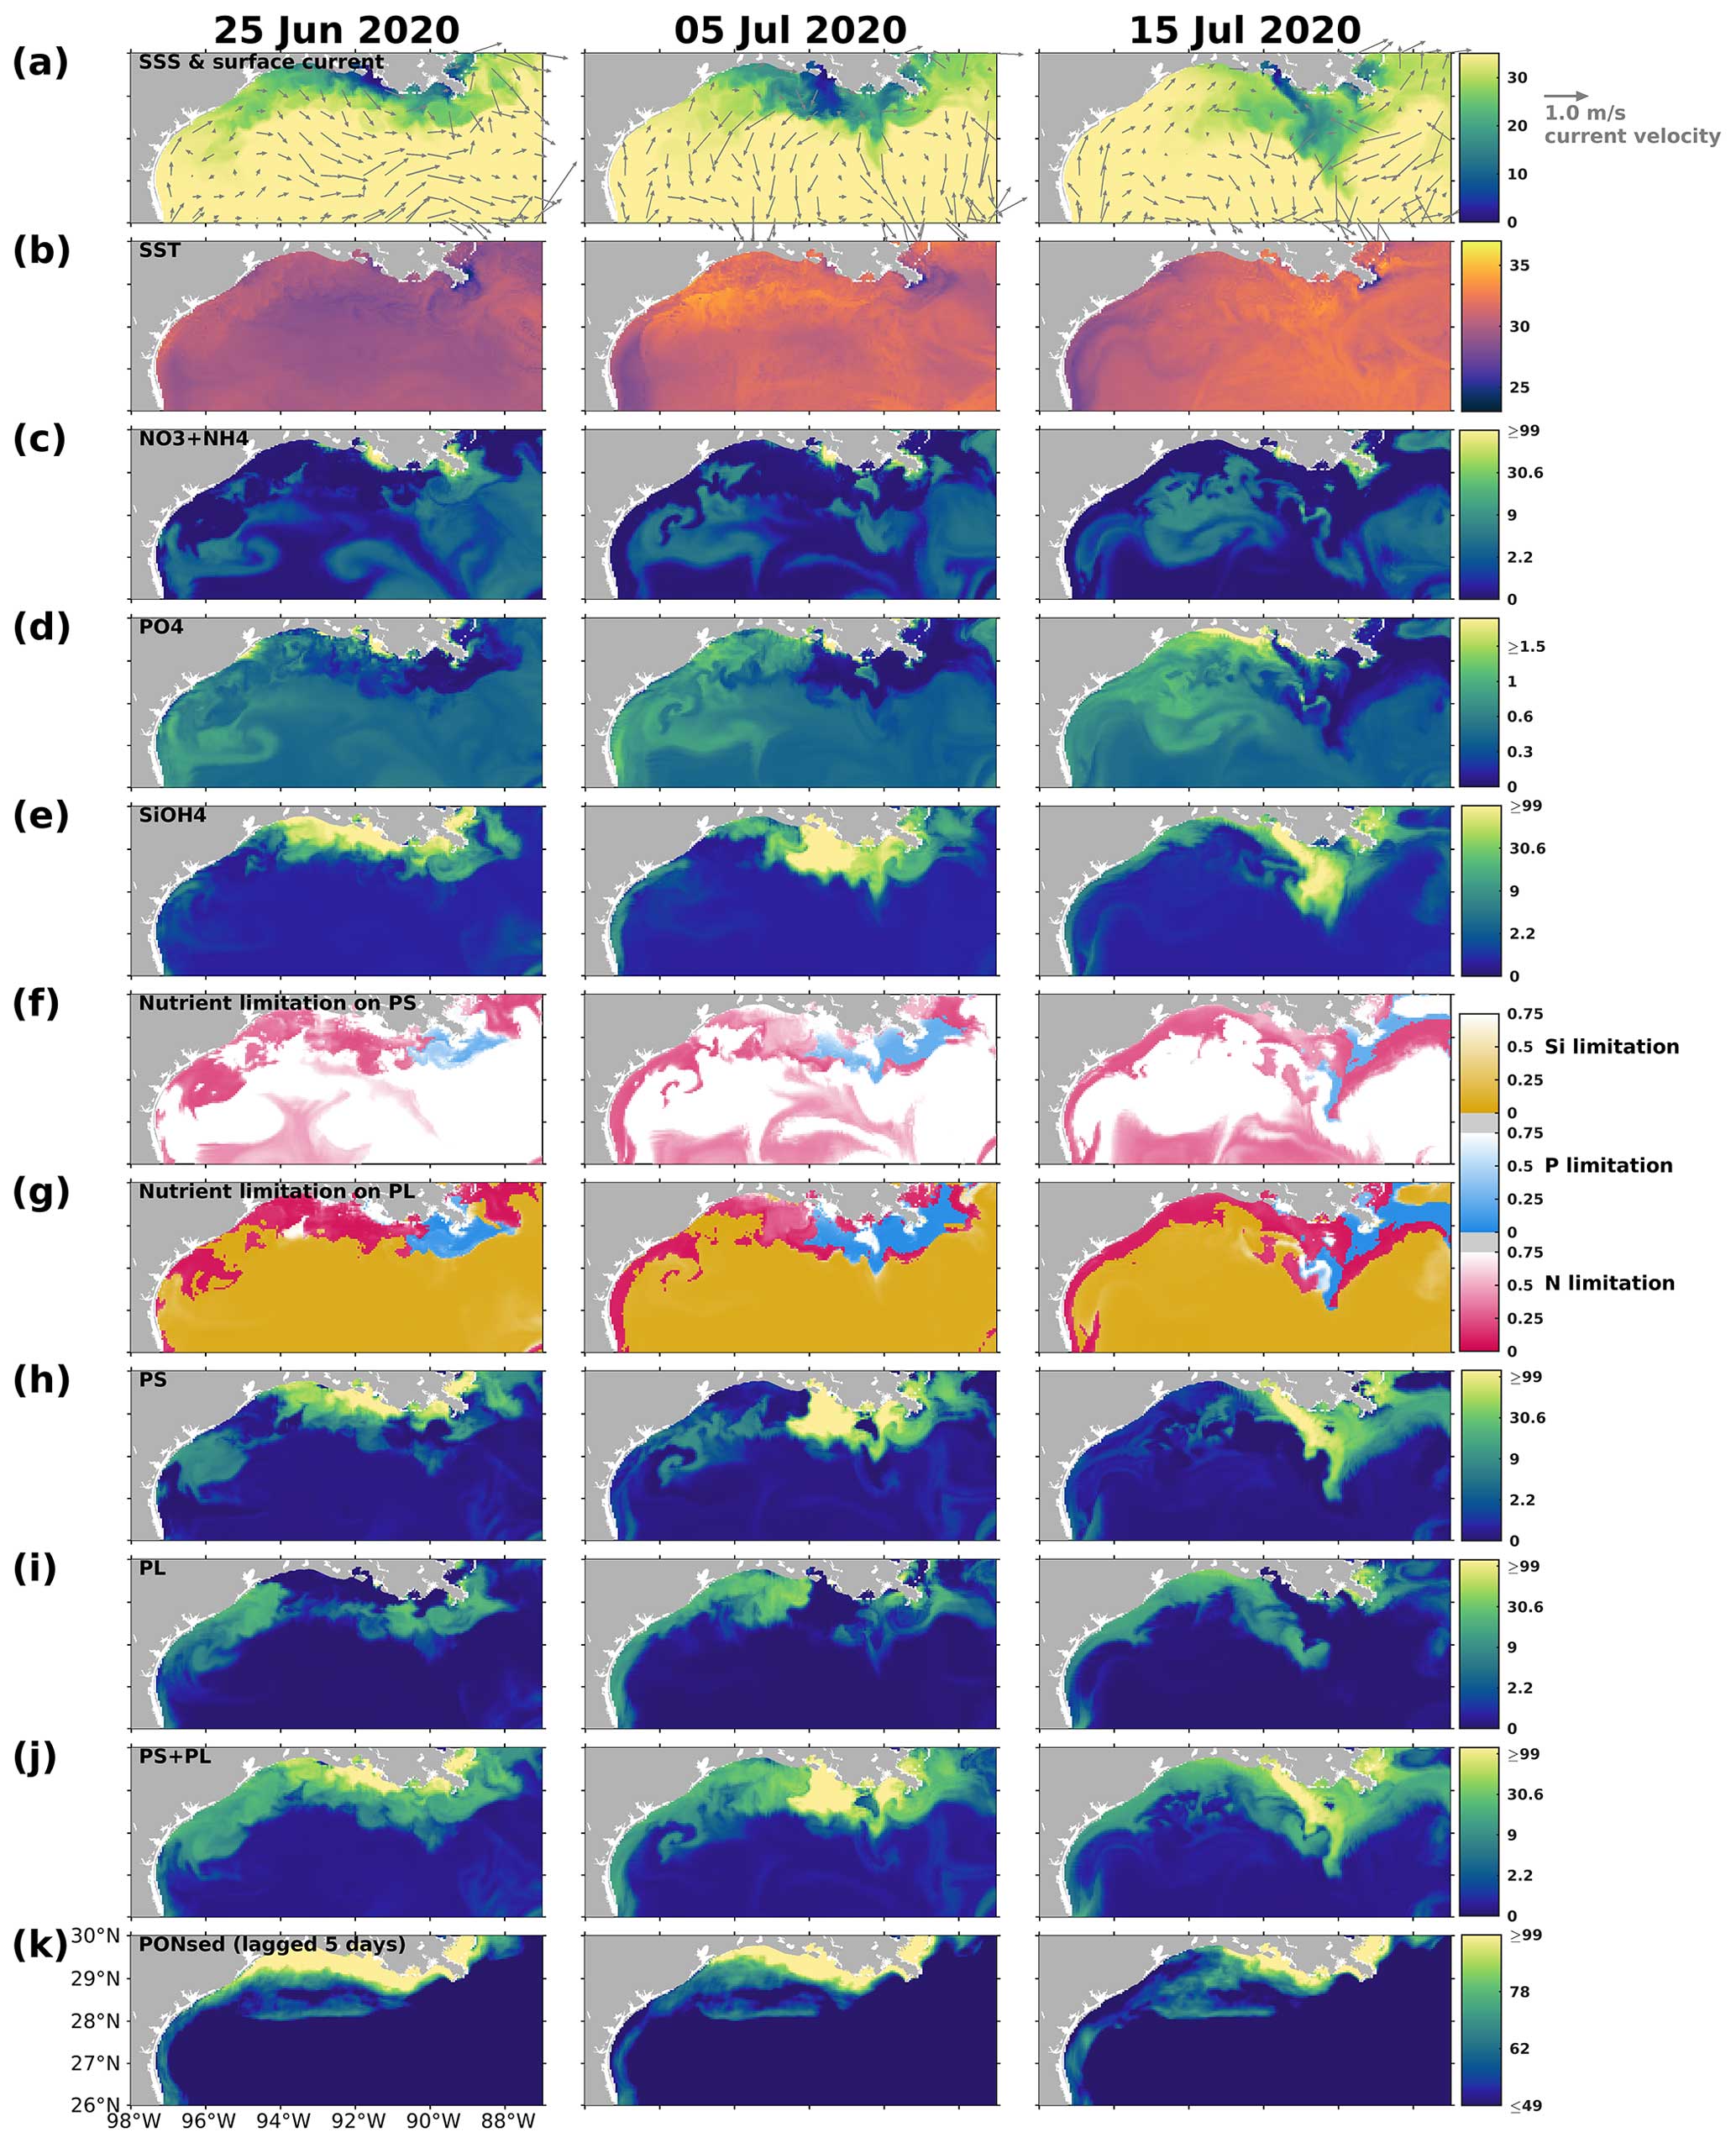
Figure C3Summer snapshots of (a) sea surface salinity (overlaid with surface current velocity), (b) surface temperature (°C), (c) surface total inorganic nitrogen concentration (mmol N m−3), (d) surface phosphate concentration (mmol P m−3), (e) surface silicate concentration (mmol Si m−3), (f–g) surface nutrient limitation coefficients, (h–i) surface phytoplankton concentration (mmol N m−3), and (k) PONsed concentration (mmol N m−3) with a 5 d lag in the nGoM. The nutrient, phytoplankton, and PONsed concentrations are displayed on the log10 scale.
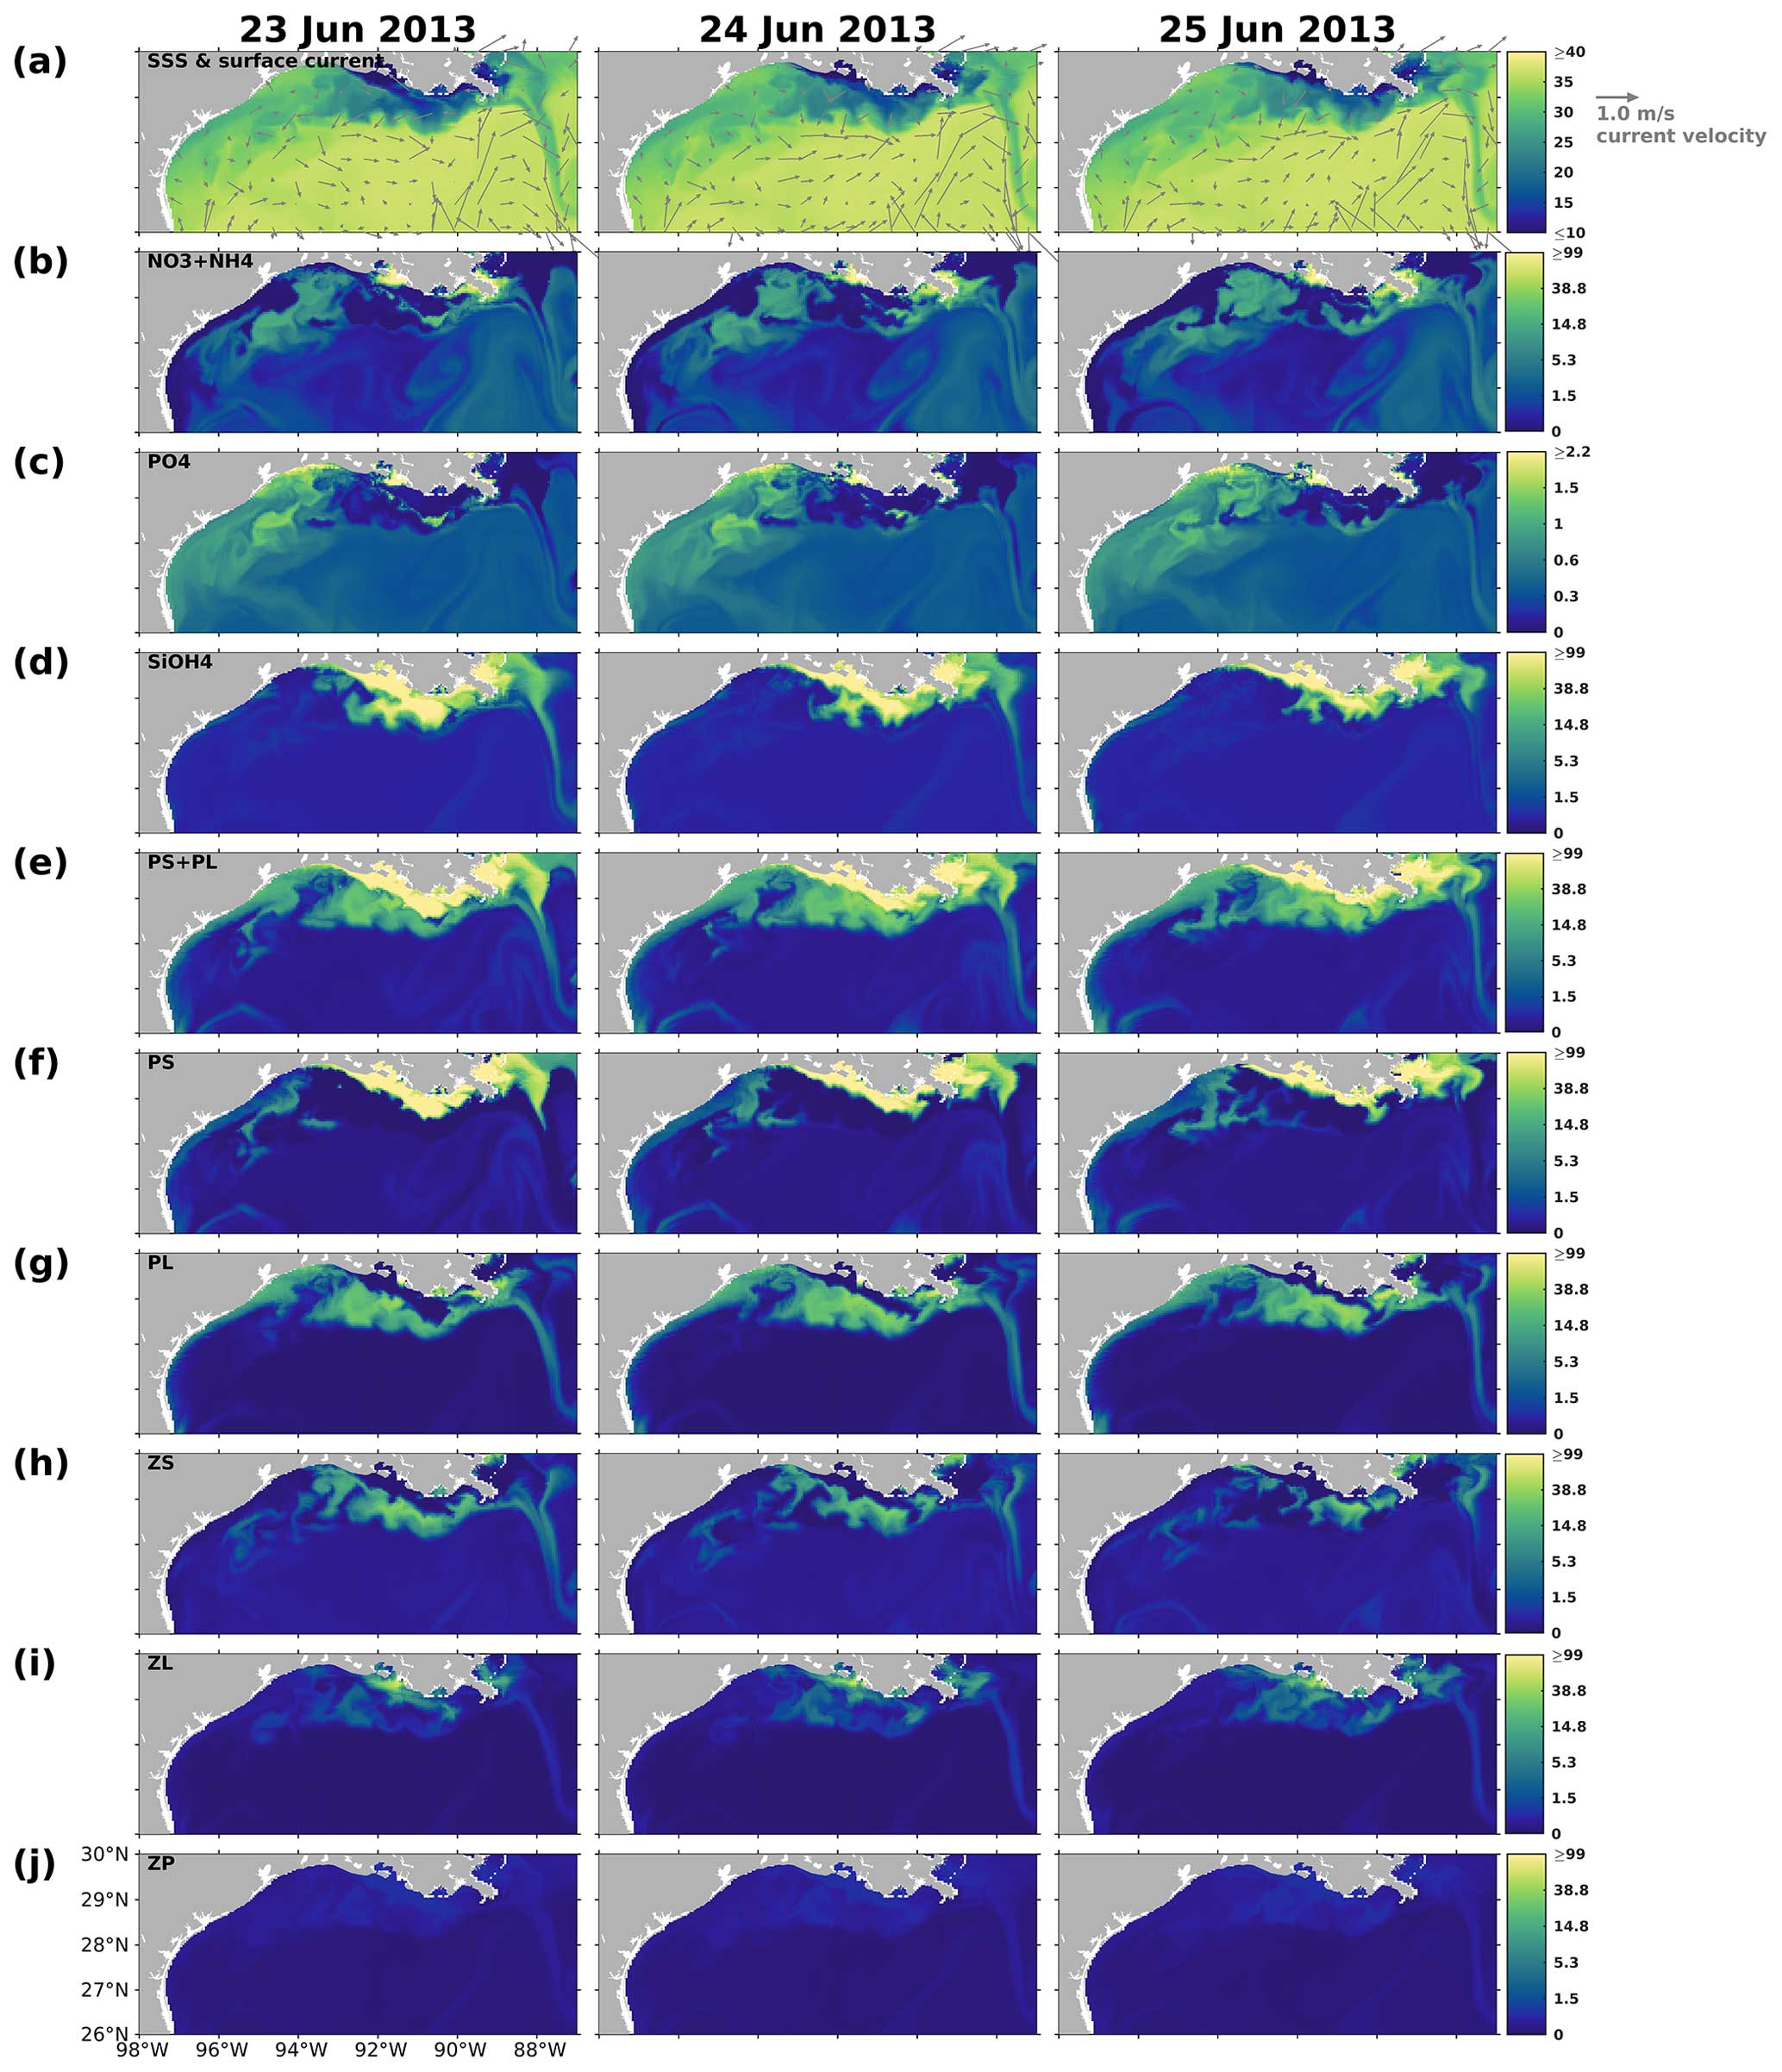
Figure C4Snapshots of (a) sea surface salinity (overlaid with surface current velocity), (b) surface total inorganic nitrogen concentration (mmol N m−3), (c) surface phosphate concentration (mmol P m−3), (d) surface silicate concentration (mmol Si m−3), (e–g) surface phytoplankton concentration (mmol N m−3), and (h–j) surface zooplankton concentration (mmol N m−3). The nutrient and plankton concentrations are displayed on the log10 scale.
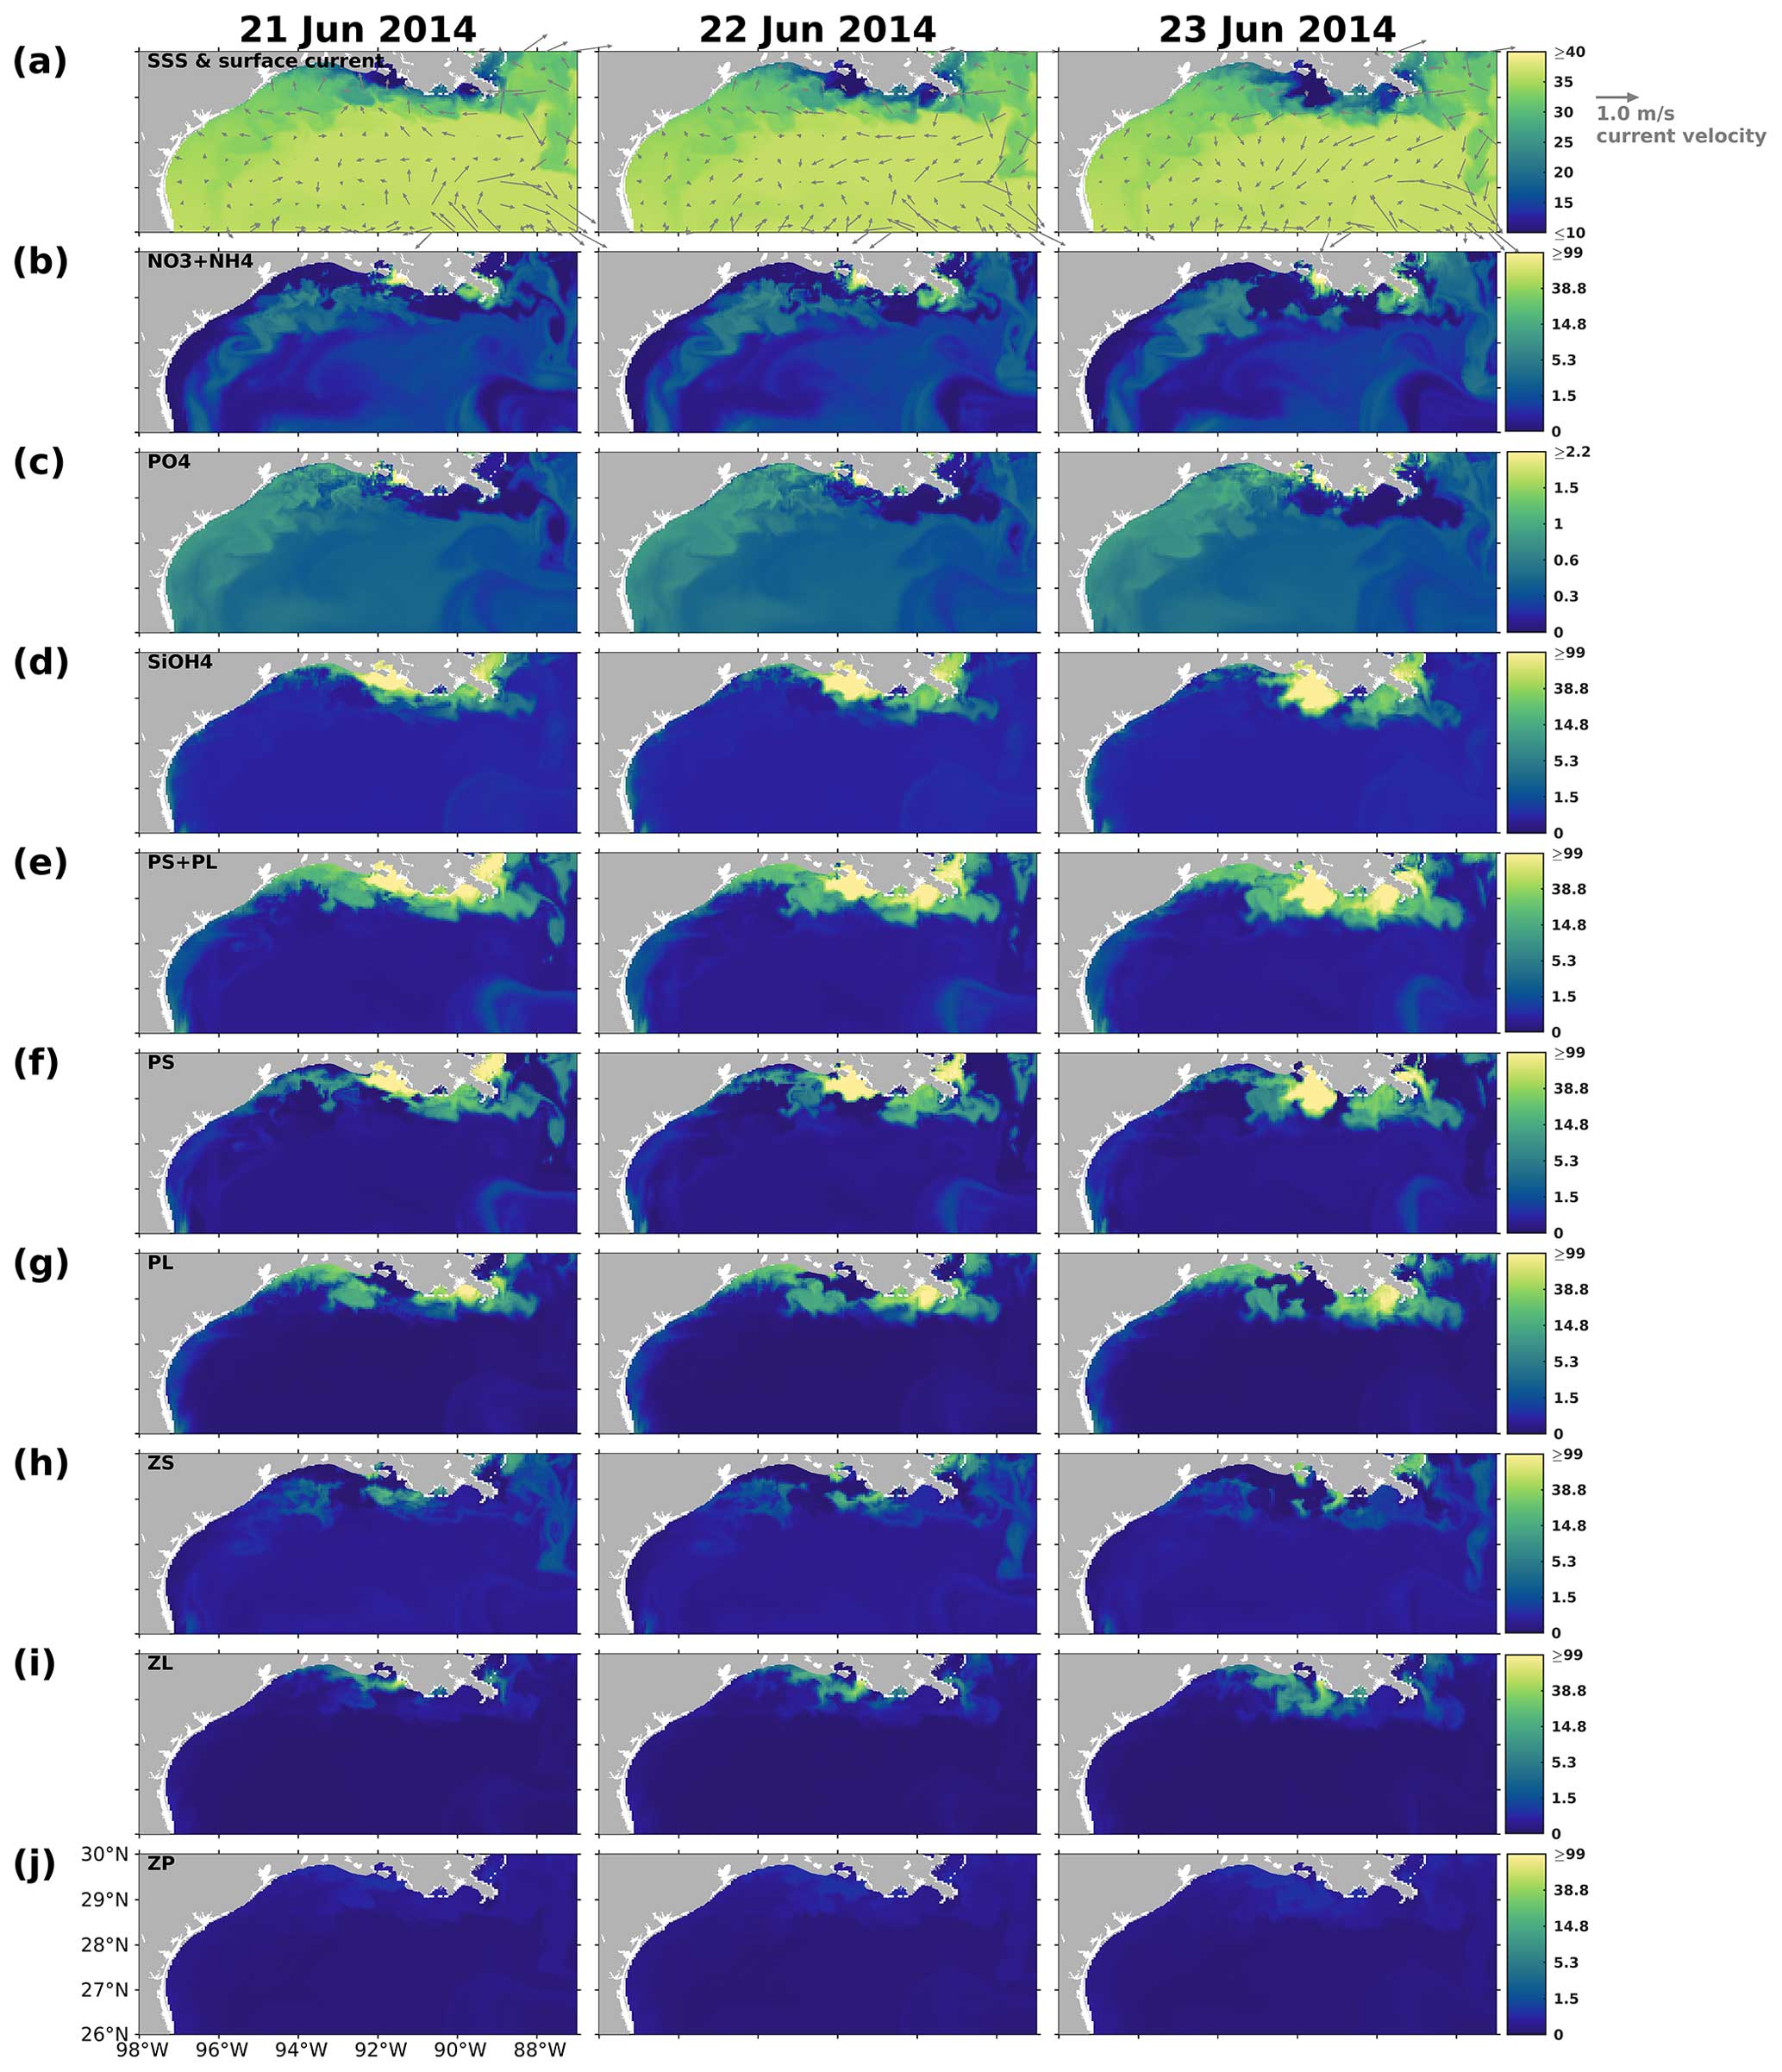
Figure C5Same as Fig. C4, but for snapshots from 21 to 23 June 2014.
The codes and model data supporting the analyses presented in this work are available in the open-access Zenodo repository (Ou, 2024). More model data are available at the LSU mass storage system, and details are on the web page of the Coupled Ocean Modeling Group at LSU (https://faculty.lsu.edu/zxue/, Xue, 2024). Data requests can be sent to the corresponding author via this web page.
ZGX designed the experiments and YO carried them out. YO developed the model code and performed the simulations. YO and ZGX prepared the paper.
The contact author has declared that neither of the authors has any competing interests.
Publisher’s note: Copernicus Publications remains neutral with regard to jurisdictional claims made in the text, published maps, institutional affiliations, or any other geographical representation in this paper. While Copernicus Publications makes every effort to include appropriate place names, the final responsibility lies with the authors.
We thank Jerome Fiechter at UC Santa Cruz for sharing his NEMURO codes and Katja Fennel at Dalhousie University for discussing model parameterization. Computational resources were provided by the High-Performance Computing Facility (clusters SuperMIC and QueenBee3) at Louisiana State University.
This research has been supported by the Bureau of Ocean Energy Management (grant nos. M17AC00019 and M20AC10001).
This paper was edited by Caroline P. Slomp and reviewed by two anonymous referees.
Anglès, S., Jordi, A., Henrichs, D. W., and Campbell, L.: Influence of coastal upwelling and river discharge on the phytoplankton community composition in the northwestern Gulf of Mexico, Prog. Oceanogr., 173, 26–36, https://doi.org/10.1016/j.pocean.2019.02.001, 2019.
Aumont, O. and Bopp, L.: Globalizing results from ocean in situ iron fertilization studies, Global Biogeochem. Cy., 20, GB2017, https://doi.org/10.1029/2005GB002591, 2006.
Azam, F.: Silicic-acid uptake in diatoms studied with [68Ge]germanic acid as tracer, Planta, 121, 205–212, https://doi.org/10.1007/BF00389321, 1974.
Azam, F., Hemmingsen, B. B., and Volcani, B. E.: Role of silicon in diatom metabolism – V. silicic acid transport and metabolism in the heterotrophic diatom Nitzschia alba, Arch. Microbiol., 97, 103–114, https://doi.org/10.1007/BF00403050, 1974.
Bianchi, T. S., DiMarco, S. F., Cowan, J. H., Hetland, R. D., Chapman, P., Day, J. W., and Allison, M. A.: The science of hypoxia in the northern Gulf of Mexico: A review, Sci. Total Environ., 408, 1471–1484, https://doi.org/10.1016/j.scitotenv.2009.11.047, 2010.
Billen, G. and Garnier, J.: River basin nutrient delivery to the coastal sea: Assessing its potential to sustain new production of non-siliceous algae, Mar. Chem., 106, 148–160, https://doi.org/10.1016/j.marchem.2006.12.017, 2007.
Bleck, R.: An oceanic general circulation model framed in hybrid isopycnic-Cartesian coordinates, Ocean Model., 4, 55–88, https://doi.org/10.1016/S1463-5003(01)00012-9, 2002.
Bleck, R. and Boudra, D. B.: Initial testing of a numerical ocean circulation model using a hybrid (quasi-isopycnic) vertical coordinate, J. Phys. Oceanogr., 11, 755–770, https://doi.org/10.1175/1520-0485(1981)011<0755:ITOANO>2.0.CO;2, 1981.
Boyer, T. P., Baranova, O. K., Coleman, C., Garcia, H. E., Grodsky, A., Locarnini, R. A., Mishonov, A. V., Paver, C. R., Reagan, J. R., Seidov, D., Smolyar, I. V, Weathers, K. W., and Zweng, M. M.: World Ocean Database 2018, NOAA Atlas NESDIS 87, edited by: Mishonov, A. V., NOAA, Silver Spring, MD, 207 pp., 2018.
Buitenhuis, E. T., Rivkin, R. B., Séailley, S., and Le Quéré, C.: Biogeochemical fluxes through microzooplankton, Global Biogeochem. Cy., 24, GB4015, https://doi.org/10.1029/2009GB003601, 2010.
Chai, F., Dugdale, R. C., Peng, T., Wilkerson, F. P., and Barber, R. T.: One-dimensional ecosystem model of the equatorial Pacific upwelling system, Part I: model development and silicon and nitrogen cycle, Deep-Sea Res. Pt. II, 49, 2713–2745, 2002.
Chakraborty, S. and Lohrenz, S. E.: Phytoplankton community structure in the river-influenced continental margin of the northern Gulf of Mexico, Mar. Ecol. Prog. Ser., 521, 31–47, https://doi.org/10.3354/meps11107, 2015.
Chakraborty, S., Lohrenz, S. E., and Gundersen, K.: Photophysiological and light absorption properties of phytoplankton communities in the river-dominated margin of the northern Gulf of Mexico, J. Geophys. Res.-Ocean., 122, 4922–4938, https://doi.org/10.1002/2016JC012092, 2017.
Chapman, D. C.: Numerical treatment of cross-shelf open boundaries in a barotropic coastal ocean model, J. Phys.Oceanogr., 15, 1060–1075, https://doi.org/10.1175/1520-0485(1985)015<1060:ntocso>2.0.co;2, 1985.
Cummings, J. A.: Operational multivariate ocean data assimilation, Q. J. R. Meteorol. Soc., 131, 3583–3604, https://doi.org/10.1256/qj.05.105, 2005.
Cummings, J. A. and Smedstad, O. M.: Variational Data Assimilation for the Global Ocean, in: Data Assimilation for Atmospheric, Oceanic and Hydrologic Applications, Vol. II, edited by: Park, S. K. and Xu, L., Springer Berlin Heidelberg, 303–343, https://doi.org/10.1007/978-3-642-35088-7_13, 2013.
Del Amo, Y. and Brzezinski, M. A.: The chemical form of dissolved Si taken up by marine diatoms, J. Phycol., 35, 1162–1170, https://doi.org/10.1046/j.1529-8817.1999.3561162.x, 1999.
Dortch, Q. and Whitledge, T. E.: Does nitrogen or silicon limit phytoplankton production in the Mississippi River plume and nearby regions?, Cont. Shelf Res., 12, 1293–1309, https://doi.org/10.1016/0278-4343(92)90065-R, 1992.
Feng, Y., Fennel, K., Jackson, G. A., DiMarco, S. F., and Hetland, R. D.: A model study of the response of hypoxia to upwelling-favorable wind on the northern Gulf of Mexico shelf, J. Mar. Syst., 131, 63–73, https://doi.org/10.1016/j.jmarsys.2013.11.009, 2014.
Fennel, K. and Laurent, A.: N and P as ultimate and proximate limiting nutrients in the northern Gulf of Mexico: implications for hypoxia reduction strategies, Biogeosciences, 15, 3121–3131, https://doi.org/10.5194/bg-15-3121-2018, 2018.
Fennel, K. and Testa, J. M.: Biogeochemical Controls on Coastal Hypoxia, Ann. Rev. Mar. Sci., 11, 105–130, https://doi.org/10.1146/annurev-marine-010318-095138, 2019.
Fennel, K., Wilkin, J., Levin, J., Moisan, J., O'Reilly, J., and Haidvogel, D.: Nitrogen cycling in the Middle Atlantic Bight: Results from a three-dimensional model and implications for the North Atlantic nitrogen budget, Global Biogeochem. Cy., 20, 1–14, https://doi.org/10.1029/2005GB002456, 2006.
Fennel, K., Hetland, R., Feng, Y., and DiMarco, S.: A coupled physical-biological model of the Northern Gulf of Mexico shelf: model description, validation and analysis of phytoplankton variability, Biogeosciences, 8, 1881–1899, https://doi.org/10.5194/bg-8-1881-2011, 2011.
Fennel, K., Hu, J., Laurent, A., Marta-Almeida, M., and Hetland, R.: Sensitivity of hypoxia predictions for the northern Gulf of Mexico to sediment oxygen consumption and model nesting, J. Geophys. Res.-Ocean., 118, 990–1002, https://doi.org/10.1002/jgrc.20077, 2013.
Fennel, K., Laurent, A., Hetland, R., Justic, D., Ko, D. S., Lehrter, J., Murrell, M., Wang, L., Yu, L., and Zhang, W.: Effects of model physics on hypoxia simulations for the northern Gulf of Mexico: A model intercomparison, J. Geophys. Res.-Ocean., 121, 5731–5750, https://doi.org/10.1002/2015JC011516, 2016.
Fiechter, J. and Moore, A. M.: Interannual spring bloom variability and Ekman pumping in the coastal Gulf of Alaska, J. Geophys. Res.-Ocean., 114, 1–19, https://doi.org/10.1029/2008JC005140, 2009.
Flather, R. A.: A tidal model of the northwest European continental shelf, Mem. Soc. R. Sci. Liege, 10, 141–164, 1976.
Fox, D. N., Teague, W. J., Barron, C. N., Carnes, M. R., and Lee, C. M.: The Modular Ocean Data Assimilation System (MODAS), J. Atmos. Ocean. Technol., 19, 240–252, https://doi.org/10.1175/1520-0426(2002)019<0240:TMODAS>2.0.CO;2, 2002.
Garcia, H. E., Weathers, K., Paver, C. R., Smolyar, I., Boyer, T. P., Locarnini, R. A., Zweng, M. M., Mishonov, A. V., Baranova, O. K., Seidov, D., and Reagan, J. R.: World Ocean Atlas 2018, Vol. 3, Dissolved Oxygen, Apparent Oxygen Utilization, and Oxygen Saturation, NOAA Atlas NESDIS 83, edited by: Mishonov, A. V., NOAA, Silver Spring, MD, 38 pp., 2019.
Gomez, F. A., Lee, S.-K., Liu, Y., Hernandez Jr., F. J., Muller-Karger, F. E., and Lamkin, J. T.: Seasonal patterns in phytoplankton biomass across the northern and deep Gulf of Mexico: a numerical model study, Biogeosciences, 15, 3561–3576, https://doi.org/10.5194/bg-15-3561-2018, 2018.
Große, F., Fennel, K., and Laurent, A.: Quantifying the Relative Importance of Riverine and Open-Ocean Nitrogen Sources for Hypoxia Formation in the Northern Gulf of Mexico, J. Geophys. Res.-Ocean., 124, 5451–5467, https://doi.org/10.1029/2019jc015230, 2019.
Haidvogel, D. B., Arango, H. G., Hedstrom, K., Beckmann, A., Malanotte-Rizzoli, P., and Shchepetkin, A. F.: Model evaluation experiments in the North Atlantic Basin: Simulations in nonlinear terrain-following coordinates, Dynam. Atmos. Ocean., 32, 239–281, https://doi.org/10.1016/S0377-0265(00)00049-X, 2000.
Helber, R.W., Townsend, T. L., Barron, C. N., Dastugue, J. M., and Carnes, M. R.: Validation Test Report for the Improved Synthetic Ocean Profile (ISOP) System, Part I: Synthetic Profile Methods and Algorithm, Memorandum Report, Naval Research Laboratory, Oceanography Division, Stennis Space Center, MS., 125 pp., 2013.
Hetland, R. D. and DiMarco, S. F.: How does the character of oxygen demand control the structure of hypoxia on the Texas-Louisiana continental shelf?, J. Mar. Syst., 70, 49–62, https://doi.org/10.1016/j.jmarsys.2007.03.002, 2008.
Justić, D. and Wang, L.: Assessing temporal and spatial variability of hypoxia over the inner Louisiana-upper Texas shelf: Application of an unstructured-grid three-dimensional coupled hydrodynamic-water quality model, Cont. Shelf Res., 72, 163–179, https://doi.org/10.1016/j.csr.2013.08.006, 2014.
Justić, D., Rabalais, N. N., and Turner, R. E.: Simulated responses of the Gulf of Mexico hypoxia to variations in climate and anthropogenic nutrient loading, J. Mar. Syst., 42, 115–126, https://doi.org/10.1016/S0924-7963(03)00070-8, 2003.
Justić, D., Bierman, V. J. J., Scavia, D., and Hetland, R. D.: Forecasting Gulf's Hypoxia: The Next 50 Years?, Estuar. Coast., 30, 791–801, 2007.
Kishi, M. J., Kashiwai, M., Ware, D. M., Megrey, B. A., Eslinger, D. L., Werner, F. E., Noguchi-Aita, M., Azumaya, T., Fujii, M., Hashimoto, S., Huang, D., Iizumi, H., Ishida, Y., Kang, S., Kantakov, G. A., Kim, H. cheol, Komatsu, K., Navrotsky, V. V., Smith, S. L., Tadokoro, K., Tsuda, A., Yamamura, O., Yamanaka, Y., Yokouchi, K., Yoshie, N., Zhang, J., Zuenko, Y. I., and Zvalinsky, V. I.: NEMURO-a lower trophic level model for the North Pacific marine ecosystem, Ecol. Modell., 202, 12–25, https://doi.org/10.1016/j.ecolmodel.2006.08.021, 2007.
Kristiansen, S. and Hoell, E. E.: The importance of silicon for marine production, Hydrobiologia, 484, 21–31, https://doi.org/10.1023/A:1021392618824, 2002.
Laurent, A. and Fennel, K.: Simulated reduction of hypoxia in the northern Gulf of Mexico due to phosphorus limitation, Elem. Sci. Anthr., 2, 1–12, https://doi.org/10.12952/journal.elementa.000022, 2014.
Laurent, A., Fennel, K., Hu, J., and Hetland, R.: Simulating the effects of phosphorus limitation in the Mississippi and Atchafalaya River plumes, Biogeosciences, 9, 4707–4723, https://doi.org/10.5194/bg-9-4707-2012, 2012.
Laurent, A., Fennel, K., Wilson, R., Lehrter, J., and Devereux, R.: Parameterization of biogeochemical sediment–water fluxes using in situ measurements and a diagenetic model, Biogeosciences, 13, 77–94, https://doi.org/10.5194/bg-13-77-2016, 2016.
Laurent, A., Fennel, K., Ko, D. S., and Lehrter, J.: Climate change projected to exacerbate impacts of coastal Eutrophication in the Northern Gulf of Mexico, J. Geophys. Res.-Ocean., 123, 3408–3426, https://doi.org/10.1002/2017JC013583, 2018.
Li, Q. P., Franks, P. J. S., Landry, M. R., Goericke, R., and Taylor, A. G.: Modeling phytoplankton growth rates and chlorophyll to carbon ratios in California coastal and pelagic ecosystems, J. Geophys. Res.-Biogeo., 115, 1–12, https://doi.org/10.1029/2009JG001111, 2010.
Li, Y., Hu, C., Quigg, A., and Gao, H.: Potential influence of the Deepwater Horizon oil spill on phytoplankton primary productivity in the northern Gulf of Mexico, Environ. Res. Lett., 14, 094018, https://doi.org/10.1088/1748-9326/ab3735, 2019.
Lohrenz, S. E., Fahnenstiel, G. L., Redalje, D. G., Lang, G. A., Dagg, M. J., Whitledge, T. E., and Dortch, Q.: Nutrients, irradiance, and mixing as factors regulating primary production in coastal waters impacted by the Mississippi River plume, Cont. Shelf Res., 19, 1113–1141, https://doi.org/10.1016/S0278-4343(99)00012-6, 1999.
Marchesiello, P., McWilliams, J. C., and Shchepetkin, A.: Open boundary conditions for long-term integration of regional oceanic models, Ocean Model., 3, 1–20, https://doi.org/10.1016/S1463-5003(00)00013-5, 2001.
Mattern, J. P., Fennel, K., and Dowd, M.: Sensitivity and uncertainty analysis of model hypoxia estimates for the Texas-Louisiana shelf, J. Geophys. Res.-Ocean., 118, 1316–1332, https://doi.org/10.1002/jgrc.20130, 2013.
McCarthy, M. J., Carini, S. A., Liu, Z., Ostrom, N. E., and Gardner, W. S.: Oxygen consumption in the water column and sediments of the northern Gulf of Mexico hypoxic zone, Estuar. Coast. Shelf Sci., 123, 46–53, https://doi.org/10.1016/j.ecss.2013.02.019, 2013.
Milligan, A. J., Varela, D. E., Brzezinski, M. A., and Morel, F. M. M.: Dynamics of silicon metabolism and silicon isotopic discrimination in a marine diatom as a function of pCO2, Limnol. Oceanogr., 49, 322–329, https://doi.org/10.4319/lo.2004.49.2.0322, 2004.
Mississippi River/Gulf of Mexico Watershed Nutrient Task Force: Gulf hypoxia Action Plan 2008 for reducing, mitigating, and controlling Hypoxia in the Northern Gulf of Mexico and improving water quality on the Mississippi River Basin, Tech. rep., US Environmental Protection Agency, Washington DC, 61 pp., 2008.
Moore, J. K., Doney, S. C., and Lindsay, K.: Upper ocean ecosystem dynamics and iron cycling in a global three-dimensional model, Global Biogeochem. Cy., 18, 1–21, https://doi.org/10.1029/2004GB002220, 2004.
Moriarty, J. M., Harris, C. K., Friedrichs, M. A. M., Fennel, K., and Xu, K.: Impact of Seabed Resuspension on Oxygen and Nitrogen Dynamics in the Northern Gulf of Mexico: A Numerical Modeling Study, J. Geophys. Res.-Ocean., 123, 7237–7263, https://doi.org/10.1029/2018JC013950, 2018.
Murrell, M. C. and Lehrter, J. C.: Sediment and Lower Water Column Oxygen Consumption in the Seasonally Hypoxic Region of the Louisiana Continental Shelf, Estuar. Coast., 34, 912–924, https://doi.org/10.1007/s12237-010-9351-9, 2011.
Murrell, M. C., Stanley, R. S., Lehrter, J. C., and Hagy, J. D.: Plankton community respiration, net ecosystem metabolism, and oxygen dynamics on the Louisiana continental shelf: Implications for hypoxia, Cont. Shelf Res., 52, 27–38, https://doi.org/10.1016/j.csr.2012.10.010, 2013.
Nelson, D. M. and Dortch, Q.: Silicic acid depletion and silicon limitation in the plume of the Mississippi River: Evidence from kinetic studies in spring and summer, Mar. Ecol. Prog. Ser., 136, 163–178, https://doi.org/10.3354/meps136163, 1996.
Nelson, D. M., Goering. John J., Kilham, S. S., and Guillard., R. R. L.: Kinetics of silicic acid uptake and rates of silica dissolution in the marine diatom Thalassiosira pseudonana, J. Phycol, 12, 246–252, https://doi.org/10.1111/j.1529-8817.1976.tb00510.x, 1976.
Olson, R. J.: Differential photoinhibition of marine nitrifying bacteria: a possible mechanism for the formation of the primary nitrite maximum, J. Mar. Res., 39, 227–238, 1981.
Ou, Y.: Supported codes and data for “Hydrodynamic and biochemical impacts on the development of hypoxia in the Louisiana–Texas shelf Part 1: roles of nutrient limitation and plankton community”, Zenodo [code and data set], https://doi.org/10.5281/zenodo.10946604, 2024.
Parker, R. A.: Dynamic models for ammonium inhibition of nitrate uptake by phytoplankton, Ecol. Modell., 66, 113–120, https://doi.org/10.1016/0304-3800(93)90042-Q, 1993.
Platt, T., Gallegos, C. L., and Harrison, W. G.: Photoinhibition of photosynthesis in natural assemblages of marine phytoplankton, J. Mar. Res., 38, 687–701, 1980.
Qian, Y., Jochens, A. E., Kennicutt, M. C., and Biggs, D. C.: Spatial and temporal variability of phytoplankton biomass and community structure over the continental margin of the northeast Gulf of Mexico based on pigment analysis, Cont. Shelf Res., 23, 1–17, https://doi.org/10.1016/S0278-4343(02)00173-5, 2003.
Quigg, A., Sylvan, J. B., Gustafson, A. B., Fisher, T. R., Oliver, R. L., Tozzi, S., and Ammerman, J. W.: Going West: Nutrient Limitation of Primary Production in the Northern Gulf of Mexico and the Importance of the Atchafalaya River, Aquat. Geochem., 17, 519–544, https://doi.org/10.1007/s10498-011-9134-3, 2011.
Rabalais, N. N. and Baustian, M. M.: Historical Shifts in Benthic Infaunal Diversity in the Northern Gulf of Mexico since the Appearance of Seasonally Severe Hypoxia, Diversity, 12, 49, https://doi.org/10.3390/d12020049, 2020.
Rabalais, N. N. and Turner, R. E.: Gulf of Mexico Hypoxia: Past, Present, and Future, Limnol. Oceanogr. Bull., 28, 117–124, https://doi.org/10.1002/lob.10351, 2019.
Rabalais, N. N., Turner, R. E., Justic, D., Dortch, Q., and Wiseman, W. J.: Characterization of Hypoxia: Topic 1 Report for the Integrated Assessment on Hypoxia in the Gulf of Mexico, NOAA Coastal Ocean Program Decision Analysis Series No. 15, NOAA Coastal Ocean Program, Silver Spring, MD, 167 pp., 1999.
Rabalais, N. N., Turner, R. E., and Wiseman, W. J.: Gulf of Mexico hypoxia, a.k.a. “The dead zone,” Annu. Rev. Ecol. Syst., 33, 235–263, https://doi.org/10.1146/annurev.ecolsys.33.010802.150513, 2002.
Rabalais, N. N., Turner, R. E., Sen Gupta, B. K., Boesch, D. F., Chapman, P., and Murrell, M. C.: Hypoxia in the northern Gulf of Mexico: Does the science support the plan to reduce, mitigate, and control hypoxia?, Estuar. Coast., 30, 753–772, https://doi.org/10.1007/BF02841332, 2007a.
Rabalais, N. N., Turner, R. E., Gupta, B. K. S., Platon, E., and Parsons, M. L.: Sediments tell the history of eutrophication and hypoxia in the northern Gulf of Mexico, Ecol. Appl., 17, 129–143, https://doi.org/10.1890/06-0644.1, 2007b.
Robertson, R. and Hartlipp, P.: Surface wind mixing in the Regional Ocean Modeling System (ROMS), Geosci. Lett., 4, 24, https://doi.org/10.1186/s40562-017-0090-7, 2017.
Rowe, G. T., Cruz Kaegi, M. E., Morse, J. W., Boland, G. S., and Escobar Briones, E. G.: Sediment community metabolism associated with continental shelf hypoxia, northern Gulf of Mexico, Estuar. Coast., 25, 1097–1106, https://doi.org/10.1007/BF02692207, 2002.
Royer, T. V.: Stoichiometry of nitrogen, phosphorus, and silica loads in the Mississippi-Atchafalaya River basin reveals spatial and temporal patterns in risk for cyanobacterial blooms, Limnol. Oceanogr., 65, 325–335, https://doi.org/10.1002/lno.11300, 2020.
Saha, S., Moorthi, S., Pan, H.-L., Wu, X., Wang, J., Nadiga, S., Tripp, P., Kistler, R., Woollen, J., Behringer, D., Liu, H., Stokes, D., Grumbine, R., Gayno, G., Wang, J., Hou, Y.-T., Chuang, H.-Y., Juang, H.-M. H., Sela, J., Iredell, M., Treadon, R., Kleist, D., Van Delst, P., Keyser, D., Derber, J., Ek, M., Meng, J., Wei, H., Yang, R., Lord, S., van den Dool, H., Kumar, A., Wang, W., Long, C., Chelliah, M., Xue, Y., Huang, B., Schemm, J.-K., Ebisuzaki, W., Lin, R., Xie, P., Chen, M., Zhou, S., Higgins, W., Zou, C.-Z., Liu, Q., Chen, Y., Han, Y., Cucurull, L., Reynolds, R. W., Rutledge, G., and Goldberg, M.: NCEP Climate Forecast System Reanalysis (CFSR) 6-hourly Products [data set], January 1979 to December 2010, https://doi.org/10.5065/D69K487J, 2010.
Saha, S., Moorthi, S., Wu, X., Wang, J., Nadiga, S., Tripp, P., Behringer, D., Hou, Y.-T., Chuang, H., Iredell, M., Ek, M., Meng, J., Yang, R., Mendez, M. P., van den Dool, H., Zhang, Q., Wang, W., Chen, M., and Becker, E.: NCEP Climate Forecast System Version 2 (CFSv2) 6-hourly Products [data set], https://doi.org/10.5065/D61C1TXF, 2011.
Schaeffer, B. A., Kurtz, J. C., and Hein, M. K.: Phytoplankton community composition in nearshore coastal waters of Louisiana, Mar. Pollut. Bull., 64, 1705–1712, https://doi.org/10.1016/j.marpolbul.2012.03.017, 2012.
Seitzinger, S. P. and Giblin, A. E.: Estimating denitrification in North Atlantic continental shelf sediments, in: Nitrogen Cycling in the North Atlantic Ocean and its Watersheds, edited by: Howarth, R. W., Springer Dordrecht, 235–260, https://doi.org/10.1007/978-94-009-1776-7_7, 1996.
Shchepetkin, A. F. and McWilliams, J. C.: The regional oceanic modeling system (ROMS): A split-explicit, free-surface, topography-following-coordinate oceanic model, Ocean Model., 9, 347–404, https://doi.org/10.1016/j.ocemod.2004.08.002, 2005.
Shchepetkin, A. F. and McWilliams, J. C.: Correction and commentary for “Ocean forecasting in terrain-following coordinates: Formulation and skill assessment of the regional ocean modeling system” by Haidvogel et al., J. Comp. Phys. 227, pp. 3595–3624, J. Comput. Phys., 228, 8985–9000, https://doi.org/10.1016/j.jcp.2009.09.002, 2009.
Shropshire, T. A., Morey, S. L., Chassignet, E. P., Bozec, A., Coles, V. J., Landry, M. R., Swalethorp, R., Zapfe, G., and Stukel, M. R.: Quantifying spatiotemporal variability in zooplankton dynamics in the Gulf of Mexico with a physical–biogeochemical model, Biogeosciences, 17, 3385–3407, https://doi.org/10.5194/bg-17-3385-2020, 2020.
Smith, S. M. and Hitchcock, G. L.: Nutrient enrichments and phytoplankton growth in the surface waters of the Louisiana Bight, Estuar. Coast., 17, 740–753, https://doi.org/10.2307/1352744, 1994.
Strom, S. L. and Strom, M. W.: Microplankton growth, grazing, and community structure in the northern Gulf of Mexico, Mar. Ecol. Prog. Ser., 130, 229–240, https://doi.org/10.3354/meps130229, 1996.
Sylvan, J. B., Dortch, Q., Nelson, D. M., Brown, A. F. M., Morrison, W., and Ammerman, J. W.: Phosphorus limits phytoplankton growth on the Louisiana shelf during the period of hypoxia formation, Environ. Sci. Technol., 40, 7548–7553, https://doi.org/10.1021/es061417t, 2006.
Sylvan, J. B., Quigg, A., Tozzi, S., and Ammerman, J. W.: Eutrophication-induced phosphorus limitation in the Mississippi River plume: Evidence from fast repetition rate fluorometry, Limnol. Oceanogr., 52, 2679–2685, https://doi.org/10.4319/lo.2007.52.6.2679, 2007.
Testa, J. M. and Michael Kemp, W.: Hypoxia-induced shifts in nitrogen and phosphorus cycling in Chesapeake Bay, Limnol. Oceanogr., 57, 835–850, https://doi.org/10.4319/lo.2012.57.3.0835, 2012.
Thamatrakoln, K. and Hildebrand, M.: Silicon uptake in diatoms revisited: A model for saturable and nonsaturable uptake kinetics and the role of silicon transporters, Plant Physiol., 146, 1397–1407, https://doi.org/10.1104/pp.107.107094, 2008.
Turner, R. and Rabalais, N.: Nitrogen and phosphorus phytoplankton growth limitation in the northern Gulf of Mexico, Aquat. Microb. Ecol., 68, 159–169, https://doi.org/10.3354/ame01607, 2013.
Wang, L. and Justić, D.: A modeling study of the physical processes affecting the development of seasonal hypoxia over the inner Louisiana-Texas shelf: Circulation and stratification, Cont. Shelf Res., 29, 1464–1476, https://doi.org/10.1016/j.csr.2009.03.014, 2009.
Wanninkhof, R.: Relationship Between Wind Speed and Gas Exchange Over the Ocean, J. Geophys. Res., 97, 7373–7382, https://doi.org/10.1029/92JC00188, 1992.
Warner, J. C., Geyer, W. R., and Lerczak, J. A.: Numerical modeling of an estuary: A comprehensive skill assessment, J. Geophys. Res. Pt. C, 110, 1–13, https://doi.org/10.1029/2004JC002691, 2005.
Warner, J. C., Armstrong, B., He, R., and Zambon, J. B.: Development of a Coupled Ocean-Atmosphere-Wave-Sediment Transport (COAWST) Modeling System, Ocean Model., 35, 230–244, https://doi.org/10.1016/j.ocemod.2010.07.010, 2010.
Warner, J. C., Defne, Z., Haas, K., and Arango, H. G.: A wetting and drying scheme for ROMS, Comput. Geosci., 58, 54–61, https://doi.org/10.1016/j.cageo.2013.05.004, 2013.
Wawrik, B. and Paul, J. H.: Phytoplankton community structure and productivity along the axis of the Mississippi River plume in oligotrophic Gulf of Mexico waters, Aquat. Microb. Ecol., 35, 185–196, https://doi.org/10.3354/ame035185, 2004.
Xue, Z.: https://faculty.lsu.edu/zxue/ [data set], last access: 15 May 2024.
Yingling, N., Kelly, T. B., Shropshire, T. A., Landry, M. R., Selph, K. E., Knapp, A. N., Kranz, S. A., Stukel, M. R., and Moisander, P.: Taxon-specific phytoplankton growth, nutrient utilization and light limitation in the oligotrophic Gulf of Mexico, J. Plankton Res., 44, 656–676, https://doi.org/10.1093/plankt/fbab028, 2022.
Yu, L., Fennel, K., and Laurent, A.: A modeling study of physical controls on hypoxia generation in the northern Gulf of Mexico, J. Geophys. Res.-Ocean., 120, 5019–5039, https://doi.org/10.1002/2014JC010634, 2015.
Zang, Z., Xue, Z. G., Bao, S., Chen, Q., Walker, N. D., Haag, A. S., Ge, Q., and Yao, Z.: Numerical study of sediment dynamics during hurricane Gustav, Ocean Model., 126, 29–42, https://doi.org/10.1016/j.ocemod.2018.04.002, 2018.
Zang, Z., Xue, Z. G., Xu, K., Bentley, S. J., Chen, Q., D'Sa, E. J., and Ge, Q.: A Two Decadal (1993–2012) Numerical Assessment of Sediment Dynamics in the Northern Gulf of Mexico, Water, 11, 938, https://doi.org/10.3390/w11050938, 2019.
Zang, Z., Xue, Z. G., Xu, K., Ozdemir, C. E., Chen, Q., Bentley, S. J., and Sahin, C.: A Numerical Investigation of Wave-Supported Gravity Flow During Cold Fronts Over the Atchafalaya Shelf, J. Geophys. Res.-Ocean., 125, 1–24, https://doi.org/10.1029/2019JC015269, 2020.
Zhang, Y., Hu, C., Barnes, B. B., Liu, Y., Kourafalou, V. H., McGillicuddy, D. J., Cannizzaro, J. P., English, D. C., and Lembke, C.: Bio-Optical, Physical, and Chemical Properties of a Loop Current Eddy in the Gulf of Mexico, J. Geophys. Res.-Ocean., 128, e2022JC018726, https://doi.org/10.1029/2022JC018726, 2023.
Zhao, Y. and Quigg, A.: Nutrient limitation in Northern Gulf of Mexico (NGOM): Phytoplankton communities and photosynthesis respond to nutrient pulse, PLoS One, 9, e88732, https://doi.org/10.1371/journal.pone.0088732, 2014.
- Abstract
- Introduction
- Methods
- Biogeochemical model validations
- Results and discussion
- Conclusions
- Appendix A: Expressions of process terms modified in this study
- Appendix B: Descriptions of terms and parameters
- Appendix C: Supporting figures
- Code and data availability
- Author contributions
- Competing interests
- Disclaimer
- Acknowledgements
- Financial support
- Review statement
- References