the Creative Commons Attribution 4.0 License.
the Creative Commons Attribution 4.0 License.
 | 29 May 2024
Sorption of colored vs. noncolored organic matter by tidal marsh soils
J. Patrick Megonigal
Maria Tzortziou
Elizabeth A. Canuel
Christina R. Pondell
Hannah Morrissette
Tidal marshes are significant sources of colored (or chromophoric) dissolved organic carbon (CDOC) to adjacent waters and, as a result, contribute substantially to their optical complexity and ultimately affect their water quality. Despite this, our mechanistic understanding of the processes that regulate the exchange and transformation of CDOC at the tidal marsh–estuarine interface remains limited. We hypothesized that tidal marsh soils regulate this exchange and transformation subject to soil mineralogy and salinity environment. To test this hypothesis, we generated initial mass sorption isotherms of CDOC and noncolored dissolved organic carbon (NCDOC) using anaerobic batch incubations of Great Dismal Swamp DOC with four tidal wetland soils, representing a range of organic carbon content (1.77 ± 0.12 % to 36.2 ± 2.2 %) and across four salinity treatments (0, 10, 20, and 35). CDOC sorption followed Langmuir isotherms that were similar in shape to those of total DOC, but with greater maximum sorption capacity and lower binding affinity. Like isotherms of total DOC, CDOC maximum sorption capacity increased and binding affinity decreased with greater salinity. Initial natively adsorbed colored organic carbon was low and increased with soil organic content. In contrast, NCDOC desorbed under all conditions with desorption increasing linearly with initial CDOC concentration. This suggests that for our test solutions CDOC displaced NCDOC on tidal marsh soils. Parallel factor analysis of 3-D excitation emission matrices and specific ultraviolet absorbance measurements suggested that CDOC sorption was driven primarily by the exchange of highly aromatic humic-like CDOC. Taken together, these results suggest that tidal marsh soils regulate export and composition of CDOC depending on the complex interplay between soil mineralogy, water salinity, and CDOC vs. NCDOC composition.
- Article
(2486 KB) - Full-text XML
-
Supplement
(1207 KB) - BibTeX
- EndNote


Tidal marshes are important sources to adjacent waters of colored or chromophoric dissolved organic matter (CDOM; see Appendix A Table A1 for a list of all abbreviations), the fraction of dissolved organic matter (DOM) that absorbs electromagnetic radiation across the ultraviolet (UV) and visible light spectrum (Tzortziou et al., 2008; Knobloch et al., 2022). Studies have found that CDOM composition in flooding and ebbing tidal waters differs, with more strongly colored and aromatic CDOM of higher average molecular weight and polydispersity (breadth of the molecular weight distribution) being exported from tidal marshes into estuarine waters during ebbing tide relative to that imported into marshes during flooding tide (Tzortziou et al., 2008, 2011). This suggests that the exchange and transformation of CDOM at the tidal marsh–estuarine interface contributes substantially to the optical complexity of both estuarine and coastal waters. This complexity, in turn, can impact downstream productivity and water quality. For example, polyphenolic humic substances, an important constituent of CDOM, serve as a source of energy and nutrients to aquatic organisms (Maie et al., 2006; Coble, 2007), and their absorption of solar radiation both influences photosynthesis in aquatic environments (Vahatalo et al., 2005) and protects aquatic organisms from harmful UV radiation (Hargreaves, 2003). Thus, in the interest of better informing tidal wetlands management, policymaking, and climate change mitigation, it is important to improve our understanding of how tidal marshes regulate chromophoric solute exchange at this vital interface.
There exists a rich body of literature focused on the sources of autochthonous wetland DOM and CDOM that includes the leaching of secondary metabolites from fresh and senescent plant material (e.g., Pinsonneault et al., 2016; Shelton et al., 2021), microbial and root exudates (Wu et al., 2012; Wei et al., 2023), and interstitial waters (e.g., Bertilsson and Jones, 2003). However, sorption processes regulating solute exchange between soils and the surrounding waters in tidal wetlands have received little consideration despite evidence of their importance in other ecological settings such as streams, marine and freshwater sediments, terrestrial soils, and non-tidal wetlands (e.g., Qualls, 2000; McKnight et al., 2002; Grybos et al., 2009; Kothawala et al., 2012). Studies have reported that soil non-crystalline iron content ([NC-Fe]) and aluminum content ([NC-Al]) play a significant role in the sorption of dissolved organic carbon (DOC), the carbon backbone of DOM, with highly aromatic moieties, carboxylic acid groups, and amino acid residues being preferentially sorbed to the soil mineral matrix (McKnight et al., 2002; Lalonde et al., 2012; Riedel et al., 2013). Concomitantly, other moieties may be preferentially desorbed, with the net exchange impacting the optical properties of the solution (Kothawala et al., 2012). Studies of solute exchange, particularly the exchange of colored solutes, are nearly absent in tidal marsh soils (Pinsonneault et al., 2021). Considering that colored and noncolored DOC have distinct properties that impact their biogeochemical cycling and influence on receiving aquatic ecosystems, the absence of studies that partition total DOC into functional categories limits our ability to forecast climate change impacts at the terrestrial–aquatic interface (Ward et al., 2020).
The salinity of tidal marsh waters, and thus their ionic strength, depends on their proximity to the estuarine–oceanic interface and ranges from freshwater to ∼ 35. In brackish settings salinity can vary from hourly to seasonal scales in response to tidal exchange and freshwater discharge from the watershed. All coastal systems are also susceptible to long-term changes in their salinity environment resulting from rising sea levels (Wigley, 2005), changes in precipitation (Smith et al., 2005), and anthropogenic influences such as freshwater withdrawal (Li and Pennings, 2018). As ionic strength influences the structural conformation of colored (or chromophoric) dissolved organic carbon (CDOC) and can block or displace ions from exchange sites on the soil surface (Seitzinger et al., 1991; Stumm and Morgan, 2012), such changes are likely to impact the sorption of organic carbon in marsh soils and thus the quality of carbon exported to estuarine waters.
Pinsonneault et al. (2021) previously demonstrated that sorption of total dissolved organic carbon at the tidal marsh–estuarine interface is primarily regulated by soil mineralogy and salinity environment. Here, we analyze sorption processes in more detail by considering separately the exchange of CDOC and noncolored dissolved organic carbon (NCDOC) with tidal marsh soils. As in our previous work, we examine these exchanges across tidal marshes that vary in salinity regime (freshwater to saline) and soil organic carbon content (mineral-dominated soils to highly organic soils). Overall, the objectives of this study were to (1) quantify the exchange of CDOC and NCDOC between the dissolved phase and tidal marsh soils, (2) identify how these exchanges are affected by salinity and soil characteristics, and (3) quantify the effect of these exchanges on the optical characteristics and inferred molecular composition of CDOM exported from tidal marshes to coastal waters.
2.1 Soils
Between 5 March and 15 March 2018, we collected 40 cm deep soil cores from four tidal marshes in the Chesapeake Bay area of the mid-Atlantic United States that ranged in salinity from freshwater to ∼ 32 and in soil total organic carbon (TOC) content from mineral-dominated (∼ 2 % TOC) to highly organic (36 % TOC). These four wetlands were the Smithsonian Environmental Research Center's Global Change Research Wetland (GCReW) (located in Kirkpatrick Marsh, 36°53′ N, 76°33′ W), the Jug Bay Wetlands Sanctuary (38°46′ N, 76°42′ W), Taskinas Marsh located in the York River State Park (37°25′ N, 76°43′ W), and Wachapreague Marsh (37°32′ N, 75°41′ W). Tidal marsh surface and soil core characteristics were reported by Pinsonneault et al. (2021) and for reference are summarized in Appendix B Table B1. Descriptions of all sampling and analytical methods are provided by Pinsonneault et al. (2021). Additional site and sediment descriptions are provided by Pondell and Canuel (2022).
2.2 Dissolved organic carbon standards
To provide a highly concentrated standard of natural CDOM that could be diluted to a range of concentrations for incubations with tidal marsh soils, we collected highly colored surface waters from the Great Dismal Swamp National Wildlife Refuge (GDS), a non-tidal forested wetland located on the coastal plain of southeastern Virginia and northeastern North Carolina, USA (36°37′ N, 76°28′ W). We sampled a non-tidal system to have a consistent source of strongly absorbing, terrestrial DOM that could be used for a series of experiments. In April 2018, we collected approximately 115 L of surface water in acid-washed carboys from the Jericho Ditch (36°41′45.03′′ N, 76°30′28.16′′ W). This sample was concentrated by reverse osmosis (RO) using a Growonix GX600 RO system fitted with both pleated and spun sediment filters before being filtered through a 20 µm pore size Whatman Polycap 75 HD disposable filter capsule followed by a 0.2 µm pore size Whatman Polycap 36 TC polyethersulfone membrane capsule. The resulting filtered DOC concentrate was then treated with 1 mM sodium azide (NaN3, a microbial inhibitor), and DOC concentration ([DOC]) was measured with a Shimadzu TOC-L using high-temperature combustion (reproducibility 1.5 % according to manufacturer). This concentrate yielded a [DOC] of 217 mg-DOC L−1, a specific conductivity of 180 µS cm−1 corresponding to a salinity of 0.08, and a pH of 4.40. The treated concentrate was divided into four sub-stocks that we amended with Instant Ocean aquarium salt (a synthetic sea salt) to produce four salinity treatments: 0 (no instant ocean added), 10, 20, and 35 on the practical salinity scale (no units). The typical ionic composition of Instant Ocean is reported by Christy and Dickman (2002).
2.3 Batch isotherm incubations
Seven isotherm standards, ranging in [DOC] from 0 to ∼ 200 mg L−1, were prepared by diluting the DOC treatment stocks with a ∼ 0 mg-DOC L−1 solution (hereafter referred to as the dilutant) of similar pH, salinity, and specific conductivity prepared using ultrapure water, Instant Ocean aquarium salt, and 1 mM NaN3. Isotherm standards were freshly prepared for each batch incubation.
Based on methods described by Kothawala et al. (2008) we carried out batch incubations under a 95 % nitrogen (N2) and 5 % hydrogen atmosphere in a Coy Laboratory Products anaerobic chamber using aqueous samples and solutions degassed with N2. Soil samples were incubated in triplicate at room temperature (∼ 22°C) using a 1:30 ratio of freeze-dried soil mass (g) to isotherm standard volume (mL) for 24 h in the dark on a horizontal shaker (70 RPM). We then centrifuged the incubated soil slurries at 4700 g for 1 h and measured the salinity and pH of the supernatant using a WTW Multi 340i probe and a Thermo Orion 3 Star pH meter, respectively. Finally, the supernatant was syringe-filtered using disposable 0.45 µm Millex filter cartridges for DOC and spectral analyses. We confirmed the lack of DOC precipitation in the absence of soil by conducting test incubations without soil at 12.5 and 285 mg-DOC L−1 across the four salinity treatments (data not shown).
2.4 Colored and noncolored dissolved organic carbon
Due to the highly colored nature of the Great Dismal Swamp DOC, we diluted subsamples of pre-incubation standards by a factor of 10 using dilutant from the same salinity treatment while we diluted the filtered post-incubation supernatant by the same factor using ultrapure water + NaCl (Sigma-Aldrich, 99.5 % purity) to match sample salinity. All solutions were degassed with N2, then dilutions were performed, and cuvettes loaded and sealed in an anaerobic chamber. We performed absorbance scans at 2 nm intervals (270–750 nm) for all replicates using a Thermo Scientific Evolution 220 UV–Vis spectrophotometer. Specific ultraviolet absorbance at 280 nm (SUVA280), an indicator of DOC aromaticity, was calculated from these data by dividing decadic sample absorbance at 280 nm by the DOC concentration ([DOC]) (Hansen et al., 2016). We then generated three-dimensional excitation–emission matrices (EEMs) using a Horiba Jobin Yvon FluoroMax-3 spectrofluorometer (for only one sample replicate) at 5 nm intervals (250–600 nm) for excitation and 2 nm intervals (250–600 nm) for emission. Fluorescence spectra were corrected for inner-filter effect and Raman scattering using the drEEM toolbox version 0.2.0 (Murphy et al., 2013) in MATLAB (v. 2017b). Parallel factor analysis (PARAFAC) was used to deconstruct the fluorescence signal into underlying fluorescence components, or fluorophores, that relate to differences in DOC composition (Murphy et al., 2010; Lapierre and del Giorgio, 2014).
Although all incubations started with 100 % of the DOC as GDS organic carbon (apart from trace additions from the dilutant), adsorption–desorption interactions with the soil changed the composition of organic carbon in the dissolved phase, thus changing the spectral characteristics of absorbance and fluorescence. To better understand how adsorption–desorption reactions change DOC composition, we developed a partitioning approach that considers the total DOC pool composed of two components: colored and noncolored. The colored component (CDOC) is defined as the fraction of DOC that varies linearly with absorbance. Operationally, this was estimated for each incubation using a linear regression of DOC as a function of absorbance at 355 nm (MATLAB fitlm), following the methods of Clark et al. (2019). For the purposes of this analysis, any DOC that absorbed UV only at wavelengths < 355 nm was considered noncolored. The data analysis conducted to convert a355 to CDOC (mg L−1) is presented in the results section. Once CDOC was determined, the noncolored fraction (NCDOC) was estimated by difference with total DOC, which is here designated as “TDOC”, following Eq. (1):
2.5 CDOC sorption
To quantify CDOC exchange with tidal marsh soils, we used a similar approach as described previously for TDOC sorption parameters (Pinsonneault et al., 2021). CDOC sorption was estimated by least-squares non-linear fitting using the traditional Langmuir isotherm, except in this case the net sorption of CDOC was considered dependent on the initial instead of the final concentration of the absorbent:
where Δ[COC]i−f is the quantity of colored organic carbon (COC) adsorbed in mg-C g−1, [CDOC]i is the initial CDOC concentration in mg-DOC L−1, KC is the CDOC binding affinity in L mg−1, QCmax is the soil maximum adsorption capacity for COC in mg-C g−1, and CC0 is the initial natively sorbed COC in mg-C g−1 (cf. Kothawala et al., 2008). The COC adsorbed is based on the difference between [CDOC]i and [CDOC]f, the CDOC in solution at the end of the incubation. KC, QCmax, and CC0 for each incubation were estimated by fitting Eq. (2) to the results of each experiment using nonlinear regression (MATLAB fitnlm).
The null point (NP) is defined as the concentration at which there is no net removal (adsorption) or release (desorption) of CDOC from solution, the biogeochemical significance of which is a sorptive equilibrium between the soil mineral surfaces and the aqueous phase. It is derived by setting Eq. (2) to zero and solving for NP concentration of [CDOC]i:
We chose to model CDOC adsorption in this analysis using the initial mass (IM) Langmuir isotherm since we use the same dependent variable to model the dynamics of NCDOC. For reasons to be shown in results, NCDOC dynamics can be accounted for using a linear, desorption-only, IM isotherm:
where Δ[NCOC]i−f is the difference between initial and final adsorbed noncolored organic carbon mg-C g−1, mN (L g−1) is a desorption coefficient, and CN0 is the native adsorbed NCOC. Implicit in this equation is the assumption that soil sorption of COC displaces NCOC, releasing it into solution. The slope of the NCDOC isotherm can be compared to the initial slope of the CDOC isotherm (, L g−1). The ratio is termed the displacement coefficient, the proportion of NCOC desorption associated with CDOC adsorption.
IM isotherms are advantageous for use in biogeochemical models since the result is a function of the initial, not final condition (Kothawala et al., 2008). While equilibrium Langmuir theory leads to the traditional rather than IM isotherm, both formulations are equally effective at explaining soil DOC adsorption–desorption (Kothawala et al., 2008). The parameters for the fits of the IM Langmuir isotherms to the TDOC data previously presented by Pinsonneault et al. (2021) are provided in Appendix B Table B2.
3.1 Colored and noncolored dissolved organic carbon content
Linear regressions of TDOC on absorbance at 355 nm were performed for each set of initial standards and final filtrates. Figure 1 shows a typical set of regression results for Kirkpatrick Marsh, treatment with salinity (S) of 10, and all results are provided in a supplemental file. Note the offset between the post-incubation and the pre-incubation regression lines. For any given absorbance there was more DOC in solution after incubation than before due to an increase in NCDOC. The CDOC content corresponding to a given absorbance is defined by the pre-incubation regression line (shaded triangles, in Fig. 1). To illustrate the process, dashed arrows in Fig. 1 project the absorbance in each post-incubation treatment down to the pre-incubation fitted regression line. This point (minus the intercept) is the inferred CDOC content as indicated by the solid arrows that project to the y axis (DOC). As examples, the three post-incubation solutions with TDOC = 44, 115, and 194 mg L−1 project to CDOC contents of 15, 67, and 125 mg L−1, respectively. The length of the dashed arrow represents the remainder between CDOC and TDOC in the post-incubation solution that is the noncolored DOC (NCDOC, dashed arrows) desorbed during the incubation. In this example, NCDOC rises from ∼ 29 to 68 mg L−1 in the post-incubation solutions with the lowest and highest concentrations of TDOC (bottom and top dashed arrows, respectively).
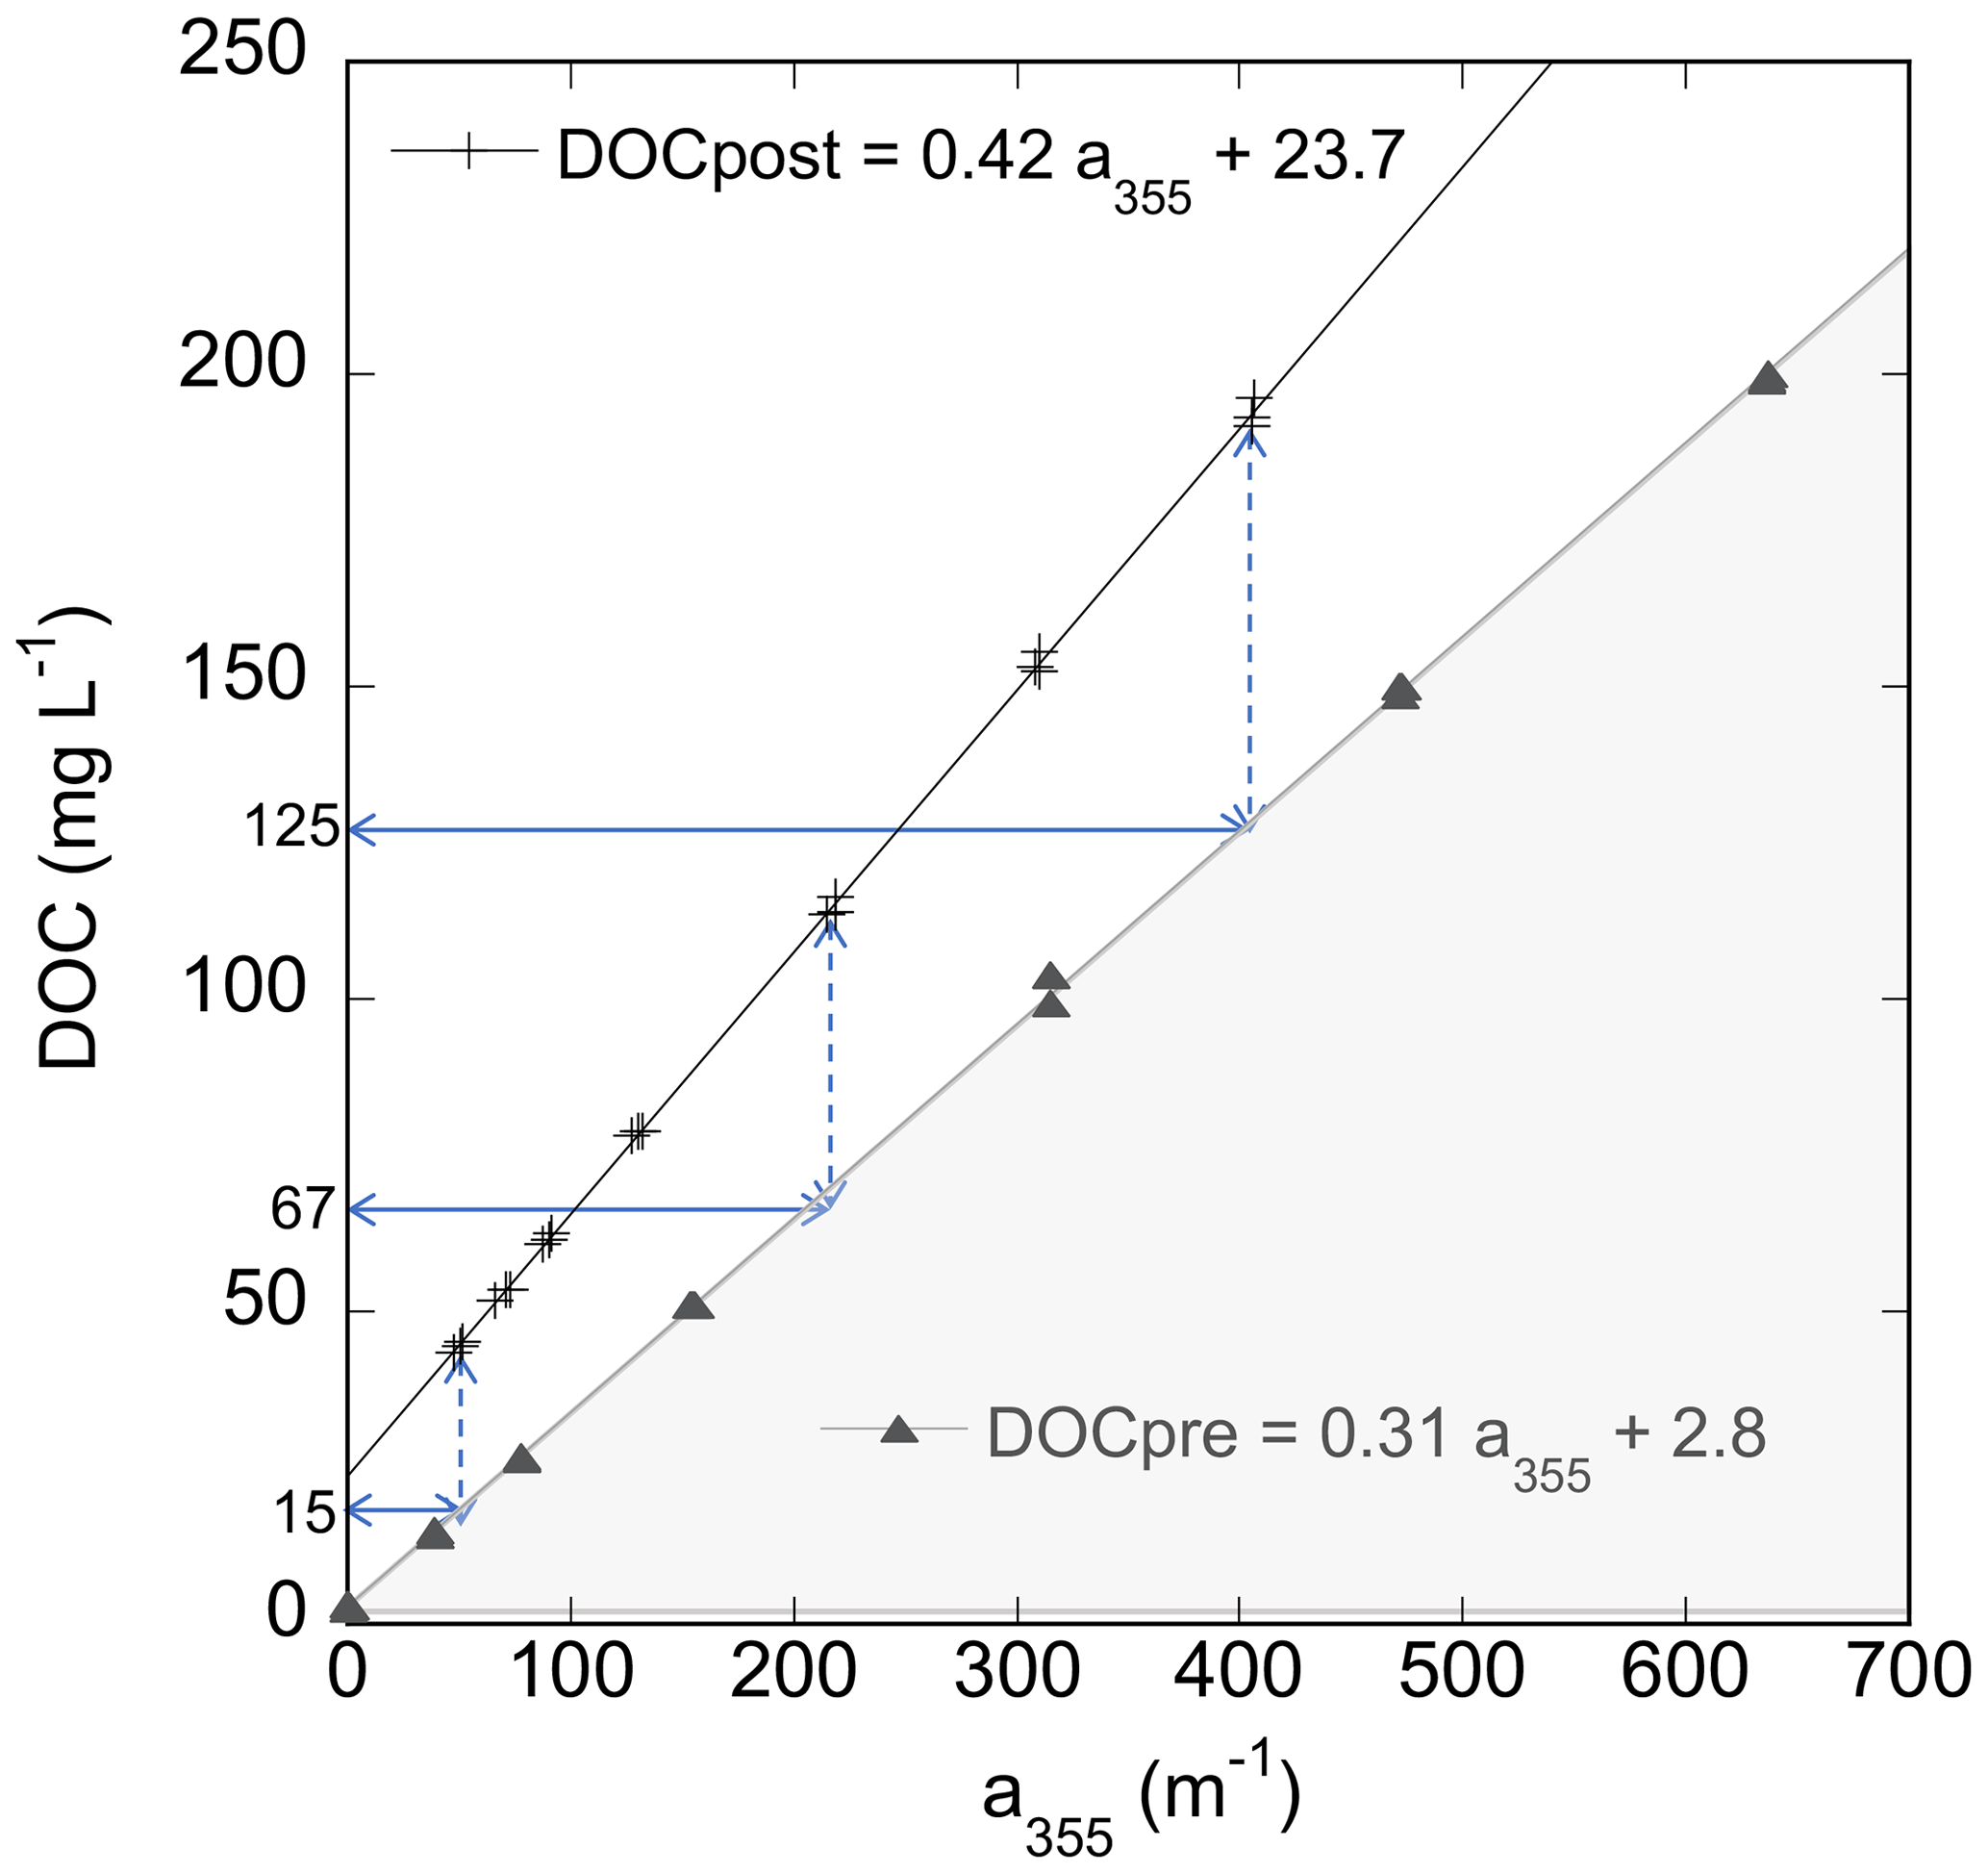
Figure 1Scatterplot of DOC content vs. absorption coefficient at 355 nm in pre-incubation (triangles) and post-incubation (+ symbols) treatments in triplicate from the Kirkpatrick soil, S=10, isotherm experiment with fitted linear regressions. The dashed arrows indicate the difference in DOC between the regression lines for selected post-incubation absorbances; the solid arrows identify the DOC of the pre-incubation line at these absorbances.
The shift from pre-incubation to post-incubation regression lines shown in Fig. 1 happened in a similar way in every experiment. Like Fig. 1, in each experiment both the pre- and post-incubation solutions showed tight linear regressions with positive intercepts (r2>0.996, n=21, Table 1), with higher slopes and intercepts for the post-incubation solutions. There were small intercepts (∼ 2 mg L−1) for the initial standards stemming from a trace component of TDOC in the dilutant. Because the dilutant had no absorbance at 355 nm, this was considered NCDOC. However, the dilutant did absorb at wavelengths < 300 nm (Appendix B Fig. B1). This absorbance biases the spectral slope estimates of CDOC for treatments that have been diluted. To minimize such bias, spectral slope estimates (Sect. 3.3) are based on the average of the three highest standards which had the least dilution (< 12 % dilution).
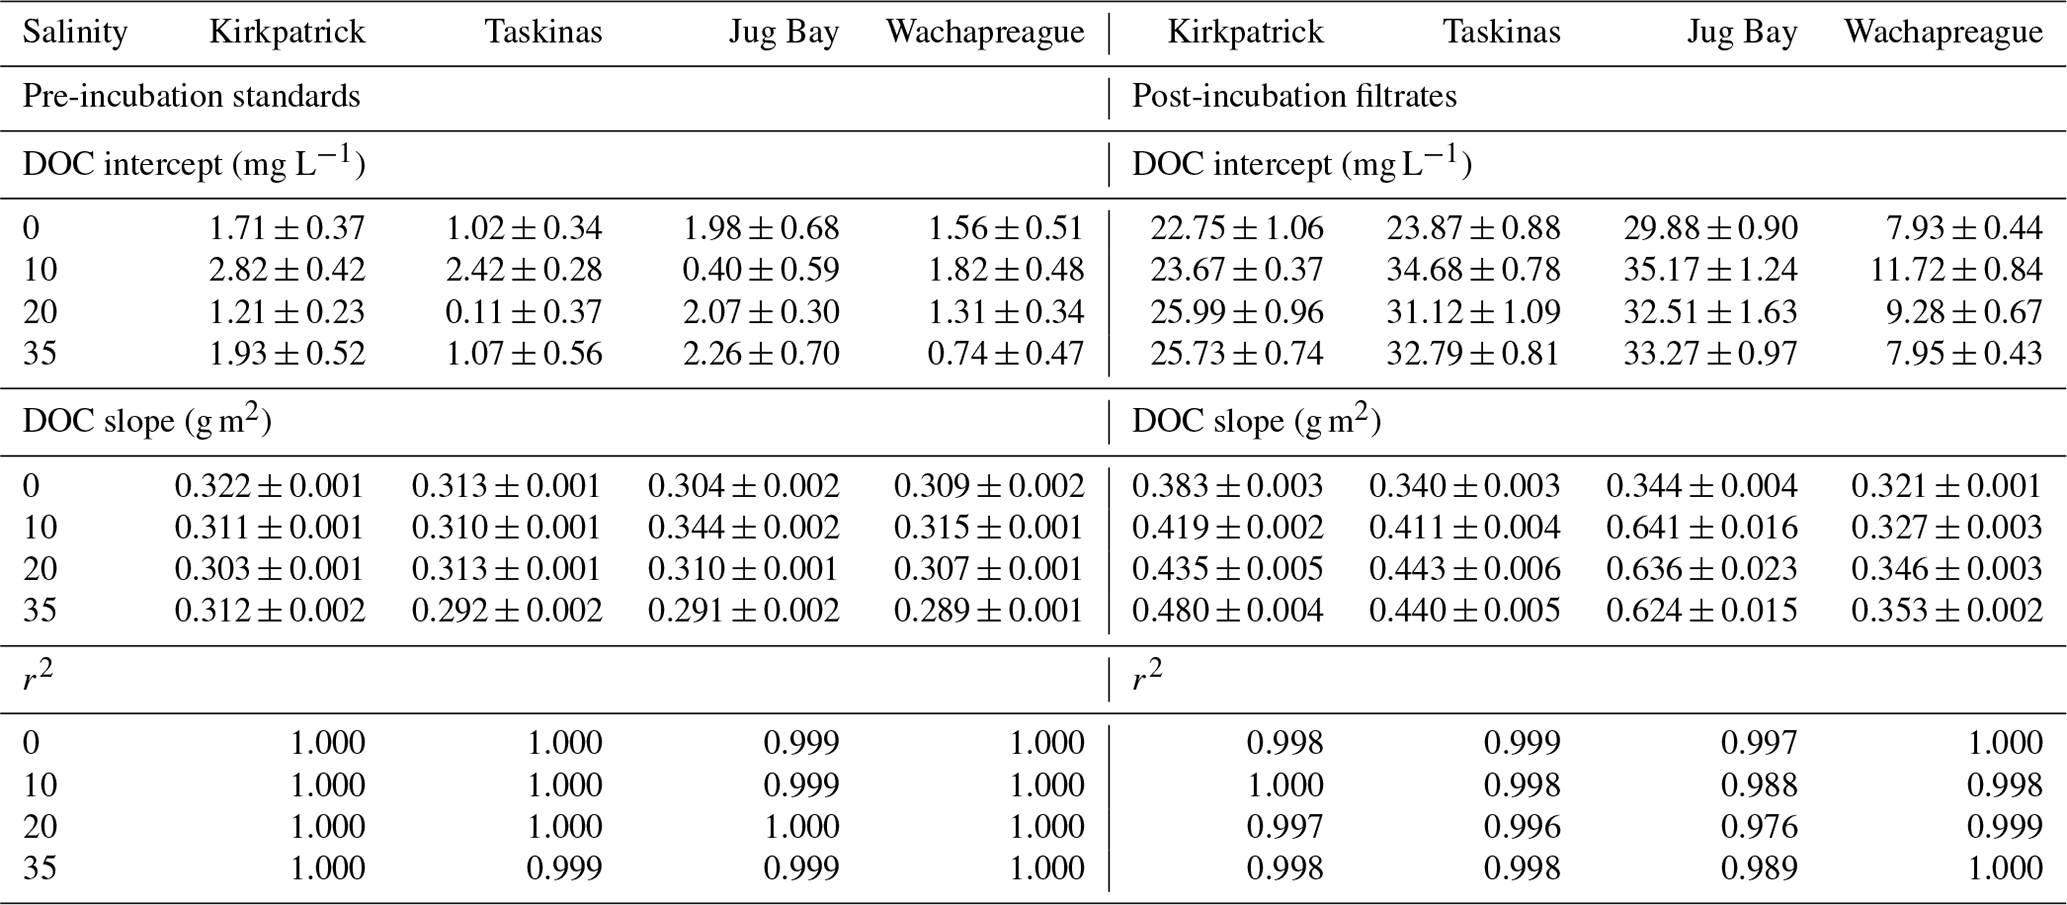
Table 1Results of linear regression fits for DOC (mg L−1) vs. absorbance at 355 nm (m−1) for both pre-incubation standards (left side) and post-incubation filtrates (right side). Estimates are stated ± SE. A separate regression (n=21) was estimated for each soil and salinity treatment; plots of the data and estimated regression lines are provided in the supplemental file.
Incubation of the standards with tidal marsh soils dramatically increased the contribution of NCDOC to the solution phase. This is illustrated in Fig. 2 for the example dataset presented in Fig. 1. The pre-incubation standards used the highly colored GDS solution to which a background level of NCDOC was introduced during dilution. This is the DOC in the “0” standard (3 mg L−1 in Fig. 2). For the other standards, CDOC made up more than 80 % of the initial DOC. Except for the “0” standard, the proportion of CDOC was much lower and NCDOC higher after incubation. NCDOC was desorbed in every case and made up more than 50 % of the DOC in the four lowest standards and 35 %–40 % at the higher standards. Conversely, CDOC decreased to between 34 %–65 % (from the lowest to highest standard) of the post-incubation DOC. In this example, there was only net desorption of CDOC in the lowest three standards, transitioning to net adsorption for the four highest standards (compare DOC values in colored bars, Fig. 2). This contrasts with the net desorption of total DOC for all except the highest standard (compare DOC values on x axes). While the transition point from desorption to adsorption varied among the experiments, this general pattern of always net desorption for NCDOC and mostly net adsorption for CDOC was observed for all experimental soils and treatments.
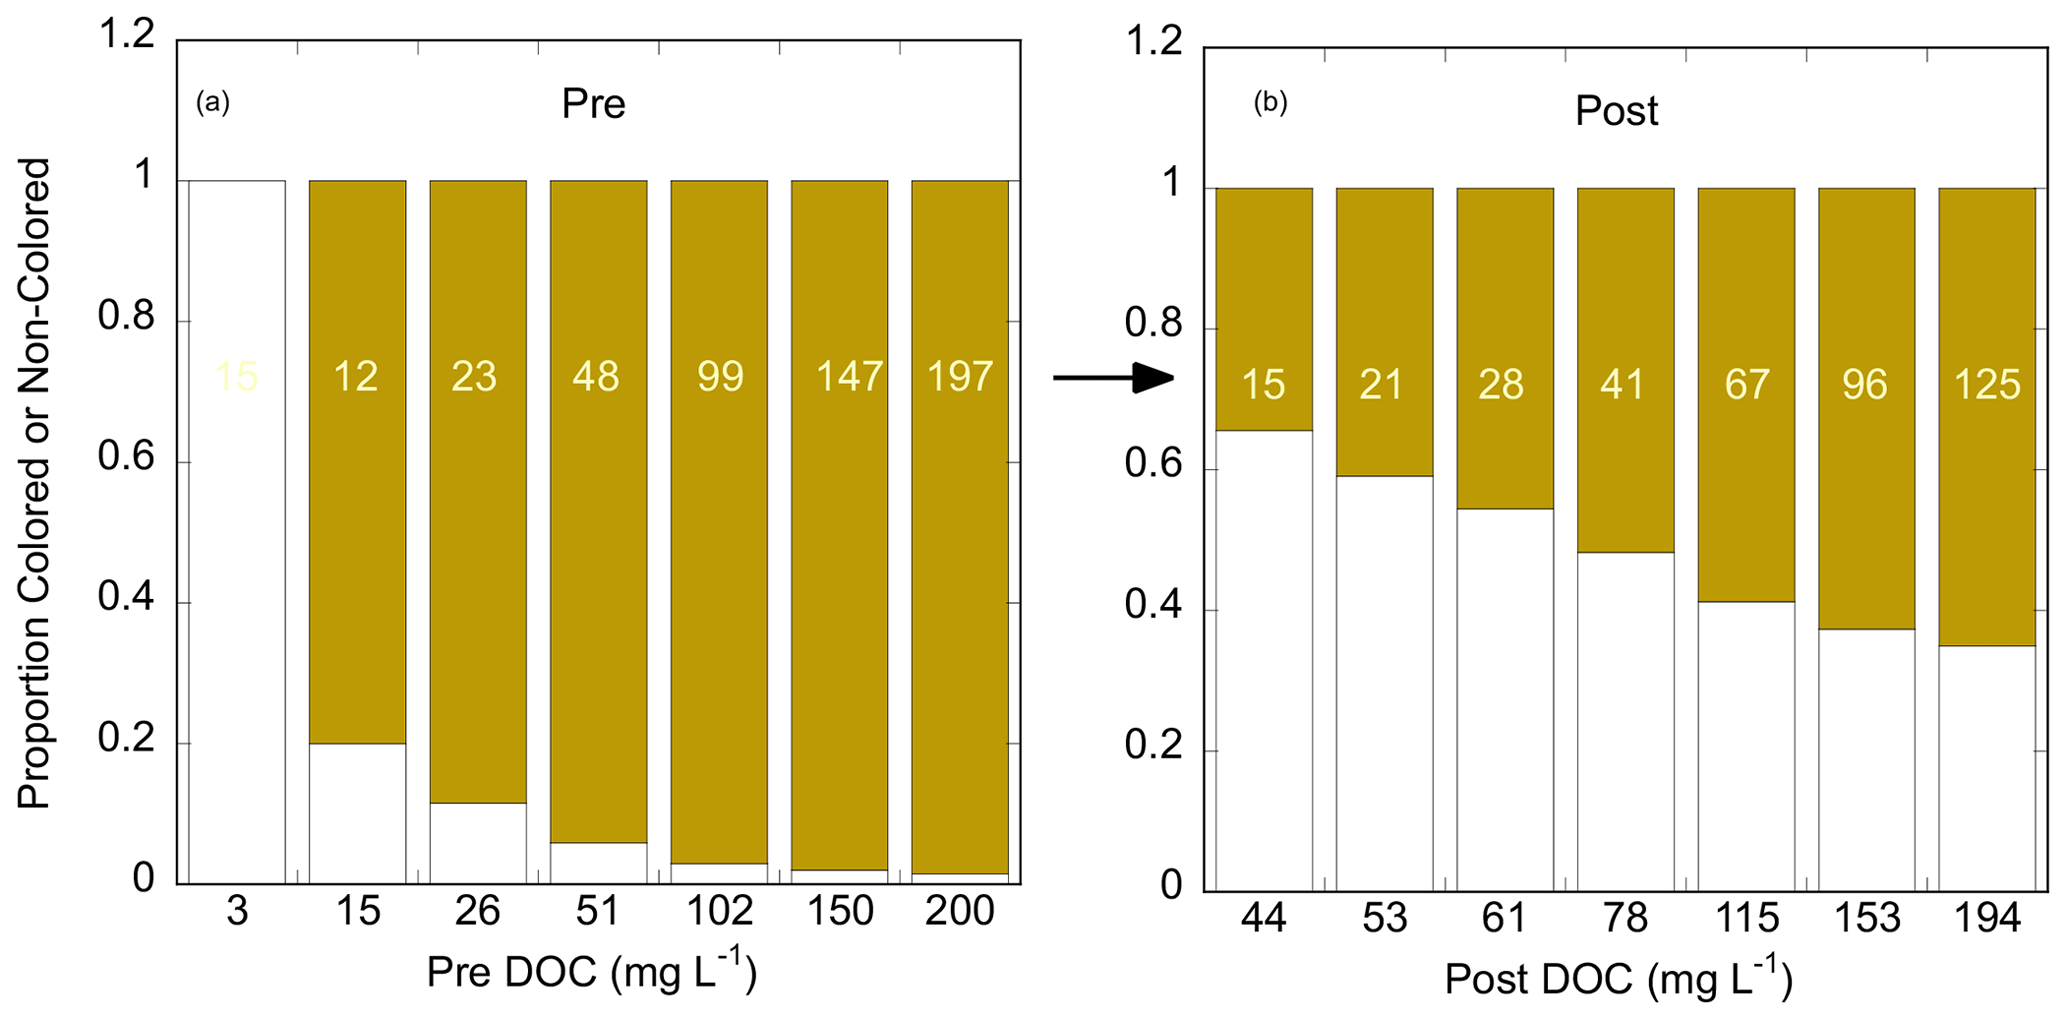
Figure 2Proportions of noncolored (white bars) and colored (brown bars) DOC in (a) the pre-incubation (“Pre”) and (b) post-incubation (“Post”) solution phases of an experimental incubation of Kirkpatrick tidal marsh soil, S=10 (cf. Fig. 1). x axes are annotated with the total DOC for each of the seven standards; annotations in the colored bars are the inferred concentrations of CDOC (mg L−1) in the pre-incubation (a) and post-incubation (b) solutions.
3.2 CDOC sorption isotherms
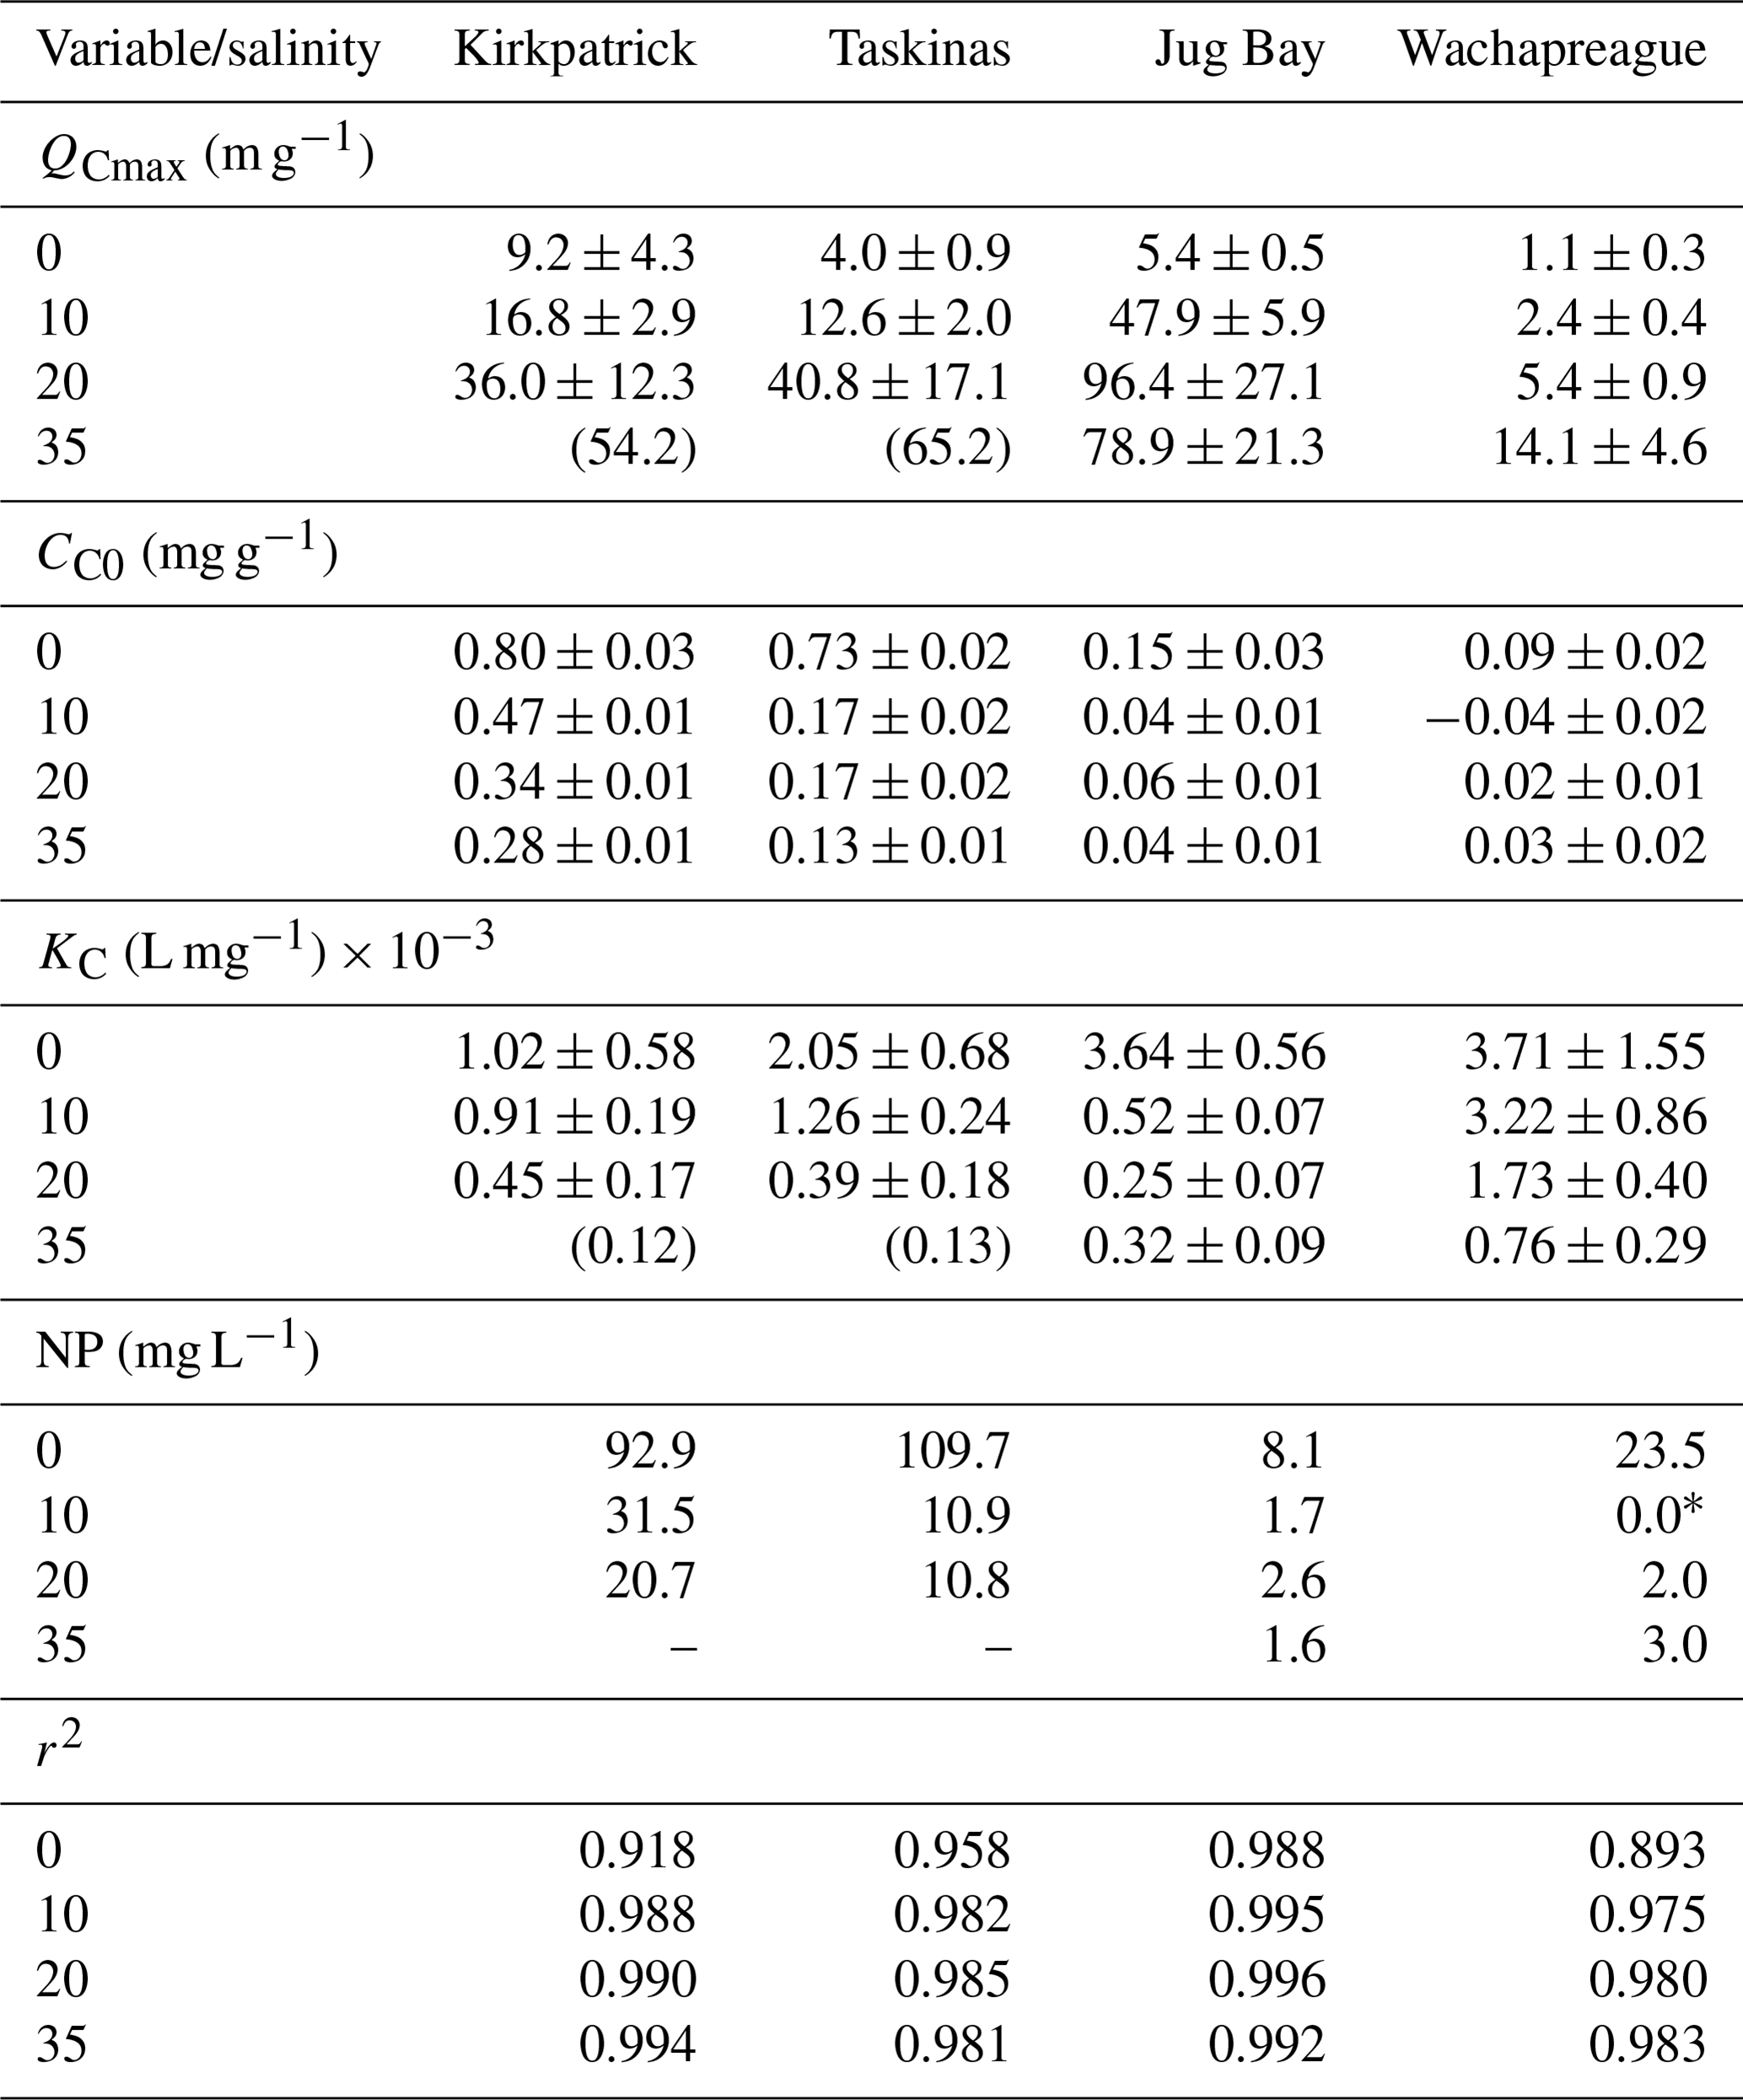
The sorption isotherm plots of CDOC for all four marsh soils are presented in Fig. 3 (filled symbols) and the sorption characteristics estimated by fitting the IM Langmuir isotherm (Eq. 2) to the data shown in Table 2. The Langmuir equation provided a good fit to the isotherm data for all experiments, except that reliable estimates of soil maximum adsorption capacity and binding affinity could not be obtained for Kirkpatrick and Taskinas marshes for S=35 (Table 2). These isotherms were close to linear over the measured range, as was the case for the TDOC isotherms (Pinsonneault et al., 2021, Appendix B). The minimum r2 of the nonlinear regressions for all soils across the four salinity treatments was 0.893, and the mean r2 was 0.975 ± 0.028 (n=21). The isotherms of CDOC are similar in shape to the TDOC isotherms, both the traditional Langmuir isotherms previously presented by Pinsonneault et al. (2021) and the IM Langmuir isotherms refitted to their data (Appendix B Fig. B2). As for these TDOC isotherms (see Appendix Table B2), the maximum soil sorption capacity for CDOC generally increased with salinity, while the CDOC binding affinity tended to decrease with salinity (Table 2).
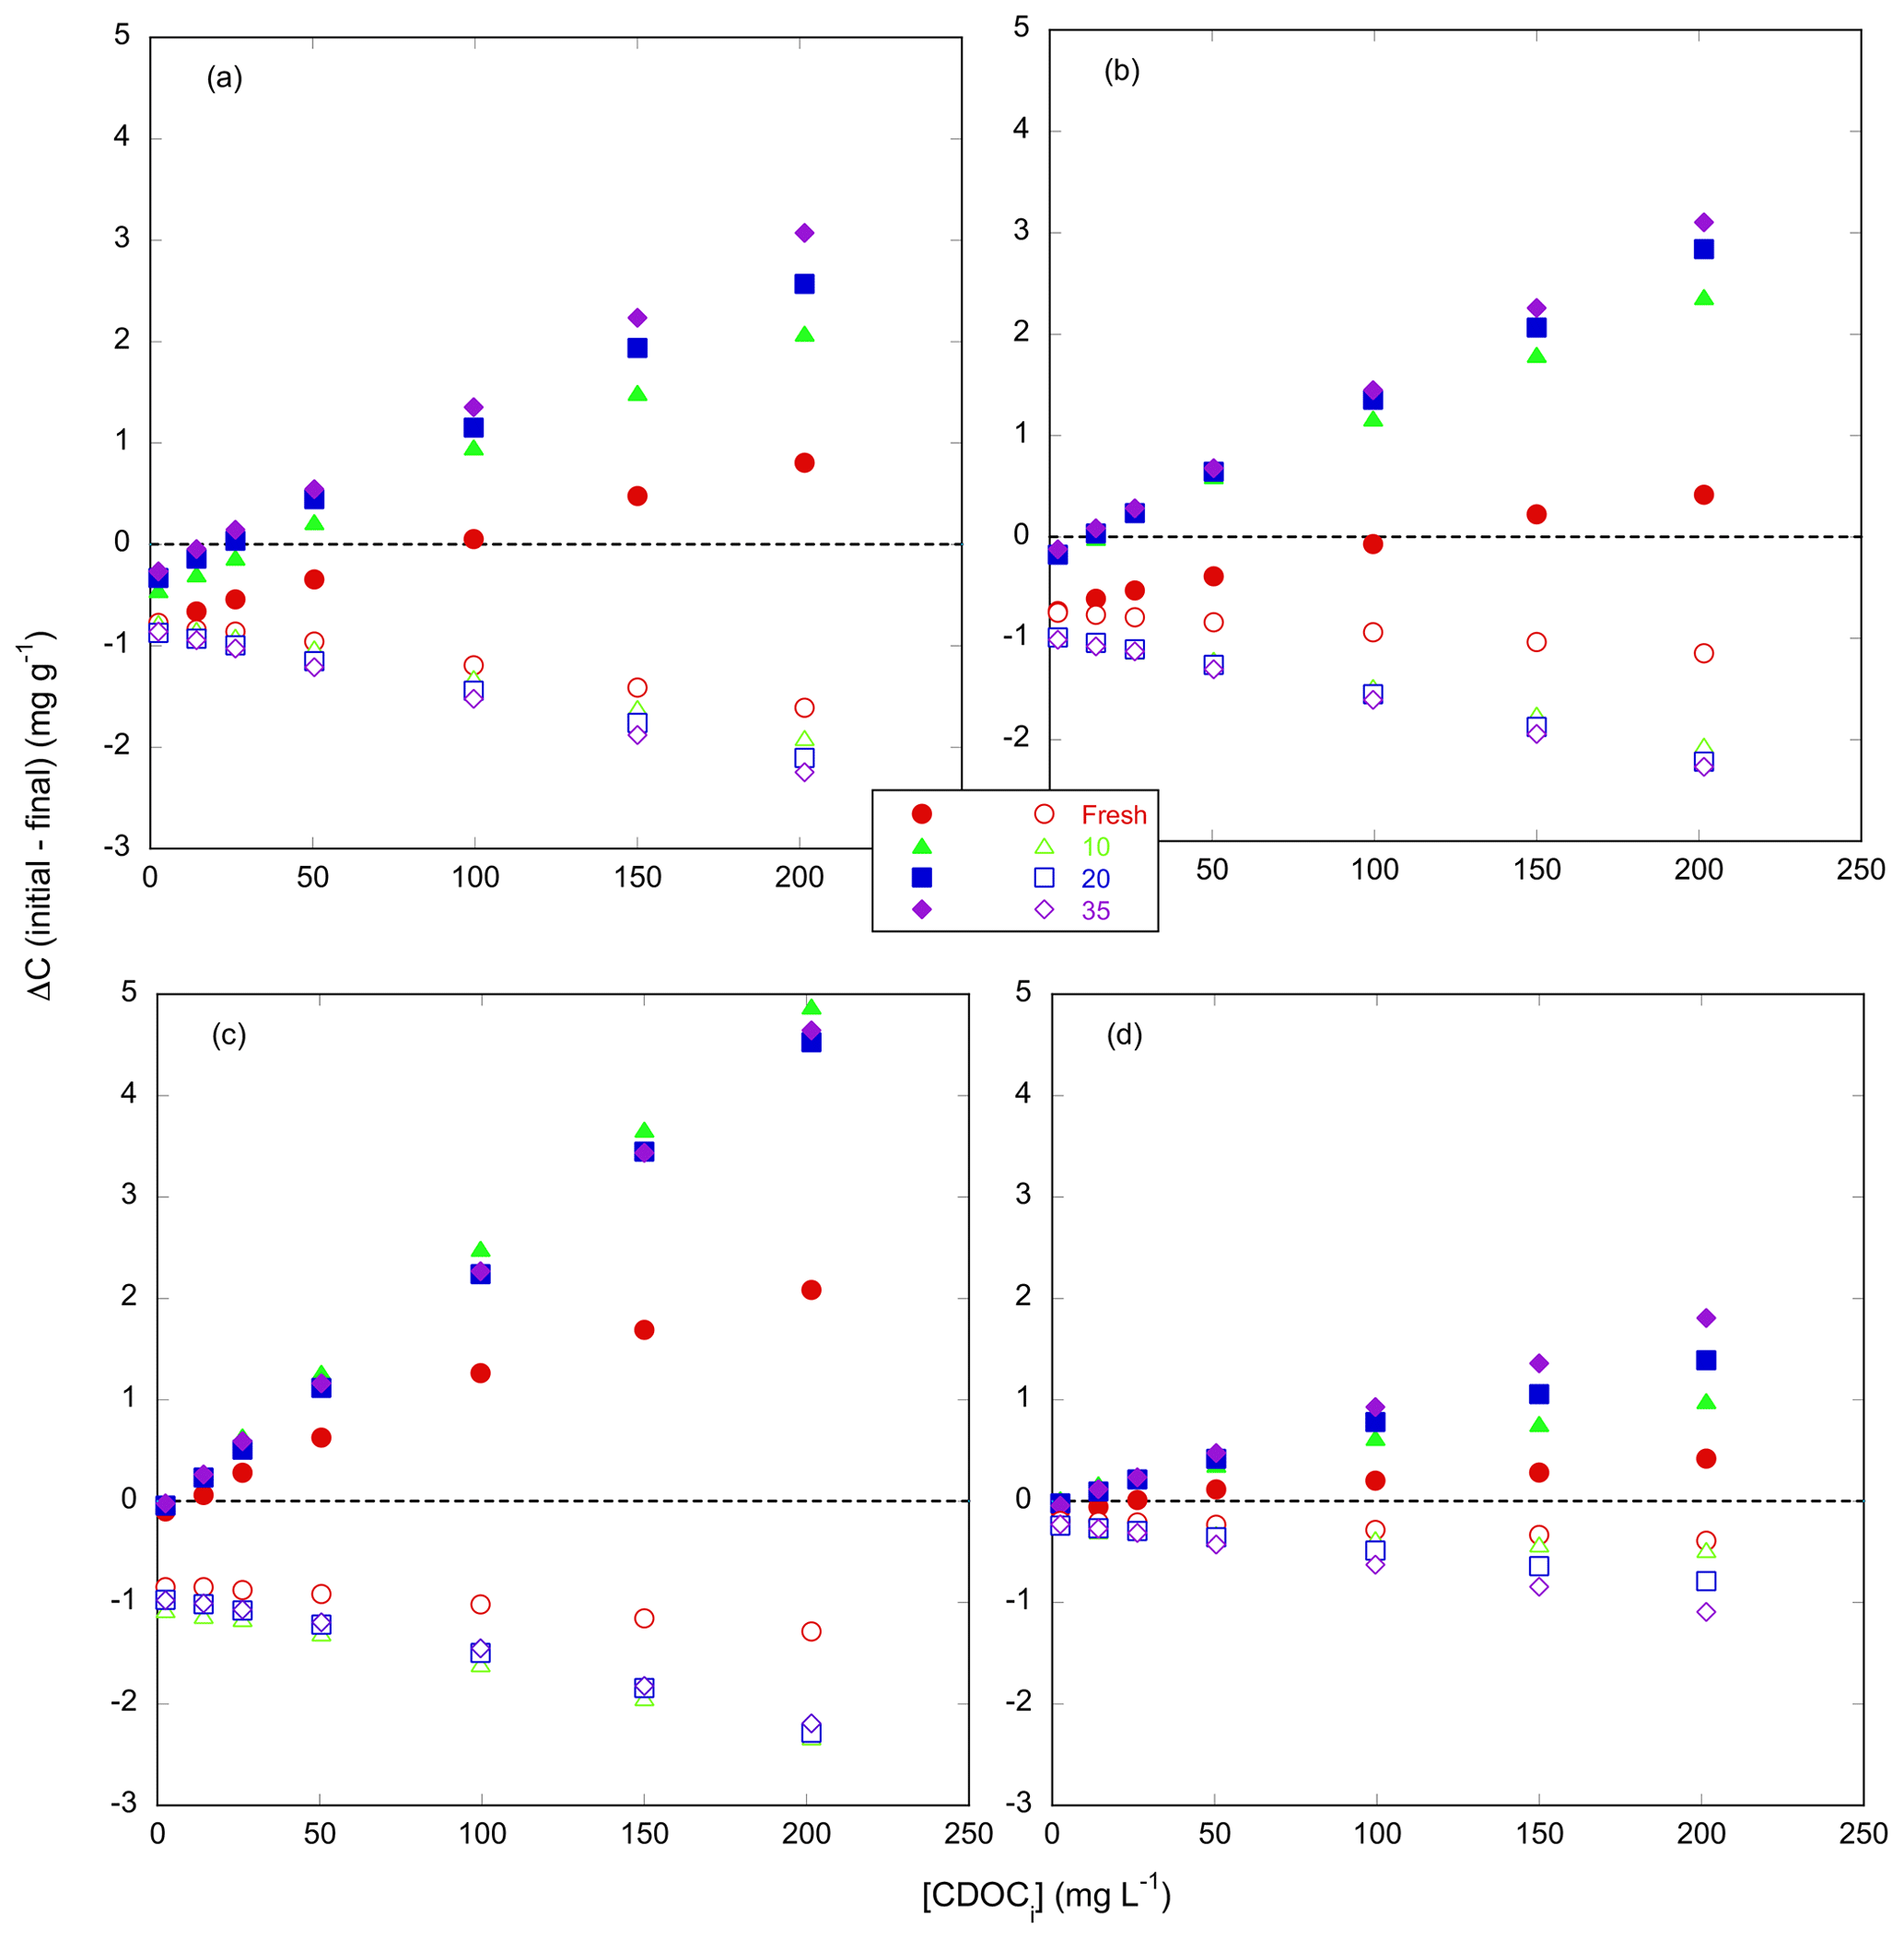
Figure 3Isotherms of adsorption–desorption of CDOC (filled shapes) and NCDOC (open shapes) for tidal marsh soils. Net adsorption of organic carbon based on the difference between initial and final concentrations of soil organic carbon (ΔC, mg C g-soil−1) as a function of initial concentration of CDOC ([CDOC]i, mg L−1). Dashed line indicates no net change, and negative values indicate net desorption. Error bars show standard deviation of triplicate incubations; in most cases error bars are smaller than the symbol. Incubations used soils from (a) Kirkpatrick, (b) Taskinas, (c) Jug Bay, and (d) Wachapreague marshes. Red circles, green triangles, blue squares, and purple diamonds denote salinities of 0, 10, 20, and 35, respectively.
Table 2Parameter estimates ± SE of sorption characteristics of CDOC derived from the initial mass Langmuir isotherm by salinity treatment. QCmax, CC0, and KC refer to the soil maximum sorption capacity, native adsorbed colored soil carbon, and the CDOC binding affinity, respectively. Null point (NP) was estimated using fitted isotherm parameters and Eq. (3). QCmax and KC for Kirkpatrick and Taskinas for S=35 incubations were estimated by extrapolation of the salinity trend, and no SE is reported. NP was not estimated using extrapolated values. * The fitted estimate of CC0 for this treatment was negative, considered to be 0 for purposes of the NP estimate.
3.3 NCDOC desorption isotherms
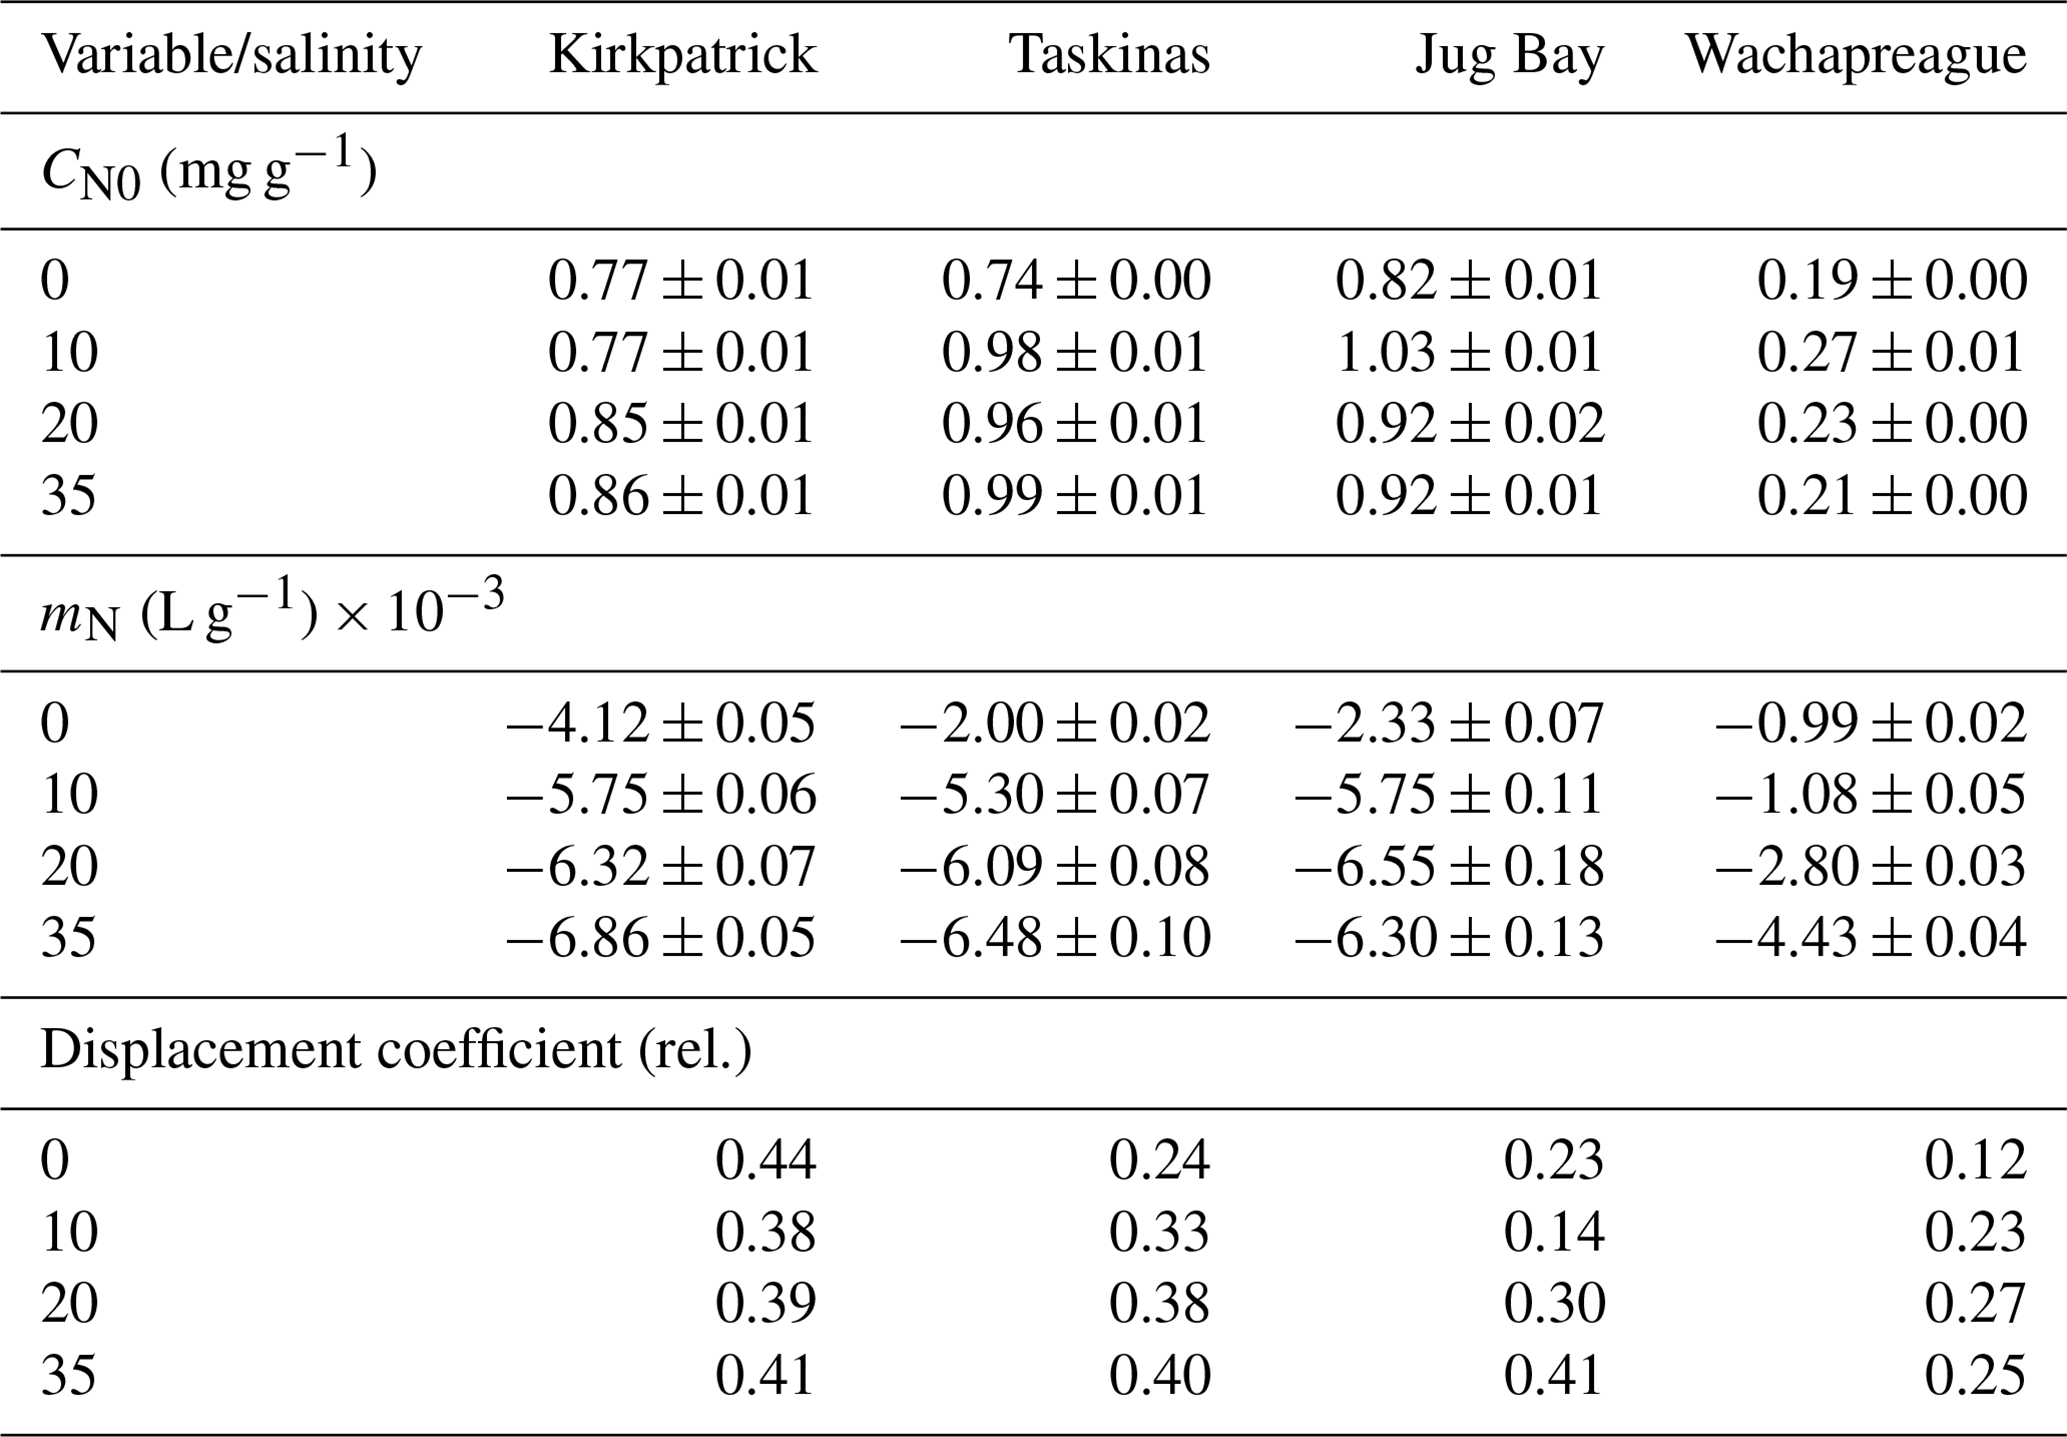
The isotherms for NCDOC (Fig. 3, open symbols) contrasted sharply with those of CDOC. The difference between initial and final adsorbed noncolored organic carbon (Δ[NCOC]i−f, mg g−1) was always negative (net desorption), and the desorption magnitude was linearly related to initial CDOC concentration by the desorption coefficient, mN (Eq. 4, fitted parameters in Table 3). The displacement coefficient, the ratio between −mN and the initial slope of the CDOC isotherm (mC), varied from 0.12 to 0.44 (Table 3). The displacement coefficient shows that between 12 %–44 % the desorption of NCOC is associated with the adsorption of CDOC.
Table 3Parameter estimates ± SE for desorption isotherms of NCDOC based on the linear equation Δ[NCOC] CDOCi−CN0, where Δ[NCOC]i−f is difference between initial and final adsorbed noncolored organic carbon (mg g−1), mN (L g−1) is the desorption coefficient for [CDOC]i, the initial concentration of colored dissolved organic carbon (mg L−1), and CN0 is the native adsorbed NCOC (mg g−1). r2 values for all fits (n=21, per experiment) were > 0.99. Displacement coefficient is the proportion of NCOC desorption associated with CDOC adsorption.
3.4 Relationship of isotherm parameters to soil characteristics
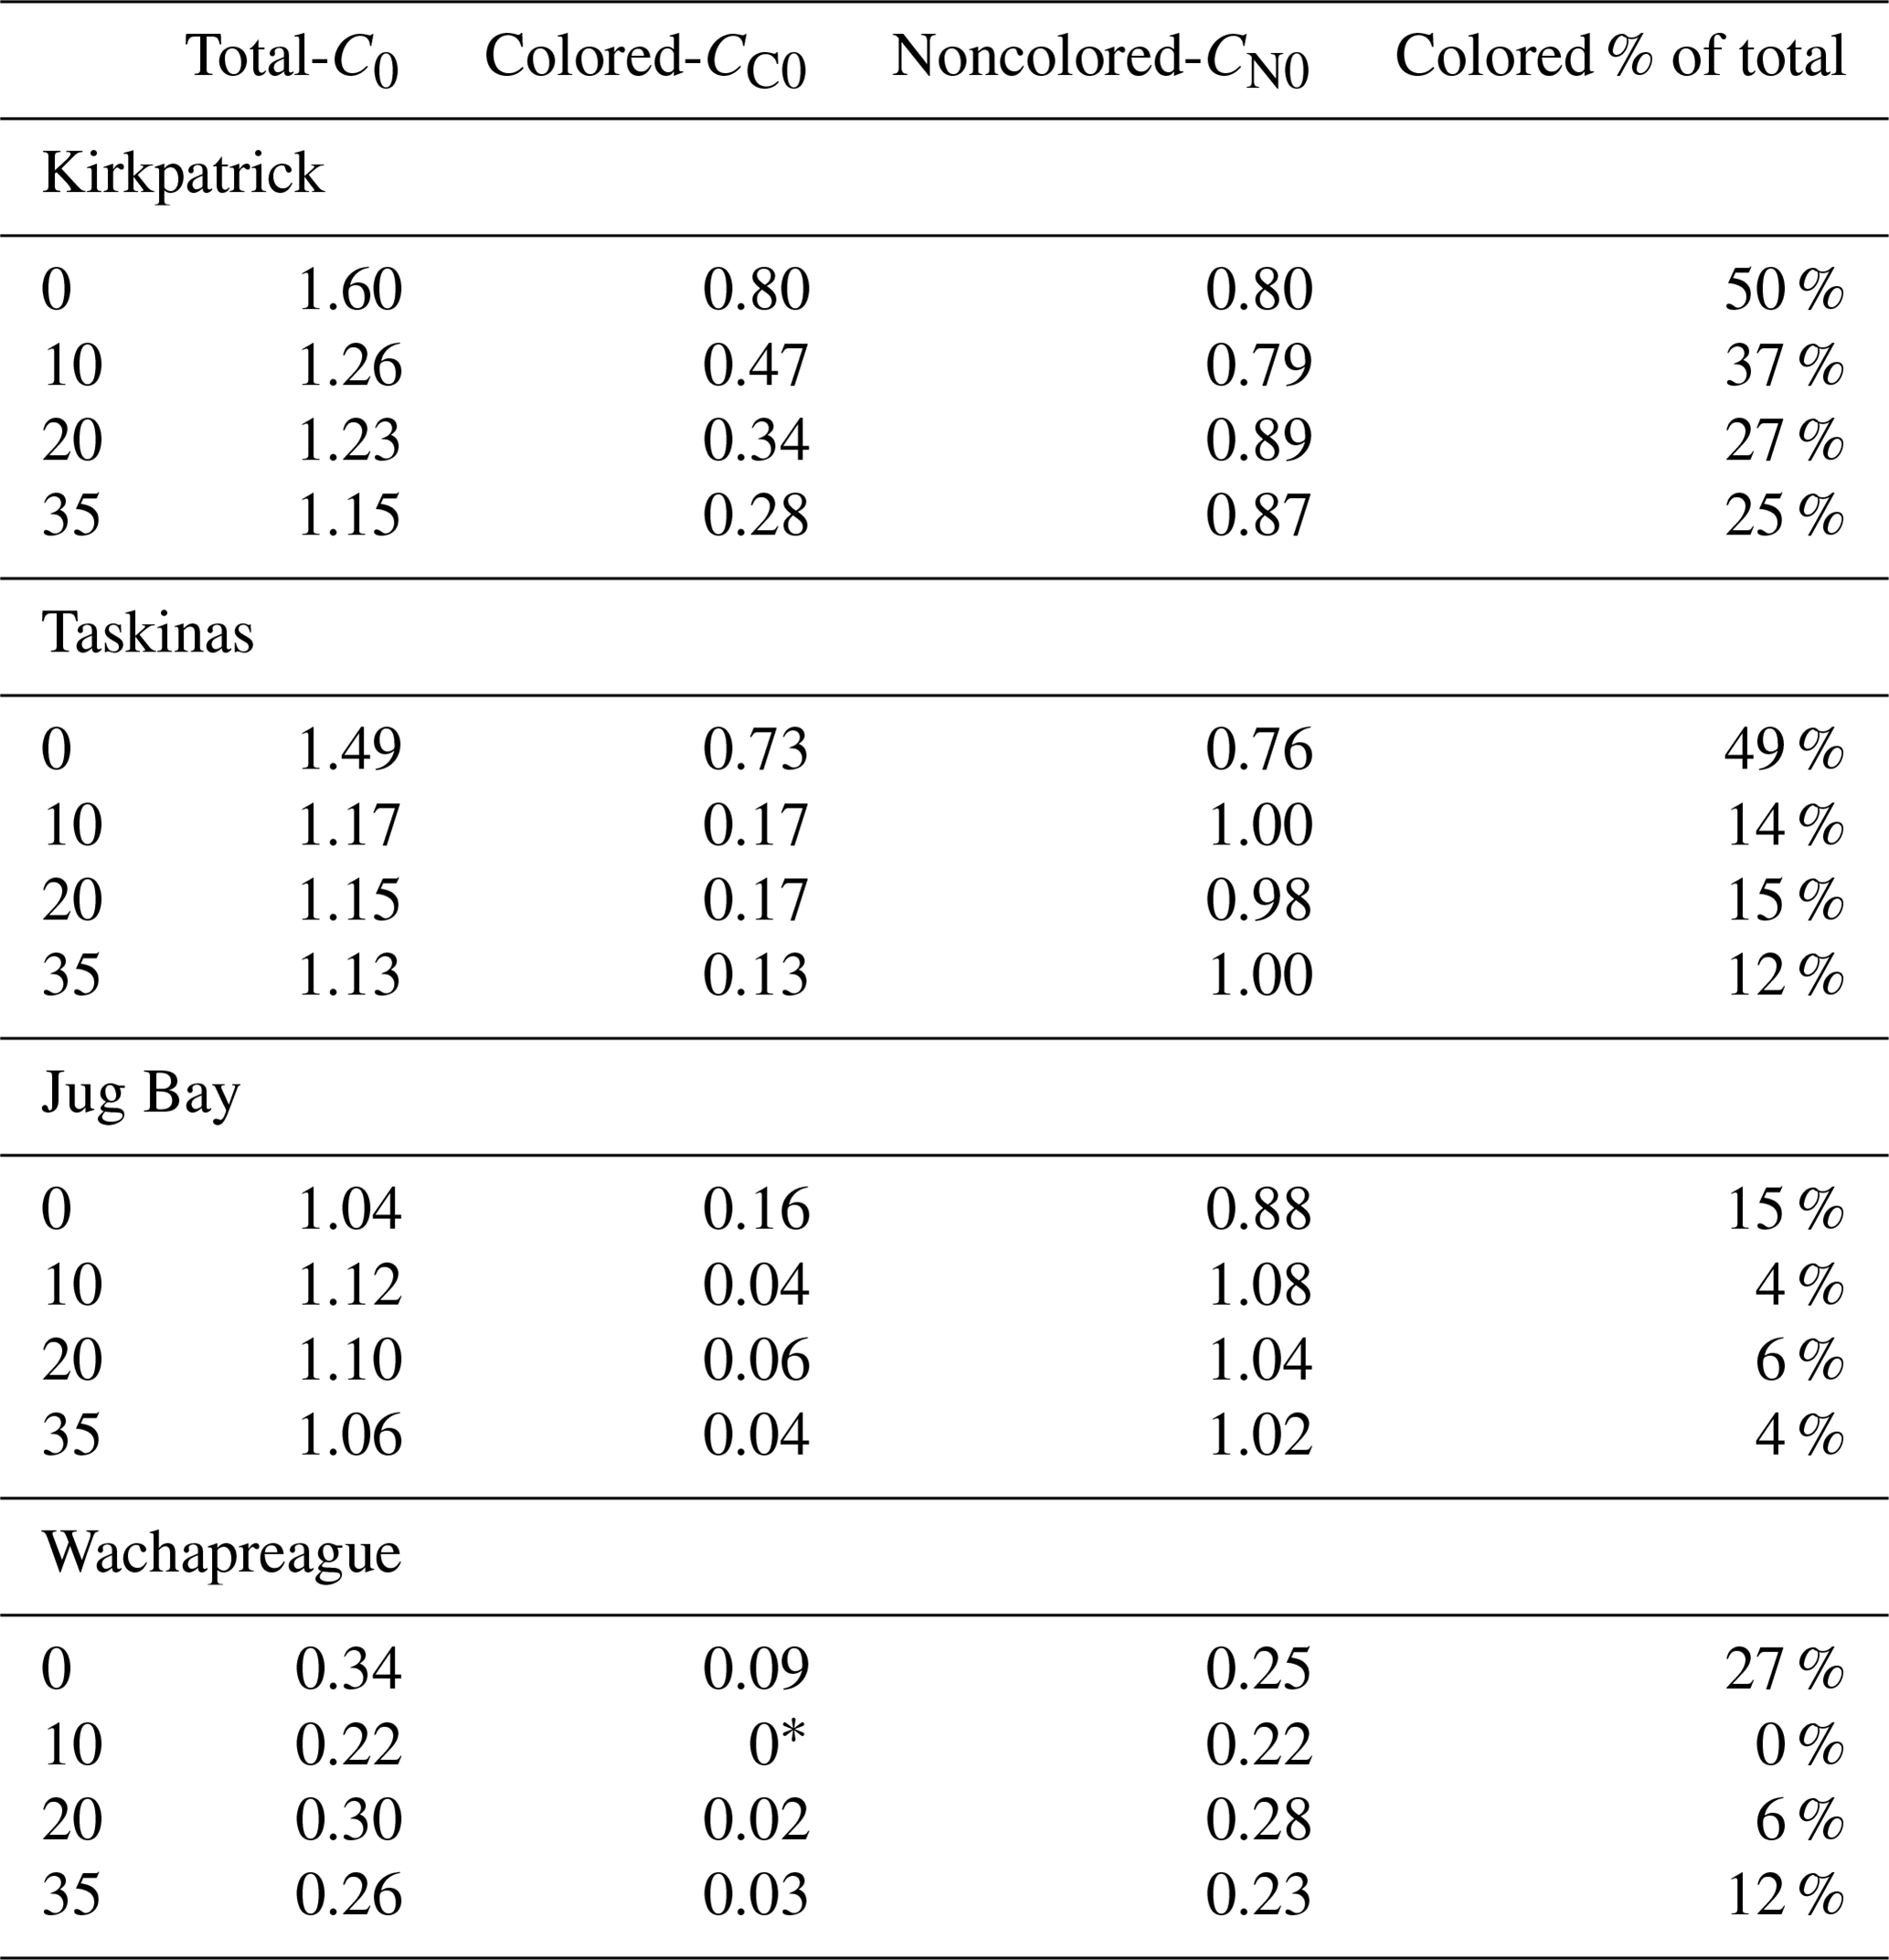
Although the parameter trends of CDOC and TDOC isotherms were similar, the magnitudes of the parameters were quite different. These differences are illustrated in an example set of fits for the Kirkpatrick, S=10 experiment (data in Fig. 1) for both TDOC and CDOC IM isotherms (Fig. 4). The y intercept represents C0, the native adsorbed organic carbon. It is clear that the absolute value of the intercept was much smaller in magnitude for the CDOC (solid circles) vs. the TDOC (“x” symbols) isotherms, e.g., 0.5 vs. 1.5 mg g−1 in Fig. 4. The C0 for CDOC (i.e., CC0) was lower because the C0 for TDOC isotherms had a large component of native-adsorbed noncolored organic carbon. The differences between TDOC and CDOC C0s are summarized in Table 4. Native adsorbed COC as a proportion of total organic carbon (TOC) varied among treatments but averaged around 39 % for the more organic-rich Taskinas and Kirkpatrick soils and only 6 % for the more mineral Jug Bay and Wachapreague soils. The CC0 decreased with salinity for Taskinas and Kirkpatrick soils and in general increased as a function of soil % organic matter with Kirkpatrick soils having the highest CC0 (Fig. 5a). The noncolored CN0 was estimated from the NCDOC isotherm (Table 3) or, equivalently, the difference between colored and total native adsorbed carbon (Table 4). The two estimates were statistically identical (compare Tables 3 and 4). In contrast with CC0, CN0 was mainly a function of soil-specific surface area (Fig. 5b) as reported in Appendix B Table B1. Desorption of NCOC increased (i.e., mn more negative) with salinity (Fig. 5c), with desorption coefficients similar for brackish and fresh tidal marsh soils. Both CN0 and mn were consistently smaller (i.e., for mn, less negative) in incubations of the sandy Wachapreague soils.
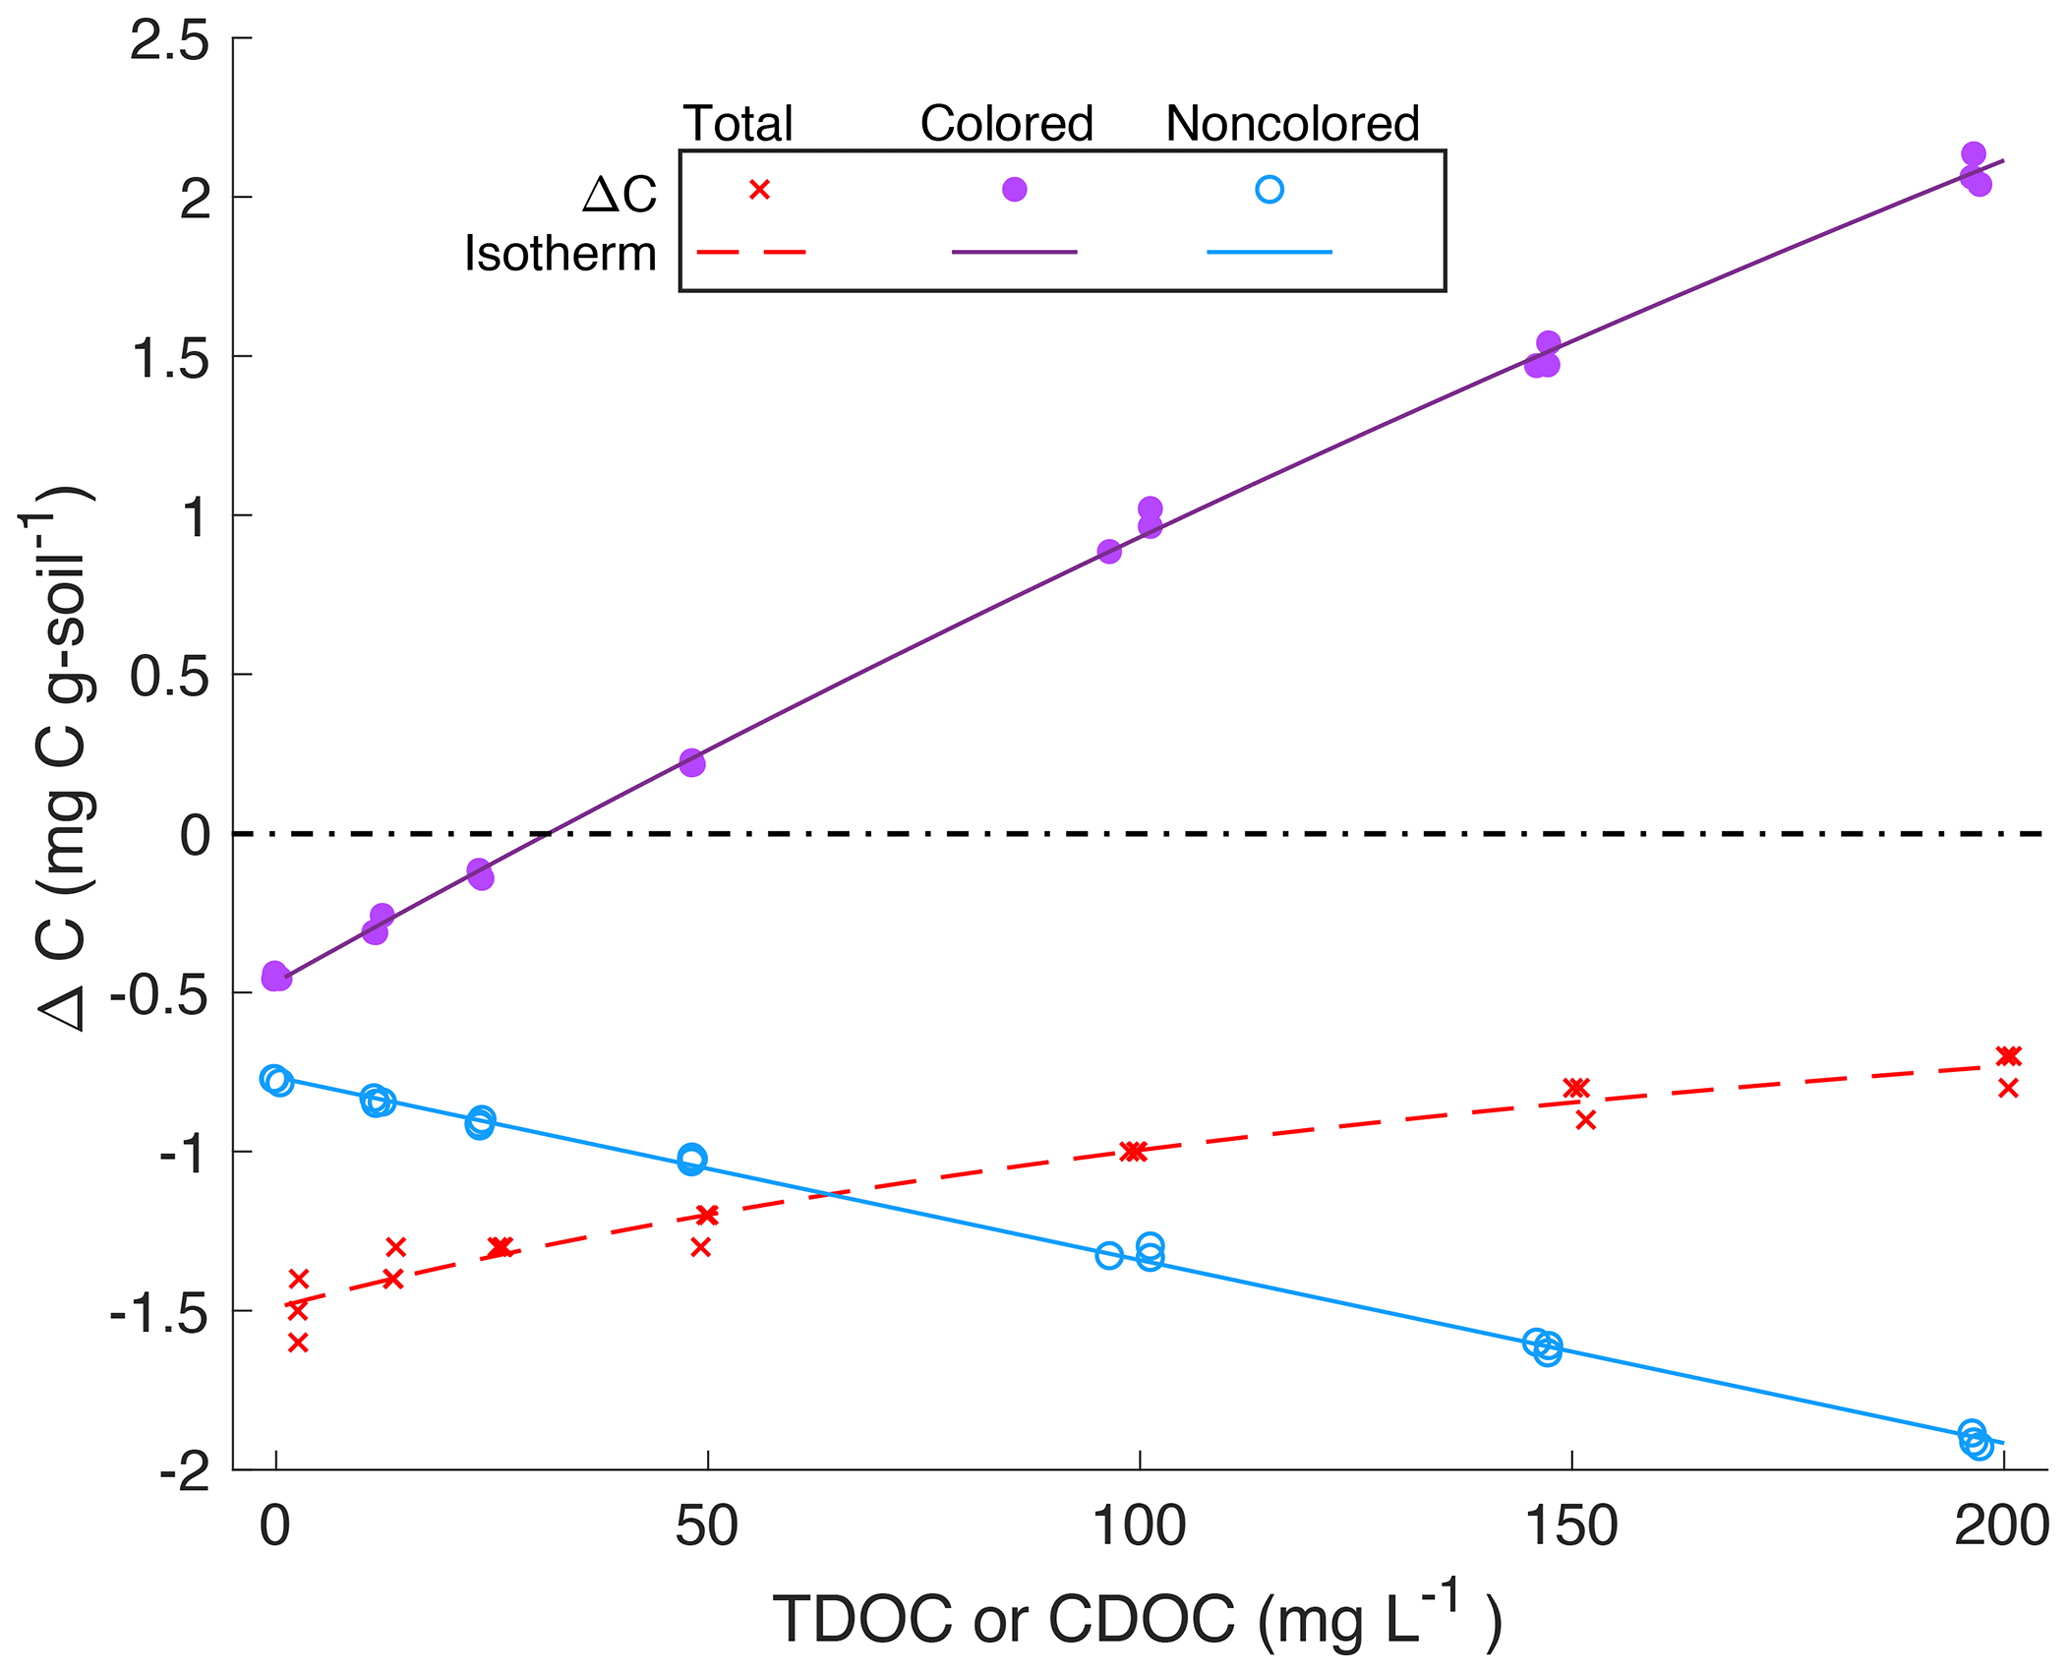
Figure 4Comparison of sorption isotherms for incubation of DOC standards with soil from Kirkpatrick Marsh, S=10, for TDOC (x, dashed line), CDOC (solid circles and line), and NCDOC (unfilled circles and solid line). Net adsorption of organic carbon, based on the difference between initial and final concentrations of soil carbon (ΔC, mg C g-soil−1), is plotted vs. solution TDOC (for total) or CDOC (colored and noncolored). Points show measured/estimated quantities from triplicate incubations for each standard; lines show the fitted Langmuir initial mass isotherm (TDOC, CDOC) and linear desorption isotherm (NCDOC). Dash–dot line indicates no net change; negative values indicate net desorption.
Table 4Comparison of native sorbed organic carbon estimates for total (C0), colored (CC0), and noncolored organic carbon (CN0), based on fitted Langmuir isotherms. CN0 was estimated by the difference C0−CC0. The CN0 based on this difference is statistically identical to the CN0 of the desorption isotherm (Table 3), r=0.99. * The fitted estimate of CC0 for this treatment was negative, considered to be 0 for purposes of the comparison.
The maximum sorption capacity of CDOC (QCmax, mg g−1) was closely related to that of the TDOC IM isotherm but was about 4 times higher (Fig. 6a). The QTmax for TDOC was lower because the adsorption of CDOC is partially compensated by desorption of NCOC. The CDOC isotherms reveal that tidal marsh soils have a large capacity to adsorb COC, especially at high salinity. The larger QCmax is coupled to a smaller binding affinity, (KC, L mg−1), which determines how quickly adsorption approaches saturation as CDOCi increases. As can be seen in Fig. 3, the approach to saturation is distinctly slower for the CDOC vs. TDOC isotherm. Overall, KC is about half of KT for TDOC (Fig. 6b). Indeed (as already mentioned), over the range of experimental treatments the CDOC IM isotherm is close to linear, though curvature is more apparent in some treatments (e.g., Jug Bay, 0 in Fig. 2).
The much smaller CC0 for CDOC also translates to a much lower threshold concentration of CDOCi (compared to TDOCi) above which there is net adsorption (null point, NP, Eq. 3). The estimated NPs (Table 2) varied in the range of 0–32 mg L−1 CDOC, except for values of ∼ 100 mg L−1 for the Kirkpatrick and Taskinas fresh treatments. For Wachapreague and Jug Bay, the NP was < 10 mg L−1 except for the Wachapreague fresh treatment for which the NP was 23.5 mg L−1. These are lower by almost an order of magnitude than the null points estimated for TDOC in these soils (Pinsonneault et al., 2021, and Appendix B Table B2).
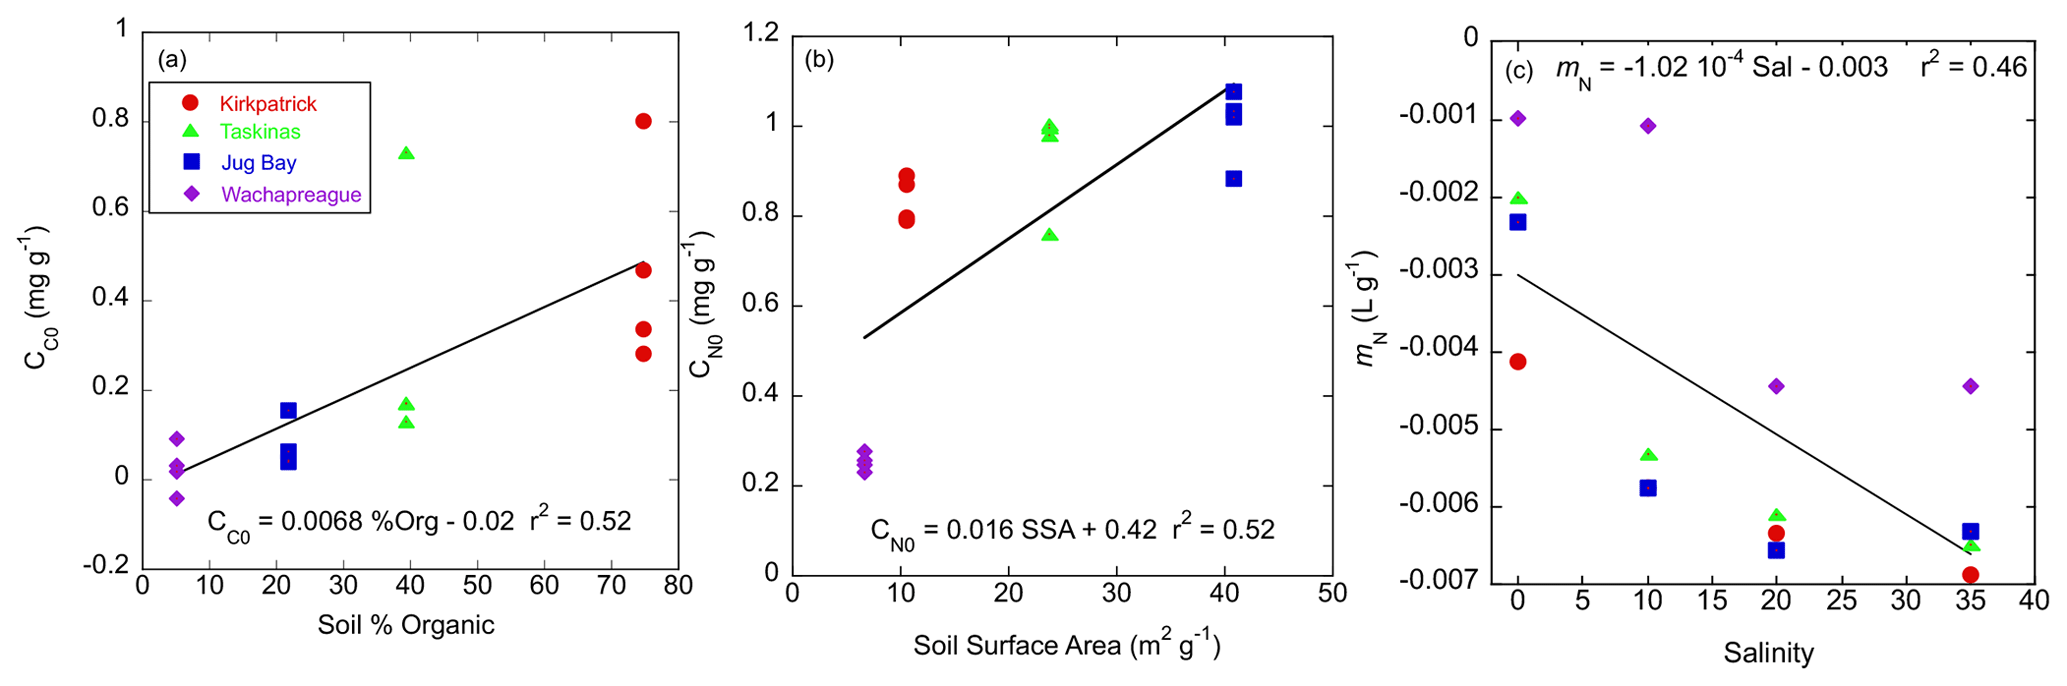
Figure 5Relationship of sorption isotherm parameters for colored and noncolored organic carbon to soil characteristics. (a) CC0 (mg g−1) vs. % soil organic matter, (b) CN0 (mg g−1) vs. soil-specific surface area, (c) desorption coefficient (mN, L g−1) vs. incubation salinity. Red circles, green triangles, blue squares, and purple diamonds denote Kirkpatrick, Taskinas, Jug Bay, and Wachapreague, respectively.
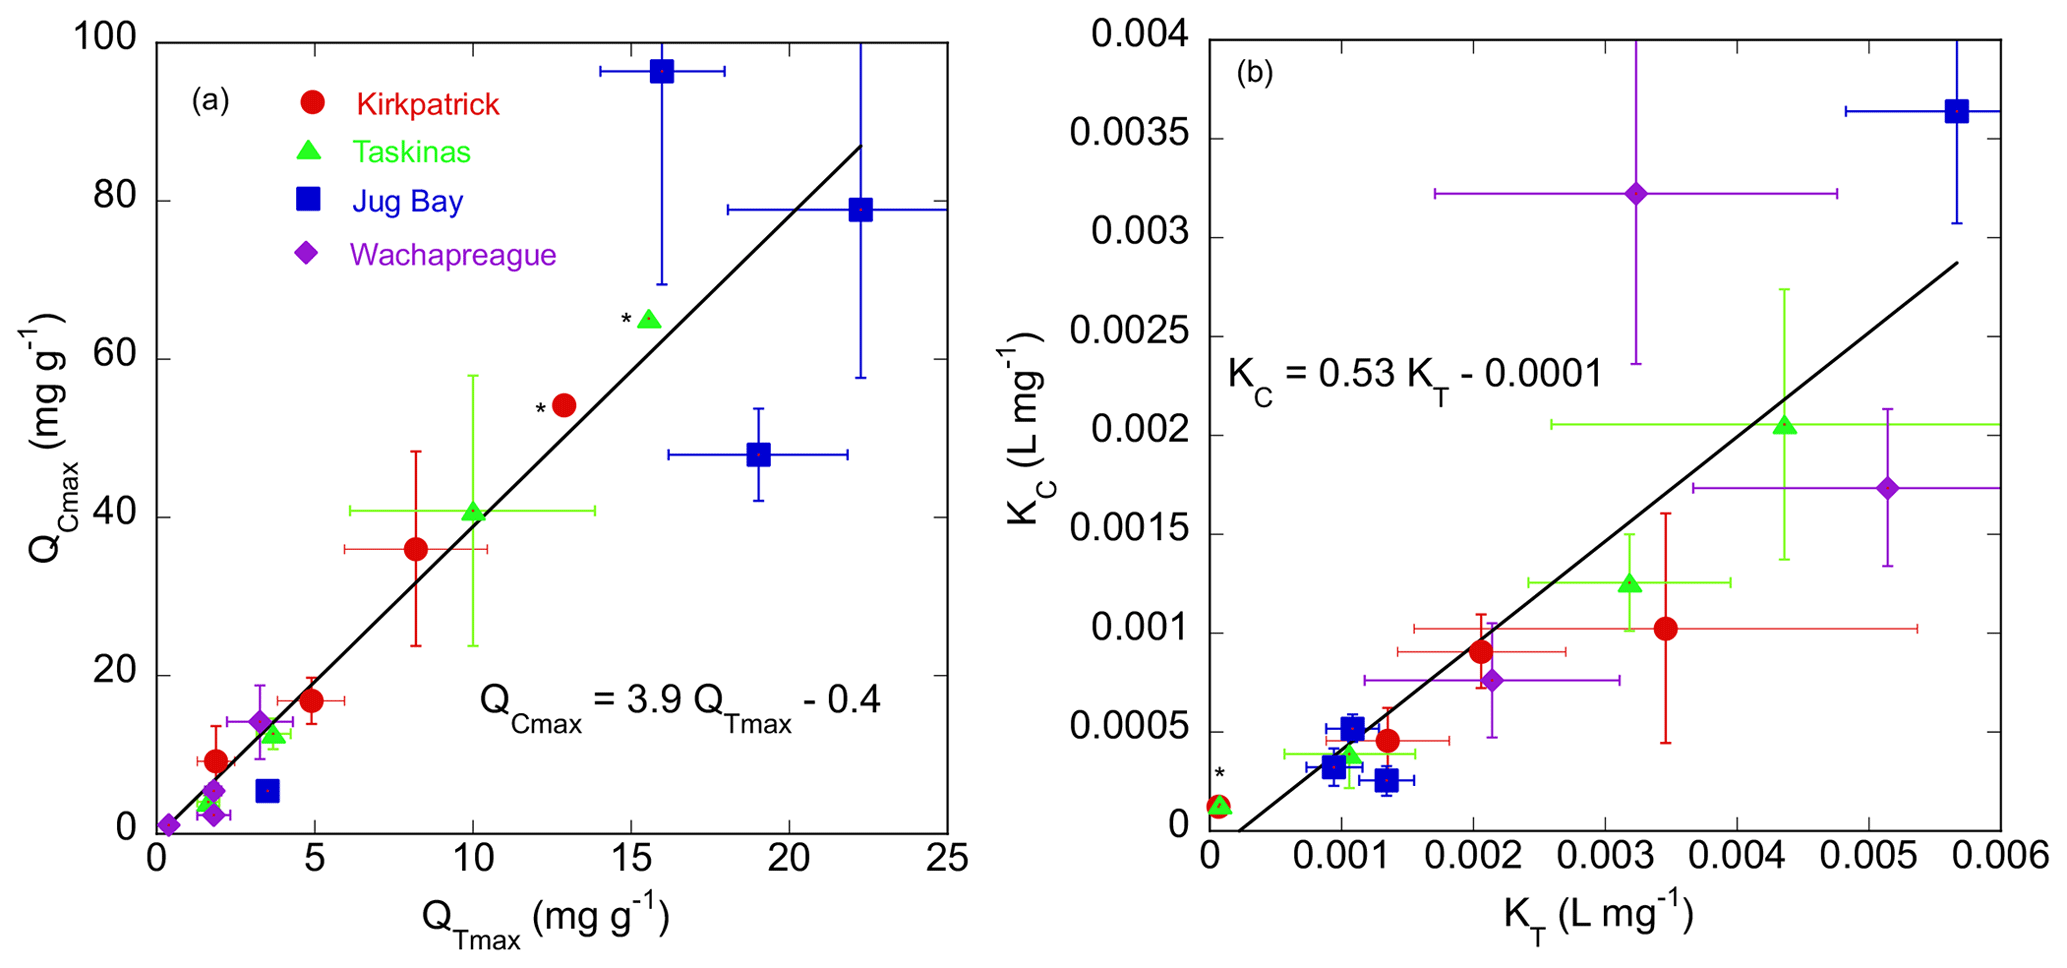
Figure 6Comparison of maximum sorption capacity (a) and binding affinity (b) estimated for CDOC isotherms (QCmax, KC) vs. those for the TDOC isotherms (QTmax, KT) fit with initial mass Langmuir isotherms (the latter in Appendix B Table B2). Error bars indicate standard errors of the parameter estimates from non-linear regression. Red circles, green triangles, blue squares, and purple diamonds denote Kirkpatrick, Taskinas, Jug Bay, and Wachapreague, respectively. Points marked with asterisks are the Kirkpatrick and Taskinas 35 incubations, which were estimated by extrapolation and lack error bars.
3.5 DOC composition
The primary change in DOC composition during incubation was a decrease in specific absorbance, which resulted from the addition of NCDOC during the incubation. Because specific absorbance at 355 nm is the inverse of the slope of the DOC vs. absorbance plots (Fig. 1, Table 1), the increase in slope (g m−2) across all the incubations translates to a decrease in specific absorbance (a* (355), m2 g−1). Similarly, the specific absorbance at 280 nm (SUVA280) and all other wavelengths decreased in all treatments (data not shown).
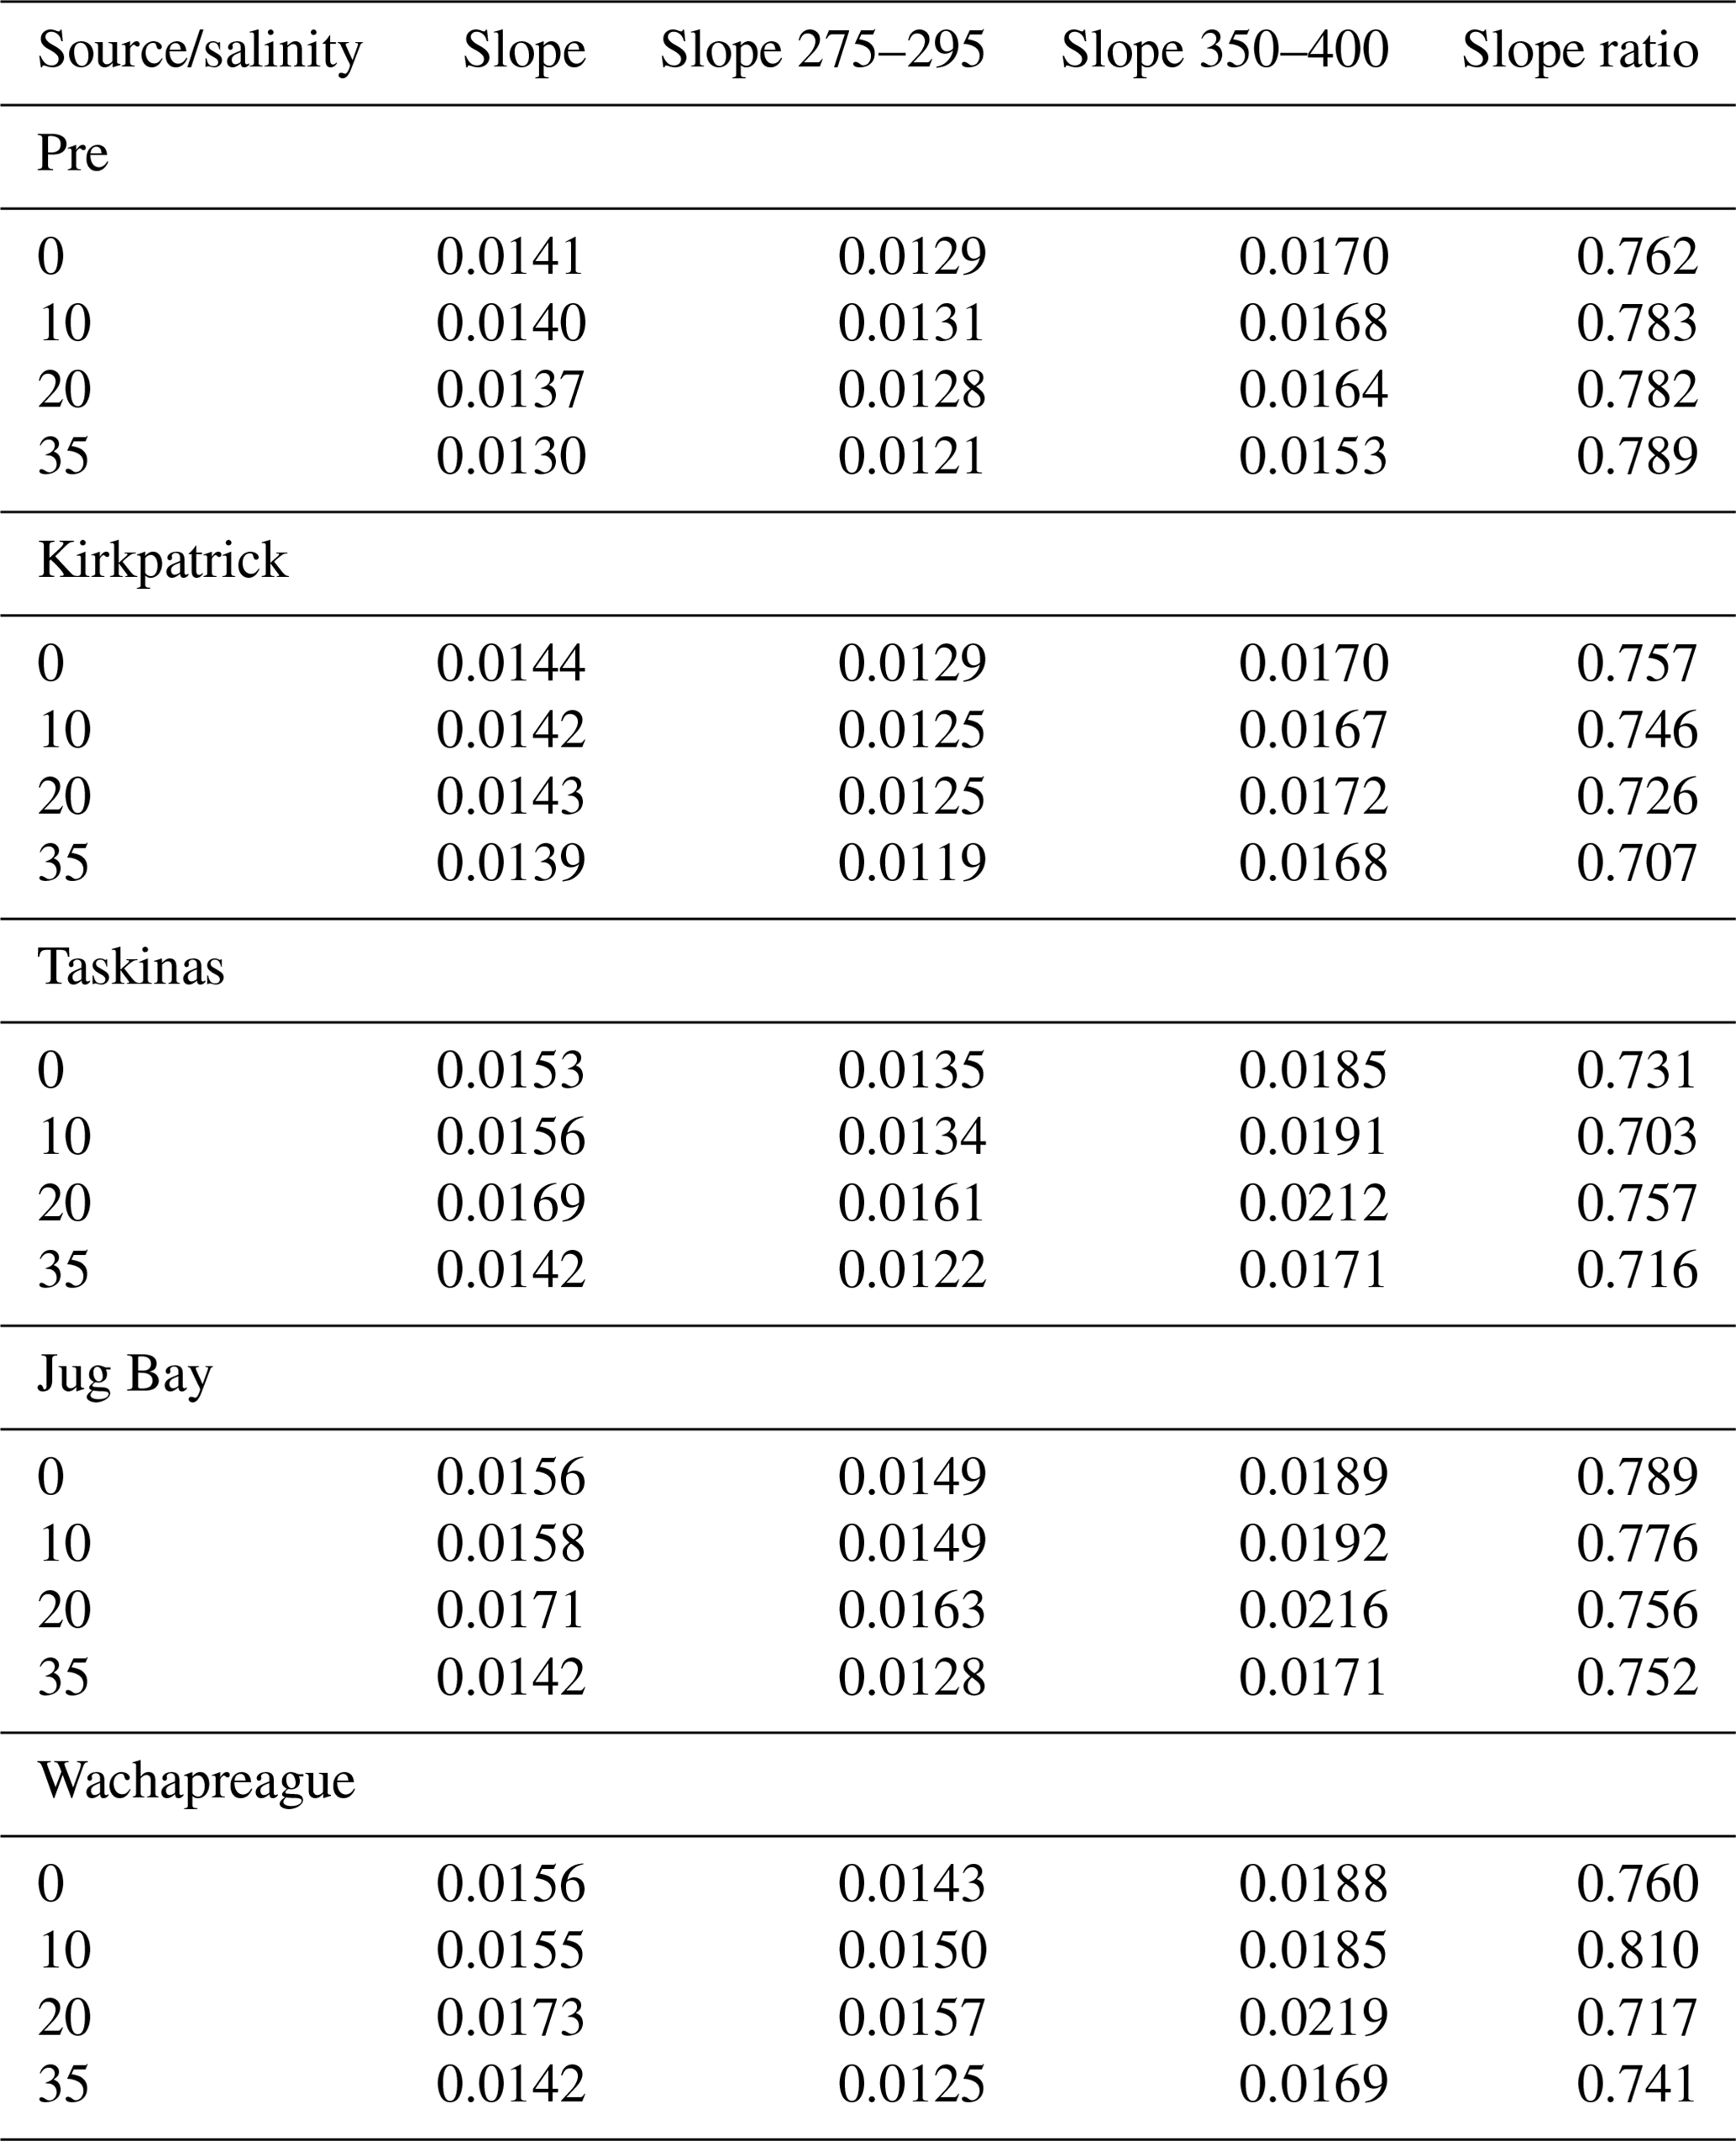
Given that spectral characteristics of CDOM absorbance and fluorescence are used to infer sources, sinks, reactivity, and other biogeochemical processes (Chin et al., 2002; Helms et al., 2008; Tzortziou et al., 2008), we examined how spectral properties of CDOC were affected by sorption processes. In addition to the “dilution effect” of desorbed NCDOC on DOC quality, there were small shifts in the spectral properties of CDOM absorbance during the incubations. The GDS-derived standards had an average (± SD) spectral slope of 0.014 ± 0.0004 nm−1 and slope ratio of 0.789 ± 0.012 (Table 5). The slope ratio (SR) falls in the range of that previously reported for GDS CDOM (SR=0.69–0.84; Helms et al., 2008). The spectral slope of CDOM after incubation was unchanged for Kirkpatrick but increased slightly for the other marsh soils to an average of 0.015 ± 0.001 nm−1. Interestingly, the average increase was slightly greater for S=20 (0.017) and less for S=35 (0.014). Slope ratio decreased on average to 0.75 ± 0.030. Despite this general decrease in slope ratio, trends differed among the soils in the 275 to 295 nm slope (S275−295), which is inversely related to the lignin-derived content of CDOM (Fichot and Benner, 2012). For the organic-rich soils of Kirkpatrick marsh, incubation resulted in a slight decrease in S275−295, averaging 0.0127 nm−1 for the standard and 0.0125 nm−1 for post-incubation CDOM. However, for the other soils the magnitude of S275−295 increased to 0.0143 ± 0.001 nm−1, indicating a decrease in lignin-derived CDOM. Within each of the standards and the post-incubation data for each soil, the lowest slope and S275−295 occurred at the highest salinity (Table 5).
Table 5Average spectral properties of CDOM for solutions added to (Pre) or resulting from incubation of tidal marsh soils. Tabulated are the full spectral slope 270–750 nm (nm−1), slope from 275 to 295 nm, and slope 350 to 400 nm, all nm−1. Slope ratio is the quotient of the 275–295 and 350–400 slopes.
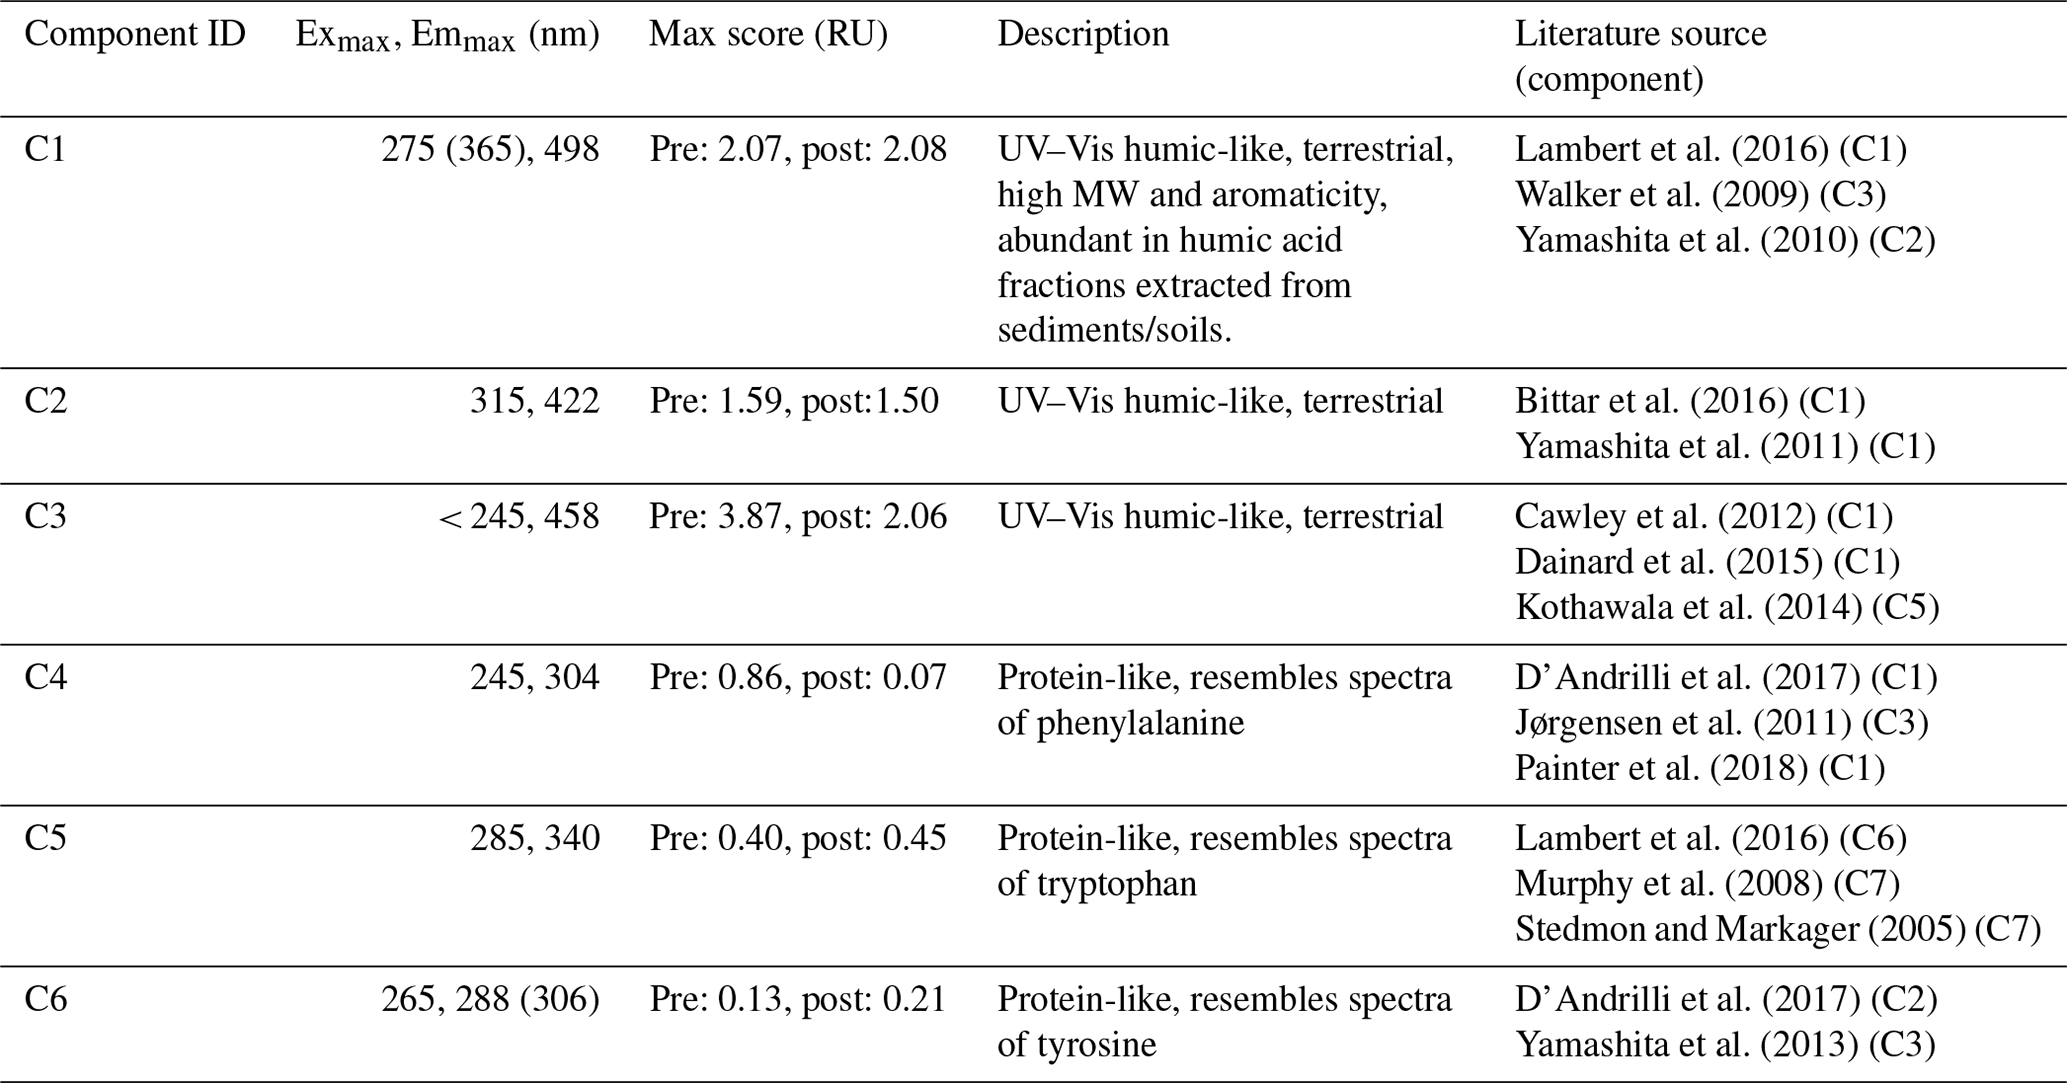
Given these shifts in CDOM composition during incubation, we used parallel factor analysis of excitation–emission matrices (PARAFAC) to obtain more information on the molecular composition. PARAFAC validated six fluorescence components which were compared to published components using the online OpenFluor database (Murphy et al., 2014). The six components correspond to different types of CDOM found in aquatic environments with varying degrees of terrestrial influence (e.g., Stedmon and Markager, 2005; Lapierre and Del Giorgio, 2014; Pinsonneault et al., 2016) (Table 6). The first three components, C1 through C3, had spectral signatures resembling those of stable, humic compounds from terrestrial sources, while the spectral signatures of components C4 through C6 were protein-like resembling those of the comparatively more reactive amino acids phenylalanine, tryptophan, and tyrosine, respectively.
Table 6Parallel factor (PARAFAC) analysis component identification using a 0.97 similarity score as matching criteria in the OpenFluor database (Murphy et al., 2014).
The adsorption–desorption incubations shifted the relative contribution of each of the three humic components to CDOM fluorescence by differential adsorption to the tidal marsh soils. This is shown by plotting “isotherms” of the initial minus final component scores (ΔC, RU) vs. initial TDOC, with positive indicating net “adsorption” (loss to the solid phase) of that component (Fig. 7). Since C1 and C2 showed similar changes, we plotted the change in the sum of the two components (C1 + C2).
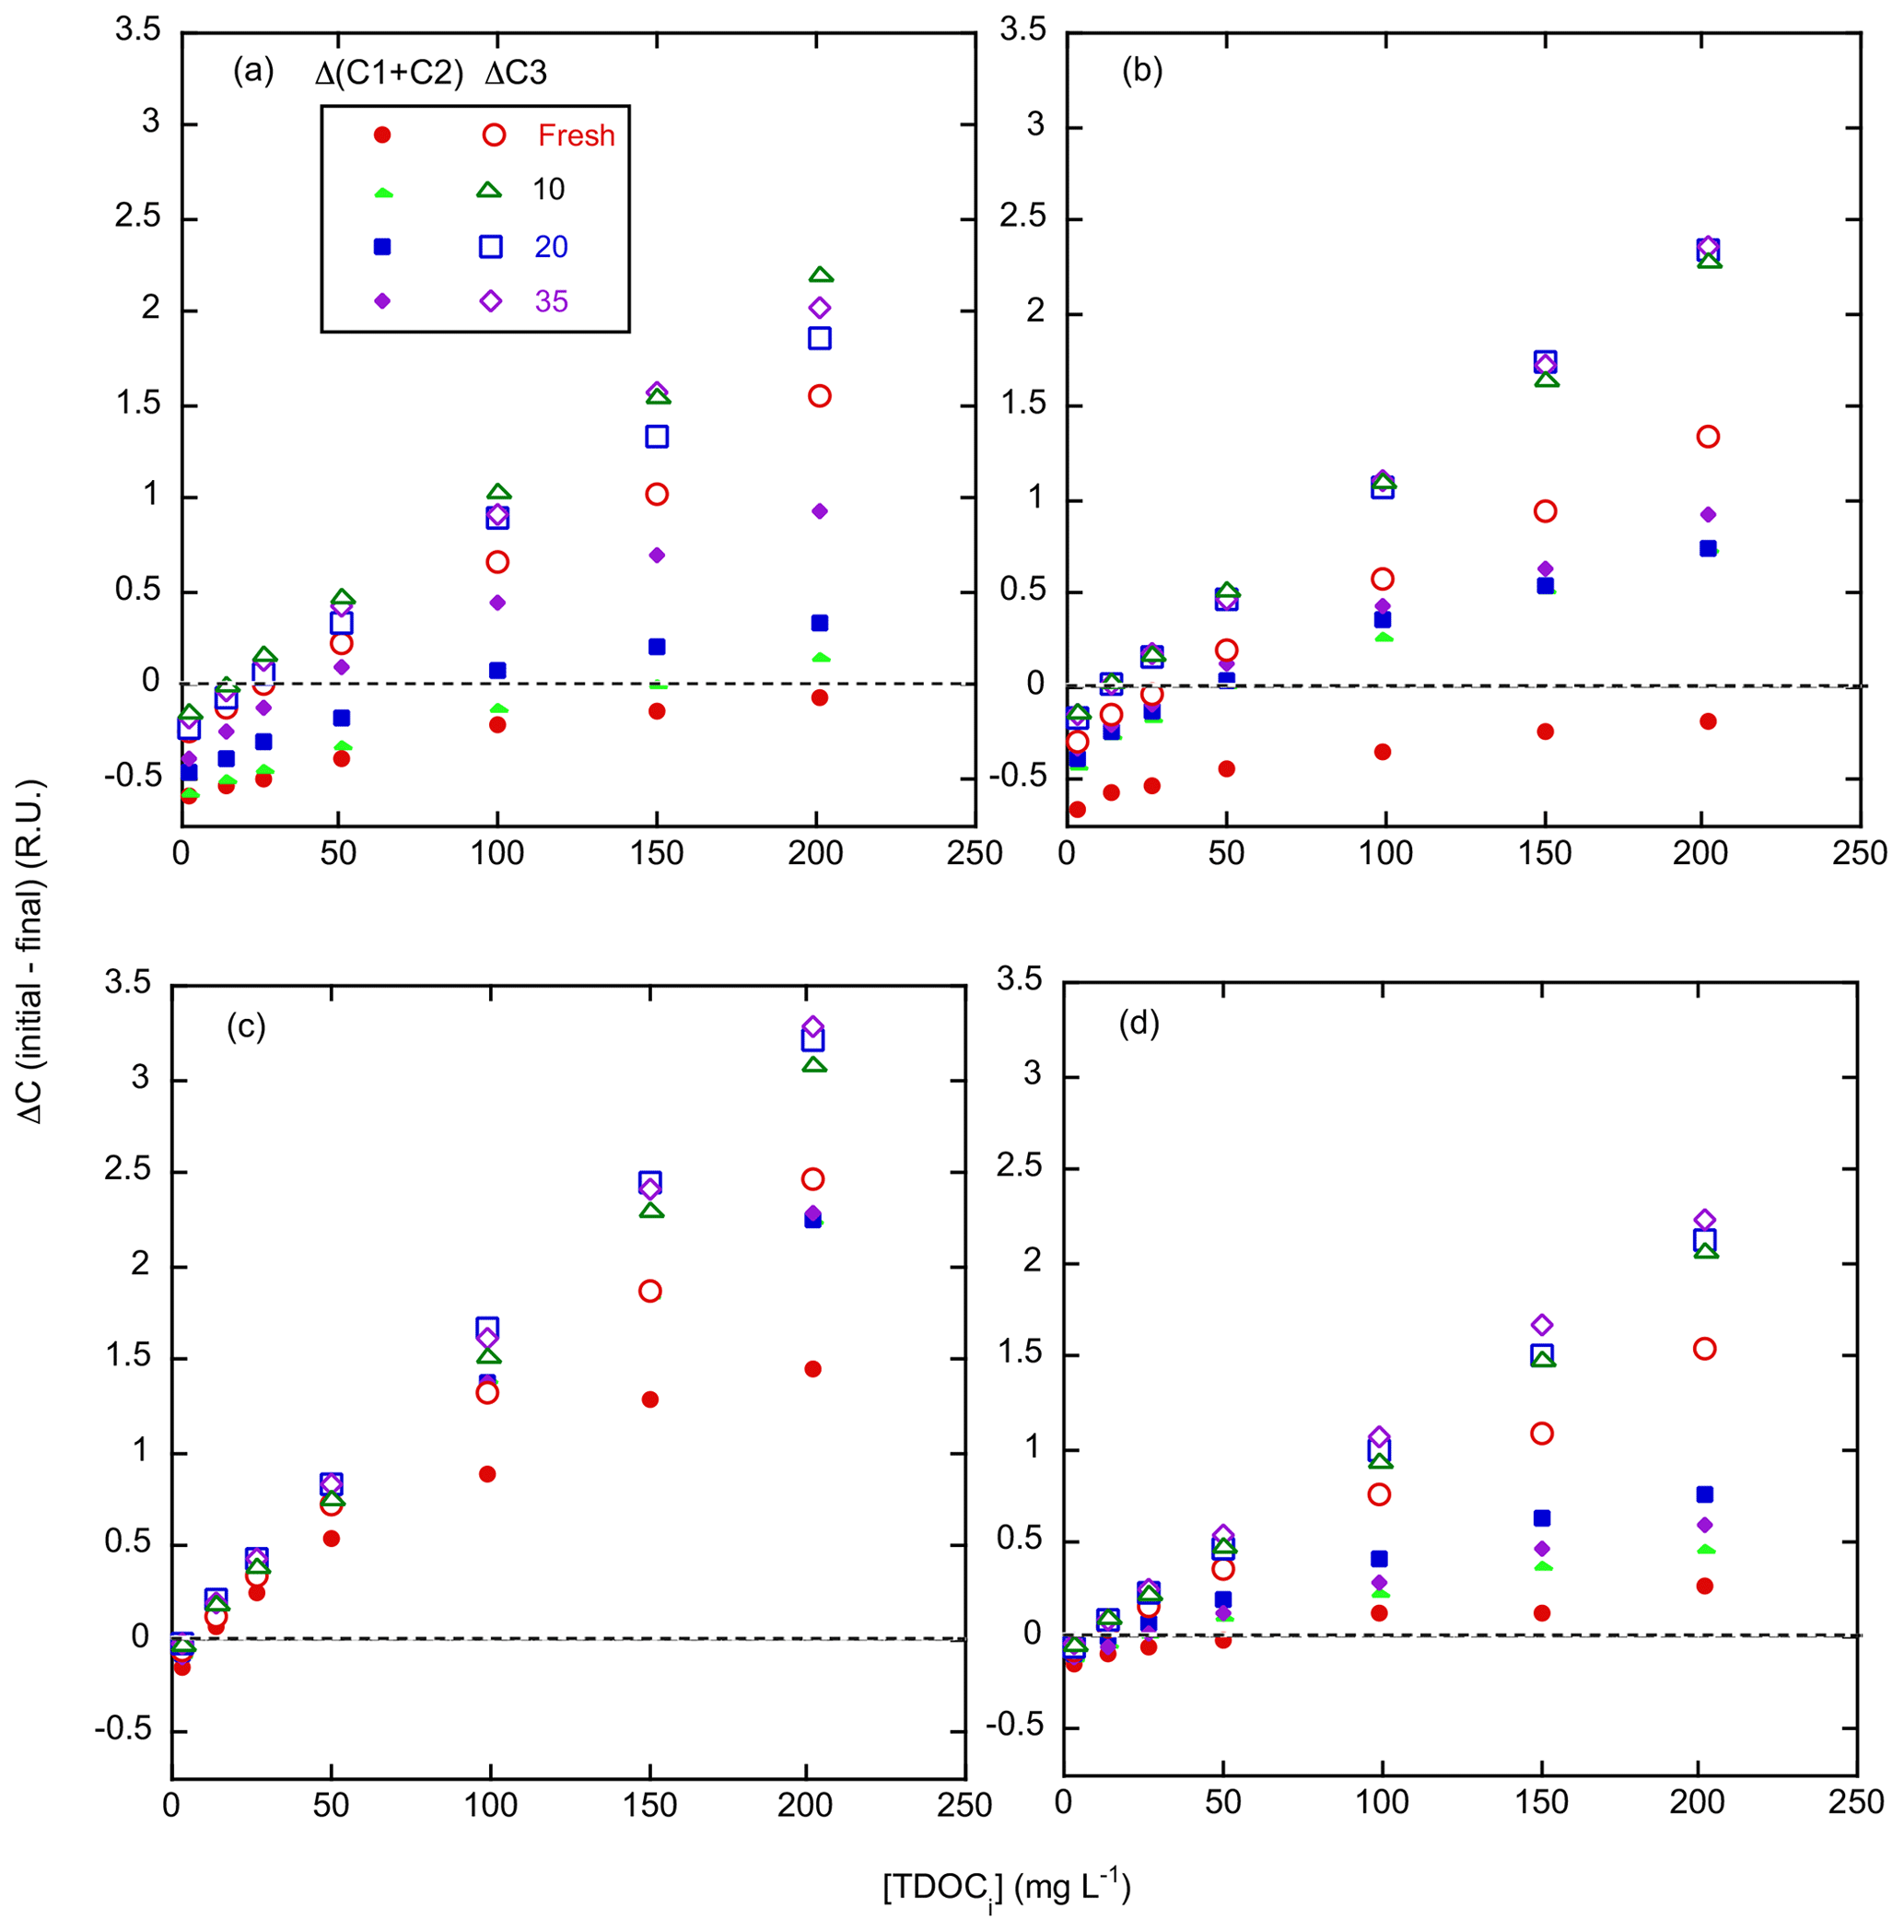
Figure 7Change in EEM components C1–C3 during adsorption–desorption incubations. Plotted is the change in component score, initial – final (i.e., net “adsorption”), for the sum of C1 and C2 (RU, closed symbols) and C3 (RU, open symbols) as a function of initial incubation TDOC (TDOCi, mg L−1). (a) Kirkpatrick, (b) Taskinas, (c) Jug Bay, and (d) Wachapreague. Red circles, green triangles, blue squares, and purple diamonds reflect 0, 10, 20, and 35 salinity treatments, respectively.
Net adsorption of component C3 was similar during incubation for all soils, salinities, and standards. The only exception was less net adsorption in the 0 treatment, especially for Taskinas. In contrast, the adsorption of C1 + C2 components varied widely with incubation salinity, with mainly net desorption for all S=0 treatments of the brackish/saline marsh soils (Fig. 7a, b, and d). However, incubation in the strongly adsorbing soils of Jug Bay resulted in net adsorption of all humic components (Fig. 7c). Nevertheless, adsorption of C1 + C2 increased with salinity for all soils. This pattern of differential adsorption resulted in the net enrichment of C1 + C2 in the solute phase during incubation, with the most enrichment occurring at low salinity.
The protein-like components (C4 through C6) made minor contributions to EEM fluorescence with maximum scores for each component in the range of 0.21 to 0.86 RU compared to 1.50 to 3.86 RU for C1 through C3 (Table 6). The tryptophan-like component (C5) content was proportional to the initial CDOC, ranging from 0 to 0.4 RU; otherwise there was no consistent relationship between the protein-like components and CDOC (data not shown). The phenylalanine-like component (C4) was prevalent in the standards with an average score of 0.30 RU but decreased during incubation to zero or near-zero. Post-incubation C4 scores only exceeded 0.02 RU in 12 of the 112 different incubation conditions, these being for low salinity in Taskinas, Jug Bay, and Wachapreague.
Experiments presented here examined the interaction between highly colored, strongly humic, terrigenous DOC, and soils from tidal marshes of the Chesapeake Bay that vary in salinity regime and soil mineral content, among other factors. In an earlier analysis (Pinsonneault et al., 2021), we examined the changes in total dissolved organic carbon (TDOC) during soil-solution sorption incubations. Here we have further analyzed organic carbon interactions with tidal marsh soils by partitioning the changes in TDOC into colored (CDOC) and noncolored (NCDOC) fractions, tracking them in the dissolved phase.
Our analysis of the adsorption–desorption exchanges revealed that colored and noncolored organic matter have distinctly different adsorption–desorption characteristics that dramatically shifted the composition of DOC during incubations (Fig. 8). Noncolored matter was consistently desorbed in our experiments, regardless of the concentration of TDOC in the standards. The linear correlation of NCDOC and CDOC in desorption isotherms shows that desorption of NCDOC is driven by the exchange (in most cases adsorption) of CDOC on soil surfaces. This coupled exchange was quantified as a displacement coefficient, which suggests that 12 %–44 % of NCOC desorption is associated with CDOC adsorption. Similarly, Kothawala et al. (2012) reported that incubating terrestrial mineral soils with aqueous extracts from organic horizons decreased the solution-specific absorbance and average molecular weights. They concluded that ligand exchange occurred on soil surfaces during the incubations whereby solution-phase aromatic C (strong ligands) replaced less aromatic (weaker ligands) soil C. This is consistent with our observation of strong adsorption of more aromatic CDOC and release into solution of the less aromatic NCDOC. Decrease in average molecular weight can also occur due to differential adsorption of CDOC components from the solution (cf. Fig. 7). However, this was a minor process under our experimental conditions because incubations had minimal effects on the slopes and slope ratios of absorbance spectra. Moreover, such differential adsorption would be expected to cause differential changes in the specific absorbance of CDOC (an indicator of average molecular weight) as a function of CDOC (cf. adsorption of fulvic acid on goethite Zhou et al., 2001), whereas we observed uniform specific absorbance over all incubation concentrations (Fig. 1).
The specific absorbance of the CDOC derived from GDS surface waters was lower than that of Kirkpatrick low tide (LT) tidal surface water (Clark et al., 2019; see Appendix B, Fig. B3), so what we have designated as CDOC may be mixed with some NCDOC. This NCDOC could not be resolved by our approach because its concentration in the initial solution is simply a function of the dilution of the GDS stock. However, if there was NCDOC present in the incubation standards, it was not interacting with soil-adsorbed noncolored organic carbon. Any moiety in the standards that could exchange with the soil NCOC would act to repress net desorption of NCOC in incubations with sufficiently high TDOC. Such an interaction would result in a deviation from the observed tight linear relationship between NCDOC desorption and CDOC in the standards.
In contrast to NCDOC, the net adsorption or desorption of CDOC in the isotherm experiments followed the functional response of Langmuir isotherms, as observed for TDOC (Pinsonneault et al., 2021). However, CC0 (native adsorbed COC) was much lower than C0 for total organic carbon meaning that the transition from net desorption to net adsorption (null point) was at a much lower concentration for CDOC than for TDOC. This reflects the preferential adsorption of CDOC over most of the concentration range of the standards. Appreciable net desorption only occurred in the highly organic soils from Kirkpatrick and Taskinas and at low CDOCi (< 32 mg L−1 for saline soils, Fig. 3). Net adsorption of CDOC dominated in the Jug Bay and Wachapreague incubations. In contrast to CC0, the isotherm parameters (QCmax and KC) were well correlated for TDOC and CDOC, although the magnitudes were different (Fig. 6). The maximum adsorption capacity, QCmax, was almost 4 times higher for CDOC than QTmax for TDOC, while KT, the binding affinity, was about half. The magnitudes are different even though the adsorption of TDOC and CDOC follow similar patterns because the TDOC reflects the combination of CDOC adsorption and NCOC desorption. Nevertheless, the TDOC isotherm parameter correlations (Fig. 6) imply that the previously reported relationships between QTmax or KT and various soil properties also apply to CDOC isotherms (Pinsonneault et al., 2021). The tested soil properties were specific surface area (SSA), non-crystalline iron, and % organic content. Like for TDOC, QCmax increased and KC decreased with greater salinity, although the enhancement of maximum soil sorption capacity at higher salinity was somewhat less in soils enriched in poorly crystalline iron minerals. However, soil organic content, not its SSA, determined how much COC was available to be desorbed into low concentration standards. Such relationships between commonly measured soil properties and differential DOC sorption demonstrate the potential for spatial modeling of DOC functional group sorption across Chesapeake Bay coastal wetland soils.
Variations in incubation physiochemical conditions also affected DOM absorbance, but these variations do not substantially affect our interpretation of CDOC dynamics. Increasing salinity, and thus ionic strength, increases CDOM absorbance, with proportionally greater increases at longer wavelengths (Gao et al., 2015). This is attributed to deprotonation of DOM and results in a lowering of the spectral slope of CDOM absorption spectra and increase of specific absorbance, e.g., at 355 nm (Gao et al 2015). Consistent with these effects is the slight reduction of spectral slope with increasing salinity in both pre- and post-incubation spectra and the increase in specific absorbance (inverse of the decrease in DOC regression slope) of pre-incubation CDOC (Tables 1 and 6). However, increasing salinity, per se, does not account for the trend in the key change related to desorption of NCDOC during incubations, the decrease in specific absorbance (increase in DOC slope). This decrease was intensified by increasing salinity (Table 1). Increasing pH also increases DOM-specific absorbance (Gao et al., 2015), and pH increased in all our incubations from 4.6 ± 0.09 in the standards to post-incubation values of 6.74 ± 0.03, 6.64 ± 0.04, 5.15 ± 0.05, and 6.94 ± 0.10 for Kirkpatrick, Taskinas, Jug Bay, and Wachapreague soils, respectively (Pinsonneault et al., 2021). Again, the increase in pH did not have an important effect on post-incubation absorbance since specific absorbance decreased during the incubation, the opposite direction from what would be expected from the pH change alone.
Ferric (Fe3+) iron also absorbs in the UV, and its concentration in some surface waters is high enough to significantly bias estimates of CDOM absorbance (Poulin et al., 2014; Logozzo et al., 2022). However, Fe is not a significant factor for DOM from the Great Dismal Swamp since it is a peat wetland with very low iron (U.S. Fish and Wildlife Service, 2006). Release of iron into solution during the incubation seems unlikely since it would have increased specific absorbance, again, the opposite of what we observed. Finally, we can exclude interference from dissolved iron on our absorbance measurements since all solutions were anaerobic, and dissolved iron would be in the non-absorbing Fe2+ state.
In addition to releasing NCDOC, incubations with tidal marsh soils had secondary effects on the GDS CDOC pool. The humic C3 EEM component, which was the dominant component in the GDS pool, was strongly adsorbed during all incubation conditions (Fig. 7). In studies with a similar component (identified through OpenFluor, Table 6), C3 has been described as relatively resistant to photodegradation (Dainard et al., 2015), a property that may explain its relative abundance in the stagnant, sun-exposed ditch waters of the Great Dismal Swamp. On the other hand, adsorption of the humic components C1 and C2 was dependent on salinity, suggesting that these components account for the pattern of salinity-dependent adsorption observed in the CDOC (and TDOC) isotherms. The C4 component (phenylalanine-like) was also depleted from the dissolved fraction during incubation. Taking these results into account, we conclude that incubation with tidal marsh soils changes the composition of DOC primarily due to adsorption–desorption differences between noncolored and colored organic matter, but there can also be selective sorption that changes the composition of the colored organic matter pool. Further information on the selective effects of adsorption–desorption on the DOC composition of tidal marsh waters could be obtained by tracking the differential changes with high-resolution molecular techniques, such as FT-ICR-MS and high-resolution LC-MS. This information is essential for including tidal marsh sorption effects in biogeochemical models of carbon cycling in coupled tidal marsh–estuarine systems.
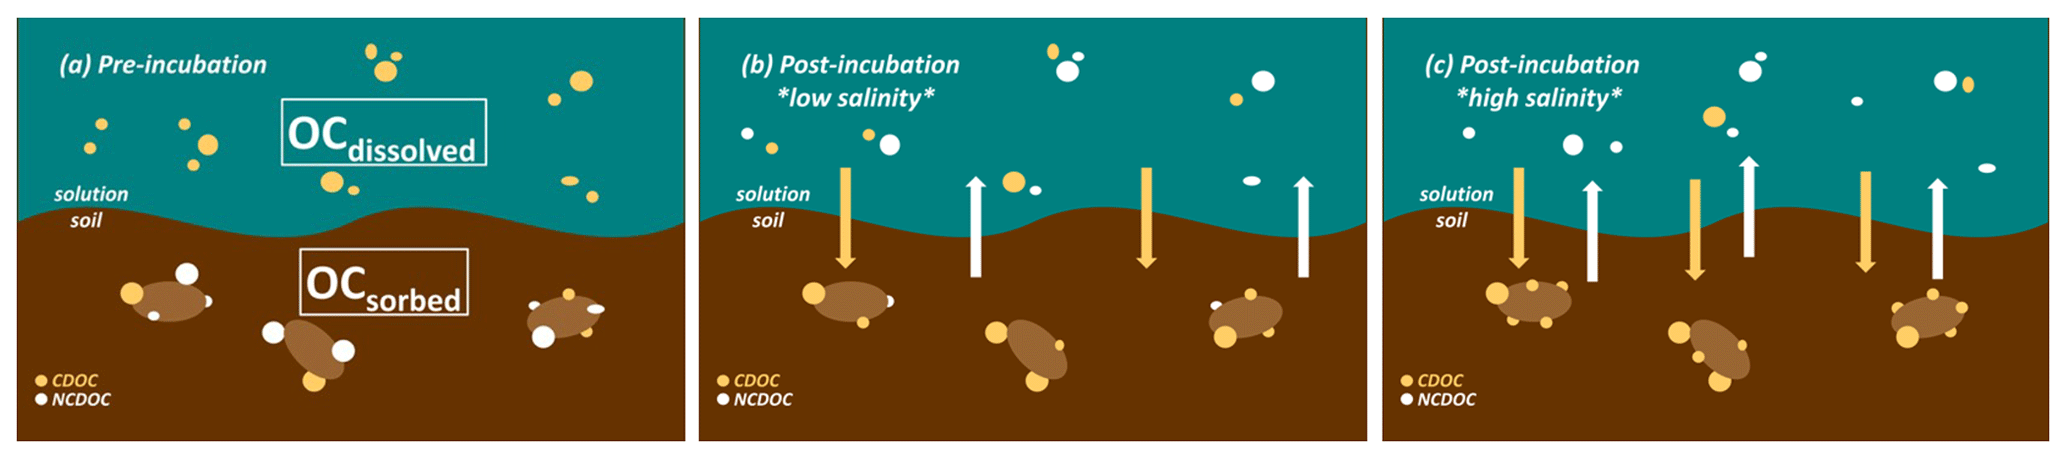
Figure 8Conceptual diagram of the closed incubation experiments showing (a) pre-incubation vs. (b) post-incubation low-salinity and (c) post-incubation high-salinity exchange of colored (beige dots) vs. noncolored (white dots) organic carbon that is either sorbed to soil (bottom brown area) or dissolved (top blue-green area). The initial composition of the wetland soil sorbed organic carbon (OCsorbed) is a mixture of colored and noncolored OC, whereas the Great Dismal Swamp DOC contains almost exclusively colored OC (OCdissolved). During the incubation at low salinity (b), colored OC is preferentially adsorbed to soil while noncolored OC is desorbed into solution. These net fluxes are intensified at high salinity (c).
Overall, these results show that adsorption–desorption of TDOC and CDOC are similar, suggesting that sorption of CDOC accounted for most of the total DOC sorption in our marsh soils. Our experimental conditions – incubation of sieved, freeze-dried soil with non-native DOC – are not representative of adsorption–desorption in situ; nevertheless, the estimated CDOC null points for our soils are in the same range as porewater DOC measured at these sites. Spot samples of porewater using “peepers” (12 h deployment) had DOC concentrations between 10 and 40 mg C L−1 (Pinsonneault et al., unpublished data), similar to the null points of CDOC in our IM isotherms (excluding the freshwater treatments of two brackish sites, Kirkpatrick and Taskinas). This suggests that exchanges of colored organic matter adsorbed on these tidal marsh soils and CDOC in associated pore waters could be close to equilibrium. Such an equilibrium is consistent with the hypothesis that tidal marsh soils act as reservoirs of CDOM that buffer the release of CDOM into surface waters (Tzortziou et al., 2011).
In our experiments the noncolored organic matter fraction only desorbed, leaving open questions regarding its adsorption characteristics. Other types of test solutions may be needed to determine the adsorption–desorption characteristics of the noncolored fraction. Since test solutions from GDS were from static areas with long residence times, NCDOC comparable to NCOC in tidal soils may have been relatively low as the former fraction is presumably relatively more reactive to microbial degradation. On the other hand, water draining from Kirkpatrick tidal marsh at low tide, having been recently in contact with tidal marsh soil, has varying amounts (40 %–70 %) of its DOC as NCDOC (Clark et al., 2019); experiments with these solutions may help to better resolve the sorption properties of NCDOC.
4.1 Implications
While more needs to be known about the sorption properties of NCOC, our results lead us to predict that increasing salinity in tidal marsh ecosystems will shift the DOC composition of marsh porewater exported to estuaries, increasing the proportion of noncolored vs. colored organic matter (cf. Fig. 8). We predict that, all other factors held constant, shifts in the relative amounts of noncolored and colored organic matter will be greatest for mineral-rich soils, especially in soils with a very high surface area (SSA) like those of Jug Bay. The high SSA in our study soils arises, in part, from a high content of non-crystalline iron (Pinsonneault et al., 2021, Appendix B, Table B1). Coastal wetlands transitioning to a more saline condition may therefore export more bioreactive (i.e., less complex, noncolored) organic compounds, increasing substrate availability to estuarine microbes. At the same time, less release of colored organic matter in tidal waters would increase transmission of UV and PAR, increasing photochemical degradation – and potentially also microbial availability – of estuarine CDOC (Logozzo et al., 2020). These shifts, as well as interplay of multiple co-occurring processes, would need to be considered in modeling the effect of salinity change on the carbon cycle in coupled tidal marsh–estuarine systems (Clark et al., 2020), including in connection with the restoration of tidal exchange to artificially impounded coastal marshes (Kroeger et al., 2017; Wang et al., 2019; Eagle et al., 2022). In addition to sea level rise, disturbances like warming, eutrophication, and landscape development are all expected to alter the complex relationships between ecological, geochemical, and geomorphic controls on soil organic matter decomposition and preservation in coastal marsh systems (Spivak et al., 2019).
Chromophoric solutes have been used as indicators of water quality in a wide variety of ecosystems (e.g., Levy et al., 2014; Liu et al., 2014; Niu et al., 2014), and it has been reported that CDOM composition differs significantly between flooding and ebbing tides in tidal marshes (Tzortziou et al., 2008; Knobloch et al., 2022). Porewater draining from tidal creek banks at low tide is a primary source of CDOM in the ebbing tide (Menendez et al., 2022). Our results are consistent with this CDOM being derived by exchange with marsh sediment, as low DOC flood waters infiltrate into the sediment and desorb CDOC from the sediment. Our results also suggest that sediments are a significant source of NCDOC which, for example, comprises ∼ 50 % of the DOC in Kirkpatrick Marsh tidal creeks at low tide (Clark et al., 2019). However, our understanding of the abiotic processes that regulate this exchange and transformation at the tidal marsh–estuarine interface remains limited. Our study demonstrates the complex interplay between soil mineral and organic properties, salinity, and dissolved organic matter composition in regulating sorption processes at this dynamic interface, information that is required to represent the function and sensitivity of coastal interfaces in Earth system models (Ward et al., 2020). Our results highlight the potential sensitivity of coastal wetlands to the impacts of anthropogenic climate change and evolving water management practices, resulting in heightened drought conditions and unpredictable variations in freshwater flow. We show that models forecasting salinity-driven changes to the fluxes and chemical characteristics of coastal wetland DOC export can succeed by incorporating soil parameters such as the poorly crystalline mineral content, soil organic matter content, and CDOC vs. NCDOC composition as explicit variables. Further research into the impacts of small salinity increases (< 10) on the CDOC and NCDOC sorption dynamics in tidal freshwater and tidal oligohaline wetland soils would be instrumental in improving our understanding of the finer-scale and more immediate impacts of global climate change and/or management changes on sorption processes in these systems.
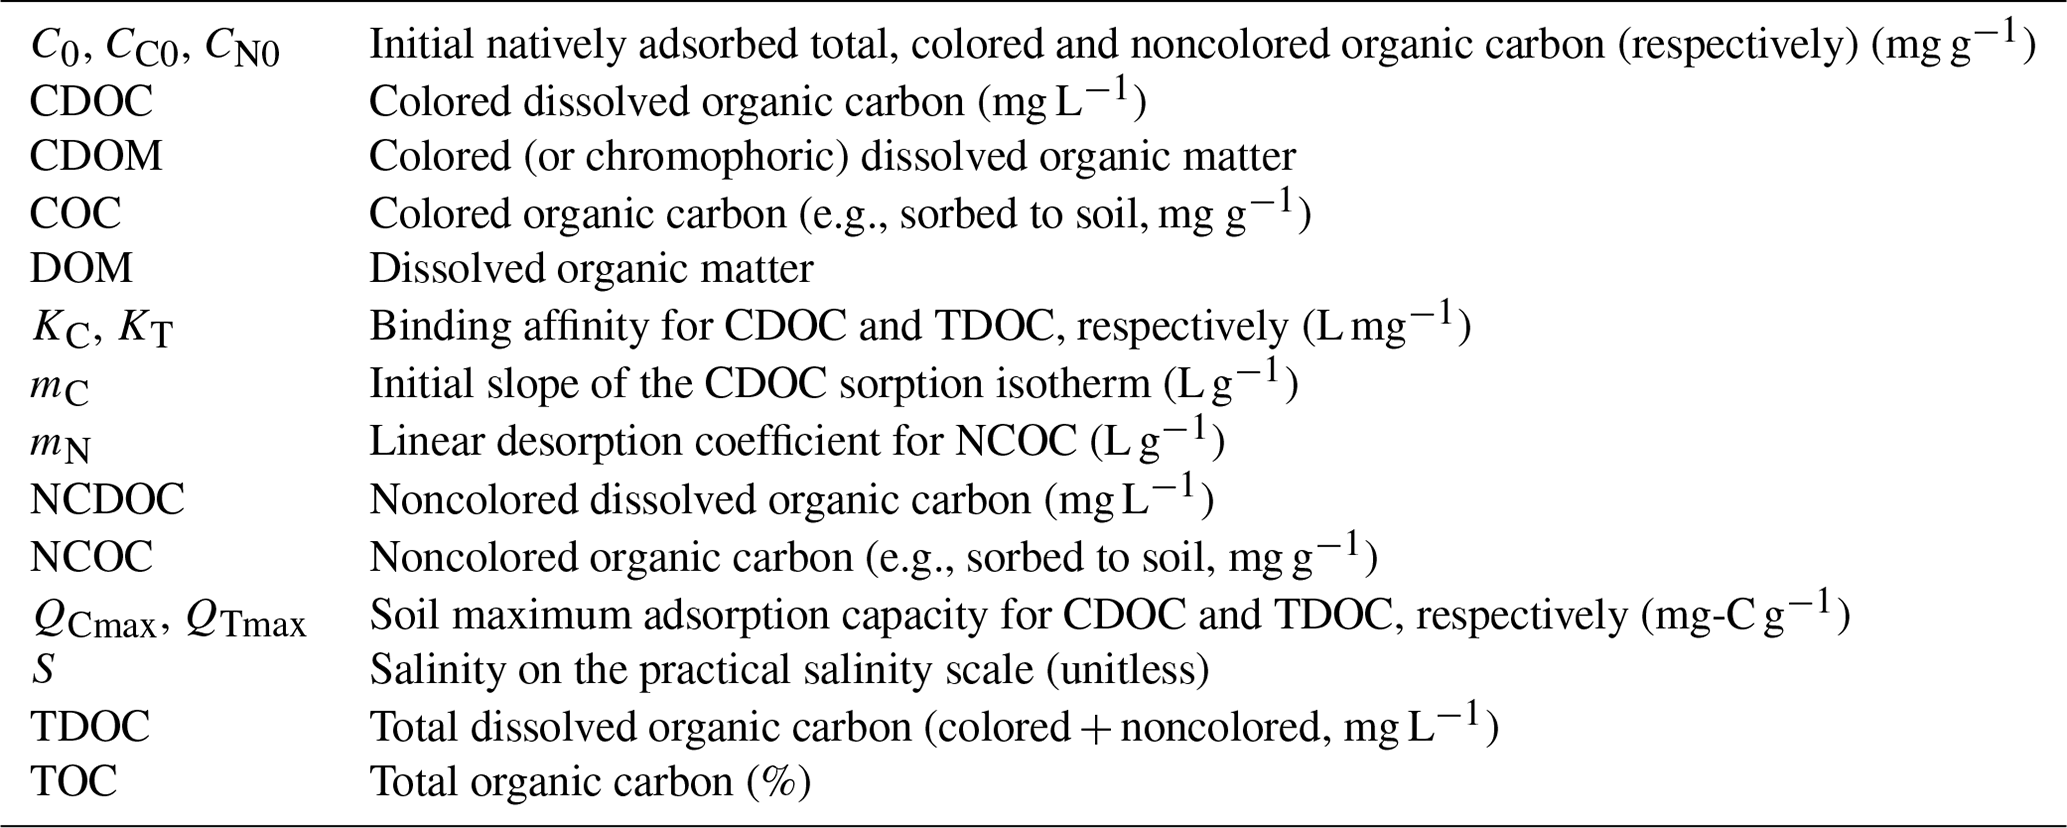
Table B1Tidal marsh surface characteristics and soil characteristics for 0–40 cm depth including standard error. This table is presented as primary data in Pinsonneault et al. (2021), who present full descriptions of sample techniques and measurement methods.
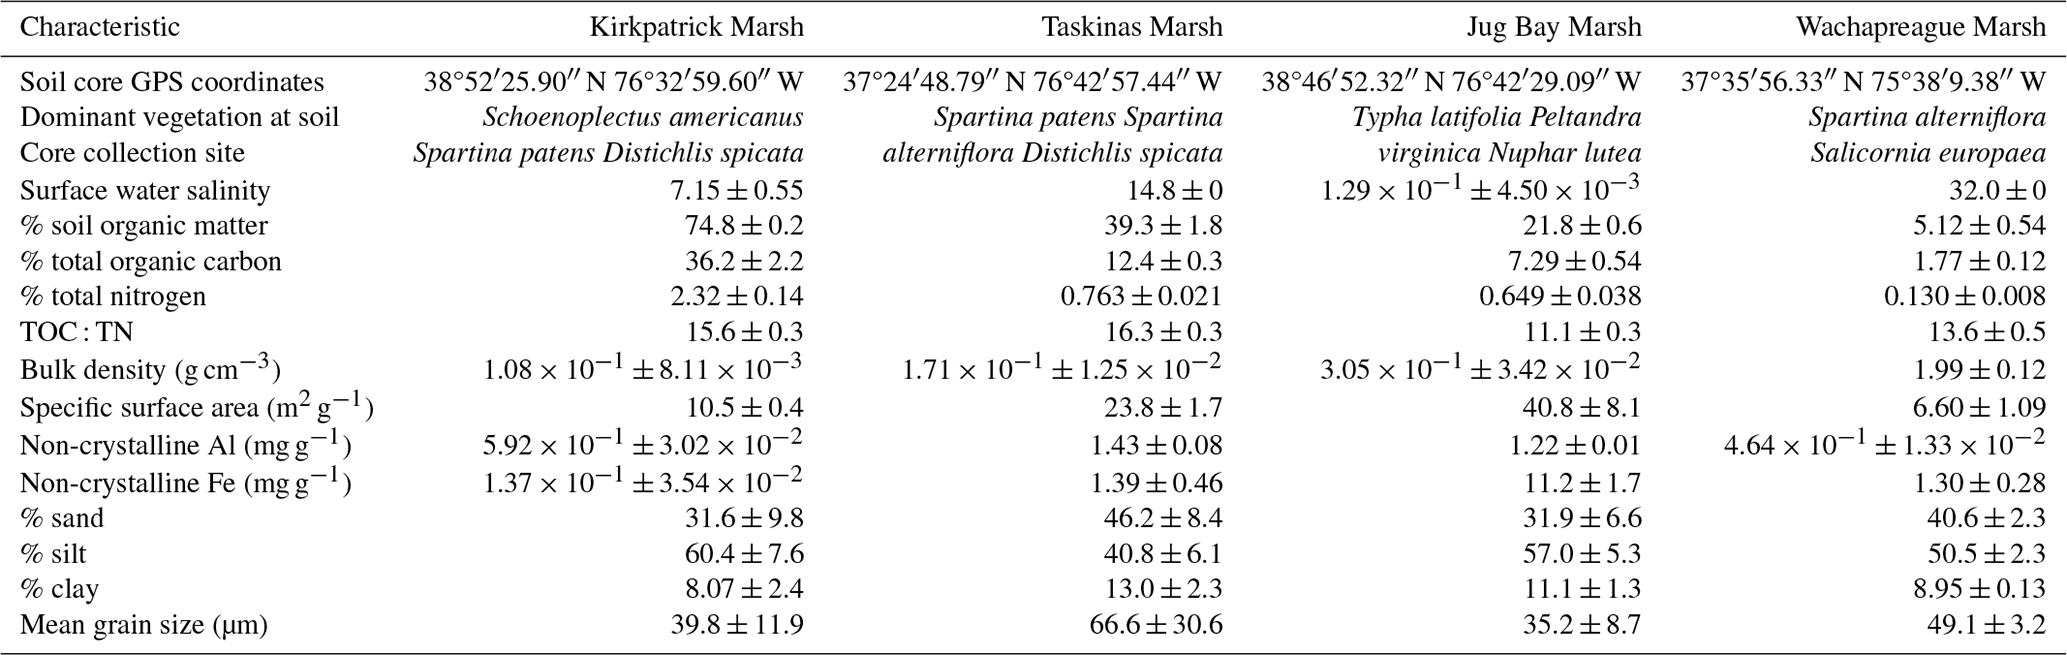
Table B2Mean and standard error of sorption characteristics for total DOC of tidal marsh soils based on fits to the initial mass (IM) Langmuir isotherm by salinity treatment (see Fig. B2). QTmax, C0, KT, and NP refer to the soil maximum sorption capacity, initial exchangeable soil carbon, the DOC binding affinity, and the null point, respectively. Data for the fit were presented in Pinsonneault et al. (2021), where they were fit to the traditional Langmuir isotherm and here were refit to the IM Langmuir isotherm. Values in parentheses were estimated by extrapolation from other salinities; these were not used to estimate NP.
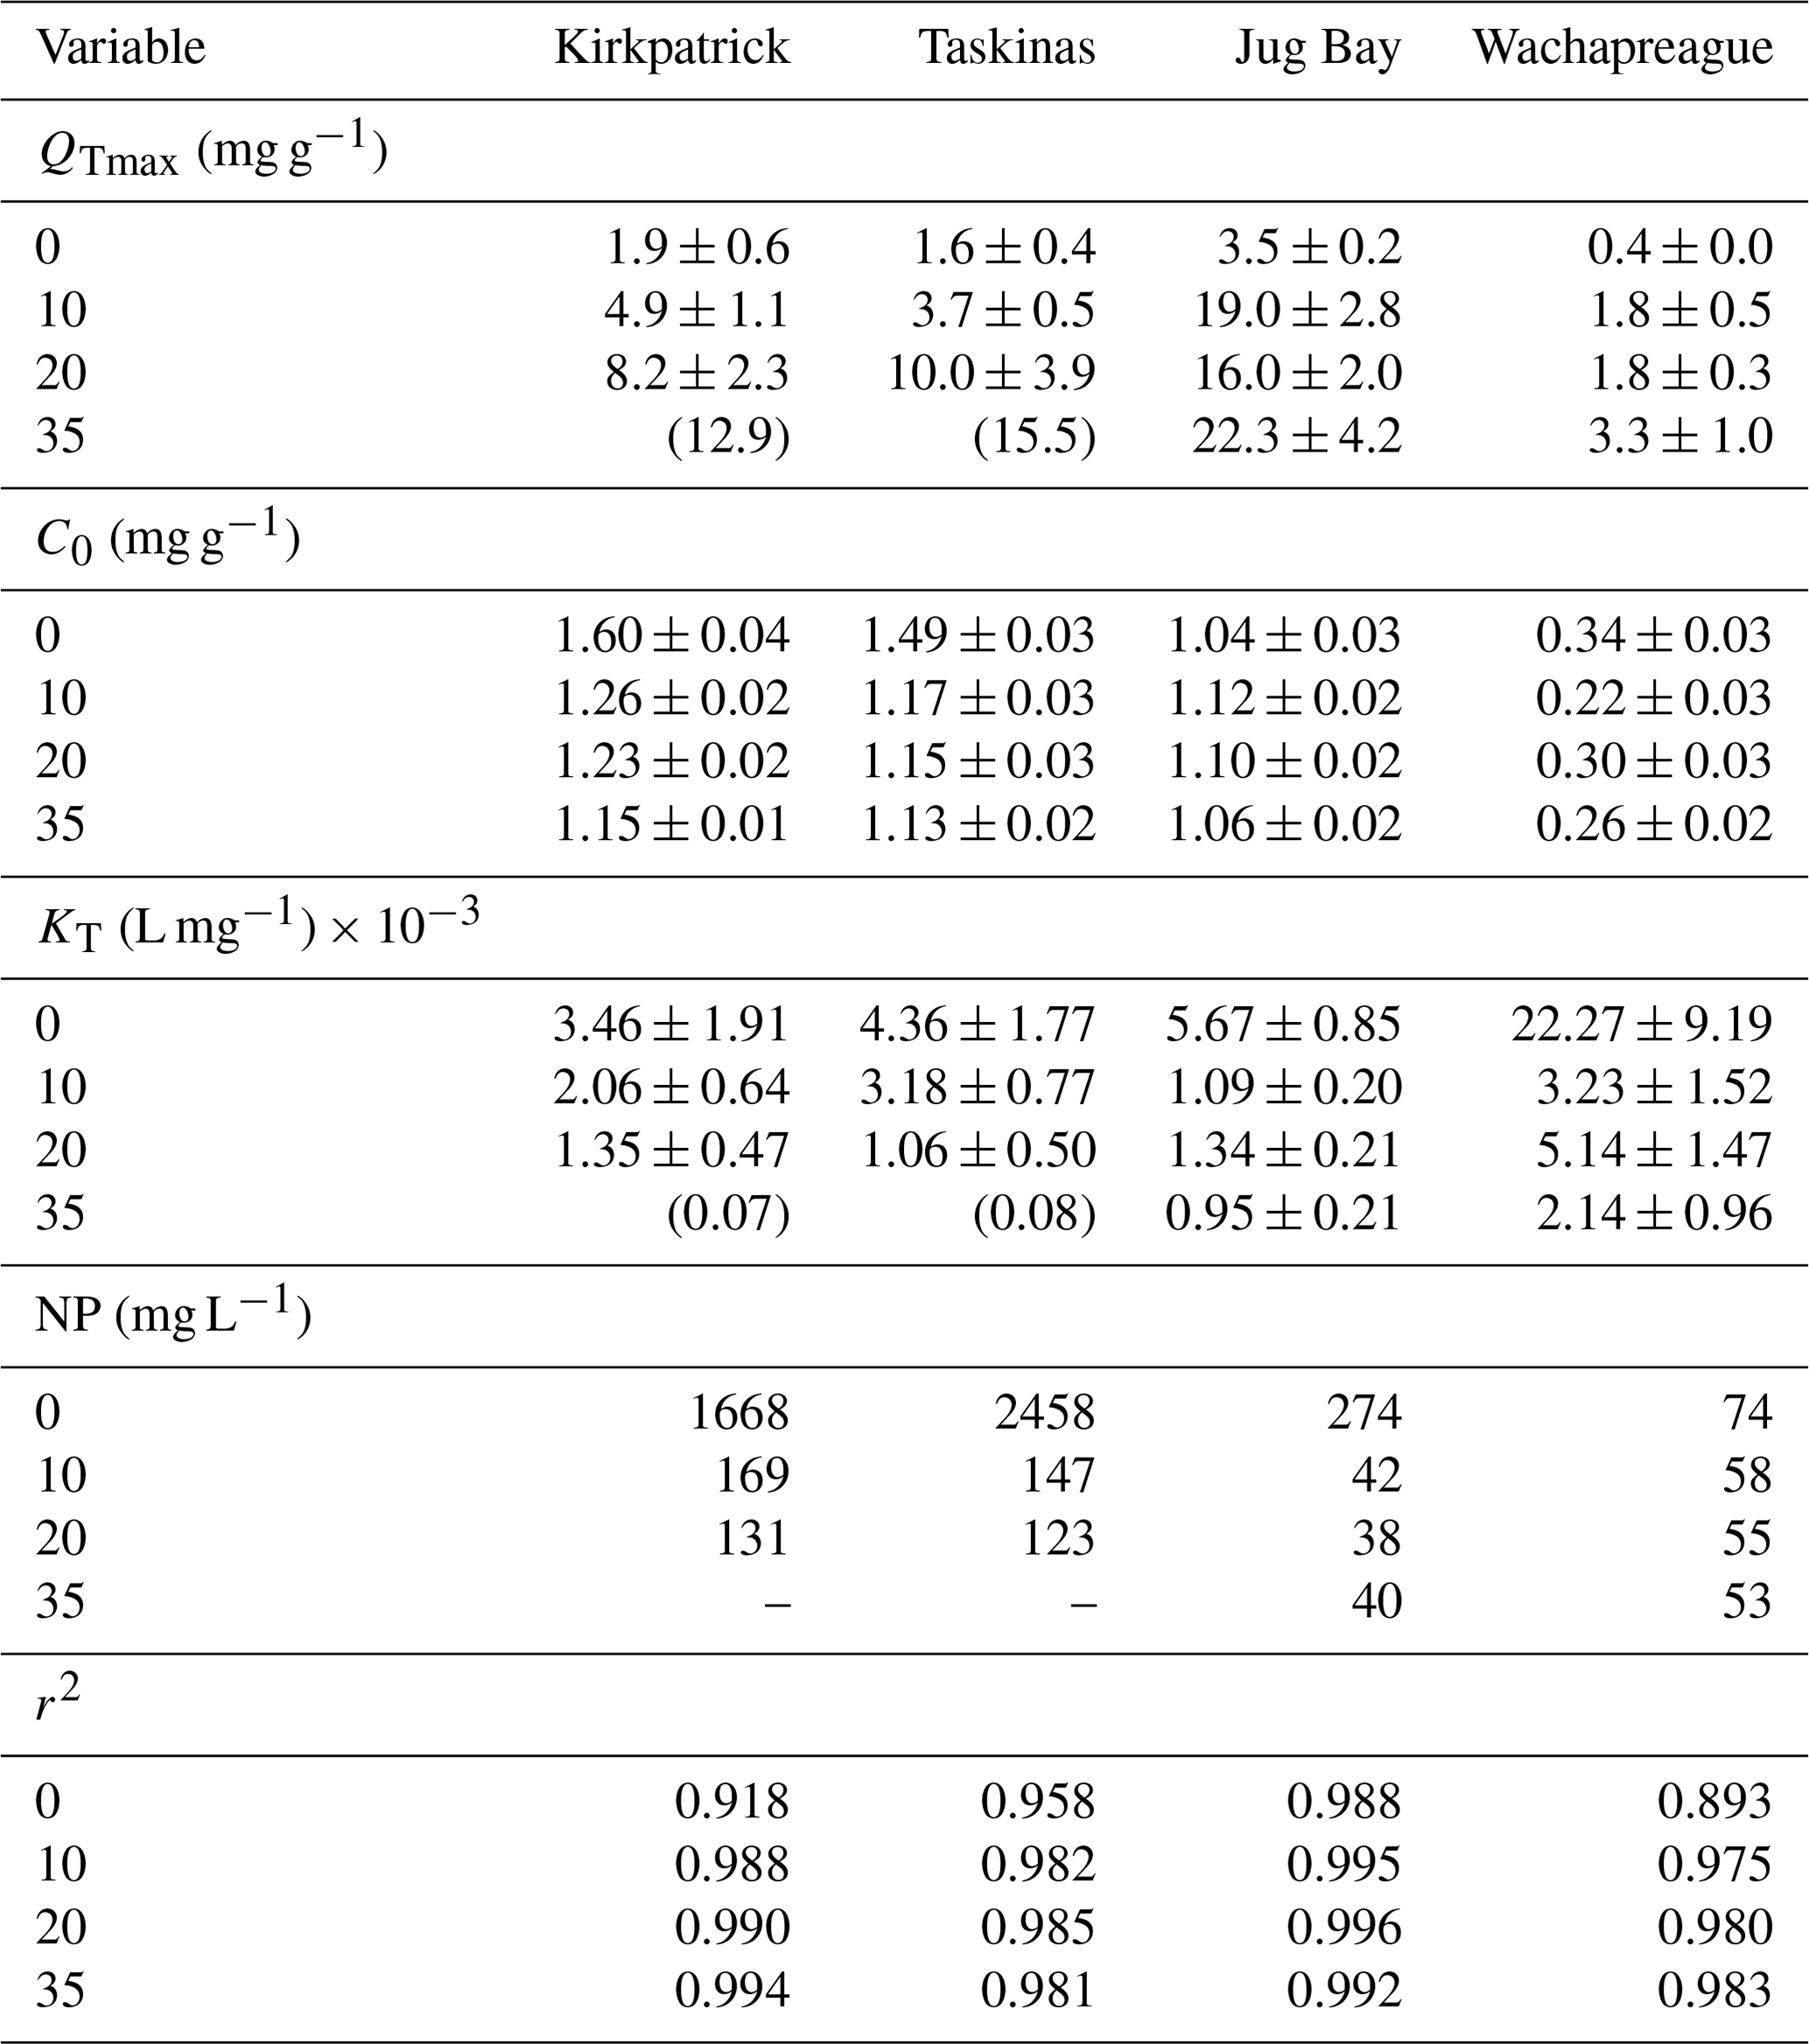
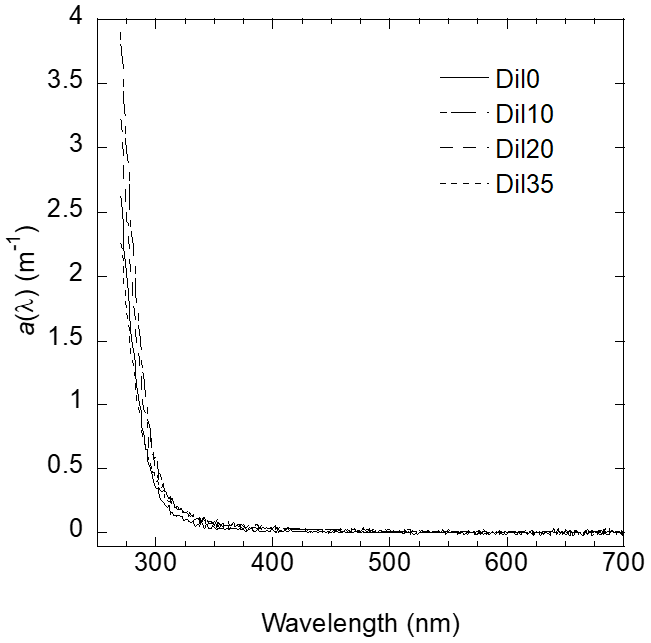
Figure B1Average absorbance spectra (a(λ), m−1) of dilutant used to create different standards from the Great Dismal Swamp concentrate. Line type indicates dilutant for fresh treatment (solid line), 10 (long dashes), 20 (medium-length dashes), and 35 salinity treatments (short dashes).
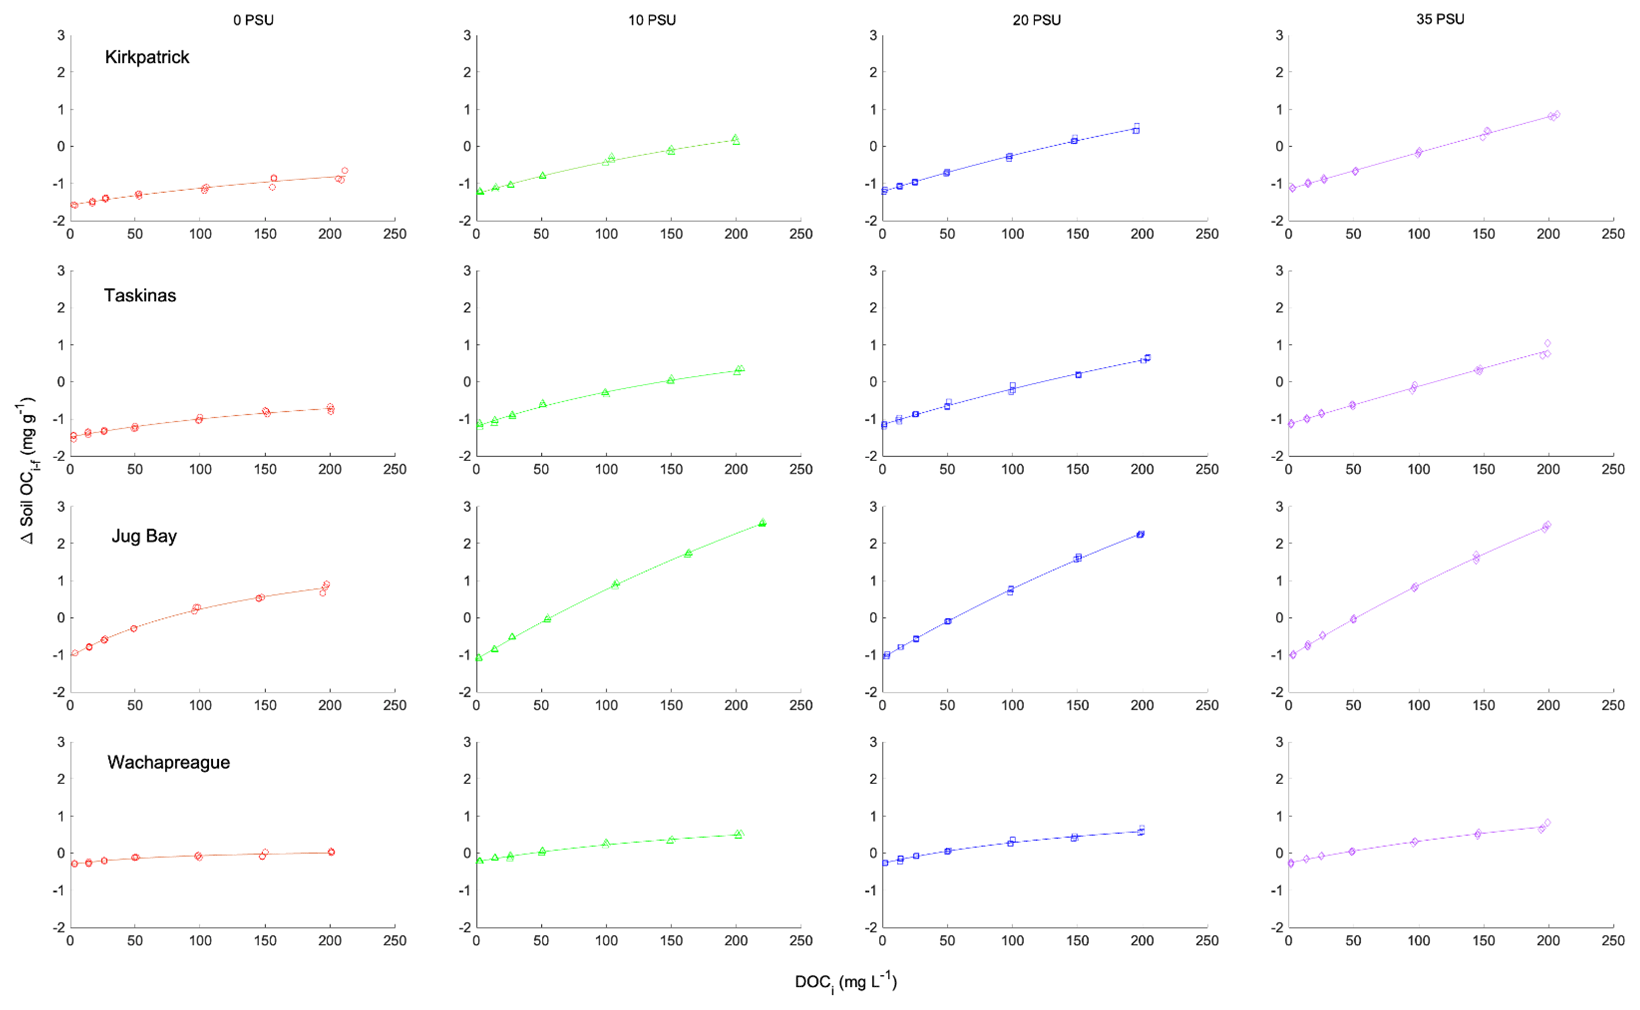
Figure B2Isotherms of adsorption–desorption of TDOC for tidal marsh soils. Net adsorption of organic carbon based on the difference between initial and final concentrations of soil organic carbon (ΔC, mg C g-soil−1) as a function of initial concentration of DOC ([DOC]i, mg L−1) using data from Pinsonneault et al. (2021). Symbols show the results of triplicate incubations, lines the fitted IM isotherm. By rows the plots show (from top to bottom) Kirkpatrick, Taskinas, Jug Bay, and Wachapreague. Red circles, green triangles, blue squares, and purple diamonds reflect 0, 10, 20, and 35 salinity treatments, respectively.
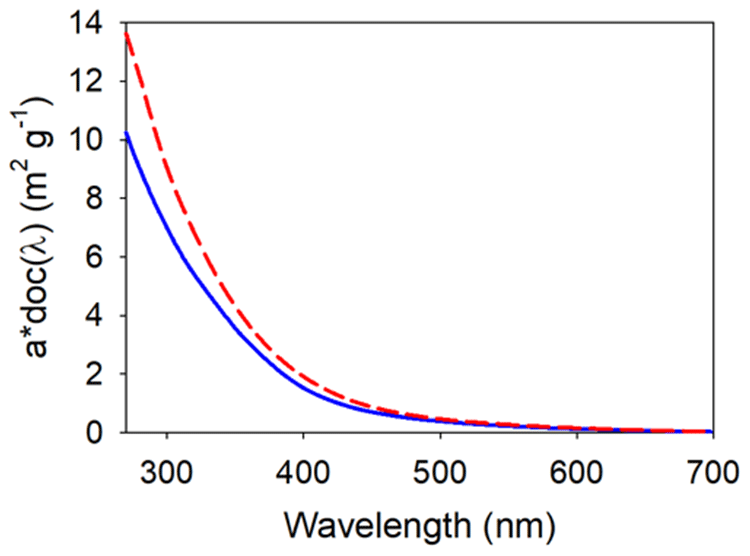
Figure B3Plot of the carbon-specific absorption spectra (a* CDOC(λ), m2 g−1) of Great Dismal Swamp standards (this study, solid blue line) and Kirkpatrick Marsh low tide water (Clark et al., 2019, red dashed line).
All data used for the publication can be downloaded from Zenodo: https://doi.org/10.5281/zenodo.10845926 (Neale et al., 2024).
The supplement related to this article is available online at: https://doi.org/10.5194/bg-21-2599-2024-supplement.
All authors contributed to the study conception and design. PJN and JPM supervised the data collection, and the data analysis was performed by PJN and HM. MT, JPM, PJN, and EAC were responsible for project administration and funding acquisition. PJN led the manuscript writing, and all authors revised drafts and approved the final manuscript.
The contact author has declared that none of the authors has any competing interests.
Publisher’s note: Copernicus Publications remains neutral with regard to jurisdictional claims made in the text, published maps, institutional affiliations, or any other geographical representation in this paper. While Copernicus Publications makes every effort to include appropriate place names, the final responsibility lies with the authors.
We would like to thank the staff of the Jug Bay Wetlands Sanctuary, the York River State Park, the Virginia Institute of Marine Science (VIMS) Eastern Shore Laboratory, and the Great Dismal Swamp National Wildlife Refuge, for their support and assistance. In particular, we are grateful to Amanda Knobloch, Yanhua Feng, and Sean Fate (VIMS), Willy Reay (Chesapeake Bay National Estuarine Research Reserve), Michael Gonsior (University of Maryland Center for Environmental Science, Chesapeake Biological Laboratory), Jade Dominique Walker (University of Maryland University College), Ellen Weber (Wilkes University), and Andrew Peresta and Andrew Pinsonneault (Smithsonian Environmental Research Center) for their assistance in the field and laboratory.
This research has been supported by the National Science Foundation Ecosystem Studies Program (grant nos. DEB-1556556, 1556554), the National Science Foundation Long Term Research in Environmental Biology Program (grant nos. DEB-0950080, 1457100, 1557009, 2051343), and the US Department of Energy Office of Biological and Environmental Research Environmental System Science program through the COMPASS-FME project (grant no. DE-AC05-76RL01830). Support was also provided by the Smithsonian Institution, the Smithsonian Environmental Research Center, the Global Change Research Wetland, and the Virginia Institute of Marine Sciences.
This paper was edited by Ji-Hyung Park and reviewed by two anonymous referees.
Bertilsson, S. and Jones, J. B.: Supply of Dissolved Organic Matter to Aquatic Ecosystems, in: Aquatic Ecosystems: Interactivity of Dissolved Organic Matter, edited by: Findlay, S. E. G. and Sinsabaugh, R. L., Academic Press, San Diego, USA, 3–24, https://doi.org/10.1016/b978-012256371-3/50002-0, 2003.
Bittar, T. B., Berger, S. A., Birsa, L. M., Walters, T. L., Thompson, M. E., Spencer, R. G. M., Mann, E. L., Stubbins, A., Frischer, M. E., and Brandes, J. A.: Seasonal dynamics of dissolved, particulate and microbial components of a tidal saltmarsh-dominated estuary under contrasting levels of freshwater discharge, Estuar. Coast. Shelf Sci., 182, 72–85, https://doi.org/10.1016/j.ecss.2016.08.046, 2016.
Cawley, K. M., Butler, K. D., Aiken, G. R., Larsen, L. G., Huntington, T. G., and McKnight, D. M.: Identifying fluorescent pulp mill effluent in the Gulf of Maine and its watershed, Mar. Pollut. Bull., 64, 1678–1687, https://doi.org/10.1016/j.marpolbul.2012.05.040, 2012.
Chin, Y.-P., Aiken, G., and O'Loughlin, E.: Molecular weight, polydispersity, and spectroscopic properties of aquatic humic substances, Environ. Sci. Technol., 28, 1853–1858, https://doi.org/10.1021/es00060a015, 2002.
Christy, M. and Dickman, C.: Effects of salinity on tadpoles of the green and golden bell frog (Litoria aurea), Amphibia-Reptilia, 23, 1–11, https://doi.org/10.1163/156853802320877582, 2002.
Clark, J. B., Neale, P., Tzortziou, M., Cao, F., and Hood, R. R.: A mechanistic model of photochemical transformation and degradation of colored dissolved organic matter, Mar. Chem., 214, 103666, https://doi.org/10.1016/j.marchem.2019.103666, 2019.
Clark, J. B., Long, W., and Hood, R. R.: A comprehensive estuarine dissolved organic carbon budget using an enhanced biogeochemical model, J. Geophys. Res.-Biogeo., 125, e2019JG005442, https://doi.org/10.1029/2019jg005442, 2020.
Coble, P. G.: Marine optical biogeochemistry: The chemistry of ocean color, Chem. Rev., 107, 402–418, https://doi.org/10.1021/cr050350+, 2007.
Dainard, P. G., Guéguen, C., McDonald, N., and Williams, W. J.: Photobleaching of fluorescent dissolved organic matter in Beaufort Sea and North Atlantic Subtropical Gyre, Mar. Chem., 177, 630–637, https://doi.org/10.1016/j.marchem.2015.10.004, 2015.
D'Andrilli, J., Foreman, C. M., Sigl, M., Priscu, J. C., and McConnell, J. R.: A 21 000-year record of fluorescent organic matter markers in the WAIS Divide ice core, Clim. Past, 13, 533–544, https://doi.org/10.5194/cp-13-533-2017, 2017.
Eagle, M. J., Kroeger, K. D., Spivak, A. C., Wang, F., Tang, J., Abdul-Aziz, O. I., Ishtiaq, K. S., O'Keefe Suttles, J., and Mann, A. G.: Soil carbon consequences of historic hydrologic impairment and recent restoration in coastal wetlands, Sci. Total Environ., 848, 157682, https://doi.org/10.1016/j.scitotenv.2022.157682, 2022.
Fichot, C. G. and Benner, R.: The spectral slope coefficient of chromophoric dissolved organic matter (S275−295) as a tracer of terrigenous dissolved organic carbon in river‐influenced ocean margins, Limnol. Oceanogr., 57, 1453–1466, https://doi.org/10.4319/lo.2012.57.5.1453, 2012.
Gao, Y., Yan, M., and Korshin, G. V.: Effects of ionic strength on the chromophores of dissolved organic matter, Environ. Sci. Technol., 49, 5905–5912, https://doi.org/10.1021/acs.est.5b00601, 2015.
Grybos, M., Davranche, M., Gruau, G., Petitjean, P., and Pédrot, M.: Increasing pH drives organic matter solubilization from wetland soils under reducing conditions, Geoderma, 154, 13–19, https://doi.org/10.1016/j.geoderma.2009.09.001, 2009.
Hansen, A. M., Kraus, T. E. C., Pellerin, B. A., Fleck, J. A., Downing, B. D., and Bergamaschi, B. A.: Optical properties of dissolved organic matter (DOM): Effects of biological and photolytic degradation, Limnol. Oceanogr., 61, 1015–1032, https://doi.org/10.1002/lno.10270, 2016.
Hargreaves, B. R.: Water column optics and penetration of UVR, in: UV effects in aquatic organisms and ecosystems, edited by: Helbling, E. W. and Zagarese, H. E., Comprehensive Series in Photochemistry and Photobiology, Royal Society of Chemistry, Cambridge, UK, 59–105, https://doi.org/10.1039/9781847552266, 2003.
Helms, J. R., Stubbins, A., Ritchie, J. D., Minor, E. C., Kieber, D. J., and Mopper, K.: Absorption spectral slopes and slope ratios as indicators of molecular weight, source, and photobleaching of chromophoric dissolved organic matter, Limnol. Oceanogr., 53, 955–969, 2008.
Jørgensen, L., Stedmon, C. A., Kragh, T., Markager, S., Middelboe, M., and Søndergaard, M.: Global trends in the fluorescence characteristics and distribution of marine dissolved organic matter, Mar. Chem., 126, 139–148, https://doi.org/10.1016/j.marchem.2011.05.002, 2011.
Knobloch, A. L. J., Neale, P. J., Tzortziou, M., and Canuel, E. A.: Seasonal and tidal controls of the quantity and quality of dissolved organic matter at the marsh creek-estuarine interface, Estuar. Coast. Shelf Sci., 278, 108124, https://doi.org/10.1016/j.ecss.2022.108124, 2022.
Kothawala, D. N., Moore, T. R., and Hendershot, W. H.: Adsorption of dissolved organic carbon to mineral soils: A comparison of four isotherm approaches, Geoderma, 148, 43–50, https://doi.org/10.1016/j.geoderma.2008.09.004, 2008.
Kothawala, D. N., Roehm, C., Blodau, C., and Moore, T. R.: Selective adsorption of dissolved organic matter to mineral soils, Geoderma, 189/190, 334–342, https://doi.org/10.1016/j.geoderma.2012.07.001, 2012.
Kothawala, D. N., Stedmon, C. A., Müller, R. A., Weyhenmeyer, G. A., Köhler, S. J., and Tranvik, L. J.: Controls of dissolved organic matter quality: Evidence from a large-scale boreal lake survey, Glob. Change Biol., 20, 1101–1114, https://doi.org/10.1111/gcb.12488, 2014.
Kroeger, K. D., Crooks, S., Moseman-Valtierra, S., and Tang, J.: Restoring tides to reduce methane emissions in impounded wetlands: A new and potent Blue Carbon climate change intervention, Sci. Rep., 7, 11914, https://doi.org/10.1038/s41598-017-12138-4, 2017.
Lalonde, K., Mucci, A., Ouellet, A., and Gélinas, Y.: Preservation of organic matter in sediments promoted by iron, Nature, 483, 198–200, https://doi.org/10.1038/nature10855, 2012.
Lambert, T., Bouillon, S., Darchambeau, F., Massicotte, P., and Borges, A. V.: Shift in the chemical composition of dissolved organic matter in the Congo River network, Biogeosciences, 13, 5405–5420, https://doi.org/10.5194/bg-13-5405-2016, 2016.
Lapierre, J.-F. and del Giorgio, P. A.: Partial coupling and differential regulation of biologically and photochemically labile dissolved organic carbon across boreal aquatic networks, Biogeosciences, 11, 5969–5985, https://doi.org/10.5194/bg-11-5969-2014, 2014.
Levy, G. J., Lordian, A., Goldstein, D., and Borisover, M.: Soil structural indices' dependence on irrigation water quality and their association with chromophoric components in dissolved organic matter, Eur. J. Soil Sci., 65, 197–205, https://doi.org/10.1111/ejss.12116, 2014.
Li, F. and Pennings, S. C.: Response and recovery of low-salinity marsh plant communities to presses and pulses of elevated salinity, Estuar. Coast., 42, 708–718, https://doi.org/10.1007/s12237-018-00490-1, 2018.
Liu, X., Zhang, Y., Shi, K., Zhu, G., Xu, H., and Zhu, M.: Absorption and fluorescence properties of chromophoric dissolved organic matter: implications for the monitoring of water quality in a large subtropical reservoir, Environ. Sci. Pollut. Res., 21, 14078–14090, https://doi.org/10.1007/s11356-014-3319-4, 2014.
Logozzo, L., Tzortziou, M., Neale, P. J., and Clark, B.: Photochemical and microbial degradation of chromophoric dissolved organic matter exported from tidal marshes, J. Geophys. Res.-Biogeo., 126, e2020JG005744, https://doi.org/10.1029/2020JG005744, 2020.
Logozzo, L. A., Martin, J. W., McArthur, J., and Raymond, P. A.: Contributions of Fe(III) to UV–Vis absorbance in river water: A case study on the Connecticut River and argument for the systematic tandem measurement of Fe(III) and CDOM, Biogeochemistry, 160, 17–33, https://doi.org/10.1007/s10533-022-00937-5, 2022.
Maie, N., Jaffé, R., Miyoshi, T., and Childers, D. L.: Quantitative and qualitative aspects of dissolved organic carbon leached from senescent plants in an oligotrophic wetland, Biogeochemistry, 78, 285–314, https://doi.org/10.1007/s10533-005-4329-6, 2006.
McKnight, D. M., Bencala, K. E., Zellweger, G. W., Aiken, G. R., Feder, G. L., and Thorn, K. A.: Sorption of dissolved organic carbon by hydrous aluminum and iron oxides occurring at the confluence of Deer Creek with the Snake River, Summit County, Colorado, Environ. Sci. Technol., 26, 1388–1396, https://doi.org/10.1021/es00031a017, 2002.
Menendez, A., Tzortziou, M., Neale, P., Megonigal, P., Powers, L., Schmitt-Kopplin, P., and Gonsior, M.: Strong dynamics in tidal marsh DOC export in response to natural cycles and episodic events from continuous monitoring, J. Geophys. Res.-Biogeo., 127, e2022JG006863, https://doi.org/10.1029/2022jg006863, 2022.
Murphy, K. R., Stedmon, C. A., Waite, T. D., and Ruiz, G. M.: Distinguishing between terrestrial and autochthonous organic matter sources in marine environments using fluorescence spectroscopy, Mar. Chem., 108, 40–58, https://doi.org/10.1016/j.marchem.2007.10.003, 2008.
Murphy, K. R., Butler, K. D., Spencer, R. G. M., Stedmon, C. A., Boehme, J. R., and Aiken, G. R.: Measurement of dissolved organic matter fluorescence in aquatic environments: An interlaboratory comparison, Environ. Sci. Technol., 44, 9405–9412, https://doi.org/10.1021/es102362t, 2010.
Murphy, K. R., Stedmon, C. A., Graeber, D., and Bro, R.: Fluorescence spectroscopy and multi-way techniques. PARAFAC, Anal. Method., 5, https://doi.org/10.1039/c3ay41160e, 2013.
Murphy, K. R., Stedmon, C. A., Wenig, P., and Bro, R.: OpenFluor – an online spectral library of auto-fluorescence by organic compounds in the environment, Anal. Method., 6, 658–661, https://doi.org/10.1039/c3ay41935e, 2014.
Neale, P., Megonigal, J. P., Tzortziou, M., Canuel, E. A., Pondell, C. R., and Morrissette, H.: Sorption of Colored vs Noncolored Organic Matter by Tidal Marsh Soils (1.0) Zenodo [data set], https://doi.org/10.5281/zenodo.10845927, 2024.
Niu, C., Zhang, Y., Zhou, Y., Shi, K., Liu, X., and Qin, B.: The potential applications of real-time monitoring of water quality in a large shallow lake (Lake Taihu, China) using a chromophoric dissolved organic matter fluorescence sensor, Sensors, 14, 11580–11594, https://doi.org/10.3390/s140711580, 2014.
Painter, S. C., Lapworth, D. J., Woodward, E. M. S., Kroeger, S., Evans, C. D., Mayor, D. J., and Sanders, R. J.: Terrestrial dissolved organic matter distribution in the North Sea, Sci. Total Environ., 630, 630–647, https://doi.org/10.1016/j.scitotenv.2018.02.237, 2018.
Pinsonneault, A. J., Moore, T. R., Roulet, N. T., and Lapierre, J.-F.: Biodegradability of vegetation-derived dissolved organic carbon in a cool temperate ombrotrophic bog, Ecosystems, 19, 1023–1036, https://doi.org/10.1007/s10021-016-9984-z, 2016.
Pinsonneault, A. J., Neale, P. J., Tzortziou, M., Canuel, E. A., Pondell, C. R., Morrissette, H., Lefcheck, J. S., and Megonigal, J. P.: Dissolved organic carbon sorption dynamics in tidal marsh soils, Limnol. Oceanogr., 66, 214–225, https://doi.org/10.1002/lno.11598, 2021.
Pondell, C. R. and Canuel, E. A.: Composition of organic matter in soils from tidal marshes around the Chesapeake Bay, USA, as revealed by lipid biomarkers and stable carbon and nitrogen isotopes, Estuar. Coast. Shelf Sci., 277, 108068, https://doi.org/10.1016/j.ecss.2022.108068, 2022.
Poulin, B. A., Ryan, J. N., and Aiken, G. R.: Effects of iron on optical properties of dissolved organic matter, Environ. Sci. Technol., 48, 10098–10106, https://doi.org/10.1021/es502670r, 2014.
Qualls, R. G.: Comparison of the behavior of soluble organic and inorganic nutrients in forest soils, Forest Ecol. Manag., 138, 29–50, https://doi.org/10.1016/s0378-1127(00)00410-2, 2000.
Riedel, T., Zak, D., Biester, H., and Dittmar, T.: Iron traps terrestrially derived dissolved organic matter at redox interfaces, P. Natl. Acad. Sci. USA, 110, 10101–10105, https://doi.org/10.1073/pnas.1221487110, 2013.
Seitzinger, S. P., Gardner, W. S., and Spratt, A. K.: The effect of salinity on ammonium sorption in aquatic sediments: Implications for benthic nutrient recycling, Estuaries, 14, 167–174, https://doi.org/10.2307/1351690, 1991.
Shelton, S., Neale, P., Pinsonneault, A. J., and Tzortziou, M.: Biodegradation and Photodegradation of Vegetation-Derived Dissolved Organic Matter in Tidal Marsh Ecosystems, Estuar. Coast., 36, 559–574, https://doi.org/10.1007/s12237-021-00982-7, 2021.
Smith, S. J., Thomson, A. M., Rosenberg, N. J., Izaurralde, R. C., Brown, R. A., and Wigley, T. M. L.: Climate Change Impacts for the Conterminous USA: An Integrated Assessment, Climatic Change, 69, 7–25, https://doi.org/10.1007/s10584-005-3614-7, 2005.
Spivak, A. C., Sanderman, J., Bowen, J. L., Canuel, E. A., and Hopkinson, C. S.: Global-change controls on soil-carbon accumulation and loss in coastal vegetated ecosystems, Nat. Geosci., 12, 685–692, https://doi.org/10.1038/s41561-019-0435-2, 2019.
Stedmon, C. A. and Markager, S.: Resolving the variability in dissolved organic matter fluorescence in a temperate estuary and its catchment using PARAFAC analysis, Limnol. Oceanogr., 50, 686–697, https://doi.org/10.4319/lo.2005.50.2.0686, 2005.
Stumm, W. and Morgan, J. J.: Aquatic Chemistry: Chemical Equilibria and Rates in Natural Waters, 3rd Edn., Wiley, ISBN 978-0-471-51185-4, 2012.
Tzortziou, M., Neale, P. J., Osburn, C. L., Megonigal, J. P., Maie, N., and Jaffe, R.: Tidal marshes as a source of optically and chemically distinctive colored dissolved organic matter in the Chesapeake Bay, Limnol. Oceanogr., 53, 148–159, 2008.
Tzortziou, M., Neale, P., Megonigal, J., Pow, C., and Butterworth, M.: Spatial gradients in dissolved carbon due to tidal marsh outwelling into a Chesapeake Bay estuary, Mar. Ecol. Prog. Ser., 426, 41–56, https://doi.org/10.3354/meps09017, 2011.
U.S. Fish and Wildlife Service: Great Dismal Swamp and Nansemond NWRs Comprehensive Conservation Plan, https://www.fws.gov/media/ (last access:7 May 2024), 2006.
Vahatalo, A. V., Wetzel, R. G., and Paerl, H. W.: Light absorption by phytoplankton and chromophoric dissolved organic matter in the drainage basin and estuary of the Neuse River, North Carolina (USA), Freshwater Biol., 50, 477–493, https://doi.org/10.1111/j.1365-2427.2004.01335.x, 2005.
Walker, S. A., Amon, R. M. W., Stedmon, C., Duan, S., and Louchouarn, P.: The use of PARAFAC modeling to trace terrestrial dissolved organic matter and fingerprint water masses in coastal Canadian Arctic surface waters, J. Geophys. Res., 114, G00F06, https://doi.org/10.1029/2009jg000990, 2009.
Wang, F., Kroeger, K. D., Gonneea, M. E., Pohlman, J. W., and Tang, J.: Water salinity and inundation control soil carbon decomposition during salt marsh restoration: An incubation experiment, Ecol. Evol., 9, 1911–1921, https://doi.org/10.1002/ece3.4884, 2019.
Ward, N. D., Megonigal, J. P., Bond-Lamberty, B., Bailey, V. L., Butman, D., Canuel, E. A., Diefenderfer, H., Ganju, N. K., Goñi, M. A., Graham, E. B., Hopkinson, C. S., Khangaonkar, T., Langley, J. A., McDowell, N. G., Myers-Pigg, A. N., Neumann, R. B., Osburn, C. L., Price, R. M., Rowland, J., Sengupta, A., Simard, M., Thornton, P. E., Tzortziou, M., Vargas, R., Weisenhorn, P. B., and Windham-Myers, L.: Representing the function and sensitivity of coastal interfaces in Earth system models, Nat. Commun., 11, 2458, https://doi.org/10.1038/s41467-020-16236-2, 2020.
Wei, J., Zhang, F., Ma, D., Zhang, J., Zheng, Y., Dong, H., Liang, X., Yin, G., Han, P., Liu, M., and Hou, L.: Microbial necromass carbon in estuarine tidal wetlands of China: Influencing factors and environmental implication, Sci. Total Environ., 876, 162566, https://doi.org/10.1016/j.scitotenv.2023.162566, 2023.
Wigley, T. M. L.: The Climate Change Commitment, Science, 307, 1766–1769, https://doi.org/10.1126/science.1103934, 2005.
Wu, F. Y., Chung, A. K. C., Tam, N. F. Y., and Wong, M. H.: Root exudates of wetland plants influenced by nutrient status and types of plant cultivation, Int. J. Phytoremed., 14, 543–553, https://doi.org/10.1080/15226514.2011.604691, 2012.
Yamashita, Y., Maie, N., Briceño, H., and Jaffé, R.: Optical characterization of dissolved organic matter in tropical rivers of the Guayana Shield, Venezuela, J. Geophys. Res., 115, G00F10, https://doi.org/10.1029/2009jg000987, 2010.
Yamashita, Y., Kloeppel, B. D., Knoepp, J., Zausen, G. L., and Jaffé, R.: Effects of watershed history on dissolved organic matter characteristics in headwater streams, Ecosystems, 14, 1110–1122, https://doi.org/10.1007/s10021-011-9469-z, 2011.
Yamashita, Y., Boyer, J. N., and Jaffé, R.: Evaluating the distribution of terrestrial dissolved organic matter in a complex coastal ecosystem using fluorescence spectroscopy, Cont. Shelf Res., 66, 136–144, https://doi.org/10.1016/j.csr.2013.06.010, 2013.
Zhou, Q., Maurice, P. A., and Cabaniss, S. E.: Size fractionation upon adsorption of fulvic acid on goethite: equilibrium and kinetic studies, Geochim. Cosmochim. Ac., 65, 803–812, https://doi.org/10.1016/s0016-7037(00)00536-6, 2001.