the Creative Commons Attribution 4.0 License.
the Creative Commons Attribution 4.0 License.
 | 13 Jun 2024
Modelling CO2 and N2O emissions from soils in silvopastoral systems of the West African Sahelian band
Yélognissè Agbohessou
Claire Delon
Manuela Grippa
Eric Mougin
Daouda Ngom
Espoir Koudjo Gaglo
Ousmane Ndiaye
Paulo Salgado
Olivier Roupsard
Silvopastoral systems (SPSs) have been shown to improve ecosystem resilience and provide sustainable land management solutions in the Sahel. However, accurately estimating the contribution of Sahelian ecosystems to the overall greenhouse gas (GHG) balance is a challenge, in particular regarding the magnitude of carbon dioxide (CO2) and nitrous oxide (N2O) emissions from soils. In this work, we spatialized and applied the process-based model Sahelian Transpiration Evaporation and Productivity – GENeral model of litter DEComposition – N2O (STEP–GENDEC-N2O) to investigate the magnitude and spatial and temporal patterns of herbaceous mass, as well as CO2 and N2O emissions from soil (not net emissions) in Sahelian SPSs. Our results show that over the last decade (2012–2022), there was a heterogeneous spatial distribution of herbaceous mass production and of soil CO2 and N2O emissions in Sahelian SPSs. Spatial variations in soil CO2 emissions are primarily controlled by soil carbon content, temperature, herbaceous mass, and animal load, while soil nitrogen content, soil water content, and animal load are the main factors driving the spatial variations in N2O emissions from soil. The estimated CO2 and N2O emissions from soil in Sahelian SPSs over the 2012–2022 period were equal to 58.79 ± 4.83 Tg CO2-C yr−1 (1 Tg = 1012 g) and 21.59 ± 3.91 Gg N2O-N yr−1 (1 Gg = 109 g), respectively. These values are generally lower than estimates reported in the literature for tropical areas and croplands. Furthermore, our simulations indicated a significant annual rising trend of soil CO2 and N2O emissions between 2012 and 2020 as herbaceous mass increased, making more C and N available for the nitrification, denitrification, and decomposition processes. By mapping soil CO2 and N2O emissions, we provide crucial insights into the localization of emission hotspots in Sahelian SPSs, thereby offering valuable information that can be used to devise and implement effective strategies aimed at fostering carbon sequestration in the Sahel.
- Article
(13114 KB) - Full-text XML
- BibTeX
- EndNote


Carbon dioxide (CO2) and nitrous oxide (N2O) are two important greenhouse gases (GHG) that contribute significantly (> 90 %) to anthropogenic climate warming (Hansen et al., 2000). With 298 times the warming potential of CO2 over 100 years (Myhre et al., 2013), N2O is also a stratospheric ozone-depleting substance (Ravishankara et al., 2009). Atmospheric concentrations of CO2 and N2O have experienced significant increases since the late 1700s (Bloch-Johnson et al., 2021; Prinn et al., 2018). This surge is primarily attributed to emissions originating from terrestrial soils (Butterbach-Bahl et al., 2013; Chevallier et al., 2015; Tian et al., 2020) during the period from 1700 to 1980 (Kammen and Marino, 1993). However, post-1990, the major contributors to greenhouse gas emissions on a global scale shifted to the energy systems and industrial sectors (Parmesan et al., 2022). CO2 emissions from soil are due to organic matter decomposition (Robertson and Paul, 2000), while N2O is produced in soils through nitrification (i.e. oxidation of ammonium to nitrate) and denitrification (i.e. the reduction of nitrate to molecular N; Davidson and Verchot, 2000). These processes are regulated by a range of environmental factors (Aulakh et al., 1991; Bajracharya et al., 2000; Reth et al., 2005), making it difficult to scale up soil CO2 and N2O emissions from local sites to the regional and global scale.
Nevertheless, in the last decade, several works provided estimates of CO2 and N2O emissions from terrestrial soils at a large scale (Dangal et al., 2020; Leahy, 2004; Tian et al., 2015, 2016, 2018, 2019, 2020). However, regions such as Africa, and especially sectors such as West African Sahelian livestock production systems, have not received much attention. Our knowledge of the magnitude and the spatiotemporal distribution of soil CO2 and N2O emissions in these systems is limited and subject to large uncertainties (Assouma et al., 2017). This is mainly due to a lack of experimental and modelling studies focused on the region.
Silvopastoral systems (SPSs) are one of the most common livestock production systems in the West African Sahel (Le Houerou, 1987; Herrero et al., 2013a, b; Turner et al., 2014). They are composed of a mix of trees and herbaceous cover grazed by livestock. As an attractive nature-based climate solution, SPSs offer long-term climate benefits thanks to the presence of trees that have the potential to sequester carbon and offset GHG emissions (Agbohessou et al., 2023a; Torres et al., 2017). On the other hand, it has been reported that the livestock component of SPSs has an impact on the nitrogen (N) and carbon (C) cycles and therefore on GHG emissions (Butterbach-Bahl et al., 2020). Indeed, livestock affect substrate availability in soil through N input from their excreta, thus impacting CO2 and N2O emissions (Butterbach-Bahl et al., 2020; Dangal et al., 2020). It has been also reported that direct agricultural N2O emissions from Africa mainly arise from livestock manure deposited in pastures and rangelands (Xu et al., 2019). Livestock movements result in heterogeneous spatial and temporal distributions of excreta, which increases spatial heterogeneity in soil properties and available nutrients, promoting microbiological processes driving soil CO2 and N2O emissions (Assouma et al., 2017; Smith et al., 2003). Actually, rangeland soils, combined with livestock productions, were reported to be responsible for a large share of GHG emissions (Assouma et al., 2017; Soussana et al., 2010; Valentini et al., 2014). The importance of rangelands in the global CO2 and N2O cycles and their potential for increasing atmospheric CO2 and N2O levels have been highlighted in a number of studies (Chang et al., 2015; Dangal et al., 2020; Leahy, 2004). Accordingly, to better understand the magnitude of GHG emissions in these systems and to develop effective and spatially targeted climate solutions, it is important to identify CO2 and N2O emission hotspots and accurately estimate emissions from Sahelian SPSs.
The different bottom-up approaches used to estimate large-scale soil CO2 and N2O emissions include the use of emission factors (EFs) as proposed by the Intergovernmental Panel on Climate Change (IPCC; Hergoualc'h et al., 2019; IPCC, 2006), statistical extrapolation of field measurements, and process-based models (Bigaignon et al., 2020; Delon et al., 2019; Li et al., 2000; Parton et al., 2001). Aside from this, the top-down approaches integrate atmospheric measurements and atmospheric inversion models (Saikawa et al., 2014). Each method has its uncertainties and limitations, resulting in significant divergences in results across studies (Tian et al., 2019), especially in underrepresented regions like West Africa (Tian et al., 2020). The IPCC defined N2O emission as 1 % of the applied N in the Tier 1 level (IPCC, 2006). This assumption of constant EFs can neither depict spatial variations in N2O emissions nor reflect the impacts of changing environments over time (Davidson and Kanter, 2014). Statistical extrapolation can also fail to depict the spatial heterogeneity in emissions, especially when the spatial variability in the parameters exceeds the prevailing conditions during the calibration step (Tian et al., 2019). On the other hand, the process-based model simulation approach has the advantage of describing the overall C and N cycle within the terrestrial systems and can integrate various driving factors controlling soil CO2 and N2O production and emissions (Tian et al., 2019). This approach involves the use of extensive data, such as meteorological, soil, and ecosystem management data. However, estimating the model parameters can be challenging as there is a scarcity of experimental studies that contain comprehensive details on local and regional pedoclimatic conditions and agricultural practices in West Africa. Additionally, reliable and accurate large-spatial-scale input datasets for the models are often lacking, not only in under-represented areas but also in well-documented regions such as Europe (Ballabio et al., 2016).
In this study, we selected the Sahelian Transpiration Evaporation and Productivity – GENeral model of litter DEComposition – N2O (STEP–GENDEC-N2O) process-based model (Agbohessou et al., 2023a), which couples water budget, herbaceous aboveground and belowground vegetation growth and decay, herbaceous and tree foliage litterfall (Jarlan et al., 2005; Mougin et al., 1995; Tracol et al., 2006), soil biogeochemistry, and gaseous emissions (Bigaignon et al., 2020; Delon et al., 2019; Moorhead and Reynolds, 1991) to investigate the spatial and temporal patterns of herbaceous vegetation mass and CO2 and N2O emissions from soil and estimate their annual budget in the Sahelian SPSs. The STEP–GENDEC-N2O model was specifically designed for Sahelian semi-arid ecosystems and has been validated locally for soil CO2 and N2O emissions in several sites representative of the Sahelian SPSs (Agbohessou et al., 2023a; Bigaignon et al., 2020; Delon et al., 2015, 2019). In this study, this model was scaled up and used at the regional scale, i.e. at the west Sahelian regional scale.
The specific objectives of our study are to (1) investigate the spatiotemporal patterns of herbaceous vegetation mass, CO2, and N2O emissions from soils in the Sahelian SPSs over the last decade (2012–2022); (2) identify the environmental factors responsible for the changes in the spatial patterns of soil CO2 and N2O emissions; and (3) estimate the soil CO2 and N2O budget of the Sahelian SPSs during the 2012–2022 period.
2.1 Characteristics of the study area
The Sahel region is a semi-arid strip stretching across the African continent from Senegal to the Red Sea (Le Houérou, 1989). The region is characterized by high temperatures, low soil fertility, and a long dry season alternating with a short rainy season, with precipitation occurring mostly between June and September, making it challenging to grow crops. As a result, a large portion of the region is used for pastoral activities, which serve as the primary means of subsistence (Touré et al., 2012). The focus of this study is on the Sahelian SPSs of West Africa from latitude 13 to 18° N and from longitude 18° W to 20° E (Figs. 1 and A1), which covers approximately 40 % (≈ 892 353 km2) of the Sahelian band. The dynamics of rainfall in the Sahel are strongly linked to the dynamics of the West African monsoon (Biasutti, 2019). The Sahel experienced a dry period from the late 1960s to the mid-1990s, marked by years of extreme droughts such as in 1973–1974 and in 1984–1985. Several studies have reported a recovery period (Galle et al., 2018; Nicholson, 2017) for the Sahel since 1984, which is defined by an increasing trend in total seasonal rainfall (Biasutti, 2019; Dai et al., 2004). However, rainy season characteristics have changed: rainfall is more intense and intermittent (especially in areas with the lowest rainfall), and wetting is concentrated in the late rainy season (Biasutti, 2019; Chagnaud et al., 2022).
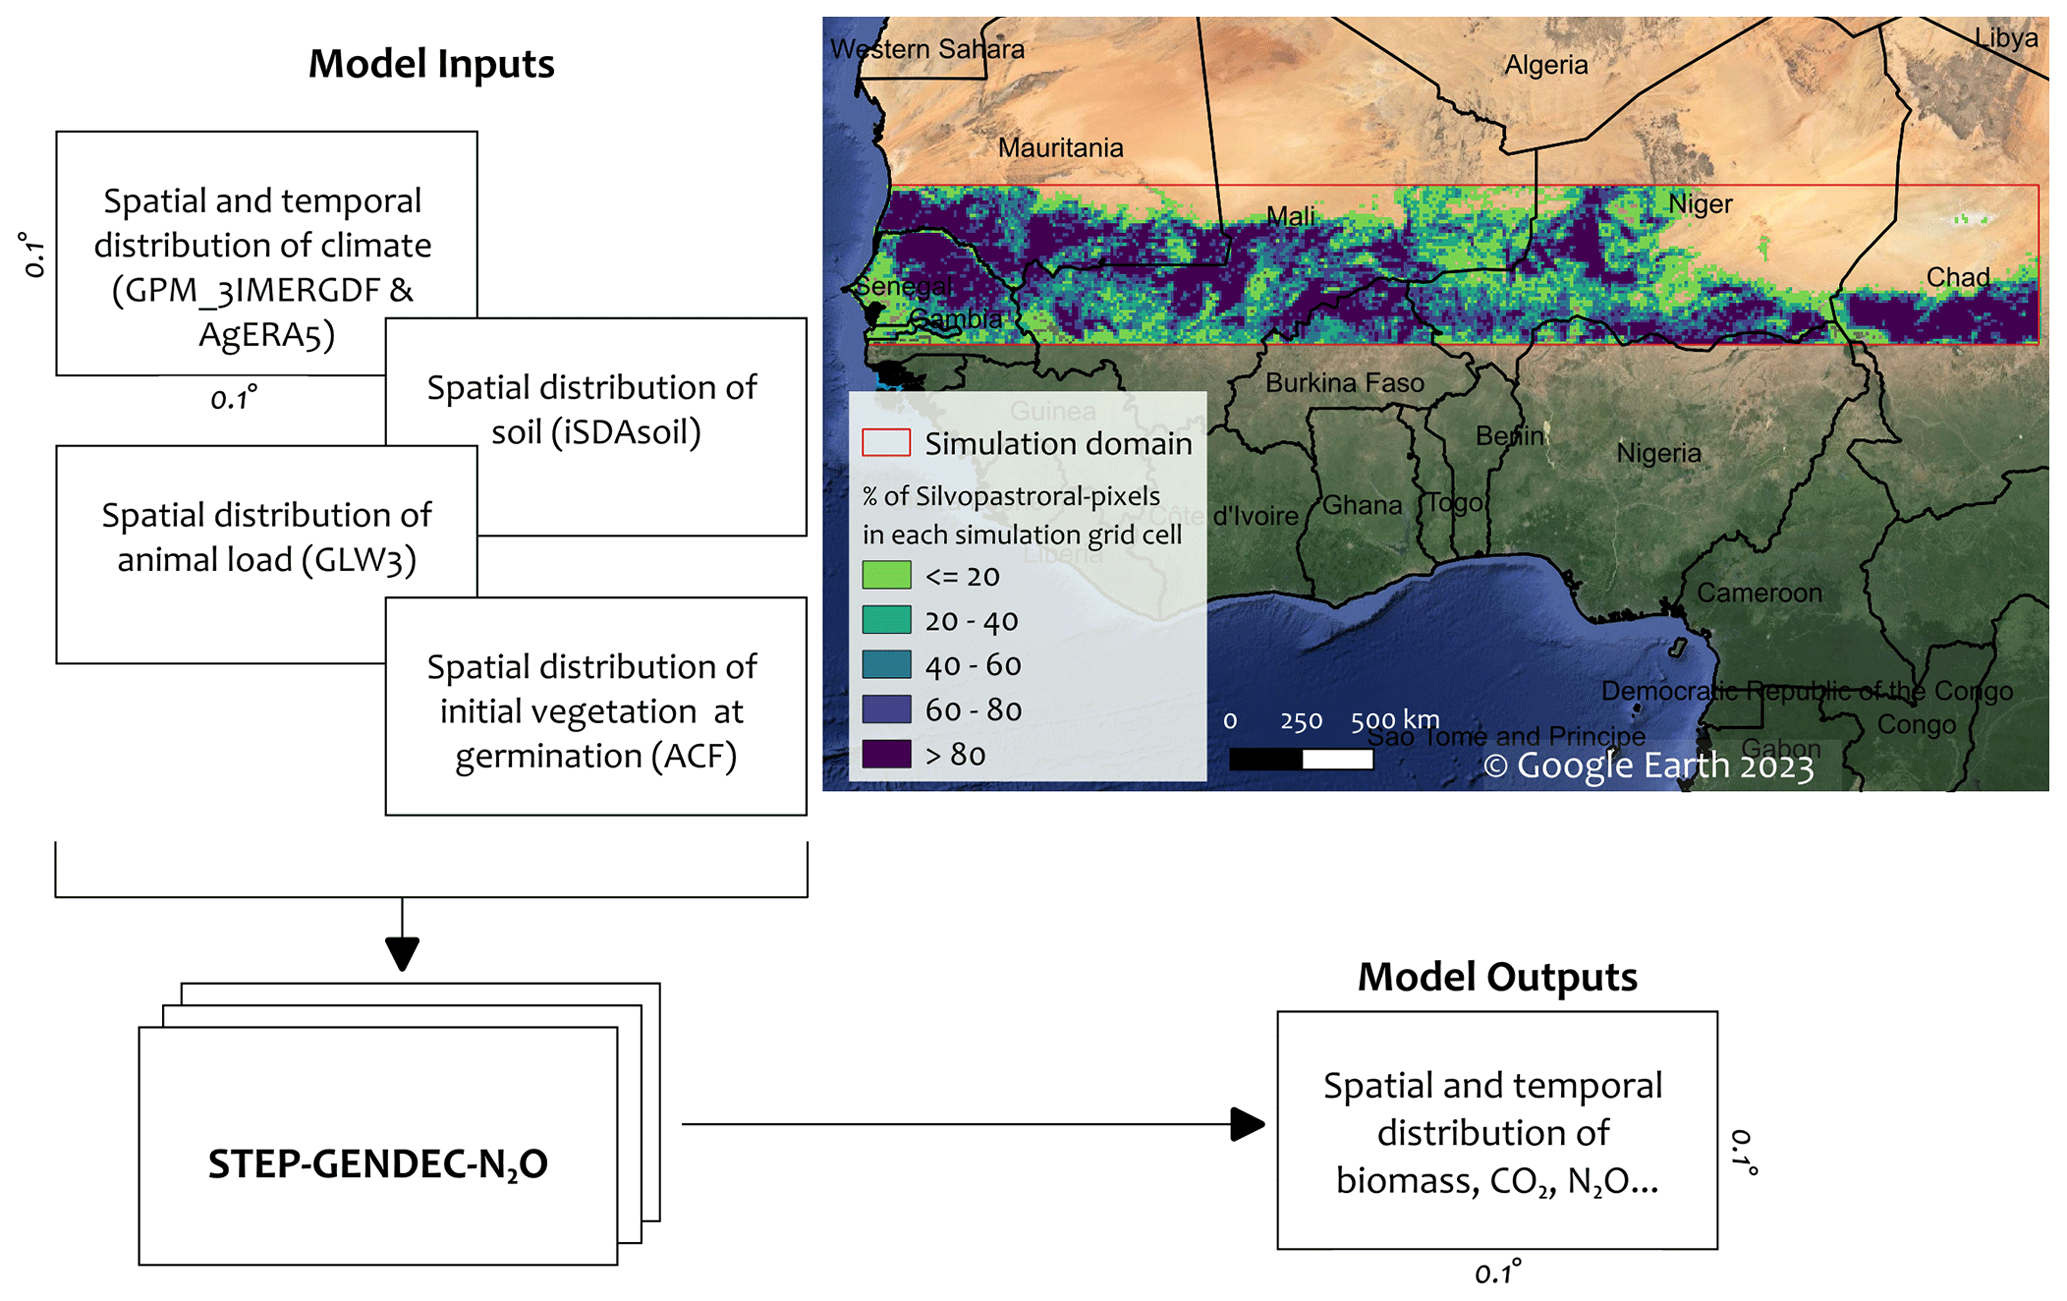
Figure 1Illustration of the upscaling approach used. Model inputs and outputs and the simulation domain (Sahelian SPSs) are shown on the map. Silvopastoral areas were filtered from cultivated areas in the simulation area.
2.2 Model used from 1D processes to 2D upscaling: STEP–GENDEC-N2O
2.2.1 Model description
STEP–GENDEC-N2O is a process-based model developed for the Sahelian herbaceous savanna, coupling water budget, aboveground and belowground herbaceous vegetation growth and decay, litter fall (Mougin et al., 1995), soil biogeochemistry (Moorhead and Reynolds, 1991), and soil gaseous emissions (Agbohessou et al., 2023a; Bigaignon et al., 2020; Delon et al., 2019). The model simulates the main processes of the water, C, and N cycling between the atmosphere, vegetation, and soil at daily time steps and finally simulates CO2 and N2O emissions. STEP–GENDEC-N2O is forced daily by rain, global radiation, air temperature, wind speed, and relative air humidity. The model has been applied to estimate herbaceous vegetation mass in Senegal, Mali (Mougin et al., 1995; Tracol et al., 2006), and Niger (Hiernaux et al., 2009), and the model has been applied to CO2, NO, and N2O emissions in Mali (Delon et al., 2015) and in Senegal (Agbohessou et al., 2023a; Bigaignon et al., 2020; Delon et al., 2019). In the litter decomposition GENDEC sub-model, the soil C content is calculated from the total litter input provided by STEP, while soil N is derived from the quantity of C using ratios (Moorhead and Reynolds, 1991). Soil moisture, soil temperature, and biomass (i.e. herbal aerial mass, herbaceous root mass, ligneous leaf mass, and faecal matter from livestock) are used as input variables to simulate microbial respiration. This is done by examining the interaction between buried litter, decomposer microorganisms, and six C and N pools (i.e. labile compounds, holocellulose, resistant compounds, dead microbial biomass, living microbial biomass, and soil N). N2O production and emissions from nitrification and denitrification are simulated using the DNDC (DeNitrification–DeComposition) equations (Li et al., 2000; Liu, 1996) adapted to the semi-arid region, as described in Bigaignon et al. (2020) and Agbohessou et al. (2023a). STEP alone has already been run to simulate aboveground biomass production at the local scale (Jarlan et al., 2003, 2005, 2008; Mougin et al., 1995), mesoscale (Grippa et al., 2017), and West African Sahel scale (Pierre et al., 2016). The summary figure (Fig. A9) showing the connection between the STEP and GENDEC models and the N2O module can be found in the Appendix.
2.2.2 Model upscaling
We used STEP–GENDEC-N2O to simulate daily herbaceous vegetation mass and CO2 and N2O emissions from soil in western Sahelian SPSs. We developed a framework to run the model at a regional scale using the parameterizations developed in the above-cited studies. Simulations were performed at the western Sahelian band scale (Fig. 1) divided into 18 271 grid cells of 0.1° × 0.1° from 2012 to 2022. Input variables were extracted from different datasets available at the global or regional scale, as described below (Table 1). For the soil dataset that is provided at a finer resolution (< 0.1° × 0.1°), pixel values for each centroid of the 18 271 simulation grid cells was extracted. Simulations were performed over an 11-year period (2012–2022) preceded by a 6-year spin-up using the meteorological forcing data of the year 2012, which was repeated 6 times. The spin-up period allows carbon and nitrogen pools to reach stability, as in Agbohessou et al. (2023a). Indeed, in the model, the carbon compartments for buried litter, feces, and dry roots are not initialized at 0; thus, our simulations start with initial carbon values of 3.7, 0.3, and 6.0 g C for buried litter, feces, and dry roots, respectively. These values represent means derived from in situ measurements collected over several years at the Dahra site, where the model has previously been employed at the local scale. The carbon and nitrogen sub-model used is relatively simple, employing first-order differential equations with moderate nonlinearity, which likely accounts for the rapid convergence observed in the model. All of this explains why the model did not require an extensive spin-up time to run with appropriately supplied carbon and nitrogen compartments.
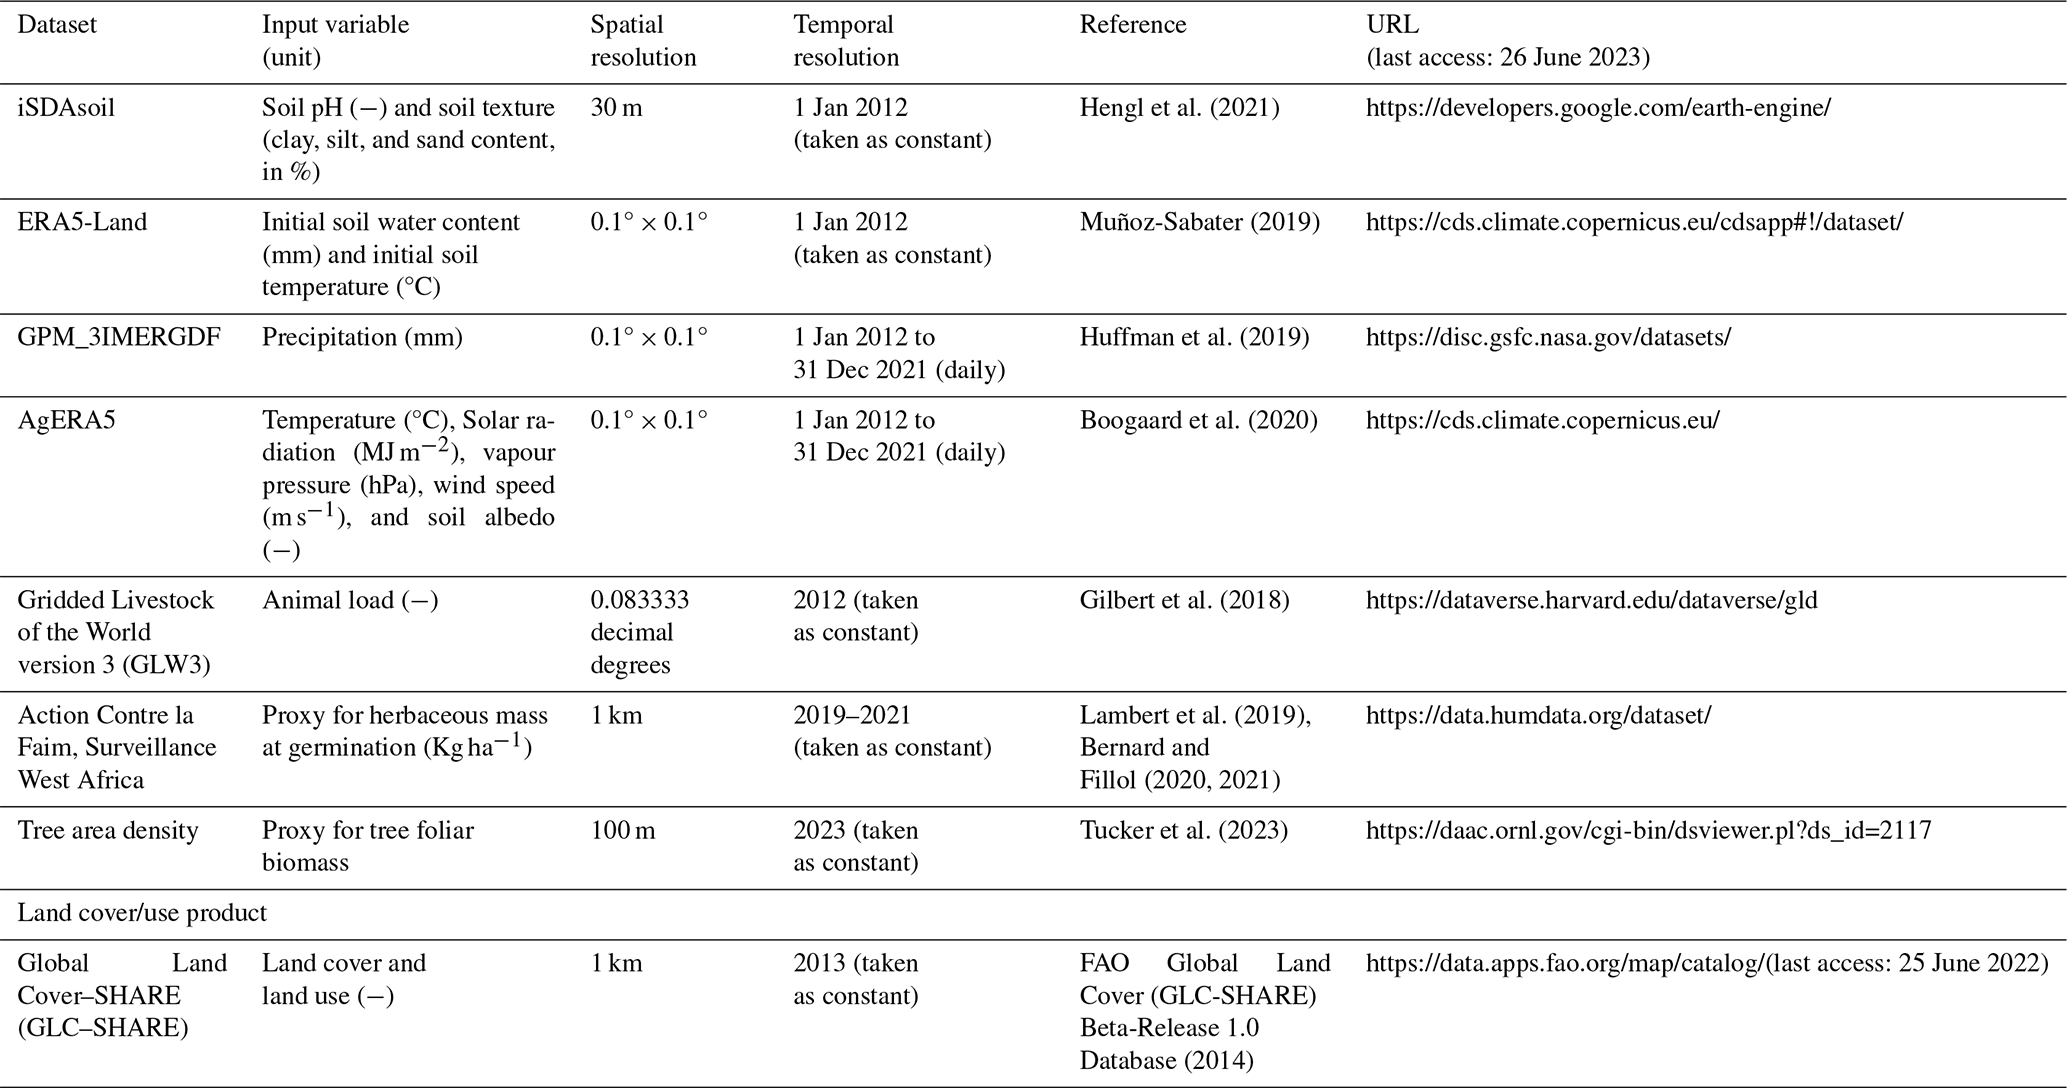
Table 1Summary of the datasets used for input variables and land cover/use.
2.3 Model input data
2.3.1 Climate data
The climate data required for the simulation were derived from two different datasets (GPM_3IMERGDF and AgERA5). Precipitation (mm) data were taken from the IMERG (Integrated Multi-satellitE Retrievals for GPM) dataset, GPM_3IMERGDF (Huffman et al., 2019). GPM_3IMERGDF or GPM IMERG Final Precipitation L3 1 d 0.1° × 0.1° V06, is derived from the 30 min GPM_3IMERGHH dataset (Huffman et al., 2019) and represents the final estimate of the daily accumulated precipitation. The selected product is the precipitationCal* multi-satellite precipitation estimates with gauge calibration. Dezfuli et al. (2017) validated the IMERG product in Africa using gauge data from western and eastern Africa. They showed that the precipitation diurnal cycle is relatively better-captured by IMERG than by the Tropical Rainfall Measuring Mission (TRMM) Multi-Satellite Precipitation Analysis (TMPA) product. Maranan et al. (2020) did a process-based validation of GPM IMERG in Africa using gauge data from a West African forested zone. Additionally, the choice of the IMERG dataset over the ERA5 dataset for precipitation is based on expert recommendations and on the results of previous evaluations of ERA5 precipitation data by Lavers et al. (2022). Their study highlighted significant errors, primarily in tropical regions. According to Lavers et al. (2022), users can only have confidence in ERA5 precipitation data in extratropical regions.
The spatial distribution of the GPM_3IMERGDF average precipitation over the last decade (2012–2022) exhibits significant gradients, with precipitation reaching as low as 0 mm at the northern border, exceeding 500 mm at the south-eastern border, and exceeding 1000 mm at the south-western borders (Fig. A2). Additionally, there is a significant increasing trend in annual mean precipitation from 2010 to 2021, along with interannual variability (Fig. 3c).
Temperature (°C), solar radiation (MJ m−2), vapour pressure (hPa), and wind speed (m s−1) were extracted from the AgERA5 dataset (Boogaard et al., 2020) using the R package ag5Tools (Brown and de Sousa, 2023). The AgERA5 dataset provides daily surface meteorological data matching the input needs of STEP–GENDEC-N2O. The dataset is based on the ECMWF (European Centre for Medium-Range Weather Forecasts) reanalysis ERA5-Land dataset (Muñoz-Sabater, 2019). ERA5-Land is an enhanced global dataset for the land component of the fifth-generation reanalysis produced by the ECMWF. It combines extensive historical observations from satellites, aircraft, and land and marine weather sensors into global estimates using advanced modelling and data assimilation systems to generate consistent time series of multiple climate variables. More information about the ERA5-Land product can be found in Muñoz-Sabater et al. (2021) and Gleixner et al. (2020). In the data used, no significant trends (p > 0.01) were observed in average air temperature (range: 25–35 °C), minimum air temperature (range: 16–27 °C), maximum air temperature (range: 25–39 °C), global radiation (range: 19–25 MJ m−2 d−1), wind speed (range: 2–7 m s−1), and vapour pressure (range: 5–25 hPa; extracted from ERA5-Land) in the Sahel between 2012 and 2022.
2.3.2 Soil data
Soil pH and soil texture (i.e. clay, silt, and sand content) were obtained from the iSDA (Innovative Solutions for Decision Agriculture, Ltd.) soil dataset (Hengl et al., 2021). The iSDAsoil dataset contains soil property predictions at a 30 m pixel size using machine learning coupled with remote sensing data and a training set of over 100 000 analysed soil samples from all over Africa (Hengl et al., 2021; Miller et al., 2021). Prediction uncertainty estimates per pixel for the iSDAsoil property data are provided in Hengl et al. (2021). In the same study, the average accuracy performance based on 5-fold spatial cross-validation for various soil variables indicated that soil pH exhibited the highest performance, with a concordance correlation coefficient (CCC) of 0.90. The CCC values for soil clay content, sand content, and silt content were 0.85, 0.85, and 0.78, respectively. We initialized the dry soil albedo, soil moisture (mm), and soil temperature (°C) at the beginning of the simulation using data extracted from the ECMWF reanalysis ERA5_Land (Muñoz-Sabater, 2019).
Exploration of the extracted soil datasets showed that the soils in the Sahel region are typically sandy, with high levels of sand and low levels of clay (Fig. A3a and b). This results in soils that are well-drained but low in nutrients. The soil pH in the south-western part of the Sahel ranges from 5 to 7, while in the north and east it is higher than 7 (Fig. A3c). The pH levels of the soils in the Sahel vary also depending on their texture. Sandier soils typically have a higher pH (7–8.5), while clay soils have a lower pH (5–7).
2.3.3 Animal load data
Information about livestock population and animal load distribution were obtained from the total livestock number for the reference year 2010 provided by the Gridded Livestock of the World version 3 (GLW3; Gilbert et al., 2018) dataset. GLW3 provides global population densities of cattle, buffaloes, horses, sheep, and goats in each land pixel at a spatial resolution of 0.083333 decimal degrees (approximately 10 km at the Equator). The relative spatial distribution of livestock over the simulation period was assumed to be the same as the one indicated by the GLW3 database for the year 2010. To our knowledge, no measurement data are available for the temporal variation in livestock across the Sahel. Indeed, the Food and Agricultural Organization of the UN, Statistics Division (FAOSTAT) provides estimates of the livestock population at the national level for the period from 2012 to 2020 (FAOSTAT, 2024). However, these data are only available at the national scale and have not been downscaled to the finer spatial scales required for our simulation. GLW3 is currently the most recently compiled and harmonized sub-national livestock distribution dataset available (and only covers the year 2010). In Gilbert et al. (2018) it is mentioned that the outputs of the GLW3 dataset have been adjusted to ensure that the total number of animals in a country aligns with the FAOSTAT 2010 total stock number. To our knowledge, there are no recent datasets available prior to 2010 presenting livestock distribution at the sub-national scale in our region. We used the annual values of the GLW3 database to distribute the animal load on a monthly basis, taking into account the temporal variation in the livestock population from one month to the next throughout the year. We assumed an increase in the livestock up to 100 % (in reference to the GLW3 database) in the pixels during the rainy season and a gradual decrease down to 20 % as we approached the middle of the dry season.
Analysis of the GLW3 dataset revealed that livestock is heterogeneously distributed across the Sahel and that the animal load is dominated by bovines, ovines, caprines, and some equines (Gilbert et al., 2018). High livestock densities were observed in north-western Senegal, southern Mauritania, central Mali, northern Burkina Faso, southern Niger, northern Nigeria, and south-western Chad (Fig. A3f).
2.3.4 Initial biomass data
The model calibration input parameters related to herbaceous vegetation, such as initial mass (Bg0) and initial specific leaf area (SLAg0) at germination date, were computed using data from the biomass dataset provided by Action Contre la Faim (ACF), Surveillance West Africa (Bernard and Fillol, 2020, 2021; Lambert et al., 2019). ACF biomass data were produced from 10 d images of dry mass production (DMP) from Satellite Pour l'Observation de la Terre – Végétation (SPOT-VGT) 4 and 5, PROBA-V satellite, and SENTINEL-3 satellite (Lambert et al., 2019). The retrieval algorithm of the DMP product is described as follows (Monteith, 1972; Swinnen et al., 2022):
DMP is the 10 d dry mass production (kg DM ha−1 d−1), R is the 10 d total shortwave incoming radiation (GJT ha−1 d−1), the fraction of absorbed photosynthetically active radiation (fAPAR) is the PAR fraction absorbed by green vegetation (), γLUEc is the light-use efficiency at optimum (kg DM GJ), γc is the fraction of PAR in the total shortwave (), γT is the normalized temperature effect, is the normalized CO2 fertilization effect, and CUE is the carbon use efficiency.
The 1 km2 resolution biomass raster product showing biomass production in the Sahel in kg ha−1 yr−1 was downloaded for the study period. We extracted the biomass value for each centroid of the simulation grid cells and performed a normalization by scaling the dataset linearly to a range between 0 and 2.5 g m−2 (the min and max values of Bg0 in the STEP model) to get the spatial distribution of the initial biomass (Bg0) at germination date. To obtain the spatial distribution of the initial specific leaf area (SLAg0) at germination date, we normalized the ACF biomass dataset to a range between 0 and 280 cm2 g−1 (the min and max values of SLAg0 given in Jarlan et al., 2008). The normalization formula used to linearly scale biomass values to Bg0 and SLAg0 ranges is the following:
with Xnorm representing the value of Bg0 or SLAg0; a and b being the smallest and the largest value that Bg0 or SLAg0 can take, respectively; and x being the biomass values from the ACF dataset.
In the model, Bg0 and SLAg0 are calibration parameters. Bg0 mainly affects the date of peak biomass (Tracol et al., 2006), whereas SLAg0 is used to estimate the leaf area index (LAI) and the fAPAR. The maximum conversion efficiency (γc) of absorbed radiation into biomass (i.e. g of dry matter per MJ of absorbed photosynthetically active radiation) was set to 5 g MJ−1, which corresponds to the central value of the γc range possible values (Mougin et al., 1995; Pierre et al., 2011; Tracol et al., 2006) for all simulation grid cells.
2.3.5 Foliar mass of trees
Using the allometric equation developed by Hiernaux et al. (2023), we transformed the tree area density product provided by Tucker et al. (2023) into an estimate of tree foliar biomass in each simulation grid cell (Fig. A3e). The conversion formula employed was
Here, DMfoliar represents the mass of tree leaves in kilograms, and A denotes the tree crown area in square metres.
2.4 Accounting for SPS distribution in model outputs
The Global Land Cover–SHARE (GLC–SHARE) dataset (FAO Global Land Cover (GLC-SHARE) Beta-Release 1.0 Database, 2014) provides information about the spatial distribution of a set of 11 major land cover classes (i.e. artificial surfaces, cropland, grassland, tree-covered areas, shrub-covered areas, herbaceous vegetation, aquatic or regularly flooded, mangroves, sparse vegetation, bare soil, snow and glaciers, and water bodies) for the year 2013 at a 1 km2 pixel resolution. First, we assumed that land cover change intensity was negligible in the Sahel during the last decade (the study period). Second, a new land cover class called silvopastoral areas was created that represents the sum of pixels of the shrub-covered area and grassland classes (Fig. 1).
The proportions of silvopastoral area pixels within the 0.1° × 0.1° simulation grid cells (pixel resolution ≈ 123.21 km2) were calculated using the GLC–SHARE dataset to obtain the spatial distribution of silvopastoral systems in the Sahel (Fig. A1). In our analysis and interpretation of the spatial distribution of herbaceous mass and CO2 and N2O emissions, we consider the model outputs for simulation pixels where silvopastoral areas are > 80 %. Additionally, bivariate maps that display both model outputs and the distribution of SPSs in the simulation domain were proposed to provide a more comprehensive view of the results.
To estimate the annual budget of soil CO2 and N2O emissions, the model outputs were weighted by the proportion of silvopastoral area within each simulation grid cell (Figs. 1 and A1), thus considering all SPSs across the simulation domain, even those with % SPS < 80 %,.
2.5 Random forest algorithm for the analysis of soil CO2 and N2O emission driving parameters
Random forest (RF) is a machine learning method developed by Breiman (2001); it is a natural non-linear modelling tool that has proven valuable in many fields (Liu et al., 2022; Webb et al., 2021). We used the RF algorithm to identify the most important factors influencing the spatial distribution of soil CO2 and N2O emissions. The main advantages of RF algorithms are the low number of tunable factors, good tolerance to outliers and noise, general resistance to overfitting, and the ability to identify and rank the most important variables (Liu et al., 2022; Webb et al., 2021). The RF algorithm was implemented in the R software (R Core Team, 2019), and the modelling framework provided by the randomForest R package (Liaw and Wiener, 2002) was used in our study. The target variables of the RF are the spatial distribution of the simulated soil CO2 and soil N2O emissions, while the explanatory variables include the spatial distribution of various environmental and biological factors that can impact the spatial distribution of the soil CO2 and N2O emissions simulated by the STEP–GENDEC-N2O model. These factors consist of a combination of output variables from the STEP–GENDEC-N2O model (e.g. soil water content, soil temperature, soil C content, soil N content, and herbaceous mass) and input variables for the STEP–GENDEC-N2O model (e.g. soil sand content, soil clay content, soil pH, air temperature, albedo, annual precipitation, and animal load). We conducted the RF with the default parameters proposed by the randomForest package.
The method is composed of three critical steps, each of which plays a crucial role in the overall performance of the model. In the first step, a bootstrap sample of observations (equal to the number of trees) is randomly drawn from the dataset, with replacement. Approximately one-third of the total observations are left out and used as “out-of-bag” (OOB) data to evaluate the model performance and prevent the need for a separate validation dataset (Efron and Tibshirani, 1986; Philibert et al., 2013). This provides a resampling procedure that generates multiple versions of the training dataset, which helps to mitigate overfitting and improves the accuracy of the model. In the second step, a random subset of predictor variables is selected at each node of the decision tree (Ghattas, 2000; Philibert et al., 2013; Prasad et al., 2006). The number of variables selected (mtry) was set to the integer part of the square root of the total number of variables (Breiman, 2001; Liaw and Wiener, 2002; Philibert et al., 2013). This approach involves considering a subset of variables at each node of the decision tree and selecting the best variable that maximizes the information gain. This randomization technique reduces the correlation among the trees and makes the model more robust and accurate. In the final step, multiple decision trees are grown from the bootstrapped dataset and the random subsets of features. The trees are grown using recursive binary partitioning of the data, with the best split determined by optimizing a quality criterion such as information gain according to the Gini impurity index (Breiman et al., 1984). The final prediction is made by averaging the outputs of the aggregated predictions of all trees in the forest. The process is repeated multiple times until a stable estimate of model performance is obtained.
We assessed variable importance using the percentage increase in mean squared error (% IncMSE) after a factor was randomly permuted. The % IncMSE estimates the contribution of each variable to the reduction in the mean squared error in the model (Breiman, 2001; Echeverry-Galvis et al., 2014). Factors with higher % IncMSE values are considered more important in explaining the spatial distribution of soil CO2 and N2O emissions. The importance of each factor was displayed using the variable importance plot developed from the RF.
2.6 Statistical analysis and mapping
We conducted a linear regression analysis to examine trends over time in herbaceous vegetation mass, soil CO2 and N2O emissions, and relevant emission-driving variables. The Pearson correlation was used to assess the relationship between the different variables. All statistical analysis and mapping were performed using R (R Core Team, 2019).
3.1 Spatiotemporal patterns in aboveground herbaceous mass in the Sahelian SPSs (2012–2022)
The annual production of aboveground herbaceous mass simulated from 2012 to 2022 in the Sahelian SPSs displays a latitudinal gradient characterized by higher herbaceous mass in the southern regions, which diminishes as we progress towards the northern latitudes (Fig. 2). The same spatial pattern is observed in Fig. 2b, which highlights results for Sahelian SPSs (pixel % SPS > 80 %). The maximum annual mean production (2012–2022) reaches 3 t DM ha−1 yr−1, and the annual minimum production is 0 t DM ha−1 yr−1.
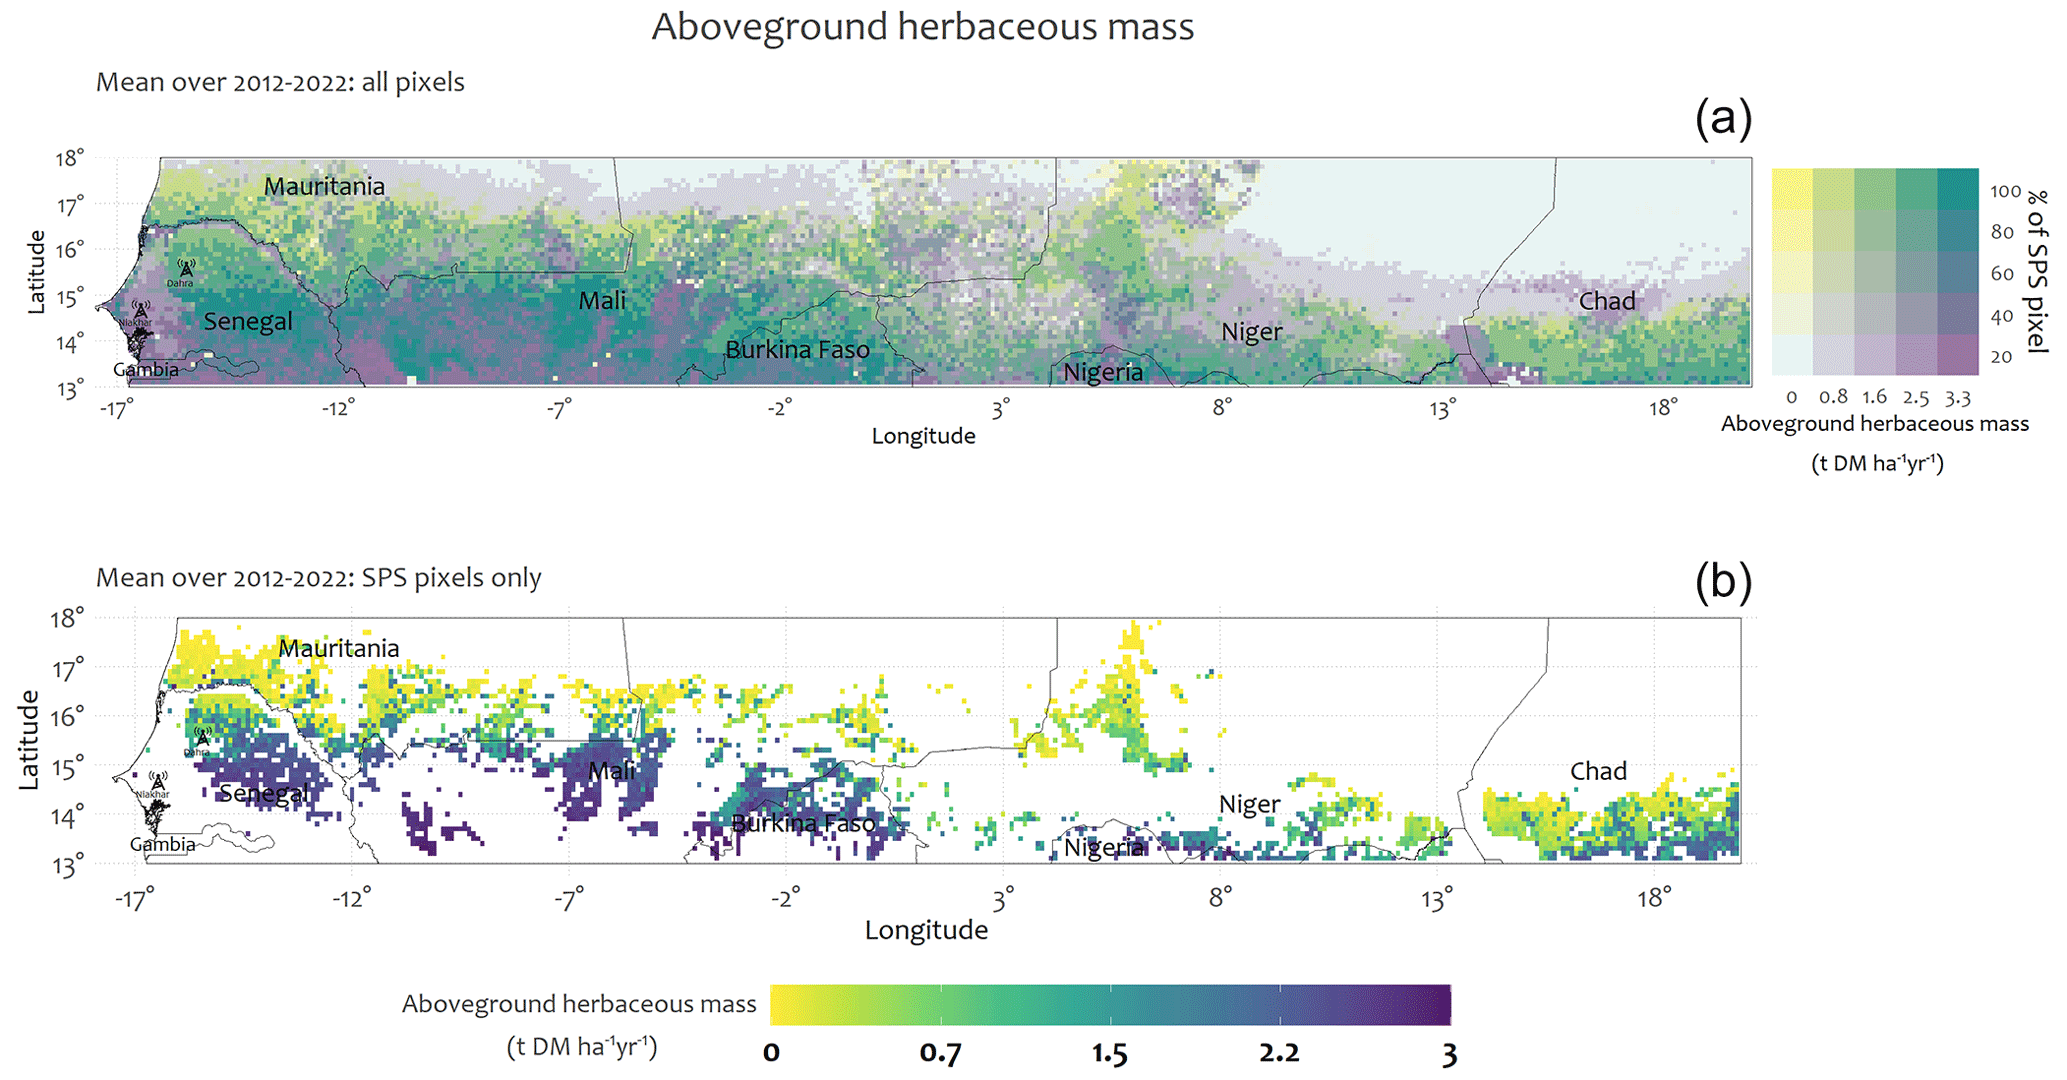
Figure 2Regional distribution of simulated herbaceous mass in the Sahelian SPSs (annual mean over 2012–2022) in t DM ha−1 yr−1. (a) Bivariate map, which displays both simulated herbaceous mass and the distribution of SPSs in the simulation domain. (b) Map filtering of the simulated herbaceous mass for areas with Sahelian SPSs > 80 % only.
Herbaceous mass in Sahelian SPSs exhibited interannual variations, with standard deviations reaching up to 1.3 t DM ha−1 yr−1 at some locations (Fig. A4a). We observed a significant increasing trend (p < 0.001) in the annual herbaceous mass anomaly (a deviation from the 2012 to 2022 average) from 2012 to 2020 (Fig. 3a). This rising trend is evident in the Hovmöller representation, which depicts a gradual increase in herbaceous mass, particularly in the southern Sahel region around the latitudes of 13 and 15° N (Fig. 3b), with the highest production simulated in the wettest years (2019, 2020, and 2021; Fig. 3c). In the southern Sahel (13 to 15° N) herbaceous mass in SPSs can reach 2.5 t DM ha−1 yr−1, while in the northern Sahel (16 to 18° N) it does not exceed 0.5 t DM ha−1 yr−1 (Fig. 3b). Overall, herbaceous mass in the Sahelian SPSs is highly correlated to the wet season total precipitation, which shows large interannual variation (Fig. 3c; p < 0.001 and r = 0.6).
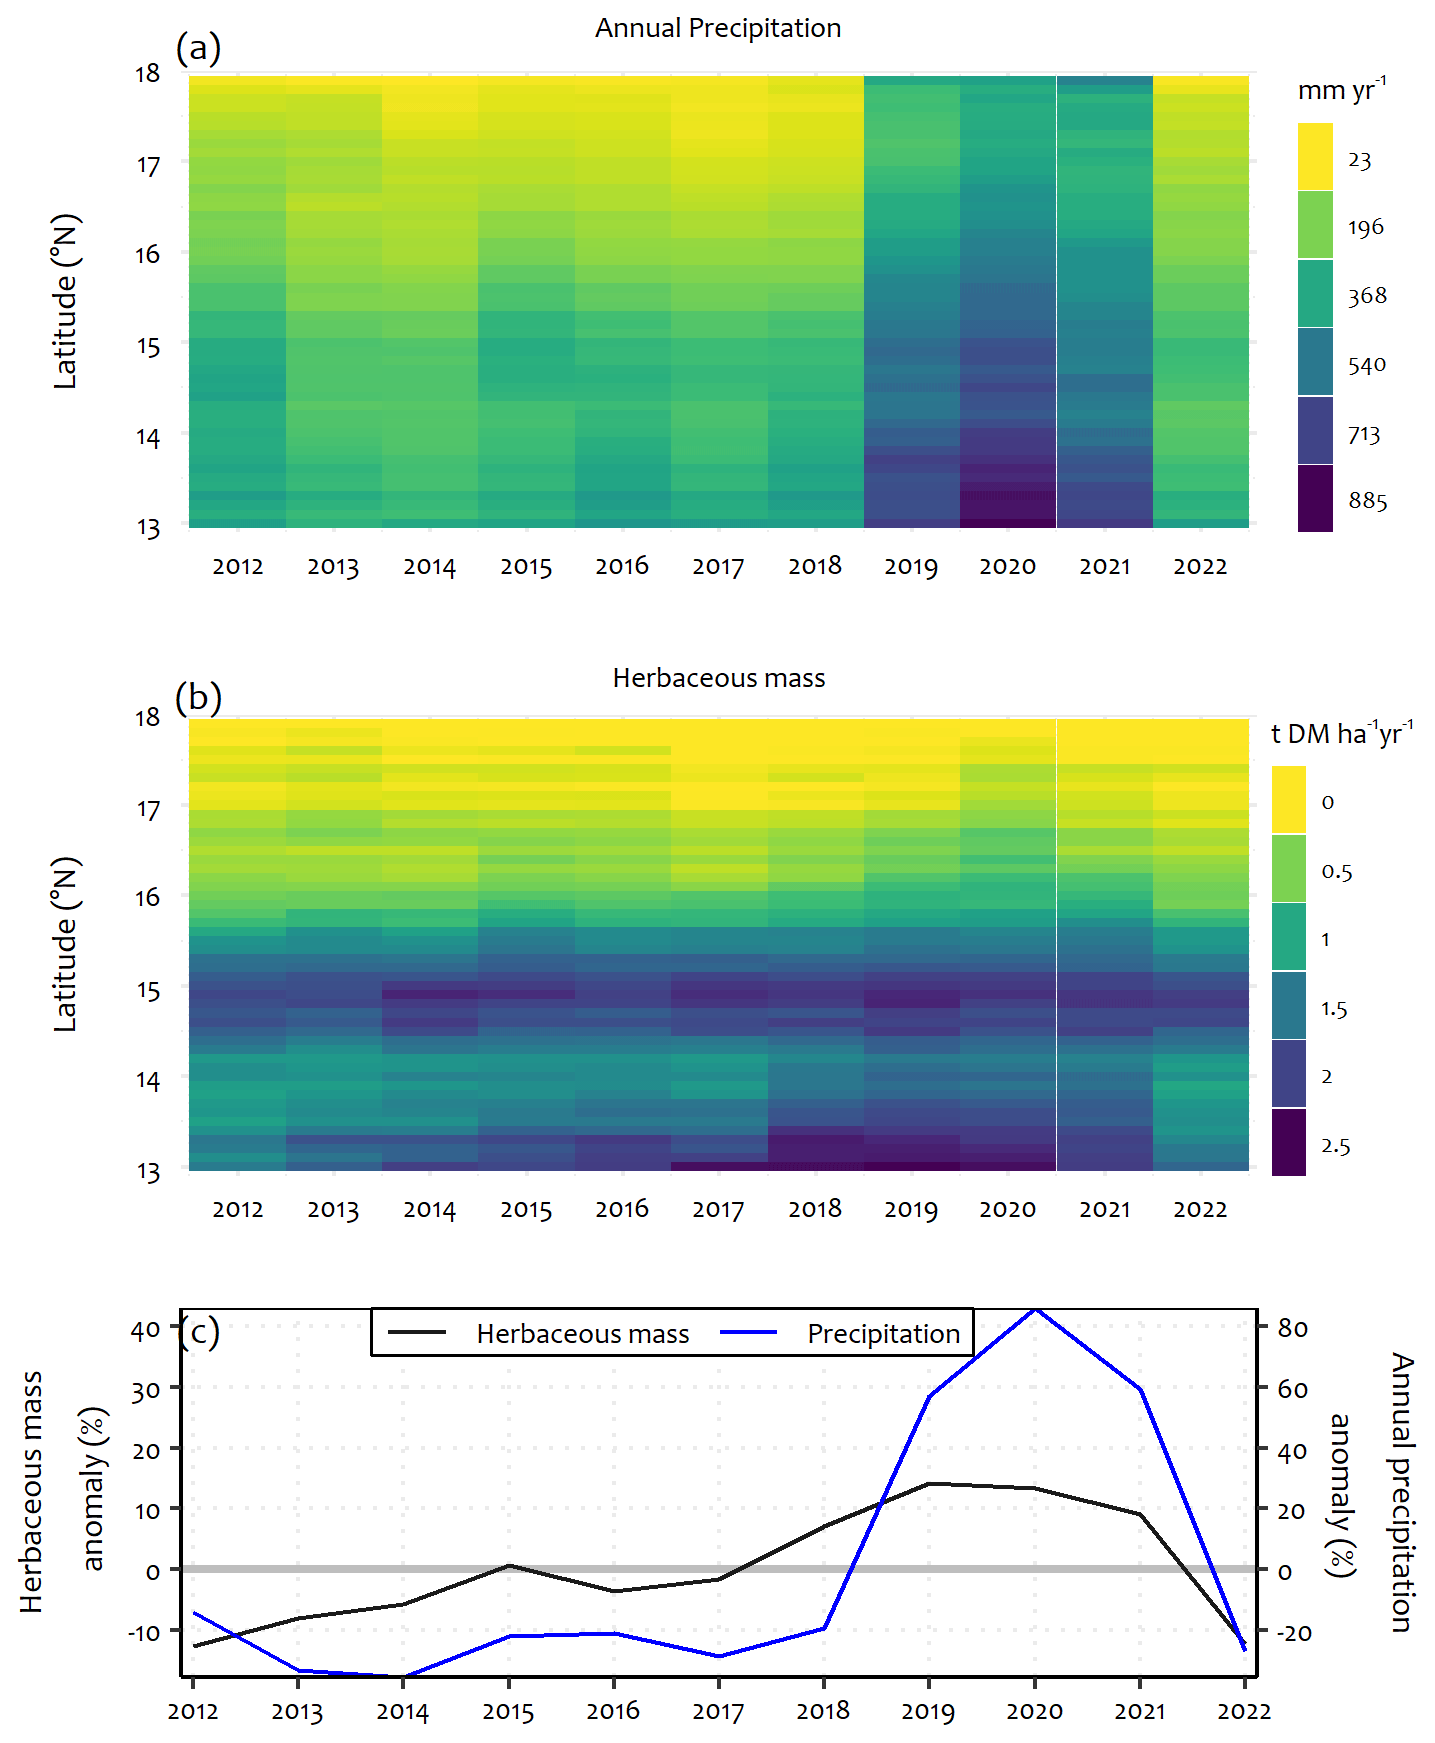
Figure 3(a) Hovmöller (latitude–year) plot of annual precipitation. (b) Hovmöller (latitude–year) plot of herbaceous mass in the domain indicated in Fig. 2b. (c) Interannual variations in anomalies (relative to the mean value for the period of 2012–2022).
3.2 Soil CO2 and N2O emissions in Sahelian SPSs
3.2.1 Spatial distribution across the Sahel
The simulation results reveal a heterogeneous spatial distribution of soil CO2 and N2O emissions, with the lowest emissions in the north and the highest emissions in the south (Fig. 4). SPSs in the pastoral zones of central Senegal, in southern and central Mali, in northern Burkina Faso, and in southern Niger (between longitudes of 7 and 8° E) exhibit high levels of soil CO2 emissions (Fig. 4a and b). The average soil CO2 emissions for the period 2012–2022 reached 1.7 t CO2-C ha−1 yr−1, as shown in Fig. 4b. SPSs located in the northern regions of Niger, as well as in Mauritania, were generally not significant sources of CO2 (Fig. 4b). Only SPSs in central Senegal, northern Burkina Faso, and Mali remained constant CO2 emission hotspots throughout the study period, with emissions as high as 2.6 t CO2-C ha−1 yr−1 in some years, as shown in the all-year detailed maps in Fig. A6. Interannual variabilities of up to 0.7 t CO2-C yr−1 ha−1 have been observed in some SPSs (Fig. A4b).
Figure 4c depicts heterogeneous soil N2O emissions ranging from 0 to 3 kg N2O-N ha−1 yr−1 and high emissions in some areas where the percentage of SPS pixels is lower than 80 %. Fig. 4d exclusively shows case areas that are representative of the Sahelian SPSs (% SPS > 80), showing that soil N2O emissions were as high as 2.3 kg N2O-N ha−1 yr−1 (mean 2012–2022 period) in SPSs located within the sandy pastoral zones of central Senegal and in southern Mali between the latitudes of 13 and 15° N. In contrast, smaller N2O emissions were observed in the other SPSs of the region, especially in Niger and Chad. High interannual variabilities have been observed in the southern part of the Sahel (Fig. A4c).
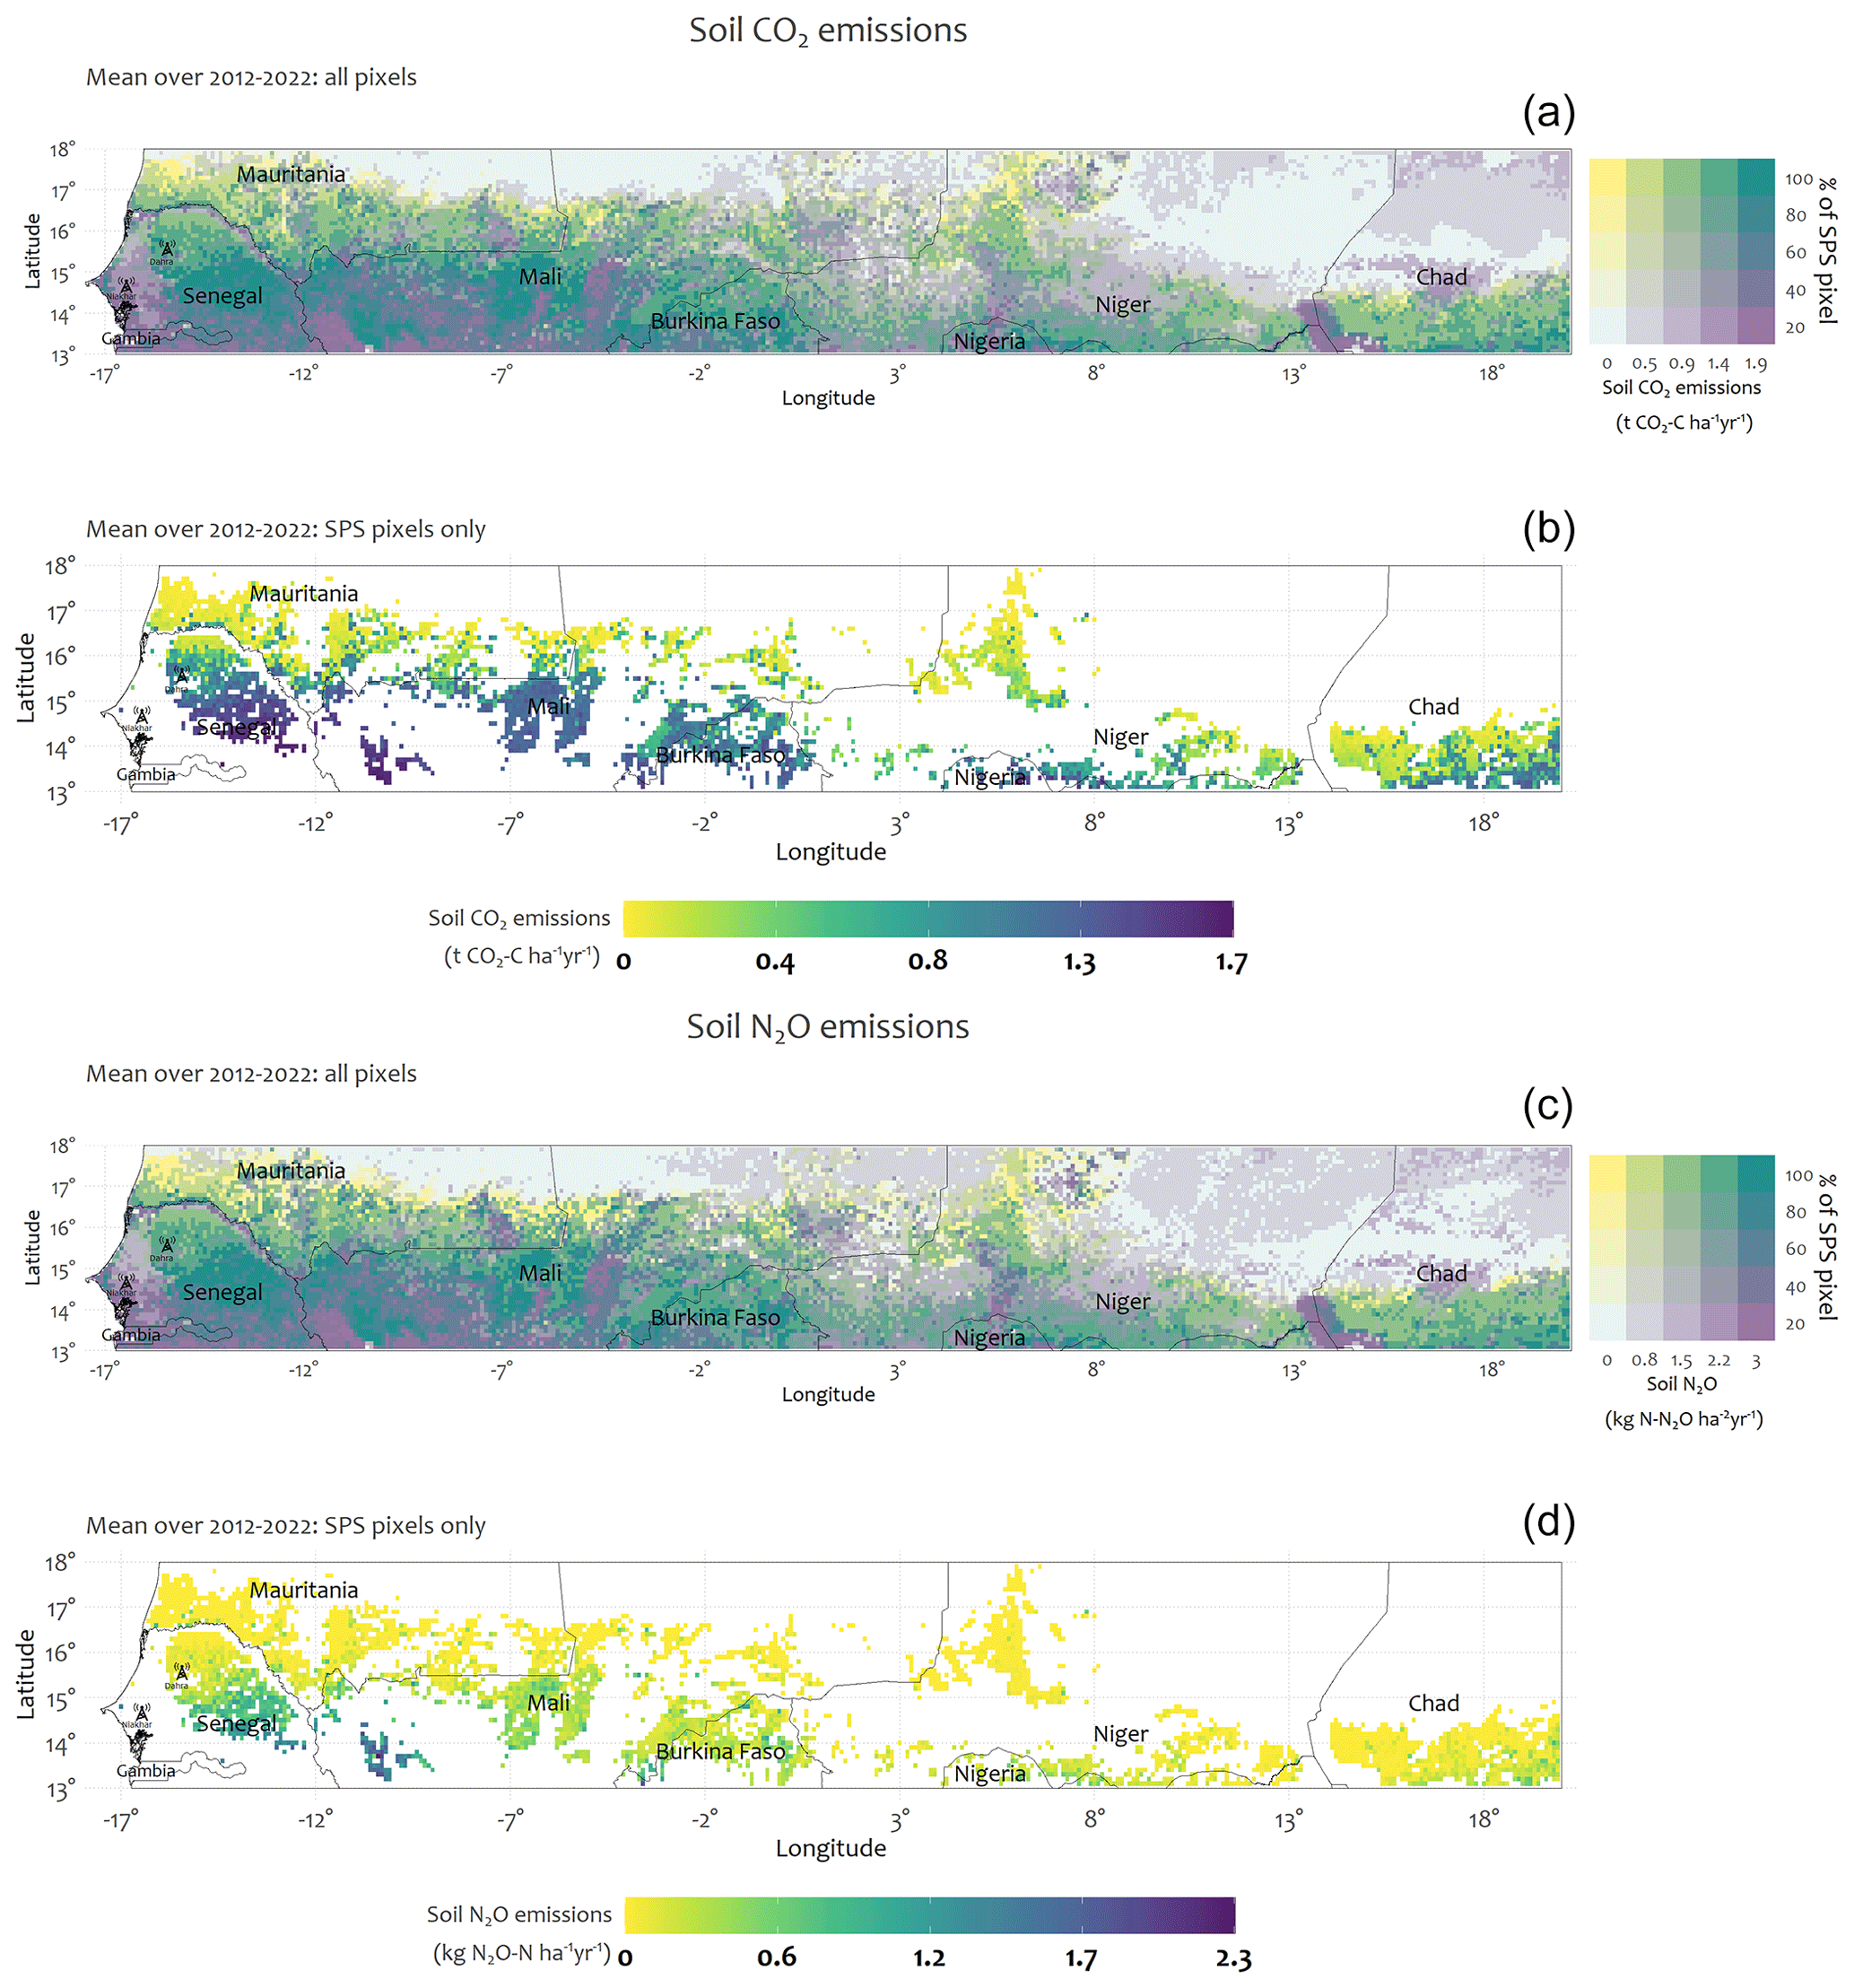
Figure 4Regional distribution of simulated soil CO2 and N2O emissions in the Sahelian SPSs (annual means from 2012–2022). Panels (a) and (c) – bivariate maps display both model outputs and the distribution of SPSs in the simulation domain. Panels (b) and (d) – maps displaying model outputs only in areas representative of the Sahelian SPS (> 80 %).
3.2.2 Exploring the temporal dynamics of model outputs
Figure 5 shows the temporal dynamics of wet-season precipitation, soil CO2 emissions, soil N2O emissions, soil water content, and soil total C at two contrasting sites showing different emission levels (low and high) located in Niger (latitude 14.2, longitude 10.7) and Senegal (latitude 15.4, longitude −15.4), respectively. These sites were on predominantly sandy soils. The observed dynamics of the different variables (precipitation, soil CO2 emissions, soil N2O emissions, soil water content, and soil C content) at these sites show the model's ability to realistically simulate seasonal variations at fine timescales in soil CO2 and soil N2O emissions in the Sahel.
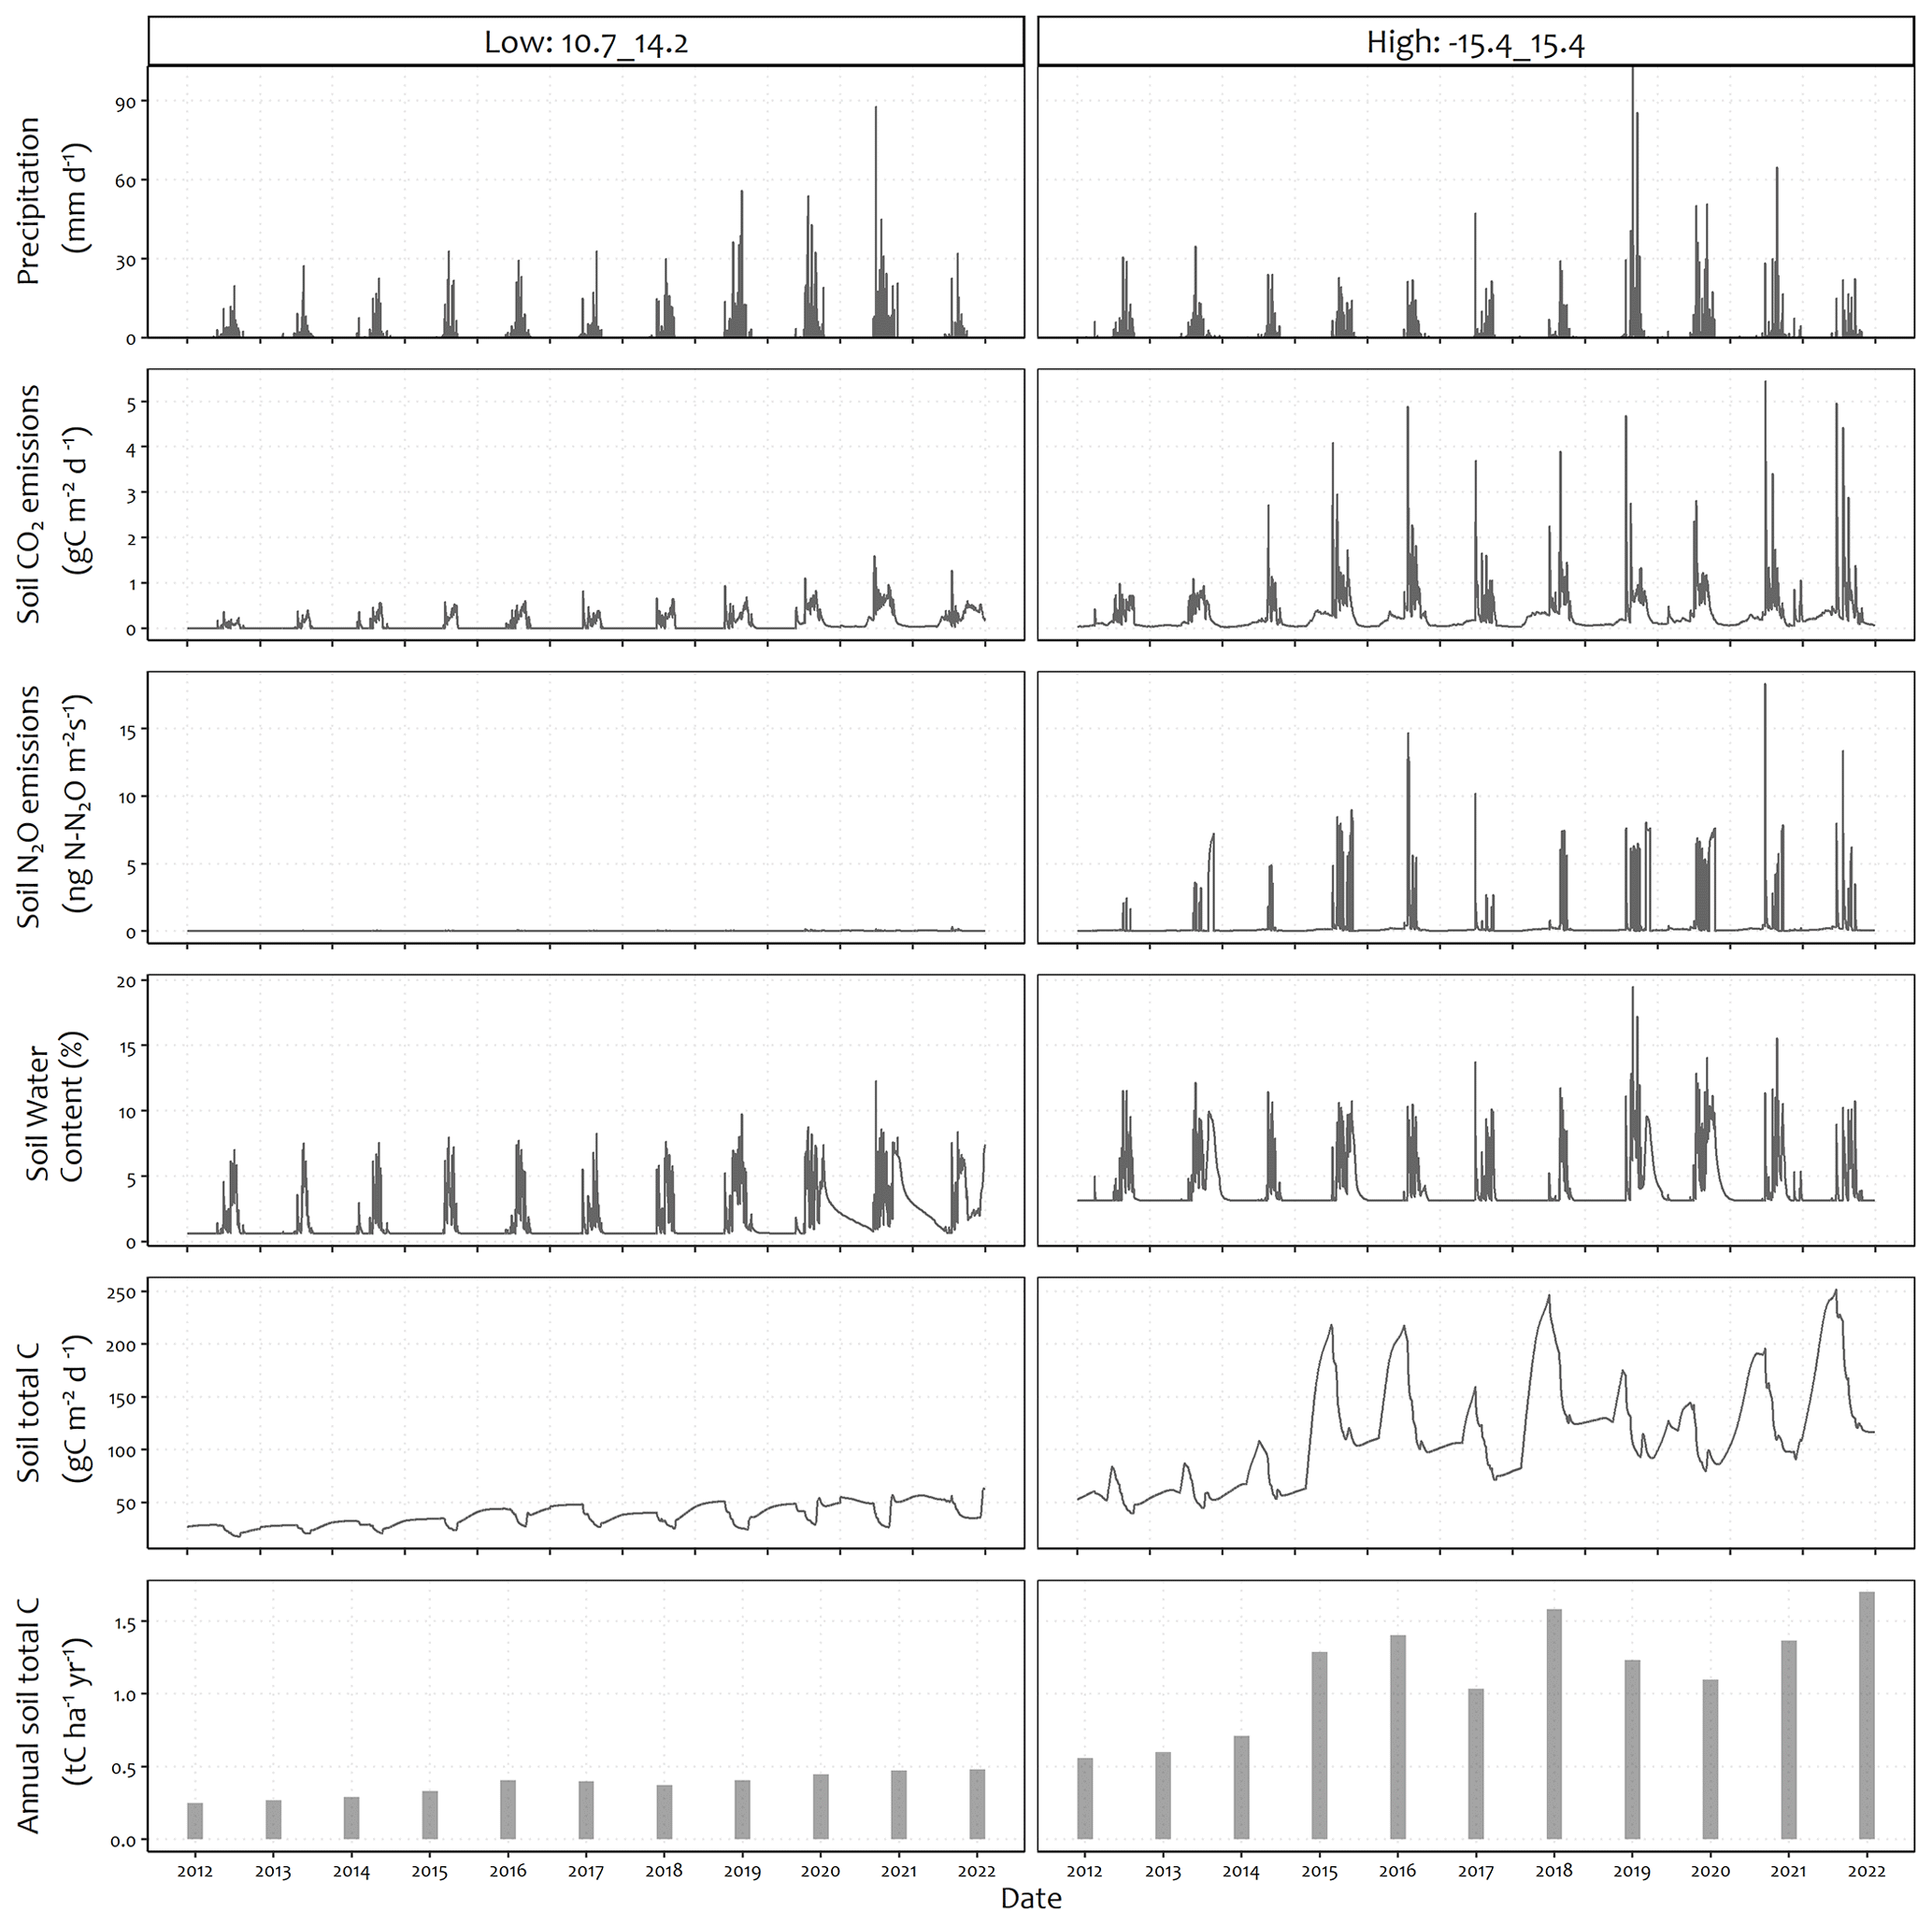
Figure 5Temporal dynamics of model outputs across two sites with different levels of soil CO2 and N2O emissions. From top to bottom: precipitation, soil CO2 emissions, soil N2O emissions, soil water content, and soil total C. On the left, a site exhibiting low emissions (latitude −10.7, longitude 14.2), on the right, a site with high emissions (latitude 15.4, longitude −15.4).
3.2.3 Factors controlling the spatial distribution of soil CO2 and N2O emissions
The observed variations in the spatial patterns of soil CO2 and N2O emissions were attributed to a complex interaction between meteorological, edaphic, and biophysical factors. According to a statistical analysis assessed by random forest over the model output in grid cells containing more than 80 % of SPSs, soil carbon and nitrogen contents were found to be the primary factors controlling the spatial distribution of soil CO2 and N2O emissions, respectively, as shown in Fig. 6. Soil C content, air temperature, and soil temperature were identified as the three most significant factors controlling the spatial patterns of soil CO2 emissions. For soil N2O, the two most significant factors after soil N content were soil water content and animal load. The results further showed that for soil CO2, the other driving factors were herbaceous mass, animal load, annual precipitation (or soil water content), soil clay content, and soil water content (Fig. 6a). For soil N2O, herbaceous mass, soil temperature, soil clay content, annual precipitation (or soil water content), and air temperature (in that order) also appeared as key driving factors (Fig. 6b). Soil pH was found to have the least influence on the spatial pattern of soil N2O emissions (Fig. 6).
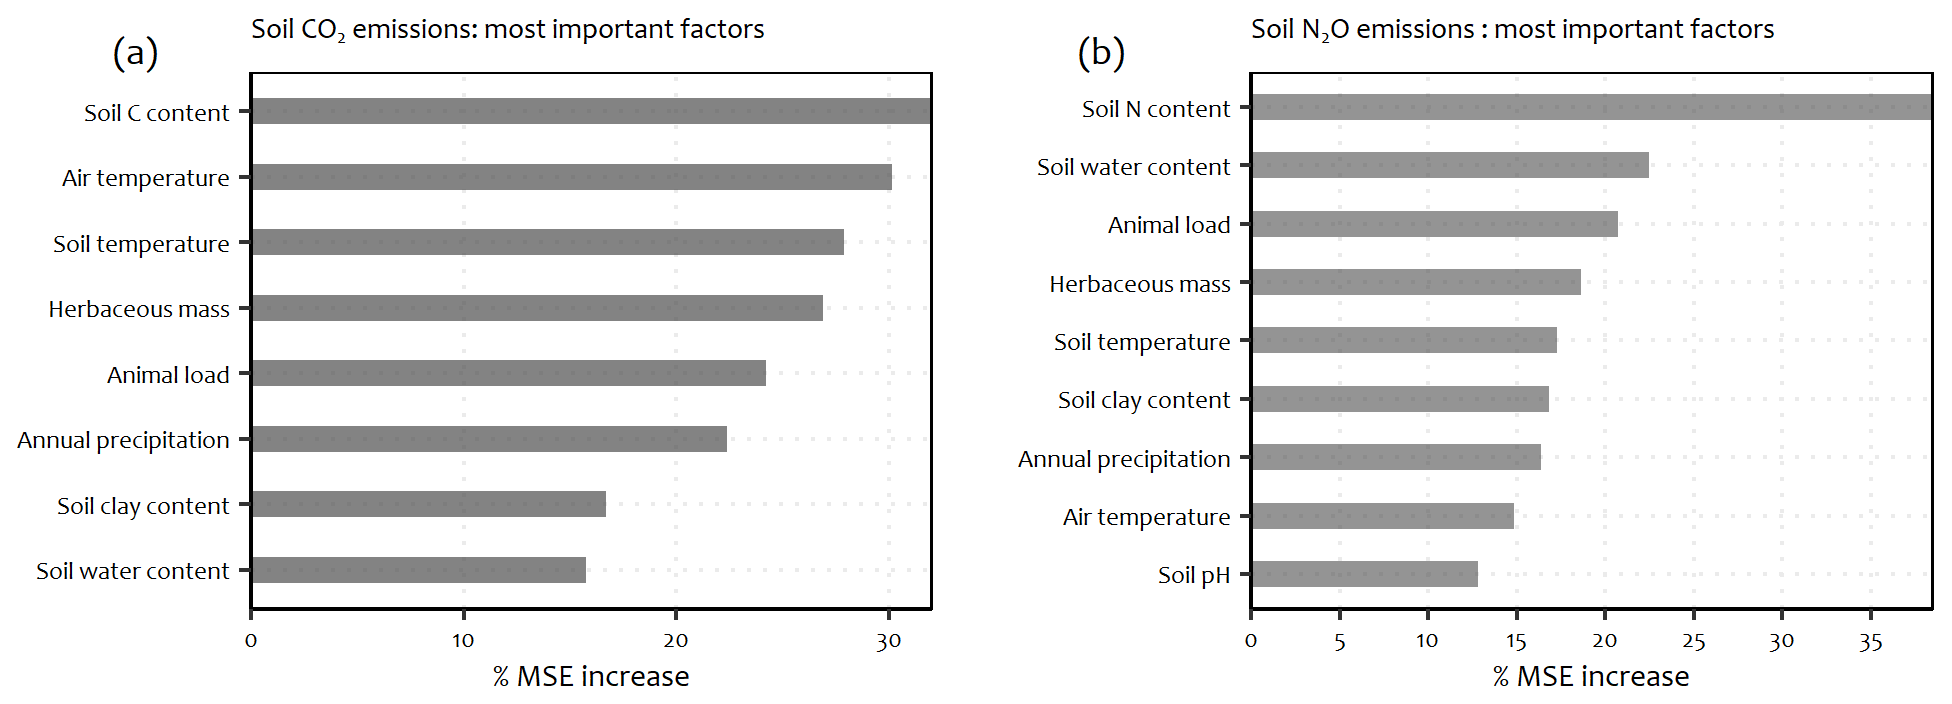
Figure 6Factors controlling the spatial changes in (a) soil CO2 emissions and (b) soil N2O emissions from random forest analysis. MSE is the mean squared error.
3.2.4 Annual budgets across the Sahel (2012–2022)
The simulated soil CO2 emissions include both microbial respiration and root respiration of herbaceous vegetation. Between 2012 and 2022, the estimated average soil CO2 emissions in the Sahelian SPSs were 58.79 ± 4.83 Tg CO2-C yr−1 (1 Tg = 1012 g). The highest annual soil CO2 emissions (65.80 Tg CO2-C yr−1) were found in 2020, while the lowest (50.77 Tg CO2-C yr−1) were in 2012 (Fig. 7a). During this same period, the mean soil N2O emissions were 21.59 ± 3.91 Gg N2O-N yr−1 (1 Gg = 109 g), ranging from 17.31 Gg N2O-N yr−1 in 2012 to 27.43 Gg N2O-N yr−1 in 2020 (Fig. 7b). From 2012–2020, annual soil CO2 and N2O emissions showed significant (p < 0.01) rising trends of ± Tg CO2-C yr−1 and ± Gg N2O-N yr−1, respectively. However, emissions dropped after 2021, with a 17.5 % decrease in soil CO2 emissions and a 25.5 % decrease in soil N2O emissions (Fig. 7c). Figure 7c reveals that the interannual variations in soil CO2 and soil N2O emissions are quite homothetic, as indicated by a Pearson correlation coefficient of 0.86. Annual precipitation over the 2012–2022 period averaged over the study domain was significantly correlated to both soil CO2 (p < 0.05, r=0.48) and N2O (p < 0.05, r = 0.79) emissions.
Previous studies at global and regional scales have estimated greenhouse gas (GHG) emissions from various ecosystems, especially agricultural systems (Tian et al., 2020, 2015), forests (Tian et al., 2020; Verchot et al., 1999), and rangelands (Dangal et al., 2020). These studies have frequently highlighted significant uncertainties when estimating emissions from underrepresented regions, such as in Africa. In addition, different modelling techniques often give divergent results when estimating emissions from these regions. In this study, we have scaled up the 1D STEP–GENDEC-N2O model, which was previously used in local studies across various sites in the western Sahel region. For example, in previous studies conducted at a SPS located in the northern region of Senegal (Dahra; 15° 24′10′′ N, 15° 25′56′′ W), Bigaignon et al. (2020) effectively used STEP–GENDEC-N2O to satisfactorily simulate soil water content (R2 = 0.68 and RMSE = 1.67 mm d−1), NO content in soil (R2= 0.42 and RMSE = 0.83 mg N kg soil−1), and N2O emissions (R2= 0.36 and RMSE = 2.51 ng N m−2 s−1). At the same site, Agbohessou et al. (2023a) successfully simulated CO2 fluxes using STEP–GENDEC-N2O combined with a tree growth model (DynACof; Vezy et al., 2020), achieving convincing results for gross primary productivity (GPP; EF = 0.49 and RMSE = 2.15 g C m−2 d−1) and ecosystem respiration (Reco; EF = 0.56 and RMSE = 1.34 g C m−2 d−1). Additionally, Delon et al. (2019) demonstrated successful simulation of soil respiration at the same site using STEP–GENDEC-N2O. At another SPS located in Mali (Agoufou; 15.34° N, 1.48° W), Delon et al. (2015) employed STEP–GENDEC-N2O to simulate soil moisture (R2= 0.7), soil temperature (R2= 0.86), and herbaceous mass (R2= 0.72), yielding satisfactory results. Building upon these previous local applications and validations of the STEP–GENDEC-N2O model in different representative sites of the Sahelian SPSs, we provide the first large-scale estimate of soil CO2 and N2O emissions from western Sahelian SPSs.
In this section, we discuss the magnitude of soil CO2 and N2O emissions reported in this study, the role of environmental and biological factors that drive the spatial heterogeneity observed in soil CO2 and N2O emissions in Sahelian SPSs, and the uncertainties and limitations associated with these estimations.
4.1 Spatial and temporal patterns of herbaceous vegetation, soil CO2 emissions, and their relationship
In a previous study, Pierre et al. (2016) demonstrated the ability of the STEP model (alone) to simulate the dynamics of herbaceous vegetation at regional scale in the western Sahel. They found good agreement between the regional spatial patterns of STEP-simulated vegetation masses and the Moderate Resolution Imaging Spectroradiometer (MODIS) vegetation indices. They observed a latitudinal gradient in herbaceous vegetation mass caused by the rainfall gradient, as is also shown in our results. The magnitudes of herbaceous mass in their study and ours are comparable, and the spatial patterns are similar, although the study periods and the input data employed are not exactly the same. Previous estimates of mass production in the Sahel using the LandscapeDNDC model (Rahimi et al., 2021) exhibited relatively stable temporal dynamics in mass production from 2010 to 2019. These estimates encompassed all land use types in the Sahel region, which could explain the divergence from our results, showing a gradual increase in mass production in Sahelian SPSs between 2012 and 2022. Moreover, the trend observed in this study is mainly driven by the most recent years, with the highest values occurring in 2019, 2020, and 2021. We compared the aboveground herbaceous mass (ABG) simulated by STEP–GENDEC-N2O with the ABG biomass product from ACF (Bernard and Fillol, 2020, 2021; Lambert et al., 2019) for SPS pixels only (Fig. 8). This revealed a significant correlation between the ABG herbaceous mass simulated by STEP–GENDEC-N2O and the ACF biomass product (with an R2 value of 0.61 and an RMSE of 1.51). The ABG biomass derived from ACF amounts to 7 t DM ha−1 yr−1, whereas the simulated ABG herbaceous mass from STEP–GENDEC-N2O does not exceed 3 t DM ha−1 yr−1. This variation can be attributed to the ACF product being derived from satellite data, encompassing not only herbaceous plants but also the tree and crop component within these SPS-dominated pixels. Additionally, the Monteith formulation (Monteith, 1972) used by ACF approaches potential biomass and therefore corresponds more to the upper bound of the STEP–GENDEC-N2O simulations.
Plant litter is the main source of carbon entering the soil, which explains the similar spatial patterns observed in both annual herbaceous mass (Fig. 2b) and annual soil CO2 emissions (Fig. 4b). This illustrates the effect of the C substrate on CO2 emissions, as confirmed by the random forest analysis (Fig. 6). The size and composition (nature of substrate, molecules, ratio, etc.) of the available carbon pool actually control the magnitude of the CO2 emissions from soil (Barnard et al., 2020). Soil CO2 emissions include the respiration of soil microorganisms (microbial or heterotrophic respiration) and plant roots (autotrophic respiration), including all respiratory processes occurring in the rhizosphere (Raich and Potter, 1996; Xu and Shang, 2016). Root cells perform cellular respiration, metabolizing carbohydrates that are sent down from the leaves. Depending on the vegetation density, root respiration can contribute significantly to the total soil respiration (Macfadyen, 1970). In some SPSs in the north-western Sahel (e.g. in Mauritania, Mali, and Niger), we simulated significant soil CO2 emissions despite the low herbaceous mass. These areas also exhibit high interannual variabilities in soil CO2 emissions (Fig. A4b; up to 0.7 t CO2-C ha−1 yr−1). The northern Sahel is generally characterized by a long dry season and very low rainfall. In such semi-arid areas, the first rainfall events at the onset of the wet season rewet the dry soil, resulting in a mineralization peak leading to a large soil CO2 efflux pulse, also known as the Birch effect (Birch, 1958). The STEP–GENDEC-N2O model accounts for this Birch effect (Delon et al., 2019), which could explain the soil CO2 emissions hotspots simulated in some SPSs of the north-western Sahel. The site (simulation pixel) located at a latitude of 15.4° N and longitude of 15.4° W (0.1°×0.1°), as depicted in Fig. 5, actually illustrates the Birch effect in soil respiration dynamics, with notably high emissions simulated at the onset of the rainy seasons. This simulation pixel encompasses the Dahra site in northern Senegal (latitude 15.40277° N, longitude 15.43222° W), where the 1D STEP–GENDEC-N2O model results were in good agreement with observations (Agbohessou et al., 2023a; Delon et al., 2019). According to Fan et al. (2015), up to 20 % of the annual soil CO2 emissions into the atmosphere occurs in African savanna ecosystems following intense rainfall. The CO2 pulses associated with rewetting can represent a large part of the annual C budget in semi-arid and arid ecosystems (Barnard et al., 2020; Jarvis et al., 2007; Ma et al., 2012; Rey et al., 2017).
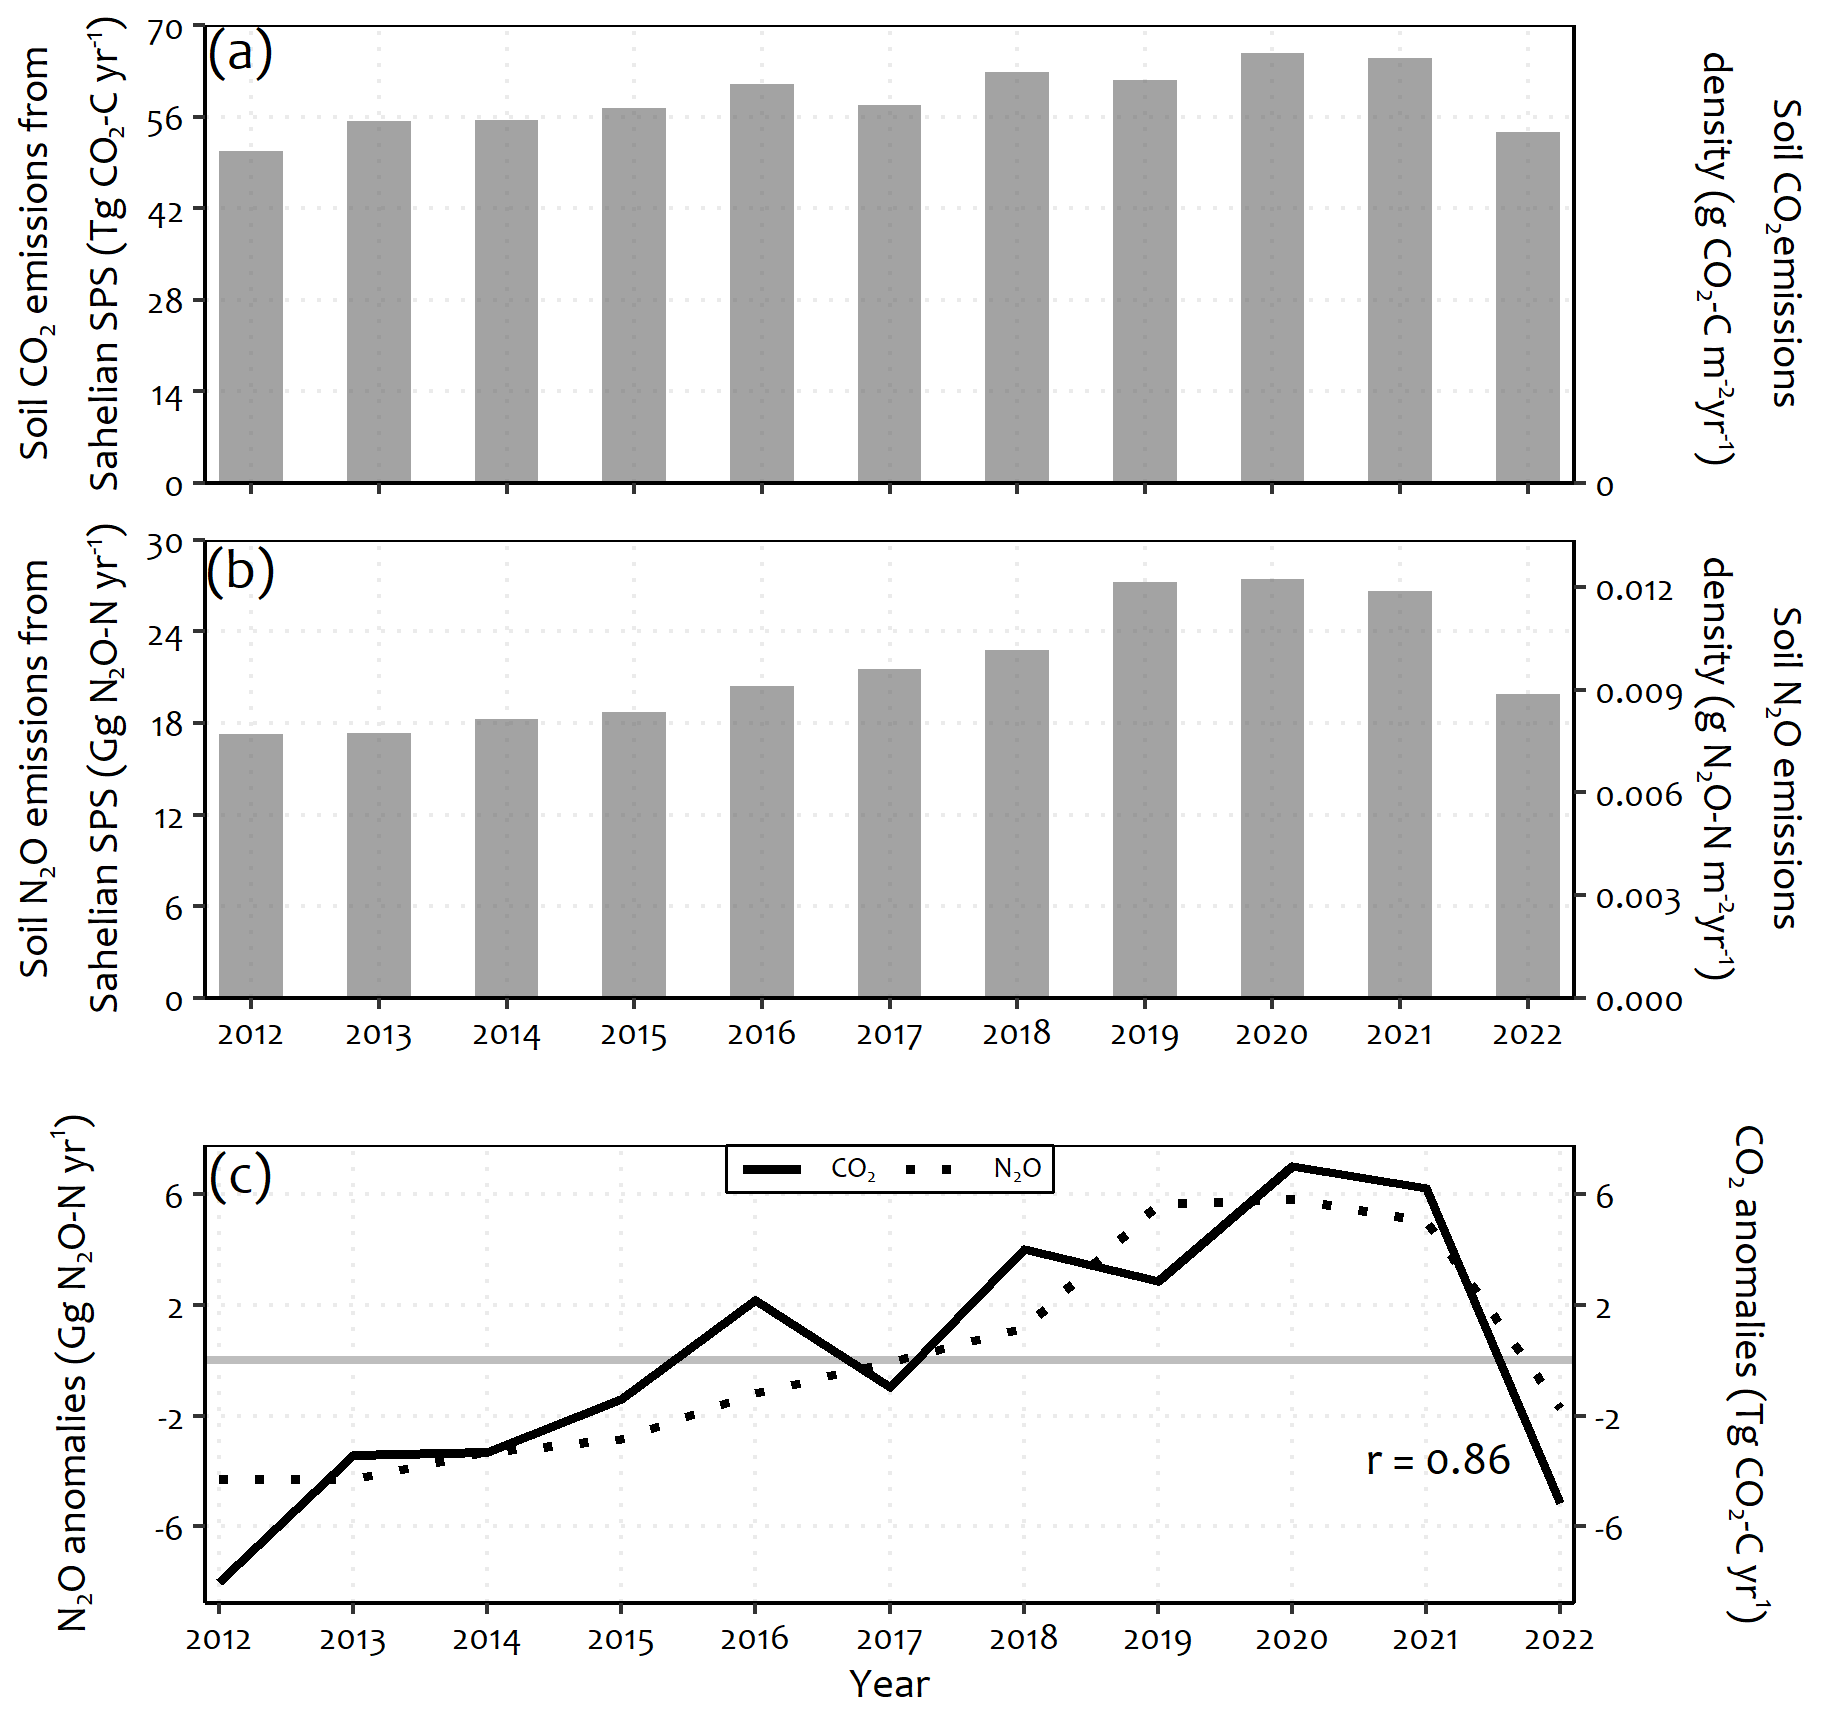
Figure 7Interannual variation in soil CO2 and N2O emissions in the Sahelian SPSs (which cover approx. 892 000 km2) during 2012–2022. (a) Soil CO2 emissions in Tg C yr−1 (1 Tg = 1012 g) and (b) soil N2O emissions in Gg C yr−1 (1 Gg = 109 g). (c) Interannual variations in soil CO2 and N2O anomalies (relative to the mean value for the period 2012–2022). The Pearson correlation coefficient between CO2 and N2O anomalies was 0.86. We calculated the proportion of SPS area pixels within each 0.1° × 0.1° simulation grid cell and used these values to weight the model outputs for each grid cell.
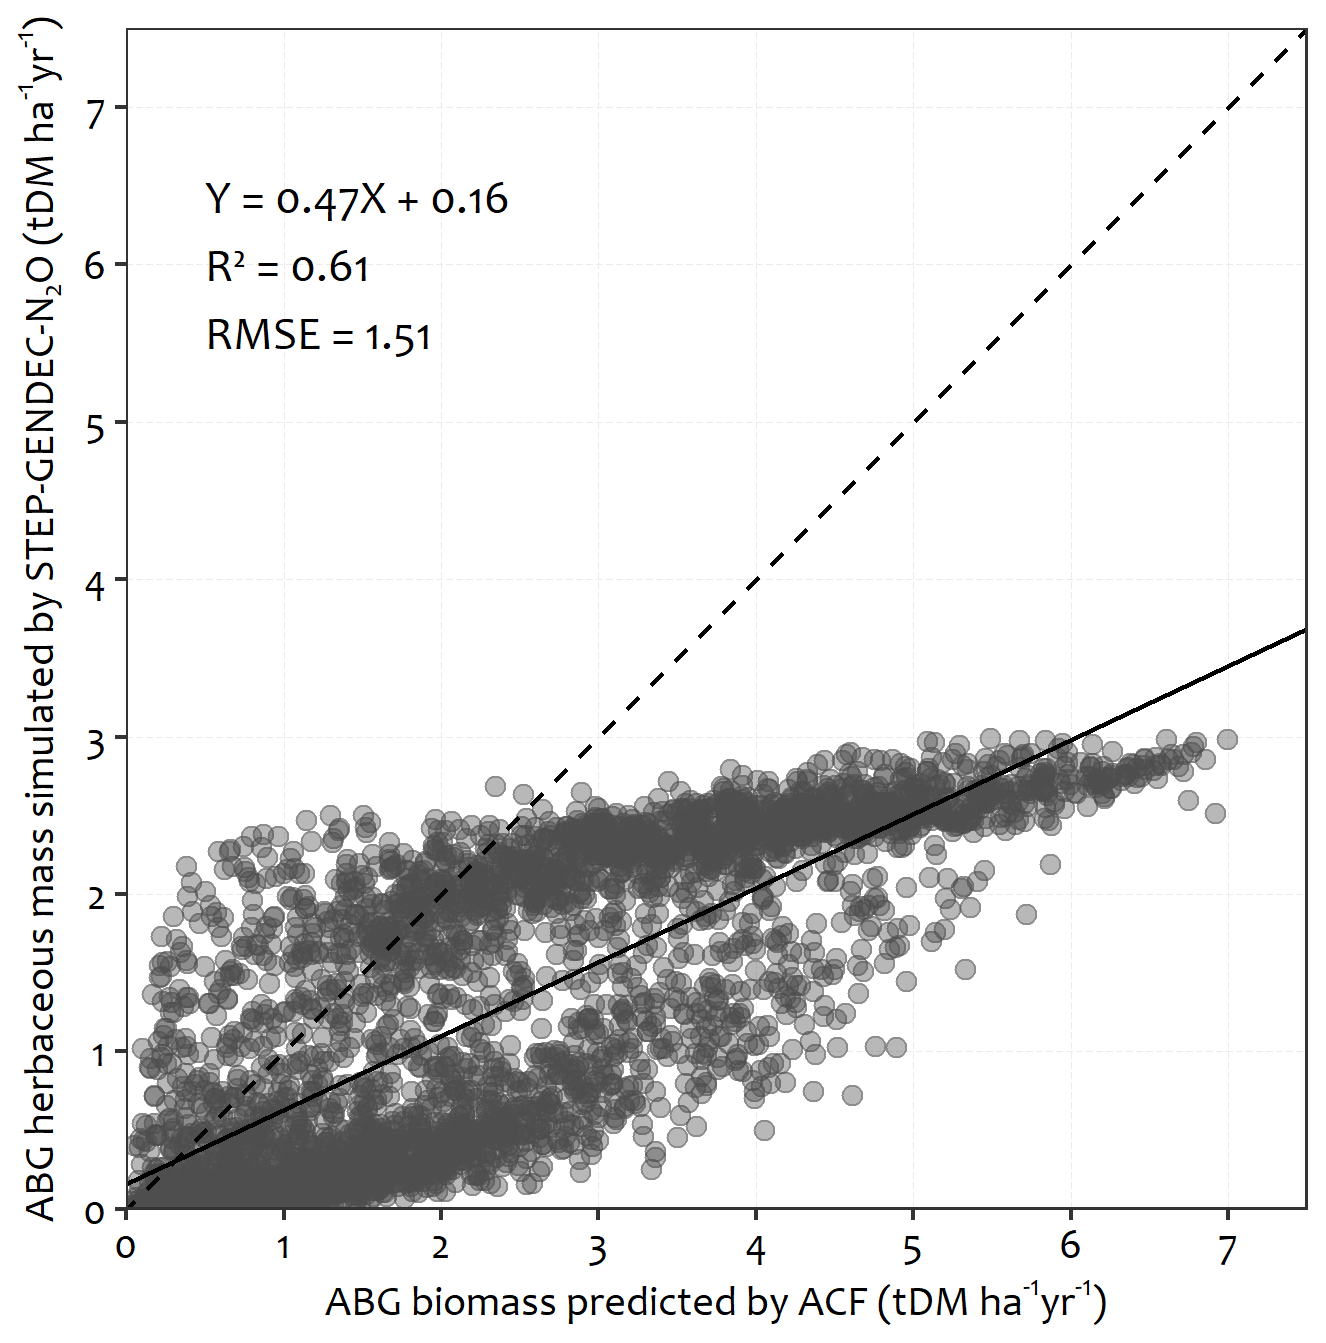
Figure 8The relationship between aboveground (ABG) herbaceous mass simulated by STEP–GENDEC-N2O and ABG biomass predicted by ACF (Bernard and Fillol, 2020, 2021; Lambert et al., 2019). Each point represents the annual mean biomass in a simulation pixel. The dashed line represents the 1:1 line, while the solid line depicts the linear regression line.
In an SPS located in northern Senegal, Delon et al. (2017) measured soil respiration ranging from 2.4 ± 0.62 g C m−2 d−1 at the onset of the wet season to 0.7 ± 0.01 g C m−2 d−1 at the end of the wet season in 2013. Our estimated mean soil CO2 emission density for Sahelian SPSs between 2012 and 2022 (0.06 g C m−2 d−1) is lower than estimates at the global scale for grasslands (2.2 g C m−2 d−1) and partially vegetated deserts (1.0 g C m−2 d−1) by Xu and Shang (2016). On a global scale, for these types of grasslands, the substrate (soil C content) is probably much more important than in SPSs, which explains the higher values of CO2 emissions. Our simulated soil CO2 emissions for our region are also lower than the estimates by Warner et al. (2019). The soil CO2 emissions (soil respiration) calculated for our region (our simulation grid cells) from the Warner et al. (2019) product indicate values as high as 7.8 t C ha−1 yr−1, whereas the simulated soil CO2 emissions from STEP–GENDEC-N2O do not exceed 2 t C ha−1 yr−1. These differences can be explained by the following points. (i) The Warner et al. (2019) product is a one-time prediction based on input data from 1 January 1963 to 31 December 2011, while our simulated soil CO2 emissions used for comparison represent the annual mean of the period from 2012 to 2022. (ii) We used a process-based model (STEP–GENDEC-N2O), while the soil CO2 emissions (soil respiration) predicted by Warner et al. (2019) are based on a machine learning approach, specifically a quantile regression forest model. This model was trained using selected environmental predictors and 2657 input soil respiration observations from the global soil respiration database (SRDB; Bond-Lamberty and Thomson, 2010). (iii) The SRDB database used by Warner et al. (2019) does not contain measurements from sites located in our region (the simulation area). Additionally, Warner et al. (2019) mentioned that the greatest prediction uncertainties were observed in semi-arid ecosystems.
4.2 Soil N2O and CO2 emissions in Sahelian SPSs and the importance of livestock
Between 2012 and 2022, the simulated soil N2O emissions from Sahelian SPSs were 0.022 ± 0.004 Tg N2O-N yr−1. The regional natural soil N2O emissions in Africa were estimated at 1.6 Tg N2O-N yr−1 for the period 2007–2016 (Tian et al., 2020). The simulated average soil N2O emissions from Sahelian SPSs were lower than the median total N2O emissions of 0.05 Tg N2O-N yr−1 from bomas (a livestock enclosure where livestock excreta accumulates) in sub-Saharan Africa's semi-arid and arid climates (Butterbach-Bahl et al., 2020). The average soil N2O emission density (per unit area) in Sahelian SPSs (2012–2022) was found to be 0.01 g N2O-N m−2 yr−1 (range – 0–0.23 g N2O-N m−2 yr−1), which is comparatively lower than the average estimate in tropical regions (0.11±0.02 g N2O-N m−2 yr−1) and than the global average (≈ 0.05 g N2O-N m−2 yr−1) reported for the period of 2007–2016 (Tian et al., 2019). The soil N2O emission density in Sahelian SPSs (2012–2022) was also lower than global emission densities estimated in croplands (0.21 ± 0.08 N2O-N m−2 yr−1) and other ecosystems (0.06 ± 0.01 g N2O-N m−2 yr−1), respectively, during the period of 2007–2016 (Tian et al., 2019). The most significant soil N input in Sahelian SPSs actually originates from livestock excreta, which is lower than the N input in most fertilized agricultural fields (Dangal et al., 2020), explaining the lower emission density in SPSs compared to the global average emission density in croplands. In fact, studies have shown that nitrogen fertilizer application in croplands is the leading factor responsible for the increases in emissions from agriculture (Cao et al., 2018; Davidson, 2009; Maavara et al., 2019; Shcherbak et al., 2014; Yao et al., 2020), followed by a minor yet significant rise in emissions from livestock manure (Tian et al., 2020). But on the other hand, in regions where very little nitrogen fertilizer is used in cropland, such as in Africa, soil N2O emissions mainly arise from livestock manure deposited in pastures and rangelands (Butterbach-Bahl et al., 2020; Dangal et al., 2020; Xu et al., 2019). This confirms the N2O emission hotspots simulated in locations where the density of livestock is high (Figs. 4c and d, A3f), as was also highlighted by the random forest analysis. Indeed, the animal load distribution also affects the spatial distribution of soil N2O and CO2 emissions, as shown in Fig. 6. Several authors have already mentioned this impact (Assouma et al., 2017; Butterbach-Bahl et al., 2020; Dangal et al., 2020; Smith et al., 2003). Livestock influences the spatial distribution of soil C and N, which in turn significantly affects soil N2O and CO2 emissions.
4.3 Common features of soil CO2 and N2O emissions in Sahelian SPSs
Figure 7c shows that the interannual variations in soil CO2 and soil N2O emissions are quite homothetic, as indicated by a Pearson correlation coefficient of 0.86. This suggests that they are both responding in a similar manner to the different ecological drivers. Some authors stated that the main processes responsible for CO2 (decomposition) and N2O (nitrification and denitrification) emissions from soils are influenced by the same environmental factors, namely soil moisture, soil temperature, soil texture, and soil C and N content (Davidson and Swank, 1986; Oertel et al., 2016; Rastogi et al., 2002; Signor and Cerri, 2013). Several studies have shown how soil CO2 and N2O emissions evolve over time in response to changes in environmental driving factors (Cuhel et al., 2010; Davidson and Swank, 1986; Khalil, 2003; Ray et al., 2020), but the complexity of the interactions between these different factors makes it difficult to assess the importance of each driver responsible for the spatial distribution of the emissions. From our results, the main factor responsible for the spatial distribution of soil CO2 and N2O emissions in SPSs (Fig. 6) is substrate availability (soil C and N content), which outweighs other factors such as soil water content, temperature, and soil texture. Moreover, substrate availability is directly linked to herbaceous mass productivity (as mentioned in Sect. 4.1) and to animal load (see Sect. 4.2). This is consistent with the findings of Ray et al. (2020), who showed that soil CO2 emissions are affected more by substrate availability than by rainfall, although their experiment was performed in a cropping system. In addition to influencing the spatial pattern of soil CO2 and N2O emissions, soil C and N also impact the temporal variation in these emissions, as shown in Fig. 5 where the largest emissions were found where the C content was the highest. Furthermore, our simulations revealed a rise in emissions between 2012 and 2020 (Fig. 7c) that is correlated to the increase in herbaceous mass during the same period (Fig. 3a). Indeed, the results produced by the random forest approach (Fig. 6) confirm our expectations that the soil C and N content are the primary factors influencing the spatial distribution of CO2 and N2O emissions from soils. The RF classification may solely have originated from the hypothesis and the structure of the STEP–GENDEC-N2O model if we were working at a local scale. However, since we are operating at a regional scale and the data inputted into the RF model reflect the spatial distribution of the explored factors in the region, we can attribute the RF classification, our result (Fig. 6), to a combination of the STEP–GENDEC-N2O model structure and the specific biophysical/edaphic conditions prevalent in the Sahelian band under investigation.
In the literature, soil water content is often highlighted as the major driver of the temporal variation in soil N2O emissions, as it regulates oxygen availability to soil microbes (Butterbach-Bahl et al., 2013; Davidson and Verchot, 2000). The effect of soil moisture is actually predominant in denitrification processes, which lead to large amounts of N2O emissions when water-filled pore space (WFPS) in the soil reaches 70 % to 80 % (Davidson and Verchot, 2000). This is consistent with the result of our RF analysis, which ranks soil water content as the second-most important factor responsible for spatial changes in soil N2O emissions (Fig. 6b). The impact of air temperature and soil temperature on the spatial distribution of soil CO2 emissions suggests a positive feedback loop between climate warming and these emissions. The impact of global change drivers, such as temperature on ecosystem processes and greenhouse gas emissions, have been well studied and proven (Aulakh et al., 1992; Bajracharya et al., 2000; Lloyd and Taylor, 1994; Ray et al., 2020). The annual budgets of CO2 and N2O emissions (Fig. 7a and b) throughout the period of simulation show low interannual variability. This can be attributed to the low interannual variability in influencing factors such as substrate availability (C – 33.60 ± 2.38 g C m−2 d−1 and N – 5.89 ± 0.46 g N m−2 d−1), and soil water content (4.87 ± 0.19 % yr−1). Our simulation results do not allow us to explore possible interactions between climate warming and annual soil CO2 and N2O emissions, as the average annual air temperature (averaged over the study domain) did not vary much over the simulation period (28.37 ± 0.25 °C). Regional-scale observations show a temperature increase ranging from 1 to 2 °C between 1950 and 2010 (Guichard et al., 2020). Therefore, over a 10-year period, this corresponds to a maximum increase of approximately 0.33 °C, which is less than 0.5 °C. This order of magnitude is comparable to the one computed for air temperature from the climate dataset used, and it is too small to be detected by the temperature-versus-time regression.
4.4 Uncertainties and limitations
The lack of a comprehensive dataset on the annual spatial distribution and growth dynamics of the livestock population in the Sahel between 2012 and 2022 remains a significant source of uncertainty in the CO2 and N2O emissions reported in this study. Actually, information on the spatial distribution and population of livestock was only available for the year 2010 (Gilbert et al., 2018). Only the spatial and seasonal variability in the grazing pressure was taken into account in our simulation. We assumed that the annual distribution and growth dynamics of livestock in Sahelian SPSs did not change significantly between 2010 and 2022, although they might have been affected by the interannual variability in herbaceous mass. Given the significant impact of livestock on CO2 and N2O emissions in these ecosystems (Agbohessou et al., 2023a; Assouma et al., 2017; Soussana et al., 2010; Valentini et al., 2014), an increase in livestock population during the study period could result in the misestimation of soil CO2 and N2O emissions. Significant changes in the spatial distribution of animal load from one year to another could also lead to some uncertainties in the simulated spatial distribution of the emissions. Furthermore, it is worth noting that our estimate does not account for tree root respiration, which can lead to an underestimation of the total soil CO2 emissions in regions with high tree density.
In a previous study employing the STEP–GENDEC-N2O model at the local scale (within a silvopastoral system located in Senegal), Agbohessou et al. (2023a) conducted an uncertainty analysis for STEP–GENDEC-N2O using a Monte Carlo simulation and a sensitivity analysis with Sobol's method (Sobol, 2001). In this study, they evaluated the overall uncertainty surrounding CO2 and N2O emissions simulated by STEP–GENDEC-N2O and identified the key parameters/variables to which the CO2 and N2O emissions simulated by STEP–GENDEC-N2O are most sensitive. They found that the CO2 and N2O emissions simulated by STEP–GENDEC-N2O at the local scale are particularly sensitive to soil texture. This being the case, another significant source of uncertainty in the CO2 and N2O emissions reported in this study arises from the accuracy of the different input datasets used, especially the soil and precipitation datasets. We used the best dataset available for our region (to our knowledge) for all input variables. However, the accuracy of our estimate also depends on the accuracy of the input datasets used. The choice of the various input datasets in this study is based on expert recommendations, comparison of the results of uncertainty analyses conducted for the different datasets in their respective reference articles, and availability of the datasets for our study region.
Soil C and N contents are significant factors influencing the spatial distribution of soil CO2 and N2O emissions in Sahelian SPSs, as indicated by our RF analysis. However, despite the availability of some local measurement data (Elberling et al., 2003a, b) and databases related to soil C and N content (Hengl et al., 2021) in the Sahel region, accurately assessing the temporal variability in these elements in Sahelian SPS soils remains challenging.
Finally, we assumed that the impacts of natural or anthropogenic disturbances such as wildfires on Sahelian SPSs during our simulation period are fairly negligible. Uncertainties related to disturbances like wildfire are actually difficult to estimate, as there are varying perspectives and conflicting findings in the literature regarding the impact of burning on N2O emissions (Karhu et al., 2015; Takakai et al., 2006).
Our study advances the understanding of the spatial distribution and annual budget of CO2 and N2O emissions from soil in the Sahel. Information on the magnitude of CO2 and N2O emissions from soils in underrepresented areas is important to shed light on the contribution of these areas to the overall GHG budget and thereby inform the development of effective mitigation strategies that can help reduce GHG emissions. SPSs represent a significant portion of the West African drylands, where they have expanded due to global warming and are expected to continue expanding in the near future (Thornton and Herrero, 2015). Previous studies at the local scale in the Sahel have shown that soils in semi-arid ecosystems are notable contributors to GHG emissions (Assouma et al., 2017; Brümmer et al., 2009; Delon et al., 2017). Our results extended these local estimates to a broader spatiotemporal scale, showing that overall, Sahelian SPS soil emits less CO2 and N2O than tropical areas and croplands on a global scale. Furthermore, by mapping emissions, we provided crucial insights into the localization of soil CO2 and N2O emission hotspots, thereby offering indirect assessments of soil health in the Sahel region. This information can be a valuable asset for land managers who can leverage it to devise and implement effective strategies aimed at minimizing emissions and fostering carbon sequestration.
To further refine estimates of soil CO2 and N2O emissions in Sahelian SPSs, efforts to collect comprehensive datasets of livestock spatial distribution and temporal dynamics, tree densities, and fire are needed. Additionally, more experimental studies should investigate the roles of nitrification and denitrification processes in soil N2O emissions and the role of the decomposition process in CO2 emissions in semi-arid ecosystems to better parameterize the model.
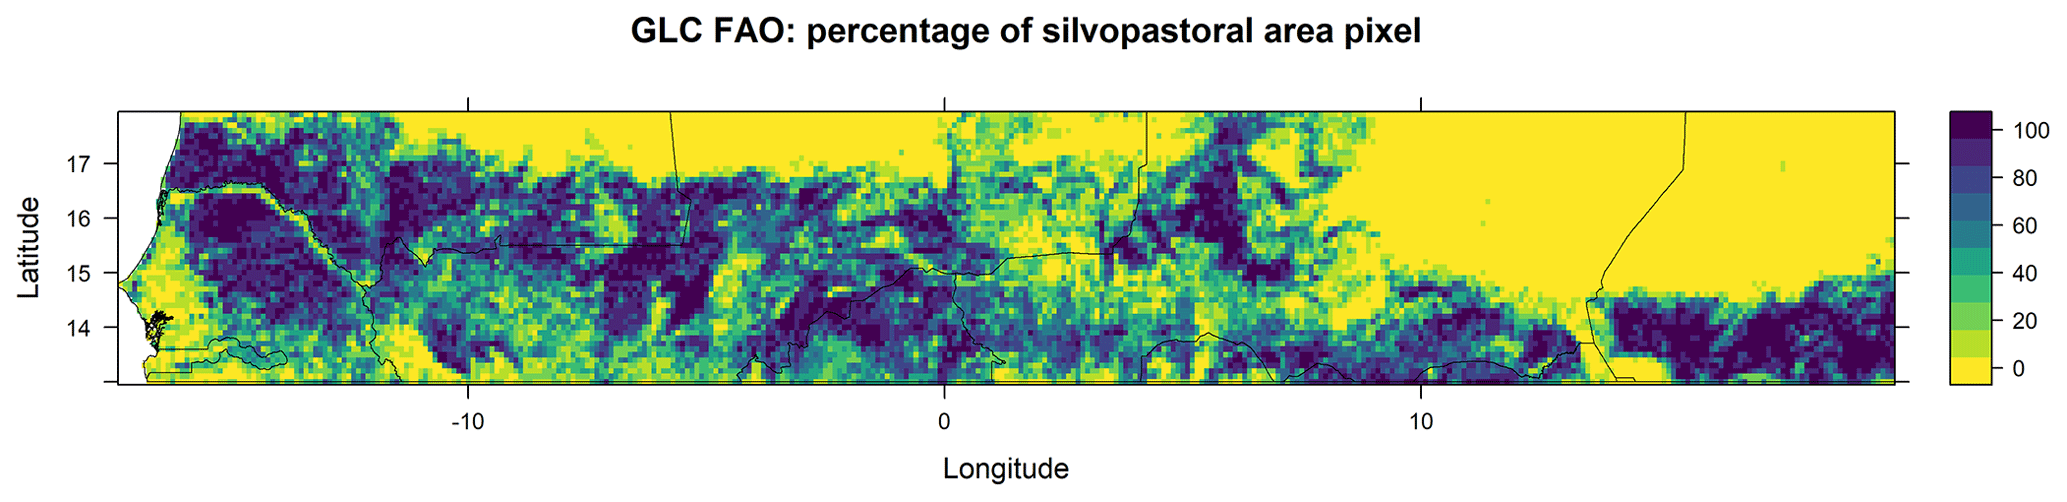
Figure A1Spatial distribution of silvopastoral areas in the Sahel. (Details on how the percentage of silvopastoral area pixels within the simulation grid cells were computed are provided in the Methodology, Sect. 2.4).
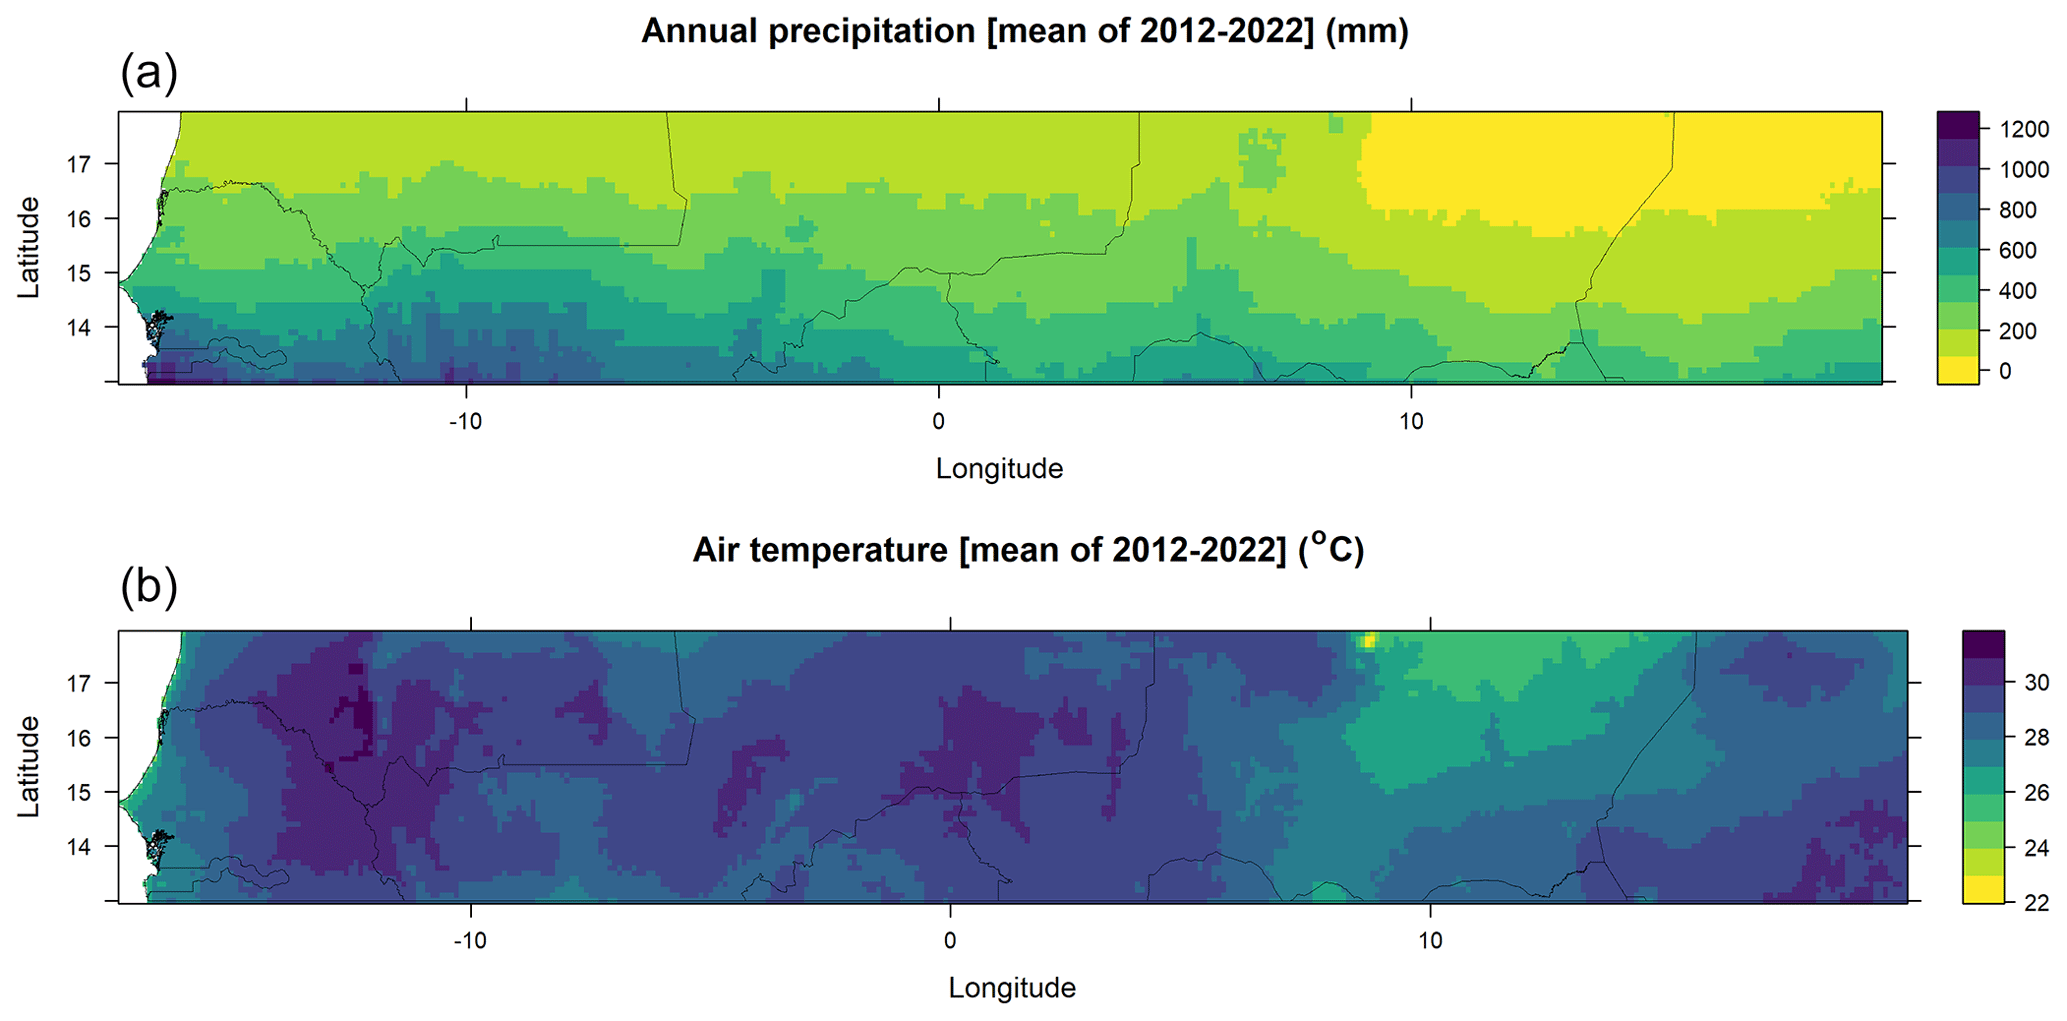
Figure A2Spatial distribution of precipitation and air temperature (mean from 2012–2022).
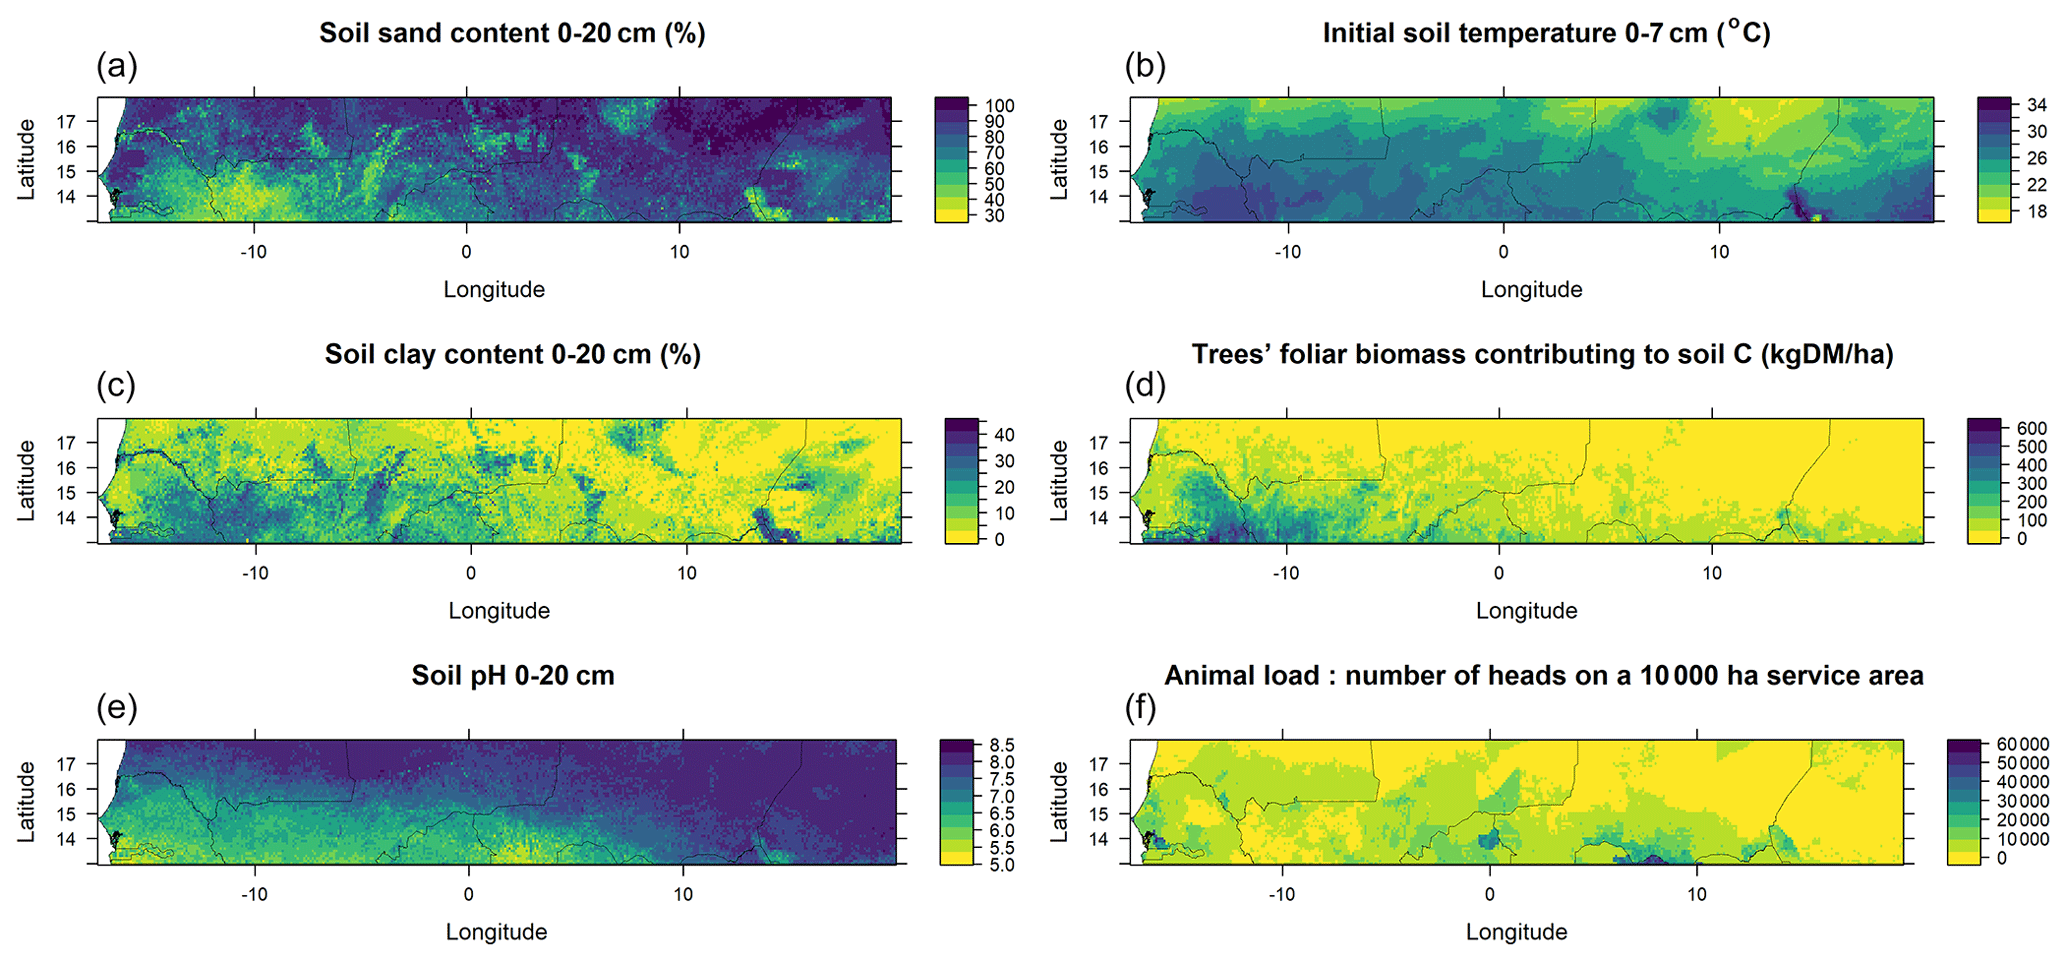
Figure A3Spatial distribution of soil properties, tree foliar biomass, and livestock.
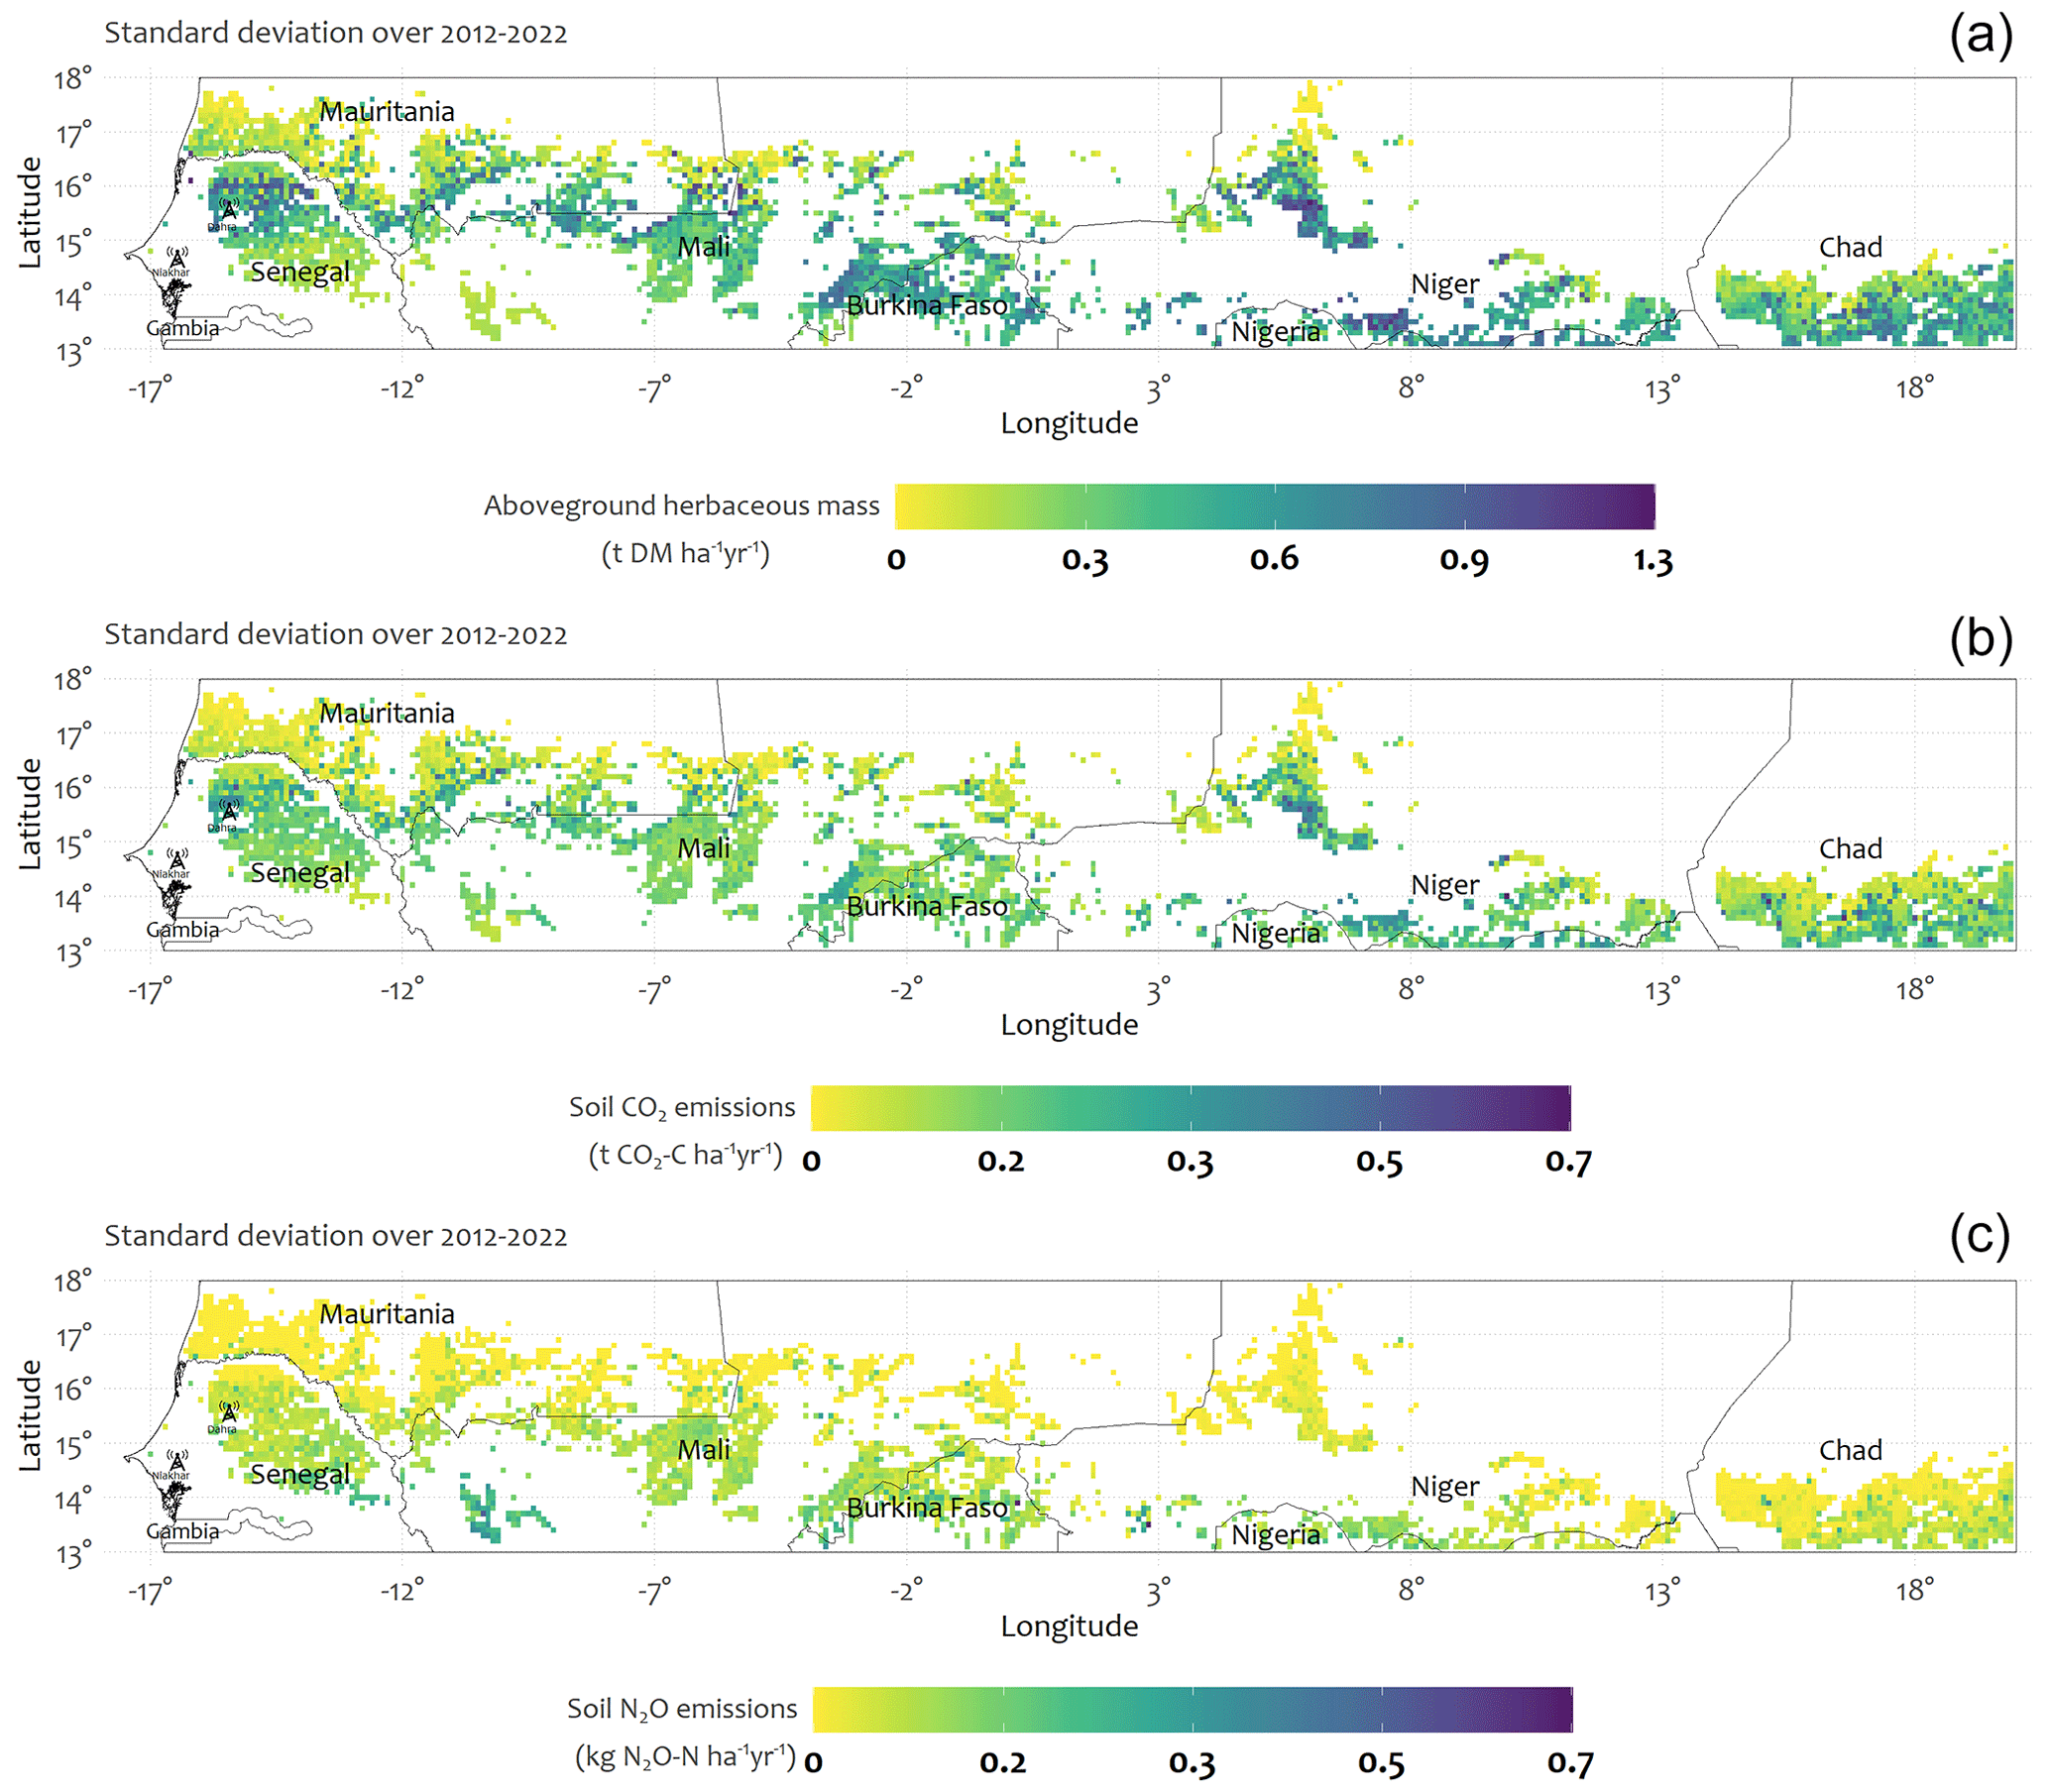
Figure A4Standard deviations of the spatial distributions of (a) herbaceous biomass, (b) soil CO2 emissions, and (c) soil N2O emissions in Sahelian SPSs (from 2012–2022). Only pixels dominated by SPSs (> 80 %) are displayed.
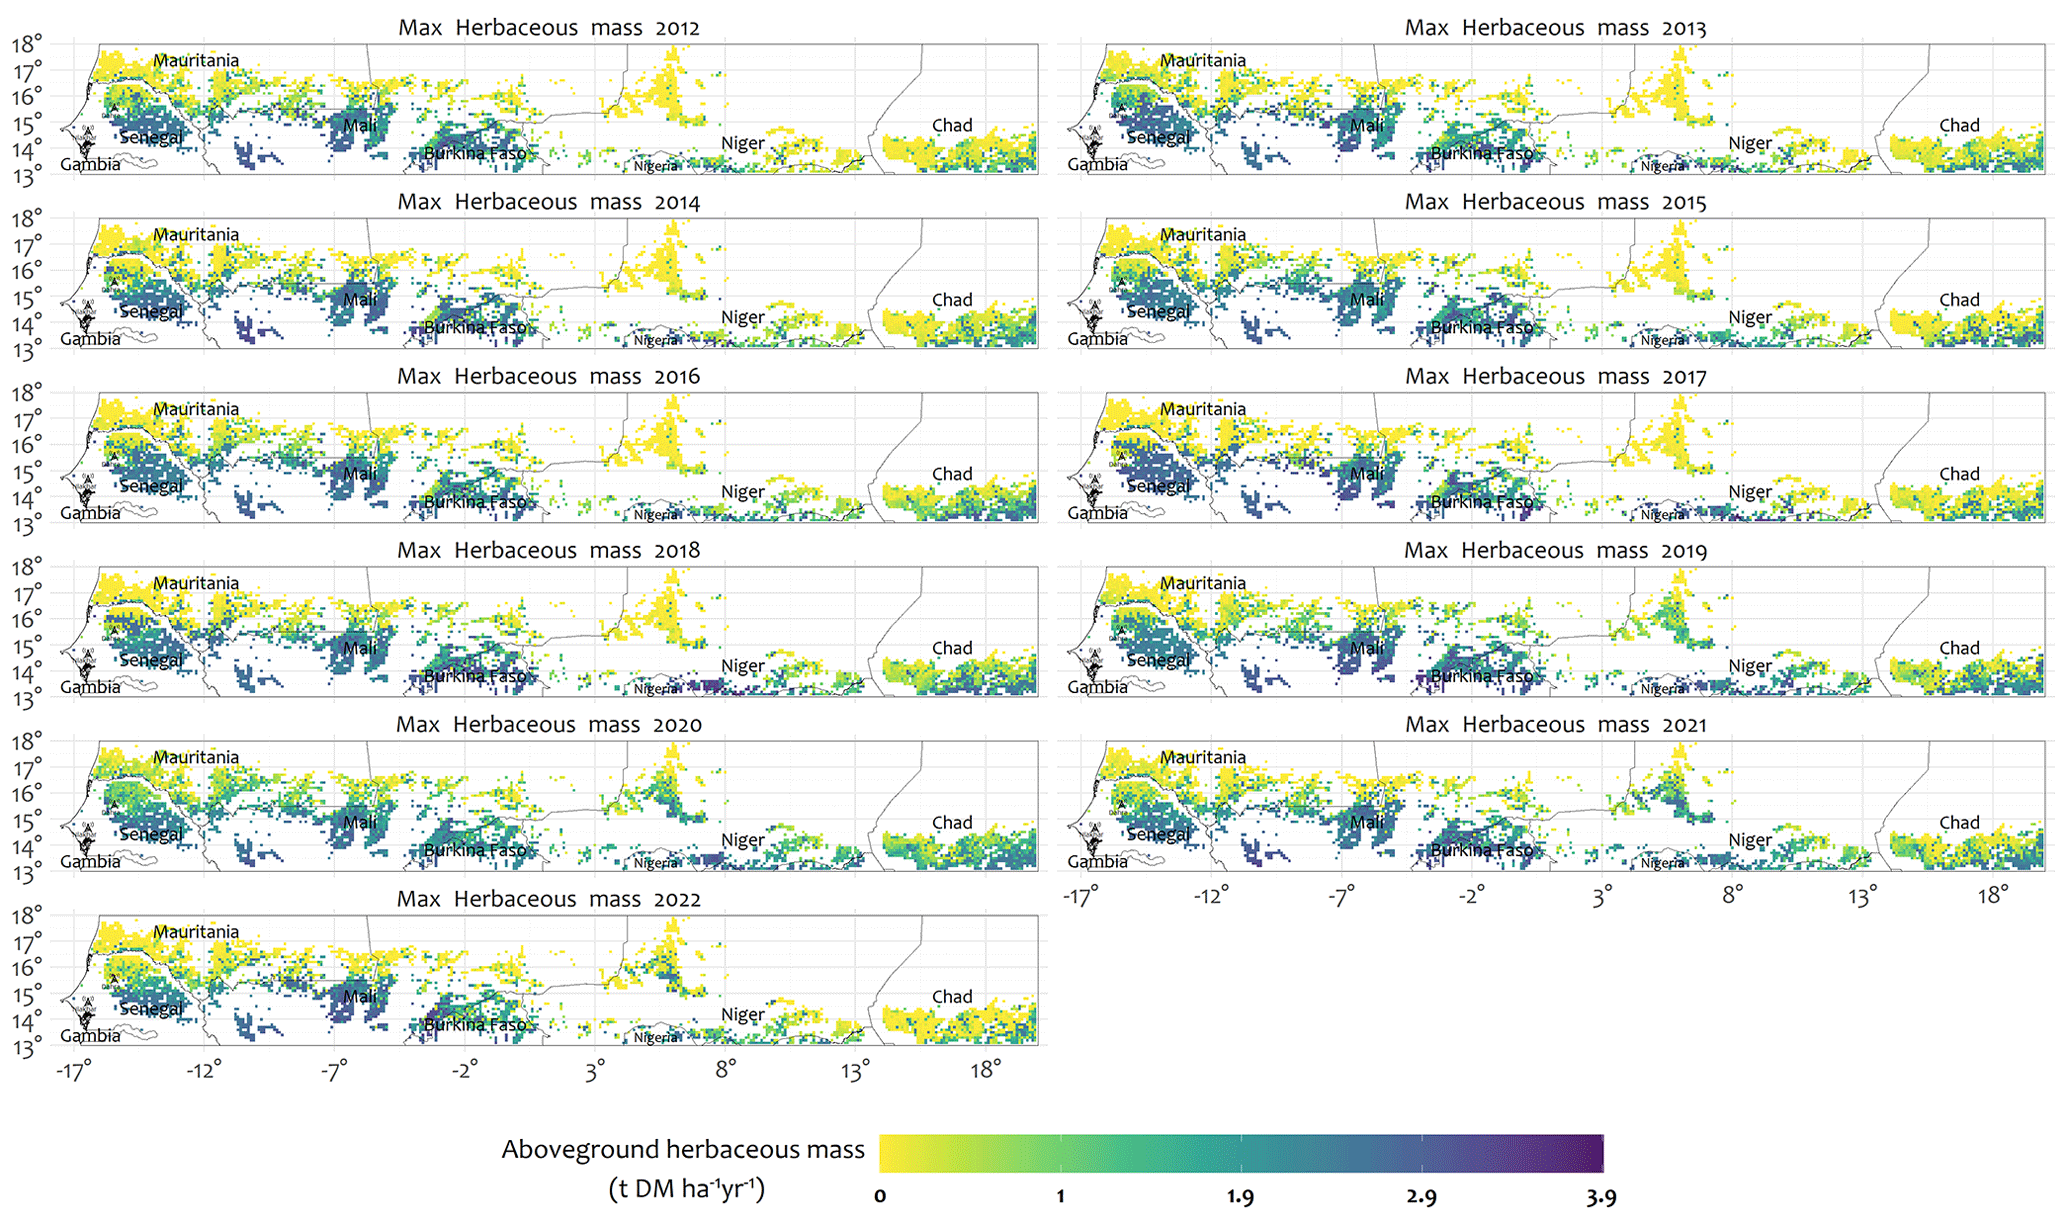
Figure A5Annual spatial distribution of herbaceous biomass in Sahelian SPSs (2012–2022). Only pixels dominated by SPSs (> 80 %) are displayed.
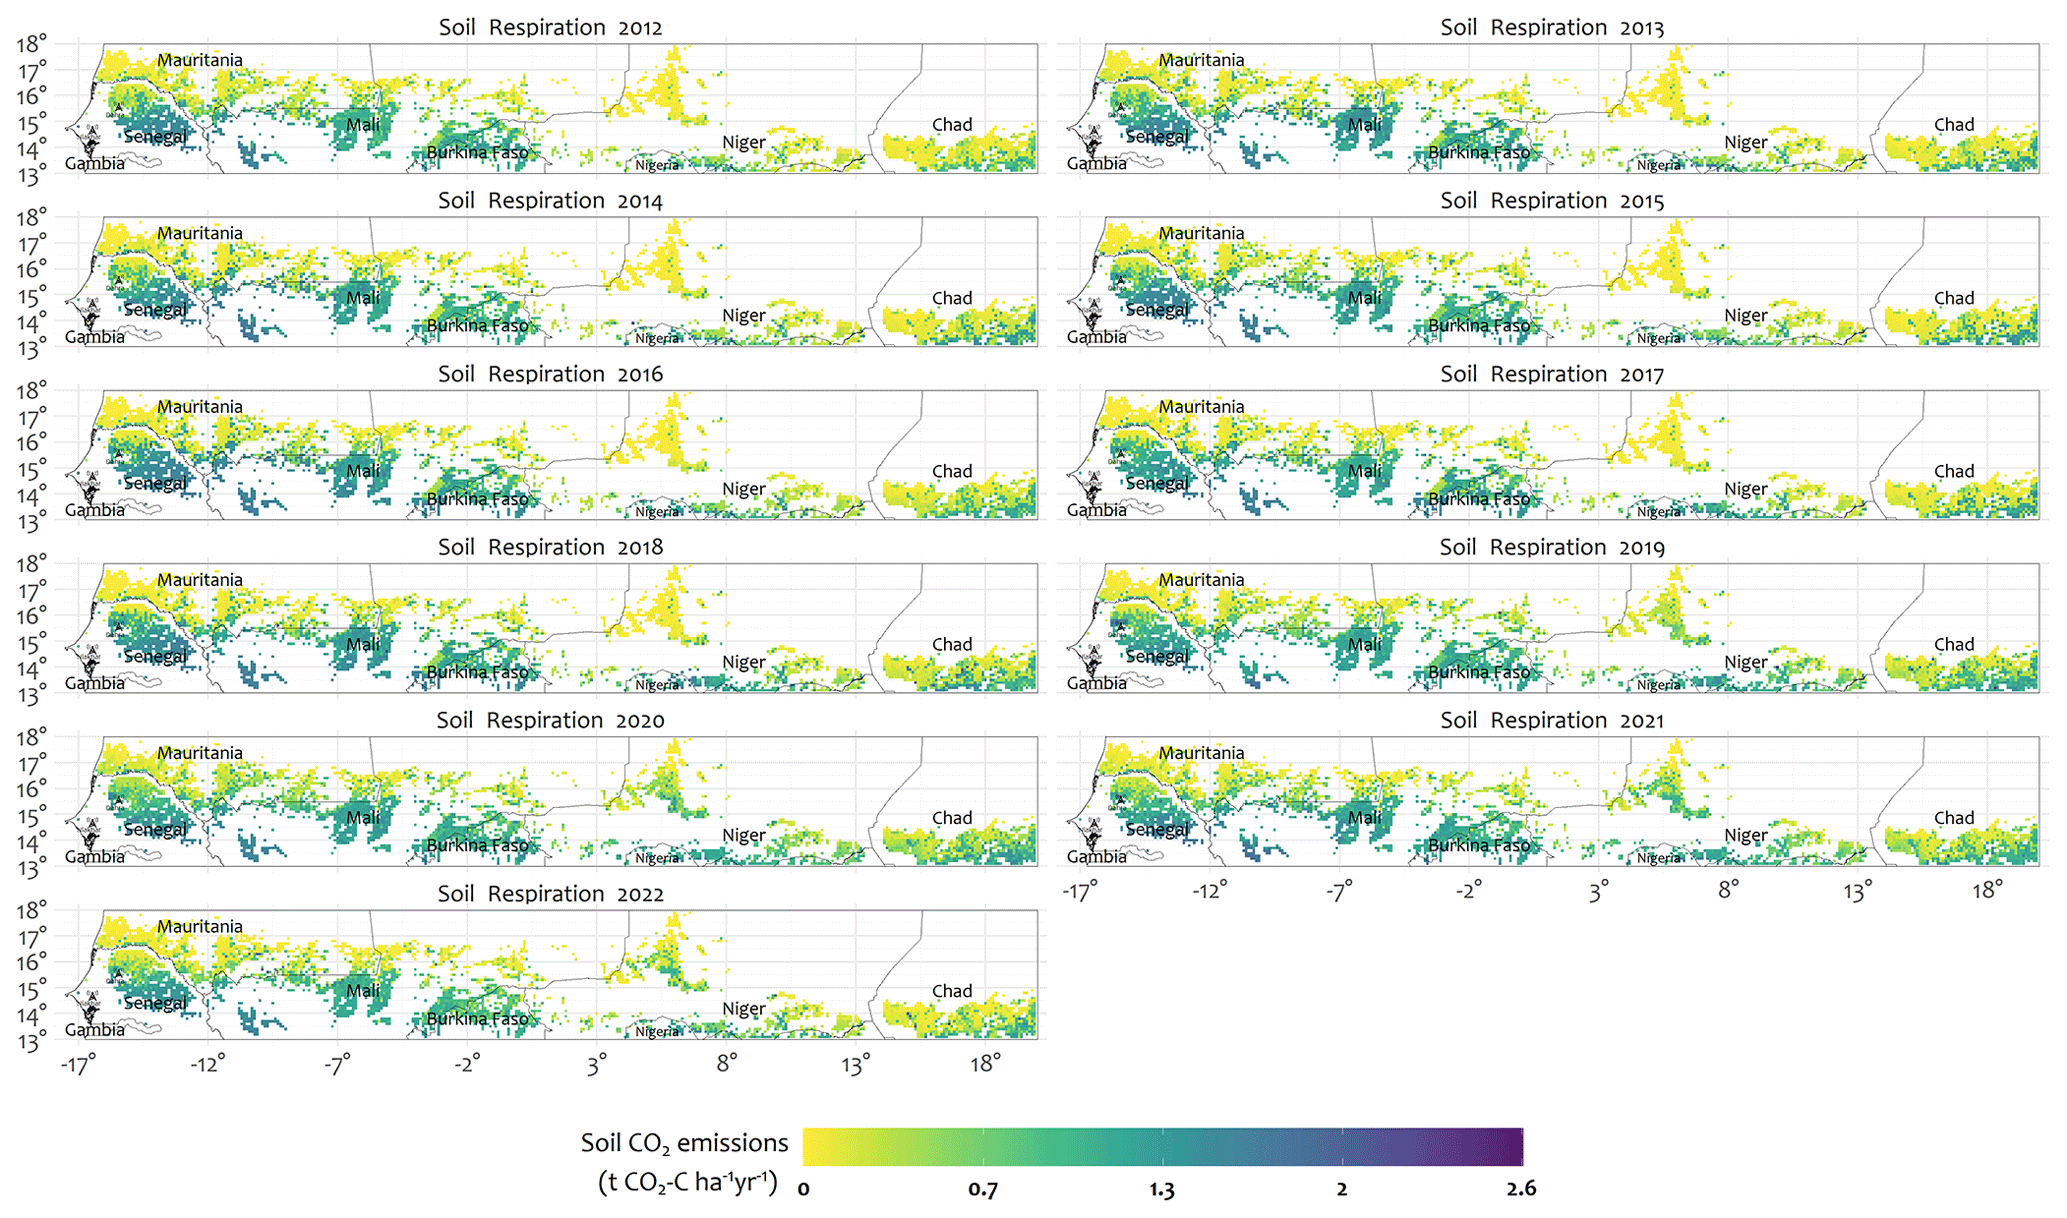
Figure A6Annual spatial distribution of soil CO2 emissions in Sahelian SPSs (2012–2022). Only pixels dominated by SPSs (> 80 %) are displayed.
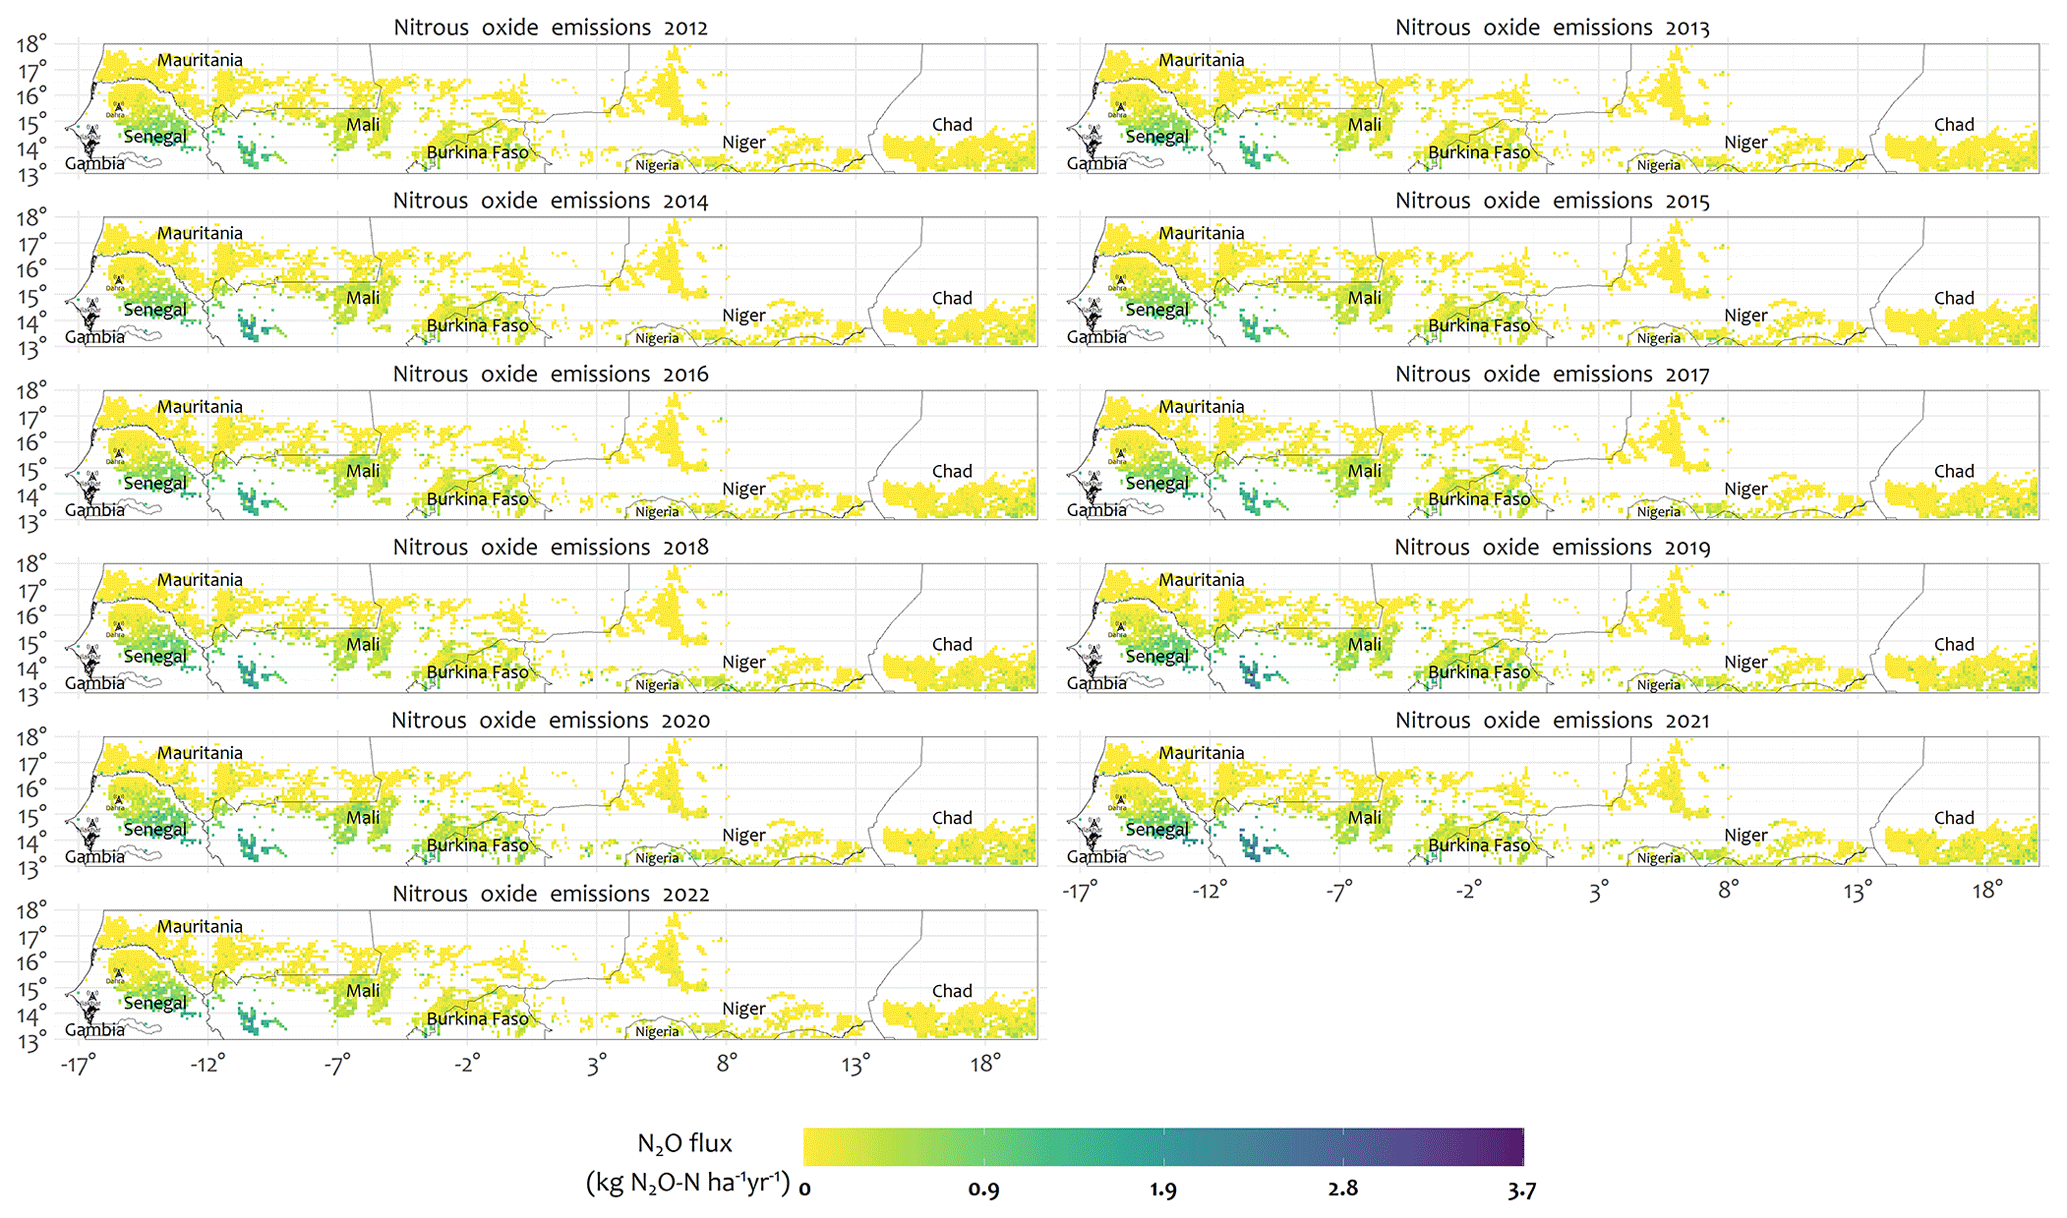
Figure A7Annual spatial distribution of soil N2O emissions in Sahelian SPSs (2012–2022). Only pixels dominated by SPSs (> 80 %) are displayed.
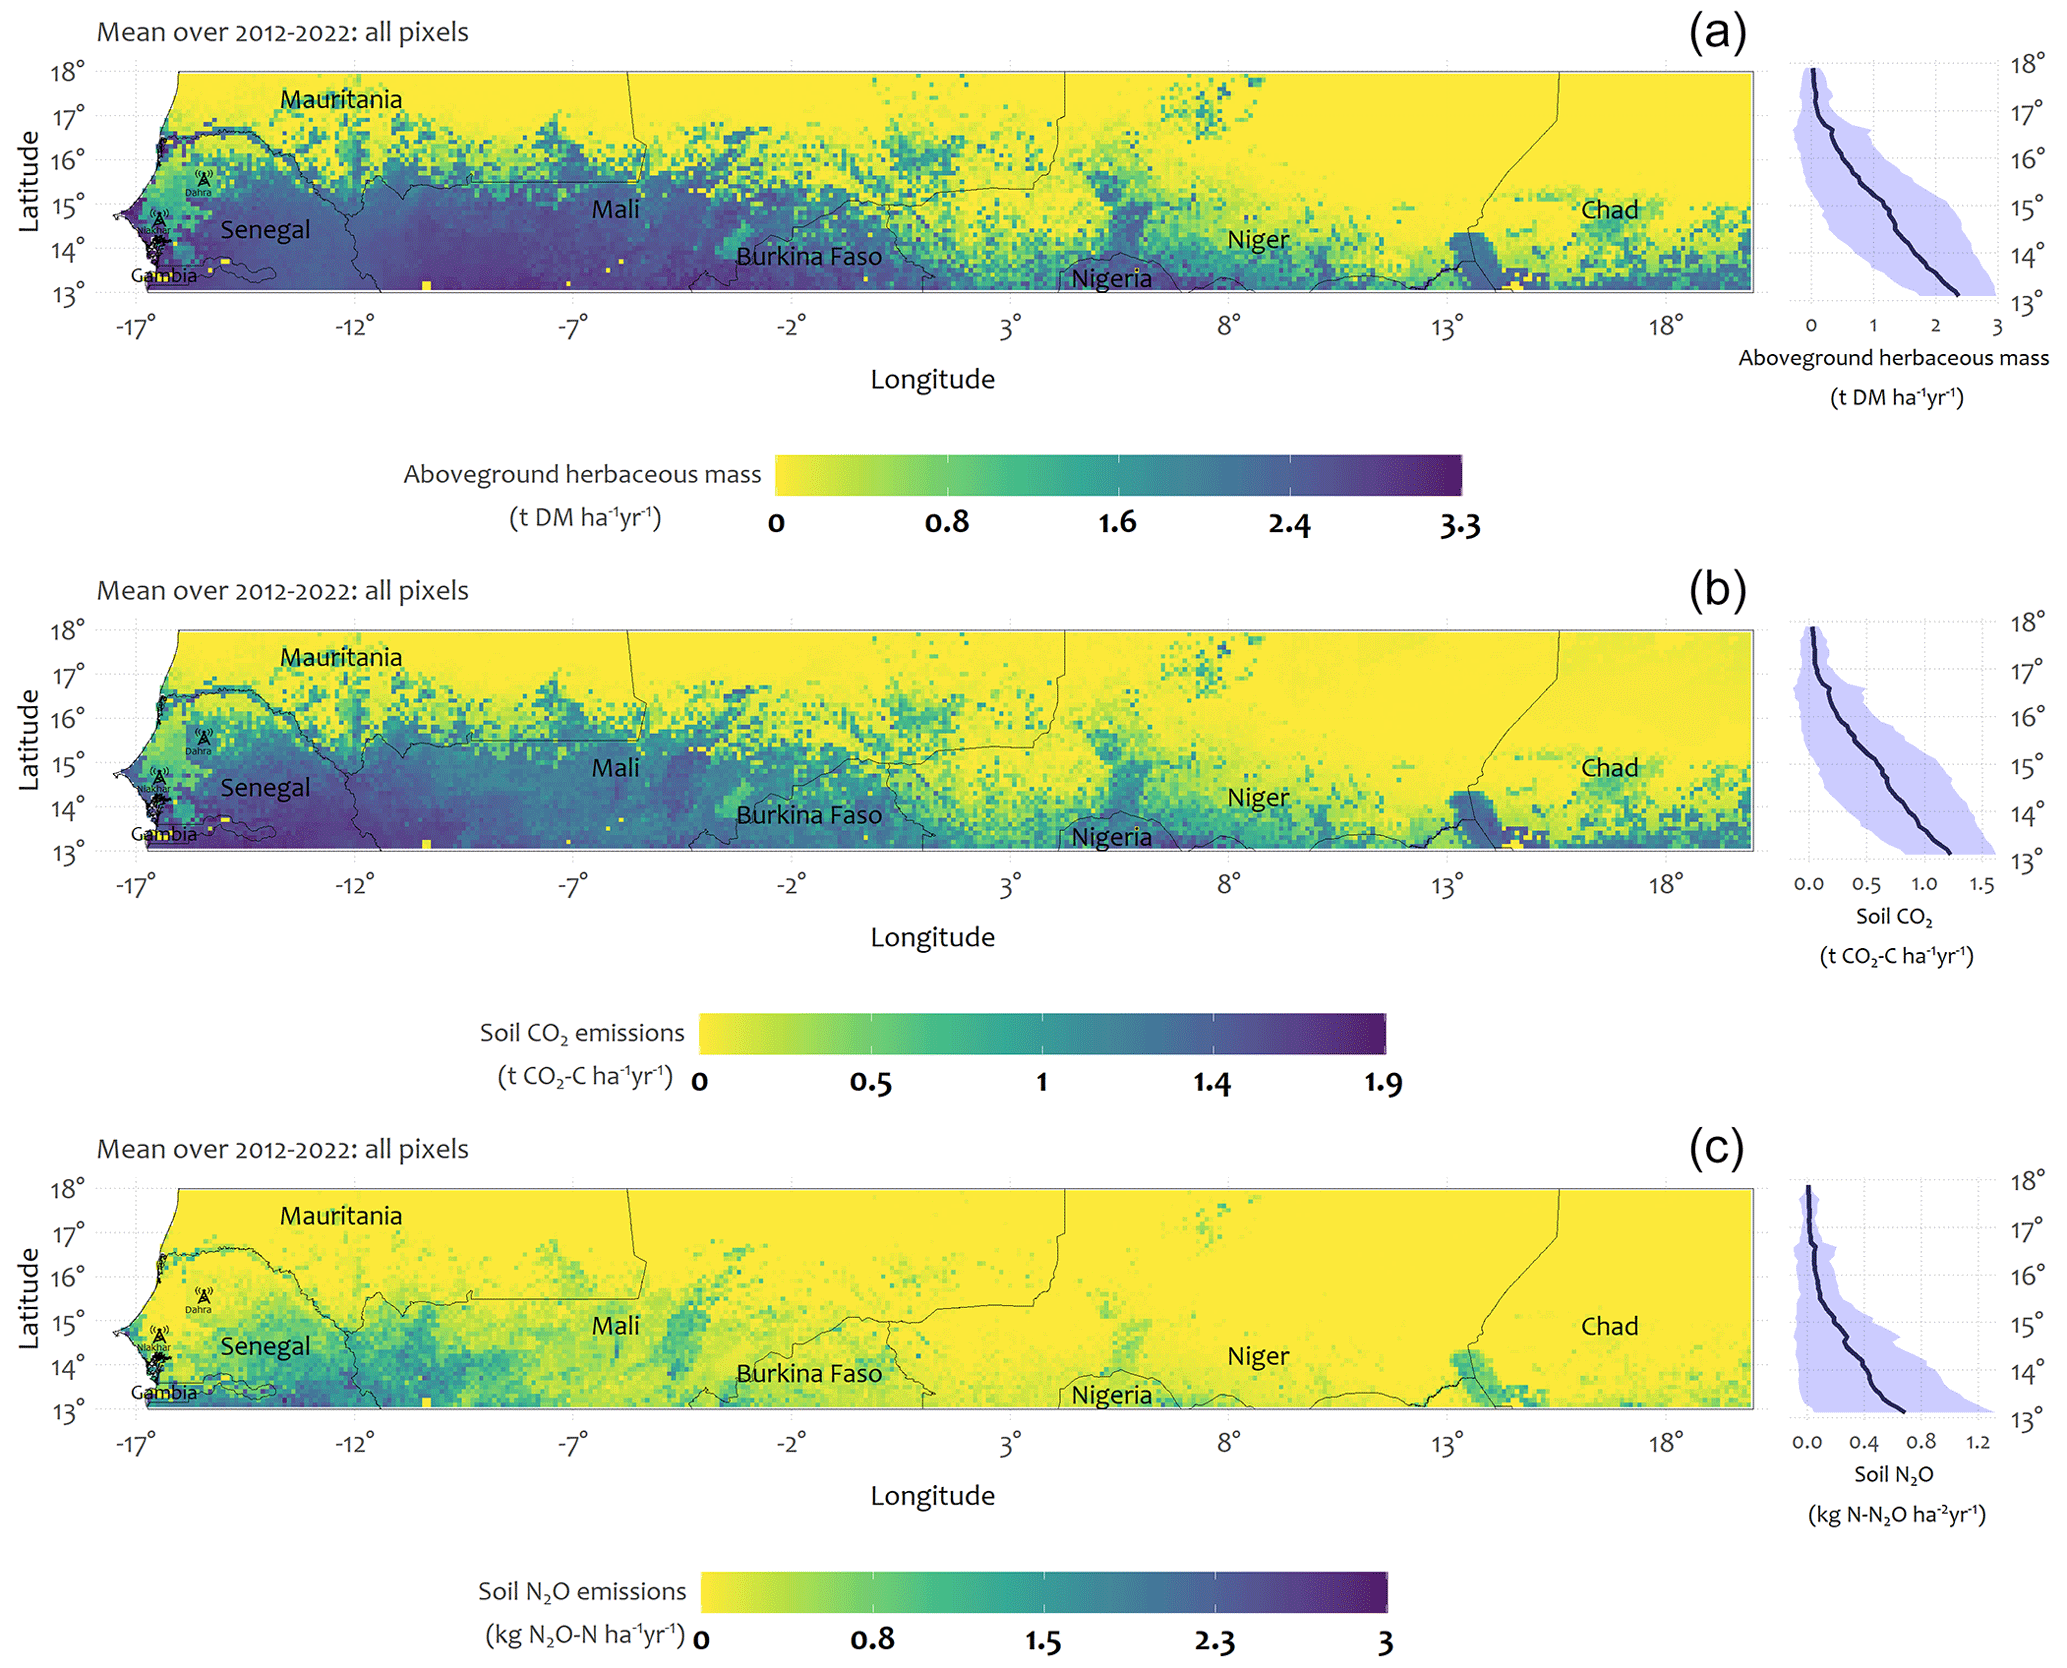
Figure A8Regional distributions of simulated (a) herbaceous biomass, (b) soil CO2 emissions, and (c) soil N2O emissions in Sahelian SPSs (annual mean from 2012–2022). All pixels are displayed. The right panel shows (a) herbaceous biomass, (b) soil CO2 emissions, and (c) soil N2O emissions along a latitudinal gradient of 0.1°, while the shaded areas indicate the standard deviations.
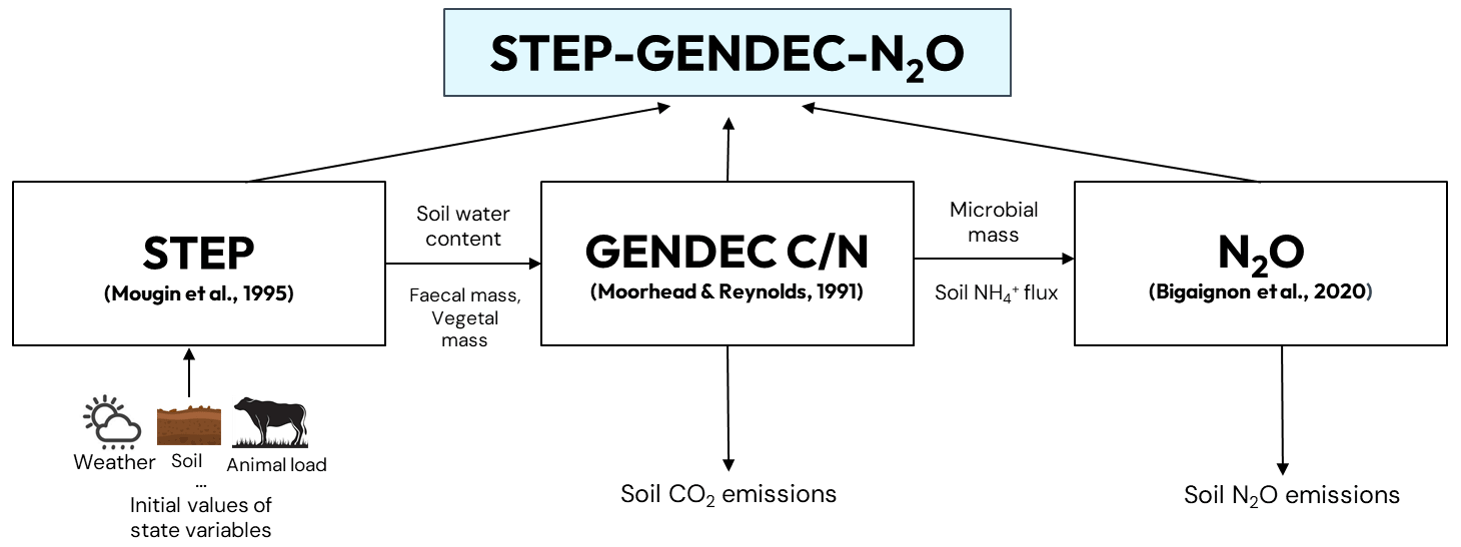
Figure A9Summary figure showing the connection between the STEP and GENDEC models and the N2O module.
The 2D STEP–GENDEC-N2O model is available on Zenodo at https://doi.org/10.5281/zenodo.7866671 (Agbohessou et al., 2023b). The rstep R package (Agbohessou, 2022), developed to automate workflows for 1D and 2D STEP–GENDEC-N2O simulations, has been archived on Zenodo at https://doi.org/10.5281/zenodo.7994028.
Data will be made available upon request from the corresponding author.
YA, CD, MG, EM, and OR conceptualized and designed the study. EM, CD, MG, and YA developed the 2D STEP–GENDEC-N2O model code, and YA performed the simulations. YA prepared the paper with contributions from all co-authors.
The contact author has declared that none of the authors has any competing interests.
Publisher’s note: Copernicus Publications remains neutral with regard to jurisdictional claims made in the text, published maps, institutional affiliations, or any other geographical representation in this paper. While Copernicus Publications makes every effort to include appropriate place names, the final responsibility lies with the authors.
This document has been produced with the assistance of the European Union. Its content is the sole responsibility of the authors and can in no way be taken to reflect the position of the European Union.
The authors gratefully acknowledge the use of the Nuwa high-performance-computing cluster from Toulouse, France, which provided the essential computing resources that facilitated the research presented in this paper. Additionally, the authors wish to express their appreciation to Anne Mottet for sharing the relevant literature on land cover products.
This work was supported by the Carbon sequestration and greenhouse gas emissions in (agro)silvopastoral ecosystems in the Sahelian CILSS states (CaSSECS) project (grant no. FOOD/2019/410-169), which received funding from the European Union under the Development of Smart Innovation through Research in Agriculture (DeSIRA) Initiative. Additionally, this research received financial support from the Integrated Nitrogen Studies in Africa (INSA) project, which is supported by the European Union Horizon 2020 Research and Innovation programme under the Marie Skłodowska-Curie Actions (RISE MSCA; grant no. 871944).
This paper was edited by Bertrand Guenet and reviewed by Bertrand Guenet and one anonymous referee.
Agbohessou, Y.: rstep: a workflow for STEP-GENDEC-CN model under R, Zenodo [code], https://doi.org/10.5281/zenodo.7994028, 2022.
Agbohessou, Y., Delon, C., Mougin, E., Grippa, M., Tagesson, T., Diedhiou, M., Ba, S., Ngom, D., Vezy, R., Ndiaye, O., Assouma, M. H., Diawara, M., and Roupsard, O.: To what extent are greenhouse-gas emissions offset by trees in a Sahelian silvopastoral system?, Agr. Forest Meteorol., 343, 109780, https://doi.org/10.1016/j.agrformet.2023.109780, 2023a.
Agbohessou, Y., Delon, C., Grippa, M., Mougin, E., and Roupsard, O.: 2D model STEP-GENDEC-CN (V1.0.0), European Geophysical Union General Assembly (EGU), Vienna, Zenodo [code], https://doi.org/10.5281/zenodo.7866671, 2023b.
Assouma, M. H., Serça, D., Guérin, F., Blanfort, V., Lecomte, P., Touré, I., Ickowicz, A., Manlay, R. J., Bernoux, M., and Vayssières, J.: Livestock induces strong spatial heterogeneity of soil CO2, N2O and CH4 emissions within a semi-arid sylvo-pastoral landscape in West Africa, J. Arid Land, 9, 210–221, https://doi.org/10.1007/s40333-017-0001-y, 2017.
Aulakh, M. S., Doran, J. W., Walters, D. T., and Power, J. F.: Legume residue and soil water effects on denitrification in soils of different textures, Soil Biol. Biochem., 23, 1161–1167, 1991.
Aulakh, M. S., Doran, J. W., and Mosier, A. R.: Soil denitrification – significance, measurement, and effects of management, in: Advances in soil science, Vol. 18, edited by: Stewart, B. A., Springer, New York, NY, 1–57, https://doi.org/10.1007/978-1-4612-2844-8_1, 1992.
Bajracharya, R. M., Lal, R., and Kimble, J. M.: Diurnal and seasonal CO2–C flux from soil as related to erosion phases in central Ohio, Soil Sci. Soc. Am. J., 64, 286–293, 2000.
Ballabio, C., Panagos, P., and Monatanarella, L.: Mapping topsoil physical properties at European scale using the LUCAS database, Geoderma, 261, 110–123, https://doi.org/10.1016/j.geoderma.2015.07.006, 2016.
Barnard, R. L., Blazewicz, S. J., and Firestone, M. K.: Rewetting of soil: Revisiting the origin of soil CO2 emissions, Soil Biol. Biochem., 147, 107819, https://doi.org/10.1016/j.soilbio.2020.107819, 2020.
Bernard, C. and Fillol, E.: Production de biomasse en 2020 analyses et perspectives pour 2022, 10, https://www.accioncontraelhambre.org/es (last access: 26 June 2023), 2020.
Bernard, C. and Fillol, E.: Production de biomasse en 2021 analyses et perspectives pour 2022, 10, https://fscluster.org/sites/default/files/documents/acf_rapport_biomasse_regional_2021.pdf (last access: 26 June 2023), 2021.
Biasutti, M.: Rainfall trends in the African Sahel: Characteristics, processes, and causes, WIRES Clim. Change, 10, e591, https://doi.org/10.1002/wcc.591, 2019.
Bigaignon, L., Delon, C., Ndiaye, O., Galy-Lacaux, C., Serça, D., Guérin, F., Tallec, T., Merbold, L., Tagesson, T., Fensholt, R., André, S., and Galliau, S.: Understanding N2O Emissions in African Ecosystems: Assessments from a Semi-Arid Savanna Grassland in Senegal and Sub-Tropical Agricultural Fields in Kenya, Sustainability, 12, 8875, https://doi.org/10.3390/su12218875, 2020.
Birch, H. F.: The effect of soil drying on humus decomposition and nitrogen availability, Plant Soil, 10, 9–31, 1958.
Bloch-Johnson, J., Rugenstein, M., Stolpe, M. B., Rohrschneider, T., Zheng, Y., and Gregory, J. M.: Climate Sensitivity Increases Under Higher CO2 Levels Due to Feedback Temperature Dependence, Geophys. Res. Lett., 48, e2020GL089074, https://doi.org/10.1029/2020GL089074, 2021.
Bond-Lamberty, B. and Thomson, A.: A global database of soil respiration data, Biogeosciences, 7, 1915–1926, https://doi.org/10.5194/bg-7-1915-2010, 2010.
Boogaard, H., Schubert, De Wit, A., Lazebnik, J., Hutjes, R., and Van der Grijn, G.: Agrometeorological indicators from 1979 to present derived from reanalysis, version 1.0, Copernicus Climate Change Service (C3S) Climate Data Store (CDS), https://doi.org/10.24381/CDS.6C68C9BB, 2020.
Breiman, L.: Random Forests, Mach. Learn., 45, 5–32, https://doi.org/10.1023/A:1010933404324, 2001.
Breiman, L., Friedman, J., Olshen, R., and Stone, C.: Classification and regression trees, Chapman and Hall/CRC, New York, 368 pp., https://doi.org/10.1201/9781315139470, 1984.
Brown, D. and de Sousa, K.: ag5Tools: An R package for downloading and extracting agrometeorological data from the AgERA5 database, SoftwareX, 21, 101267, https://doi.org/10.1016/j.softx.2022.101267, 2023.
Brümmer, C., Papen, H., Wassmann, R., and Brüggemann, N.: Termite mounds as hot spots of nitrous oxide emissions in South-Sudanian savanna of Burkina Faso (West Africa), Geophys. Res. Lett., 36, L09814, https://doi.org/10.1029/2009GL037351, 2009.
Butterbach-Bahl, K., Baggs, E. M., Dannenmann, M., Kiese, R., and Zechmeister-Boltenstern, S.: Nitrous oxide emissions from soils: how well do we understand the processes and their controls?, Philos. T. R. Soc. B, 368, 20130122, https://doi.org/10.1098/rstb.2013.0122, 2013.
Butterbach-Bahl, K., Gettel, G., Kiese, R., Fuchs, K., Werner, C., Rahimi, J., Barthel, M., and Merbold, L.: Livestock enclosures in drylands of Sub-Saharan Africa are overlooked hotspots of N2O emissions, Nat. Commun., 11, 4644, https://doi.org/10.1038/s41467-020-18359-y, 2020.
Cao, P., Lu, C., and Yu, Z.: Historical nitrogen fertilizer use in agricultural ecosystems of the contiguous United States during 1850–2015: application rate, timing, and fertilizer types, Earth Syst. Sci. Data, 10, 969–984, https://doi.org/10.5194/essd-10-969-2018, 2018.
Chagnaud, G., Panthou, G., Vischel, T., and Lebel, T.: A synthetic view of rainfall intensification in the West African Sahel, Environ. Res. Lett., 17, 044005, https://doi.org/10.1088/1748-9326/ac4a9c, 2022.
Chang, J., Ciais, P., Viovy, N., Vuichard, N., Sultan, B., and Soussana, J.-F.: The greenhouse gas balance of European grasslands, Glob. Change Biol., 21, 3748–3761, https://doi.org/10.1111/gcb.12998, 2015.
Chevallier, T., Hmaidi, K., Kouakoua, E., Bernoux, M., Gallali, T., Toucet, J., Jolivet, C., Deleporte, P., and Barthès, B. G.: Physical protection of soil carbon in macroaggregates does not reduce the temperature dependence of soil CO2 emissions, J. Plant Nutr. Soil Sc., 178, 592–600, 2015.
Cuhel, J., Šimek, M., Laughlin, R. J., Bru, D., Chèneby, D., Watson, C. J., and Philippot, L.: Insights into the effect of soil pH on N2O and N2 emissions and denitrifier community size and activity, Appl. Environ. Microbiol., 76, 1870–1878, 2010.
Dai, A., Lamb, P. J., Trenberth, K. E., Hulme, M., Jones, P. D., and Xie, P.: The recent Sahel drought is real, Int. J. Climatol., 24, 1323–1331, 2004.
Dangal, S. R. S., Tian, H., Pan, S., Zhang, L., and Xu, R.: Greenhouse gas balance in global pasturelands and rangelands, Environ. Res. Lett., 15, 104006, https://doi.org/10.1088/1748-9326/abaa79, 2020.
Davidson, E. A.: The contribution of manure and fertilizer nitrogen to atmospheric nitrous oxide since 1860, Nat. Geosci., 2, 659–662, https://doi.org/10.1038/ngeo608, 2009.
Davidson, E. A. and Kanter, D.: Inventories and scenarios of nitrous oxide emissions, Environ. Res. Lett., 9, 105012, https://doi.org/10.1088/1748-9326/9/10/105012, 2014.
Davidson, E. A. and Swank, W. T.: Environmental parameters regulating gaseous nitrogen losses from two forested ecosystems via nitrification and denitrification, Appl. Environ. Microbiol., 52, 1287–1292, 1986.
Davidson, E. A. and Verchot, L. V.: Testing the hole-in-the-pipe model of nitric and nitrous oxide emissions from soils using the TRAGNET database, Global Biogeochem. Cy., 14, 1035–1043, 2000.
Delon, C., Mougin, E., Serça, D., Grippa, M., Hiernaux, P., Diawara, M., Galy-Lacaux, C., and Kergoat, L.: Modelling the effect of soil moisture and organic matter degradation on biogenic NO emissions from soils in Sahel rangeland (Mali), Biogeosciences, 12, 3253–3272, https://doi.org/10.5194/bg-12-3253-2015, 2015.
Delon, C., Galy-Lacaux, C., Serça, D., Loubet, B., Camara, N., Gardrat, E., Saneh, I., Fensholt, R., Tagesson, T., Le Dantec, V., Sambou, B., Diop, C., and Mougin, E.: Soil and vegetation-atmosphere exchange of NO, NH3, and N2O from field measurements in a semi arid grazed ecosystem in Senegal, Atmos. Environ., 156, 36–51, https://doi.org/10.1016/j.atmosenv.2017.02.024, 2017.
Delon, C., Galy-Lacaux, C., Serça, D., Personne, E., Mougin, E., Adon, M., Le Dantec, V., Loubet, B., Fensholt, R., and Tagesson, T.: Modelling land–atmosphere daily exchanges of NO, NH3, and CO2 in a semi-arid grazed ecosystem in Senegal, Biogeosciences, 16, 2049–2077, https://doi.org/10.5194/bg-16-2049-2019, 2019.
Dezfuli, A. K., Ichoku, C. M., Huffman, G. J., Mohr, K. I., Selker, J. S., Van De Giesen, N., Hochreutener, R., and Annor, F. O.: Validation of IMERG precipitation in Africa, J. Hydrometeorol., 18, 2817–2825, 2017.
Echeverry-Galvis, M. A., Peterson, J. K., and Sulo-Caceres, R.: The social nestwork: Tree structure determines nest placement in kenyan weaverbird colonies, PloS One, 9, e88761, https://doi.org/10.1371/journal.pone.0088761, 2014.
Efron, B. and Tibshirani, R.: Bootstrap methods for standard errors, confidence intervals, and other measures of statistical accuracy, Stat. Sci., 1, 54–75, https://doi.org/10.1214/ss/1177013815, 1986.
Elberling, B., Touré, A., and Rasmussen, K.: Changes in soil organic matter following groundnut–millet cropping at three locations in semi-arid Senegal, West Africa, Agr. Ecosyst. Environ., 96, 37–47, 2003a.
Elberling, B., Fensholt, R., Larsen, L., Petersen, A. S., and Sandholt, I.: Water content and land use history controlling soil CO2 respiration and carbon stock in savanna soil and groundnut fields in semi-arid Senegal, Geogr. Tidsskr.-Den., 103, 47–56, 2003b.
Fan, Z., Neff, J. C., and Hanan, N. P.: Modeling pulsed soil respiration in an African savanna ecosystem, Agr. Forest Meteorol., 200, 282–292, 2015.
FAOSTAT: Food and Agriculture Organization of the United Nations: Crops and livestock products, https://www.fao.org/faostat/en/#data/GT (last access: 29 March 2024), 2024.
Galle, S., Grippa, M., Peugeot, C., Moussa, I. B., Cappelaere, B., Demarty, J., Mougin, E., Panthou, G., Adjomayi, P., Agbossou, E. K., Ba, A., Boucher, M., Cohard, J.-M., Descloitres, M., Descroix, L., Diawara, M., Dossou, M., Favreau, G., Gangneron, F., Gosset, M., Hector, B., Hiernaux, P., Issoufou, B.-A., Kergoat, L., Lawin, E., Lebel, T., Legchenko, A., Abdou, M. M., Malam-Issa, O., Mamadou, O., Nazoumou, Y., Pellarin, T., Quantin, G., Sambou, B., Seghieri, J., Séguis, L., Vandervaere, J.-P., Vischel, T., Vouillamoz, J.-M., Zannou, A., Afouda, S., Alhassane, A., Arjounin, M., Barral, H., Biron, R., Cazenave, F., Chaffard, V., Chazarin, J.-P., Guyard, H., Koné, A., Mainassara, I., Mamane, A., Oi, M., Ouani, T., Soumaguel, N., Wubda, M., Ago, E. E., Alle, I. C., Allies, A., Arpin-Pont, F., Awessou, B., Cassé, C., Charvet, G., Dardel, C., Depeyre, A., Diallo, F. B., Do, T., Fatras, C., Frappart, F., Gal, L., Gascon, T., Gibon, F., Guiro, I., Ingatan, A., Kempf, J., Kotchoni, D. O. v., Lawson, F. M. A., Leauthaud, C., Louvet, S., Mason, E., Nguyen, C. C., Perrimond, B., Pierre, C., Richard, A., Robert, E., Román-Cascón, C., Velluet, C., and Wilcox, C.: AMMA-CATCH, a Critical Zone Observatory in West Africa Monitoring a Region in Transition, Vadose Zone J., 17, 180062, https://doi.org/10.2136/vzj2018.03.0062, 2018.
Ghattas, B.: Agrégation d'arbres de classification, Revue de Statistique Appliquee, 48, 85–98, 2000.
Gilbert, M., Nicolas, G., Cinardi, G., Van Boeckel, T. P., Vanwambeke, S. O., Wint, G. R. W., and Robinson, T. P.: Global distribution data for cattle, buffaloes, horses, sheep, goats, pigs, chickens and ducks in 2010, Sci. Data, 5, 180227, https://doi.org/10.1038/sdata.2018.227, 2018.
Gleixner, S., Demissie, T., and Diro, G. T.: Did ERA5 improve temperature and precipitation reanalysis over East Africa?, Atmosphere, 11, 996, https://doi.org/10.3390/atmos11090996, 2020.
Grippa, M., Kergoat, L., Boone, A., Peugeot, C., Demarty, J., Cappelaere, B., Gal, L., Hiernaux, P., Mougin, E., Ducharne, A., Dutra, E., Anderson, M., Hain, C., and ALMIP2 Working Group: Modeling Surface Runoff and Water Fluxes over Contrasted Soils in the Pastoral Sahel: Evaluation of the ALMIP2 Land Surface Models over the Gourma Region in Mali, J. Hydrometeorol., 18, 1847–1866, https://doi.org/10.1175/JHM-D-16-0170.1, 2017.
Guichard, F., Kergoat, L., Hourdin, F., Léauthaud, C., Barbier, J., Mougin, É., and Diarra, B.: Chap. 1, Climate warming observed in the Sahel since 1950, in: Rural societies in the face of climatic and environmental changes in West Africa, edited by: Lalou, R., Oumarou, A., Sanni, M. A., Sultan, B., and Arame Soumaré, M., IRD Éditions, Marseille, 23–41, https://doi.org/10.4000/books.irdeditions.12319, 2020.
Hansen, J., Sato, M., Ruedy, R., Lacis, A., and Oinas, V.: Global warming in the twenty-first century: An alternative scenario, P. Natl. Acad. Sci. USA, 97, 9875–9880, https://doi.org/10.1073/pnas.170278997, 2000.
Hengl, T., Miller, M. A. E., Križan, J., Shepherd, K. D., Sila, A., Kilibarda, M., Antonijević, O., Glušica, L., Dobermann, A., Haefele, S. M., McGrath, S. P., Acquah, G. E., Collinson, J., Parente, L., Sheykhmousa, M., Saito, K., Johnson, J.-M., Chamberlin, J., Silatsa, F. B. T., Yemefack, M., Wendt, J., MacMillan, R. A., Wheeler, I., and Crouch, J.: African soil properties and nutrients mapped at 30 m spatial resolution using two-scale ensemble machine learning, Sci. Rep., 11, 6130, https://doi.org/10.1038/s41598-021-85639-y, 2021.
Hergoualc'h, K., Akiyama, H., Bernoux, M., Chirinda, N., Prado, A. del, Kasimir, Å., MacDonald, J. D., Ogle, S. M., Regina, K., and van der Weerden, T. J.: N2O emissions from managed soils, and CO2 emissions from lime and urea application, Chap. 11, 1–48, https://hdl.handle.net/10568/107142, 2019.
Herrero, M., Havlík, P., Valin, H., Notenbaert, A., Rufino, M. C., Thornton, P. K., Blümmel, M., Weiss, F., Grace, D., and Obersteiner, M.: Biomass use, production, feed efficiencies, and greenhouse gas emissions from global livestock systems, P. Natl. Acad. Sci. USA, 110, 20888–20893, https://doi.org/10.1073/pnas.1308149110, 2013a.
Herrero, M., Grace, D., Njuki, J., Johnson, N., Enahoro, D., Silvestri, S., and Rufino, M. C.: The roles of livestock in developing countries, Animal, 7, 3–18, https://doi.org/10.1017/S1751731112001954, 2013b.
Hiernaux, P., Diarra, L., Trichon, V., Mougin, E., Soumaguel, N., and Baup, F.: Woody plant population dynamics in response to climate changes from 1984 to 2006 in Sahel (Gourma, Mali), J. Hydrol., 375, 103–113, https://doi.org/10.1016/j.jhydrol.2009.01.043, 2009.
Hiernaux, P., Issoufou, H. B.-A., Igel, C., Kariryaa, A., Kourouma, M., Chave, J., Mougin, E., and Savadogo, P.: Allometric equations to estimate the dry mass of Sahel woody plants mapped with very-high resolution satellite imagery, Forest Ecol. Manag., 529, 120653, https://doi.org/10.1016/j.foreco.2022.120653, 2023.
Huffman, G. J., Stocker, E. F., Bolvin, D. T., Nelkin, E. J., and Tan, J.: GPM IMERG Final Precipitation L3 1 day 0.1° × 0.1° V06, edited by: Savtchenko, A., Greenbelt, MD, Goddard Earth Sciences Data and Information Services Center (GES DISC), https://doi.org/10.5067/GPM/IMERGDF/DAY/06, 2019.
IPCC: 2006 IPCC Guidelines for National Greenhouse Gas Inventories, https://www.ipcc.ch/report/2006-ipcc-guidelines-for-national-greenhouse-gas-inventories/ (last access: 22 October 2022), 2006.
Jarlan, L., Mazzega, P., Mougin, E., Lavenu, F., Marty, G., Frison, P. L., and Hiernaux, P.: Mapping of Sahelian vegetation parameters from ERS scatterometer data with an evolution strategies algorithm, Remote Sens. Environ., 87, 72–84, 2003.
Jarlan, L., Mougin, E., Mazzega, P., Schoenauer, M., Tracol, Y., and Hiernaux, P.: Using coarse remote sensing radar observations to control the trajectory of a simple Sahelian land surface model, Remote Sens. Environ., 94, 269–285, 2005.
Jarlan, L., Mangiarotti, S., Mougin, E., Mazzega, P., Hiernaux, P., and Le Dantec, V.: Assimilation of SPOT/VEGETATION NDVI data into a sahelian vegetation dynamics model, Remote Sens. Environ., 112, 1381–1394, 2008.
Jarvis, P., Rey, A., Petsikos, C., Wingate, L., Rayment, M., Pereira, J., Banza, J., David, J., Miglietta, F., and Borghetti, M.: Drying and wetting of Mediterranean soils stimulates decomposition and carbon dioxide emission: the “Birch effect,” Tree Physiol., 27, 929–940, 2007.
Kammen, D. M. and Marino, B. D.: On the origin and magnitude of pre-industrial anthropogenic CO2 and CH4 emissions, Chemosphere, 26, 69–86, https://doi.org/10.1016/0045-6535(93)90413-Y, 1993.
Karhu, K., Dannenmann, M., Kitzler, B., Díaz-Pinés, E., Tejedor, J., Ramírez, D. A., Parra, A., De Dios, V. R., Moreno, J. M., and Rubio, A.: Fire increases the risk of higher soil N2O emissions from Mediterranean Macchia ecosystems, Soil Biol. Biochem., 82, 44–51, 2015.
Khalil, K.: Emissions de N2O par nitrification et dénitrification à l’échelle de la motte de sol: effet de la structure du sol, de l’aération et des activités microbiennes, phdthesis, Université Pierre et Marie Curie – Paris VI, https://theses.hal.science/tel-00008117 (last access: 12 April 2023), 2003.
Lambert, M.-J., Bana, Z. S., and Oualbiogo, H. V.: Production de biomasse au sahel en 2019, 8, https://www.accioncontraelhambre.org/es (last access: 26 June 2023), 2019.
FAO Global Land Cover (GLC-SHARE) Beta-Release 1.0 Database: Land and Water Division, edited by: Latham, J., Cumani, R., Rosati, I., and Bloise, M., 2014.
Lavers, D. A., Simmons, A., Vamborg, F., and Rodwell, M. J.: An evaluation of ERA5 precipitation for climate monitoring, Q. J. Roy. Meteorol. Soc., 148, 3152–3165, https://doi.org/10.1002/qj.4351, 2022.
Leahy, P.: Managed grasslands: A greenhouse gas sink or source?, Geophys. Res. Lett., 31, L20507, https://doi.org/10.1029/2004GL021161, 2004.
Le Houerou, H. N.: Indigenous shrubs and trees in the silvopastoral systems of Africa, in: Agroforestry a decade of development, Citeseer, Nairobi, Kenya, 139, ISBN : 92 9059 036 X, 1987.
Le Houérou, H. N.: Classification écoclimatique des zones arides (sl) de l'Afrique du Nord, Ecologia Mediterranea, 15, 95–144, 1989.
Li, C., Aber, J., Stange, F., Butterbach-Bahl, K., and Papen, H.: A process-oriented model of N2O and NO emissions from forest soils: 1. Model development, J. Geophys. Res.-Atmos., 105, 4369–4384, 2000.
Liaw, A. and Wiener, M.: Classification and regression by randomForest, R News, 2, 18–22, 2002.
Liu, Y.: Modeling the Emissions of Nitrous Oxide (N2O) and Methane (CH4) from the Terrestrial Biosphere to the Atmosphere, Ph.D. Thesis, MIT Dept. Earth, Atmos. Planet. Sci., http://globalchange.mit.edu/publication/14226 (last access: 8 March 2022), 1996.
Liu, Y., Wu, X., Wu, T., Zhao, L., Li, R., Li, W., Hu, G., Zou, D., Ni, J., Du, Y., Wang, M., Li, Z., Wei, X., and Yan, X.: Soil Texture and Its Relationship with Environmental Factors on the Qinghai–Tibet Plateau, Remote Sens., 14, 3797, https://doi.org/10.3390/rs14153797, 2022.
Lloyd, J. and Taylor, J. A.: On the Temperature Dependence of Soil Respiration, Funct. Ecol., 8, 315–323, https://doi.org/10.2307/2389824, 1994.
Ma, S., Baldocchi, D. D., Hatala, J. A., Detto, M., and Yuste, J. C.: Are rain-induced ecosystem respiration pulses enhanced by legacies of antecedent photodegradation in semi-arid environments?, Agr. Forest Meteorol., 154, 203–213, 2012.
Maavara, T., Lauerwald, R., Laruelle, G. G., Akbarzadeh, Z., Bouskill, N. J., Van Cappellen, P., and Regnier, P.: Nitrous oxide emissions from inland waters: Are IPCC estimates too high?, Glob. Change Biol., 25, 473–488, 2019.
Macfadyen, A.: Soil metabolism in relation to ecosystem energy flow and to primary and secondary production, in: “Methods of Study in Soil Ecology” Proc. UNESCO/IBP Symp., Paris 1967, 167–172, https://www.cabidigitallibrary.org/doi/full/10.5555/19711903864 (last access: 27 January 2022), 1970.
Maranan, M., Fink, A. H., Knippertz, P., Amekudzi, L. K., Atiah, W. A., and Stengel, M.: A process-based validation of GPM IMERG and its sources using a mesoscale rain gauge network in the West African forest zone, J. Hydrometeorol., 21, 729–749, 2020.
Miller, M. A., Shepherd, K. D., Kisitu, B., and Collinson, J.: iSDAsoil: The first continent-scale soil property map at 30 m resolution provides a soil information revolution for Africa, PLoS Biol., 19, e3001441, https://doi.org/10.1371/journal.pbio.3001441, 2021.
Monteith, J. L.: Solar radiation and productivity in tropical ecosystems, J. Appl. Ecol., 9, 747–766, 1972.
Moorhead, D. L. and Reynolds, J. F.: A general model of litter decomposition in the northern Chihuahuan Desert, Ecol. Model., 56, 197–219, https://doi.org/10.1016/0304-3800(91)90200-K, 1991.
Mougin, E., Lo Seena, D., Rambal, S., Gaston, A., and Hiernaux, P.: A regional Sahelian grassland model to be coupled with multispectral satellite data, I: Model description and validation, Remote Sens. Environ., 52, 181–193, https://doi.org/10.1016/0034-4257(94)00126-8, 1995.
Muñoz-Sabater, J.: ERA5-Land hourly data from 1981 to present, Copernicus Climate Change Service (C3S) Climate Data Store (CDS), https://doi.org/10.24381/CDS.E2161BAC, 2019.
Muñoz-Sabater, J., Dutra, E., Agustí-Panareda, A., Albergel, C., Arduini, G., Balsamo, G., Boussetta, S., Choulga, M., Harrigan, S., Hersbach, H., Martens, B., Miralles, D. G., Piles, M., Rodríguez-Fernández, N. J., Zsoter, E., Buontempo, C., and Thépaut, J.-N.: ERA5-Land: a state-of-the-art global reanalysis dataset for land applications, Earth Syst. Sci. Data, 13, 4349–4383, https://doi.org/10.5194/essd-13-4349-2021, 2021.
Myhre, G., Shindell, D., Bréon, F. M., Collins, W., Fuglestvedt, J., Huang, J., Koch, D., Lamarque, J. F., Lee, D., and Mendoza, B.: Climate change 2013: the physical science basis, Contribution of working group I to the fifth assessment report of the intergovernmental panel on climate change, 659–740, 2013.
Nicholson, S. E.: Climate and climatic variability of rainfall over eastern Africa, Rev. Geophys., 55, 590–635, https://doi.org/10.1002/2016RG000544, 2017.
Oertel, C., Matschullat, J., Zurba, K., Zimmermann, F., and Erasmi, S.: Greenhouse gas emissions from soils – A review, Geochemistry, 76, 327–352, https://doi.org/10.1016/j.chemer.2016.04.002, 2016.
Parmesan, C., Morecroft, M., Trisurat, Y., Adrian, R., Anshari, G., Arneth, A., Gao, Q., Gonzalez, P., Harris, R., Price, J., Stevens, N., Talukdarr, G., Strutz, S., Ackerly, D., Anderson, E., Boyd, P., Birkmann, J., Bremerich, V., Brotons, L., and Young, K.: IPCC AR6 WGII, Chap. 2 – Terrestrial and Freshwater Ecosystems and Their Services, in: Climate Change 2022: Impacts, Adaptation, and Vulnerability, Contribution of Working Group II to the Sixth Assessment Report of the Intergovernmental Panel on Climate Change, edited by: Pörtner, H.-O., Roberts, D. C., Tignor, M., Poloczanska, E. S., Mintenbeck, K., Alegría, A., Craig, M., Langsdorf, S., Löschke, S., Möller, V., Okem, A., and Rama, B., Cambridge, UK and New York, NY, USA, 197–377, https://doi.org/10.1017/9781009325844.004, 2022.
Parton, W. J., Holland, E. A., Del Grosso, S. J., Hartman, M. D., Martin, R. E., Mosier, A. R., Ojima, D. S., and Schimel, D. S.: Generalized model for NOx and N2O emissions from soils, J. Geophys. Res.-Atmos., 106, 17403–17419, 2001.
Philibert, A., Loyce, C., and Makowski, D.: Prediction of N2O emission from local information with Random Forest, Environ. Pollut., 177, 156–163, https://doi.org/10.1016/j.envpol.2013.02.019, 2013.
Pierre, C., Bergametti, G., Marticorena, B., Mougin, E., Lebel, T., and Ali, A.: Pluriannual comparisons of satellite-based rainfall products over the Sahelian belt for seasonal vegetation modeling, J. Geophys. Res., 116, D18201, https://doi.org/10.1029/2011JD016115, 2011.
Pierre, C., Grippa, M., Mougin, E., Guichard, F., and Kergoat, L.: Changes in Sahelian annual vegetation growth and phenology since 1960: A modeling approach, Glob. Planet. Change, 143, 162–174, https://doi.org/10.1016/j.gloplacha.2016.06.009, 2016.
Prasad, A. M., Iverson, L. R., and Liaw, A.: Newer classification and regression tree techniques: bagging and random forests for ecological prediction, Ecosystems, 9, 181–199, 2006.
Prinn, R. G., Weiss, R. F., Arduini, J., Arnold, T., DeWitt, H. L., Fraser, P. J., Ganesan, A. L., Gasore, J., Harth, C. M., Hermansen, O., Kim, J., Krummel, P. B., Li, S., Loh, Z. M., Lunder, C. R., Maione, M., Manning, A. J., Miller, B. R., Mitrevski, B., Mühle, J., O'Doherty, S., Park, S., Reimann, S., Rigby, M., Saito, T., Salameh, P. K., Schmidt, R., Simmonds, P. G., Steele, L. P., Vollmer, M. K., Wang, R. H., Yao, B., Yokouchi, Y., Young, D., and Zhou, L.: History of chemically and radiatively important atmospheric gases from the Advanced Global Atmospheric Gases Experiment (AGAGE), Earth Syst. Sci. Data, 10, 985–1018, https://doi.org/10.5194/essd-10-985-2018, 2018.
R Core Team: R: a language and environment for statistical computing, version 3.0, Vienna, Austria, R Foundation for Statistical Computing, https://www.R-project.org/ (last access: 14 September 2022), 2019.
Rahimi, J., Haas, E., Grote, R., Kraus, D., Smerald, A., Laux, P., Goopy, J., and Butterbach-Bahl, K.: Beyond livestock carrying capacity in the Sahelian and Sudanian zones of West Africa, Sci. Rep., 11, 22094, https://doi.org/10.1038/s41598-021-01706-4, 2021.
Raich, J. W. and Potter, C. S.: Global Patterns of CO2 Emissions from Soils on a 0.5° Grid Cell Basis, Environmental System Science Data Infrastructure for a Virtual Ecosystem (ESS-DIVE) (United States), https://doi.org/10.3334/CDIAC/LUE.DB1015, 1996.
Rastogi, M., Singh, S., and Pathak, H.: Emission of carbon dioxide from soil, Curr. Sci., 82, 510–517, http://www.jstor.org/stable/24105957 (last access: 27 September 2022), 2002.
Ravishankara, A. R., Daniel, J. S., and Portmann, R. W.: Nitrous oxide (N2O): the dominant ozone-depleting substance emitted in the 21st century, Science, 326, 123–125, 2009.
Ray, R. L., Griffin, R. W., Fares, A., Elhassan, A., Awal, R., Woldesenbet, S., and Risch, E.: Soil CO2 emission in response to organic amendments, temperature, and rainfall, Sci. Rep., 10, 5849, https://doi.org/10.1038/s41598-020-62267-6, 2020.
Reth, S., Reichstein, M., and Falge, E.: The effect of soil water content, soil temperature, soil pH-value and the root mass on soil CO2 efflux – A modified model, Plant Soil, 268, 21–33, https://doi.org/10.1007/s11104-005-0175-5, 2005.
Rey, A., Oyonarte, C., Morán-López, T., Raimundo, J., and Pegoraro, E.: Changes in soil moisture predict soil carbon losses upon rewetting in a perennial semiarid steppe in SE Spain, Geoderma, 287, 135–146, 2017.
Robertson, G. P. and Paul, E. A.: Decomposition and Soil Organic Matter Dynamics, in: Methods in Ecosystem Science, edited by: Sala, O. E., Jackson, R. B., Mooney, H. A., and Howarth, R. W., Springer, New York, NY, 104–116, https://doi.org/10.1007/978-1-4612-1224-9_8, 2000.
Saikawa, E., Prinn, R. G., Dlugokencky, E., Ishijima, K., Dutton, G. S., Hall, B. D., Langenfelds, R., Tohjima, Y., Machida, T., Manizza, M., Rigby, M., O'Doherty, S., Patra, P. K., Harth, C. M., Weiss, R. F., Krummel, P. B., van der Schoot, M., Fraser, P. J., Steele, L. P., Aoki, S., Nakazawa, T., and Elkins, J. W.: Global and regional emissions estimates for N2O, Atmos. Chem. Phys., 14, 4617–4641, https://doi.org/10.5194/acp-14-4617-2014, 2014.
Shcherbak, I., Millar, N., and Robertson, G. P.: Global metaanalysis of the nonlinear response of soil nitrous oxide (N2O) emissions to fertilizer nitrogen, P. Natl. Acad. Sci. USA, 111, 9199–9204, 2014.
Signor, D. and Cerri, C. E. P.: Nitrous oxide emissions in agricultural soils: a review, Pesquisa Agropecuária Tropical, 43, 322–338, 2013.
Smith, K. A., Ball, T., Conen, F., Dobbie, K. E., Massheder, J., and Rey, A.: Exchange of greenhouse gases between soil and atmosphere: interactions of soil physical factors and biological processes, Eur. J. Soil Sci., 54, 779–791, 2003.
Sobol, I. M.: Global sensitivity indices for nonlinear mathematical models and their Monte Carlo estimates, Math. Comput. Simulat., 55, 271–280, 2001.
Soussana, J.-F., Tallec, T., and Blanfort, V.: Mitigating the greenhouse gas balance of ruminant production systems through carbon sequestration in grasslands, Animal, 4, 334–350, 2010.
Swinnen, E., Toté, C., and Van Hoolst, R.: Algorithm theorethical basis document dry matter, productivity (dmp), gross dry matter productivity (GDMP), in: Copernicus Global Land Operations “Vegetation and Energy”, https://land.copernicus.eu/api/en/ (last access: 14 March 2023), 2022.
Takakai, F., Morishita, T., Hashidoko, Y., Darung, U., Kuramochi, K., Dohong, S., Limin, S. H., and Hatano, R.: Effects of agricultural land-use change and forest fire on N2O emission from tropical peatlands, Central Kalimantan, Indonesia, Soil Sci. Plant Nutr., 52, 662–674, 2006.
Thornton, P. K. and Herrero, M.: Adapting to climate change in the mixed crop and livestock farming systems in sub-Saharan Africa, Nat. Clim. Change, 5, 830–836, 2015.
Tian, H., Chen, G., Lu, C., Xu, X., Ren, W., Zhang, B., Banger, K., Tao, B., Pan, S., Liu, M., Zhang, C., Bruhwiler, L., and Wofsy, S.: Global methane and nitrous oxide emissions from terrestrial ecosystems due to multiple environmental changes, Ecosyst. Health Sustain., 1, 1–20, https://doi.org/10.1890/EHS14-0015.1, 2015.
Tian, H., Lu, C., Ciais, P., Michalak, A. M., Canadell, J. G., Saikawa, E., Huntzinger, D. N., Gurney, K. R., Sitch, S., Zhang, B., Yang, J., Bousquet, P., Bruhwiler, L., Chen, G., Dlugokencky, E., Friedlingstein, P., Melillo, J., Pan, S., Poulter, B., Prinn, R., Saunois, M., Schwalm, C. R., and Wofsy, S. C.: The terrestrial biosphere as a net source of greenhouse gases to the atmosphere, Nature, 531, 225–228, https://doi.org/10.1038/nature16946, 2016.
Tian, H., Yang, J., Lu, C., Xu, R., Canadell, J. G., Jackson, R. B., Arneth, A., Chang, J., Chen, G., Ciais, P., Gerber, S., Ito, A., Huang, Y., Joos, F., Lienert, S., Messina, P., Olin, S., Pan, S., Peng, C., Saikawa, E., Thompson, R. L., Vuichard, N., Winiwarter, W., Zaehle, S., Zhang, B., Zhang, K., and Zhu, Q.: The Global N2O Model Intercomparison Project, Bull. Am. Meteorol. Soc., 99, 1231–1251, https://doi.org/10.1175/BAMS-D-17-0212.1, 2018.
Tian, H., Yang, J., Xu, R., Lu, C., Canadell, J. G., Davidson, E. A., Jackson, R. B., Arneth, A., Chang, J., Ciais, P., Gerber, S., Ito, A., Joos, F., Lienert, S., Messina, P., Olin, S., Pan, S., Peng, C., Saikawa, E., Thompson, R. L., Vuichard, N., Winiwarter, W., Zaehle, S., and Zhang, B.: Global soil nitrous oxide emissions since the preindustrial era estimated by an ensemble of terrestrial biosphere models: Magnitude, attribution, and uncertainty, Glob. Change Biol., 25, 640–659, https://doi.org/10.1111/gcb.14514, 2019.
Tian, H., Xu, R., Canadell, J. G., Thompson, R. L., Winiwarter, W., Suntharalingam, P., Davidson, E. A., Ciais, P., Jackson, R. B., Janssens-Maenhout, G., Prather, M. J., Regnier, P., Pan, N., Pan, S., Peters, G. P., Shi, H., Tubiello, F. N., Zaehle, S., Zhou, F., Arneth, A., Battaglia, G., Berthet, S., Bopp, L., Bouwman, A. F., Buitenhuis, E. T., Chang, J., Chipperfield, M. P., Dangal, S. R. S., Dlugokencky, E., Elkins, J. W., Eyre, B. D., Fu, B., Hall, B., Ito, A., Joos, F., Krummel, P. B., Landolfi, A., Laruelle, G. G., Lauerwald, R., Li, W., Lienert, S., Maavara, T., MacLeod, M., Millet, D. B., Olin, S., Patra, P. K., Prinn, R. G., Raymond, P. A., Ruiz, D. J., van der Werf, G. R., Vuichard, N., Wang, J., Weiss, R. F., Wells, K. C., Wilson, C., Yang, J., and Yao, Y.: A comprehensive quantification of global nitrous oxide sources and sinks, Nature, 586, 248–256, https://doi.org/10.1038/s41586-020-2780-0, 2020.
Torres, C. M. M. E., Jacovine, L. A. G., Nolasco de Olivera Neto, S., Fraisse, C. W., Soares, C. P. B., de Castro Neto, F., Ferreira, L. R., Zanuncio, J. C., and Lemes, P. G.: Greenhouse gas emissions and carbon sequestration by agroforestry systems in southeastern Brazil, Sci. Rep., 7, 16738, https://doi.org/10.1038/s41598-017-16821-4, 2017.
Touré, I., Ickowicz, A., Wane, A., Garba, I., and Gerber, P.: Systeme d'information sur le pastoralisme au Sahel, Atlas des evolutions des systemes pastoraux au Sahel 1970–2012, http://www.fao.org/3/a-i2601f.pdf (last access: 9 February 2023), 2012.
Tracol, Y., Mougin, E., Hiernaux, P., and Jarlan, L.: Testing a sahelian grassland functioning model against herbage mass measurements, Ecol. Model., 193, 437–446, 2006.
Tucker, C., Brandt, M., Hiernaux, P., Kariryaa, A., Rasmussen, K., Small, J., Igel, C., Reiner, F., Melocik, K., Meyer, J., Sinno, S., Romero, E., Glennie, E., Fitts, Y., Morin, A., Pinzon, J., McClain, D., Morin, P., Porter, C., Loeffler, S., Kergoat, L., Issoufou, B.-A., Savadogo, P., Wigneron, J.-P., Poulter, B., Ciais, P., Kaufmann, R., Myneni, R., Saatchi, S., and Fensholt, R.: Sub-continental-scale carbon stocks of individual trees in African drylands, Nature, 615, 80–86, https://doi.org/10.1038/s41586-022-05653-6, 2023.
Turner, M. D., McPeak, J. G., and Ayantunde, A.: The Role of Livestock Mobility in the Livelihood Strategies of Rural Peoples in Semi-Arid West Africa, Human Ecol., 42, 231–247, 2014.
Valentini, R., Arneth, A., Bombelli, A., Castaldi, S., Cazzolla Gatti, R., Chevallier, F., Ciais, P., Grieco, E., Hartmann, J., Henry, M., Houghton, R. A., Jung, M., Kutsch, W. L., Malhi, Y., Mayorga, E., Merbold, L., Murray-Tortarolo, G., Papale, D., Peylin, P., Poulter, B., Raymond, P. A., Santini, M., Sitch, S., Vaglio Laurin, G., van der Werf, G. R., Williams, C. A., and Scholes, R. J.: A full greenhouse gases budget of Africa: synthesis, uncertainties, and vulnerabilities, Biogeosciences, 11, 381–407, https://doi.org/10.5194/bg-11-381-2014, 2014.
Verchot, L. V., Davidson, E. A., Cattânio, H., Ackerman, I. L., Erickson, H. E., and Keller, M.: Land use change and biogeochemical controls of nitrogen oxide emissions from soils in eastern Amazonia, Global Biogeochem. Cy., 13, 31–46, 1999.
Vezy, R., le Maire, G., Christina, M., Georgiou, S., Imbach, P., Hidalgo, H. G., Alfaro, E. J., Blitz-Frayret, C., Charbonnier, F., Lehner, P., Loustau, D., and Roupsard, O.: DynACof: A process-based model to study growth, yield and ecosystem services of coffee agroforestry systems, Environ. Model. Softw., 124, 104609, https://doi.org/10.1016/j.envsoft.2019.104609, 2020.
Warner, D. L., Bond-Lamberty, B., Jian, J., Stell, E., and Vargas, R.: Spatial Predictions and Associated Uncertainty of Annual Soil Respiration at the Global Scale, Global Biogeochem. Cy., 33, 1733–1745, https://doi.org/10.1029/2019GB006264, 2019.
Webb, H., Barnes, N., Powell, S., and Jones, C.: Does drone remote sensing accurately estimate soil pH in a spring wheat field in southwest Montana?, Precis. Agric, 22, 1803–1815, https://doi.org/10.1007/s11119-021-09812-z, 2021.
Xu, M. and Shang, H.: Contribution of soil respiration to the global carbon equation, J. Plant Physiol., 203, 16–28, 2016.
Xu, R., Tian, H., Pan, S., Dangal, S. R. S., Chen, J., Chang, J., Lu, Y., Skiba, U. M., Tubiello, F. N., and Zhang, B.: Increased nitrogen enrichment and shifted patterns in the world's grassland: 1860–2016, Earth Syst. Sci. Data, 11, 175–187, https://doi.org/10.5194/essd-11-175-2019, 2019.
Yao, Y., Tian, H., Shi, H., Pan, S., Xu, R., Pan, N., and Canadell, J. G.: Increased global nitrous oxide emissions from streams and rivers in the Anthropocene, Nat. Clim. Change, 10, 138–142, 2020.