the Creative Commons Attribution 4.0 License.
the Creative Commons Attribution 4.0 License.
 | 13 Jun 2024
Mapping the future afforestation distribution of China constrained by a national afforestation plan and climate change
Shuaifeng Song
Xuezhen Zhang
Afforestation has been considered a critical nature-based solution to mitigate global warming. China has announced an ambitious afforestation plan covering an area of 73.78×10⁴ km2 for the period 2020–2050. However, it is unclear which areas will be suitable for afforestation under future climate change. Here, we carried out a finer-resolution (25×25 km) dynamical downscaling of climate change for China using the Weather Research and Forecast (WRF) model nested with the bias-corrected MPI-ESM1-2-HR model. Then, using the Holdridge life zone model forced by the WRF model output, we mapped the climatological suitability for forests in China. The results showed that the potential forestation domain (PFD) at present (1995–2014) approximated 500.75×10⁴ km2, and it would increase by about 3.49 % to 518.25×10⁴ km2 in the period 2041–2060 under the Shared Socioeconomic Pathway (SSP) scenario (SSP2-4.5). Considering the expansion of the future PFD due to climate change, the afforestation area for each province was allocated to grid cells following the climatological suitability for forests. The new afforestation grid cells would be located around and to the east of the Hu Line (a geographical division stretching from Heihe to Tengchong). Due to afforestation, the land cover would be modified. The conversion from grasslands to deciduous broadleaf forests in northern China took up the most area, accounting for 40 % of the new afforestation area. The grid-cell-resolved afforestation dataset was consistent with the provincial afforestation plan and the future climatological forest suitability. The dataset would be valuable for investigating the impacts of future afforestation on various aspects, including the carbon budget, ecosystem services, water resources, and surface hydroclimate regime.
- Article
(7319 KB) - Full-text XML
-
Supplement
(15148 KB) - BibTeX
- EndNote


Afforestation has been considered a reasonable nature-based solution for global warming (Rohatyn et al., 2022; Yu et al., 2022). Afforestation could increase carbon stocks in terrestrial ecosystems by absorbing atmospheric carbon dioxide through its biogeochemical effect (Jayakrishnan and Bala, 2023; Zhu et al., 2019; Gundersen et al., 2021). Moreover, afforestation changes the surface energy and mass budgets as well as the water cycle by modifying the surface albedo and roughness along with the partitioning between sensible and latent heat fluxes (Bonan, 2008; Breil et al., 2021; Wang et al., 2023). Specifically, afforestation causes warming effects through decreasing albedo and cooling effects through intensifying evapotranspiration, which can partly offset or amplify the cooling effects due to carbon uptake from the atmosphere (Arora and Montenegro, 2011). Afforestation not only impacts the climate, but also enhances forest ecosystem services such as maintenance and enhancement of habitat provisioning and species richness (Brockerhoff et al., 2017). In recent decades, China has implemented large-scale afforestation programmes (Zhang et al., 2000), such as the Three-North Shelter Forest Program (Hu et al., 2021), the Grain for Green Programme (Xiao, 2014), and the Natural Forest Conservation Program (Huang et al., 2019). These ecological engineering programmes have been beneficial for water conservation (Liu et al., 2023), mitigating climate warming (Yu et al., 2020), increasing terrestrial carbon sequestration (Shi and Han, 2014), reducing water erosion risk (Wang et al., 2021), and alleviating dust storms (Tan and Li, 2015). These initiatives have significantly increased China's total forest cover from 8.6 % in 1949 to 24.02 % in 2022 (Zhang and Song, 2006; Fu et al., 2023; Moore et al., 2016), and they have contributed to 42 % of land greening in China during 2000–2017 (Chen et al., 2019).
In September 2020, the Chinese government declared a specific objective of achieving carbon neutrality before 2060 (Liu et al., 2022; Zhao et al., 2022). In pursuit of this goal, China is committed to expanding its forest area in the future, and new national afforestation plans have been introduced. For instance, the Action Plan for Carbon Dioxide Peaking Before 2030 (State Council of China, 2021) outlines China's target to increase forest cover to 25 % by 2030. The National Forest Management Planning (2016–2050), issued by the State Forestry Administration of China in 2016, set the afforestation target of about 73.78×10⁴ km2 for the period 2020–2050 in China. Such extensive afforestation in the future would lead to land cover conversion from non-forestland to forestland, potentially causing a series of effects through the aforementioned biogeophysical and biogeochemical processes. It is important to note that the effects of afforestation are highly dependent on the afforestation location. For example, tropical afforestation may yield greater cooling effects than boreal afforestation (Arora and Montenegro, 2011). However, recent studies find that the benefits of afforestation may be overestimated, which is controversial, because the responses of the global carbon cycle to anthropogenic land use change are uncertain (Bastin et al., 2019; Veldman et al., 2019; Lewis et al., 2019). There is limited climate change net mitigation potential if tree planting occur in water-limited locations, such as in drylands (Rohatyn et al., 2022). It is therefore imperative to strategically allocate the national planned afforestation area to specific regions and project the possible land cover changes resulting from afforestation.
Various studies have examined the climatic effects of future afforestation scenarios (Abiodun et al., 2013; Naik and Abiodun, 2016; Diasso and Abiodun, 2018; Odoulami et al., 2019; Zhang et al., 2022). For example, Odoulami et al. (2019) fully replaced savanna areas (between 8 and 12° N) with evergreen broadleaf trees over West Africa to study the climate effects of future afforestation. An obvious increase in total annual precipitation was found over the afforested area. Similarly, Abiodun et al. (2013) employed random afforestation scenarios to replace 25 %–100 % of the current land cover in Nigeria and found a local cooling effect. In summary, these studies mostly employed idealistic and hypothetical afforestation scenarios and neglected the future climatological suitability of forests. In addition, process-based dynamic global vegetation models (DGVMs), such as LPJ-GUESS, have been extensively used to explore the responses of potential natural vegetation distribution to climate change (Hickler et al., 2012; Verbruggen et al., 2021), and they are also useful tools for quantifying future afforestation scenarios (Krinner et al., 2005; Horvath et al., 2021). The DGVMs driven by meteorological data generally consider complex biogeophysical, biogeochemical, and physiological processes, such as evapotranspiration, carbon–nitrogen interactions, and photosynthesis (Cramer et al., 2001). Given that the mathematical representations of these processes and their parameters as well as future meteorological scenario data from global climate models (GCMs) have large uncertainties, their overlap may yield greater uncertainties (Jiang et al., 2012; Martens et al., 2021).
The impact of future climate change is one of the biggest challenges. Previous studies (de Lima et al., 2022; Hinze et al., 2023) explored the responses of potential vegetation distribution to future climate change based on climate–vegetation models forced by the climate projection data of the GCM. However, the resolution of the raw GCM is too coarse (∼ 100–300 km) to describe the finer land surface features at a regional scale (Varney et al., 2022; Turner et al., 2023; Song and Yan, 2022; Parsons, 2020). To overcome such shortcomings, downscaling techniques are widely used to translate GCM output to regional high-resolution data. Statistical downscaling involves the establishment of statistical relationships between local climate variables and coarsely resolved atmospheric fields (Wilby and Dawson, 2013). However, it is not clear whether this historical statistical relationship is always stable in future climate scenarios. Moreover, statistical downscaling cannot ensure the physical consistency among meteorological variables. By contrast, physically based dynamical downscaling using a regional climate model (RCM) nested within a GCM could provide high-resolution climate simulations (Giorgi and Mearns, 1999; Mishra et al., 2014). Physical consistency is crucial for identifying potential afforestation regions due to the multiple meteorological variables involved. Previous studies (Liu et al., 2020a; Bowden et al., 2021) have employed the dynamical downscaling approach to quantify the climatological suitability of natural vegetation. However, previous studies (Niu et al., 2019; Wu and Gao, 2020) used the raw GCM outputs as the lateral boundary conditions (LBCs) of RCM. It is well known that raw GCM outputs have some uncertainties, and the accuracy of LBCs is the most critical factor affecting the performance of dynamical downscaling due to the underlying biases propagated into RCM through the LBCs (Sato et al., 2007; Moalafhi et al., 2017; Karypidou et al., 2023). Therefore, high-accuracy LBCs are the key to obtaining robust future potential vegetation types. Correcting the GCM outputs before dynamical downscaling is necessary for reducing the underlying uncertainty.
By taking into account the aforementioned background factors, this study aims to map the future afforestation distribution in China. It is highlighted that the results are constrained by both the national afforestation plan and future climate change. The national afforestation plan determines the total afforestation area of each province, and climate change determines where it is suitable for forest growth. Section 2 introduces the methodology. The main results are described in Sect. 3. The discussion and conclusions are presented in Sects. 4 and 5, respectively.
2.1 Data sources
This study used three categories of data: (1) ground meteorology measurements and satellite-observed land use/land cover data, (2) national planned afforestation area data, and (3) climate modelling data from GCM as well as ERA5 reanalysis data.
2.1.1 Ground meteorology measurement data and land use/land cover data
This study used observation data of air temperature and precipitation at 2 m from the CN05.1 dataset (Wu and Gao, 2013). This dataset has a spatial resolution of 0.25°×0.25° and a temporal resolution of days from 1995 to 2014. The dataset was produced by interpolating more than 2400 meteorological stations in China using the “anomaly approach”. The CN05.1 dataset has been widely used to evaluate the performance of RCM simulations in China (Yu et al., 2015; Huang and Gao, 2018; Yan et al., 2019; Gao et al., 2023).
Land use type is a key parameter of RCMs (Mallard and Spero, 2019; Yan et al., 2021). This study used the Moderate Resolution Imaging Spectroradiometer (MODIS) land cover type dataset (MCD12Q1) for the year 2020 (Fig. S1 in the Supplement), with a spatial resolution of 500 m (Friedl et al., 2010). The MCD12Q1 features a 17-class International Geosphere-Biosphere Programme (IGBP) classification scheme (Loveland et al., 2000). It could match the first 17 default categories of land use with the Weather Research and Forecast (WRF) model (Table S1 in the Supplement). The MCD12Q1 is highly accurate globally, with an overall accuracy of approximately 75 % (Friedl et al., 2010; Sulla-Menashe et al., 2019). It was widely used to investigate land use and land cover change (You et al., 2020; Hou et al., 2022) and served as the lower boundary conditions for climate modelling (Yu et al., 2017; Ge et al., 2020; Zhao et al., 2021).
2.1.2 National planned afforestation area data
This study also used the national planned afforestation area data, which were from the National Forest Management Planning (2016–2050) (NFMP) released by the State Forestry Administration of China (2016). The NFMP presented the total national afforestation area of 73.78×10⁴ km2 (equivalent to an increase in China's forest cover by 7.7 %) and the area corresponding to each province between 2020 and 2050 (Fig. 6d). The NFMP was utilized as a policy constraint to identify the future afforestation domain in China.
2.1.3 Climate modelling data and ERA5 reanalysis data
To select the optimal LBCs from GCM, Song et al. (2023) comprehensively evaluated the performance of GCM in the Coupled Model Intercomparison Project 6 (CMIP6). It was reported that the MPI-ESM1-2-HR model from the Max Planck Institute outperforms all other GCMs in East Asia. When compared with other CMIP6 models, the MPI-ESM1-2-HR model was reported to also have a higher performance in simulating various climatic variables such as the sea surface temperature (Bhattacharya et al., 2022), mean temperature (Karim et al., 2020), total precipitation (Kamruzzaman et al., 2022), and large-scale circulation (Han et al., 2022). The main configuration of the MPI-ESM1-2-HR model utilized in this study comprised the coupling of the atmospheric (ECHAM6.3) and ocean model (MPIOM version 1.6.2) and the JSBACH land surface scheme and HAMOCC ocean biogeochemistry model with a spatial resolution of 0.9375°×0.9375° on a latitude–longitude grid; the model is described in detail by Müller et al. (2018). The MPI-ESM-MR model involved in CMIP5, which was the precursor of the current MPI-ESM1-2-HR model, was widely used as the LBCs to force RCMs in carrying out finer-resolution climate simulation (Kebe et al., 2017; Ozturk et al., 2018; Crespo et al., 2023). It is well known that there are several Shared Socioeconomic Pathways (SSPs) for future climate projections in the CMIP6. Here, we used the climate projections of the MPI-ESM1-2-HR model under the middle-of-the-road pathway (i.e. the SSP2-4.5 scenario), which represents the development path most likely to occur (O'Neill et al., 2016).
The ERA5 reanalysis is the fifth-generation global reanalysis product developed by the European Centre for Medium-range Weather Forecast (ECMWF) (Hersbach et al., 2020). The state-of-the-art reanalysis data assimilated multi-source data including from ground-based meteorological measurements, satellite observations, and atmospheric sounding based on a 4D-var ensemble data assimilation system (Hersbach et al., 2020). The 6-hourly ERA5 reanalysis data with a spatial resolution of 1.0°×1.0° from 1994 to 2014 were also used as the LBCs. Climate variables for ERA5 reanalysis data and the MPI-ESM1-2-HR model include atmospheric fields (air temperature, specific humidity, zonal wind, meridional wind, geopotential height) and surface fields (i.e. sea surface temperature, surface pressure, soil temperature and moisture).
Despite performing better than other GCMs, the MPI-ESM1-2-HR model still exhibits biases. Hence, the corrections of climate mean and variance were carried out using the method reported by Xu and Yang (2012) according to Eqs. (1) and (2). The ERA5 data were used as a reference to correct the MPI-ESM1-2-HR model outputs. The MPI-ESM1-2-HR model outputs were interpolated into grid cells of 1.0°×1.0° using the bilinear interpolation method to match the ERA5 grid cells. The bias-corrected 6-hourly data of the MPI-ESM1-2-HR model retained the same means and variances as the ERA5 data (Figs. S2 and S3). This bias-corrected approach was applied to the atmospheric and surface fields:
where, Hcor and Fcor are bias-corrected data of 6-hourly MPI-ESM1-2-HR models over the historical period (1994–2014) and future period (2040–2060), respectively. DGCM_H and DGCM_F indicate anomaly by referring to the historical and future mean of MPI-ESM1-2-HR modelling, respectively. SDERA and SDGCM indicate the standard deviation of ERA5 and MPI-ESM1-2-HR simulations during the historical period, respectively. denotes the variance-adjusted term. MERA denotes the climatological mean of ERA5 data during the historical period, and MGCM_F−MGCM_H indicates the mean future climate change projected by MPI-ESM1-2-HR.
2.2 Methodology
The study consists of three steps. As shown in Fig. 1, the first step is to carry out dynamical downscaling and prepare finer-resolution climate data; the second step is to run the Holdridge life zone model to identify forest-suitable lands under future climate change scenarios; finally, the third step is to allocate the national afforestation plan area to 25 km, grid cells by taking into account the climatic suitability for forests.
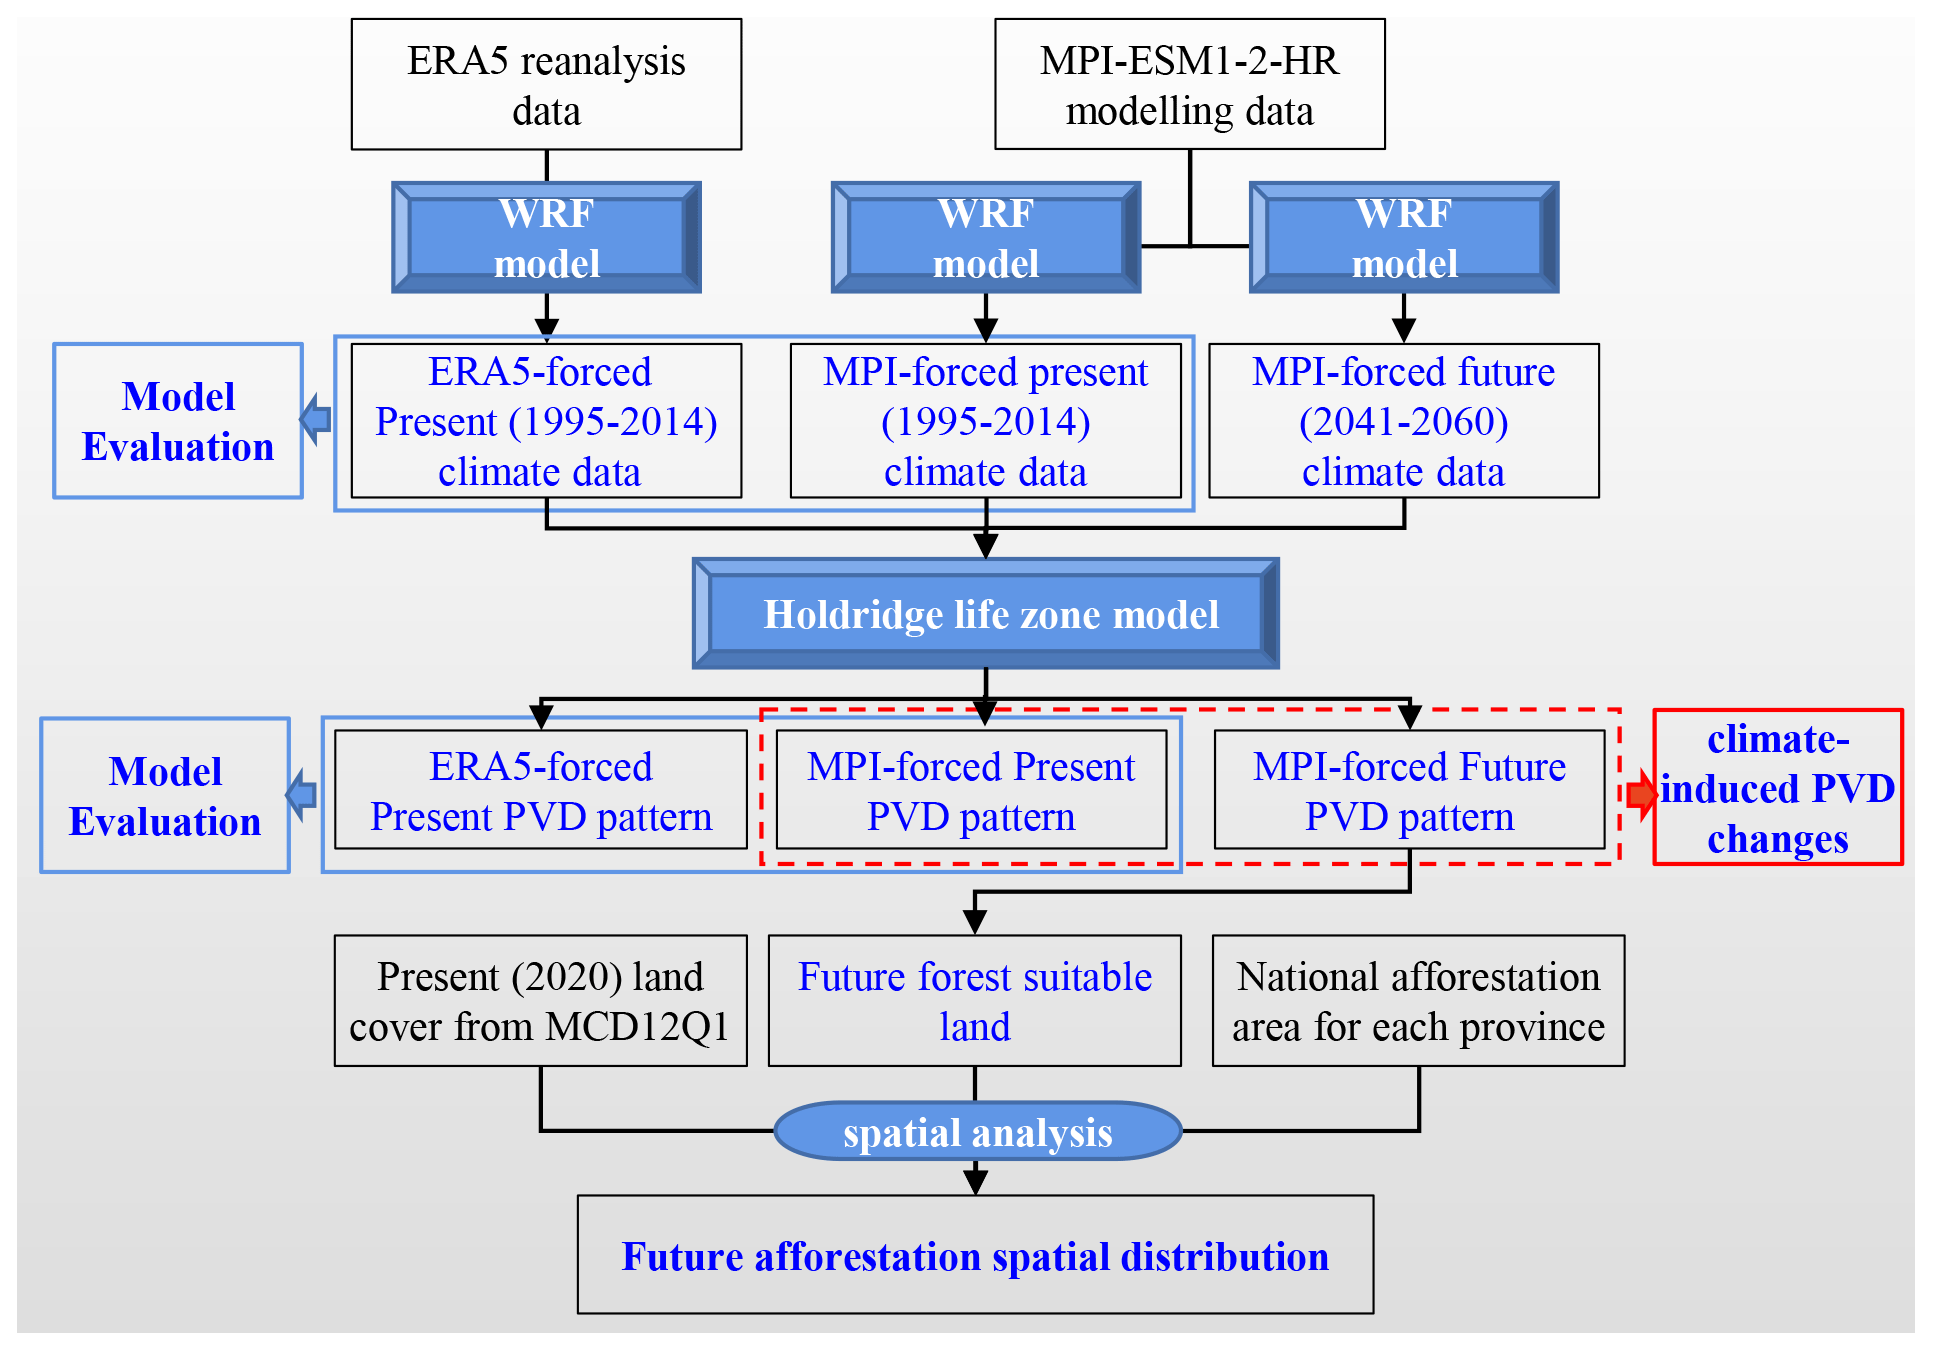
Figure 1Outline for mapping the spatial distribution of future afforestation in China (PVD: potential vegetation domain; WRF: Weather Research and Forecast model; MPI: MPI-ESM1-2-HR model).
2.2.1 Dynamical downscaling of GCM outputs
In this study, the WRF model served as an RCM and was utilized to obtain high-resolution simulations (Skamarock et al., 2019). As an open-source community mesoscale numerical model, the WRF model has generally been used to investigate regional climate modelling (Wang and Kotamarthi, 2015; Cardoso et al., 2019; Moustakis et al., 2021), weather diagnosis (Ullah and Shouting, 2013; Lu et al., 2021), numerical weather prediction (Case et al., 2008; Zheng et al., 2016), and land–atmosphere interactions (Wang et al., 2013; Zhang et al., 2020, 2021). Specifically, the WRF model has been demonstrated to reproduce well the historical spatiotemporal characteristics of temperature (Politi et al., 2021), precipitation (Moustakis et al., 2022), and biome classification (Zevallos and Lavado-Casimiro, 2022), and it can successfully project the changes in temperature and precipitation over China (Hui et al., 2018). The WRF model configurations and physical parameterization (Hu et al., 2015) used in this study are detailed in Table 1. The simulation domain is shown in Fig. 2.
Table 1Model configurations and physical parameterization for WRF simulations.
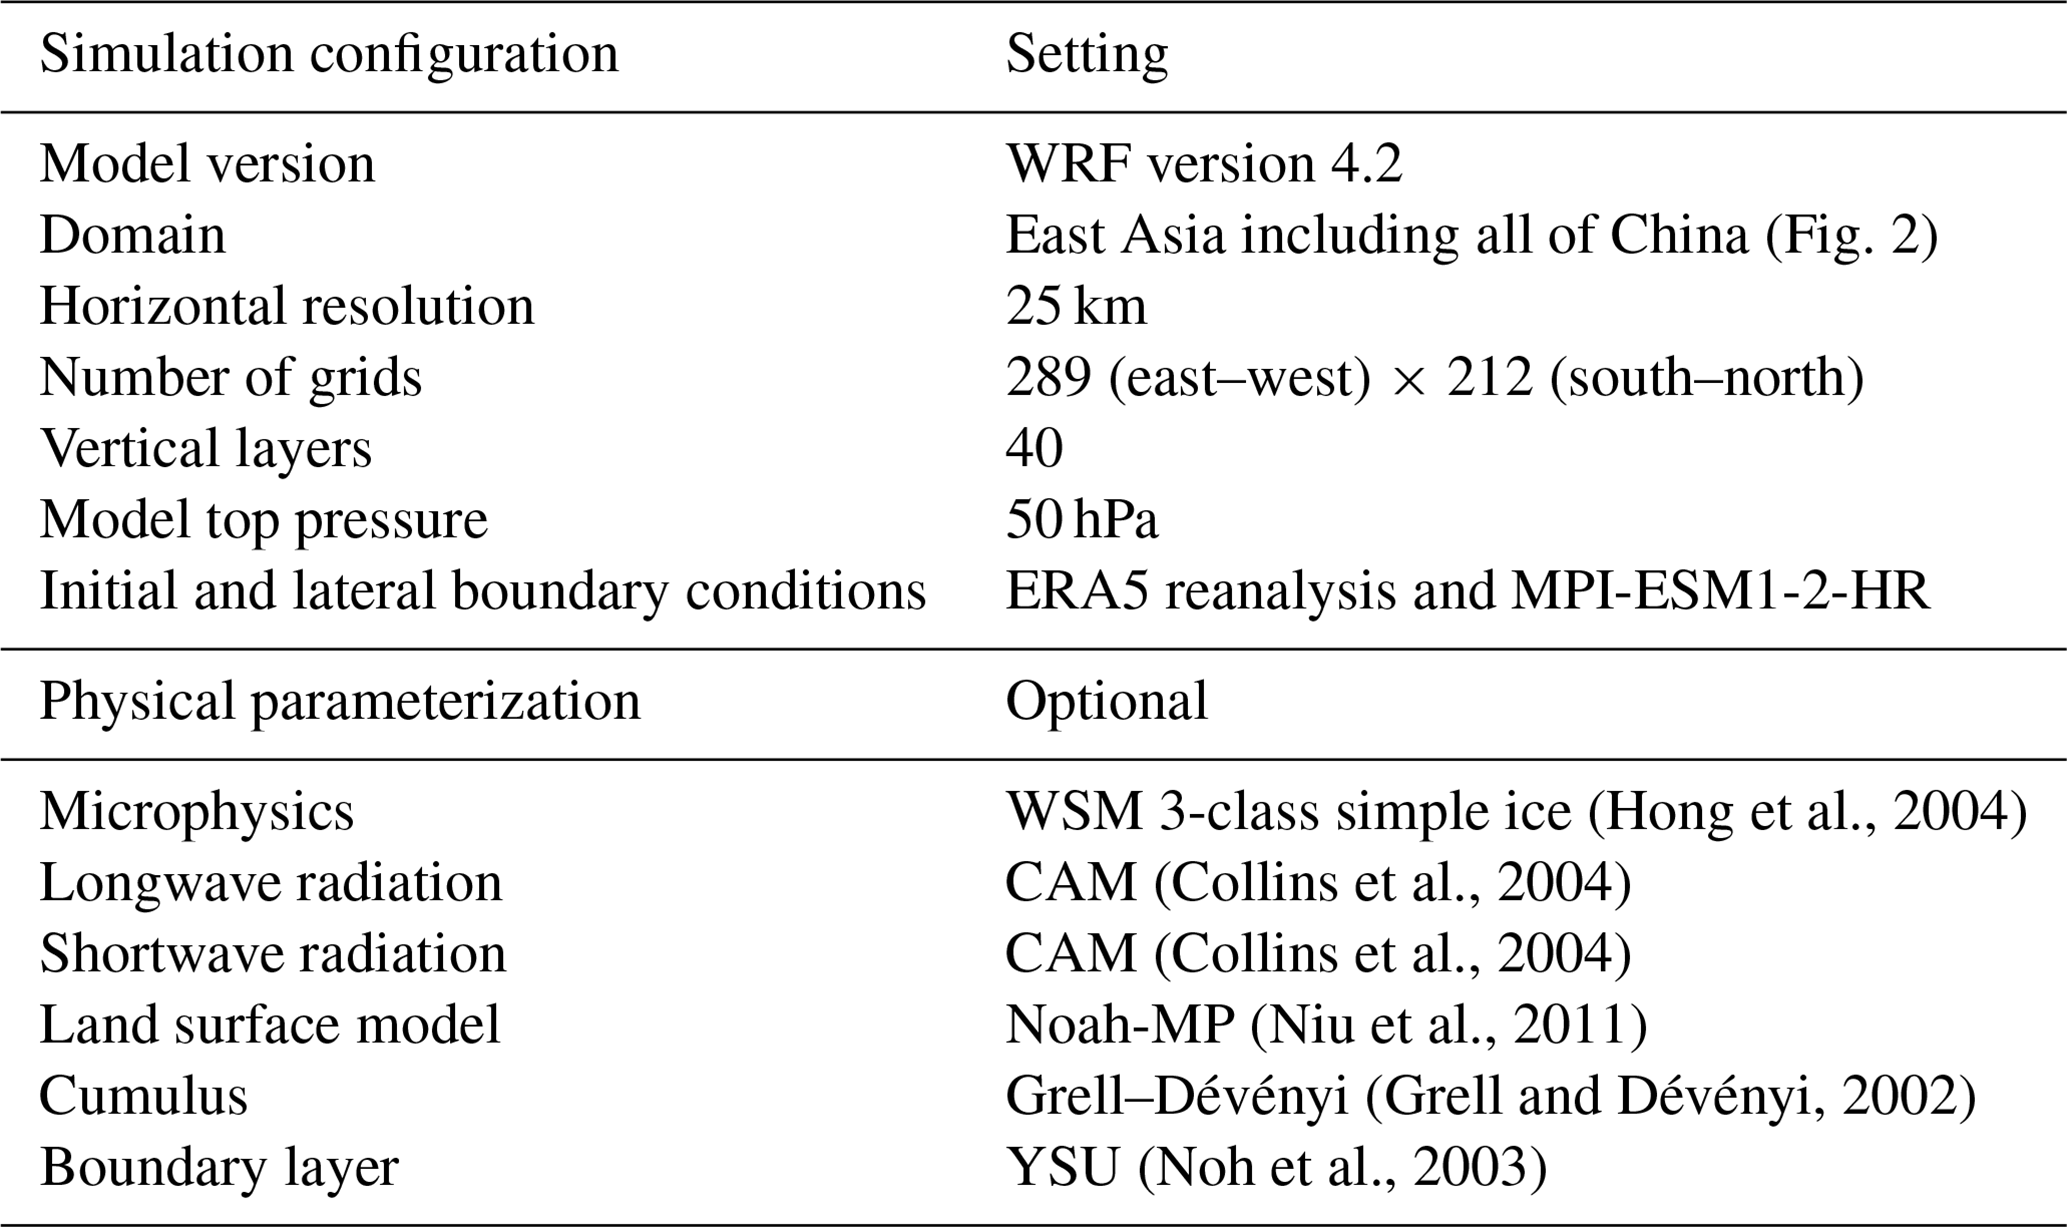
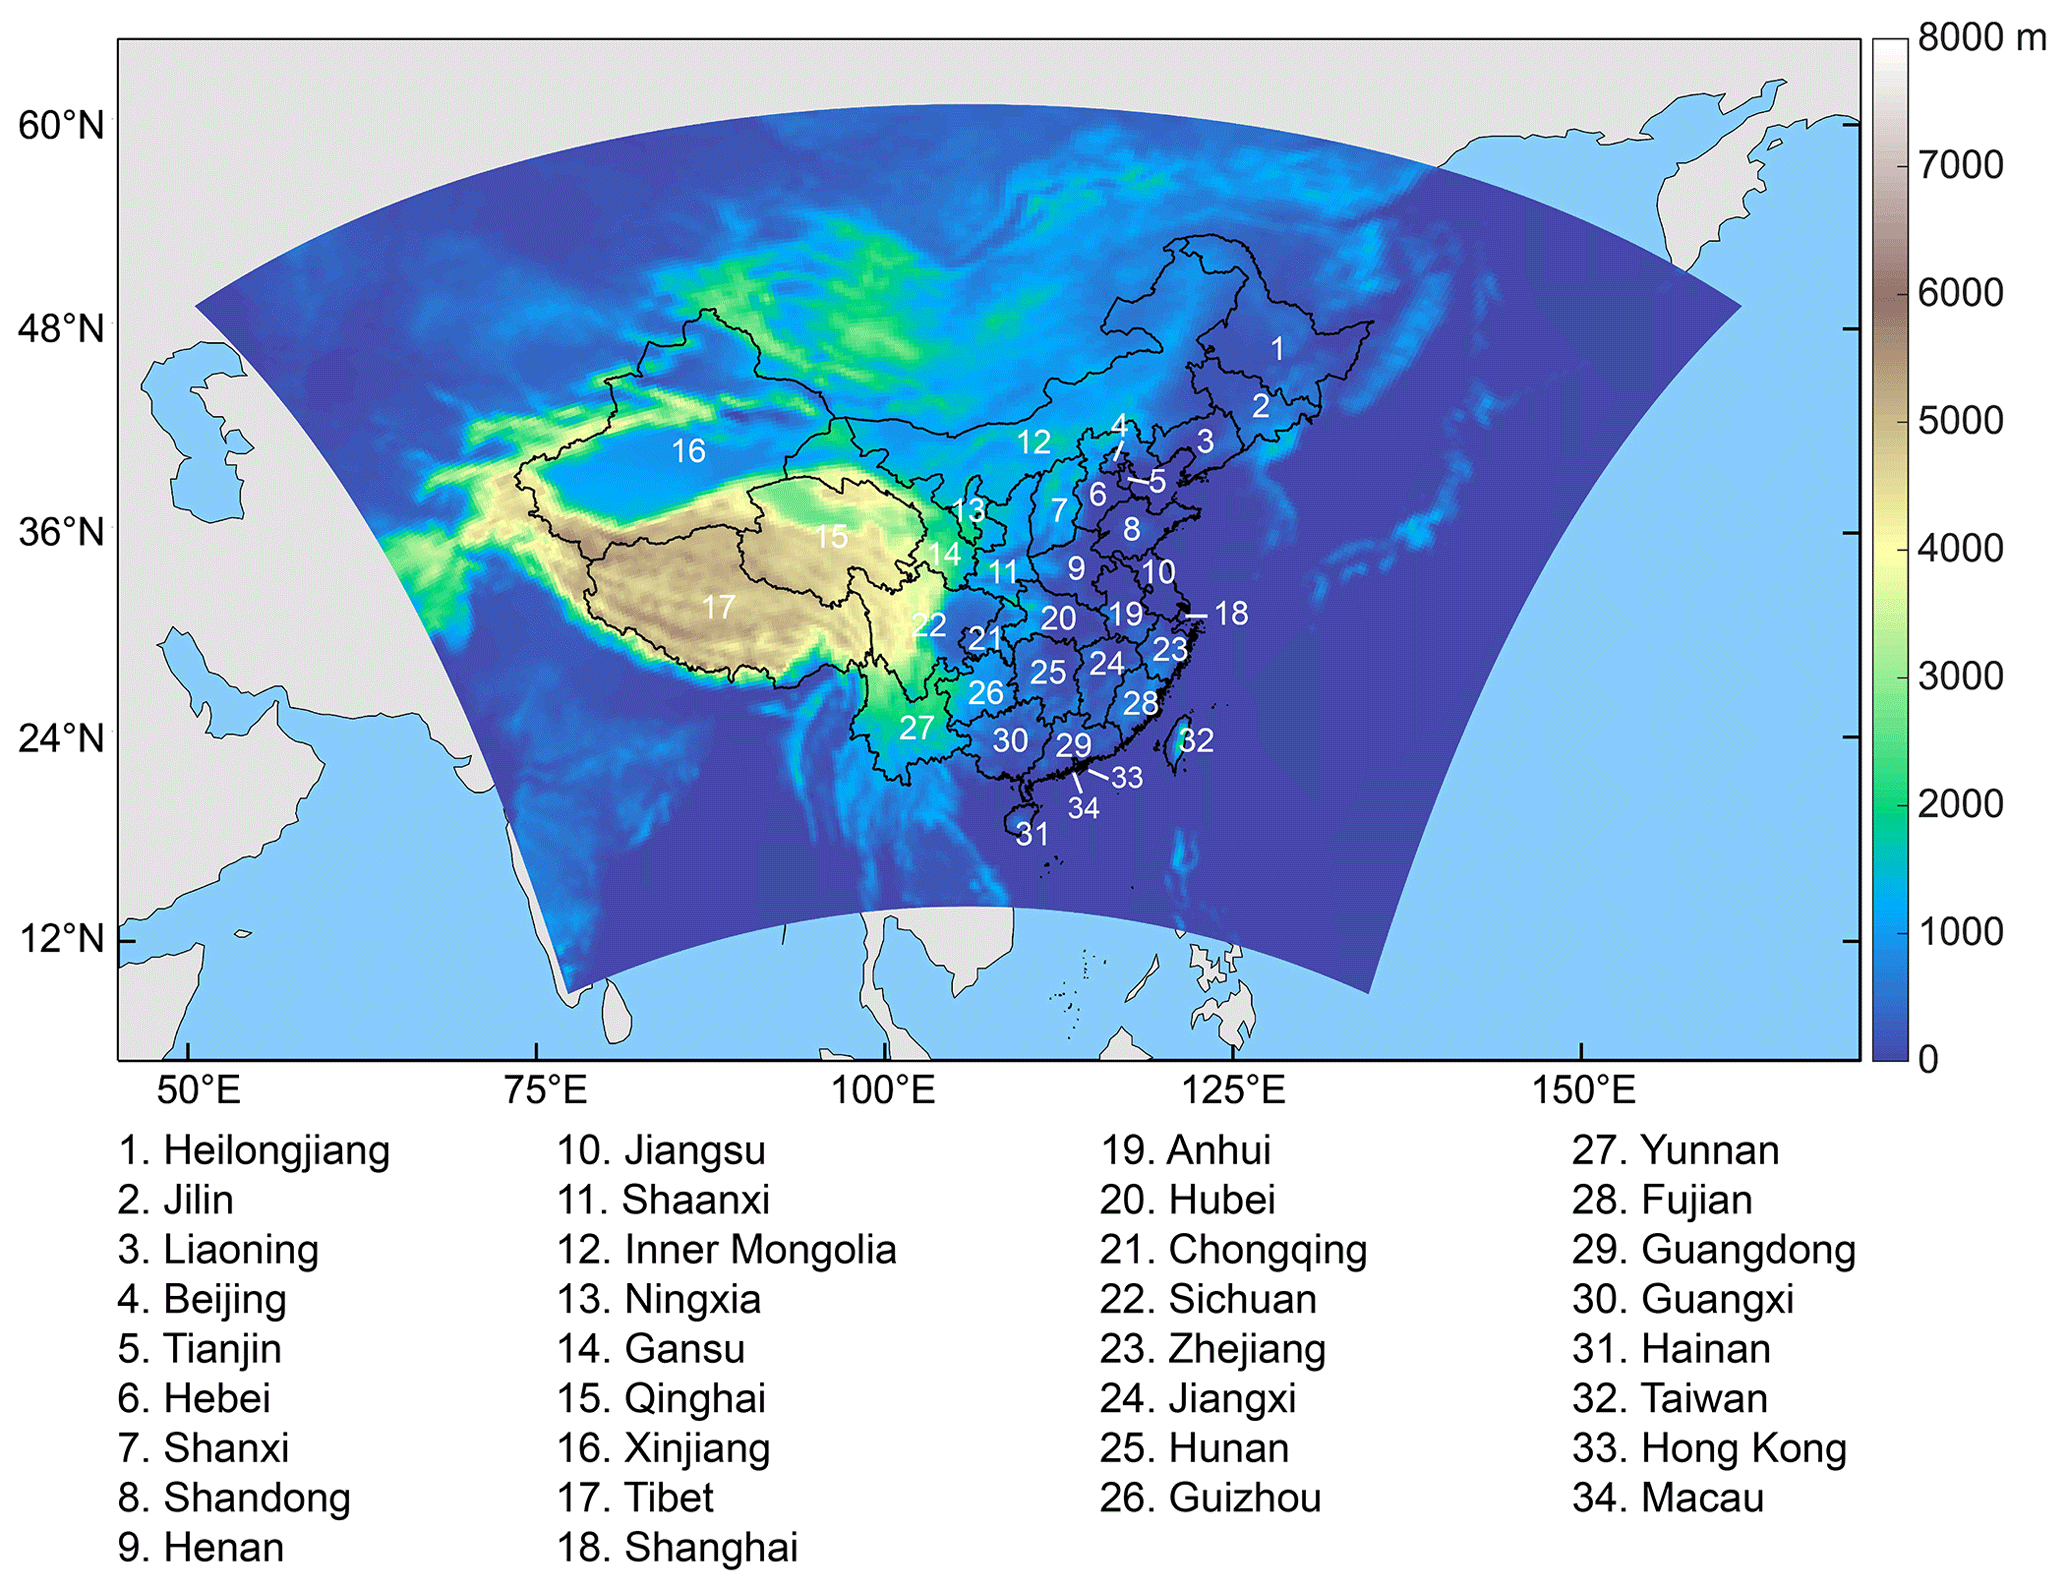
Figure 2Model domain with topography.
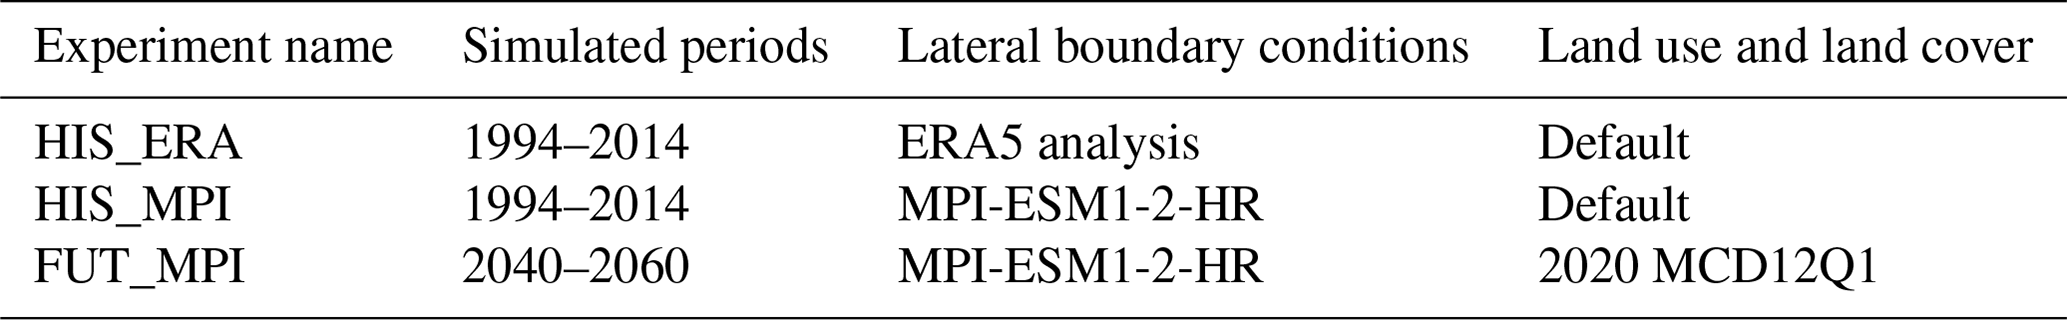
The last two decades (from 1994 to 2014) were considered the historical period in this study because the historical simulation for GCM is up to 2014. Given that the NFMP is implemented for afforestation up to 2050, the simulation for the future period covers the decade around 2050, from 2040 to 2060. Three 21-year numerical experiments were performed using the WRF model (Table 2). The first two experiments, HIS_ERA and HIS_MPI, simulated the historical climate change (1994–2014) using the ERA5 analysis and MPI-ESM1-2-HR models as LBCs and default land use, respectively. The future climate change experiment (FUT_MPI) used the 2020 MCD12Q1 land cover in simulating the future period (2040–2060). All the WRF experiments were run for 21 years (1994–2014 and 2040–2060), but the first year of each experiment (1994 and 2040) as spin-up time was discarded. The remaining 20-year period (1995–2014 and 2041–2060) was analysed. We compared the HIS_MPI and HIS_ERA experiments to validate the simulation performance. The FUT_MPI experiment generated a high-resolution future climate dataset under the SSP2-4.5 scenarios.
2.2.2 Identification of forest-suitable lands under future climate change scenario
The distribution of terrestrial ecosystems is directly affected by some main climate factors (i.e. temperature) (Piao et al., 2011; Tatli and Dalfes, 2016). Therefore, the impact of future climate change on forest-suitable lands is a further factor to be analysed. It is noted that the forest-suitable lands in this study indicate the area of the potential forestation domain (PFD). Climate–vegetation models can describe the relationship between the potential vegetation domain (PVD) and the climatic conditions (Dan et al., 2005; Kummu et al., 2021; Anwar and Diallo, 2022). Among a series of climate–vegetation models – such as the Holdridge life zone (HLZ) model (Holdridge, 1947), BIOME4 model (Kaplan, 2001), BOX model (Box, 1981), LPJ-DVGM model (Sitch et al., 2003), MAPSS model (Neilson et al., 1992), and IBIS model (Foley et al., 1996) – the HLZ model is a classification model for simulating the correlation between the potential terrestrial ecosystem types and climate change based on the combination of key climate variables (Holdridge, 1947). In recent years, the HLZ model has been globally well accepted and used to quantitatively identify the impacts of climate change on the distribution of PVD at the global (Elsen et al., 2022; Navarro et al., 2022), continental (Fan et al., 2019), and regional scales, e.g. China (Fan and Bai, 2021; Li et al., 2022). Therefore, the HLZ model was used to obtain the spatial pattern of forest-suitable lands during 2041–2060 under the SSP2-4.5 scenario over China.
The HLZ classification system requires daily temperature and monthly precipitation to obtain three bioclimatic variables: annual average biotemperature (AT), annual total precipitation (TP), and potential evapotranspiration ratio (PE). The output of the FUT_2020 experiment provides these meteorological variables. The HLZ model is estimated with a specific calculation formula as follows:
where, AT(t), TP(t), and PE(t) are the AT (°C), TP (mm), and PE for each grid in the period t, respectively. T(j,t) and P(j,t) are the mean temperature with values above 0 and below 30 °C and the total precipitation on the jth day in the period t, respectively; n is the number of days in a year. TEM(t)=ln AT(t), PER(t)=ln TP(t), PET(t)=ln PE(t); Ti0, Pi0, and Ei0 are the reference values of the classification scheme of the AT logarithm, TP logarithm, and PE logarithm, respectively, at the central point of the ith potential vegetation type in the HLZ model classification scheme. HLZ(t) is the ith potential vegetation type in the period t. A low HLZ value indicates greater potential vegetation. Fan et al. (2019) improved the HLZ model and revised the classification scheme, which was applied successfully to Eurasia. In this study, the reference values of the classification scheme were used to quantify the distribution of potential vegetation types in China (Table S3); for more details, the reader is referred to Fan et al. (2019). Compared to the actual vegetation types, the HLZ model can reproduce the potential forest distribution and grassland–forest geographical boundary well (Fig. S4).
2.2.3 Approach for allocation of new afforestation areas
In this section, we designed an approach to allocate the new afforestation area for each province into grid cells. To obtain plausible afforestation scenarios, the overall principles were that future afforestation areas should consider both future climate change and the national afforestation plan. The specific details are as follows:
- 1.
The final total afforestation area should be consistent with the NFMP.
- 2.
Present forestland, cropland, urban, wetland, and water body areas must not be encroached on. If the demand of the NFMP cannot be met, we consider minimizing encroachment on cropland. This can establish the concept of sustainable development as well as avoid repeated afforestation in the future (Zomer et al., 2008). The present land cover dataset for the year 2020 is based on MCD12Q1.
- 3.
After afforestation, China's cultivated land area is not expected to fall below 121.67×10⁴ km2 according to the requirements of the National Land Planning Outline (2016–2030) (State Council of China, 2017). This ensures that the cultivated land area stays within the “red line” and enhances people's welfare.
- 4.
Afforestation is implemented in areas where the potential vegetation type is forestland in the context of future climate, according to the output of the HLZ model. This measure could ensure that future climate conditions are suitable for the growth of forests.
- 5.
Areas with a low HLZ value are given priority afforestation. The HLZ metric is a comprehensive metric considering the biotemperature, precipitation, and potential evapotranspiration ratio. A low HLZ value means a greater chance of the area being potential forestland according to the HLZ model.
3.1 Model evaluation
We evaluate the performance of the key climate variables and PVD based on the observations and two WRF simulations (HIS_ERA and HIS_MPI). The performance of the WRF simulation is quantified by the bias, mean absolute error (MAE), and spatial correlation coefficient (R) for the bioclimatic variables (AT, TP, and PE). Larger R values and smaller bias and MAE values indicate better performance. Figure 3 illustrates the spatial patterns of the observed and simulated multi-annual averaged (1995–2014) AT, TP, PE, and HLZ types in China. The WRF simulation can reproduce well the spatial distribution of the observations with an increasing northwest to southeast temperature and precipitation gradient. However, the underlying bias still remains against the observations (Figs. S5–S7). A more detailed inspection of the scatterplots shows that the spatial correlation coefficient between the observation and simulations (HIS_ERA) is 0.982 for AT, 0.795 for TP, and 0.754 for PE (Fig. 4). The simulated AT is generally underestimated in most regions, with the national-average bias of −0.974 °C. Consistent with the previous studies (Meng et al., 2018), the largest cold biases are in the Tibetan Plateau and complex terrain regions (Fig. S5), with a bias of more than −3.6 °C, which could be attributed to the poor simulation of the snow–ice albedo feedback process (Ji and Kang, 2013). The simulated AT is relatively better in eastern China. The WRF simulation generally overestimates TP in most regions with a national-average bias of 92.883 mm (Fig. 4d). The wet bias could be attributed to inappropriate parameterization schemes (Ou et al., 2020; Zhao et al., 2023), coarse horizontal resolution (Lin et al., 2018; Rahimi et al., 2019), and inappropriate land surface processes associated with soil moisture and freezing–thawing (Fu et al., 2020; Yang et al., 2018). However, the scatterplot dispersion displays that the simulated TP exceeding 1200 mm in southern China is underestimated (Fig. S5). It is not surprising that the temperature is well modelled, but the simulation capacity of precipitation-related variables is modest for the WRF model (Gao, 2020). It should be noted that the HIS_ERA simulation exhibits a highly consistent representation to that of HIS_MPI. The cross-correlations for three climate variables between the HIS_ERA and HIS_MPI simulation show a high spatial correlation coefficient, and the scatter distribution is very close to the 1:1 line (Fig. 4).
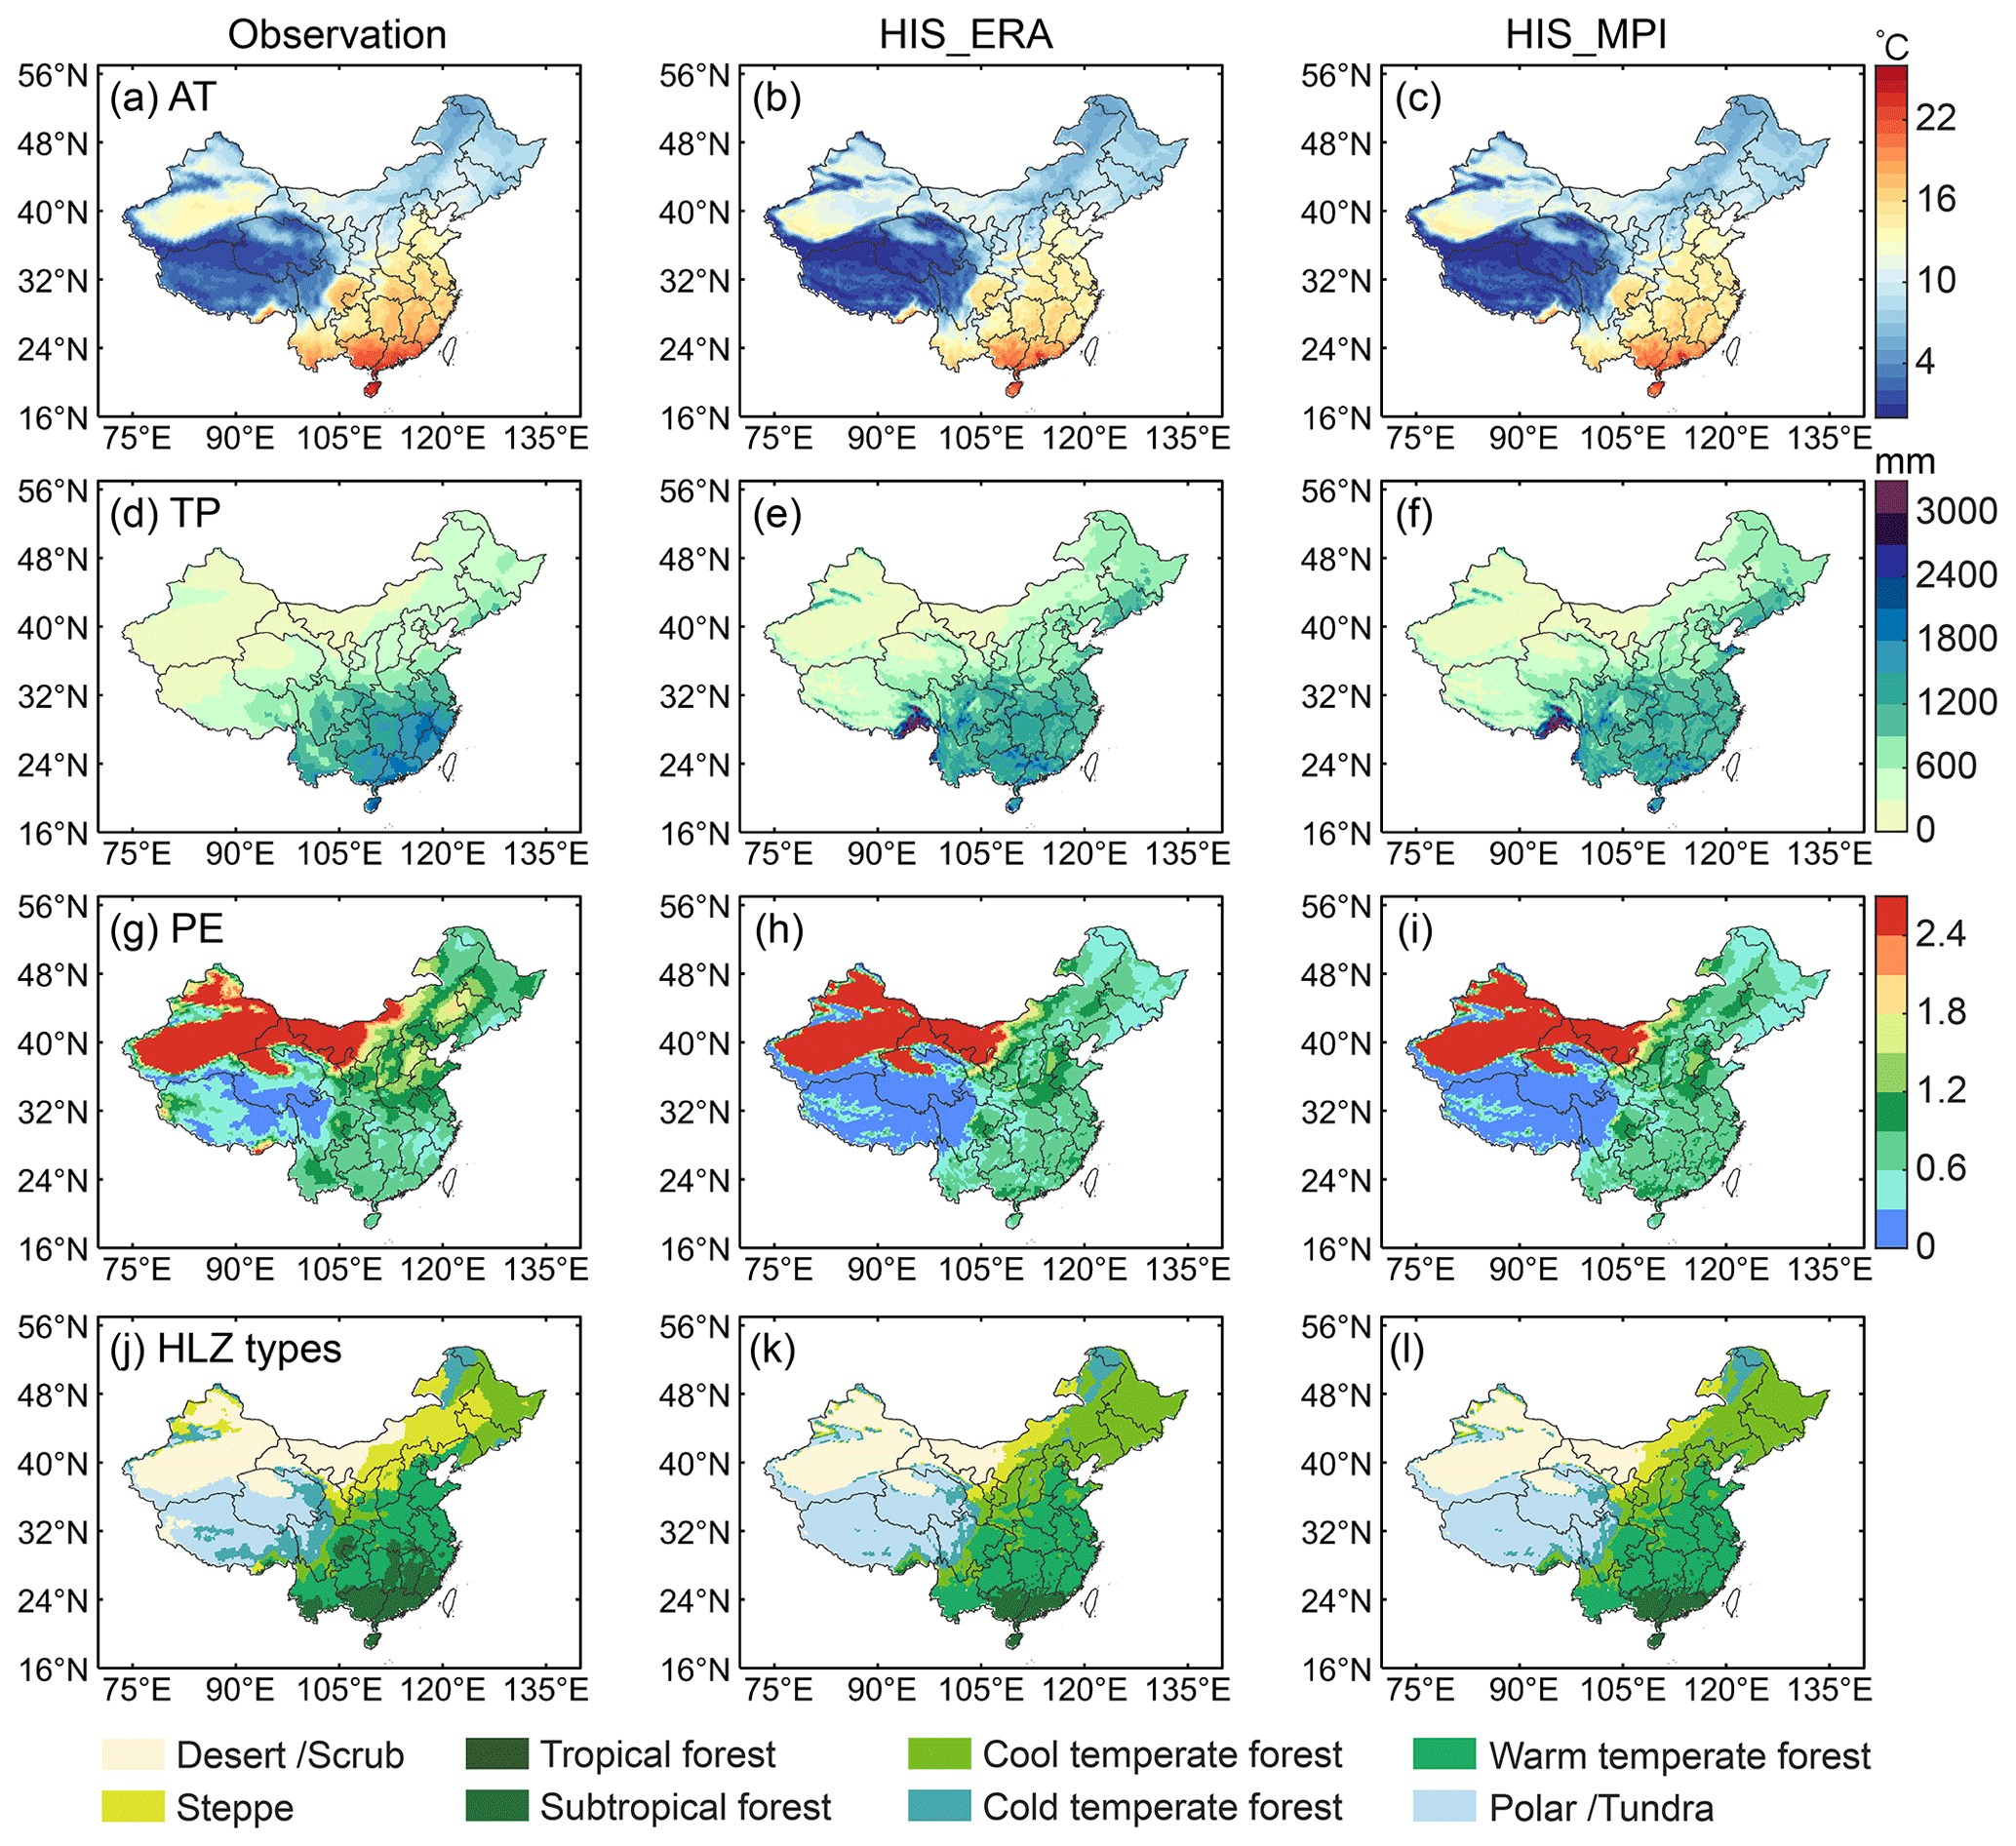
Figure 3Spatial pattern of annual average biotemperature (AT), annual total precipitation (TP), potential evapotranspiration ratio (PE), and potential vegetation domain from the Holdridge life zone (HLZ) model based on observations (a, d, g, j), HIS_ERA simulations (b, e, h, k), and HIS_MPI simulations (c, f, i, l) during the period 1995–2014.
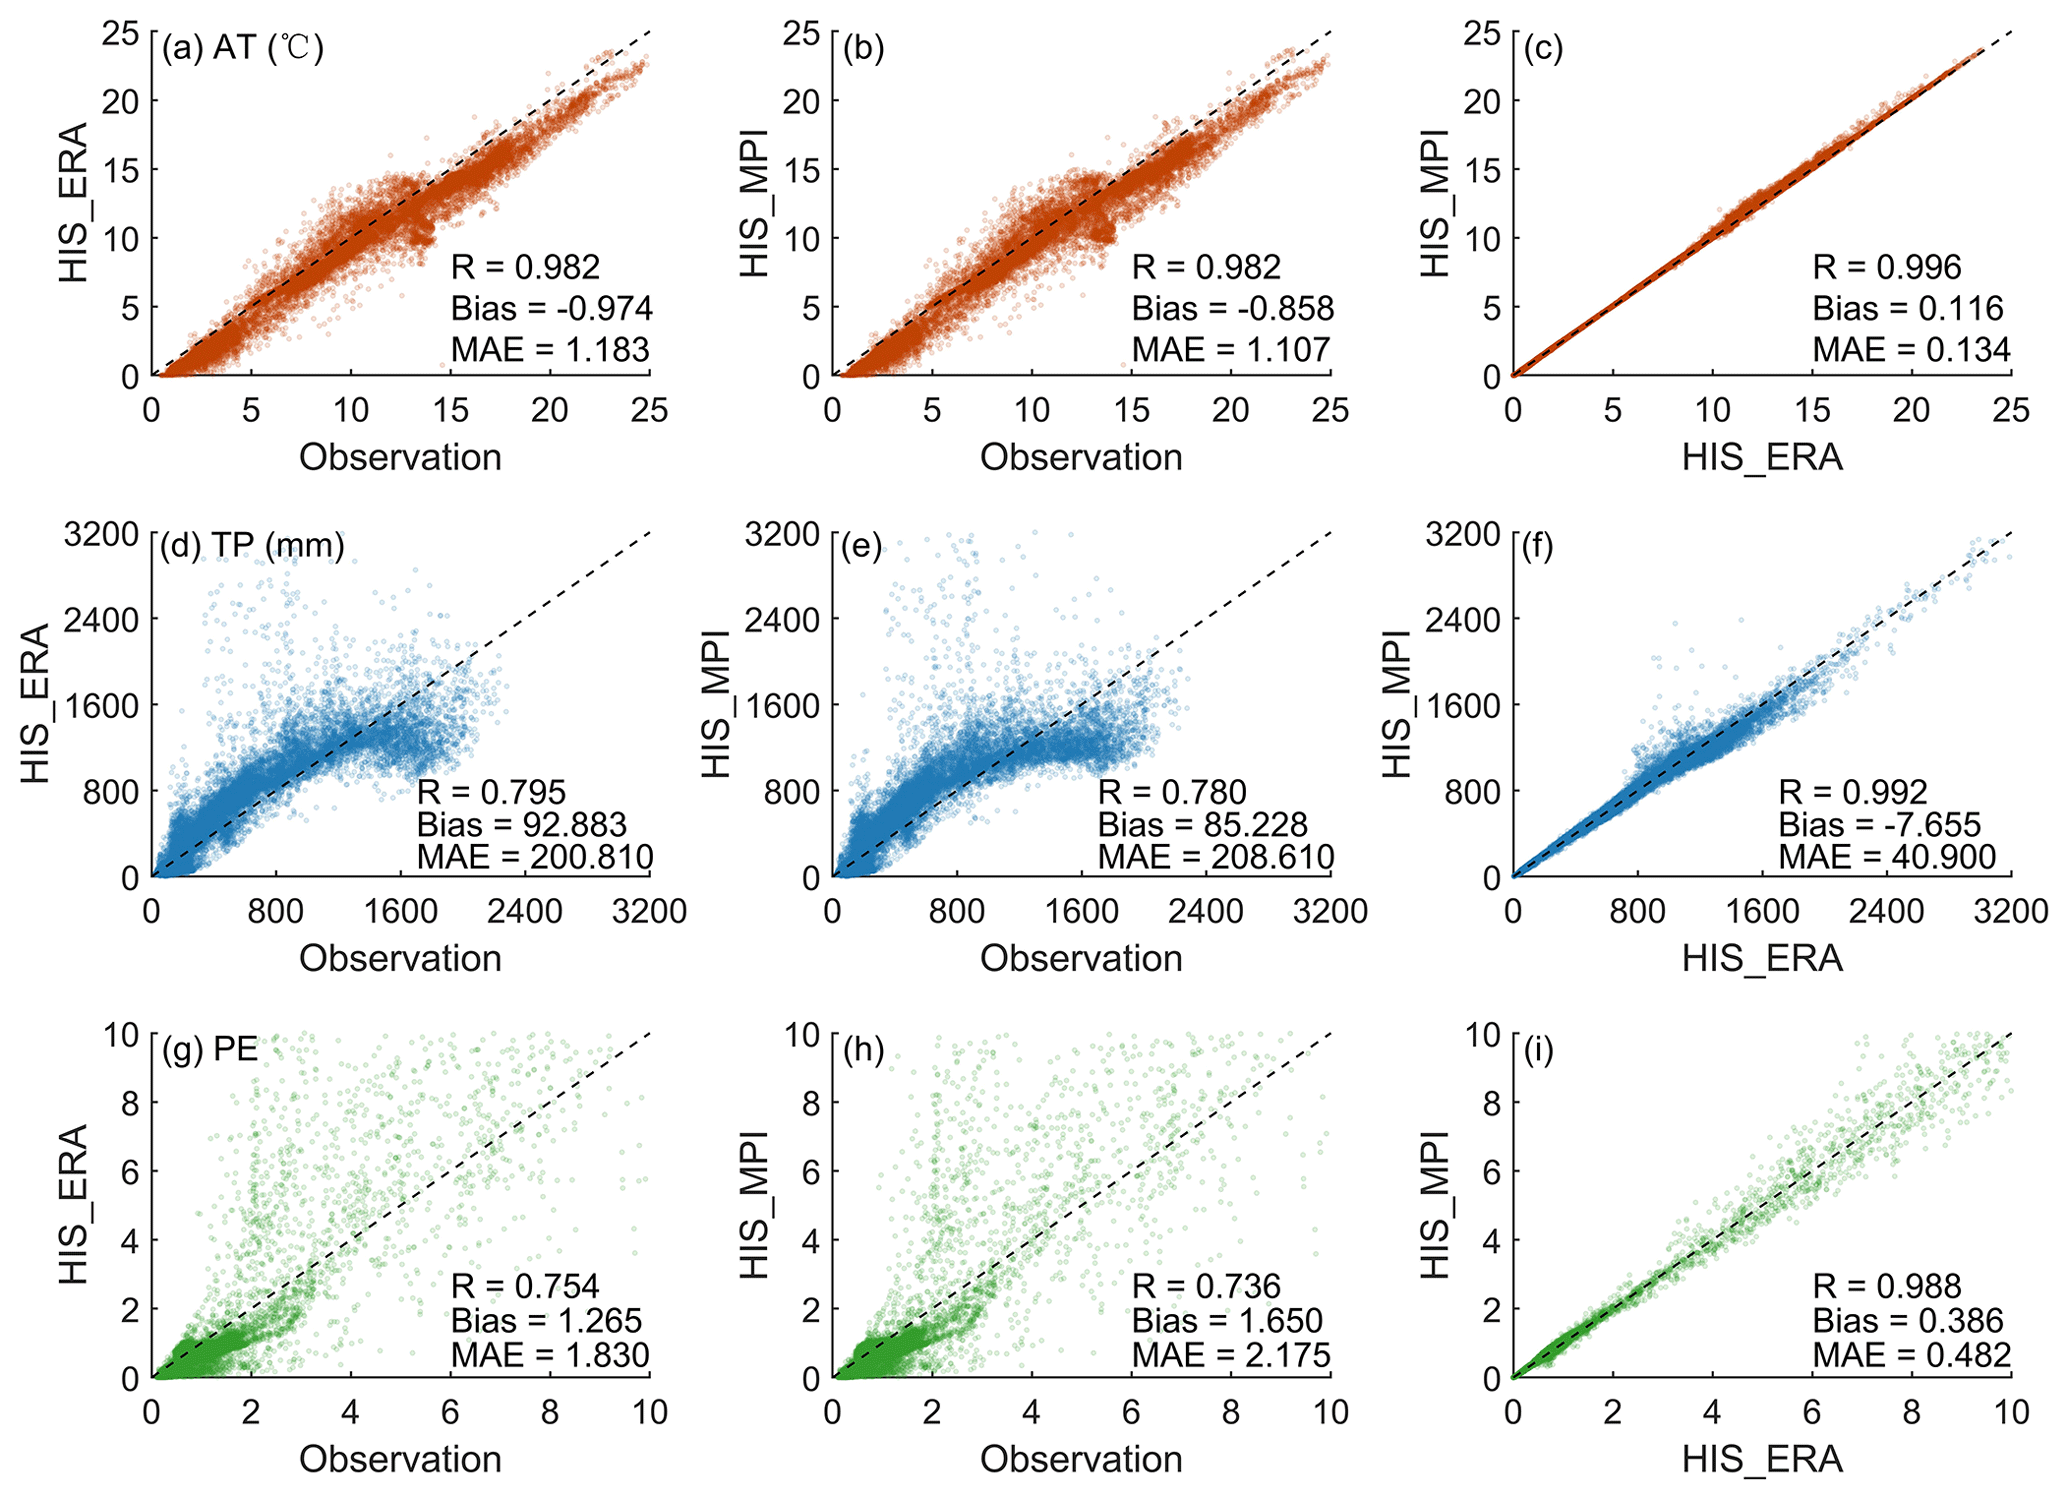
Figure 4Scatterplots of the annual average biotemperature (AT), annual total precipitation (TP), and potential evapotranspiration ratio (PE) for each grid against the observations and HIS_ERA, the observations and HIS_MPI, and HIS_MPI and HIS_ERA. HIS_ERA and HIS_MPI indicate the WRF simulation driven by the ERA5 reanalysis data and the bias-corrected MPI-ESM1-2-HR model, respectively. The observation is derived from the CN05.1 dataset. Evaluation indexes include the bias, mean absolute error (MAE), and spatial correlation coefficient (R). The dotted black line indicates the 1:1 line.
The observed and simulated results of PVD are shown in Fig. 3j–l. The kappa statistic is applied to validate the observed and simulated accuracy of the PVD map from the HLZ model (Cohen, 1960). The kappa coefficient ranges from 0 to 1.0, and the degree of agreement differs across these ranges. According to the description of Landis and Koch (1977), a kappa coefficient range of 0–0.2 is considered slight agreement, 0.21–0.40 is fair agreement, 0.41–0.60 is moderate agreement, 0.61–0.80 is substantial agreement, and 0.81–1.00 is almost perfect agreement. Overall, the WRF_ERA simulation could reproduce the distribution of PVD well in China. However, some minor differences in vegetation types are found. For example, in the northeast region of China, the WRF simulation could not precisely reproduce the observed extent of steppe types. Such misclassified zones could be due to the fact that the model overestimated the precipitation exceeding 220 mm in the transition zone of a dry–wet climate (Fig. S5d); thus, the vegetation types are changed from steppe to cool temperature forest. Other disagreement types are found in southern China, where the observed subtropical forest expands northward up to 32° N. However, the simulation results reduce the extent. The dry bias of precipitation simulation in southern China could explain the source of uncertainty. Despite the limited ability displayed by the models, the overall accuracy based on the kappa coefficient indicates a substantial agreement between the observation and the WRF simulation. When compared with the observations, the kappa coefficient is 0.648 for HIS_ERA and 0.662 for HIS_MPI. This suggests a perfect agreement (kappa coefficient = 0.962) of the PVD between the HIS_MPI and HIS_ERA (as shown in Fig. 3k and l). The implementation suggests that the bias-corrected MPI-ESM1-2-HR model can replace the ERA5 reanalysis data as the LBCs of WRF to obtain similar accuracy in high-resolution simulations. Therefore, in the following analysis, the WRF model forced by the bias-corrected MPI-ESM1-2-HR model will be applied to project future climate change.
3.2 Future potential vegetation cover
For the future simulation, the three key variables (AT, TP, and PE) of the HLZ model are obtained from the FUT_MPI experiment. The projected spatial distribution of PVD is presented in Fig. 5a. The most dominant vegetation types are forest, polar/tundra, and desert/scrub, accounting for 57.1 %, 20.1 %, and 17.7 % of the total area of China, respectively. The forest types are located in eastern China, characterized by a latitudinal distribution. The potential forest types from north to south are mainly cool temperate forests, warm temperate forests, and subtropical forests, in that order. This may be explained by the fact that temperature is the critical factor in defining the forest types due to the sufficient precipitation in eastern China.
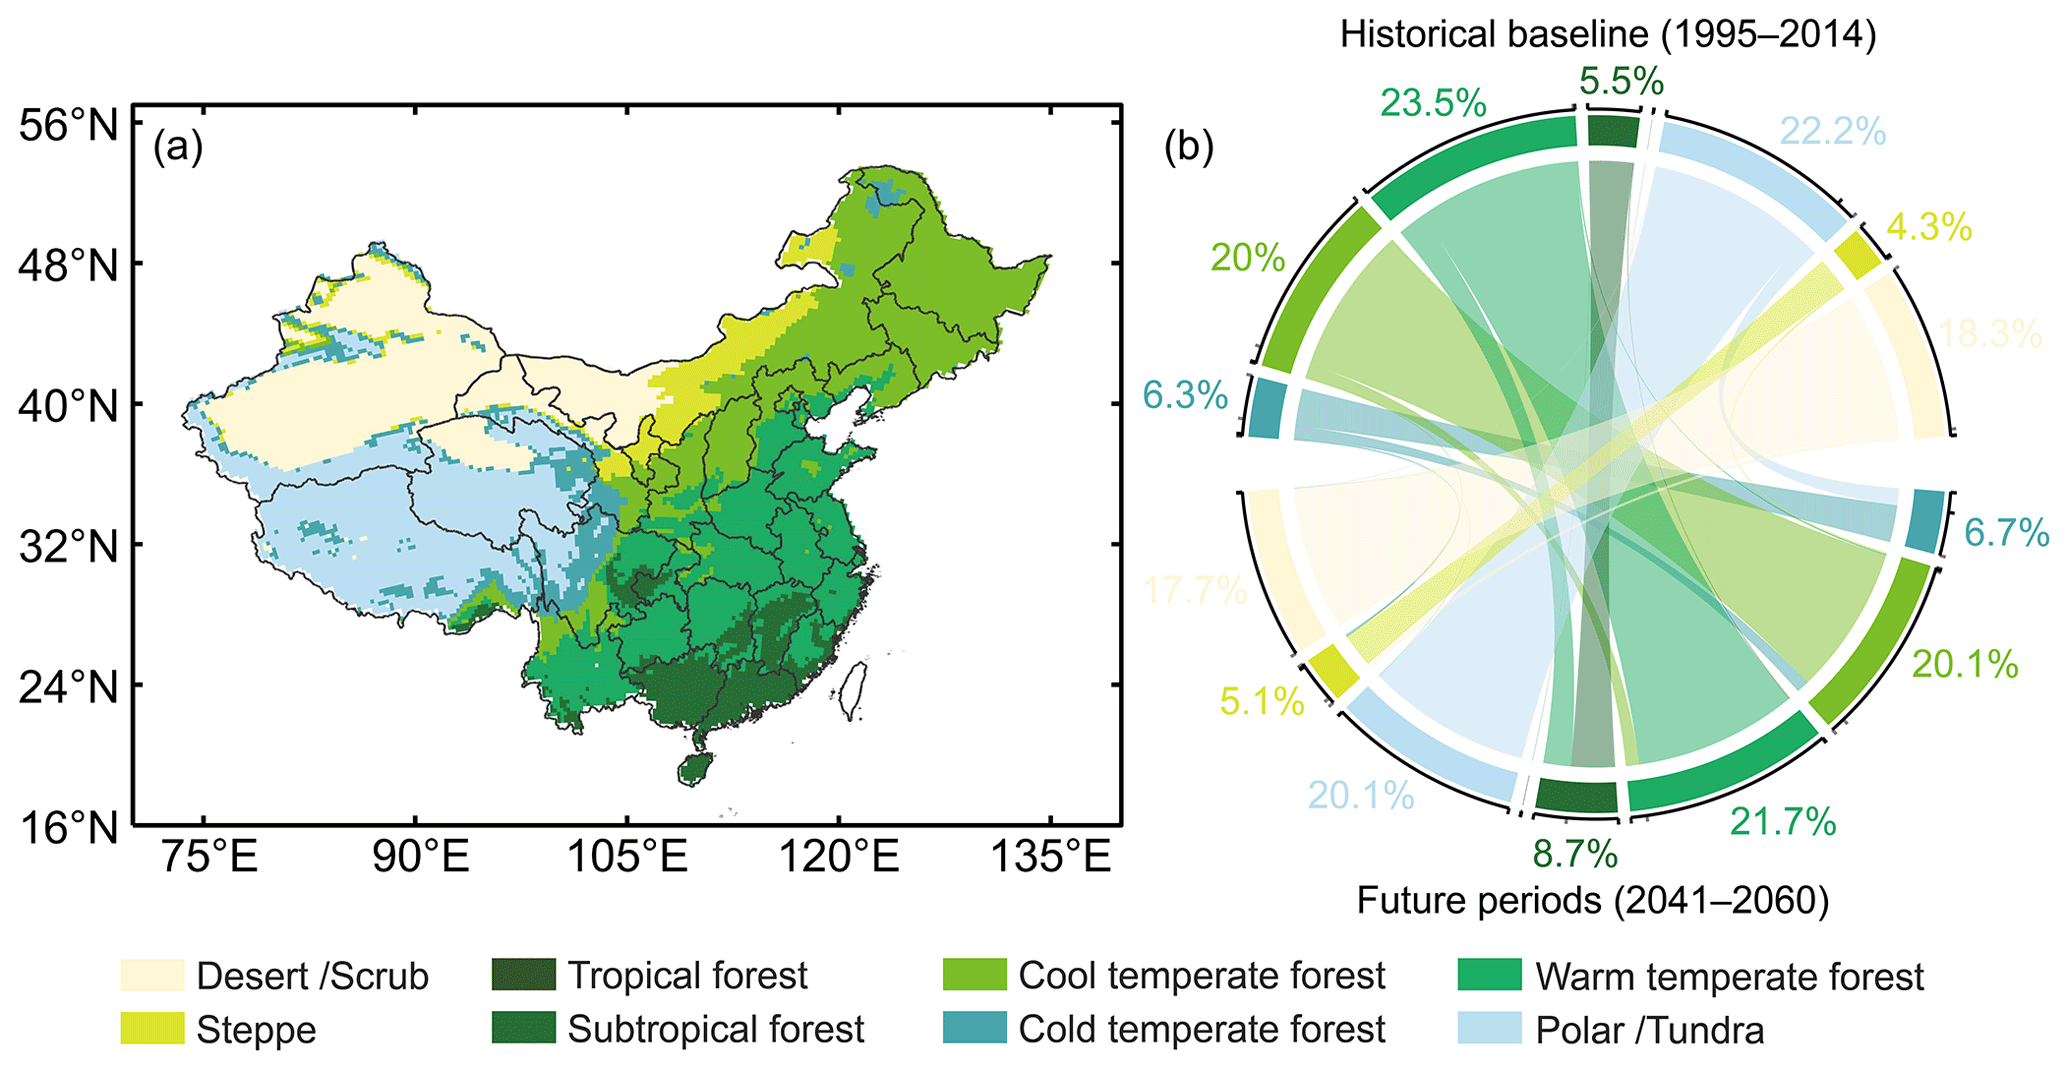
Figure 5Projected spatial pattern of (a) potential vegetation types from the HLZ model under the SSP2-4.5 scenario in the future period (2041–2060) from the FUT_MPI simulation and (b) area changes across historical baseline (1995–2014) and future period, where the calculations are based on the FUT_MPI simulation versus the HIS_MPI simulation.
Flow diagrams are useful tools for depicting precise changes in vegetation types, displaying whether the vegetation types are shifting and in which direction. The projected changes in the vegetation types for the area are shown in Fig. 5b. The results indicate that under future climate change, the PVD changes correspondingly. A total area of 10.4 % will be shifted in China. The northward expansion of subtropical forests replaces warm temperate forests, with an area of approximately 30.6×10⁴ km2, which is considered the largest shift type (Fig. S8). In addition, projected future increases in temperature and precipitation have caused some non-forestland areas to transition into forested lands (Fig. S9). For example, in western China, areas that are polar/tundra and steppe at present have transitioned into cold temperate forest and cool temperate forest in the future, respectively, and the shifted area is 18.4×10⁴ and 1.7×10⁴ km2, respectively.
Overall, the PFD (1995–2014) covers approximately 500.75×10⁴ km2. It is projected to expand to 518.25×10⁴ km2, experiencing an increase of around 17.5×10⁴ km2 (about 3.49 %) within the period 2041–2060 under the SSP2-4.5 scenario. In eastern China, the main transition is interconversion between forest types. In western China, some non-forestland types turn into forest types. These changes indicate that the forest-suitable region would be modified under future climate change, and it is necessary to consider the climatic contexts in terms of future large-scale afforestation.
3.3 Identification of future potential afforestation location in China
According to the approach of the new afforestation allocation in Sect. 2.2.3, we mapped the future afforestation distribution of China. First, historical open-space regions for afforestation were identified. We excluded some ineligible regions, including present forestland, cropland, urban, wetland, and water body areas based on the 2020 MCD12Q1 land cover data (Fig. S1); the remaining regions were considered open-space regions for afforestation (Rohatyn et al., 2022). The results show that the total area of open-space regions is about 612.88×10⁴ km2 in China, with the majority located in southern and western China (Fig. 6a).
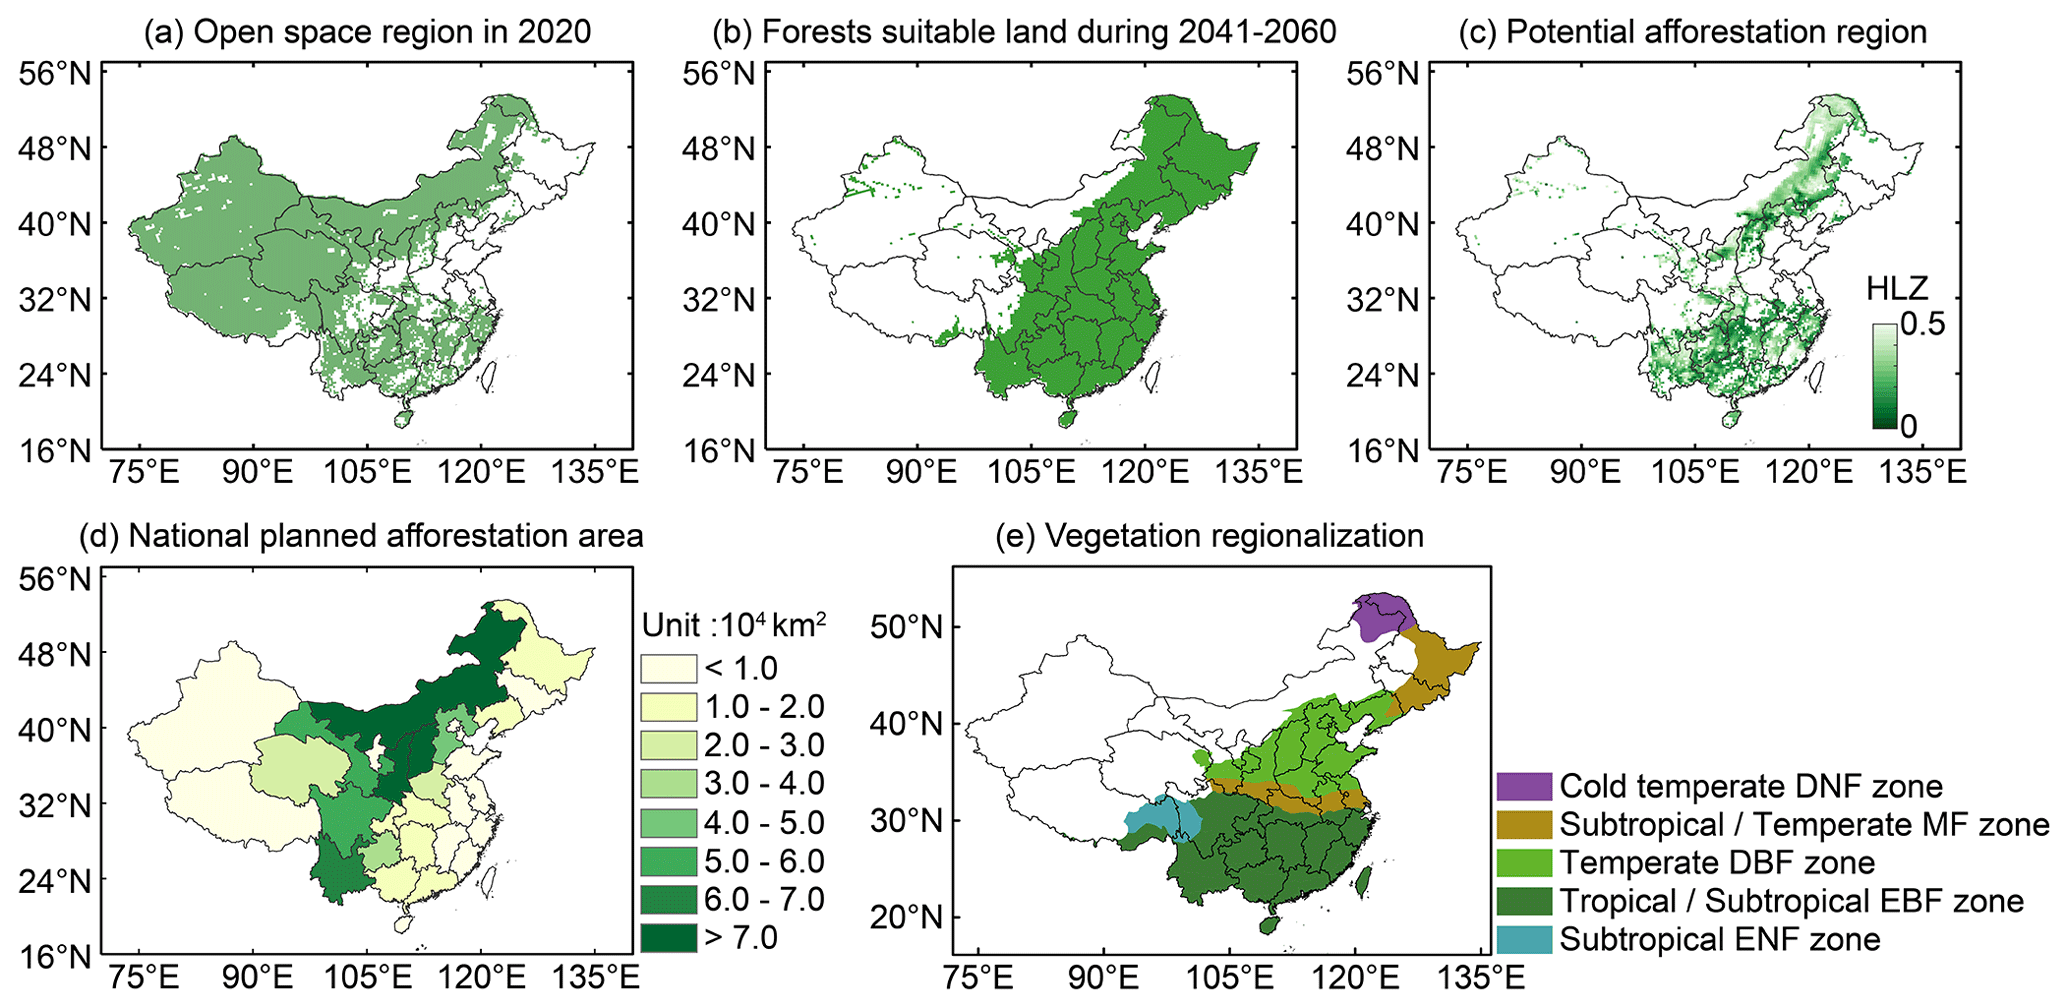
Figure 6Spatial distribution of (a) historical open-space region for afforestation, (b) future potential forestation domain (PFD) from the HLZ model considered to be forest-suitable lands, (c) potential afforestation region constrained by climate change, (d) national planned afforestation area in the individual provinces from the NFMP, and (e) Chinese vegetation regionalization map.
The second step was to determine the distribution of future PFD. We used the map of potential vegetation derived from the outputs of the HLZ model (Fig. 5a) to select the forest type grids as future PFD under the SSP2-4.5 scenarios during 2041–2060. The future PFD was considered to be forest-suitable lands constrained by future climate conditions. The forest-suitable lands are mainly located in eastern China (Fig. 6b). The corresponding annual total precipitation is over 353.6 mm among the selected grids.
Then, we combined the historical open-space region (Fig. 6a) with the future PFD (Fig. 6b), which enabled us to obtain the future potential afforestation areas (Fig. 6c). These regions provide suitable climate conditions for forest growth and can be utilized for afforestation implementation in the context of future climate change. The total area of potential afforestation is approximately 191.33×10⁴ km2.
There is no doubt that the potential afforestation area is extensive and unrealistic. Thus, according to the national tree planning policy, we further restricted the afforestation area. The NFMP released by the State Forestry Administration of China (2016) included the total area of planning afforestation in each province during 2020–2050 (Fig. 6d) and was considered a reference for future afforestation design. It notes that the potential afforestation area for individual provinces is usually larger than the national planned afforestation area (Table S2). Thus, we further constrained the potential afforestation areas following the HLZ value. Specifically, we sorted the HLZ value for each province in the potential afforestation region in ascending order (Fig. 6c); low HLZ values were given priority afforestation. We calculated the total afforestation area sequentially grid by grid, until it satisfied the NFMP policy requirements. The approach of the total afforestation area for each province is calculated based on Eq. (7):
where Area indicates the total afforestation area; r indicates the spatial resolution (here, r equals 25 km); and N indicates the number of afforestation grids in the historical land cover. The land cover types represent the area used for afforestation. Given the tree cover for woody savannas and savannas is 30 %–60 % and 10 %–30 % according to the IGBP classification scheme (Table S1), it means that approximately 45 % and 20 % of the grid area for woody savannas and savannas, respectively, has already been covered by forests in the historical period. Thus, to avoid repeated afforestation, the coefficients 0.55 and 0.80 were set.
It is worth noting that the planned afforestation area is larger than the potential afforestation area in Henan and Shandong provinces (Table S2). A small amount of cropland had been scheduled for afforestation to meet the national afforestation demand. The occupied croplands are mainly located in mountain areas, where the regions are highly suitable for forest growth. With such an afforestation scenario design, 125.33×10⁴ km2 croplands in China are still available for cultivation. It is also away from the protection “red line” of 121.67×10⁴ km2, released by the National Land Planning Outline (2016–2030) (State Council of China, 2017).
A Chinese vegetation regionalization map (Wu et al., 1980) was used to identify the forest types within each grid (Fig. 6e). Finally, the distribution of future potential afforestation regions in China is shown in Fig. 7. The findings show that the probable locations for future potential afforestation areas in China are around and to the east of the Hu Line (a geographical division of climate zone, population density, and economic development in China, stretching from Heihe to Tengchong). Due to afforestation, the land cover would be modified. In northern China, the main conversion types are from grasslands to deciduous broadleaf forests, and the region has the largest land conversions in China, accounting for 40 % of the new afforestation area. The most intensive conversion provinces are Shanxi and Shaanxi. In southwest China, the dominant conversions are from woody savannas and savannas to evergreen broadleaf forests. These conversions account for 26 % and 16 % of the new afforestation area, respectively. These land use conversions are mainly located in southwest China, such as Yunnan province, Sichuan province, and Guizhou province. Overall, the final total afforestation area in China is approximately 73.64×10⁴ km2, consistent with the NFMP (73.78×10⁴ km2). Therefore, for each province within the future afforestation region, we applied the aforementioned approach to ensure that the total afforestation area of individual provinces and the extent were consistent with the national policies and future climate conditions, respectively.
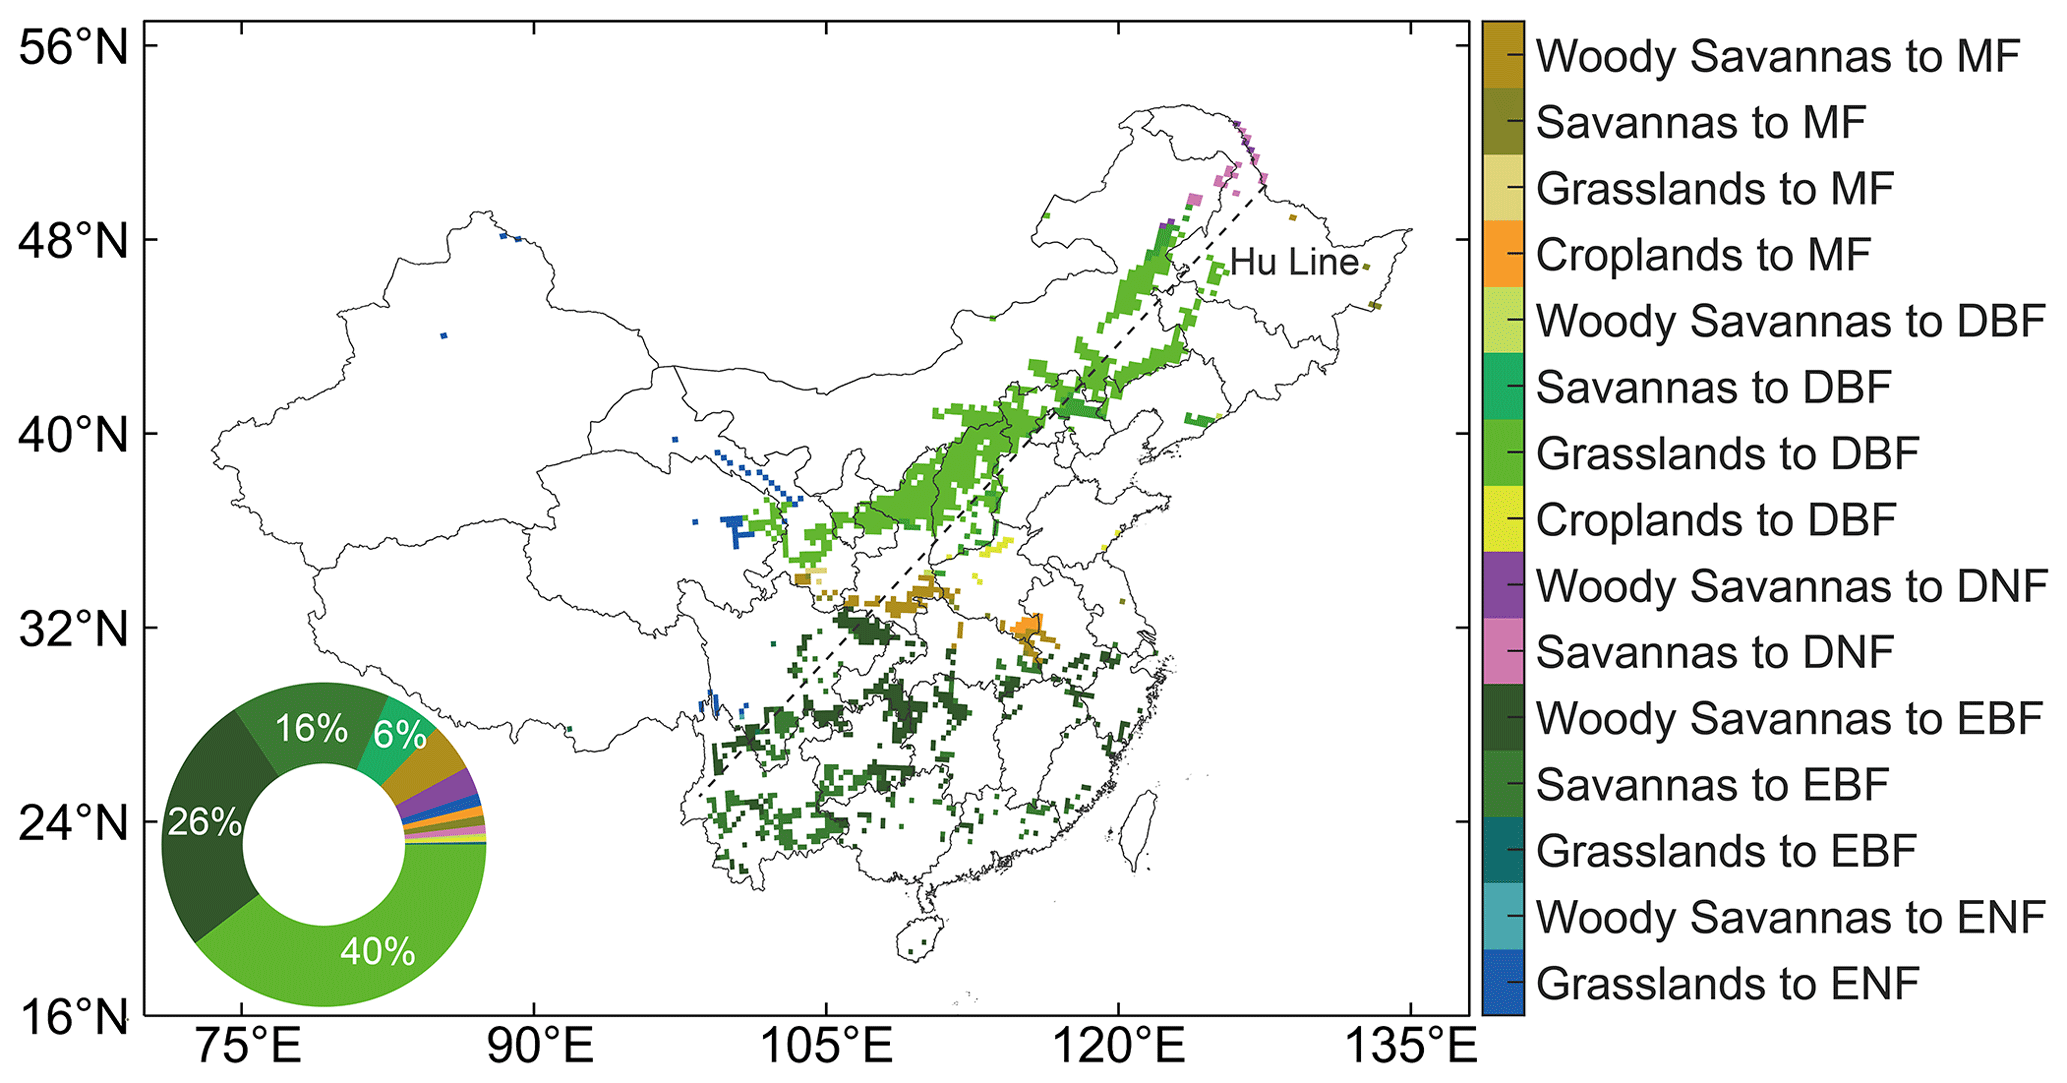
Figure 7Map of future potential afforestation distribution and land shift types constrained by both the national afforestation plan and climate change. Forest types from IGBP include evergreen needleleaf forests (ENF), evergreen broadleaf forests (EBF), deciduous needleleaf forests (DNF), deciduous broadleaf forests (DBF), and mixed forests (MF). The dotted black line indicates the Hu Line.
The most probable geographical distribution of future potential afforestation regions in China was investigated in this study. The total afforestation area in this study (73.64×10⁴ km2) is larger than that in existing studies. For example, Zhang et al. (2022) reported an obvious increase in potential forestation lands by 33.1×10⁴ km2 under future climate scenarios (2070s) using a machine learning approach to predict the ecological niche of forests. Xu (2023) reported that the area of prioritized potential forestation land was about 66.61×10⁴ km2 in 2020 through spatial overlay analysis of multiple factors (i.e. climate, transportation, topography, land use). However, the effects of future climate change and the national afforestation plan are ignored. Our results show that forest-suitable lands will increase by 17.5×10⁴ km2 under the SSP2-4.5 scenario compared with the historical period. The dataset would be valuable for studying the effects of future afforestation on carbon budget, ecosystem services, water resources, and surface climate.
Our findings indicate that future afforestation in China would mostly be located around and to the east of the Hu Line, consistent with Zhang et al. (2022). The area near the Hu Line is a transition zone characterized by dry–wet, agro-pastoral, and grassland–forest areas. This transition zone is highly sensitive to climate change (Li et al., 2015). Due to moisture limitations, the historical forest distribution is mainly located east of the Hu Line. Crossing the Hu Line is challenging for forests (Liu, 2019). However, under future climate change, the projected results show that the temperature and precipitation in China will increase by the middle of the 21st century under the SSP2-4.5 scenario compared with the historical period (Yang et al., 2021). A similar conclusion is also derived from our projection (Fig. S9). The response of PFD to future climate change could be slightly modified. Therefore, only a small proportion of future potential afforestation areas are in the western region of the Hu Line, such as the Loess Plateau region. This shows that afforestation planning should consider vegetation responses to future climate change.
Afforestation can provide temperature benefits (e.g. cooling the land surface), according to previous studies (Peng et al., 2014; Yu et al., 2020; Breil et al., 2024); however, the biophysical response of afforestation to temperature varies spatially. At a global scale, it is logical that afforestation causes a warming effect in high-latitude regions due to the albedo-dominant radiation effect, while it causes a cooling effect in low-latitude regions due to the evapotranspiration-dominant non-radiation effect (Bonan, 2008; Arora and Montenegro, 2011). Thus, afforestation-induced regional temperature changes depend on the net effects. Afforestation can also cause daytime cooling but nighttime warming (Yuan et al., 2022), and it can increase the surface temperature in winter but decrease it in the other seasons (Ma et al., 2017). Differential seasonal and daily responses lead to larger uncertainties in the net effects induced by afforestation. Therefore, a more realistic afforestation scenario is necessary in order to quantify the effects of afforestation on temperature under future climate change and to develop climate change mitigation policies.
Although the resolution of our dynamical downscaled simulation (25 km) is finer than raw GCM (∼ 100 km), it is difficult to meet the needs of afforestation planning in areas with complex topography. Convection-permitting climate modelling at the kilometre scale has recently been developed to reproduce better mesoscale atmospheric processes (Prein et al., 2015; Lucas-Picher et al., 2021) and obviously improve the WRF simulation, especially precipitation (Knist et al., 2020). However, improving the resolution involves higher computational costs. By contrast, statistical downscaling methods are also known to obtain high-resolution climate data with fewer computational resources (Tang et al., 2016). These methods assume that the historical relationship between local climate variables and the large-scale circulation remains fixed in the future term (Wilby and Dawson, 2013). The multi-model ensemble from the CMIP6 statistical downscaling can significantly reduce the biases compared with individual models (Gebrechorkos et al., 2019). Thus, some statistical downscaled CMIP6 datasets (Gebrechorkos et al., 2023; Lin et al., 2023; Thrasher et al., 2022), with a resolution of 0.1–0.25° covering the global area, can be applied to explore the future global potential afforestation area in later work. However, it is noted that the statistical downscaling data may have a limitation, as the covariance among the variables may not align with physical laws.
This study may have some limitations and uncertainties. Following the approach of existing studies (Ma et al., 2023; Qiu et al., 2022), we also utilized the bias-corrected LBCs in dynamical downscaling. However, the model uncertainty in the future climate projection is difficult to quantify because one GCM is nested within the WRF model. The projected result generally exhibits variations based on the choice of driving GCMs (Gao et al., 2022). This divergence can be attributed to the inherent configurations and physical parameterization of the GCM, distinct radiative forcing scenarios, and varying equilibrium climate sensitivities found in CMIP6 models (Zuo et al., 2023; Bukovsky and Mearns, 2020). For instance, the high-emission scenario could lead to higher temperature and stronger precipitation in China relative to the middle-emission scenario (Yang et al., 2021). Obvious differences are found in northern China, suggesting that there are greater opportunities for afforestation in semi-arid areas. Thus, the suitability of future forest lands depends on emission scenarios (Liu et al., 2020b; Elsen et al., 2022). Exploring the impacts of different SSPs on the distribution of potential afforestation regions would be an intriguing avenue for future research. To address the concerns about model uncertainty, exploring WRF forced by multiple bias-corrected CMIP6 models can help uncover the source of uncertainty. Utilizing ensemble means for downscaled climate simulation would contribute to a more robust projection. Additionally, the selection of different physical parameterization schemes in the WRF model can also influence the simulation performance (Gbode et al., 2019). Selecting the most suitable combination is beneficial for reducing the underlying bias. Out of all the factors limiting afforestation allocation, we used the HLZ value to constrain the afforestation distribution. Previous studies found that precipitation was a key meteorological factor that restricts forest distribution, especially in the mid-latitude regions (Hansen et al., 2005; Fang et al., 2005). When the areas with high precipitation were given priority afforestation, we obtained a similar future potential afforestation distribution (Fig. S10). Future studies should comprehensively consider additional factors, such as local economic development, soil physicochemical properties, and provincial tree planning policy.
This study evaluated the performance of the WRF model in simulating the PVD from the HLZ model in China during the historical period (1995–2014). The projected shifts in the potential vegetation types were explored under the SSP2-4.5 scenario during the future period (2041–2060) relative to the historical period. Based on these data, the most probable distribution of future potential afforestation was obtained by constraining both future climate contexts and national afforestation plans in China. We could draw the following main conclusions:
The output of the WRF model forced by the ERA5 analysis and bias-corrected MPI-ESM1-2-HR model could capture the spatial distribution of the PVD from the HLZ model over China through comparisons with the CN05.1 dataset during the historical period. However, the WRF simulation did not precisely reproduce the observed extent of steppe types in northeast China and of subtropical forests in southern China. Such misclassifications might be attributed to the bias of the precipitation simulation. Overall, in terms of the nationwide potential forestation domain, the WRF model could reproduce the spatial distribution well over China.
Under the SSP2-4.5 scenario, the PVD would obviously shift during 2041–2060 compared to the historical period. The largest shift type was from warm temperate forests to subtropical forests over southern China. The new forest-suitable lands would increase by about 17.5×10⁴ km2 in China due to projected increases in temperature and precipitation. In addition, considering both future climate change and the national tree planning policy, we found that the probable locations for future afforestation were around and to the east of the Hu Line, with a total area of approximately 73.64×10⁴ km2. The main shift types were from grasslands to deciduous broadleaf forests in northern China and from woody savannas and savannas to evergreen broadleaf forests in southwest China. The findings of this study could provide a dataset for exploring the effects of future afforestation, and this method can guide designs of future gridded afforestation regions for other countries.
The MPI-ESM1-2-HR model (Müller et al., 2018) can be downloaded from https://esgf.nci.org.au/search/cmip6-nci/. The WRF model (Skamarock et al., 2019) can be found at https://www2.mmm.ucar.edu/wrf/users/. The national planned afforestation area data (State Forestry Administration of China, 2016) are available at https://www.gov.cn/xinwen/2016-7/28/5095504/files/b9ac167edfd748dc8c1a256a784f40d5.pdf. The ERA5 reanalysis data (Hersbach et al., 2020) can be found at https://cds.climate.copernicus.eu/cdsapp#!/dataset/reanalysis-era5-pressure-levels?tab=form. The Chinese vegetation regionalization map data (Wu et al., 1980) are available at https://www.resdc.cn/data.aspx?DATAID=133. The MCD12Q1 land use data (Friedl et al., 2010) can be obtained from https://e4ftl01.cr.usgs.gov/MOTA/MCD12Q1.061/. The observed temperature and precipitation data from CN05.1 (Wu and Gao, 2013) are available at https://ccrc.iap.ac.cn/resource/detail?id=228. MATLAB (version 2020a) can be accessed at https://www.mathworks.com/login?uri=%2Fdownloads%2Fweb_downloads (MathWorks Inc., 2020, login required). The future potential afforestation distribution data are available at https://doi.org/10.5281/zenodo.10900150 (Shuaifeng, 2024).
The supplement related to this article is available online at: https://doi.org/10.5194/bg-21-2839-2024-supplement.
XZ and XY designed the experiments and developed the study; SS conducted the analysis and prepared the figures. All three authors contributed to the writing and revision of the text.
The contact author has declared that none of the authors has any competing interests.
Publisher's note: Copernicus Publications remains neutral with regard to jurisdictional claims made in the text, published maps, institutional affiliations, or any other geographical representation in this paper. While Copernicus Publications makes every effort to include appropriate place names, the final responsibility lies with the authors.
We gratefully acknowledge the support of the National Key Research and Development Program of China (nos. 2019YFA0606600 and 2019YFA0606904). We thank the World Climate Research Programme (WCRP) for providing the CMIP6 simulation and the ECMWF for providing the ERA5 reanalysis data. We would like to thank Jia Wu and Xuejie Gao for assisting with the CN05.1 observation data. We also thank the editor and the anonymous reviewers for their careful revision and constructive suggestions in the review process.
This study has been supported by the National Key Research and Development Program of China (nos. 2019YFA0606600 and 2019YFA0606904).
This paper was edited by Andrew Feldman and reviewed by three anonymous referees.
Abiodun, B. J., Salami, A. T., Matthew, O. J., and Odedokun, S.: Potential impacts of afforestation on climate change and extreme events in Nigeria, Clim. Dynam., 41, 277–293, https://doi.org/10.1007/s00382-012-1523-9, 2013.
Anwar, S. A. and Diallo, I.: Modelling the Tropical African Climate using a state-of-the-art coupled regional climate-vegetation model, Clim. Dynam., 58, 97–113, https://doi.org/10.1007/s00382-021-05892-9, 2022.
Arora, V. K. and Montenegro, A.: Small temperature benefits provided by realistic afforestation efforts, Nat. Geosci., 4, 514–518, https://doi.org/10.1038/ngeo1182, 2011.
Bastin, J.-F., Finegold, Y., Garcia, C., Mollicone, D., Rezende, M., Routh, D., Zohner, C. M., and Crowther, T. W.: The global tree restoration potential, Science, 365, 76–79, https://doi.org/10.1126/science.aax0848, 2019.
Bhattacharya, B., Mohanty, S., and Singh, C.: Assessment of the potential of CMIP6 models in simulating the sea surface temperature variability over the tropical Indian Ocean, Theor. Appl. Climatol., 148, 585–602, https://doi.org/10.1007/s00704-022-03952-6, 2022.
Bonan, G. B.: Forests and climate change: forcings, feedbacks, and the climate benefits of forests, Science, 320, 1444–1449, https://doi.org/10.1126/science.1155121, 2008.
Bowden, J. H., Terando, A. J., Misra, V., Wootten, A., Bhardwaj, A., Boyles, R., Gould, W., Collazo, J. A., and Spero, T. L.: High-resolution dynamically downscaled rainfall and temperature projections for ecological life zones within Puerto Rico and for the US Virgin Islands, Int. J. Climatol., 41, 1305–1327, https://doi.org/10.1002/joc.6810, 2021.
Box, E. O.: Predicting physiognomic vegetation types with climate variables, Vegetatio, 45, 127–139, https://doi.org/10.1007/BF00119222, 1981.
Breil, M., Davin, E. L., and Rechid, D.: What determines the sign of the evapotranspiration response to afforestation in European summer?, Biogeosciences, 18, 1499–1510, https://doi.org/10.5194/bg-18-1499-2021, 2021.
Breil, M., Schneider, V. K. M., and Pinto, J. G.: The effect of forest cover changes on the regional climate conditions in Europe during the period 1986–2015, Biogeosciences, 21, 811–824, https://doi.org/10.5194/bg-21-811-2024, 2024.
Brockerhoff, E. G., Barbaro, L., Castagneyrol, B., Forrester, D. I., Gardiner, B., González-Olabarria, J. R., Lyver, P. O., Meurisse, N., Oxbrough, A., Taki, H., Thompson, I. D., van der Plas, F., and Jactel, H.: Forest biodiversity, ecosystem functioning and the provision of ecosystem services, Biodivers. Conserv., 26, 3005–3035, https://doi.org/10.1007/s10531-017-1453-2, 2017.
Bukovsky, M. S. and Mearns, L. O.: Regional climate change projections from NA-CORDEX and their relation to climate sensitivity, Climatic Change, 162, 645–665, https://doi.org/10.1007/s10584-020-02835-x, 2020.
Cardoso, R. M., Soares, P. M., Lima, D. C., and Miranda, P.: Mean and extreme temperatures in a warming climate: EURO CORDEX and WRF regional climate high-resolution projections for Portugal, Clim. Dynam., 52, 129–157, https://doi.org/10.1007/s00382-018-4124-4, 2019.
Case, J. L., Crosson, W. L., Kumar, S. V., Lapenta, W. M., and Peters-Lidard, C. D.: Impacts of high-resolution land surface initialization on regional sensible weather forecasts from the WRF model, J. Hydrometeorol., 9, 1249–1266, https://doi.org/10.1175/2008JHM990.1, 2008.
Chen, C., Park, T., Wang, X., Piao, S., Xu, B., Chaturvedi, R. K., Fuchs, R., Brovkin, V., Ciais, P., Fensholt, R., Tømmervik, H., Bala, G., Zhu, Z., Nemani, R. R., and Myneni, R. B.: China and India lead in greening of the world through land-use management, Nat. Sustain., 2, 122–129, https://doi.org/10.1038/s41893-019-0220-7, 2019.
Cohen, J.: A coefficient of agreement for nominal scales, Educ. Psychol. Meas., 20, 37–46, https://doi.org/10.1177/001316446002000104, 1960.
Collins, W. D., Rasch, P., Boville, B., Hack, J., McCaa, J., Williamson, D., Kiehl, J., Briegleb, B., Bitz, C., Lin, S.-J., Zhang, M., and Dai, Y.: Description of the NCAR community atmosphere model (CAM 3.0), Natl. Cent. for Atmos. Res., Boulder, Colorado, 226, 1326–1334, https://doi.org/10.5065/D63N21CH, 2004.
Cramer, W., Bondeau, A., Woodward, F. I., Prentice, I. C., Betts, R. A., Brovkin, V., Cox, P. M., Fisher, V., Foley, J. A., Friend, A. D., Kucharik, C., Lomas, M. R., Ramankutty, N., Sitch, S., Smith, B., White, A., and Young-Molling, C.: Global response of terrestrial ecosystem structure and function to CO2 and climate change: results from six dynamic global vegetation models, Glob. Change Biol., 7, 357–373, https://doi.org/10.1046/j.1365-2486.2001.00383.x, 2001.
Crespo, N. M., da Silva, N. P., Palmeira, R. M. J., Cardoso, A. A., Kaufmann, C. L. G., Lima, J. A. M., Andrioni, M., de Camargo, R. and da Rocha, R. P.: Western South Atlantic Climate Experiment (WeSACEx): Extreme winds and waves over the Southeastern Brazilian sedimentary basins, Clim. Dynam., 60, 571–588, https://doi.org/10.1007/s00382-022-06340-y, 2023.
Dan, L., Ji, J., and Zhang, P.: The soil moisture of China in a high resolution climate-vegetation model, Adv. Atmos. Sci., 22, 720–729, https://doi.org/10.1007/BF02918715, 2005.
de Lima, R. F., de Oliveira Aparecido, L. E., Lorençone, J. A., Lorençone, P. A., Torsoni, G. B., da Silva Cabral Moraes, J. R., and de Meneses, K. C.: Assessing life zone changes under climate change scenarios in Brazil, Theor. Appl. Climatol., 149, 1687–1703, https://doi.org/10.1007/s00704-022-04133-1, 2022.
Diasso, U. and Abiodun, B. J.: Future impacts of global warming and reforestation on drought patterns over West Africa, Theor. Appl. Climatol., 133, 647–662, https://doi.org/10.1007/s00704-017-2209-3, 2018.
Elsen, P. R., Saxon, E. C., Simmons, B. A., Ward, M., Williams, B. A., Grantham, H. S., Kark, S., Levin, N., Perez-Hammerle, K. V., Reside, A. E., and Watson, J. E. M.: Accelerated shifts in terrestrial life zones under rapid climate change, Glob. Change Biol., 28, 918–935, https://doi.org/10.1111/gcb.15962, 2022.
Fan, Z. and Bai, X.: Scenarios of potential vegetation distribution in the different gradient zones of Qinghai-Tibet Plateau under future climate change, Sci. Total Environ., 796, 148918, https://doi.org/10.1016/j.scitotenv.2021.148918, 2021.
Fan, Z., Fan, B., and Yue, T.: Terrestrial ecosystem scenarios and their response to climate change in Eurasia, Sci. China Earth Sci., 62, 1607–1618, https://doi.org/10.1007/s11430-018-9374-3, 2019.
Fang, J., Piao, S., Zhou, L., He, J., Wei, F., Myneni, R. B., Tucker, C. J., and Tan, K.: Precipitation patterns alter growth of temperate vegetation, Geophys. Res. Lett., 32, L21411, https://doi.org/10.1029/2005GL024231, 2005.
Foley, J. A., Prentice, I. C., Ramankutty, N., Levis, S., Pollard, D., Sitch, S., and Haxeltine, A.: An integrated biosphere model of land surface processes, terrestrial carbon balance, and vegetation dynamics, Global Biogeochem. Cy., 10, 603–628, https://doi.org/10.1029/96GB02692, 1996.
Friedl, M. A., Sulla-Menashe, D., Tan, B., Schneider, A., Ramankutty, N., Sibley, A., and Huang, X.: MODIS Collection 5 global land cover: Algorithm refinements and characterization of new datasets, Remote Sens. Environ., 114, 168–182, https://doi.org/10.1016/j.rse.2009.08.016, 2010 (data available at: https://e4ftl01.cr.usgs.gov/MOTA/MCD12Q1.061/, last access: 30 March 2022).
Fu, B., Liu, Y., and Meadows, M. E.: Ecological restoration for sustainable development in China, Natl. Sci. Rev., 10, nwad033, https://doi.org/10.1093/nsr/nwad033, 2023.
Fu, Y., Ma, Y., Zhong, L., Yang, Y., Guo, X., Wang, C., Xu, X., Yang, K., Xu, X., Liu, J., Fan G., Li, Y., and Wang, D.: Land-surface processes and summer-cloud-precipitation characteristics in the Tibetan Plateau and their effects on downstream weather: a review and perspective, Natl. Sci. Rev., 7, 500–515, https://doi.org/10.1093/nsr/nwz226, 2020.
Gao, S.: Dynamical downscaling of surface air temperature and precipitation using RegCM4 and WRF over China, Clim. Dynam., 55, 1283–1302, https://doi.org/10.1007/s00382-020-05326-y, 2020.
Gao, S., Zhu, S., and Yu, H.: Dynamical downscaling of temperature extremes over China using the WRF model driven by different lateral boundary conditions, Atmos. Res., 278, 106348, https://doi.org/10.1016/j.atmosres.2022.106348, 2022.
Gao, Z., Yan, X., Dong, S., Luo, N., and Song, S.: Object-based evaluation of rainfall forecasts over eastern China by eight cumulus parameterization schemes in the WRF model, Atmos. Res., 284, 106618, https://doi.org/10.1016/j.atmosres.2023.106618, 2023.
Gbode, I. E., Dudhia, J., Ogunjobi, K. O., and Ajayi, V. O.: Sensitivity of different physics schemes in the WRF model during a West African monsoon regime, Theor. Appl. Climatol., 136, 733–751, https://doi.org/10.1007/s00704-018-2538-x, 2019.
Ge, J., Pitman, A. J., Guo, W., Zan, B., and Fu, C.: Impact of revegetation of the Loess Plateau of China on the regional growing season water balance, Hydrol. Earth Syst. Sci., 24, 515–533, https://doi.org/10.5194/hess-24-515-2020, 2020.
Gebrechorkos, S., Hülsmann, S., and Bernhofer, C.: Regional climate projections for impact assessment studies in East Africa, Environ. Res. Lett., 14, 044031, https://doi.org/10.1088/1748-9326/ab055a, 2019.
Gebrechorkos, S., Leyland, J., Slater, L., Wortmann, M., Ashworth, P. J., Bennett, G. L., Boothroyd, R., Cloke, H., Delorme, P., Griffith, H., Hardy, R., Hawker, L., McLelland, S., Neal, J., Nicholas, A., Tatem, A. J., Vahidi, E., Parsons, D. R., and Darby, S. E.: A high-resolution daily global dataset of statistically downscaled CMIP6 models for climate impact analyses, Sci. Data, 10, 611, https://doi.org/10.1038/s41597-023-02528-x, 2023.
Giorgi, F. and Mearns, L. O.: Introduction to special section: Regional climate modeling revisited, J. Geophys. Res.-Atmos., 104, 6335–6352, https://doi.org/10.1029/98JD02072, 1999.
Grell, G. A. and Dévényi, D.: A generalized approach to parameterizing convection combining ensemble and data assimilation techniques, Geophys. Res. Lett., 29, 1693, https://doi.org/10.1029/2002GL015311, 2002.
Gundersen, P., Thybring, E. E., Nord-Larsen, T., Vesterdal, L., Nadelhoffer, K. J., and Johannsen, V. K.: Old-growth forest carbon sinks overestimated, Nature, 591, E21–E23, https://doi.org/10.1038/s41586-021-03266-z, 2021.
Han, Y., Zhang, M. Z., Xu, Z., and Guo, W.: Assessing the performance of 33 CMIP6 models in simulating the large-scale environmental fields of tropical cyclones, Clim. Dynam., 58, 1683–1698, https://doi.org/10.1007/s00382-021-05986-4, 2022.
Hansen, M. C., Townshend, J. R., DeFries, R. S., and Carroll, M.: Estimation of tree cover using MODIS data at global, continental and regional/local scales, Int. J. Remote Sens., 26, 4359–4380, https://doi.org/10.1080/01431160500113435, 2005.
Hersbach, H., Bell, B., Berrisford, P., Hirahara, S., Horányi, A., Muñoz-Sabater, J., Nicolas, J., Peubey, C., Radu, R., Schepers, D., Simmons, A., Soci, C., Abdalla, S., Abellan, X., Balsamo, G., Bechtold, P., Biavati, G., Bidlot, J., Bonavita, M., De Chiara, G., Dahlgren, P., Dee, D., Diamantakis, M., Dragani, R., Flemming, J., Forbes, R., Fuentes, M., Geer, A., Haimberger, L., Healy, S., Hogan, R. J., Hólm, E., Janisková, M., Keeley, S., Laloyaux, P., Lopez, P., Lupu, C., Radnoti, G., de Rosnay, P., Rozum, I., Vamborg, F., Villaume, S., and Thépaut, J.-N.: The ERA5 global reanalysis, Q. J. Roy. Meteor. Soc., 146, 1999–2049, https://doi.org/10.1002/qj.3803, 2020 (data available at: https://cds.climate.copernicus.eu/cdsapp#!/dataset/reanalysis-era5-pressure-levels?tab=form, last access: 20 March 2022).
Hickler, T., Vohland, K., Feehan, J., Miller, P. A., Smith, B., Costa, L., Giesecke, T., Fronzek, S., Carter, T. R., Cramer, W., Kühn, I., and Sykes, M. T.: Projecting the future distribution of European potential natural vegetation zones with a generalized, tree species-based dynamic vegetation model, Global Ecol. Biogeogr., 21, 50–63, https://doi.org/10.1111/j.1466-8238.2010.00613.x, 2012.
Hinze, J., Albrecht, A., and Michiels, H. G.: Climate-Adapted Potential Vegetation – A European Multiclass Model Estimating the Future Potential of Natural Vegetation, Forests, 14, 239, https://doi.org/10.3390/f14020239, 2023.
Holdridge, L. R.: Determination of world plant formations from simple climatic data, Science, 105, 367–368, https://doi.org/10.1126/science.105.2727.367, 1947.
Hong, S. Y., Dudhia, J., and Chen, S. H.: A revised approach to ice microphysical processes for the bulk parameterization of clouds and precipitation, Mon. Weather Rev., 132, 103–120, https://doi.org/10.1175/1520-0493(2004)132<0103:ARATIM>2.0.CO;2, 2004.
Horvath, P., Tang, H., Halvorsen, R., Stordal, F., Tallaksen, L. M., Berntsen, T. K., and Bryn, A.: Improving the representation of high-latitude vegetation distribution in dynamic global vegetation models, Biogeosciences, 18, 95–112, https://doi.org/10.5194/bg-18-95-2021, 2021.
Hou, H., Zhou, B. B., Pei, F., Hu, G., Su, Z., Zeng, Y., Zhang, H., Gao, Y., Luo, M., and Li, X.: Future land use/land cover change has nontrivial and potentially dominant impact on global gross primary productivity, Earths Future, 10, e2021EF002628, https://doi.org/10.1029/2021EF002628, 2022.
Hu, Y., Zhang, X. Z., Mao, R., Gong, D. Y., Liu, H. B., and Yang, J.: Modeled responses of summer climate to realistic land use/cover changes from the 1980s to the 2000s over eastern China, J. Geophys. Res.-Atmos., 120, 167–179, https://doi.org/10.1002/2014JD022288, 2015.
Hu, Y., Li, H., Wu, D., Chen, W., Zhao, X., Hou, M., Li, A., and Zhu, Y.: LAI-indicated vegetation dynamic in ecologically fragile region: A case study in the Three-North Shelter Forest program region of China, Ecol. Indic., 120, 106932, https://doi.org/10.1016/j.ecolind.2020.106932, 2021.
Huang, D. and Gao, S.: Impact of different reanalysis data on WRF dynamical downscaling over China, Atmos. Res., 200, 25–35, https://doi.org/10.1016/j.atmosres.2017.09.017, 2018.
Huang, L., Wang, B., Niu, X., Gao, P., and Song, Q.: Changes in ecosystem services and an analysis of driving factors for China's Natural Forest Conservation Program, Ecol. Evol., 9, 3700–3716, https://doi.org/10.1002/ece3.4925, 2019.
Hui, P., Tang, J., Wang, S., Niu, X., Zong, P., and Dong, X.: Climate change projections over China using regional climate models forced by two CMIP5 global models. Part II: projections of future climate, Int. J. Climatol., 38, e78–e94, https://doi.org/10.1002/joc.5409, 2018.
Jayakrishnan, K. U. and Bala, G.: A comparison of the climate and carbon cycle effects of carbon removal by afforestation and an equivalent reduction in fossil fuel emissions, Biogeosciences, 20, 1863–1877, https://doi.org/10.5194/bg-20-1863-2023, 2023.
Ji, Z. and Kang, S.: Projection of snow cover changes over China under RCP scenarios, Clim. Dynam., 41, 589–600, https://doi.org/10.1007/s00382-012-1473-2, 2013.
Jiang, Y., Zhuang, Q., Schaphoff, S., Sitch, S., Sokolov, A., Kicklighter, D., and Melillo, J.: Uncertainty analysis of vegetation distribution in the northern high latitudes during the 21st century with a dynamic vegetation model, Ecol. Evol., 2, 593–614, https://doi.org/10.1002/ece3.85, 2012.
Kamruzzaman, M., Shahid, S., Roy, D. K., Islam, A. R. M. T., Hwang, S., Cho, J., Zaman, M. A. U., Sultana, T., Rashid, T., and Akter, F.: Assessment of CMIP6 global climate models in reconstructing rainfall climatology of Bangladesh, Int. J. Climatol., 42, 3928–3953, https://doi.org/10.1002/joc.7452, 2022.
Kaplan, J. O.: Geophysical applications of vegetation modelling, Lund University, ISBN 91-7874-089-4, 2001.
Karim, R., Tan, G., Ayugi, B., Babaousmail, H., and Liu, F.: Evaluation of historical CMIP6 model simulations of seasonal mean temperature over Pakistan during 1970–2014, Atmosphere, 11, 1005, https://doi.org/10.3390/atmos11091005, 2020.
Karypidou, M. C., Sobolowski, S. P., Sangelantoni, L., Nikulin, G., and Katragkou, E.: The impact of lateral boundary forcing in the CORDEX-Africa ensemble over southern Africa, Geosci. Model Dev., 16, 1887–1908, https://doi.org/10.5194/gmd-16-1887-2023, 2023.
Kebe, I., Sylla, M. B., Omotosho, J. A., Nikiema, P. M., Gibba, P., and Giorgi, F.: Impact of GCM boundary forcing on regional climate modeling of West African summer monsoon precipitation and circulation features, Clim. Dynam., 48, 1503–1516, https://doi.org/10.1007/s00382-016-3156-x, 2017.
Knist, S., Goergen, K., and Simmer, C.: Evaluation and projected changes of precipitation statistics in convection-permitting WRF climate simulations over Central Europe, Clim. Dynam., 55, 325–341, https://doi.org/10.1007/s00382-018-4147-x, 2020.
Krinner, G., Viovy, N., de Noblet-Ducoudré, N., Ogée, J., Polcher, J., Friedlingstein, P., Ciais, P., Sitch, S., and Prentice, I. C.: A dynamic global vegetation model for studies of the coupled atmosphere-biosphere system, Global Biogeochem. Cy., 19, GB1015, https://doi.org/10.1029/2003GB002199, 2005.
Kummu, M., Heino, M., Taka, M., Varis, O., and Viviroli, D.: Climate change risks pushing one-third of global food production outside the safe climatic space, One Earth, 4, 720–729, https://doi.org/10.1016/j.oneear.2021.04.017, 2021.
Landis, J. R. and Koch, G. G.: The measurement of observer agreement for categorical data, Biometrics, 33, 159–174, https://doi.org/10.2307/2529310, 1977.
Lewis, S. L., Mitchard, E. T. A., Prentice, C., Maslin, M., and Poulter, B.: Comment on “The global tree restoration potential”, Science, 366, eaaz0388, https://doi.org/10.1126/science.aaz0388, 2019.
Li, S., An, P., Pan, Z., Wang, F., Li, X., and Liu, Y.: Farmers' initiative on adaptation to climate change in the Northern Agro-pastoral Ecotone, Int. J. Disast. Risk Re., 12, 278–284, https://doi.org/10.1016/j.ijdrr.2015.02.002, 2015.
Li, S., Zhang, J., Henchiri, M., Cao, D., Zhang, S., Bai, Y., and Yang, S.: Spatiotemporal Variations of Chinese Terrestrial Ecosystems in Response to Land Use and Future Climate Change, Atmosphere, 13, 1024, https://doi.org/10.3390/atmos13071024, 2022.
Lin, C., Chen, D., Yang, K., and Ou, T.: Impact of model resolution on simulating the water vapor transport through the central Himalayas: implication for models' wet bias over the Tibetan Plateau, Clim. Dynam., 51, 3195–3207, https://doi.org/10.1007/s00382-018-4074-x, 2018.
Liu, H.: It is difficult for China's greening through large-scale afforestation to cross the Hu Line, Sci. China Earth. Sci., 62, 1662–1664, https://doi.org/10.1007/s11430-019-9381-3, 2019.
Lin, H., Tang, J., Wang, S., Wang, S., and Dong, G.: Deep learning downscaled high-resolution daily near surface meteorological datasets over East Asia, Sci. Data, 10, 890, https://doi.org/10.1038/s41597-023-02805-9, 2023.
Liu, W., Wang, G., Yu, M., Chen, H., and Jiang, Y.: Multimodel future projections of the regional vegetation-climate system over East Asia: Comparison between two ensemble approaches, J. Geophys. Res.-Atmos., 125, e2019JD031967, https://doi.org/10.1029/2019JD031967, 2020a.
Liu, W., Wang, G., Yu, M., Chen, H., Jiang, Y., Yang, M., and Shi, Y.: Projecting the future vegetation–climate system over East Asia and its RCP-dependence, Clim. Dynam., 55, 2725–2742, https://doi.org/10.1007/s00382-020-05411-2, 2020b.
Liu, Y., Ge, J., Guo, W., Cao, Y., Chen, C., Luo, X., Yang, L., and Wang, S.: Revisiting biophysical impacts of greening on precipitation over the Loess Plateau of China using WRF with water vapor tracers, Geophys. Res. Lett., 50, e2023GL102809, https://doi.org/10.1029/2023GL102809, 2023.
Liu, Z., Deng, Z., He, G., Wang, H., Zhang, X., Lin, J., Qi, Y., and Liang, X.: Challenges and opportunities for carbon neutrality in China, Nat. Rev. Earth Env., 3, 141–155, https://doi.org/10.1038/s43017-021-00244-x, 2022.
Loveland, T. R., Reed, B. C., Brown, J. F., Ohlen, D. O., Zhu, Z., Yang, L. W. M. J., and Merchant, J. W.: Development of a global land cover characteristics database and IGBP DISCover from 1 km AVHRR data, Int. J. Remote Sens., 21, 1303–1330, https://doi.org/10.1080/014311600210191, 2000.
Lu, Z., Han, Y., and Liu, Y.: Improving the Ramer scheme for diagnosis of freezing rain in China, Atmos. Res., 254, 105520, https://doi.org/10.1016/j.atmosres.2021.105520, 2021.
Lucas-Picher, P., Argüeso, D., Brisson, E., Tramblay, Y., Berg, P., Lemonsu, A., Kotlarski, S., and Caillaud, C.: Convection-permitting modeling with regional climate models: Latest developments and next steps, WIRes Clim. Change, 12, e731, https://doi.org/10.1002/wcc.731, 2021.
Ma, M., Tang, J., Ou, T., and Zhou, P.: High-resolution climate projection over the Tibetan Plateau using WRF forced by bias-corrected CESM, Atmos. Res., 286, 106670, https://doi.org/10.1016/j.atmosres.2023.106670, 2023.
Ma, W., Jia, G., and Zhang, A.: Multiple satellite-based analysis reveals complex climate effects of temperate forests and related energy budget, J. Geophys. Res.-Atmos., 122, 3806–3820, https://doi.org/10.1002/2016JD026278, 2017.
Mallard, M. S. and Spero, T. L.: Effects of mosaic land use on dynamically downscaled WRF simulations of the contiguous United States, J. Geophys. Res.-Atmos., 124, 9117–9140, https://doi.org/10.1029/2018JD029755, 2019.
Martens, C., Hickler, T., Davis-Reddy, C., Engelbrecht, F., Higgins, S. I., Von Maltitz, G. P., Midgley, G. F., Pfeiffer, M., and Scheiter, S.: Large uncertainties in future biome changes in Africa call for flexible climate adaptation strategies, Glob. Change Biol., 27, 340–358, https://doi.org/10.1111/gcb.15390, 2021.
MathWorks Inc.: MATLAB version 2020a, login required, Natick, Massachusetts, https://www.mathworks.com/login?uri=%2Fdownloads%2Fweb_downloads (last access: 20 July 2021), 2020.
Meng, X., Lyu, S., Zhang, T., Zhao, L., Li, Z., Han, B., Li, S., Ma, D., Chen, H., Ao, Y., Luo, S., Shen, Y., Guo, J., and Wen, L.: Simulated cold bias being improved by using MODIS time-varying albedo in the Tibetan Plateau in WRF model, Environ. Res. Lett., 13, 044028, https://doi.org/10.1088/1748-9326/aab44a, 2018.
Mishra, V., Kumar, D., Ganguly, A. R., Sanjay, J., Mujumdar, M., Krishnan, R., and Shah, R. D.: Reliability of regional and global climate models to simulate precipitation extremes over India, J. Geophys. Res.-Atmos., 119, 9301–9323, https://doi.org/10.1002/2014JD021636, 2014.
Moalafhi, D. B., Evans, J. P., and Sharma, A.: Influence of reanalysis datasets on dynamically downscaling the recent past, Clim. Dynam., 49, 1239–1255, https://doi.org/10.1007/s00382-016-3378-y, 2017.
Moore, J. C., Chen, Y., Cui, X., Yuan, W., Dong, W., Gao, Y., and Shi, P.: Will China be the first to initiate climate engineering?, Earths Future, 4, 588–595, https://doi.org/10.1002/2016EF000402, 2016.
Moustakis, Y., Papalexiou, S. M., Onof, C. J., and Paschalis, A.: Seasonality, intensity, and duration of rainfall extremes change in a warmer climate, Earths Future, 9, e2020EF001824, https://doi.org/10.1029/2020EF001824, 2021.
Moustakis, Y., Fatichi, S., Onof, C., and Paschalis, A.: Insensitivity of ecosystem productivity to predicted changes in fine-scale rainfall variability, J. Geophys. Res.-Biogeo., 127, e2021JG006735, https://doi.org/10.1029/2021JG006735, 2022.
Müller, W. A., Jungclaus, J. H., Mauritsen, T., Baehr, J., Bittner, M., Budich, R., Bunzel, F., Esch, M., Ghosh, R., Haak, H., Ilyina, T., Kleine, T., Kornblueh, L., Li, H., Modali, K., Notz, D., Pohlmann, H., Roeckner, E., Stemmler, I., Tian, F., and Marotzke, J.: A higher-resolution version of the Max Planck Institute Earth System Model (MPI-ESM1. 2-HR), J. Adv. Model. Earth Sy., 10, 1383–1413, https://doi.org/10.1029/2017MS001217, 2018 (data available at: https://esgf.nci.org.au/search/cmip6-nci/, last access: 11 May 2022).
Naik, M. and Abiodun, B. J.: Potential impacts of forestation on future climate change in Southern Africa, Int. J. Climatol., 36, 4560–4576, https://doi.org/10.1002/joc.4652, 2016.
Navarro, A., Merino, A., Sánchez, J. L., García-Ortega, E., Martín, R., and Tapiador, F. J.: Towards better characterization of global warming impacts in the environment through climate classifications with improved global models, Int. J. Climatol., 42, 5197–5217, https://doi.org/10.1002/joc.7527, 2022.
Neilson, R. P., King, G. A., and Koerper, G.: Toward a rule-based biome model, Landscape Ecol., 7, 27–43, https://doi.org/10.1007/BF02573955, 1992.
Niu, G. Y., Yang, Z. L., Mitchell, K. E., Chen, F., Ek, M. B., Barlage, M., Kumar, A., Manning, K., Niyogi, D., Rosero, E., Tewari, M., and Xia, Y.: The community Noah land surface model with multiparameterization options (Noah-MP): 1. Model description and evaluation with local-scale measurements, J. Geophys. Res.-Atmos., 116, D12109, https://doi.org/10.1029/2010JD015139, 2011.
Niu, X., Tang, J., Wang, S., and Fu, C.: Impact of future land use and land cover change on temperature projections over East Asia, Clim. Dynam., 52, 6475–6490, https://doi.org/10.1007/s00382-018-4525-4, 2019.
Noh, Y., Cheon, W. G., Hong, S. Y., and Raasch, S.: Improvement of the K-profile model for the planetary boundary layer based on large eddy simulation data, Bound.-Lay. Meteorol., 107, 401–427, https://doi.org/10.1023/A:1022146015946, 2003.
Odoulami, R. C., Abiodun, B. J., and Ajayi, A. E.: Modelling the potential impacts of afforestation on extreme precipitation over West Africa, Clim. Dynam., 52, 2185–2198, https://doi.org/10.1007/s00382-018-4248-6, 2019.
O'Neill, B. C., Tebaldi, C., van Vuuren, D. P., Eyring, V., Friedlingstein, P., Hurtt, G., Knutti, R., Kriegler, E., Lamarque, J.-F., Lowe, J., Meehl, G. A., Moss, R., Riahi, K., and Sanderson, B. M.: The Scenario Model Intercomparison Project (ScenarioMIP) for CMIP6, Geosci. Model Dev., 9, 3461–3482, https://doi.org/10.5194/gmd-9-3461-2016, 2016.
Ou, T., Chen, D., Chen, X., Lin, C., Yang, K., Lai, H. W., and Zhang, F.: Simulation of summer precipitation diurnal cycles over the Tibetan Plateau at the gray-zone grid spacing for cumulus parameterization, Clim. Dynam., 54, 3525–3539, https://doi.org/10.1007/s00382-020-05181-x, 2020.
Ozturk, T., Turp, M. T., Türkeş, M., and Kurnaz, M. L.: Future projections of temperature and precipitation climatology for CORDEX-MENA domain using RegCM4.4, Atmos. Res., 206, 87–107, https://doi.org/10.1016/j.atmosres.2018.02.009, 2018.
Parsons, L. A.: Implications of CMIP6 projected drying trends for 21st century Amazonian drought risk, Earths Future, 8, e2020EF001608, https://doi.org/10.1029/2020EF001608, 2020.
Peng, S., Piao, S., Zeng, Z., Ciais, P., Zhou, L., Li, L. Z. X., Myneni, R. B., Yin, Y., and Zeng, H.: Afforestation in China cools local land surface temperature, P. Natl. Acad. Sci. USA, 111, 2915–2919, https://doi.org/10.1073/pnas.1315126111, 2014.
Piao, S., Wang, X., Ciais, P., Zhu, B., Wang, T. A. O., and Liu, J. I. E.: Changes in satellite-derived vegetation growth trend in temperate and boreal Eurasia from 1982 to 2006, Glob. Change Biol., 17, 3228–3239, https://doi.org/10.1111/j.1365-2486.2011.02419.x, 2011.
Politi, N., Vlachogiannis, D., Sfetsos, A., and Nastos, P. T.: High-resolution dynamical downscaling of ERA-Interim temperature and precipitation using WRF model for Greece, Clim. Dynam., 57, 799–825, https://doi.org/10.1007/s00382-021-05741-9, 2021.
Prein, A. F., Langhans, W., Fosser, G., Ferrone, A., Ban, N., Goergen, K., Keller, M., Tölle, M., Gutjahr, O., Feser, F., Brisson, E., Kollet, S., Schmidli, J., van Lipzig, N. P. M., and Leung, R.: A review on regional convection-permitting climate modeling: Demonstrations, prospects, and challenges, Rev. Geophys., 53, 323–361, https://doi.org/10.1002/2014RG000475, 2015.
Qiu, Y., Feng, J., Yan, Z., Wang, J., and Li, Z.: High-resolution dynamical downscaling for regional climate projection in Central Asia based on bias-corrected multiple GCMs, Clim. Dynam., 58, 777–791, https://doi.org/10.1007/s00382-021-05934-2, 2022.
Rahimi, S. R., Wu, C., Liu, X., and Brown, H.: Exploring a variable-resolution approach for simulating regional climate over the Tibetan Plateau using VR-CESM, J. Geophys. Res.-Atmos., 124, 4490–4513, https://doi.org/10.1029/2018JD028925, 2019.
Rohatyn, S., Yakir, D., Rotenberg, E., and Carmel, Y.: Limited climate change mitigation potential through forestation of the vast dryland regions, Science, 377, 1436–1439, https://doi.org/10.1126/science.abm9684, 2022.
Sato, T., Kimura, F., and Kitoh, A.: Projection of global warming onto regional precipitation over Mongolia using a regional climate model, J. Hydrol., 333, 144–154, https://doi.org/10.1016/j.jhydrol.2006.07.023, 2007.
Sitch, S., Smith, B., Prentice, I. C., Arneth, A., Bondeau, A., Cramer, W., Kaplan, J. O., Levis, S., Lucht, W., Sykes, M. T., Thonicke, K., and Venevsky, S.: Evaluation of ecosystem dynamics, plant geography and terrestrial carbon cycling in the LPJ dynamic global vegetation model, Glob. Change Biol., 9, 161–185, https://doi.org/10.1046/j.1365-2486.2003.00569.x, 2003.
Shi, S. and Han, P.: Estimating the soil carbon sequestration potential of China's Grain for Green Project, Global Biogeochem. Cy., 28, 1279–1294, https://doi.org/10.1002/2014GB004924, 2014.
Shuaifeng, S.: Mapping the Future Afforestation Distribution of China Constrained by National Afforestation Plan and Climate Change (Version 1.0), Zenodo [data set], https://doi.org/10.5281/zenodo.10900150, 2024.
Skamarock, W. C., Klemp, J. B., Dudhia, J., Gill, D. O., Liu, Z., Berner, J., Wang, W., Powers, J. G., Duda, M. G., Barker, D. M., and Huang, X. Y.: A description of the advanced research WRF model version 4, National Center for Atmospheric Research, Boulder, CO, USA, 145 pp., https://doi.org/10.5065/1dfh-6p97, 2019 (data available at: https://www2.mmm.ucar.edu/wrf/users/, last access: 18 March 2022).
Song, S. and Yan, X.: Projected changes and uncertainty in cold surges over northern China using the CMIP6 weighted multi-model ensemble, Atmos. Res., 278, 106334, https://doi.org/10.1016/j.atmosres.2022.106334, 2022.
Song, S., Zhang, X., Gao, Z., and Yan, X.: Evaluation of atmospheric circulations for dynamic downscaling in CMIP6 models over East Asia, Clim. Dynam., 60, 2437–2458, https://doi.org/10.1007/s00382-022-06465-0, 2023.
State Council of China: Action Plan for Carbon Dioxide Peaking Before 2030, 24 October 2021, https://www.gov.cn/gongbao/content/2021/content_5649731.htm?eqid=e82790c90001dc23000000036459fff2 (last access: 13 October 2022), 2021.
State Council of China: National Land Planning Outline of China (2016–2030), 4 February 2017, http://www.gov.cn/zhengce/content/2017--02/04/content_5165309.htm (last access: 13 October 2022), 2017.
State Forestry Administration of China: National Forest Management Planning (2016–2050), 28 July 2016, https://www.gov.cn/xinwen/2016-07/28/content_5095504.htm?eqid=f495541b0003bd9a00000002648fc315 (last access: 13 October 2022), 2016 (data available at: https://www.gov.cn/xinwen/2016-7/28/5095504/files/b9ac167edfd748dc8c1a256a784f40d5.pdf, last access: 13 October 2022).
Sulla-Menashe, D., Gray, J. M., Abercrombie, S. P., and Friedl, M. A.: Hierarchical mapping of annual global land cover 2001 to present: The MODIS Collection 6 Land Cover product, Remote Sens. Environ., 222, 183–194, https://doi.org/10.1016/j.rse.2018.12.013, 2019.
Tan, M. and Li, X.: Does the Green Great Wall effectively decrease dust storm intensity in China? A study based on NOAA NDVI and weather station data, Land Use Policy, 43, 42–47, https://doi.org/10.1016/j.landusepol.2014.10.017, 2015.
Tang, J., Niu, X., Wang, S., Gao, H., Wang, X., and Wu, J.: Statistical downscaling and dynamical downscaling of regional climate in China: Present climate evaluations and future climate projections, J. Geophys. Res.-Atmos., 121, 2110–2129, https://doi.org/10.1002/2015JD023977, 2016.
Tatli, H. and Dalfes, H. N.: Defining Holdridge's life zones over Turkey, Int. J. Climatol., 36, 3864–3872, https://doi.org/10.1002/joc.4600, 2016.
Thrasher, B., Wang, W., Michaelis, A., Melton, F., Lee, T., and Nemani, R.: NASA global daily downscaled projections, CMIP6, Sci. Data, 9, 262, https://doi.org/10.1038/s41597-022-01393-4, 2022.
Turner, K. E., Smith, D. M., Katavouta, A., and Williams, R. G.: Reconstructing ocean carbon storage with CMIP6 Earth system models and synthetic Argo observations, Biogeosciences, 20, 1671–1690, https://doi.org/10.5194/bg-20-1671-2023, 2023.
Ullah, K. and Shouting, G.: A diagnostic study of convective environment leading to heavy rainfall during the summer monsoon 2010 over Pakistan, Atmos. Res., 120, 226–239, https://doi.org/10.1016/j.atmosres.2012.08.021, 2013.
Varney, R. M., Chadburn, S. E., Burke, E. J., and Cox, P. M.: Evaluation of soil carbon simulation in CMIP6 Earth system models, Biogeosciences, 19, 4671–4704, https://doi.org/10.5194/bg-19-4671-2022, 2022.
Veldman, J. W., Aleman, J. C., Alvarado, S. T., Anderson, T. M., Archibald, S., Bond, W. J., Boutton, T. W., Buchmann, N., Buisson, E., Canadell, J. G., Dechoum, M. D. S., Diaz-Toribio, M. H., Durigan, G., Ewel, J. J., Fernandes, G. W., Fidelis, A., Fleischman, F., Good, S. P., Griffith, D. M., Hermann, J.-M., Hoffmann, W. A., Le Stradic, S., Lehmann, C. E. R., Mahy, G., Nerlekar, A. N., Nippert, J. B., Noss, R. F., Osborne, C. P., Overbeck, G. E., Parr, C. L., Pausas, J. G., Pennington, R. T., Perring, M. P., Putz, F. E., Ratnam, J., Sankaran, M., Schmidt, I. B., Schmitt, C. B., Silveira, F. A. O., Staver, A. C., Stevens, N., Still, C. J., Strömberg, C. A. E., Temperton, V. M., Varner, J. M., and Zaloumis, N. P.: Comment on “The global tree restoration potential”, Science, 366, eaay7976, https://doi.org/10.1126/science.aay7976, 2019.
Verbruggen, W., Schurgers, G., Horion, S., Ardö, J., Bernardino, P. N., Cappelaere, B., Demarty, J., Fensholt, R., Kergoat, L., Sibret, T., Tagesson, T., and Verbeeck, H.: Contrasting responses of woody and herbaceous vegetation to altered rainfall characteristics in the Sahel, Biogeosciences, 18, 77–93, https://doi.org/10.5194/bg-18-77-2021, 2021.
Wang, H., Zhao, W., Li, C., and Pereira, P.: Vegetation greening partly offsets the water erosion risk in China from 1999 to 2018, Geoderma, 401, 115319, https://doi.org/10.1016/j.geoderma.2021.115319, 2021.
Wang, H., Yue, C., and Luyssaert, S.: Reconciling different approaches to quantifying land surface temperature impacts of afforestation using satellite observations, Biogeosciences, 20, 75–92, https://doi.org/10.5194/bg-20-75-2023, 2023.
Wang, J. and Kotamarthi, V. R.: High-resolution dynamically downscaled projections of precipitation in the mid and late 21st century over North America, Earths Future, 3, 268–288, https://doi.org/10.1002/2015EF000304, 2015.
Wang, M., Zhang, X., and Yan, X.: Modeling the climatic effects of urbanization in the Beijing–Tianjin–Hebei metropolitan area, Theor. Appl. Climatol., 113, 377–385, https://doi.org/10.1007/s00704-012-0790-z, 2013.
Wilby, R. L. and Dawson, C. W.: The statistical downscaling model: insights from one decade of application, Int. J. Climatol., 33, 1707–1719, https://doi.org/10.1002/joc.3544, 2013.
Wu, J. and Gao, X.: A gridded daily observation dataset over China region and comparison with the other datasets, Chinese J. Geophys.-Ch., 56, 1102–1111, https://doi.org/10.6038/cjg20130406, 2013 (data available at: https://ccrc.iap.ac.cn/resource/detail?id=228, last access: 20 February 2023).
Wu, J. and Gao, X.: Present day bias and future change signal of temperature over China in a series of multi-GCM driven RCM simulations, Clim. Dynam., 54, 1113–1130, https://doi.org/10.1007/s00382-019-05047-x, 2020.
Wu, Z., Wang, X., Liu, F., Zhu Y., Li, S., Li, B., He, S., Zhang, X., Chen, C., Zhou, Y., Zhou, G., Lin, Y., and Hou, X.: China Vegetation, Science Press, Beijing, ISBN 9787030024220, 1980 (data available at: https://www.resdc.cn/data.aspx?DATAID=133, last access: 26 December 2022).
Xiao, J.: Satellite evidence for significant biophysical consequences of the “Grain for Green” Program on the Loess Plateau in China, J. Geophys. Res.-Biogeo., 119, 2261–2275, https://doi.org/10.1002/2014JG002820, 2014.
Xu, J.: Estimation of the spatial distribution of potential forestation land and its climatic potential productivity in China, Acta Geographica Sinica, 78, 677–693, https://doi.org/10.11821/dlxb202303011, 2023.
Xu, Z. and Yang, Z. L.: An improved dynamical downscaling method with GCM bias corrections and its validation with 30 years of climate simulations, J. Climate, 25, 6271–6286, https://doi.org/10.1175/JCLI-D-12-00005.1, 2012.
Yan, Y., Tang, J., Liu, G., and Wu, J.: Effects of vegetation fraction variation on regional climate simulation over Eastern China, Global Planet. Change, 175, 173–189, https://doi.org/10.1016/j.gloplacha.2019.02.004, 2019.
Yan, Y., Tang, J., Wang, S., Niu, X., and Wang, L.: Uncertainty of land surface model and land use data on WRF model simulations over China, Clim. Dynam., 57, 1833–1851, https://doi.org/10.1007/s00382-021-05778-w, 2021.
Yang, K., Wang, C., and Li, S.: Improved simulation of frozen-thawing process in land surface model (CLM4.5), J. Geophys. Res.-Atmos., 123, 13238–13258, https://doi.org/10.1029/2017JD028260, 2018.
Yang, X., Zhou, B., Xu, Y., and Han, Z.: CMIP6 evaluation and projection of temperature and precipitation over China, Adv. Atmos. Sci., 38, 817–830, https://doi.org/10.1007/s00376-021-0351-4, 2021.
You, N., Meng, J., Zhu, L., Jiang, S., Zhu, L., Li, F., and Kuo, L. J.: Isolating the impacts of land use/cover change and climate change on the GPP in the Heihe River Basin of China, J. Geophys. Res.-Biogeo., 125, e2020JG005734, https://doi.org/10.1029/2020JG005734, 2020.
Yu, E., Sun, J., Chen, H., and Xiang, W.: Evaluation of a high-resolution historical simulation over China: climatology and extremes, Clim. Dynam., 45, 2013–2031, https://doi.org/10.1007/s00382-014-2452-6, 2015.
Yu, L., Liu, T., Bu, K., Yang, J., Chang, L., and Zhang, S.: Influence of snow cover changes on surface radiation and heat balance based on the WRF model, Theor. Appl. Climatol., 130, 205–215, https://doi.org/10.1007/s00704-016-1856-0, 2017.
Yu, L., Liu, Y., Liu, T., and Yan, F.: Impact of recent vegetation greening on temperature and precipitation over China, Agr. Forest. Meteorol., 295, 108197, https://doi.org/10.1016/j.agrformet.2020.108197, 2020.
Yu, Z., Ciais, P., Piao, S., Houghton, R. A., Lu, C., Tian, H., Agathokleous, E., Kattel, G. R., Sitch, S., Goll, D., Yue, X., Walker, A., Friedlingstein, P., Jain, A. K., Liu, S., and Zhou, G.: Forest expansion dominates China's land carbon sink since 1980, Nat. Commun., 13, 5374, https://doi.org/10.1038/s41467-022-32961-2, 2022.
Yuan, G., Tang, W., Zuo, T., Li, E., Zhang, L., and Liu, Y.: Impacts of afforestation on land surface temperature in different regions of China, Agr. Forest. Meteorol., 318, 108901, https://doi.org/10.1016/j.agrformet.2022.108901, 2022.
Zevallos, J. and Lavado-Casimiro, W.: Climate change impact on Peruvian biomes, Forests, 13, 238, https://doi.org/10.3390/f13020238, 2022.
Zhang, L., Sun, P., Huettmann, F., and Liu, S.: Where should China practice forestry in a warming world?, Glob. Change Biol., 28, 2461–2475, https://doi.org/10.1111/gcb.16065, 2022.
Zhang, P., Shao, G., Zhao, G., Le Master, D. C., Parker, G. R., Dunning Jr., J. B., and Li, Q.: China's forest policy for the 21st century, Science, 288, 2135–2136, https://doi.org/10.1126/science.288.5474.2135, 2000.
Zhang, X., Ding, N., Han, S., and Tang, Q.: Irrigation-induced potential evapotranspiration decrease in the Heihe River Basin, Northwest China, as simulated by the WRF model, J. Geophys. Res.-Atmos., 125, e2019JD031058, https://doi.org/10.1029/2019JD031058, 2020.
Zhang, X., Chen, J., and Song, S.: Divergent impacts of land use/cover change on summer precipitation in eastern China from 1980 to 2000, Int. J. Climatol., 41, 2360–2374, https://doi.org/10.1002/joc.6963, 2021.
Zhang, Y. and Song, C.: Impacts of afforestation, deforestation, and reforestation on forest cover in China from 1949 to 2003, J. Forest., 104, 383–387, https://doi.org/10.1093/jof/104.7.383, 2006.
Zhao, D., Lin, Y., Dong, W., Qin, Y., Chu, W., Yang, K., Letu, H., and Huang, L.: Alleviated WRF summer wet bias over the Tibetan Plateau using a new cloud macrophysics scheme, J. Adv. Model. Earth Sy., 15, e2023MS003616, https://doi.org/10.1029/2023MS003616, 2023.
Zhao, X., Ma, X., Chen, B., Shang, Y., and Song, M.: Challenges toward carbon neutrality in China: Strategies and countermeasures, Resour. Conserv. Recy., 176, 105959, https://doi.org/10.1016/j.resconrec.2021.105959, 2022.
Zhao, Y., Zhong, L., Ma, Y., Fu, Y., Chen, M., Ma, W., Zhao, C., Huang, Z., and Zhou, K.: WRF/UCM simulations of the impacts of urban expansion and future climate change on atmospheric thermal environment in a Chinese megacity, Climatic Change, 169, 38, https://doi.org/10.1007/s10584-021-03287-7, 2021.
Zheng, Y., Alapaty, K., Herwehe, J. A., Del Genio, A. D., and Niyogi, D.: Improving high-resolution weather forecasts using the Weather Research and Forecasting (WRF) Model with an updated Kain–Fritsch scheme, Mon. Weather Rev., 144, 833–860, https://doi.org/10.1175/MWR-D-15-0005.1, 2016.
Zhu, K., Song, Y., and Qin, C.: Forest age improves understanding of the global carbon sink, P. Natl. Acad. Sci. USA, 116, 3962–3964, https://doi.org/10.1073/pnas.1900797116, 2019.
Zomer, R. J., Trabucco, A., Bossio, D. A., and Verchot, L. V.: Climate change mitigation: A spatial analysis of global land suitability for clean development mechanism afforestation and reforestation, Agr. Ecosyst. Environ., 126, 67–80, https://doi.org/10.1016/j.agee.2008.01.014, 2008.
Zuo, Z., Fung, J. C., Li, Z., Huang, Y., Wong, M. F., Lau, A. K., and Lu, X.: Projection of future heatwaves in the Pearl River Delta through CMIP6-WRF dynamical downscaling, J. Appl. Meteorol. Clim., 62, 1297–1314, https://doi.org/10.1175/JAMC-D-22-0201.1, 2023.