the Creative Commons Attribution 4.0 License.
the Creative Commons Attribution 4.0 License.
 | 25 Jun 2024
Technical note: An open-source, low-cost system for continuous monitoring of low nitrate concentrations in soil and open water
Sahiti Bulusu
Cristina Prieto García
Helen E. Dahlke
Nitrate (NO), mainly leaching with soil porewater, is the primary nonpoint source pollutant of groundwater worldwide. Obtaining real-time information on nitrate levels in soils would allow for gaining a better understanding of the sources and transport dynamics of nitrate through the unsaturated zone. However, conventional nitrate detection techniques (e.g., soil sample analysis) necessitate costly, laboratory-grade equipment for analysis, along with human resources, resulting in a laborious and time-intensive procedure. These drawbacks raise the need to develop cost-effective and automated systems for in situ nitrate measurements in field conditions. This study presents the development of a low-cost, portable, automated system for field measurements of nitrate in soil porewater and open water bodies. The system is based on the spectrophotometric determination of nitrate using a single reagent. The system design and processing software are openly accessible, including a building guide, to allow duplicating or changing the system according to user-specific needs. Three field tests, conducted over 5 weeks, validated the system's measurement capabilities within the range of 0–10 ppm NO–N with a low RMSE of <0.2 ppm NO–N when comparing the results to standard laboratory nitrate analysis. Data derived from such a system allow for tracking of the temporal variation in soil nitrate, thus opening new possibilities for diverse soil and nutrient management studies.
- Article
(1728 KB) - Full-text XML
- BibTeX
- EndNote


Nitrogen (N) is a macro-nutrient found in soil, groundwater, and open water bodies across the globe. Nitrogen is essential for crop production, and applying nitrogen-based fertilizers is a common practice in agriculture. However, excess fertilization leads to low nitrogen use efficiency (NUE) and can cause groundwater contamination due to leaching of excess nitrate (NO) in the soil, which is the mobile form of nitrogen and is easily transported by water (Ascott et al., 2017; Turkeltaub et al., 2021; Levintal et al., 2023). Nitrate leaching from agricultural soils through the vadose zone has become the primary nonpoint source pollutant of groundwater (Ascott et al., 2017; Richa et al., 2022; Gurdak and Qi, 2012). Elevated nitrate concentrations in open water, in addition to groundwater, are also considered a major global threat that can cause algae blooms and loss of aquatic life (Van Metre et al., 2016; Wherry et al., 2021).
Optimizing fertilization by applying the needed amount of nitrogen fertilizer for the crop at each growing stage can reduce the environmental risks above. To achieve this, real-time information on soil porewater nitrate levels is required (Yeshno et al., 2019), leading to a need for an accessible method to measure real-time nitrate concentrations in soils. However, measuring continuous in situ soil porewater nitrate concentrations is still a major environmental and agricultural challenge. During the last 2 decades, different soil porewater nitrate characterization technologies have been tested, including ion-selective electrodes, portable spectrophotometers coupled with suction cups, and lab-on-a-chip technologies (Bristow et al., 2022).
The majority of published nitrate sensing systems for soil porewater show promising potential; however, they are limited to only lab tests, require complicated and repeated calibration procedures, or may be considered to be a proof of concept rather than a functional field system (e.g., Ali et al., 2019; Chen et al., 2023; Tuli et al., 2009). Only two published studies, as far as we know, have shown significant progress in measuring soil porewater nitrate concentrations continuously in the field. Bristow et al. (2022) developed ion-selective electrodes for soil nitrate sensing. The electrodes were field tested under a relatively high nitrate measurement range of ∼ 50–300 ppm NO–N with a reported root mean square error (RMSE) of ∼ 16 ppm NO–N. They described significant drift after 8 weeks of field deployment that required the development of a correction algorithm. In general, electrode fouling, drift, ion interference, limited sensitivity, and the need for temperature compensation are major disadvantages of ion-selective electrodes (Tuli et al., 2009).
Yeshno et al. (2019) presented a monitoring system for continuous measurements of nitrate concentrations in soil porewater. Their system is based on ultraviolet (UV) absorbance spectroscopy to directly determine nitrate without pretreatment of the sample, such as filtration or adding reagents. The system was tested at four agricultural field sites during four sampling campaigns. The nitrate measurement range was ∼ 10–350 ppm NO–N (no RMSE was reported). The main advantage of the system is the durability and lack of needed field calibration; thus we consider this system to be the most advanced and robust solution for field nitrate measurements currently available. Yet, the methodology is patented with no assembly details provided, and therefore, it cannot be duplicated and deployed by other users.
This study describes the construction and performance of a portable, low-cost, automated system for porewater nitrate measurements. The system is based on a spectrophotometer coupled with an array of pumps and a suction cup installed in the soil. Comprehensive technical documentation encompassing system design, assembly, programming, deployment, power management, and data analysis is included to allow end users to replicate, modify, and deploy the system to their specific requirements without requiring prior engineering expertise. For validation, three field tests with a concentration range of 0–10 ppm NO–N were conducted over 5 weeks.
The system is based on the spectrophotometric determination of nitrate using a single reagent (Doane and Horwáth, 2003). Each water sample is mixed with a reagent (vanadium(III) chloride (VCl3) + sulfanilamide + N − (1-naphthyl)ethylenediamine dihydrochloride (NEDD)) and then measured at 540 nm wavelength. The absorption intensity is used to determine the nitrate concentration using a calibration curve as detailed below.
2.1 Hardware
The field nitrate sensing system is established on the open-source hardware concept (Pearce, 2012, 2014) and consists of three segments: the spectrophotometer, the hydraulics system, and the control unit (Fig. 1a). The low-cost spectrophotometer is based on the design by Laganovska et al. (2020), utilizing the C12880MA mini-spectrometer chip (Hamamatsu Photonics K.K., Japan). The device measures absorption in the 450–750 nm range, yet we use only the 540 nm wavelength. The 3D-printed measurement box holds the cuvette for sample measurements (Fig. 1b).
The hydraulics system consisted of six peristaltic dosing pumps, a set of (1.57 mm) inner diameter tubing, a 50 mL container for collecting the initial water sample (no. 1), a 15 mL container for mixing the sample with the reagent (no. 2), a 50 mL container for post-processing waste collection of the sample mixed with the reagent (no. 3), a reagent box (no. 4), and a ceramic suction cup used to collect the water samples from the tested soil or water body (no. 5) (Fig. 1a and b). The first pump (P1) is connected to the ceramic suction cup for sample collection. The rest of the pumps work in coordination to mix the appropriate sample volume with reagents, deposit it in the cuvette, and then clean the tubes and cuvette once the measurement is taken. The spectrophotometer and hydraulics system are controlled using an open-source microcontroller (Arduino Mega, Arduino, Italy) with a micro SD card for data logging. The system is powered by a 12 V, 7 Ah battery connected to a 10 W solar panel. Hardware details, system assembly instructions, and pump sequence are provided on our GitHub page (https://github.com/SahitiB/AGNET/tree/main; last access: 20 June 2024).
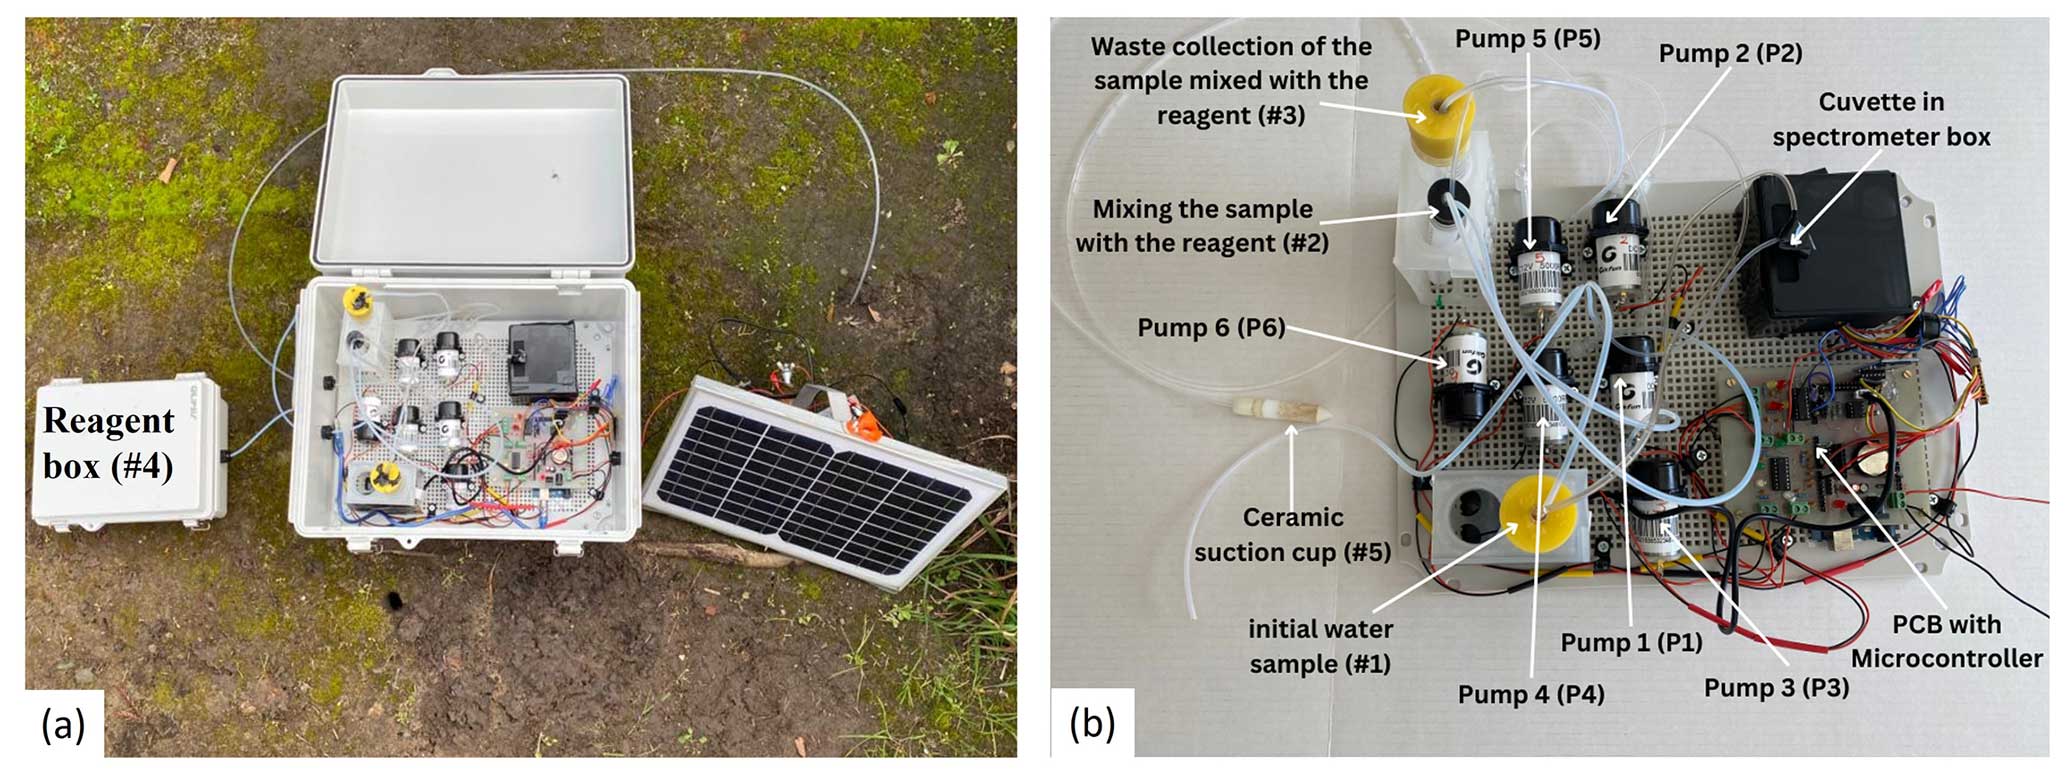
Figure 1Experimental setting. The complete system during soil testing (a) and zoomed-in view of the main box (b). We note that the spectrophotometer unit is based on the design by Laganovska et al. (2020).
2.2 Software
An Arduino Mega microcontroller controls the device. Programming the Mega is done using C, the default language of the Arduino Integrated Development Environment (IDE) (https://www.arduino.cc/en/software, last access: 20 June 2024). The code contains the functions required to control the sequence of events for the entire system as well as the process of the spectrophotometer's results. The order and runtime of the pumps are controlled through the code and can be changed as needed. The complete code and open license conditions are described on our GitHub page (https://github.com/SahitiB/AGNET/tree/main).
The flowchart in Fig. 2 shows the sequence of a single nitrate measurement event, as instructed by the code. First, P1 pumps a soil porewater sample through the ceramic suction cup into container no. 1 until the water level sensor attached to the container is met at a sample volume of 5 mL. Then, P2 pumps 0.1 mL of the collected sample into container no. 2, followed by P4 pumping 0.9 mL of the reagent into the same container. The mixed sample is then transported to the cuvette (Fig. 1b, black box) using pump P3. Once the passive reaction time of 8 h is completed, the spectrophotometer reading is taken; pumps P5 and P6 empty out the cuvette and container no. 1; and the entire system is thoroughly cleaned, emptied, and readied for the next cycle. The user can change the frequency between nitrate measurement events according to their needs and battery consumption as detailed below.
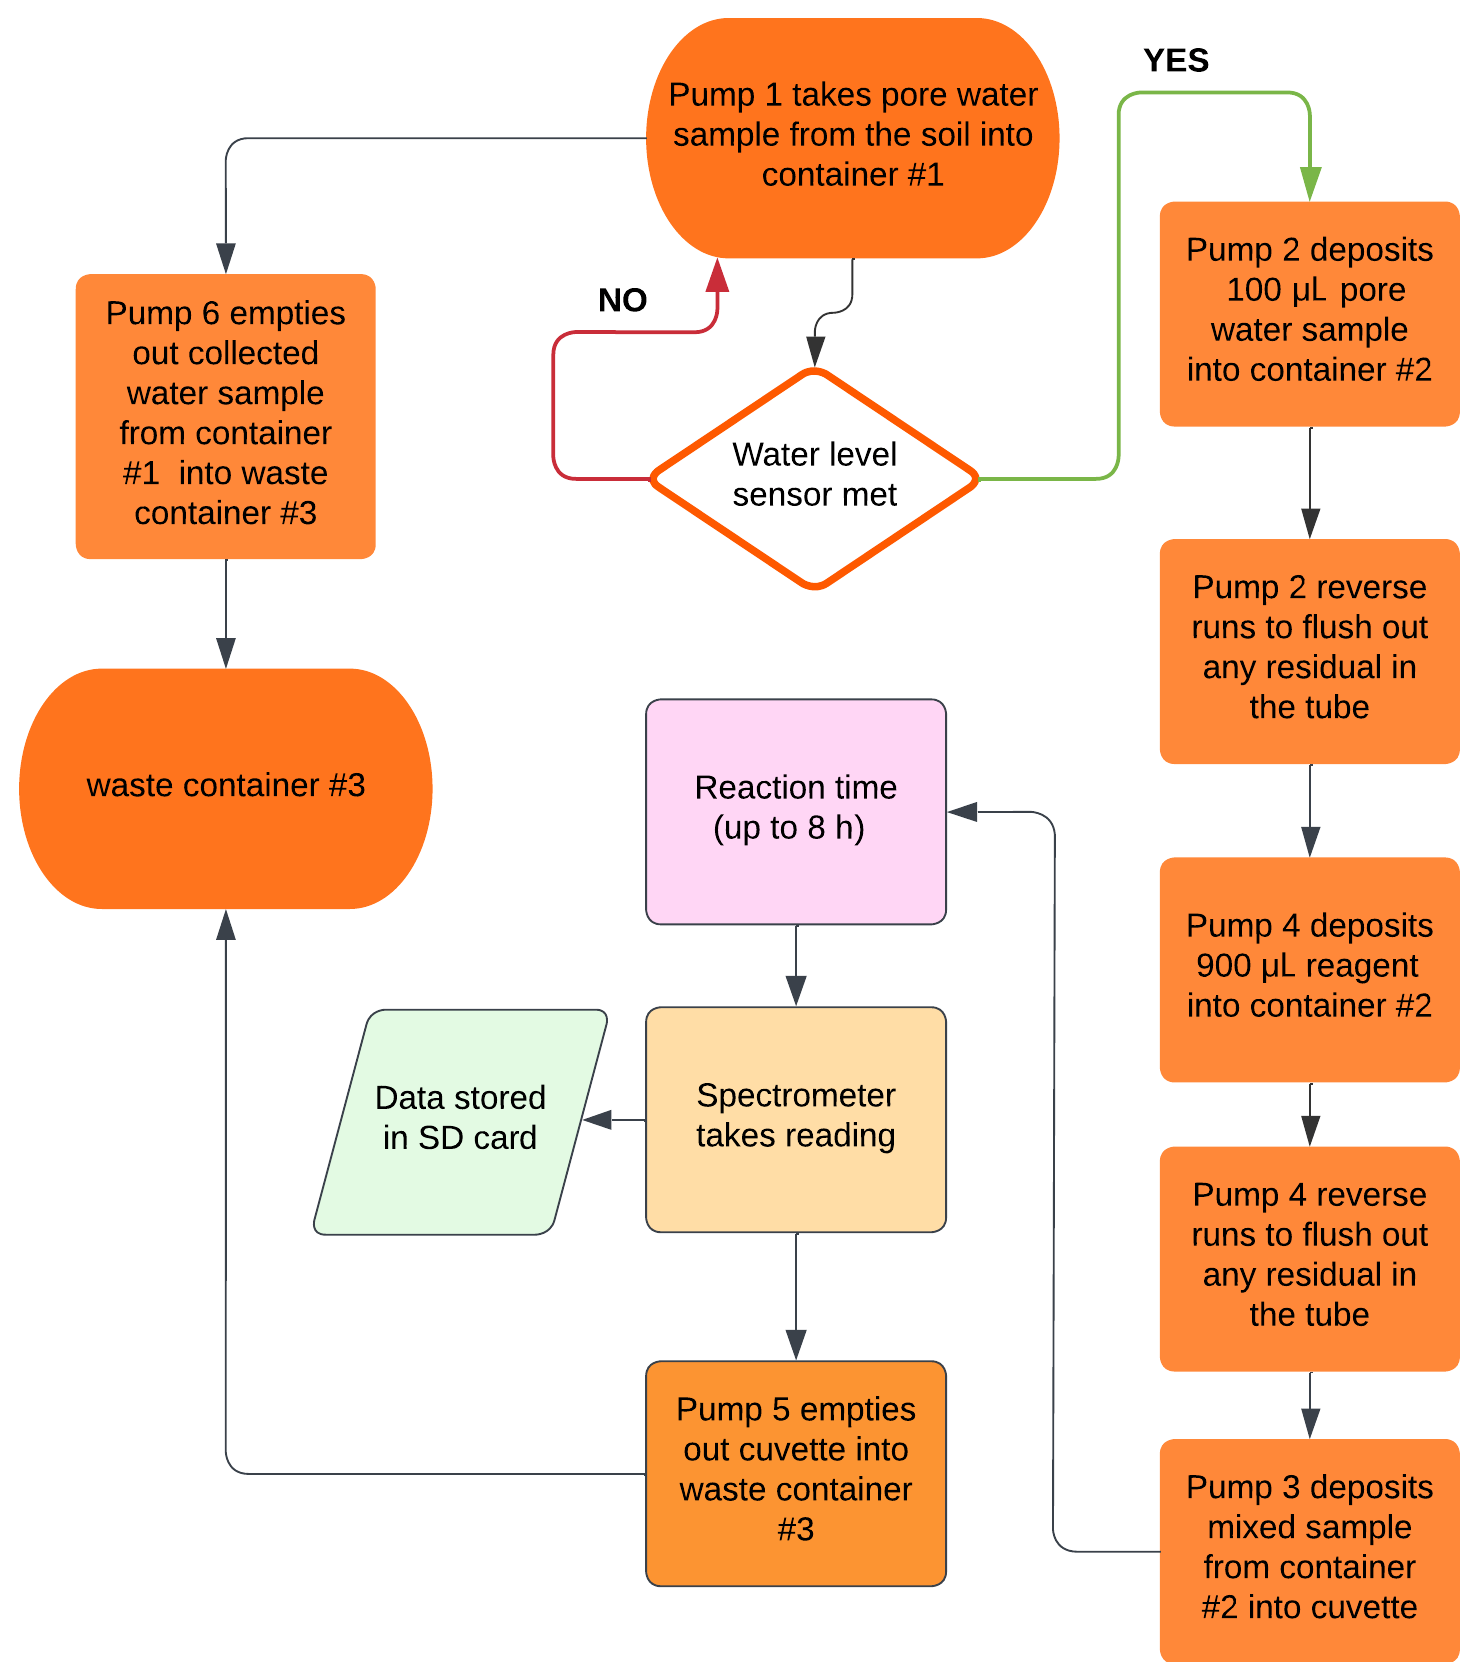
Figure 2A flowchart of the main sequence in a single nitrate measurement event. A more detailed description of each step is given on our GitHub page.
2.3 Field deployment
The system was calibrated using standard nitrate samples of 0, 0.1, 0.3, 1, 3, 5, 8, and 10 ppm NO–N. After running the samples mixed with reagent through the spectrophotometer, a calibration curve (Lambert–Beer curve) relating the spectrophotometer absorbance values to the standard nitrate samples is created. A calibration curve is constructed before each experiment. Three field tests were conducted to evaluate system performance – two tests were run on soil porewater samples and one using open water samples. The tests were all carried out in Fremont, California, between February and June 2023. For each test, field-measured nitrate concentrations were compared against laboratory measurements with a Shimadzu 206-24000-92 UV/Visible scanning spectrophotometer at the University of California, Davis, for validation. For the validation, sub-samples were directly taken from the water sample container (no. 1) after the porewater sample was obtained but before adding the reagent. Comparison of the field-measured nitrate with the standard laboratory method was done in several ways.
First, we conducted the variable test, which aimed at testing the accuracy of the system by randomly varying the amount of nitrate fertilizer in the soil during irrigation (Scotts Liquid Turf Builder with Plus 2 Weed Control (25 % nitrogen content), Scotts, USA). This tested the ability of the system to detect shifts in nitrate levels. Secondly, a continuous test was performed to examine the system stability under rain conditions and the ability to measure nitrate leaching in soil. The variable test ran for 7 d with two readings per day, and the continuous test ran for 17 d with one reading per day. In both tests, the suction cup was installed at a depth of 6.3 cm (2.5 in.) in the soil, and the system operated autonomously without any maintenance. The third test was the open water pulse test to validate the ability of the system to measure nitrate in water bodies (e.g., rivers and lakes). The suction cup was submerged in a 12 L water bucket for 12 d with one reading per day. Every fourth day, a 0.5 L cup of nitrate-based fertilizer (same as above) was added to the water bucket to test the ability of the system to detect changes in nitrate levels in open water. Atmospheric measurements for the experiments were taken from the California Irrigation Management Information System (CIMIS) station (station 171, Union City, CA).
3.1 System performances
A summary of the calibration and experimental results is presented in Table 1. One example of the Lambert–Beer calibration curve is displayed in Fig. 3. The high R2 of 0.998 between the absorption and the standard nitrate samples validates the linearity of our spectrophotometer and the capability to accurately measure nitrate.
Table 1Summary of the calibration and experiment results.
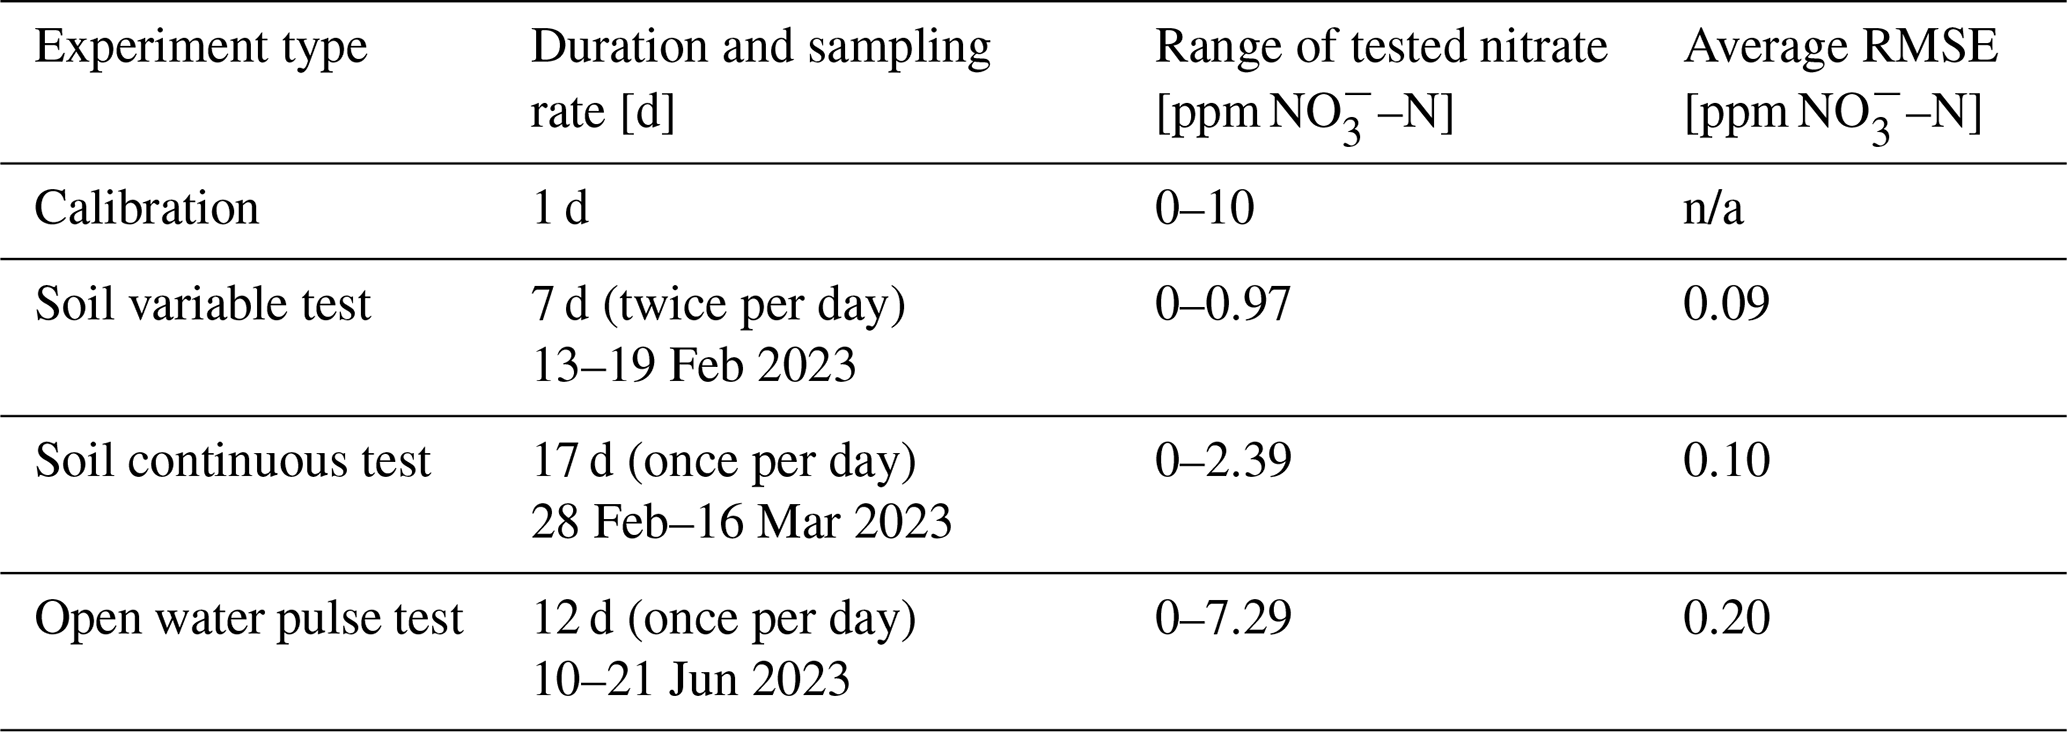
n/a – not applicable.
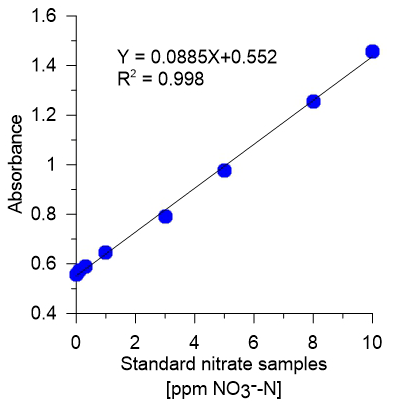
Figure 3Lambert–Beer calibration curve for the system spectrophotometer using known standard nitrate concentrations of 0, 0.1, 0.3, 1, 3, 5, 8, and 10 ppm of NO–N.
The first variable test focused on the low range of nitrate in the soil <1 ppm NO–N. During the 7 d test, the system was successful in measuring the changes in nitrate level with a RMSE of 0.09 ppm NO–N compared to the lab reference analysis (Fig. 4a). We consider this to be a low error value that validates our system in the low concentration range of nitrate. The soil continuous test showed similar high accuracy throughout the 17 d of trial, with an average RMSE of 0.10 ppm NO–N (Fig. 4b). The stability of measurements during this period suggests that no degradation of system performance occurred, with all measurement cycles conducted successfully. This 17 d test was conducted during a significant rain event with 12.2 mm d−1 of rainfall occurring on the first day. Therefore, we were able to measure, in real time, the nitrate leaching in the topsoil (marked by the black curve line in Fig. 4b). The third test was conducted to validate the system in open water (Fig. 4c). In this case, the suction cup was submerged in a 12 L water container, and nitrate-based fertilizer was added every fourth day. RMSE remained low with 0.20 ppm NO–N. The first step of water sampling using P1 was drastically faster compared to the soil tests, reducing the pump time from 30–40 to 5–10 min per cycle.
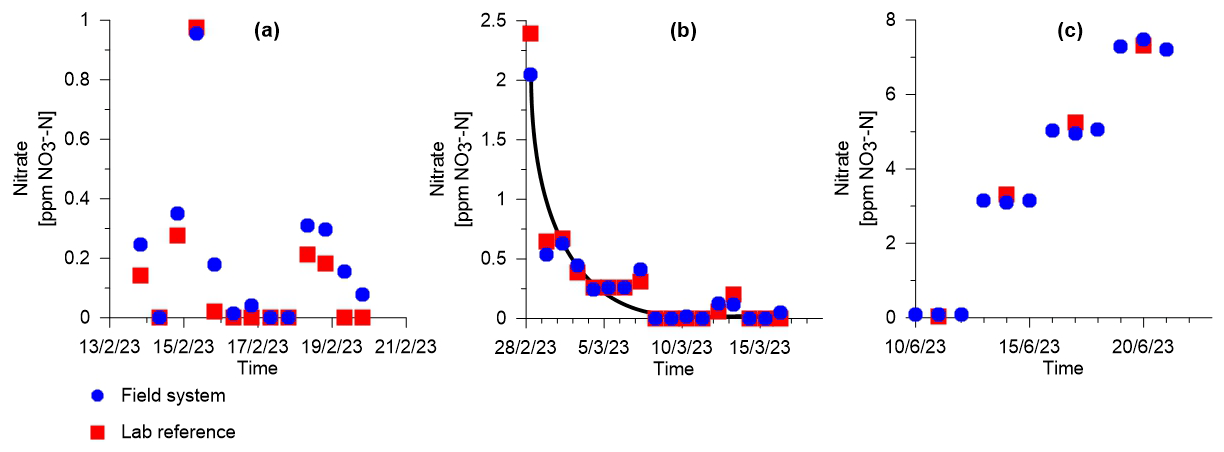
Figure 4Experimental results of the spectrophotometer testing for the soil variable test of low nitrate concentrations (a), the soil continuous test under a rain event (b), and the open water pulse test (c). The black line in (b) marks the nitrate leaching after a rain event of 12.2 mm d−1 on 28 February 2023. For each concentration level in the open water pulse test in (c), three field measurements (blue dots) were compared to one laboratory measurement (red squares).
3.2 System limitations and modifications
In this study, we presented and tested a portable, low-cost field nitrate sensing system to measure in situ nitrate concentrations in soil porewater and aquatic environments. Although the system is autonomous in terms of obtaining a sample and processing it until a nitrate concentration is determined, it does require some user input. The main user input required involves replacing the dry ice in the reagent box to maintain the recommended temperature of 4 °C for the vanadium(III) chloride reagent to work at its optimum (Fig. 1a). In our experiments, replacing the dry ice every 5 d was sufficient to ensure this temperature; however, all experiments were conducted at an average daily air temperature of 10 °C with a daily maximum of ∼ 20 °C. Warmer conditions will require a more frequent replacement time of the dry ice or adding a cooler box or more advanced solutions, such as a small field-refrigerated unit or a Peltier cooling plate based on solar panel or gas. Improving the reagent chill box will increase system cost yet reduce human dependency. This, together with the addition of a low-cost modem or wireless communication such as wi-fi or LoRa (Bristow et al., 2022; Sanchez-Iborra et al., 2018; Levintal et al., 2021), will make the device completely autonomous for weeks to months.
The system, considering our sample to reagent ratio, can accurately measure nitrate concentrations up to ∼ 10 ppm NO–N. This is a well-known limitation (Doane and Horwath, 2003) of using the vanadium(III) chloride reagent, which also exists in the lab. It would be possible to increase the range with the current system by increasing the amount of reagent, decreasing the amount of sample, or doing both. However, further experiments would be necessary to implement and test this extended range. When analyzing samples with higher concentrations (70–80 ppm NO–N), adding the reagent results in unusual colors (salmon, orange, and yellow) that cannot be accurately measured and calibrated using known concentration standards and the spectrophotometer. For example, a sample with a high concentration (e.g., approximately 120 ppm NO–N) will turn yellow, and the spectrophotometer will register absorbance corresponding to concentrations lower than 1 ppm NO–N, indicating a false reading. A possible solution could be the addition of a visual color sensor to notify the user when the color exceeds the concentration range covered by the standard (i.e., high nitrate concentrations) to then dilute the sample accordingly. This will require changing the design of the system and adding a dilution mechanism.
If a high measurement frequency is required, a heating device can be added, or a temperature curve can be developed to reduce the 8 h reaction time of the vanadium(III) chloride reagent in the cuvette. Yet, this need is highly site specific as warmer climates will reduce the sample–reagent time naturally. Higher measurement frequency means higher power consumption, which should be optimized using a larger battery capacity and/or a larger solar panel. In our experiments, taking the soil variable test as a reference (Fig. 4a), the 12 V, 7 Ah with a 10 W solar panel was sufficient for two samples per day for 7 continuous days. This was achieved under cloudy skies with an average daily solar radiation of 156 W m−2. Power consumption is site dependent due to the variability in the solar panel's efficiency in charging a 12 V battery and, moreover, due to the changes in soil moisture. Lower soil moisture will increase the runtime of the peristaltic pump extracting the water sample from the soil (P1 in Fig. 1), therefore increasing power consumption for each nitrate sampling cycle. In very dry conditions, water samples cannot be extracted from the soil, and the system will not work. A possible optimization solution could be the addition of a soil moisture sensor to deactivate the system under very dry conditions. We note that this is a common problem of using suction cups in dry soils unrelated to this specific system.
This study demonstrates the capabilities to measure nitrate leaching during a rain event and nitrate changes in open water. Additional potential research objectives for the low-cost portable nitrate system include the following: (1) measure soil nitrate levels in the root zone of an agricultural field during a growing session to optimize nitrogen fertilization applications, i.e., precision agriculture methods to reduce groundwater pollution (Yeshno et al., 2019). This application will need to include a soil moisture sensor to allow for the calculation of the nitrate stock available for plant uptake (Bristow et al., 2022). (2) Couple the system with low-cost oxygen sensors (Levintal et al., 2022) to investigate in real time the occurrence of denitrification and its dependency on soil oxygen levels (Levintal et al., 2023). (3) Measure nitrate changes in lakes and rivers during heavy-rain events or floods. (4) Implement the same design to measure other contaminants in the soil porewater and open water given that they have distinct absorbance in the range of our spectrophotometer of 450–750 nm.
This study presents the development of a low-cost, portable, automated system for field measurements of nitrate in soil porewater and open water bodies. The system consists of an Arduino-controlled array of pumps, a suction cup installed in the soil, and a spectrophotometer that measures the nitrate concentration after the water sample is mixed with a reagent. Three field tests conducted over 5 weeks to validate the system within a measurement range of 0–10 ppm NO–N showed a low RMSE of <0.2 ppm NO–N when comparing the results to standard laboratory nitrate analysis. This nitrate range is suitable for soils with low nitrate concentrations or open water. The system design and processing software are openly accessible. By designing a system in which all electronics are limited to buyable hardware components and the files for the printed circuit board (PCB) are provided, it is possible to duplicate or change the system according to user-specific needs. The total cost of the system components is USD 1100, excluding reagents, which we hope will allow for reproducibility and present new possibilities for conducting field studies in soil and environmental nitrate monitoring.
The complete technical guide and code are available at https://doi.org/10.5281/zenodo.12341717 (Bulusu and Levintal, 2024).
EL conceptualized the study and designed the system, SB constructed the system and conducted the study, SB and EL wrote the first manuscript draft, and HED provided the resources and project supervision. All the authors (SB, CPG, HED, and EL) contributed to the final version.
The contact author has declared that none of the authors has any competing interests.
Publisher’s note: Copernicus Publications remains neutral with regard to jurisdictional claims made in the text, published maps, institutional affiliations, or any other geographical representation in this paper. While Copernicus Publications makes every effort to include appropriate place names, the final responsibility lies with the authors.
This research has been supported by the Gordon and Betty Moore Foundation (grant no. 7975), the United States–Israel Binational Agricultural Research and Development Fund (Vaadia-BARD Postdoctoral Fellowship no. FI-605-2020), and the USDA National Institute of Food and Agriculture (grant no. 2021-68012-35914).
This paper was edited by Nicolas Brüggemann and reviewed by two anonymous referees.
Ali, M. A., Wang, X., Chen, Y., Jiao, Y., Mahal, N. K., Moru, S., Castellano, M. J., Schnable, J. C., Schnable, P. S., and Dong, L.: Continuous Monitoring of Soil Nitrate Using a Miniature Sensor with Poly(3-octyl-thiophene) and Molybdenum Disulfide Nanocomposite, ACS Appl. Mater. Inter., 11, 29195–29206, https://doi.org/10.1021/acsami.9b07120, 2019.
Ascott, M. J., Gooddy, D. C., Wang, L., Stuart, M. E., Lewis, M. A., Ward, R. S., and Binley, A. M.: Global patterns of nitrate storage in the vadose zone, Nat. Commun., 8, 1–6, https://doi.org/10.1038/s41467-017-01321-w, 2017.
Bristow, N., Rengaraj, S., Chadwick, D. R., Kettle, J., and Jones, D. L.: Development of a LoRaWAN IoT Node with Ion-Selective Electrode Soil Nitrate Sensors for Precision Agriculture, Sensors, 22, 9100, https://doi.org/10.3390/s22239100, 2022.
Bulusu, S. and Levintal, E.: An open-source, low-cost system for continuous monitoring of low nitrate concentrations in soil and open water, Zenodo [data set], https://doi.org/10.5281/zenodo.12341717, 2024.
Chen, S., Chen, J., Qian, M., Liu, J., and Fang, Y.: Low cost, portable voltammetric sensors for rapid detection of nitrate in soil, Electrochim. Acta, 446, 142077, https://doi.org/10.1016/j.electacta.2023.142077, 2023.
Doane, T. A. and Horwáth, W. R.: Spectrophotometric determination of nitrate with a single reagent, Anal. Lett., 36, 2713–2722, https://doi.org/10.1081/AL-120024647, 2003.
Gurdak, J. J. and Qi, S. L.: Vulnerability of Recently Recharged Groundwater in Principle Aquifers of the United States To Nitrate Contamination, Environ. Sci. Technol., 46, 6004–6012, https://doi.org/10.1021/es300688b, 2012.
Laganovska, K., Zolotarjovs, A., Vázquez, M., Mc Donnell, K., Liepins, J., Ben-Yoav, H., Karitans, V., and Smits, K.: Portable low-cost open-source wireless spectrophotometer for fast and reliable measurements, HardwareX, 7, e00108, https://doi.org/10.1016/j.ohx.2020.e00108, 2020.
Levintal, E., Lee Kang, K., Larson, L., Winkelman, E., Nackley, L., Weisbrod, N., Selker, J. S., and Udell, C. J.: eGreenhouse: Robotically positioned, low-cost, open-source CO2 analyzer and sensor device for greenhouse applications, HardwareX, 9, e00193, https://doi.org/10.1016/j.ohx.2021.e00193, 2021.
Levintal, E., Ganot, Y., Taylor, G., Freer-Smith, P., Suvocarev, K., and Dahlke, H. E.: An underground, wireless, open-source, low-cost system for monitoring oxygen, temperature, and soil moisture, SOIL, 8, 85–97, https://doi.org/10.5194/soil-8-85-2022, 2022.
Levintal, E., Huang, L., Prieto García, C., Coyotl, A., Fidelibus, M. W., Horwath, W. R., Mazza Rodrigues, J. L., and Dahlke, H. E.: Nitrogen fate during agricultural managed aquifer recharge: Linking plant response, hydrologic, and geochemical processes, Sci. Total Environ., 864, 161206, https://doi.org/10.1016/j.scitotenv.2022.161206, 2023.
Pearce, J. M.: Building Research Equipment with Free, Open-Source Hardware, Science, 337, 1303–1304, https://doi.org/10.1126/science.1228183, 2012.
Pearce, J. M.: Cut costs with open-source hardware, Nature, 505, 618–618, https://doi.org/10.1038/505618d, 2014.
Richa, A., Touil, S., and Fizir, M.: Recent advances in the source identification and remediation techniques of nitrate contaminated groundwater: A review, J. Environ. Manage., 316, 115265, https://doi.org/10.1016/j.jenvman.2022.115265, 2022.
Sanchez-Iborra, R., Sanchez-Gomez, J., Ballesta-Viñas, J., Cano, M. D., and Skarmeta, A. F.: Performance evaluation of lora considering scenario conditions, Sensors, 18, 772, https://doi.org/10.3390/s18030772, 2018.
Tuli, A., Wei, J., Shaw, B. D., and Hopmans, J. W.: In Situ Monitoring of Soil Solution Nitrate: Proof of Concept, Soil Sci. Soc. Am. J., 73, 501–509, https://doi.org/10.2136/sssaj2008.0160, 2009.
Turkeltaub, T., Jia, X., Zhu, Y., Shao, M., and Binley, A.: A Comparative Study of Conceptual Model Complexity to Describe Water Flow and Nitrate Transport in Deep Unsaturated Loess, Water Resour. Res., 57, 1–21, https://doi.org/10.1029/2020WR029250, 2021.
Van Metre, P. C., Frey, J. W., Musgrove, M., Nakagaki, N., Qi, S., Mahler, B. J., Wieczorek, M. E., and Button, D. T.: High Nitrate Concentrations in Some Midwest United States Streams in 2013 after the 2012 Drought, J. Environ. Qual., 45, 1696–1704, https://doi.org/10.2134/jeq2015.12.0591, 2016.
Wherry, S. A., Tesoriero, A. J., and Terziotti, S.: Factors Affecting Nitrate Concentrations in Stream Base Flow, Environ. Sci. Technol., 55, 902–911, https://doi.org/10.1021/acs.est.0c02495, 2021.
Yeshno, E., Arnon, S., and Dahan, O.: Real-time monitoring of nitrate in soils as a key for optimization of agricultural productivity and prevention of groundwater pollution, Hydrol. Earth Syst. Sci., 23, 3997–4010, https://doi.org/10.5194/hess-23-3997-2019, 2019.