the Creative Commons Attribution 4.0 License.
the Creative Commons Attribution 4.0 License.
 | 17 Jul 2024
Isotopomer labeling and oxygen dependence of hybrid nitrous oxide production
Nicole M. Travis
Pascale Anabelle Baya
Claudia Frey
Bess B. Ward
Karen L. Casciotti
Nitrous oxide (N2O) is a potent greenhouse gas and ozone depletion agent, with a significant natural source from marine oxygen-deficient zones (ODZs). Open questions remain, however, about the microbial processes responsible for this N2O production, especially hybrid N2O production when ammonia-oxidizing archaea are present. Using 15N-labeled tracer incubations, we measured the rates of N2O production from ammonium (NH), nitrite (NO), and nitrate (NO) in the eastern tropical North Pacific ODZ and the isotopic labeling of the central (α) and terminal (β) nitrogen (N) atoms of the N2O molecule. We observed production of both doubly and singly labeled N2O from each tracer, with the highest rates of labeled N2O production at the same depths as the near-surface N2O concentration maximum. At most stations and depths, the production of 45N2Oα and 45N2Oβ were statistically indistinguishable, but at a few depths there were significant differences in the labeling of the two nitrogen atoms in the N2O molecule. Implementing the rates of labeled N2O production in a time-dependent numerical model, we found that N2O production from NO dominated at most stations and depths, with rates as high as 1600 ± 200 pM N2O d−1. Hybrid N2O production, one of the mechanisms by which ammonia-oxidizing archaea produce N2O, had rates as high as 230 ± 80 pM N2O d−1 that peaked in both the near-surface and deep N2O concentration maxima. Based on the equal production of 45N2Oα and 45N2Oβ in the majority of our experiments, we infer that hybrid N2O production likely has a consistent site preference, despite drawing from two distinct substrate pools. We also found that the rates and yields of hybrid N2O production were enhanced at low dissolved oxygen concentrations ([O2]), with hybrid N2O yields as high as 20 % at depths where [O2] was below detection (880 nM) but nitrification was still active. Finally, we identified a few incubations with [O2] up to 20 µM where N2O production from NO was still active. A relatively high O2 tolerance for N2O production via denitrification has implications for the feedbacks between marine deoxygenation and greenhouse gas cycling.
- Article
(5625 KB) - Full-text XML
-
Supplement
(910 KB) - BibTeX
- EndNote


Nitrous oxide (N2O) is one of the lesser-known greenhouse gases, yet its potential to warm the environment on a per-molecule basis is immense. N2O has a global warming potential 273 times that of carbon dioxide (Smith et al., 2021), and its atmospheric mixing ratio is increasing at a rate of 0.85 ± 0.03 ppb yr−1 (Tian et al., 2020). In the ocean, hotspots of N2O production and flux to the atmosphere occur in marine oxygen-deficient zones (ODZs), where steep redox gradients allow multiple N2O production processes to overlap (Codispoti and Christensen, 1985). ODZs have expanded over the last 60 years (Breitburg et al., 2018; Stramma et al., 2008) and will likely continue to do so as the oceans warm (Oschlies et al., 2018), although the fate of the anoxic cores of ODZs ([O2] ≤ 20 µmol kg−1) remains uncertain (Bianchi et al., 2018; Busecke et al., 2022; Cabré et al., 2015). Without a clear picture of N2O cycling in these regions, it is impossible to predict how climate change will impact the marine emissions of this powerful greenhouse gas.
Much of the N2O cycling in ODZs is linked to denitrification. In low-oxygen waters, denitrifying organisms produce N2O as an intermediate during organic matter remineralization (Dalsgaard et al., 2014; Naqvi et al., 2000; Zumft, 1997). Both direct rate measurements (Frey et al., 2020; Ji et al., 2015, 2018) and natural abundance isotope measurements (Casciotti et al., 2018; Kelly et al., 2021; Monreal et al., 2022; Toyoda et al., 2023) indicate that N2O production directly from nitrate (NO), i.e., without exchange with extracellular nitrite (NO) or nitric oxide (NO) pools, is the primary source of N2O in ODZs. N2O production from extracellular NO, meanwhile, tends to occur at lower rates (Frey et al., 2020; Ji et al., 2015, 2018). Historically, N2O production from denitrification was thought to cease at dissolved oxygen concentrations above 2–3 µM (Dalsgaard et al., 2014), but more recent data suggest that N2O production from NO can occur at ambient oxygen levels as high as 30 µM (Frey et al., 2020; Ji et al., 2018). N2O consumption via denitrification is more sensitive to oxygen than N2O production via denitrification, leading to an oxygen window in which denitrification is a source but not a sink of N2O (Babbin et al., 2015; Dalsgaard et al., 2014; Farías et al., 2009; Frey et al., 2020), although the oxygen inhibition constant for N2O consumption remains difficult to define (Sun et al., 2021a). N2O may also be consumed through N2O fixation, although the importance of N2O fixation in the ocean has yet to be determined (Farías et al., 2013; Si et al., 2023).
Nonetheless, a significant fraction of the N2O in the oxyclines above and below ODZs may be derived from archaeal nitrification. When NO is present, isotopic evidence continues to suggest that ammonia-oxidizing archaea can produce N2O via a hybrid mechanism that combines nitrogen (N) derived from NO and ammonium (NH) to form the N2O molecule (Frame et al., 2017; Frey et al., 2020, 2023; Stieglmeier et al., 2014; Trimmer et al., 2016). New evidence indicates that ammonia-oxidizing archaea can produce N2O both as a by-product of hydroxylamine oxidation and via hybrid N2O production and that the ratio of these processes depends on the ratio of NH to NO available to the archaea (Wan et al., 2023b). The exact mechanism and enzymology of archaeal N2O production remains unknown (Carini et al., 2018; Stein, 2019) but may involve a reaction between hydroxylamine and NO, which occur as intermediates during archaeal ammonia oxidation (Kozlowski et al., 2016; Lancaster et al., 2018; Martens-Habbena et al., 2015; Vajrala et al., 2013). In anaerobic conditions, ammonia-oxidizing archaea are also capable of NO dismutation to O2 and N2, which may involve N2O as an intermediate (Kraft et al., 2022). Ammonia-oxidizing bacteria, more common in regions that are nutrient-replete, produce N2O as a byproduct of hydroxylamine oxidation (Cohen and Gordon, 1979) and via nitrifier denitrification as oxygen concentrations decline (Goreau et al., 1980; Stein and Yung, 2003; Wrage et al., 2001) and nitrite concentrations rise (Frame and Casciotti, 2010).
The stable natural abundance nitrogen and oxygen isotopes of N2O can provide quantification of – and distinction among – potential N2O cycling mechanisms (Kim and Craig, 1990; Rahn and Wahlen, 2000; Toyoda and Yoshida, 1999). For example, natural abundance N2O isotopocule studies have indicated that the high near-surface N2O accumulations in the eastern tropical North Pacific (ETNP) ODZ are 80 % derived from denitrification and 20 % derived from nitrification (Kelly et al., 2021). The isotopic content of the individual N and oxygen (O) atoms in the N2O molecule are expressed in delta notation, defined as δ(15N) or δ(18O) = (), where Rstandard for δ(15N) and Rstandard for δ(18O) are the ratios 15N 14N of air and 18O 16O of Vienna Standard Mean Ocean Water (VSMOW), respectively (Kim and Craig, 1990; Rahn and Wahlen, 2000; Toyoda and Yoshida, 1999). In addition to the bulk N and O isotope ratios in N2O, we can measure the isotopic content of the inner (α) N atom and the outer (β) N atom in N2O (Brenninkmeijer and Röckmann, 1999; Toyoda and Yoshida, 1999). The difference in the 15N content of these two atoms is often referred to as the “site preference” and is defined as . In natural abundance studies, δ(15Nsp) is particularly useful because it exhibits distinct values for different N2O production processes, which are independent of the isotopic value of the substrate (Frame and Casciotti, 2010; Sutka et al., 2003, 2004, 2006; Toyoda et al., 2002, 2005). This allows partitioning between different N2O sources and has been used extensively to quantify N2O cycling in the ocean (Bourbonnais et al., 2017, 2023; Casciotti et al., 2018; Farías et al., 2009; Kelly et al., 2021; Monreal et al., 2022; Popp et al., 2002; Toyoda et al., 2002, 2005, 2019, 2021, 2023; Westley et al., 2006; Yamagishi et al., 2007). As we elaborate upon in the discussion, however, the premise that δ(15Nsp) exhibits a unique and consistent value depends on the assumption that both N atoms in N2O are derived from a singular substrate pool. Thus, hybrid N2O production may complicate traditional interpretations of natural abundance N2O isotopocules.
Previous studies have used 15N tracer experiments to measure N2O production rates in ODZs (Frey et al., 2020, 2023; Ji et al., 2015, 2018). These studies used the accumulation of 45N2O and 46N2O resulting from the addition of 15N-labeled substrates such as 15N–NH and 15N–NO to measure N2O production rates. To our knowledge, the isotopomer measurement has never been applied to 15N tracer experiments to track 15N from different substrates into the α and β positions of the N2O molecule. Here, we present data showing the production of N2O isotopomers with 15N in the α position (45N2Oα) and 15N in the β position (45N2Oβ) from 15N-labeled NH, NO, and NO. Measuring the production of 45N2Oα and 45N2Oβ creates an additional constraint on N2O production mechanisms and thus allows us to quantify different source processes more precisely and accurately. We employed these measurements to (a) validate previous 15N tracer studies of N2O production rates in the ETNP; (b) uncover that the hybrid pathway dominates production by nitrification; (c) establish the insignificance of production solely from NH except the surface; and (d) infer a constant δ(15Nsp) for hybrid N2O, despite drawing from two substrate pools. We also use these results to confirm inferences from natural abundance N2O isotopocules measured in the same system (Kelly et al., 2021).
2.1 Sampling sites
Experiments were performed at three stations in the eastern tropical North Pacific on the R/V Sally Ride in March–April 2018 (Fig. 1). Station PS1 (10° N, 113° W) was on the edge of the oxygen-deficient region, station PS2 (16° N, 105° W) was near the geographic center of the ODZ, and station PS3 (18° N, 102° W) was 19 km from the coast of Mexico (Fig. 1). Samples were collected from 30 L Niskin bottles mounted on a 12-place rosette with a conductivity–temperature–depth profiler and sensors for chlorophyll a fluorescence and dissolved O2 (Sea-Bird SBE 43 oxygen sensor). The cruise took place during a weak La Niña event (Ocean Niño Index = −0.6 °C; NOAA/National Weather Service, 2020).
Ambient [NO] and [NH] were measured shipboard with standard colorimetric (Grasshoff et al., 1999) and fluorometric methods (Grasshoff et al., 1999; Holmes et al., 1999), respectively. Ambient [NO] was measured at Stanford University using a Westco SmartChem 200 Discrete Analyzer (detection limit 83 nM, precision 0.6 µM). Ambient [N2O] was measured via an isotope ratio mass spectrometer (IRMS) at the Stanford Stable Isotope Biogeochemistry Laboratory as part of a prior study (Kelly et al., 2021).
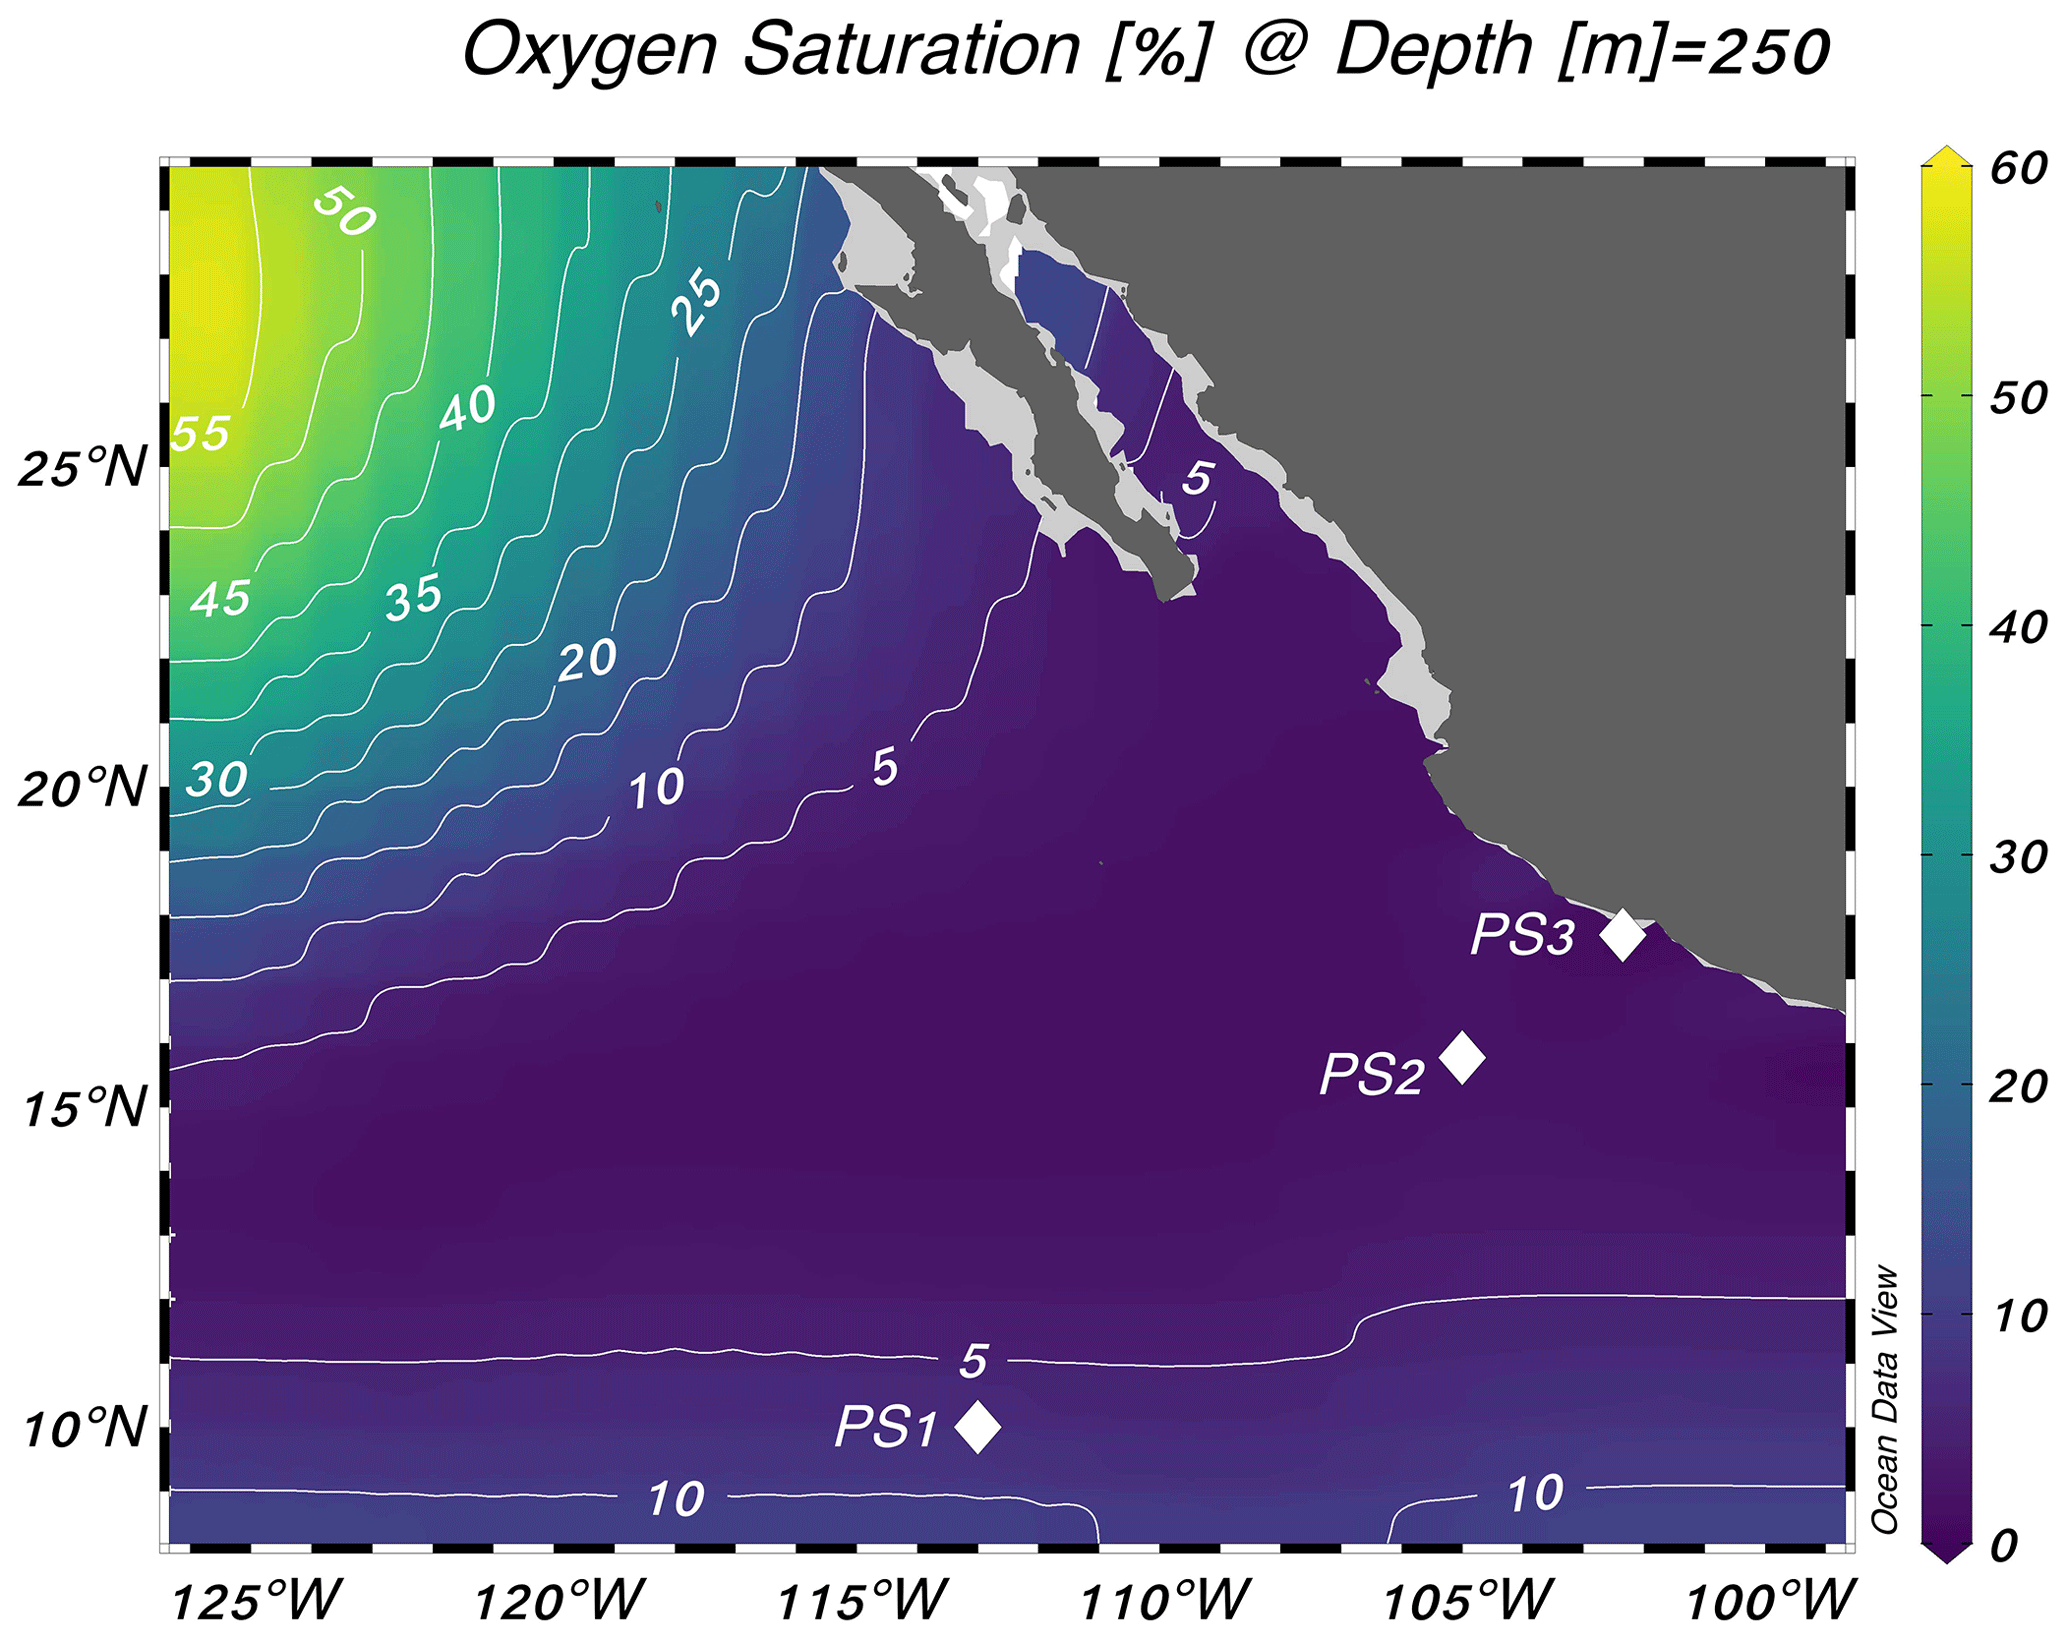
Figure 1Locations of the three stations sampled for this study. Stations are plotted on top of World Ocean Atlas oxygen saturation ( %) at 250 m depth (World Ocean Atlas, 2013). Schlitzer, Reiner, Ocean Data View, https://odv.awi.de, last access: 25 October 2023.
2.2 Sample collection
Incubation depths were chosen to target prominent hydrographic features: the primary NO maximum, shallow and deep oxyclines, oxic–anoxic interfaces above and below the ODZ, secondary chlorophyll a maximum, and secondary NO maximum (Table S1). Incubation samples were filled directly from Niskin bottles into 160 mL glass serum bottles (WHEATON) using Tygon tubing. Incubation bottles were overflowed three times before being capped and sealed bubble-free, with no headspace, using gray butyl rubber septa (National Scientific) and aluminum crimp seals. To minimize oxygen contamination during sampling, incubation bottles were overflowed in a secondary container filled with suboxic water from the same depth, and Niskin bottles were vented with carbon dioxide gas to displace the withdrawn water. The butyl rubber stoppers were deoxygenated in a He-flushed anaerobic chamber for ∼ 1 week prior to sampling.
After sample collection, a 2 mL He headspace was created in each bottle by displacing the 2 mL sample from the bottle with He. At most (all but two) anoxic depths at stations PS2 and PS3, samples were sparged with He gas for 90 min at a flow rate of at least 100 mL min−1, equivalent to 56 volume exchanges, to remove potential oxygen contamination introduced during sampling. Depths with low but non-zero ambient dissolved oxygen were not purged with He gas. After sparging, 100 µL of 1030 ppm N2O in He (4 nmol N2O) in gaseous form was introduced back into each bottle for a final concentration of 26 nM to provide a constant background of N2O for later isotopic analysis (Fig. S4a). The isotopic content of this N2O carrier, measured independently via IRMS (Kelly et al., 2023; McIlvin and Casciotti, 2010), was δ(15Nα) ± 0.2 ‰, δ(15Nβ) = 0.2 ± 0.4 ‰, δ(15Nbulk) = −0.65 ± 0.08 ‰, and δ(18O) = 37.4 ± 0.3 ‰.
Time series were constructed by sacrificing triplicate bottles over a time course, rather than by resampling the incubation bottles over time. A total of 27 incubation samples were thus produced at each experimental depth, comprised of triplicate samples for each of the three time points and three tracers. For each station and depth, nine samples were amended with 15NH4Cl (98.8 atm % 15N; Sigma-Aldrich) to a final concentration of 0.501 µM and with Na14NO2 to a final concentration 1.01 µM. Nine samples were amended with Na15NO2 (98.8 atm % 15N; Sigma-Aldrich) to a final concentration of 5.00 µM and with 14NH4Cl to a final concentration of 0.510 µM. Finally, nine samples were amended with K15NO3 (98.8 atm % 15N; Sigma-Aldrich) to a final concentration of 1.00 µM, plus 1.01 µM Na14NO2 and 0.510 µM 14NH4Cl. Note that the Na15NO2 tracer was added at a higher concentration than the other tracers or the Na14NO2 carrier; this discrepancy was due to a miscalculation that was caught midway through the cruise, but the high tracer addition was retained for the sake of consistency. The NO and NH tracer and carrier additions were confirmed via [NO] and [NH] measurements of sample aliquoted from each bottle immediately before samples were measured for N2O isotopic content, using colorimetric and fluorometric techniques (Grasshoff et al., 1999; Holmes et al., 1999). The Na14NO2 and 14NH4Cl amendments served two purposes: (1) to provide enough total NO for isotopic analysis of 15NO produced from 15NH and (2) to minimize isotope dilution of the substrate pool, which can cause underestimation of rates with low substrate additions. The final atm % 15N of the substrate pools was thus 56 %–100 % for 15N–NH, 65 %–100 % for 15N–NO, and 2 %–92 % for 15N–NO experiments. Three samples for each tracer were terminated immediately after tracer addition with the addition of 100 µL saturated mercuric chloride (HgCl2) solution. These also served as abiotic controls. The remaining samples were incubated at 12 °C in the dark; three samples per tracer were terminated at 12 h and at 24 h with 100 µL saturated HgCl2. All samples were incubated at 12 °C, which was chosen as an intermediate temperature that approximated subsurface conditions. After termination, samples were stored at room temperature (∼ 20 °C) in the dark until isotope analysis.
2.3 Chemiluminescent optode oxygen measurements
Eight 160 mL glass serum bottles were prepared with a chemiluminescent oxygen optode spot (PyroScience) affixed to the inner glass wall with silicone glue. These bottles were incubated alongside experimental bottles to monitor dissolved [O2] during incubations. At stations PS2 and PS3, two optode bottles per depth were filled, purged, amended with the N2O carrier, and incubated without the addition of tracer or HgCl2. At each time point, [O2] was measured in each sensor bottle for at least 10 min using fiber-optic cables paired to the oxygen optode spot mounted inside the bottle (PyroScience). The fiber-optic cables were calibrated with a two-point measurement of (1) a sodium sulfite solution (30 g L−1 in DI, or 0.24 M) and (2) surface seawater saturated with air at 12 °C (270 µM [O2], based on a salinity of 35 psu and a temperature of 12 °C) (Garcia and Gordon, 1992). The two calibration bottles, each containing its own optode spot, were used to calibrate all four of the fiber-optic cables, effectively correcting them to the same scale. Differences in detection limit between sensor spots were accounted for by first performing this two-point calibration procedure to correct for differences between fiber-optic cables and then by measuring the minimum oxygen concentration measured by each sensor spot in purged seawater (purged at 100 mL min−1. for 90 min, equal to 56 volume exchanges). Those detection limits were specific to each optode spot and varied from 146–880 nM [O2].
The optode [O2] measurements were adjusted for the detection limit specific to each sensor spot; optode [O2] for each experiment was calculated as the mean measured [O2] at each of the three time points. No optode measurements were made at station PS1, since this station lacked a secondary NO maximum; thus incubations performed at low-oxygen depths were not expected to occur under functional anoxia. Optical oxygen sensors are susceptible to interference from NO, which could result in an overestimate of [O2] in experiments with especially high rates of NO production (Kraft et al., 2022). Given maximum ammonia oxidation rates of 4.68 ± 0.07 nM N d−1, the release of equivalent amounts of NO would result in an [O2] overestimate of 0.745 nM during a 24 h incubation, based on the interference curve calculated by Kraft et al. (2022) ([O2] overestimate = 0.159 × [NO]). Because of this small potential error and the lack of relevant NO measurements, no correction was applied for NO interference.
Optode [O2] generally agreed with ambient [O2] measured by the Sea-Bird oxygen sensor attached to the rosette (Fig. S1). Two important exceptions were in the experiments at the base of the ODZ and the deep ODZ core at station PS2, which were not purged before tracer addition. As a result, the ambient [O2] at these depths was below detection on the Sea-Bird sensor, but the optode [O2] measurements in the incubation bottles from these depths were 17.7 ± 0.1 and 19.2 ± 0.8 µM, respectively (Fig. S1, Table S1). Additionally, two depths that were suboxic (and thus not sparged prior to tracer addition) had higher optode [O2] than ambient [O2]: in the deep oxycline at station PS2, ambient [O2] was 6.8 µM and optode [O2] was 14.8 ± 0.2 µM; at the oxic–anoxic interface at station PS2, ambient [O2] was 6.5 µM and optode [O2] was 9.48 ± 0.09 µM (Fig. S1, Table S1). Because of these few exceptions, we always report both optode and ambient [O2] in the following figures and text.
2.4 Nitrous oxide isotopocule measurements
Two steps were taken to prepare incubation samples for N2O isotopocule analysis immediately prior to measurement. Firstly, a 5 mL aliquot was removed from each sample by syringe and replaced with He gas. These aliquots were refrigerated until analysis for [NO] and [NH] to check tracer and carrier additions, as mentioned above. After this aliquot was removed, 100 µL of 14NH4Cl, Na14NO2, or K14NO3 carrier was added to each sample at final concentrations of 54, 262, or 27 µM, respectively, to bring 15N tracer levels below 5000 ‰. Note that these carrier additions were different from the 14N carrier added to each incubation alongside the 15N tracer; the purpose of the later carrier additions was to prevent exposure of the IRMS system to highly 15N-enriched substrates.
Samples were measured for N2O concentrations and 15N isotopocules on a custom-built purge and trap system coupled to a Thermo Finnigan DELTA V Plus IRMS, which was run in continuous flow mode and configured to measure 30, 31, 44, 45, and 46 (McIlvin and Casciotti, 2010). These measurements were made under normal operating conditions, using an ionization energy of 124 eV, emission current of 1.50 mA, and accelerating voltage of 3 kV. Samples were analyzed alongside reference materials (B6, S2, and atmosphere-equilibrated seawater) to calibrate the IRMS for scrambling in the ion source with the pyisotopomer software package in Python (Kelly et al., 2023). The number ratios of isotopomers 14N15NO and 15N14NO were calculated as in Kelly et al. (2023), with the following modifications to account for the contribution of 15N15NO to the molecular ion number ratios (46R) and (31R), which, while negligible at natural abundance, becomes important in tracer experiments.
In natural abundance samples, pyisotopomer solves the following four equations to obtain 15Rα and 15Rβ:
where 45R, 46R, and 31R are the molecular ion number ratios , , and . 15Rα, 15Rβ, 17R, and 18R denote the number ratios of 14N15N16O, 15N14N16O, 14NO, and 14NO, respectively, to 14NO. Here, Δ(17O) was assumed to be equal to zero. In these equations, the term (15Rα)(15Rβ) represents the statistically expected contribution of 15N15N16O to the 46R and31R ion number ratios, based on the probabilities of forming 15N15N16O. The probability of getting 15N in Nα is given by 15Rα, and the probability of getting 15N in Nβ is given by 15Rβ; furthermore, the two probabilities are assumed to be independent, so the probability of getting 15N in both positions would be (15Rα)(15Rβ) (Kaiser et al., 2004). Predicting the concentration of 15N15N16O from the distribution of 15N in the singly labeled molecules (15Rα and 15Rβ) is a reasonable assumption for natural abundance samples, where the concentration of 15N15N16O is extremely low (Kantnerová et al., 2022; Magyar et al., 2016).
For 15N-labeled samples, however, we cannot predict 15N15N16O from the singly labeled molecules (15Rα and 15Rβ). This is because the relationship between the formation of 15N15N16O, 14N15N16O, and 15N14N16O depends on production mechanism and the atom fraction of the substrate. For example, in 15N–NO experiments with denitrification occurring, there may be far more 15N15N16O molecules produced than the amount predicted from the production of 14N15N16O and 15N14N16O. To account for this, we added a term to the equations for 46R and 31R to account for the potential of excess 15N15N16O production (15N15N16Oexcess) in tracer experiments:
To quantify 15N15N16Oexcess in tracer samples, we assumed that any increase in 46R over the course of the experiment is due to added 15N15N16O, i.e., that δ(18O) remains constant. This should be a reasonable assumption – while denitrification and N2O consumption could cause natural-abundance-level increases in δ(18O) and thus 46R (10s of per mil), N2O production from 15N-labeled substrates are expected to cause much greater increases in 46R (100s to 1000s of per mil). We calculated the term 15N15N16Oexcess by subtracting the mean 46R at t0 from the measured 46R at later time points using the pyisotopomer template designed for tracer experiments (Kelly, 2023). Then, we used the “Tracers” function in pyisotopomer, which takes this 15N15N16Oexcess into account, to calculate 15Rα and 15Rβ.
The concentration of 44N2O in each sample was calculated from 44 peak area and from a linear conversion factor divided by the sample volume (McIlvin and Casciotti, 2010). The concentrations of 45N2Oα, 45N2Oβ, and 46N2O were finally calculated by multiplying 15Rα, 15Rβ, and 46R by the average [44N2O] across all time points for that tracer experiment. Average values of [44N2O] were used to avoid aliasing random variability in [44N2O] over increases in 15Rα, 15Rβ, and 46R. The analytical precisions for N2O isotopocule measurements, based on the pooled standard deviations of reference materials run alongside samples, were δ(15Nα)= 4.4 ‰, δ(15Nβ)= 3.4 ‰, δ(15Nbulk)= 3.5 ‰, and δ(18O) = 2.1 ‰. The analytical precision was poorer than that in a similar natural abundance dataset (Kelly et al., 2021) due to minor 15N carry-over in some of the standards analyzed immediately following highly enriched samples.
2.5 Nitrite and nitrate isotope measurements
After N2O analysis, approximately 2 mL of sample remained in each bottle, which was prepared for the analysis of δ(15N–NO NO), δ(15N–NO), or δ(15N–NO), to determine the rates of NH3 oxidation, NO oxidation, and NO reduction, depending on the tracer experiment. Samples incubated with 15N–NH were prepared for δ(15N–NONO) analysis using the denitrifier method (Casciotti et al., 2002; Sigman et al., 2001), with updates from McIlvin and Casciotti (2011), to determine rates of NH3 oxidation. These samples were run on a Thermo Finnigan DELTAPLUS XP IRMS alongside a process blank and reference materials USGS32, USGS34, and USGS35 (Böhlke et al., 2003) to obtain δ(15N–NONO).
Samples incubated with 15N–NO were first treated with 5 % sulfamic acid (weight by volume, or 10 mM final concentration) to remove 15N–NO (Granger and Sigman, 2009) then prepared with the denitrifier method for δ(15N–NO) analysis (Casciotti et al., 2002; McIlvin and Casciotti, 2011; Sigman et al., 2001) to determine rates of NO oxidation. For these analyses, reference materials USGS32, USGS34, and USGS35 (Böhlke et al., 2003) were also treated with 5 % sulfamic acid and prepared with the denitrifier method alongside samples. Incubations with low ambient [NO] had high t0δ(15N) values (> 1000 ‰; Fig. S2). This is likely because NO is produced when sulfamic acid is added to NO (Granger and Sigman, 2009), so the sulfamic treatment probably chemically converted some 15N–NO tracer to 15N–NO; additionally, 15N–NO is a possible contaminant of the 15N–NO tracer solutions. Regardless, this would have shifted all three time points equally and thus should not introduce a bias into the slope of δ(15N–NO) with time and the rates calculated from there.
Finally, samples incubated with 15N–NO were prepared for δ(15N–NO) isotopic analysis with the azide method (McIlvin and Altabet, 2005) to determine rates of NO reduction to NO. The 2 mL of remaining sample was transferred into 20 mL vials, where it was prepared alongside reference materials RSIL-N23, -N7373, and -N10219 (Casciotti et al., 2007). Reference materials were diluted from 200 mM working stocks into 3 mL NO-free seawater in 5 and 10 nmol quantities of NO to correct for the contribution of a consistent blank to a range of sample sizes. The analytical precisions for δ(15N–NO), δ(15N–NO), and δ(15N–NO) were 0.9 ‰, 1.2 ‰, and 0.4 ‰, respectively. The δ(15N) analytical precision for the denitrifier and azide methods is typically better (McIlvin and Altabet, 2005; Sigman et al., 2001), but tracer measurements tend to have lower analytical precision than natural abundance measurements.
The rates of NH and NO oxidation were calculated using a weighted least-squares linear regression through product 15N vs. incubation time (Fig. S3). Each sample was weighted by its uncertainty, which was calculated based on the slope and intercept of the calibration curve, blank peak area, and sample peak area (Appendix A). Although using this uncertainty calculation is complex, it allows the assessment of relative error and the inclusion of low-peak-area samples that had high enough δ(15N) enrichments such that the relative error remained below 10 % (and in most cases 1 %). A weighted least-squares regression was used in place of an ordinary least-squares regression to prevent samples with high uncertainties from biasing the slope estimate (e.g., two samples in Fig. S3b). Then, the rate was calculated by
where m(15Fproduct) is the slope of the atom fraction of 15N in the product vs. incubation time, [P] is the mean product concentration (e.g., NO in an NO oxidation experiment), and 15Fsubstrate is the atom fraction of 15N in the substrate (e.g., NO in an NO oxidation experiment). Our method of estimating individual uncertainties was developed to deal with low NH3 oxidation rates, which generated low peak areas in δ(15N–NO) samples. Since the rates of NO reduction were generally much higher than the rates of NH3 oxidation (Table S2), a parallel method was not needed to estimate individual uncertainties in samples measured with the azide method, i.e., δ(15N–NO) measurements, so rates of NO reduction were with an ordinary least-squares regression in Eq. (7) instead of a weighted least-squares regression.
2.6 Modeling N2O production mechanisms
A time-dependent model was constructed to infer the rates and mechanisms of N2O production from the measured isotopocule time courses in each incubation experiment. While it is possible to calculate rates of hybrid and bacterial N2O production with linear regressions of 45N2O and 46N2O with time (Trimmer et al., 2016), these calculations cannot take into account 15N transfer between substrates and, more importantly, produce separate rate estimates for separate tracer experiments. They also do not leverage the additional information provided by N2O isotopomers. We sought to solve for a common set of N2O production rate constants across the three parallel tracer experiments at a given station and depth, wherein the only differences between each tracer experiment were the starting concentrations of 14N and 15N in NH, NO, and NO (Fig. 2). The model encoded four different N2O-producing pathways: (1) production solely from NH, which includes N2O from hydroxylamine oxidation (referred to as Pathway 1 in Wan et al., 2023b), hybrid production using cellular NO (referred to as Pathway 2 in Wan et al., 2023b), and nitrifier denitrification using cellular NO; (2) hybrid production using extracellular NO (referred to as Pathway 3 in Wan et al., 2023b); (3) production from NO, i.e., denitrification or nitrifier denitrification using extracellular NO; and (4) production from NO, i.e., denitrification using cellular NO (Fig. 2). Using this model, the relative importance of each of these pathways was determined at each incubation depth based on the production of 15N-labeled N2O isotopocules in parallel experiments supplied with different 15N substrates.
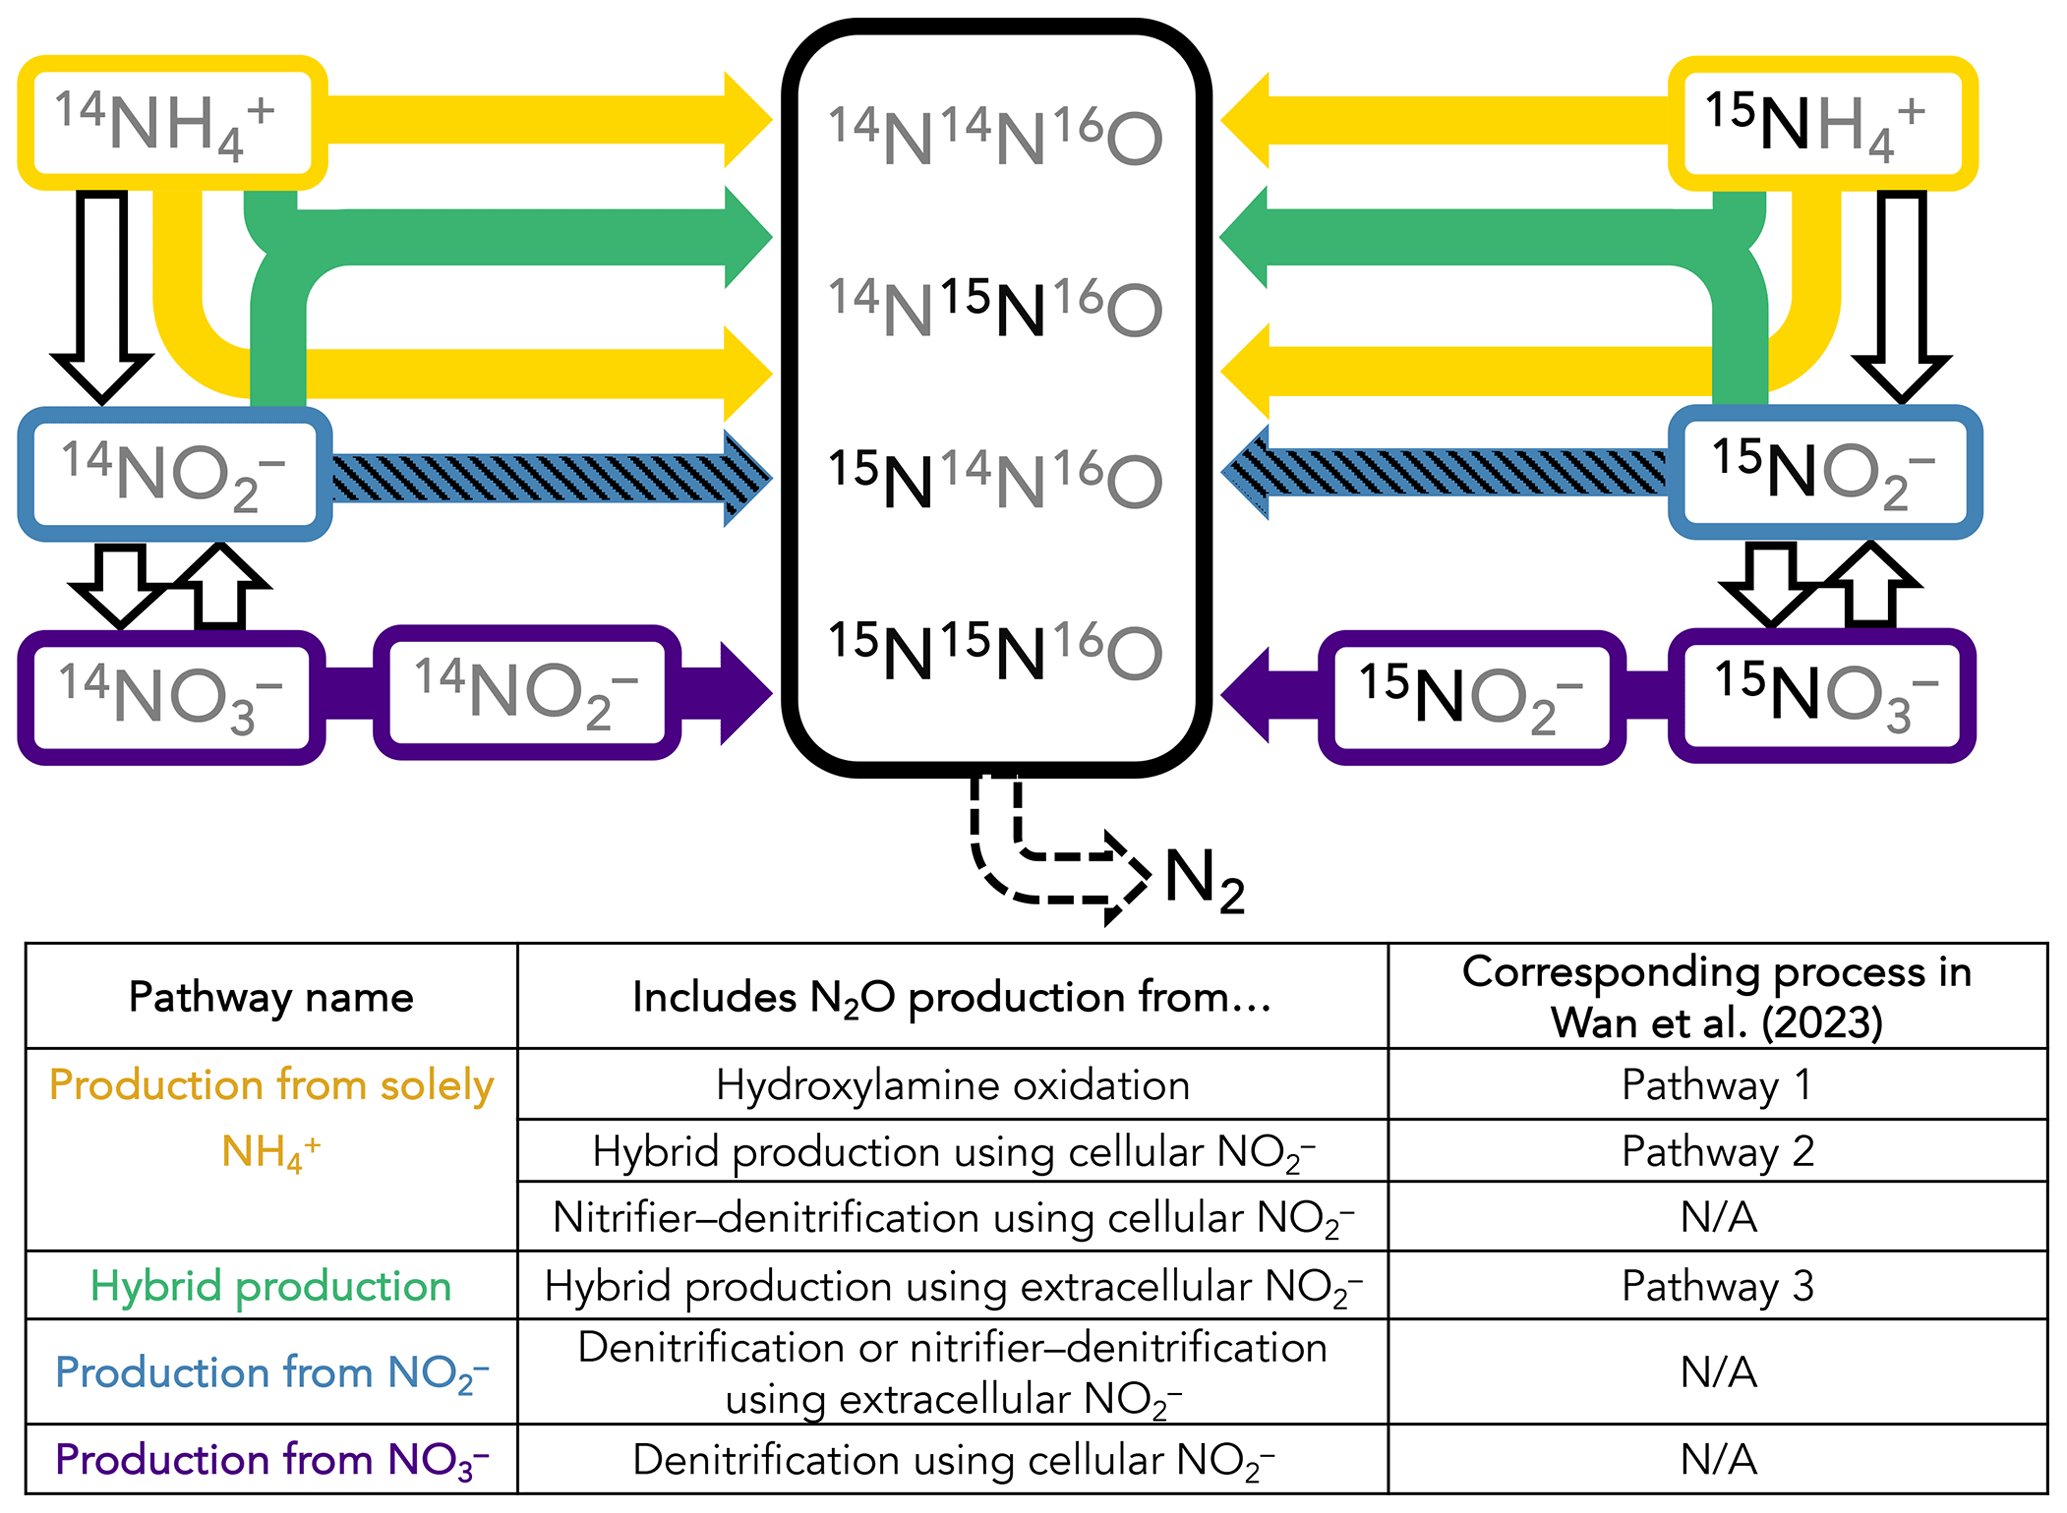
Figure 2Schematic of the forward-running model used to solve for rates of N2O production. Horizontal arrows represent processes whose rates are solved for, while vertical arrows represent processes whose rates are prescribed based on our experimental results. The model solves for second-order rate constants for four N2O-producing processes: (1) production solely from NH (yellow horizontal arrows), which includes N2O from hydroxylamine oxidation (Wan et al., 2023, Pathway 1), hybrid production using cellular NO (Wan et al., 2023, Pathway 2), and nitrifier denitrification using cellular NO; (2) hybrid production using NH and extracellular NO (green arrows; Wan et al., 2023, Pathway 3); (3) production from NO, i.e., denitrification or nitrifier denitrification using extracellular NO (hatched blue horizontal arrows); and (4) production from NO3, i.e., denitrification or nitrifier denitrification using cellular NO (indigo horizontal arrows). The model also solves for f, the proportion of Nα derived from NO during hybrid N2O production. NH3 oxidation (yellow vertical arrows), NO oxidation (hatched blue vertical arrows), and NO reduction to NO (indigo vertical arrows) are modeled as first-order rates to account for 15N transfer between substrate pools, as described in the main text. Finally, N2O consumption (dashed black arrow) is modeled as first order to N2O. It is assumed that, while the distribution of 15N in each tracer experiment at a given station and depth is different, the overall rates and mechanisms of N2O production are the same regardless of which substrate is labeled. The model is optimized against the observed 46N2O, 45N2Oα, 45N2Oβ, and 44N2O at each time point in each tracer experiment (black box).
The concentration of each nitrogen species was modeled as
where Nt is the concentration of a given N species (e.g., NH, NO, NO, or N2O) at time t, Nt+1 is its concentration at time t+1, Δt represents the model time step (days), is the sum of i individual source processes of that species (nM d−1), and is the sum of k individual sink processes of that species (nM d−1).
The pattern of N2O isotopocule production for a given process was set by the total rate J of N2O production for that process multiplied by the probability of forming each isotopocule from a given pair of substrates. The probabilities of forming each isotopocule were based on the atom fractions of the two substrates from which the nitrogen atoms in N2O are derived:
where P(46N2O), P(45N2Oα), P(45N2Oβ), and P(44N2O) are the probabilities of forming each isotopocule; 15F1 is the atom fraction of 15N in substrate 1; 15F2 is the atom fraction of 15N in substrate 2; f is the proportion of Nα derived from substrate 1; and 1 – f is the proportion of Nα derived from substrate 2. Assuming a 1:1 pairing of substrates 1 and 2, f also represents the proportion of Nβ derived from substrate 2 and 1 – f represents the proportion of Nβ derived from substrate 1. Processes that derive both nitrogen atoms from the same substrate pool are a special case of Eqs. (9)–(12), where 15F1=15F2. Measuring bulk 45N2O production instead of individual isotopomers (Trimmer et al., 2016) is also a special case of Eqs. (9)–(12), where P(45N2O) = P(45N2Oα)+ P(45N2Oβ) and f cancel out.
To represent each N2O-producing J term in the model, the rates of N2O production were modeled as second order:
where Ji is the rate of N2O production process i in nM N d−1, kiis a second-order rate constant for that process, [substrate1] is the concentration of substrate 1 for process i, and [substrate2] is the concentration of substrate 2 for process i. Each rate constant ki was optimized in the model for each station and depth. Again, N2O production processes that draw both nitrogen atoms from the same substrate are a special case, where [substrate1] = [substrate2]. J was multiplied by to convert the rate from nM N d−1 to nM N2O d−1, which was then multiplied by Eqs. (9)–(12) to obtain the rates of production of each isotopocule (note that rates are reported in pM d−1). For example, the rate of hybrid 46N2O production was represented as
where is the rate of 46N2O production via hybrid production in nM N2O d−1.
To relate the J terms to consumption of the substrate pools (NH, NO, and NO), J draws upon the 15N and 14N substrate pools according to the atom fractions of 15N in each substrate:
where and are the rates of consumption of the 15N and 14N substrate pools by N2O-producing process i, Ji is the rate in nM N d−1 calculated in Eq. (13) for N2O production process i, and 15Fsubstrate is the atom fraction of 15N in the given substrate pool (NH, NO, and NO). Essentially, Eq. (15) relates how each rate Ji draws from the 15N and 14N substrate pools, while Eqs. (9)–(12) determine the 15N and 14N distribution in the product N2O. For example, the rate of 15NH consumption by hybrid N2O production was represented as
where is the rate of 15N–NH consumption via hybrid production in nM N d−1. Equation (16) does not contain the factor of in Eq. (14) because the units are nM N d−1, not nM N2O d−1. Rates of 15N and 14N transfer between substrate pools via NH3 oxidation, NO oxidation, and NO reduction were also included in the model. The model solves for N2O production rates, given a set of NH3 oxidation, NO oxidation, and NO reduction rates calculated in Sect. 2.5, Eq. (7) (Table S2). These rates were represented in the model as first order:
where J15 and J14 represent the rates of 15N and 14N transformation via NH3 oxidation, NO oxidation, or NO reduction; k is a first-order rate constant derived from measured rates; α is a fractionation factor (Table S3); [15N] is the concentration of the 15N species; and [14N] is the concentration of the 14N species. N2O consumption was modeled as first order to the concentration of each isotopocule, based on the [O2]-corrected rates of N2O consumption measured on the same cruise (Sun et al., 2021a).
The model was optimized against isotopocule data at each time step in each tracer experiment (Fig. S4). The parameters being optimized (inputs to the cost function) were the second-order rate constants ki for N2O production solely from NH, N2O production from NO via denitrification or nitrifier denitrification, N2O production from NO via denitrification, hybrid N2O production using extracellular NO, and f (Fig. 2). In the model, these are all separate processes that operate independently. The model was optimized using the Nelder–Mead simplex algorithm (Nelder and Mead, 1965), implemented in the SciPy optimization library (Virtanen et al., 2020), which has been used successfully for natural abundance N2O isotopocule models (Monreal et al., 2022). Model error was estimated by optimizing the model at each station and depth with 100 combinations of model parameters, randomly varying the initial concentrations of each 15N and 14N substrate and rate constants for NH3 oxidation, NO oxidation, and NO oxidation by up to 25 %.
To ground-truth the model, rates of N2O production obtained from the model were compared to the measured net rates of 46N2O production (Fig. S5). For processes drawing both nitrogen atoms from the same substrate pool (i.e., not hybrid production), the modeled rates of N2O production from each substrate should correspond roughly to the net rate of 46N2O production from the same 15N-labeled substrate. Higher modeled rates of N2O production solely from NH generally corresponded to higher net rates of 46N2O production from 15N–NH (Fig. S5a). Since the model cannot produce negative rates, negative net rates of 46N2O production from 15N–NH corresponded to modeled N2O production rates equal to zero (Fig. S5a). Modeled rates of N2O production from NO and NO via denitrification also corresponded to higher measured rates of 46N2O production from 15N–NO and 15N–NO, respectively (Fig. S5b, c).
3.1 Depth distributions of oxygen, nitrite, and nitrous oxide
Station PS1, which was at the edge of the ODZ, represented a “background” station with no secondary NO maximum and a less-pronounced minimum in [N2O] below the oxycline (Fig. S6; Kelly et al., 2021). At station PS1, the oxic–anoxic interface, defined in this study as the depth just above the ODZ, occurred at the base of the mixed layer at 100 m depth (Fig. S6). Station PS2 was near the geographic center of the oxygen-deficient region and had a secondary NO maximum of 2.2 µM, indicating functional anoxia (Fig. S6). The oxic–anoxic interface at station PS2 occurred at 92 m depth (Fig. S6). Below the oxic–anoxic interface, [N2O] declined to 4.5 ± 0.3 nM before increasing again at the base of the secondary NO maximum and reaching a local maximum around 800 m depth. Station PS3 was approximately 19 km from the coast of Mexico and had a shallow oxic–anoxic interface that moved up and down on timescales of days: on 10 April, the oxic–anoxic interface occurred at 40 m depth; 2 d later, the oxic–anoxic interface had deepened to 62 m depth. Experiments were performed at the oxic–anoxic interface on both days and are designated with the abbreviations “Interface” and “Interface2” in the experimental metadata (Table S1). The chemical profiles from 11 April (Fig. S6), on which the near-surface [N2O] maximum occurred at 61 m (Kelly et al., 2021), are displayed along with the rate data in this study. Station PS3 had a pronounced secondary NO maximum of 2.8 µM at 161 m depth (Fig. S6) and an NH maximum of 400 nM at 15 m depth (not shown). On 11 April, [N2O] reached a maximum of 195 ± 13 nM at the oxic–anoxic interface and declined below this depth. Below 600 m depth, [N2O] began to increase again to 44 ± 3 nM. At every station, a deep secondary chlorophyll a maximum was observed near the oxic–anoxic interface, where photosynthetically active radiation was much reduced and [NO] was abundant (Travis et al., 2023). This secondary chlorophyll a maximum tended to develop between the depths of the oxic–anoxic interface and the secondary NO maximum (Travis et al., 2023).
3.2 Nitrification and nitrate reduction rates
NO reduction to NO occurred at rates ranging from 0.54 ± 0.04 to 33.2 ± 0.1 nM N d−1 (Table S2). There was a small, significant rate of NO reduction to NO in apparently aerobic waters near the surface at station PS1 (Fig. 3a). The highest rates of NO reduction to NO occurred in the deep, anoxic waters at station PS2 (33.24 ± 0.01 nM N d−1; Fig. 3d) and in the secondary chlorophyll maximum at station PS3 (19.2 ± 0.1 nM N d−1; Fig. 3g).
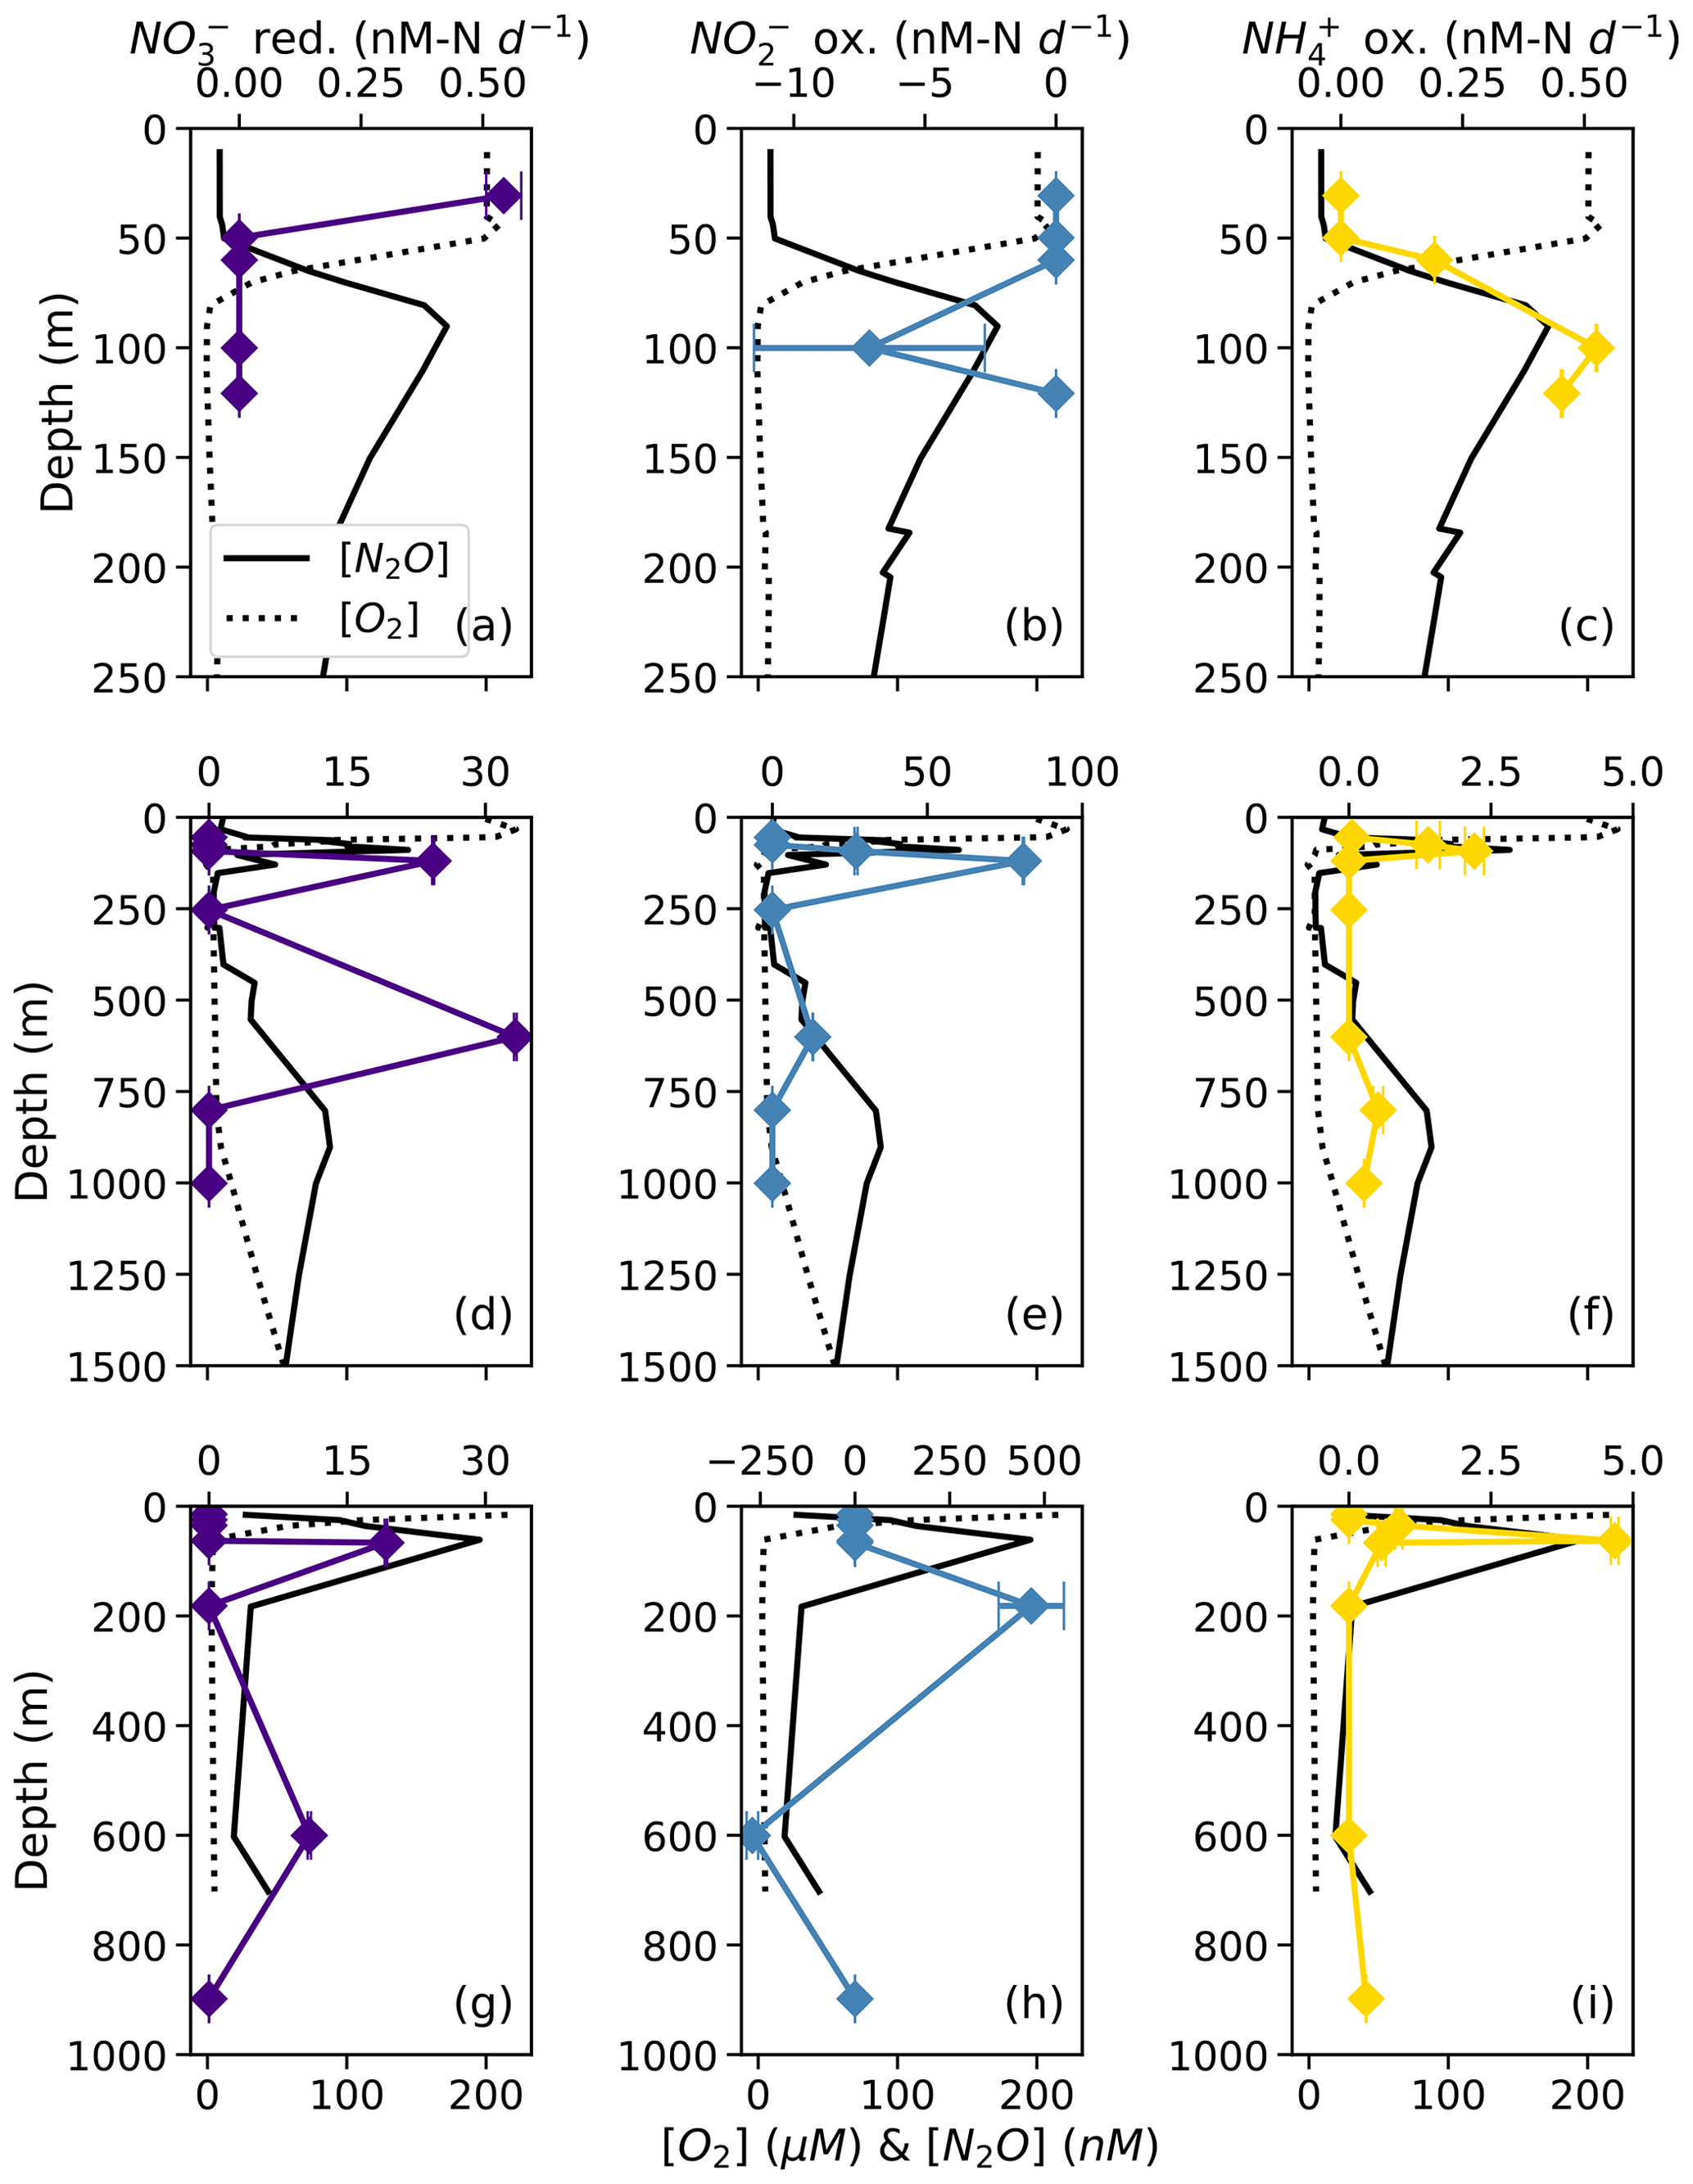
Figure 3Rates of NO reduction to NO (a, d, g; indigo), NO oxidation to NO (b, e, h; blue), and NH3 oxidation to NO NO (c, f, i; yellow) at stations PS1 (a–c), PS2 (d–f), and PS3 (g–i). Rates are plotted over depth profiles of dissolved [O2] (dashed lines) and [N2O] (solid lines; from Kelly et al., 2021). Error bars represent rate error, calculated from the error of the slope of product 15N vs. time. Note the different x-axis scales for rate measurements (top x axes) and [O2] and [N2O] (bottom x axes).
NO oxidation rates ranged from 13.05 ± 0.08 to 465 ± 86 nM N d−1 (Table S2). The highest rates of NO oxidation occurred within apparently oxygen-deficient waters at 81.0 ± 0.2 nM N d−1 in the secondary chlorophyll a maximum at station PS2 and at 465 ± 86 nM N d−1 in the secondary NO maximum at station PS3 (Fig. 3e, h; Table S2). Note that these are potential rates, since the 15N addition was generally much greater than the ambient concentration (Lipschultz, 2008). In some cases, NO oxidation rates appeared negative due to a decrease in 15N–NO vs. incubation time (Fig. 3b, h), which was likely an artifact of the elevated t0 δ(15N) values in some of our 15N–NO treatments (discussed above). We chose, however, not to left-censor the data.
NH3 oxidation to NO occurred at small but significant rates ranging from 0.19 ± 0.0004 to 4.68 ± 0.07 nM N d−1 (Table S2). At every station, rates of NH3 oxidation peaked near the base of the mixed layer at the same depth as the near-surface [N2O] maximum (Fig. 3c, f, i). At station PS2, NH3 oxidation showed a secondary peak at the same depth as the deep [N2O] maximum (Fig. 3f). At station PS3, there was also a small, significant rate of NH3 oxidation (0.303 ± 0.005 nM N d−1) at 898 m, which was close to the bottom depth (Fig. 3i). Rates of NH3 oxidation were generally lower than NO oxidation and undetectable in oxygen-deficient waters (Fig. 3c, f, i).
3.3 Net production rates of 45N2Oα, 45N2Oβ, and 46N2O (measured net rates)
At each station, the observed rates of net 46N2O (Fig. 4), 45N2Oα, and 45N2Oβ (Fig. 5) production from 15N–NH, 15N–NO, and 15N–NO all peaked at or just below the oxic–anoxic interface, where the near-surface [N2O] maximum was found. There were also relatively higher rates of net 46N2O production from 15N–NO and 15N–NO within the secondary NO maximum (253 m) at station PS2 (Fig. 4d–e). Relatively high rates of net 45N2Oα and 45N2Oβ production also occurred in the secondary NO maximum at stations PS2 (253 m; Fig. 5d–e) and PS3 (182 m; Fig. 5g–h). The net rates of 45N2Oα and 45N2Oβ production varied in concert at almost every station and depth, with a few exceptions (Fig. 5).
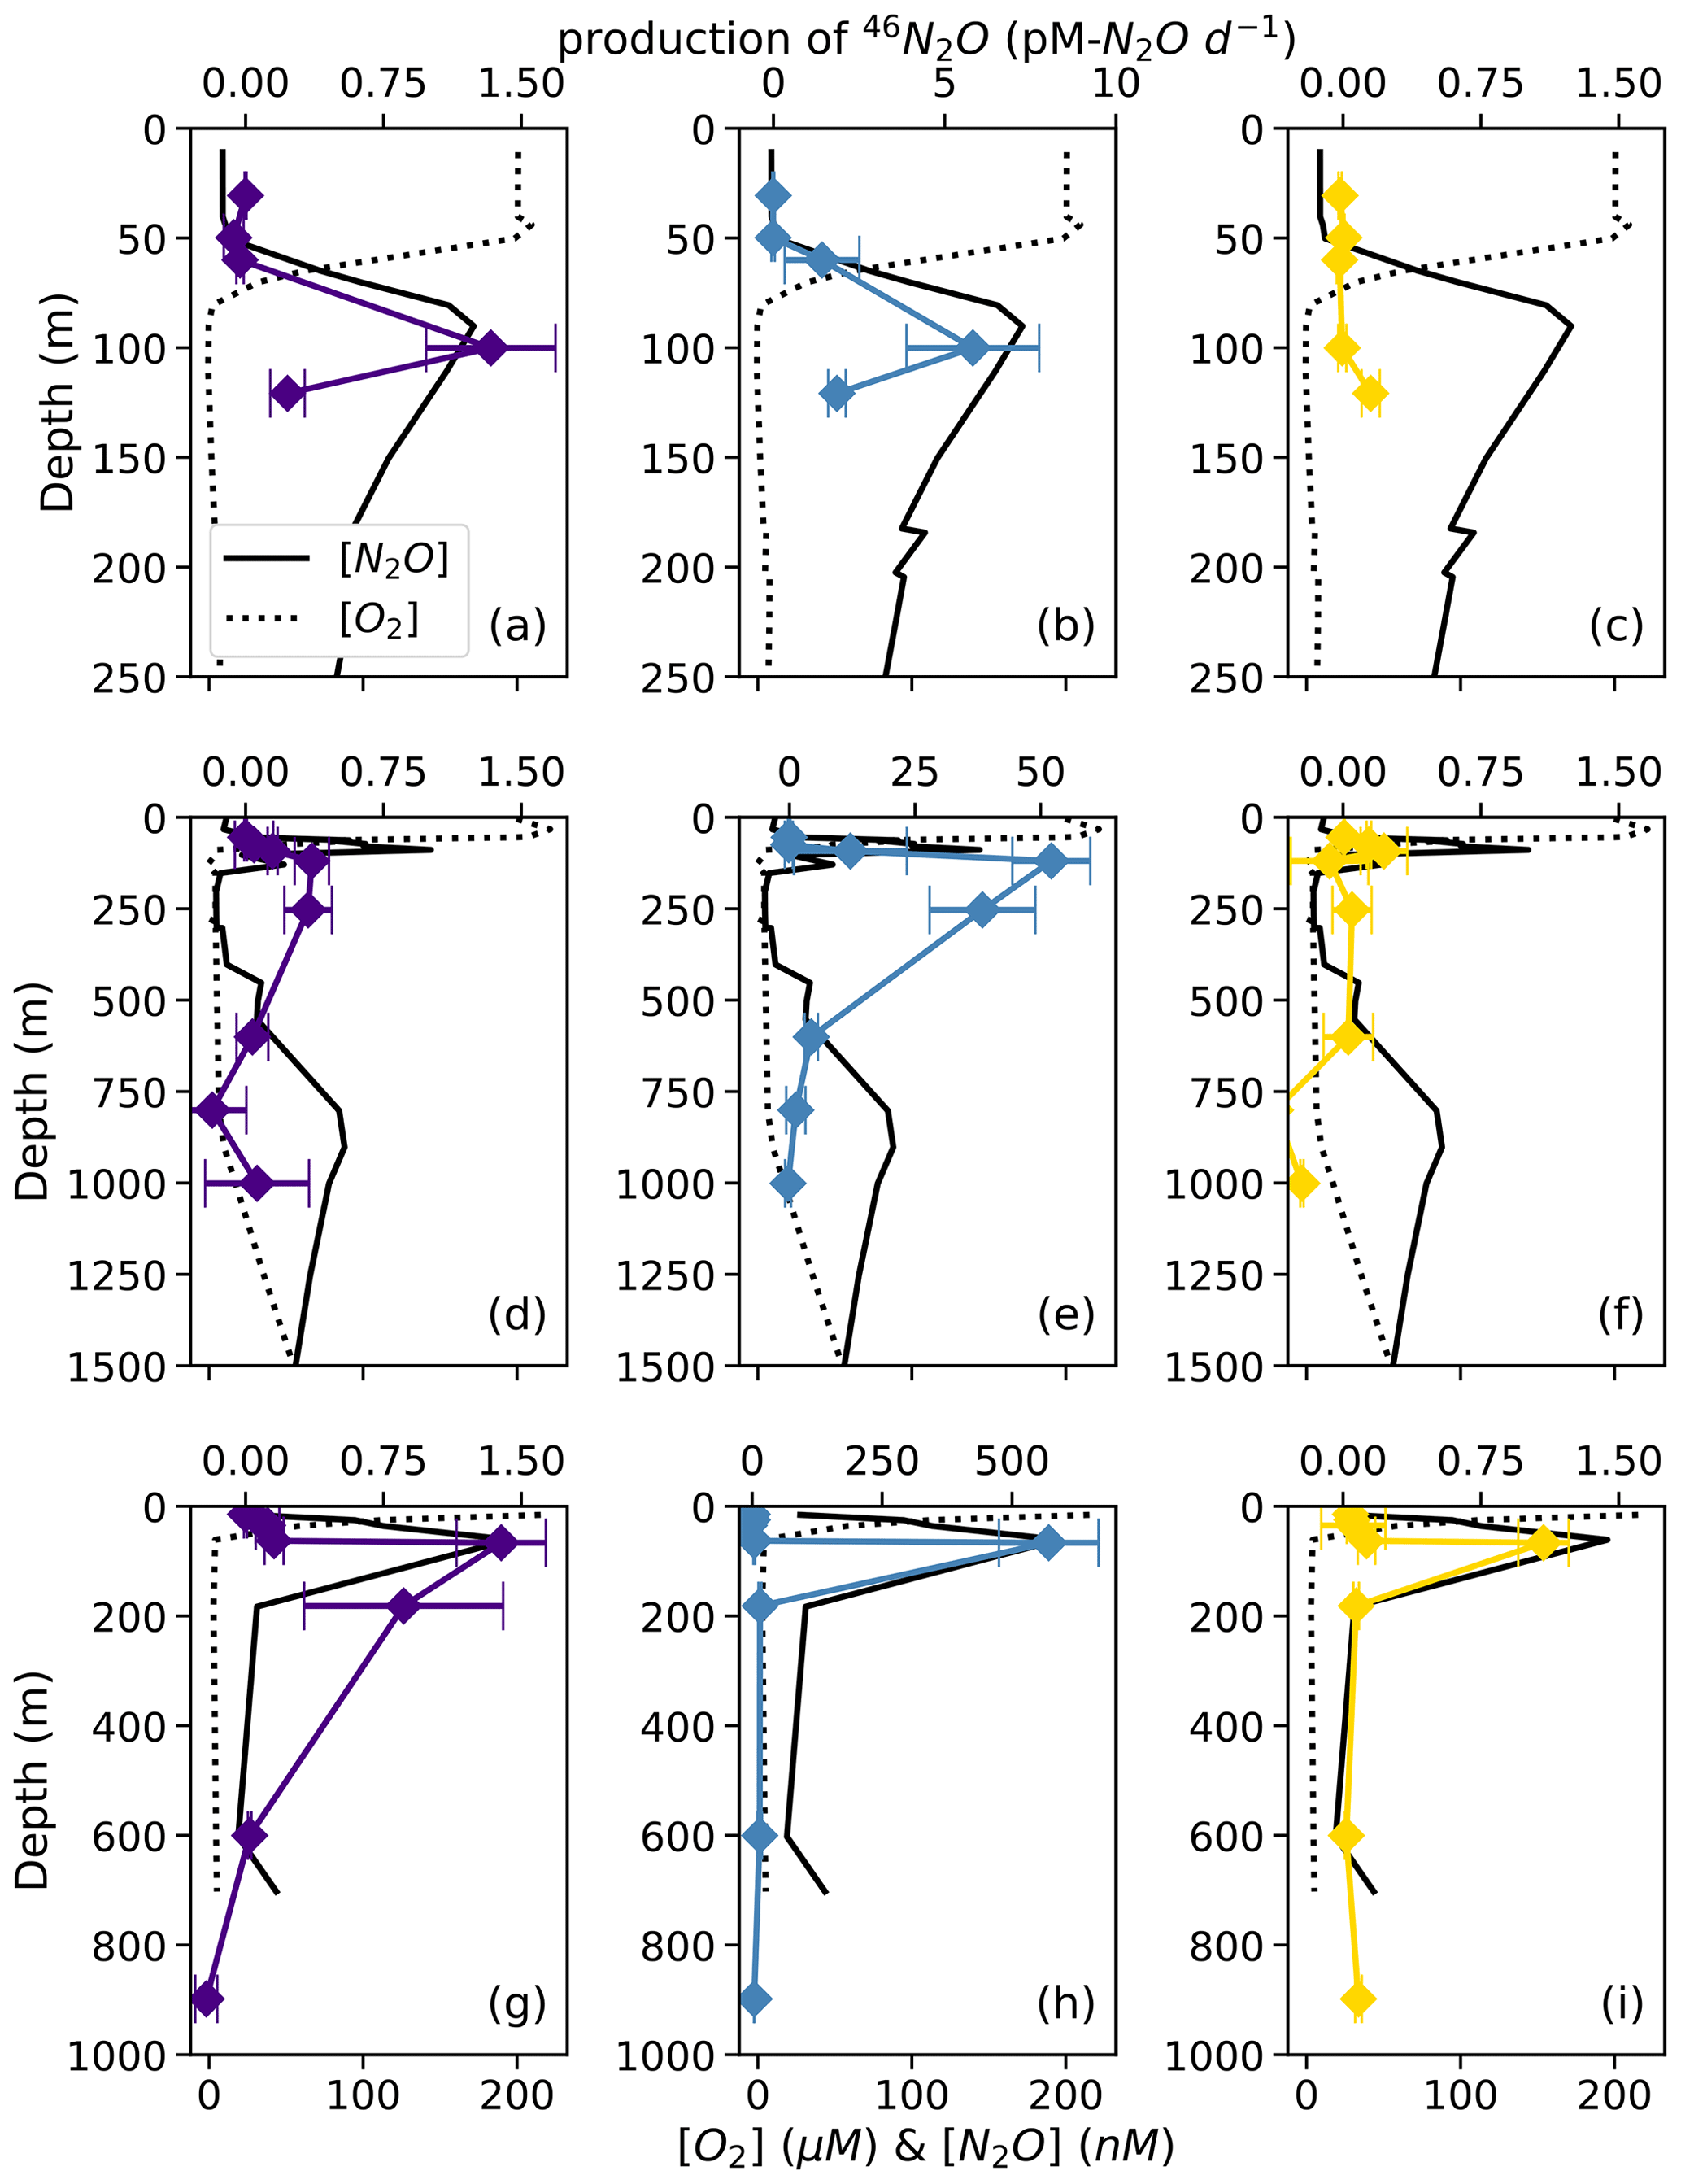
Figure 4Net 46N2O production from 15N–NO (a, d, g; indigo), 15N–NO (b, e, h; blue), and 15N–NH (c, f, i; yellow) at stations PS1 (a–c), PS2 (d–f), and PS3 (g–i). N2O production rates are plotted over depth profiles of dissolved [O2] (dashed lines) and [N2O] (solid lines; from Kelly et al., 2021). Error bars are calculated from the linear regression slope error of 46N2O vs. incubation time. Note the different x-axis scales for 46N2O production (top x axes) and [O2] and [N2O] (bottom x axes) .
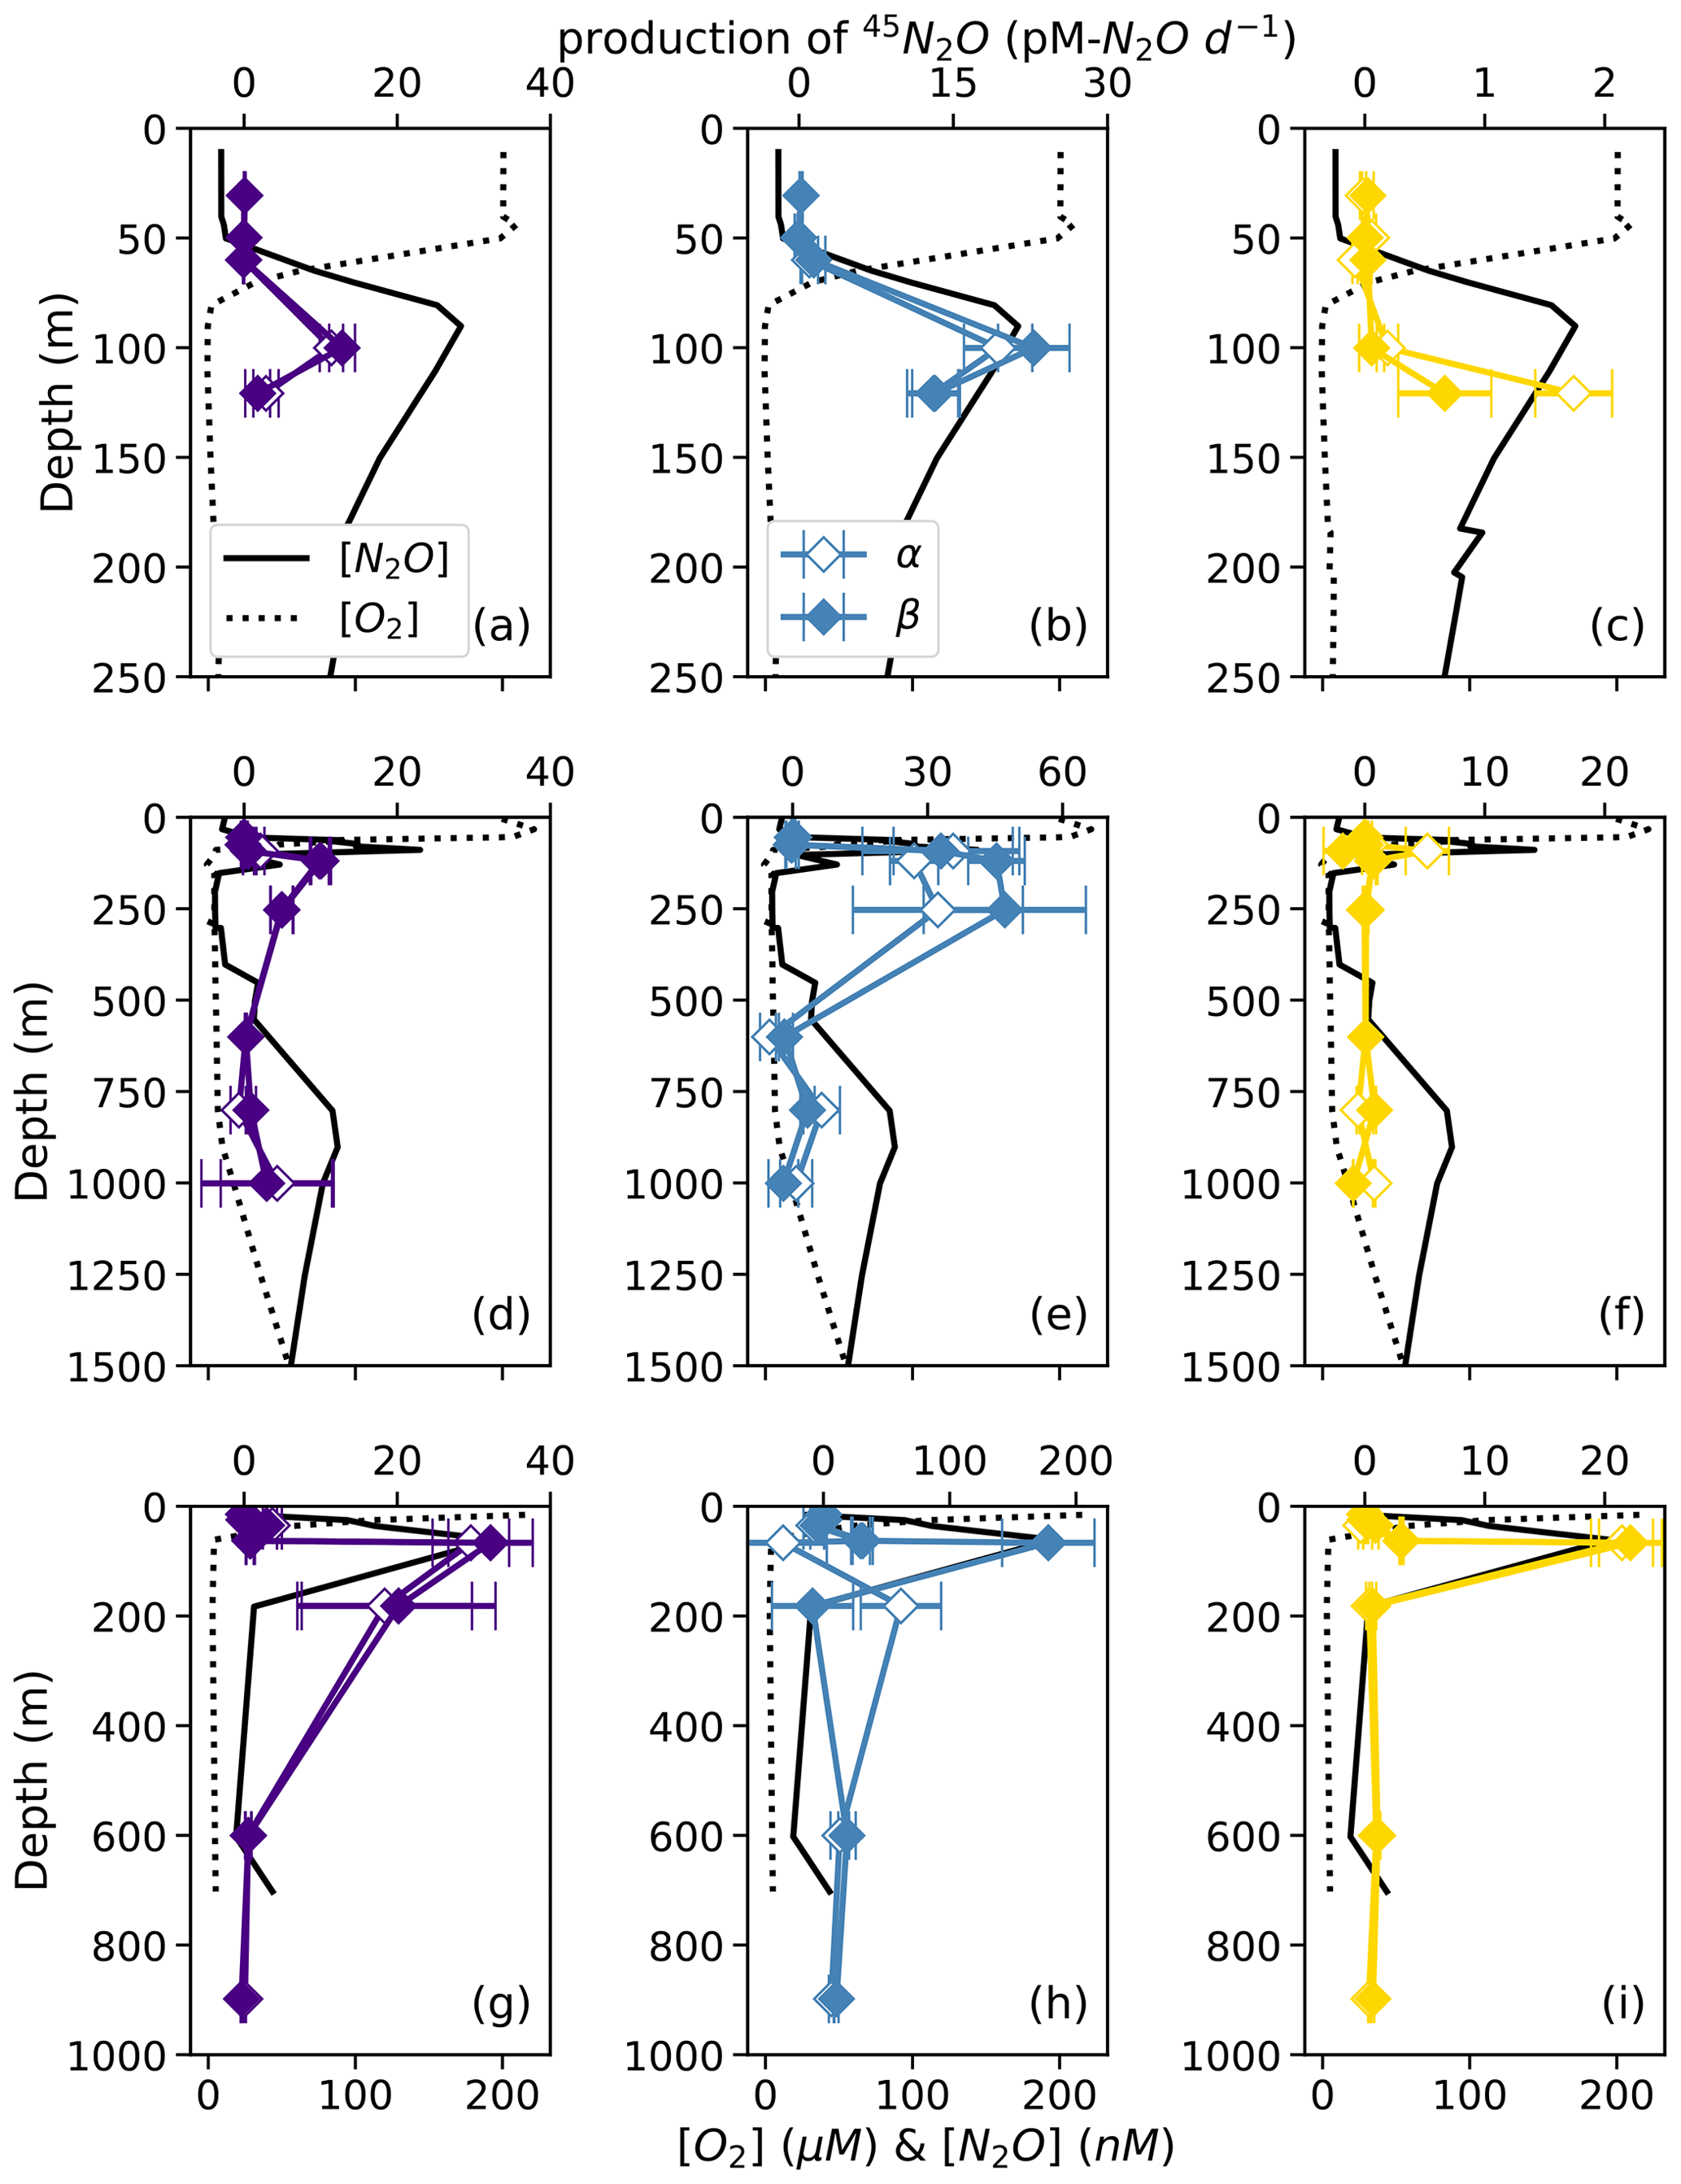
Figure 5Net 45N2Oα (open symbols) and 45N2Oβ (closed symbols) production from 15N–NO (a, d, g; indigo), 15N–NO (b, e, h; blue), and 15N–NH (c, f, i; yellow) at stations PS1 (a–c), PS2 (d–f), and PS3 (g–i). N2O production rates are plotted over depth profiles of dissolved [O2] (dashed lines) and [N2O] (solid lines; from Kelly et al., 2021). Error bars are calculated from the linear regression slope error of 45N2O vs. incubation time. Note the different x-axis scales for 45N2O production (top x axes) and [O2] and [N2O] (bottom x axes) .
For example, in the secondary NO maximum (182 m) at station PS3, in the 15N–NO experiment, the production of 45N2Oα was 60 ± 30 pM N2O d−1 (p=0.09) and there was no significant production of 45N2Oβ (Fig. 5h). In the parallel 15N–NH experiment, the production of 45N2Oβ was 0.7 ± 0.3 pM N2O d−1 (p=0.06) and there was no significant production of 45N2Oα. At this station and depth, f (the proportion of Nα derived from NO) was equal to 0.9 ± 0.2 (Table S4). The second experiment in which labeling was unequal occurred at the oxic–anoxic interface (92 m) at station PS2, where, in the 15N–NH experiment, the production of 45N2Oα was 5 ± 2 pM N2O d−1 (p=0.02) and there was no significant production of 45N2Oβ (Fig. 5f). Here, f was equal to 0.2 ± 0.1. Finally, at the mid-oxycline depth (25 m) at station PS3, in the 15N–NH experiment, the production of 45N2Oα was 0.23 ± 0.8 pM N2O d−1 (p=0.02) and there was no significant production of 45N2Oβ. Here, f was statistically indistinguishable from zero.
At many stations and depths, the net production of 45N2Oα and 45N2Oβ exceeded the values expected from 46N2O production for a process that draws both nitrogen atoms from the same substrate pool (Fig. S7). This expected value is calculated from the atom fraction of 15N in the substrate and from a binomial distribution of the isotopocules of N2O during N2O production (Trimmer et al., 2016):
where is the expected production of 45N2Oα and 45N2Oβ from a process that draws both nitrogen atoms from the same substrate pool, p46 is the net production rate of 46N2O, and 15F is the atom fraction of 15N in the substrate pool (for example, NO in a 15N–NO experiment). Then, excess production of 45N2O is any 45N2O production above and beyond this expected rate:
where is the excess production of 45N2O above and beyond that expected for a process drawing both nitrogen atoms from the same pool and p45 is the measured net production of 45N2O. The equations for 45N2Oα and 45N2Oβ are the same as Eq. (19), except for a factor of 2. In many of the 15N–NH experiments, there was significant excess 45N2Oα and 45N2Oβ production (Fig. S7a). Similarly, there was significant excess 45N2Oα and 45N2Oβ production in many of the 15N–NO experiments, although this was harder to discern due to the wider range of atom fractions in these experiments (Fig. S7b). In a few experiments, excess 45N2Oα and 45N2Oβ production diverged.
3.4 N2O production mechanisms and yields (model results)
Based on model results, the rates of N2O production from NO (denitrification using cellular NO; Fig. 2) were the highest among the N2O production processes measured in this study. At suboxic to anoxic depths, the rates of N2O production from NO were orders of magnitude higher than all the other N2O production rates (Fig. 6). N2O production from NO reached its maximum value (1600 ± 400 pM N2O d−1; Table S4) at the depth of the near-surface [N2O] maximum at every station (Fig. 6a, e, i), where there were also high rates of NO reduction to NO at stations PS2 and PS3 (Fig. 6e, i). N2O production from NO (denitrification using extracellular NO; Fig. 2) exhibited lower rates, with a maximum of 510 ± 30 pM N2O d−1 (Table S4). At stations PS1 and PS3, N2O production from NO peaked at the depth of the near-surface [N2O] maximum (Fig. 6b, j); at station PS2, N2O production from NO was observed in the near-surface [N2O] maximum but peaked in the secondary NO maximum (253 m; Fig. 6f).
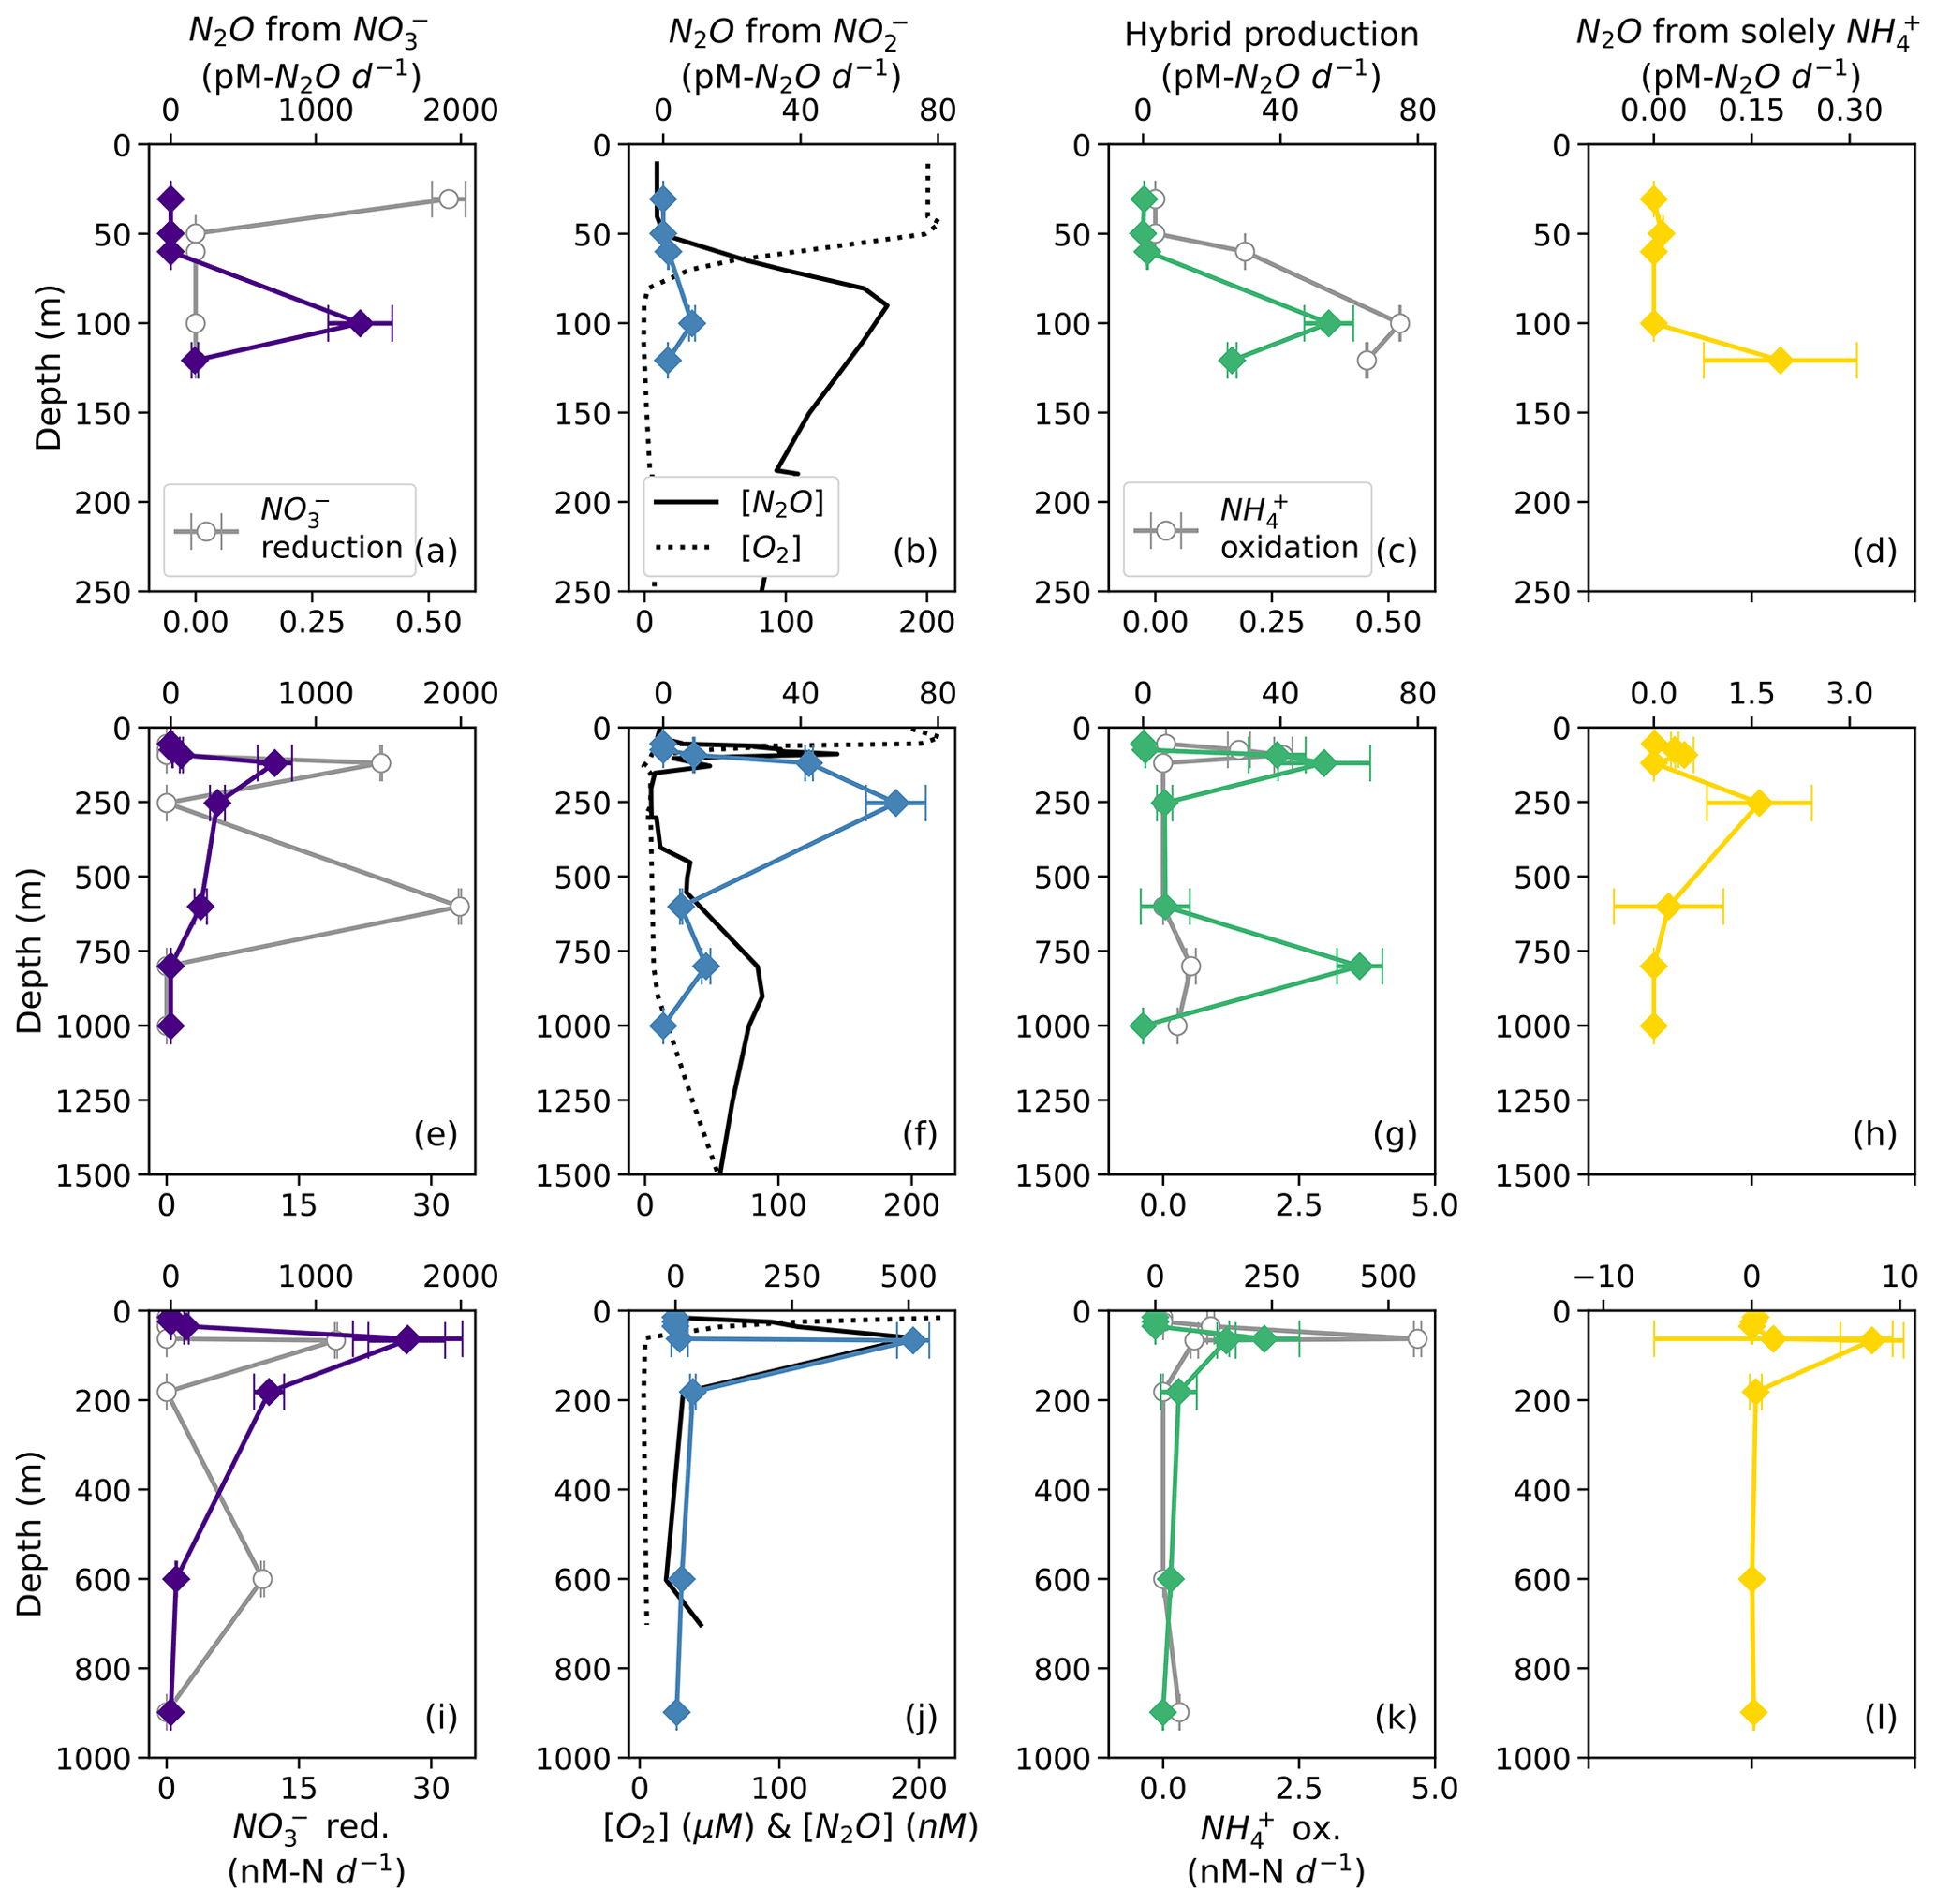
Figure 6N2O production from NO (a, e, i; indigo diamonds), N2O production from NO (b, f, j; blue diamonds), hybrid N2O production (c, g, k; green diamonds), and N2O production solely from NH (d, h, l; yellow diamonds) at stations PS1 (a–d), PS2 (e–h), and PS3 (i–l). Panels (a), (e), and (i) also show rates of NO reduction to NO (open circles). Panels (b), (f), and (j) show depth profiles of dissolved [O2] (dashed lines) and [N2O] (solid lines; from Kelly et al., 2021). Panels (c), (g), and (k) show rates of NH3 oxidation (gray circles). N2O production rate error bars are calculated from 100 model optimizations, varying key parameters by up to 25 %. Note the different x-axis scales for NO reduction to NO (a, e, i; bottom), N2O production (top), [O2] and [N2O] (b, f, j; bottom), and NH3 oxidation (c, g, k; bottom).
Hybrid N2O production occurred at a similar rate to N2O production from NO, ranging from 0.061 ± 0.005 to 230 ± 80 pM N2O d−1. Hybrid N2O production peaked within the near-surface [N2O] maximum at all stations (Fig. 6c, g, k). At station PS2, hybrid N2O production exhibited the highest rates at the same depths as NH3 oxidation, with a secondary peak in the deep [N2O] maximum (Fig. 6g). At station PS3, hybrid N2O production, like NH3 oxidation, exhibited a small, significant rate at 898 m, which was very close to the bottom depth at station PS3 (Table S4).
N2O production solely from NH occurred at the smallest rates overall, ranging from 0.010 ± 0.004 to 8 ± 2 pM N2O d−1 (Table S4). N2O production solely from NH peaked around the near-surface [N2O] maximum at each station (Fig. 6d, h, l) and in the secondary NO maximum at station PS2 (Fig. 6h).
The percentage of N2O production from NH comprised of hybrid N2O was calculated as
On average, hybrid N2O production was 86 ± 28 % of N2O production from NH. Hybrid N2O production was > 75 % of the total N2O production from NH at all stations and depths except for the top of the oxycline at station PS1 (Fig. 7a), the middle of the oxycline at station PS2 (Fig. 7b), and the top of the oxycline at station PS3 (Fig. 7c), where it comprised 0 %, 68 %, and 19 % of N2O production from NH, respectively. Hybrid production as a percentage of total N2O production from NH declined with increasing dissolved oxygen (Fig. S8), although more measurements are needed to fully evaluate this trend.
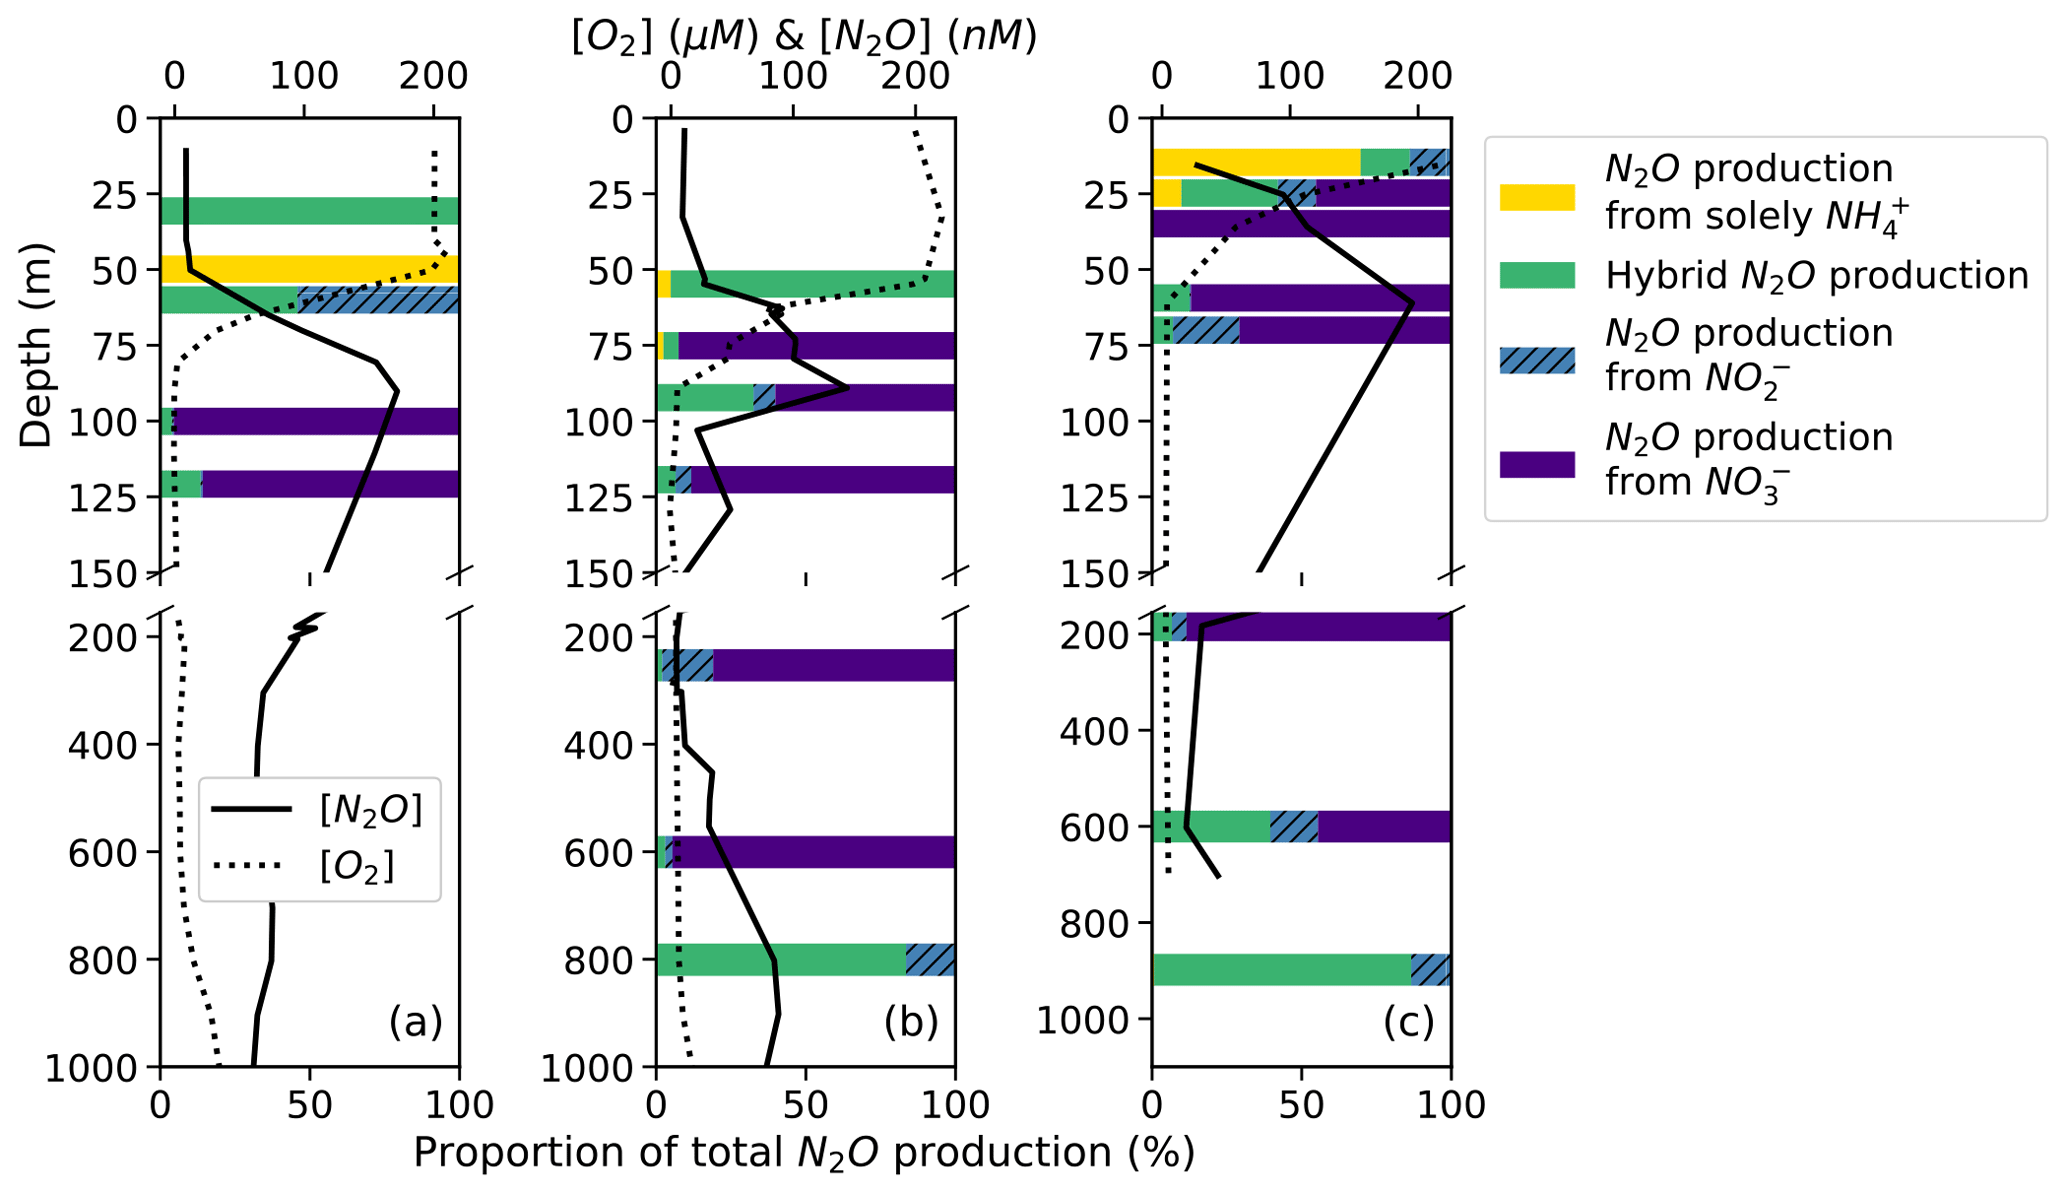
Figure 7N2O production solely from NH (yellow bars), hybrid N2O production (green bars), N2O production from NO (hatched blue bars), and N2O production from NO (indigo bars) as proportions of total N2O production at stations PS1 (a), PS2 (b), and PS3 (c). Data are plotted over depth profiles of dissolved [O2] (dashed lines) and [N2O] (solid lines; from Kelly et al., 2021). Note broken y axes and different x-axis scales for [O2] and [N2O] (top) and for proportions (bottom).
The percentage of hybrid N2O production as a proportion of total N2O production was more variable and tended to decline with decreasing dissolved oxygen as production from NO increased (Fig. 7). Hybrid N2O production was greater than 75 % of total N2O production only at the surface at station PS1 (Fig. 7a), at the top of the oxycline and in the deep [N2O] maximum at station PS2 (Fig. 7b), and in the deep [N2O] maximum at station PS3 (Fig. 7c).
N2O production from NO comprised a much greater proportion of total N2O production overall (Fig. 7). In the near-surface [N2O] maximum at station PS1, N2O production was predominantly (95.4 %) from NO, with smaller contributions from hybrid production (4.0 %) and denitrification from NO (0.6 %; Fig. 7a). In the near-surface [N2O] maximum at station PS2, N2O production was 60.2 % from NO, 32.1 % from hybrid production, 7.3 % from NO, and 0.4 % solely from NH (Fig. 7b). In the near-surface [N2O] maximum at station PS3, N2O production was 87.0 % from NO, 12.4 % from hybrid production, 0.5 % from NO, and 0.1 % solely from NH (Fig. 7c).
3.5 Oxygen dependence of N2O production
The oxygen dependencies of N2O production pathways were determined by fitting model-derived N2O production pathways vs. [O2] using the following rate law:
In this analysis, both ambient [O2] measured by the Sea-Bird sensor mounted on the rosette (“ambient [O2]”) and [O2] measured by chemiluminescent optodes mounted inside incubation bottles (“incubation [O2]”) were examined. The rate dependencies on ambient and incubation [O2] reflect both preconditioning (i.e., the ambient [O2] in which the microbial community was living before the incubation experiment) and the response to perturbation (i.e., the experimental conditions inside the incubation bottles, if different from the environment). Those incubations that had higher incubation [O2] than the ambient [O2] had received small oxygen perturbations.
N2O production via denitrification exhibited an exponentially declining relationship with dissolved O2, where N2O production from NO was more inhibited by dissolved O2 than N2O production from NO was (Fig. 8). When looking at the oxygen dependence of denitrification, we found several instances of N2O production from NO via denitrification with dissolved [O2] greater than 3 µM (Fig. 8a–b). For example, at the oxic–anoxic interface at station PS2, where ambient [O2] was 6.49 µM and incubation [O2] was 6.29 ± 0.07 µM (Table S1), N2O production from NO was 70 ± 10 pM N2O d−1 (Fig. 6e, Table S4). N2O production from NO at the same station and depth was 8.9 ± 0.2 pM N2O d−1 (Fig. 6f, Table S4). Similarly, at the oxic–anoxic interface of station PS3, where ambient [O2] was 12.48 µM and incubation [O2] was 6.64 ± 0.03 µM (Table S1), N2O production from NO was 120 ± 20 pM N2O d−1 (Fig. 6i, Table S4). There were also two anoxic depths at station PS2 that were not sparged with He before tracer addition (“base of ODZ” and “deep ODZ core”), where ambient [O2] was below detection but incubation [O2] was significantly elevated (17.7 ± 0.1 and 19.2 ± 0.8 µM, respectively; Table S1). At these depths, N2O production from NO was 12 ± 1 and 5.2 ± 0.4 pM N2O d−1, respectively (Fig. 6f, Table S4). N2O production from NO at the “deep ODZ core” depth was 210 ± 40 pM N2O d−1 (Table S4).
Hybrid N2O production rates also decreased exponentially with increasing dissolved [O2] (Fig. 9a–b). Fitting hybrid rates vs. ambient [O2] produced a rate (Eq. 21) with a=65.83 and b=0.17 (Fig. 9a); hybrid rates vs. incubation [O2] produced fits with a=76.26 and b=0.067 (Fig. 9b).
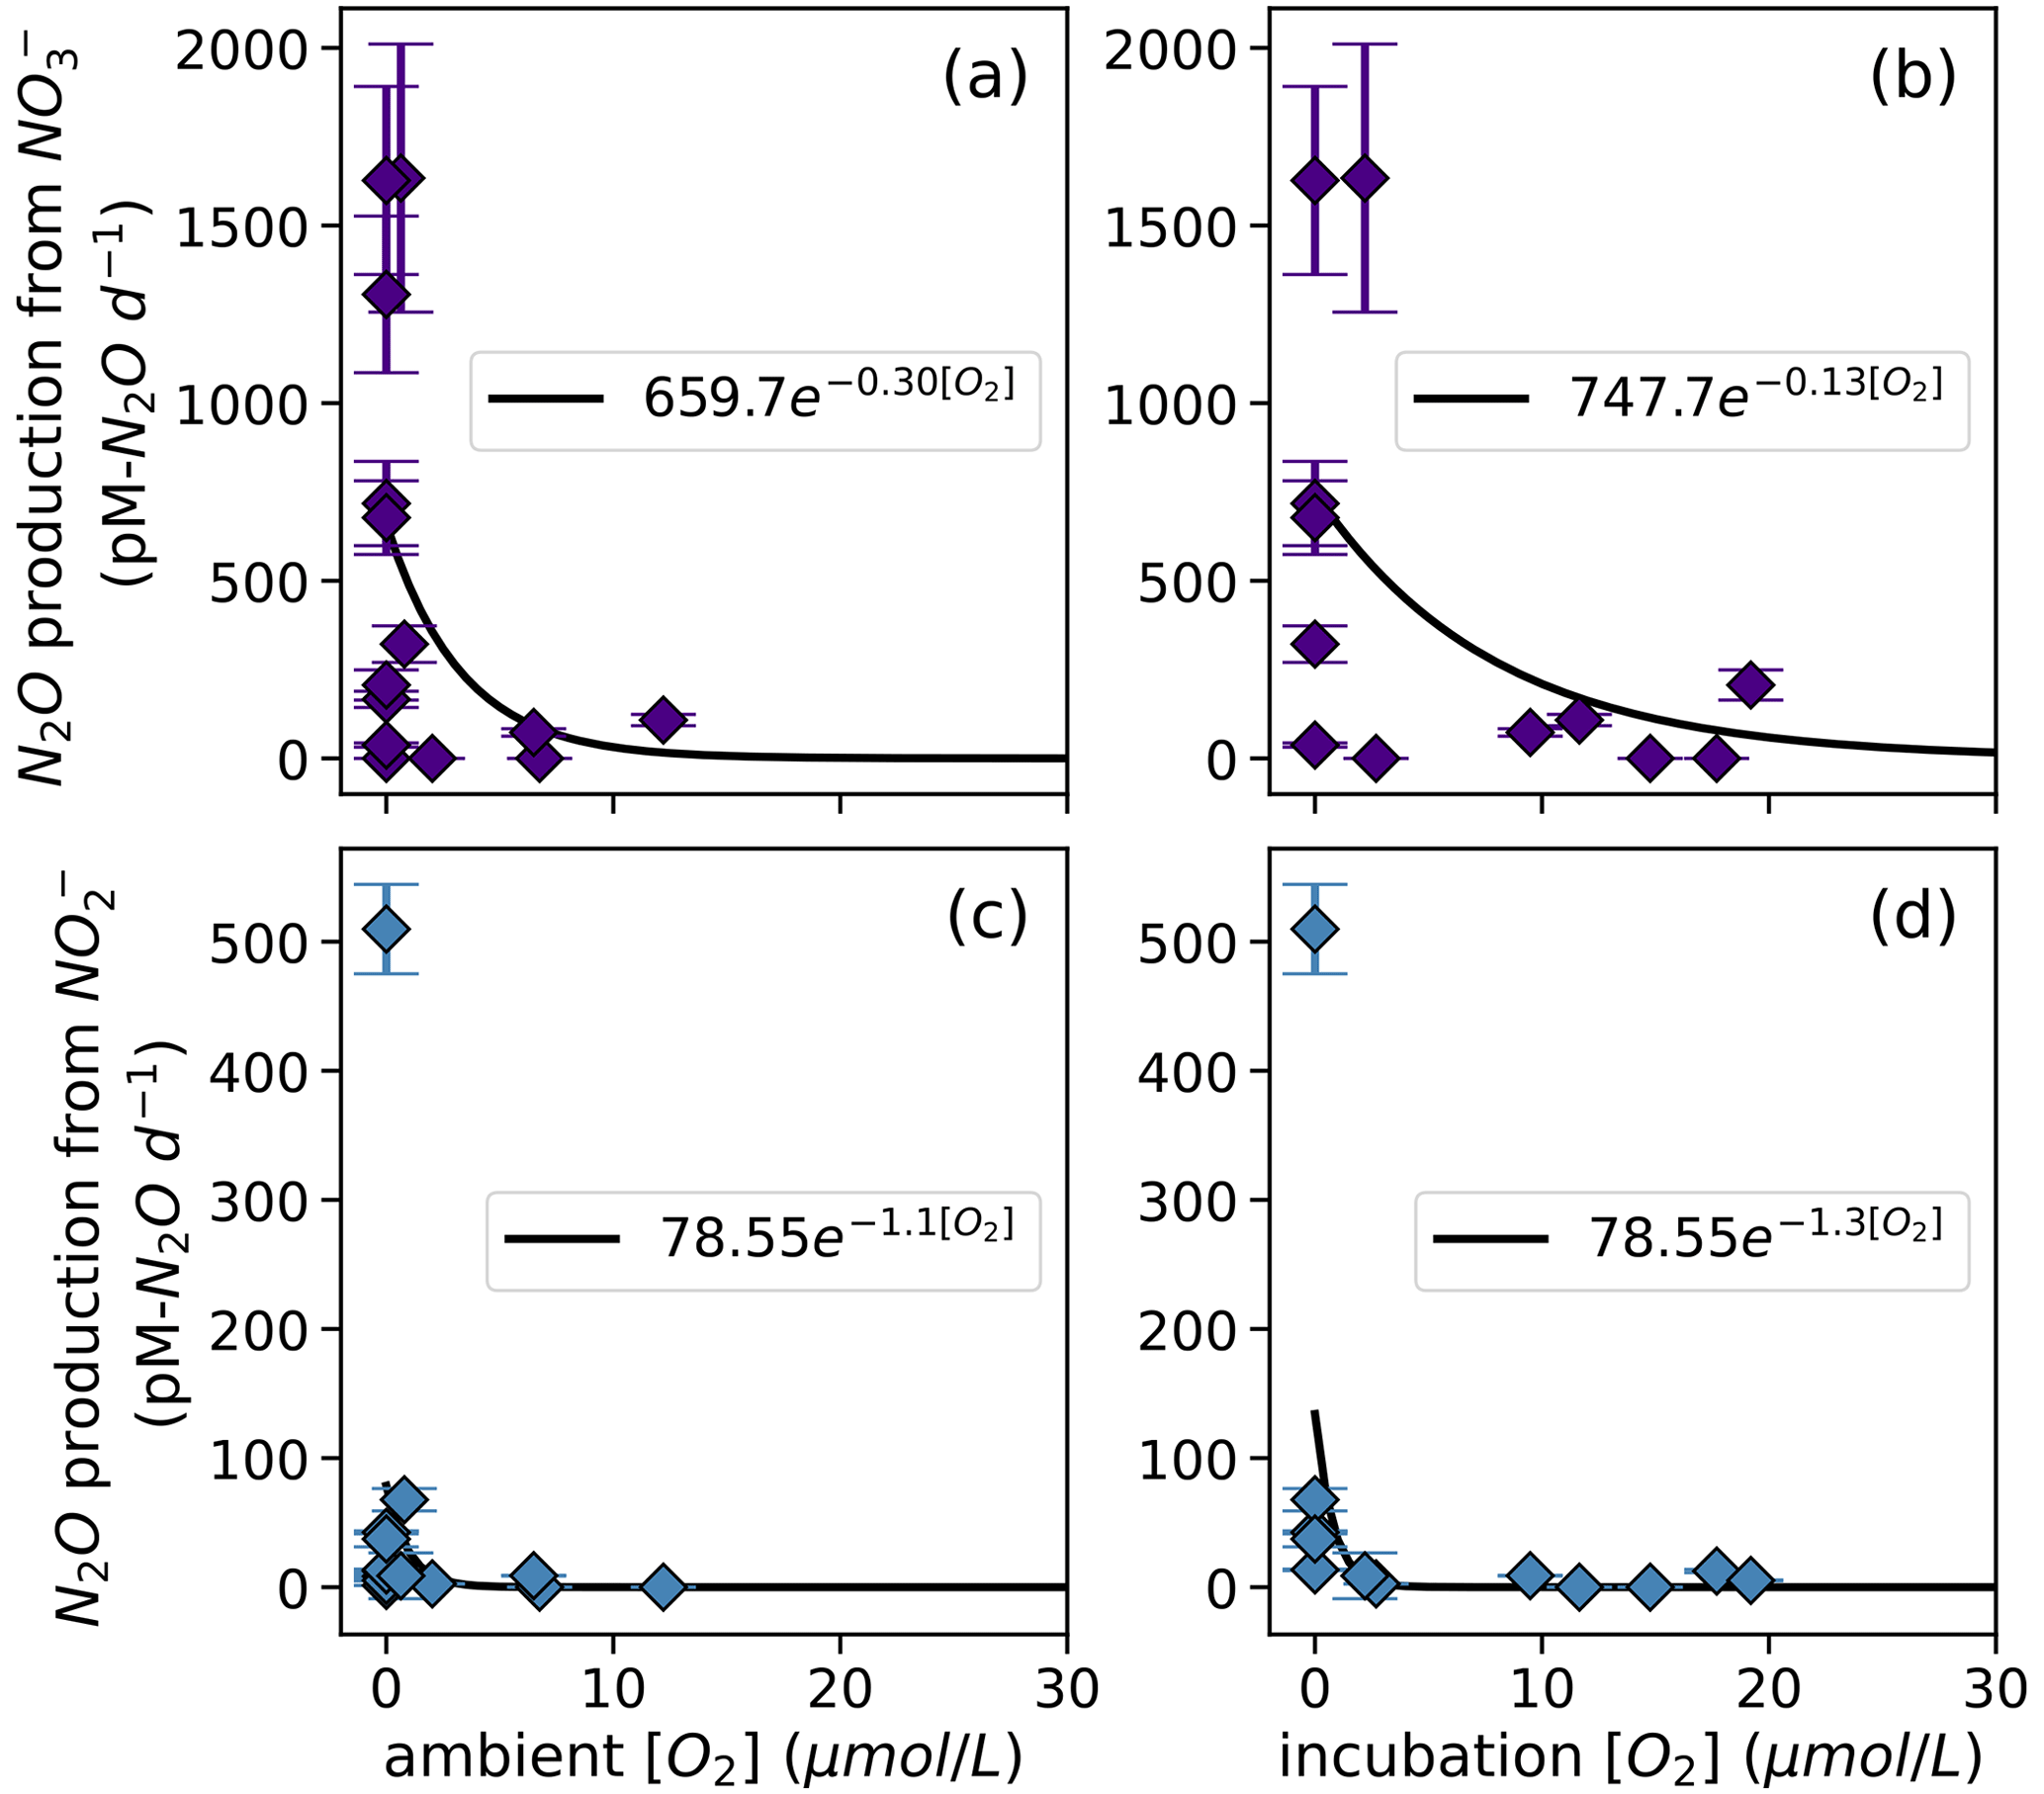
Figure 8N2O production from NO via denitrification (a, b) and from NO via denitrification (c, d), measured at a range of [O2] measured by a Seabird sensor (a, c) or by chemiluminescent optodes mounted inside incubation bottles (b, d). Curves of form, , are fit through the data (black lines); values of a and b are shown in white boxes in each plot.
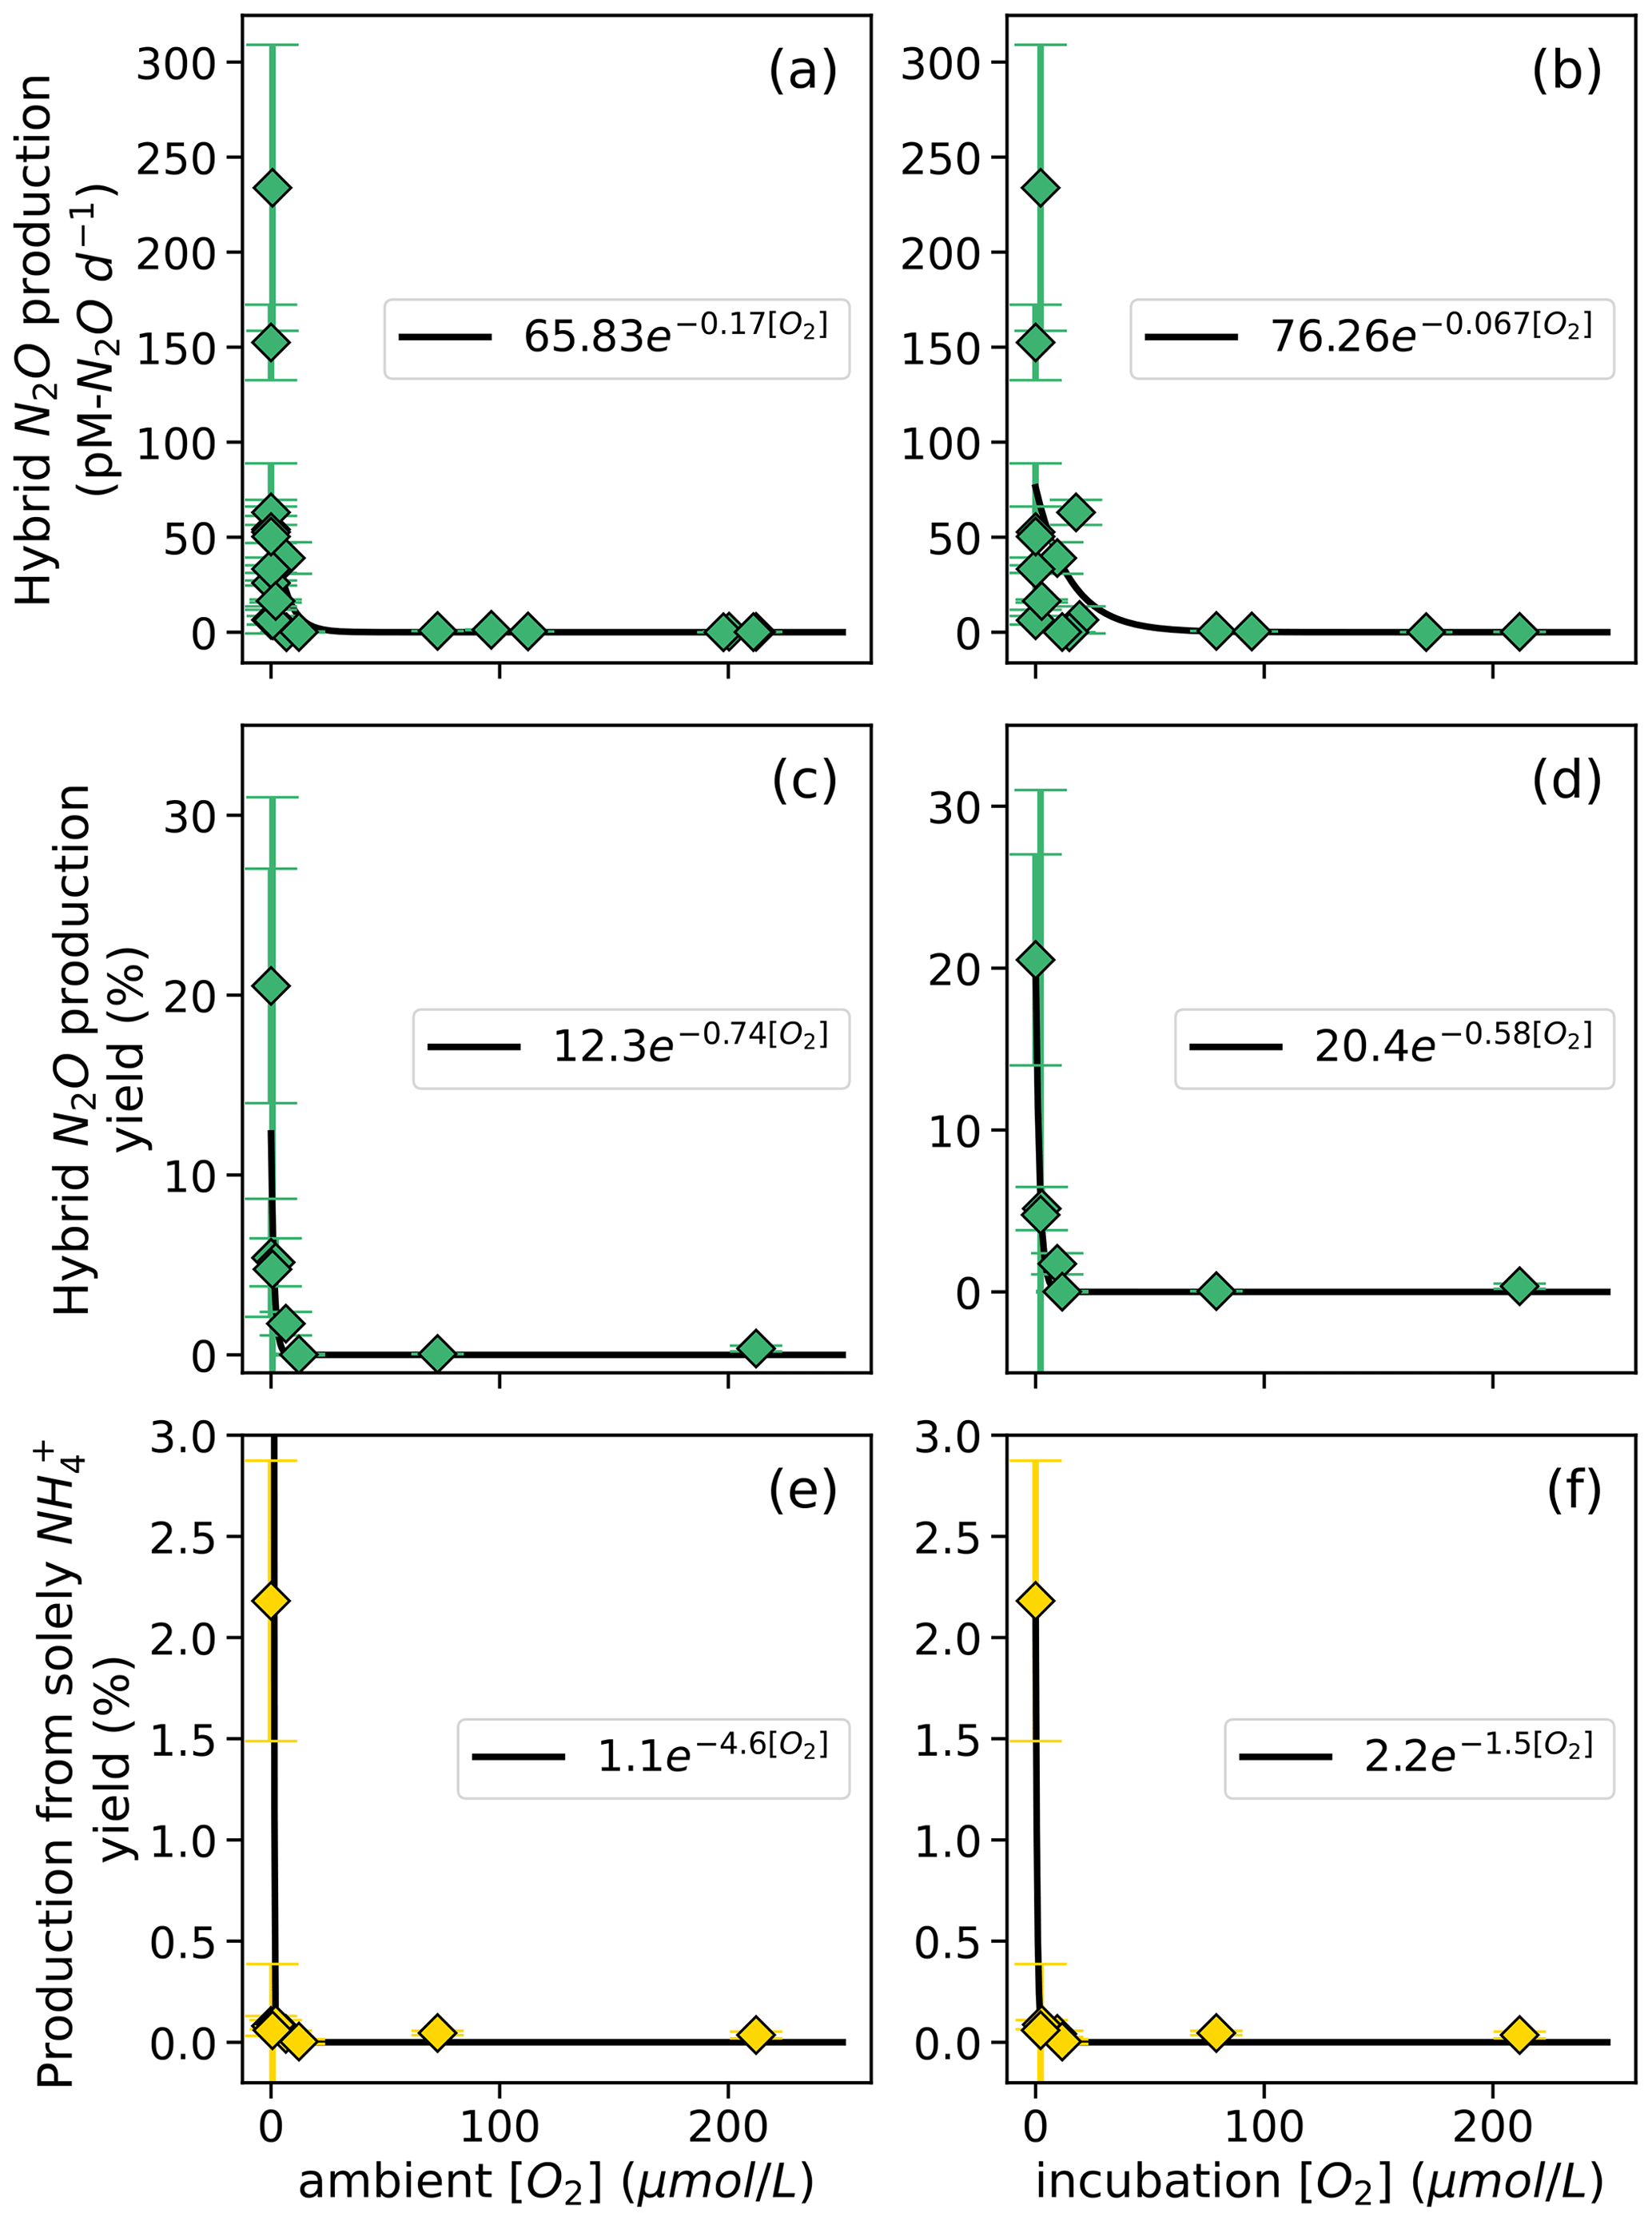
Figure 9Hybrid N2O production rates (a, b), N2O yield (%) during hybrid production (c, d), and N2O yield ( %) during production solely from NH (e, f) along a range of ambient [O2] measured by a Seabird sensor for the Niskin bottles from which samples were taken (a, c, e) and of [O2] measured by chemiluminescent optodes mounted inside incubation bottles (b, d, f). Error bars are calculated from 100 model optimizations, varying key parameters by up to 25 %. Yields are only calculated at stations and depths where rates of NH3 oxidation are greater than 0. Curves of form, , are fit through the data (black lines); values of a and b are shown in white boxes in each plot.
The rate of N2O production solely from NH also decreased exponentially with increasing dissolved [O2]. The highest rates of N2O production solely from NH occurred in the secondary chlorophyll maximum at station PS3 (Table S4), where dissolved oxygen was below detection. N2O yield during production solely from NH also exhibited exponentially decreasing relationships with dissolved [O2] (Fig. 9e–f). To ensure mass balance in terms of NH consumption (Fig. S9), N2O yield (%) during production solely from NH was calculated as
where N2O production solely from NH is in units of nM N2O d−1, hybrid N2O production is in units of nM N2O d−1, and NH3 oxidation to NO is in units of nM N d−1. This assumes that the formation of N2O solely from NH draws two nitrogen atoms from the NH pool, while hybrid N2O production and the oxidation of NH to NO each draw one atom from the NH pool (Fig. S9). Following the same convention, N2O yield (%) during hybrid production was calculated as
The maximum N2O yield from hybrid production was 21 ± 7 % (Fig. 9c, d). while the maximum N2O yield during production solely from NH was 2.2 ± 0.7 % (Fig. 9e, f). The N2O yield during production solely from NH declined more sharply with increased O2 than the N2O yield during hybrid production did (Fig. 9c–f).
In this study, we found that N2O production from denitrification was the dominant source of N2O both within the ODZ and in the upper oxycline. Hybrid N2O production was a smaller but significant contributor to N2O in the upper oxycline, and the primary source of N2O in the deep oxycline. N2O production solely from NH (which includes N2O from hydroxylamine oxidation, hybrid production with cellular NO, and nitrifier denitrification with cellular NO) was negligible everywhere except surface waters. Our findings of equal formation of 45N2Oα and 45N2Oβ in most experiments indicate that Nα retains an equal proportion of NO and NH-derived N during hybrid production, which may imply that hybrid N2O production exhibits a constant δ(15Nsp). All of the processes measured in this study exhibited a strong dependence on dissolved oxygen, although denitrification was less inhibited by dissolved oxygen than previous work would suggest.
4.1 Rates of N2O production via denitrification
Based on our rate data, N2O production from NO is the dominant source of N2O in both the near-surface [N2O] maximum and the anoxic ODZ core. This agrees well with natural abundance isotopocule measurements in the ETNP, which indicate that the near-surface [N2O] maximum is likely to comprise ∼ 80 % N2O produced via denitrification and ∼ 20 % N2O produced via nitrification or archaeal N2O production, producing a local minimum in δ(15Nsp) (Kelly et al., 2021). Natural abundance isotopomer work has shown that N2O production from NO could be an important source of N2O in the anoxic core of ODZs, as long as it has a positive δ(15Nsp) (Casciotti et al., 2018; Kelly et al., 2021; Monreal et al., 2022). While denitrification is generally accepted to produce N2O with δ(15Nsp)≈ 0 ‰ (Sutka et al., 2006; other refs), some strains of denitrifying bacteria can produce N2O with δ(15Nsp)=10 ‰–22 ‰ (Toyoda et al., 2005; Wang et al., 2023) and denitrifying fungi produce N2O with δ(15Nsp)=35 ‰–37 ‰ (Lazo-Murphy et al., 2022; Rohe et al., 2014; Sutka et al., 2008; Yang et al., 2014). Here, the dominance of N2O production from 15N–NO, combined with parallel natural abundance isotopomer studies, suggest that strains of denitrifying bacteria and fungi that produce N2O with a high site preference may be important contributors to N2O in the core of ODZs. The importance of N2O production from NO also presents an important exception to the modular view of the microbial nitrogen cycle network, which holds that intermediates are passed externally from one cell to the next, rather than being held internally (Kuypers et al., 2018). N2O production from NO that utilizes an internal NO pool is currently left out of most biogeochemical models of nitrogen cycling in and around oxygen-deficient zones (Bianchi et al., 2023), and modeling work that includes this as a source of N2O is needed.
4.2 Pathways of hybrid N2O production and implications for hybrid δ(15Nsp)
Hybrid N2O production peaked at the same depths as NH3 oxidation (Fig. 6c, g, k), which were also the depths at which ammonia-oxidizing archaea were most abundant (Frey et al., 2023), consistent with N2O production associated with ammonia-oxidizing archaea. At most stations and depths, the production of 45N2Oα and 45N2Oβ in both the 15N–NO and 15N–NH experiments were roughly equal. From this we conclude that, during hybrid formation, Nα and Nβ each retained nitrogen atoms derived from both NH and NO. The equal formation of 45N2Oα and 45N2Oβ led to values off within an error of 0.5 in most of our experiments (Table S4), and the mean value of f across all stations and depths was 0.5 ± 0.2. This means that, during hybrid N2O production, half of the Nα atoms were derived from NO and half were derived from NH (likewise for Nβ).
Although our data do not allow us to comment directly on the enzymatic machinery of hybrid N2O formation, our data can be used to theorize hypothetical pathways for hybrid N2O production. Firstly, we see much higher rates of hybrid production using ambient NO (Pathway 3 in Wan et al., 2023b) than hybrid production using cellular NO (Pathway 2 in Wan et al., 2023b). Again, this agrees with the results of Wan et al. (2023b), who see higher rates of hybrid formation from extracellular NO within the range of [15N–NH]/[NO] covered by our experiments. In our model, hybrid N2O production is operationally defined as a 1:1 combination of N derived from NH and NO, which is generally consistent with previous work (Stieglmeier et al., 2014). Any combination of N derived from NO with a second N derived from NO would be included in the modeled quantity of N2O production from NO; likewise, any combination of N derived from NH with a second N derived from NH would be included in the N2O production solely from NH. The question, then, is what reaction would be specific enough to have one N derived from each substrate but not specific enough to govern 15N placement in the resulting N2O? One such reaction could be the combination of NH and NO to form a symmetrical intermediate such as hyponitrous acid (HONNOH, or hyponitrite −ONNO− in its deprotonated form), which has been discussed as a possible intermediate in hybrid nitrous oxide formation (Wei et al., 2019). Hyponitrous acid may react to form N2O via breakage of one of the N–O bonds, resulting in N2O that contains a 1:1 ratio of NH:NO. With a precursor such as hyponitrite or hyponitrous acid, equal formation of 45N2Oα and 45N2Oβ could be achieved with non-selective N–O bond breakage.
These findings of equal 45N2O production have important implications for the natural abundance δ(15Nsp) of N2O produced by the hybrid N2O process. Assuming that hybrid N2O production proceeds through a symmetrical intermediate in which NH and NO are paired in a 1:1 ratio, we can model δ(15Nsp) as
where f is the proportion of the α nitrogen derived from NO and the proportion of the β nitrogen derived from NH and ε is the fractionation factor associated with Nβ–O bond breakage. If , hybrid δ(15Nsp) retains a dependence on the δ(15N) of the substrates – or, more accurately, the difference in δ(15N) of the two substrates; if the δ(15N) of the substrates is equal, it will cancel out regardless of f. If δ(15N–NH) >δ(15N–NO), as is generally the case in the secondary nitrite maximum (Buchwald et al., 2015; Casciotti, 2016), then low values of f should produce high hybrid δ(15Nsp) and high values of f should produce low hybrid δ(15Nsp) (Fig. 10). If, however, , as was the case for most experimental depths in this study, hybrid δ(15Nsp) should depend only on ε and not on the isotopic composition of each substrate. This means that a δ(15Nsp) endmember could potentially be established for hybrid N2O production, even though hybrid N2O production draws from different substrate pools. Wei et al. (2019) discuss possible pathways or endmembers of hybrid N2O formation, i.e., via cis-hyponitrous acid, trans-hyponitrous acid, and nitramide, all leading to N2O with different δ(15Nsp) values. More studies are needed to determine the δ(15Nsp) of N2O produced by ammonia-oxidizing archaea under a range of conditions.
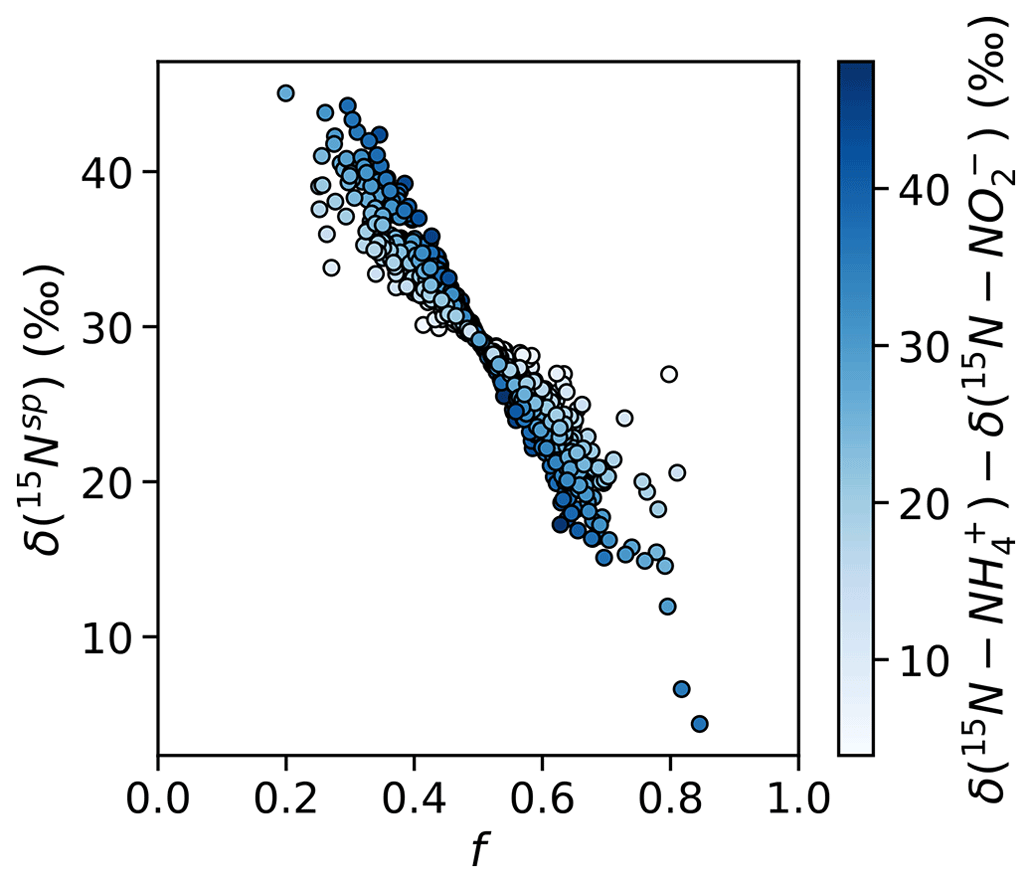
Figure 10Simulated values of δ(15Nsp) calculated with a range of f (the proportion of Nα derived from NO during hybrid N2O production) and δ(15N–NH)–δ(15N–NO), assuming ε=30.3 ‰ (Santoro et al., 2011). Results are shaded by δ(15N–NH) – δ(15N–NO). When f is less than or greater than , there is the potential for δ(15Nsp) to depend on the isotopic compositions of each substrate.
The unequal production of 45N2Oα and 45N2Oβ observed at certain depths led to values of f significantly different from 0.5 (Table S4). At these depths, Nα retained a different proportion of nitrogen derived from NO and NH than Nβ did, causing 45N2Oα and 45N2Oβ to diverge. The depths with f≠0.5 anchored significant relationships between f and ambient [O2] (R2=0.84, p<0.001; Fig. S10a) and potential density anomaly (σθ) (R2=0.72, p<0.001; Fig. S10b). The oxygen and potential density gradients may be proxies for changing archaeal community compositions at different depths in the water column, which may exhibit different patterns of incorporation of NO-derived N and NH-derived N into Nα and Nβ. It is also possible that we sampled a different “hybrid” N2O-producing process at these depths, such as fungal co-denitrification (Shoun et al., 2012), which may proceed via a different pathway from archaeal hybrid N2O production.
4.3 Rates of nitrification and N2O production solely from NH
The rates of N2O production from NH in this study (i.e., the sum of hybrid N2O production and N2O production solely from NH) peaked at 240 ± 80 pM N2O d−1 (Table S4). These were similar to those measured on the same cruise by Frey et al. (2023), who measured rates of N2O production from NH in the oxycline of 28–149 pM N2O d−1 (Frey et al., 2023). The low rates of NH3 oxidation to NO in this study (0.05–4.68 nM N d−1) were also similar to those measured by Frey et al. (2023), who measured NH3 oxidation rates of 1.0–11.7 nM d−1 in the oxycline. NH3 oxidation rates in this study were smaller than those measured on the same cruise by Travis et al. (2023), who measured NH3 oxidation rates as high as 90 ± 2 nM d−1 in fully oxygenated incubations at station PS3. The highest rates of NO oxidation we observed occurred at anoxic depths at stations PS2 and PS3 (Fig. 3e, h), which agrees with mounting evidence suggesting the importance of NO oxidation in apparently anoxic regions (Sun et al., 2017, 2021b).
When [O2] was less than 10 µM, the rates of hybrid N2O production (6–230 pM N2O d−1) were orders of magnitude greater than the rates of N2O production solely from NH at the same depths (0–8 pM N2O d−1) (Fig. 6). Indeed, at the upper oxic–anoxic interface, the rates of hybrid N2O production were on a similar order of magnitude to N2O production from NO via denitrification (8–510 pM N2O d−1). These results agree with previous work showing that hybrid N2O formation represents a high percentage of total N2O production from NH in the ETNP and eastern tropical South Pacific (ETSP) (Frey et al., 2020, 2023). The results in this study also agree with recent culture work: the 15N–NH experiments in this study fell along a range of [15N–NH] [NO] of 0.14–0.5, in which Wan et al. (2023b) found that hybrid N2O production occurred at a rate 2 to 4 times greater than N2O production via hydroxylamine oxidation (N derived solely from NH) in cultures of Nitrosopumilus maritimus.
We found three depths near the surface where hybrid production comprised a smaller percentage (0 %–68 %) of total N2O production from NH (Fig. 7a–c). Previous work in the ETNP found that hybrid N2O production always comprised > 90 % of N2O production from NH (Frey et al., 2023), and, where our samples overlapped with this previous work, we observed similarly high proportions of hybrid production (Fig. 5). The depths where we observed a smaller proportion of hybrid production had not been sampled previously; it is possible that we sampled different microbial communities there, acclimated to different levels of NH, NO, and dissolved oxygen. We also found that hybrid N2O formation generally comprised a small proportion of total N2O production, which was dominated by N2O production from NO, especially at suboxic depths (Fig. 7d–h). This is similar to previous findings from the ETSP, which showed that hybrid formation comprised 0 %–95 % of total N2O production from NO along the natural [O2] gradient (Frey et al., 2020). This large range is due to the large range of rates of N2O production from NO, which can occur at orders of magnitude higher or lower than hybrid N2O production.
4.4 Oxygen dependence of N2O production rates and yields
N2O production from NO and NO exhibited exponential dependence on dissolved oxygen, albeit with smaller maximum rates than those found in the ETSP (Frey et al., 2020; Ji et al., 2015). Most surprising were the significant rates of N2O production via denitrification at [O2] > 3 µM (Fig. 8a–d), which has previously been suggested as the threshold above which denitrification ceases (Dalsgaard et al., 2014). These observations are particularly evident in the plots of N2O production from NO vs. incubation [O2] (Fig. 8b), where positive, significant rates of N2O production from NO were evident in incubations containing [O2] as high as 19.2 ± 0.8 µM (PS2 deep ODZ core experiment). One explanation for N2O production via denitrification at such high levels of ambient dissolved oxygen is particle-associated denitrification (Bianchi et al., 2018; Smriga et al., 2021; Wan et al., 2023a). Fungal denitrification may also have contributed to these fluxes, since denitrifying fungi can tolerate a higher level of oxygen than their bacterial counterparts. Additionally, denitrifying microbial communities acclimatized to lower ambient [O2] may be able to continue to produce N2O when [O2] is suddenly increased.
These results showed that N2O production from NO can occur in [O2] as high as 19.2 ± 0.8 µM, which is similar to results from the ETSP showing that N2O production from NO in manipulated [O2] can be as high as 30 µM (Frey et al., 2020). The volume of suboxic water in the ocean has been increasing over the last 50 years and will likely continue to expand over the 21st century (Oschlies et al., 2018; Schmidtko et al., 2017; Stramma et al., 2008), although the extent of this deoxygenation remains uncertain (Bianchi et al., 2018; Busecke et al., 2022; Cabré et al., 2015). Constraining the window of oxygen concentrations under which denitrification leads to N2O production will be key to understanding how marine deoxygenation and N2O cycling will interact.
While this study and others have found that hybrid N2O production represents a consistent percentage of N2O production from NH along a range of ambient [O2] (Frey et al., 2020, 2023), the rate of hybrid N2O production followed a clear exponential dependence on dissolved oxygen (Fig. 9). The differences in ambient and incubation [O2] resulted in slight differences in the coefficients for each yield curve; nevertheless, hybrid rates plotted along both ambient and incubation [O2] gradients exhibited remarkably similar [O2] inhibition curves, with the highest rates at [O2] < 7 µM. These results are similar to those of Frey et al. (2023), who showed a decrease in N2O production from NH with increasing [O2].
The maximum N2O yield for hybrid production (21 %; Fig. 8c, d) was 1 order of magnitude higher than previous estimates of N2O yields during NH3 oxidation from ETSP and ETNP, which did not include hybrid N2O production (Ji et al., 2018). These high yields occurred at the oxic–anoxic interface at station PS1 and just below the oxic–anoxic interface at station PS3, where ambient [O2] was below detection but NH3 oxidation still occurred (Fig. 3). This indicates the potential for extremely high yields of N2O from hybrid production where NH3 oxidation is active in suboxic to anoxic environments.
N2O yields during production solely from NH also increased with decreasing [O2] (Fig. 9b), as previously reported (Frey et al., 2020; Goreau et al., 1980; Ji et al., 2018; Nevison et al., 2003). N2O yields during production solely from NH increased sharply with decreasing [O2] along both ambient and incubation [O2] gradients but were much smaller than the yields from hybrid N2O production (Fig. 8c–d). The maximum yields during production solely from NH were similar to the maximum yields found by another study in the ETNP, which were around 3 % (Frey et al., 2023), and much higher than yields from ammonia-oxidizing archaea in soils and culture (up to 0.03 %) (Hink et al., 2017a, b).
4.5 Experimental artifacts
Care was taken to minimize the effects of experimental setup on the microbial communities in each sample. In addition to the steps taken to prevent oxygen contamination (described in Sect. 2: Methods), a relatively short 24 h incubation period was selected to minimize bottle effects and shifts in the microbial community composition over the course of each incubation. Nonetheless, sample collection, preparation, and incubation conditions could have affected the microbial communities in several ways. Firstly, samples were frequently collected from depths where the water temperature was cooler than that of the laboratory, and, while samples were returned to a cool temperature during incubation (12 °C), they were exposed to warmer temperatures (> 20 °C) during the 2 h in which they underwent collection and manipulation prior to incubation. Likewise, during this interval, samples were exposed to higher light levels before being returned to the dark for incubation. While oxygen contamination was minimized during sample collection, it was not eliminated entirely, and a temporary oxygen intrusion before sparging may have poisoned certain anaerobic processes. The 90 min sparge also likely removed carbon dioxide in addition to oxygen and N2O, increasing the pH of each sample. Finally, the NH and NO tracer and carrier additions exceeded the ambient concentrations of these substrates, potentially stimulating the rates of processes that rely on these substrates. All of these perturbations, while common among incubation studies, may have affected the microbial community differentially in each sample. Thus, the results presented here represent processes able to withstand these perturbations to ambient environmental conditions. Any abiotic reactions between the HgCl2 preservative and the NO tracer and carrier would have shifted all three time points equally and thus should not introduce a bias into the slopes of 15N-labeled N2O with time and the rates calculated from there.
4.6 Alternative sources of N2O
Other processes may have contributed to N2O production in our samples. A complementary set of experiments found that fungal denitrification comprised 50 % of total N2O production via denitrification at the secondary chlorophyll a maximum depths discussed here (Peng and Valentine, 2021). Additionally, since our samples were unfiltered, particle-associated N2O production and consumption may have occurred in some of our experiments, especially in experiments at the highly productive coastal station. We cannot rule out any of these alternative sources of N2O in our samples, so we regard these processes as potential contributors to the bulk denitrifying flux discussed here.
We applied N2O isotopocule measurements to 15N tracer incubations to measure N2O production rates and mechanisms in the ETNP. We found that N2O production rates peaked at the oxic–anoxic interface above the ODZ, with the highest rates of N2O production from NO. Hybrid N2O production peaked in both the shallow and deep oxyclines, where NH3 oxidation was also active, and exhibited yields as high as 21 % of ammonia oxidation.
Based on the equal production of 45N2Oα and 45N2Oβ in the vast majority of our experiments, we posit a two-step process for hybrid N2O production involving an initial bond-forming step that draws nitrogen atoms from each substrate to form a symmetric intermediate and a second bond-breaking step that breaks an N–O bond in the symmetric intermediate to form N2O. From this, we infer that hybrid N2O production likely has a consistent δ(15Nsp), despite drawing from two distinct substrate pools. This has important implications for the interpretation of natural abundance isotopocule measurements, since it implies that it may be possible to define a δ(15Nsp) endmember for hybrid N2O formation. More culture experiments are needed to quantify the δ(15Nsp) of N2O produced by ammonia-oxidizing archaea under different temperatures, oxygen levels, and ratios of NH NO.
N2O production rates and yields of every process examined here were inhibited by dissolved oxygen. The N2O yield from hydroxylamine oxidation was most sensitive to O2, followed by the rates of N2O production from NO via denitrification, hybrid N2O production, and N2O production from NO via denitrification. Indeed, we measured positive, significant rates of N2O production from NO at ambient [O2] as high as 12.5 µM and at manipulated [O2] as high as 19.2 µM. These denitrifying fluxes may have derived partially from fungal N2O production, since fungal denitrifiers can tolerate higher oxygen levels than bacteria (Peng and Valentine, 2021) or particle-associated denitrification (Bianchi et al., 2018; Smriga et al., 2021). These results suggest that a broad window of [O2] could support net N2O accumulation, and additional studies are needed to further constrain this window and the resulting feedbacks between denitrification and marine deoxygenation.
Since only 2 mL of sample was available for preparation and analysis of nitrate isotopes using the denitrifier method, it was not possible to always achieve consistent peak areas. Instead of discarding low-peak-area samples, however, we wanted to establish a method to estimate the uncertainties associated with individual samples based on their peak area. This uncertainty arises from a correction scheme for δ(15N) that assumes constant blank : sample quantity ratios. What follows is a method for estimating this uncertainty, using the slope and intercept of the calibration curve and blank peak area.
In brief, the first step of this method is to calculate the peak area and δ(15N) of the blank for an individual run (batch of bacteria) using the slope and intercept of the nitrate isotope calibration curve (Casciotti et al., 2002). Then, a range of theoretical measured δ(15N) is calculated for a set of dummy samples based on a range of “actual” δ(15N), a range of theoretical peak areas, and the peak area and δ(15N) of the blank. Then, we correct each of these theoretical measured δ(15N) values with the calibration curve, as one would do normally, to obtain δ(15Ncorrected) for each dummy sample. We estimate the error for each dummy sample by comparing the δ(15Ncorrected) we have calculated to the δ(15Nsample) we have assigned to it. Then, for each run (and associated blank), we can fit a function through these errors, their corresponding peak areas, and the corresponding δ(15Nsample). We can then feed this function the peak area and measured δ(15N) of actual samples in that run to estimate their uncertainties.
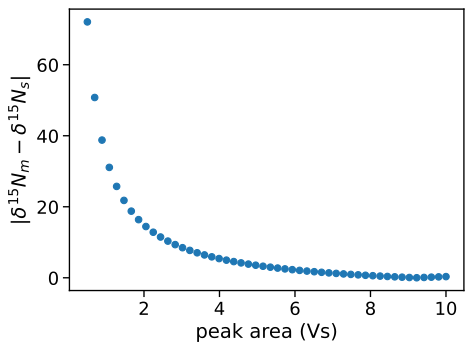
Figure A1δ(15Nerror) vs. peak area for a range of dummy samples with measured peak areas from 0.5 to 10 Vs, based on a blank peak area of 0.15 Vs and δ(15Nblank) of −69.3 ‰.
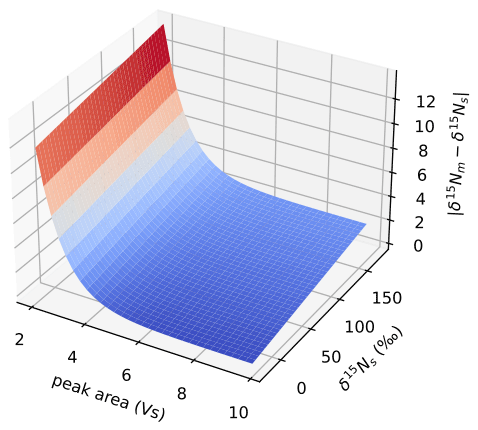
Figure A2δ(15Nerror) vs. peak area and δ(15Nsample) for a range of dummy samples with peak areas from 0.5 to 10 Vs and δ(15Nsample) from −20 ‰ to 180 ‰, based on a blank peak area of 0.15 Vs and δ(15Nblank) of −69.3 ‰.
In practice, we start with a simple mass balance that states that the measured δ(15N) is a function of the sample δ(15N), sample peak area Asample, blank δ(15N), and blank peak area Ablank:
where δ(15Nmeasured) is the measured δ(15N), Ameasured is the measured peak area, δ(15Nsample) is the actual sample δ(15N), Asample is the peak area attributable to sample N, δ(15Nblank) is the δ(15N) of the blank, and Ablank is the peak area attributable to blank N. Dividing through by Ameasured,
Equation (A2) can be expressed as a linear equation, , where m is the slope of δ(15Nmeasured) vs. δ(15Nsample) and b is the y intercept. Thus
We can obtain the mean blank peak area Ablank from the slope and the mean peak area of the measured reference materials (Ameasured):
Finally, we obtain δ(15Nblank) from
We assign the dummy samples a range of theoretical measured peak areas, Ameasured. The ratio of the blank peak area to the measured peak areas for a given sample is given by dividing Ablank (calculated from Eq. A6) by this theoretical peak area to obtain , where Ameasured,i is the theoretical peak area for that sample. Then, the ratio of sample peak area to measured peak area for a given theoretical sample is given by
As a first example, we assign all of the theoretical samples the same δ(15Nsample) of 180 ‰. Then, to obtain a range of theoretical measured δ(15Nmeasured), we plug the δ(15Nblank) calculated from Eq. (A7), the range of theoretical peak areas Ameasured,i, and this δ(15Nsample) into Eq. (A2):
We correct the range of calculated from Eq. (A9) with the slope and intercept of the calibration curve δ(15Nsample) vs. δ(15Nmeasured):
Then we calculate the error associated with each dummy sample using
Following this exercise with a range of theoretical peak areas from 0.5 to 10 Vs produces the following curve (Fig. A1). It shows that these theoretical errors increase as peak area decreases, reflecting the basis of the error.
Repeating this exercise with a range of δ(15Nsample) values from −20 ‰ to 180 ‰ produces a 3D version of this curve (Fig. A2). This shows that the estimated uncertainty is highest for samples with δ(15Nsample) most divergent from δ(15Nblank) and for the peak areas most divergent from the reference materials.
Finally, we fit a function of the following form through these theoretical data:
where a, c, and d are constants, Asample is the measured peak areas of the theoretical samples, and δ(15Nsample) is the assigned value for the dummy samples.
This procedure was repeated for each denitrifier run to produce coefficients a, c, and d specific to that set of analyses. Then, to estimate the uncertainty associated with each measurement, we used the corrected δ(15N) for each sample's δ(15Nsample) and its measured peak area for Asample in Eq. (A12).
The data reported in this study can be found in the Stanford Digital Repository (https://doi.org/10.25740/ss974md4840, Kelly and Casciotti, 2023). Forward-running model code is available via Zenodo (https://doi.org/10.5281/zenodo.11475416; Kelly, 2024). pyisotopomer, which was used for N2O isotopocule data corrections, is available for installation from the Python Package Index and Zenodo (https://doi.org/10.5281/zenodo.7552724; Kelly, 2023).
The supplement related to this article is available online at: https://doi.org/10.5194/bg-21-3215-2024-supplement.
CLK and KLC conceptualized the study, with input from CF and BBW. CLK and NMT carried out the experiments at sea, with assistance and supervision from CF and BBW. CLK and PAB analyzed the incubation samples in the laboratory. CLK performed the formal analysis of the data, developed the model code, and performed the model optimizations. XS provided N2O consumption data for inclusion in the model. KLC acquired funding for the study. CLK prepared the article with contributions from all co-authors.
The contact author has declared that none of the authors has any competing interests.
Publisher's note: Copernicus Publications remains neutral with regard to jurisdictional claims made in the text, published maps, institutional affiliations, or any other geographical representation in this paper. While Copernicus Publications makes every effort to include appropriate place names, the final responsibility lies with the authors.
This article is part of the special issue “Low-oxygen environments and deoxygenation in open and coastal marine waters”. It is not associated with a conference.
We would like to thank Stanford University and the Stanford Research Computing Center for providing computational resources and support that contributed to this research. We would also like to thank Julie Granger, Scott Wankel, and two anonymous reviewers for their constructive feedback during the review process. This research was supported by US NSF grant no. OCE-1657868 to Karen L. Casciotti. Colette L. Kelly was supported by an NSF Graduate Research Fellowship. The authors declare no competing financial interests.
This research has been supported by the Directorate for Geosciences (grant no. OCE-1657868).
This paper was edited by Nicolas Brüggemann and reviewed by Scott Wankel and two anonymous referees.
Babbin, A. R., Bianchi, D., Jayakumar, A., and Ward, B. B.: Rapid nitrous oxide cycling in the suboxic ocean, Science, 348, 1127–1129, https://doi.org/10.1126/science.aaa8380, 2015.
Bianchi, D., Weber, T. S., Kiko, R., and Deutsch, C.: Global niche of marine anaerobic metabolisms expanded by particle microenvironments, Nat. Geosci., 11, 263–268, https://doi.org/10.1038/s41561-018-0081-0, 2018.
Bianchi, D., McCoy, D., and Yang, S.: Formulation, optimization, and sensitivity of NitrOMZv1.0, a biogeochemical model of the nitrogen cycle in oceanic oxygen minimum zones, Geosci. Model Dev., 16, 3581–3609, https://doi.org/10.5194/gmd-16-3581-2023, 2023.
Böhlke, J. K., Mroczkowski, S. J., and Coplen, T. B.: Oxygen isotopes in nitrate: new reference materials for 18O : 17O : 16O measurements and observations on nitrate-water equilibration, Rapid Commun. Mass Sp., 17, 1835–1846, https://doi.org/10.1002/rcm.1123, 2003.
Bourbonnais, A., Letscher, R. T., Bange, H. W., Échevin, V., Larkum, J., Mohn, J., Yoshida, N., and Altabet, M. A.: N2O production and consumption from stable isotopic and concentration data in the Peruvian coastal upwelling system, Global Biogeochem. Cy., 31, 678–698, https://doi.org/10.1002/2016GB005567, 2017.
Bourbonnais, A., Chang, B. X., Sonnerup, R. E., Doney, S. C., and Altabet, M. A.: Marine N2O cycling from high spatial resolution concentration, stable isotopic and isotopomer measurements along a meridional transect in the eastern Pacific Ocean, Front. Mar. Sci., 10, 1137064, https://doi.org/10.3389/fmars.2023.1137064, 2023.
Breitburg, D., Levin, L. A., Oschlies, A., Grégoire, M., Chavez, F. P., Conley, D. J., Garçon, V., Gilbert, D., Gutiérrez, D., Isensee, K., Jacinto, G. S., Limburg, K. E., Montes, I., Naqvi, S. W. A., Pitcher, G. C., Rabalais, N. N., Roman, M. R., Rose, K. A., Seibel, B. A., Telszewski, M., Yasuhara, M., and Zhang, J.: Declining oxygen in the global ocean and coastal waters, Science, 359, eaam7240, https://doi.org/10.1126/science.aam7240, 2018.
Brenninkmeijer, C. A. M. and Röckmann, T.: Mass spectrometry of the intramolecular nitrogen isotope distribution of environmental nitrous oxide using fragment-ion analysis, Rapid Commun. Mass Sp., 13, 2028–2033, https://doi.org/10.1002/(SICI)1097-0231(19991030)13:20<2028::AID-RCM751>3.0.CO;2-J, 1999.
Buchwald, C., Santoro, A. E., Stanley, R. H. R., and Casciotti, K. L.: Nitrogen cycling in the secondary nitrite maximum of the eastern tropical North Pacific off Costa Rica, Gloal Biogeochem. Cy., 29, 2061–2081, https://doi.org/10.1002/2015GB005187, 2015.
Busecke, J. J. M., Resplandy, L., Ditkovsky, S. J., and John, J. G.: Diverging Fates of the Pacific Ocean Oxygen Minimum Zone and Its Core in a Warming World, AGU Adv., 3, e2021AV000470, https://doi.org/10.1029/2021AV000470, 2022.
Cabré, A., Marinov, I., Bernardello, R., and Bianchi, D.: Oxygen minimum zones in the tropical Pacific across CMIP5 models: mean state differences and climate change trends, Biogeosciences, 12, 5429–5454, https://doi.org/10.5194/bg-12-5429-2015, 2015.
Carini, P., Dupont, C. L., and Santoro, A. E.: Patterns of thaumarchaeal gene expression in culture and diverse marine environments, Environ. Microbiol., 20, 2112–2124, https://doi.org/10.1111/1462-2920.14107, 2018.
Casciotti, K. L.: Nitrite isotopes as tracers of marine N cycle processes, Philos. T. R. Soc. A, 374, 20150295, https://doi.org/10.1098/rsta.2015.0295, 2016.
Casciotti, K. L., Sigman, D. M., Hastings, M. G., Böhlke, J. K., and Hilkert, A.: Measurement of the Oxygen Isotopic Composition of Nitrate in Seawater and Freshwater Using the Denitrifier Method, Anal. Chem., 74, 4905–4912, https://doi.org/10.1021/ac020113w, 2002.
Casciotti, K. L., Böhlke, J. K., McIlvin, M. R., Mroczkowski, S. J., and Hannon, J. E.: Oxygen Isotopes in Nitrite: Analysis, Calibration, and Equilibration, Anal. Chem., 79, 2427–2436, https://doi.org/10.1021/ac061598h, 2007.
Casciotti, K. L., Forbes, M., Vedamati, J., Peters, B. D., Martin, T. S., and Mordy, C. W.: Nitrous oxide cycling in the Eastern Tropical South Pacific as inferred from isotopic and isotopomeric data, Deep-Sea Res. Pt. II, 156, 155–167, https://doi.org/10.1016/j.dsr2.2018.07.014, 2018.
Codispoti, L. A. and Christensen, J. P.: Nitrification, denitrification and nitrous oxide cycling in the eastern tropical South Pacific ocean, Mar. Chem., 16, 277–300, https://doi.org/10.1016/0304-4203(85)90051-9, 1985.
Cohen, Y. and Gordon, L. I.: Nitrous oxide production in the Ocean, J. Geophys. Res.-Ocean., 84, 347–353, https://doi.org/10.1029/JC084iC01p00347, 1979.
Dalsgaard, T., Stewart, F. J., Thamdrup, B., Brabandere, L. D., Revsbech, N. P., Ulloa, O., Canfield, D. E., and DeLong, E. F.: Oxygen at Nanomolar Levels Reversibly Suppresses Process Rates and Gene Expression in Anammox and Denitrification in the Oxygen Minimum Zone off Northern Chile, mBio, 5, e01966-14, https://doi.org/10.1128/mBio.01966-14, 2014.
Farías, L., Castro-González, M., Cornejo, M., Charpentier, J., Faúndez, J., Boontanon, N., and Yoshida, N.: Denitrification and nitrous oxide cycling within the upper oxycline of the eastern tropical South Pacific oxygen minimum zone, Limnol. Oceanogr., 54, 132–144, https://doi.org/10.4319/lo.2009.54.1.0132, 2009.
Farías, L., Faúndez, J., Fernández, C., Cornejo, M., Sanhueza, S., and Carrasco, C.: Biological N2O fixation in the Eastern South Pacific Ocean and marine cyanobacterial cultures, PloS One, 8, e63956, https://doi.org/10.1371/journal.pone.0063956, 2013.
Frame, C. H. and Casciotti, K. L.: Biogeochemical controls and isotopic signatures of nitrous oxide production by a marine ammonia-oxidizing bacterium, Biogeosciences, 7, 2695–2709, https://doi.org/10.5194/bg-7-2695-2010, 2010.
Frame, C. H., Lau, E., Nolan, E. J. I., Goepfert, T. J., and Lehmann, M. F.: Acidification Enhances Hybrid N2O Production Associated with Aquatic Ammonia-Oxidizing Microorganisms, Front. Microbiol., 7, 2104, https://doi.org/10.3389/fmicb.2016.02104, 2017.
Frey, C., Bange, H. W., Achterberg, E. P., Jayakumar, A., Löscher, C. R., Arévalo-Martínez, D. L., León-Palmero, E., Sun, M., Sun, X., Xie, R. C., Oleynik, S., and Ward, B. B.: Regulation of nitrous oxide production in low-oxygen waters off the coast of Peru, Biogeosciences, 17, 2263–2287, https://doi.org/10.5194/bg-17-2263-2020, 2020.
Frey, C., Sun, X., Szemberski, L., Casciotti, K. L., Garcia-Robledo, E., Jayakumar, A., Kelly, C. L., Lehmann, M. F., and Ward, B. B.: Kinetics of nitrous oxide production from ammonia oxidation in the Eastern Tropical North Pacific, Limnol. Oceanogr., 68, 424–438, https://doi.org/10.1002/lno.12283, 2023.
Garcia, H. E. and Gordon, L. I.: Oxygen Solubility in Seawater: Better Fitting Equations, Limnol. Oceanogr., 37, 1307–1312, 1992.
Goreau, T. J., Kaplan, W. A., Wofsy, S. C., McElroy, M. B., Valois, F. W., and Watson, S. W.: Production of NO and N2O by Nitrifying Bacteria at Reduced Concentrations of Oxygen, Appl. Environ. Microbiol., 40, 526–532, https://doi.org/10.1128/aem.40.3.526-532.1980, 1980.
Granger, J. and Sigman, D. M.: Removal of nitrite with sulfamic acid for nitrate N and O isotope analysis with the denitrifier method, Rapid Commun. Mass Sp., 23, 3753–3762, https://doi.org/10.1002/rcm.4307, 2009.
Grasshoff, K., Ehrhardt, M., Kremling, K., and Anderson, L. G. (Eds.): Methods of seawater analysis, 3rd, completely rev. and extended ed ed., Wiley-VCH, Weinheim, New York, 600 pp., 1999.
Hink, L., Nicol, G. W., and Prosser, J. I.: Archaea produce lower yields of N 2 O than bacteria during aerobic ammonia oxidation in soil: N 2 O production by soil ammonia oxidisers, Environ. Microbiol., 19, 4829–4837, https://doi.org/10.1111/1462-2920.13282, 2017a.
Hink, L., Lycus, P., Gubry-Rangin, C., Frostegård, Å., Nicol, G. W., Prosser, J. I., and Bakken, L. R.: Kinetics of NH3-oxidation, NO-turnover, N2O-production and electron flow during oxygen depletion in model bacterial and archaeal ammonia oxidisers, Environ. Microbiol., 19, 4882–4896, https://doi.org/10.1111/1462-2920.13914, 2017b.
Holmes, R. M., Aminot, A., Kérouel, R., Hooker, B. A., and Peterson, B. J.: A simple and precise method for measuring ammonium in marine and freshwater ecosystems, Can. J. Fish. Aquat. Sci., 56, 1801–1808, https://doi.org/10.1139/f99-128, 1999.
Ji, Q., Babbin, A. R., Jayakumar, A., Oleynik, S., and Ward, B. B.: Nitrous oxide production by nitrification and denitrification in the Eastern Tropical South Pacific oxygen minimum zone, Geophys. Res. Lett., 42, 10755–10764, https://doi.org/10.1002/2015GL066853, 2015.
Ji, Q., Buitenhuis, E., Suntharalingam, P., Sarmiento, J. L., and Ward, B. B.: Global Nitrous Oxide Production Determined by Oxygen Sensitivity of Nitrification and Denitrification, Global Biogeochem. Cy., 32, 1790–1802, https://doi.org/10.1029/2018GB005887, 2018.
Kaiser, J., Park, S., Boering, K. A., Brenninkmeijer, C. A. M., Hilkert, A., and Röckmann, T.: Mass spectrometric method for the absolute calibration of the intramolecular nitrogen isotope distribution in nitrous oxide, Anal. Bioanal. Chem., 378, 256–269, https://doi.org/10.1007/s00216-003-2233-2, 2004.
Kantnerová, K., Hattori, S., Toyoda, S., Yoshida, N., Emmenegger, L., Bernasconi, S. M., and Mohn, J.: Clumped isotope signatures of nitrous oxide formed by bacterial denitrification, Geochim. Cosmochim. Ac., 328, 120–129, https://doi.org/10.1016/j.gca.2022.05.006, 2022.
Kelly, C. L.: ckelly314/pyisotopomer: v1.0.4, Zenodo [code], https://doi.org/10.5281/zenodo.7552724, 2023.
Kelly, C. L.: ckelly314/isotopomer-soup: Second release of isotopomer-soup (v0.0.2), Zenodo [code], https://doi.org/10.5281/zenodo.11475416, 2024.
Kelly, C. L. and Casciotti, K. L.: Data in support of “Isotopomer labeling and oxygen dependence of hybrid nitrous oxide production” from the Eastern Tropical North Pacific, Stanford Digital Repository [data set], https://doi.org/10.25740/ss974md4840, 2023.
Kelly, C. L., Travis, N. M., Baya, P. A., and Casciotti, K. L.: Quantifying Nitrous Oxide Cycling Regimes in the Eastern Tropical North Pacific Ocean With Isotopomer Analysis, Global Biogeochem. Cy., 35, e2020GB006637, https://doi.org/10.1029/2020GB006637, 2021.
Kelly, C. L., Manning, C., Frey, C., Kaiser, J., Gluschankoff, N., and Casciotti, K. L.: Pyisotopomer: A Python package for obtaining intramolecular isotope ratio differences from mass spectrometric analysis of nitrous oxide isotopocules, Rapid Commun. Mass Sp., 37, e9513, https://doi.org/10.1002/rcm.9513, 2023.
Kim, K.-R. and Craig, H.: Two-isotope characterization of N2O in the Pacific Ocean and constraints on its origin in deep water, Nature, 347, 58–61, https://doi.org/10.1038/347058a0, 1990.
Kozlowski, J. A., Kits, K. D., and Stein, L. Y.: Comparison of Nitrogen Oxide Metabolism among Diverse Ammonia-Oxidizing Bacteria, Front. Microbiol., 7, 1090, https://doi.org/10.3389/fmicb.2016.01090, 2016.
Kraft, B., Jehmlich, N., Larsen, M., Bristow, L. A., Könneke, M., Thamdrup, B., and Canfield, D. E.: Oxygen and nitrogen production by an ammonia-oxidizing archaeon, Science, 375, 97–100, https://doi.org/10.1126/science.abe6733, 2022.
Kuypers, M. M. M., Marchant, H. K., and Kartal, B.: The microbial nitrogen-cycling network, Nat. Rev. Microbiol., 16, 263–276, https://doi.org/10.1038/nrmicro.2018.9, 2018.
Lancaster, K. M., Caranto, J. D., Majer, S. H., and Smith, M. A.: Alternative Bioenergy: Updates to and Challenges in Nitrification Metalloenzymology, Joule, 2, 421–441, https://doi.org/10.1016/j.joule.2018.01.018, 2018.
Lazo-Murphy, B. M., Larson, S., Staines, S., Bruck, H., McHenry, J., Bourbonnais, A., and Peng, X.: Nitrous oxide production and isotopomer composition by fungi isolated from salt marsh sediments, Front. Mar. Sci., 9, 1098508, https://doi.org/10.3389/fmars.2022.1098508, 2022.
Lipschultz, F.: Chap. 31 – Isotope Tracer Methods for Studies of the Marine Nitrogen Cycle, in: Nitrogen in the Marine Environment, 2nd Edn., edited by: Capone, D. G., Bronk, D. A., Mulholland, M. R., and Carpenter, E. J., Academic Press, San Diego, 1345–1384, https://doi.org/10.1016/B978-0-12-372522-6.00031-1, 2008.
Magyar, P. M., Orphan, V. J., and Eiler, J. M.: Measurement of rare isotopologues of nitrous oxide by high-resolution multi-collector mass spectrometry, Rapid Commun. Mass Sp., 30, 1923–1940, https://doi.org/10.1002/rcm.7671, 2016.
Martens-Habbena, W., Qin, W., Horak, R. E. A., Urakawa, H., Schauer, A. J., Moffett, J. W., Armbrust, E. V., Ingalls, A. E., Devol, A. H., and Stahl, D. A.: The production of nitric oxide by marine ammonia-oxidizing archaea and inhibition of archaeal ammonia oxidation by a nitric oxide scavenger, Environ. Microbiol., 17, 2261–2274, https://doi.org/10.1111/1462-2920.12677, 2015.
McIlvin, M. R. and Altabet, M. A.: Chemical Conversion of Nitrate and Nitrite to Nitrous Oxide for Nitrogen and Oxygen Isotopic Analysis in Freshwater and Seawater, Anal. Chem., 77, 5589–5595, https://doi.org/10.1021/ac050528s, 2005.
McIlvin, M. R. and Casciotti, K. L.: Fully automated system for stable isotopic analyses of dissolved nitrous oxide at natural abundance levels, Limnol. Oceanogr. Method., 8, 54–66, https://doi.org/10.4319/lom.2010.8.54, 2010.
McIlvin, M. R. and Casciotti, K. L.: Technical updates to the bacterial method for nitrate isotopic analyses, Anal. Chem., 83, 1850–1856, https://doi.org/10.1021/ac1028984, 2011.
Monreal, P. J., Kelly, C. L., Travis, N. M., and Casciotti, K. L.: Identifying the Sources and Drivers of Nitrous Oxide Accumulation in the Eddy-Influenced Eastern Tropical North Pacific Oxygen-Deficient Zone, Global Biogeochem. Cy., 36, e2022GB007310, https://doi.org/10.1029/2022GB007310, 2022.
Naqvi, S. W. A., Jayakumar, D. A., Narvekar, P. V., Naik, H., Sarma, V. V. S. S., D'Souza, W., Joseph, S., and George, M. D.: Increased marine production of N2O due to intensifying anoxia on the Indian continental shelf, Nature, 408, 346–349, https://doi.org/10.1038/35042551, 2000.
Nelder, J. A. and Mead, R.: A Simplex Method for Function Minimization, Comput. J., 7, 308–313, https://doi.org/10.1093/comjnl/7.4.308, 1965.
Nevison, C., Butler, J. H., and Elkins, J. W.: Global distribution of N2O and the Delta N2O-AOU yield in the subsurface ocean, Global Biogeochem. Cy., 17, 1119, https://doi.org/10.1029/2003GB002068, 2003.
NOAA/National Weather Service: Cold and Warm Episodes by Season, National Weather Service Climate Prediction Center [data set], https://origin.cpc.ncep.noaa.gov/products/analysis_monitoring/ensostuff/ONI_v5.php, last access: 20 July 2020.
Oschlies, A., Brandt, P., Stramma, L., and Schmidtko, S.: Drivers and mechanisms of ocean deoxygenation, Nat. Geosci., 11, 467–473, https://doi.org/10.1038/s41561-018-0152-2, 2018.
Peng, X. and Valentine, D. L.: Diversity and N2O Production Potential of Fungi in an Oceanic Oxygen Minimum Zone, J. Fungi, 7, 218, https://doi.org/10.3390/jof7030218, 2021.
Popp, B. N., Westley, M. B., Toyoda, S., Miwa, T., Dore, J. E., Yoshida, N., Rust, T. M., Sansone, F. J., Russ, M. E., Ostrom, N. E., and Ostrom, P. H.: Nitrogen and oxygen isotopomeric constraints on the origins and sea-to-air flux of N2O in the oligotrophic subtropical North Pacific gyre, Global Biogeochem. Cy., 16, 12-1–12-10, https://doi.org/10.1029/2001GB001806, 2002.
Rahn, T. and Wahlen, M.: A reassessment of the global isotopic budget of atmospheric nitrous oxide, Global Biogeochem. Cy., 14, 537–543, https://doi.org/10.1029/1999GB900070, 2000.
Rohe, L., Anderson, T.-H., Braker, G., Flessa, H., Giesemann, A., Lewicka-Szczebak, D., Wrage-Mönnig, N., and Well, R.: Dual isotope and isotopomer signatures of nitrous oxide from fungal denitrification – a pure culture study, Rapid Commun. Mass Sp., 28, 1893–1903, https://doi.org/10.1002/rcm.6975, 2014.
Schmidtko, S., Stramma, L., and Visbeck, M.: Decline in global oceanic oxygen content during the past five decades, Nature, 542, 335–339, https://doi.org/10.1038/nature21399, 2017.
Shoun, H., Fushinobu, S., Jiang, L., Kim, S.-W., and Wakagi, T.: Fungal denitrification and nitric oxide reductase cytochrome P450nor, Philos. Trans. Biol. Sci., 367, 1186–1194, 2012.
Si, Y., Zhu, Y., Sanders, I., Kinkel, D. B., Purdy, K. J., and Trimmer, M.: Direct biological fixation provides a freshwater sink for N2O, Nat. Commun., 14, 6775, https://doi.org/10.1038/s41467-023-42481-2, 2023.
Sigman, D. M., Casciotti, K. L., Andreani, M., Barford, C., Galanter, M., and Böhlke, J. K.: A Bacterial Method for the Nitrogen Isotopic Analysis of Nitrate in Seawater and Freshwater, Anal. Chem., 73, 4145–4153, https://doi.org/10.1021/ac010088e, 2001.
Smith, C., Nicholls, Z. R. J., Armour, K., Collins, W., Dufresne, J.-L., Frame, D., Lunt, D. J., Mauritsen, M. D., Palmer, M. D., Watanabe, M., Wild, M., and Zhang, H.: The Earth's Energy Budget, Climate Feedbacks, and Climate Sensitivity Supplementary Material, in: Climate Change 2021: The Physical Science Basis, Contribution of Working Group I to the Sixth Assessment Report of the Intergovernmental Panel on Climate Change, edited by: Masson-Delmotte, V., Zhai, P., Pirani, A., Connors, S. L., Péan, C., Berger, S., Caud, N., Chen, Y., Goldfarb, L., Gomis, M. I., Huang, M., Leitzell, K., Lonnoy, E., Matthews, J. B. R., Maycock, T. K., Waterfield, T., Yelekçi, O., Yu, R., and Zhou, B., Cambridge University Press, Cambridge, United Kingdom, ISBN: 978-1-00-915789-6, https://doi.org/10.1017/9781009157896, 2021.
Smriga, S., Ciccarese, D., and Babbin, A. R.: Denitrifying bacteria respond to and shape microscale gradients within particulate matrices, Commun. Biol., 4, 570, https://doi.org/10.1038/s42003-021-02102-4, 2021.
Stein, L. Y.: Insights into the physiology of ammonia-oxidizing microorganisms, Curr. Opin. Chem. Biol., 49, 9–15, https://doi.org/10.1016/j.cbpa.2018.09.003, 2019.
Stein, L. Y. and Yung, Y. L.: Production, Isotopic Composition, and Atmospheric Fate of Biologically Produced Nitrous Oxide, Annu. Rev. Earth Pl. Sc., 31, 329–356, https://doi.org/10.1146/annurev.earth.31.110502.080901, 2003.
Stieglmeier, M., Mooshammer, M., Kitzler, B., Wanek, W., Zechmeister-Boltenstern, S., Richter, A., and Schleper, C.: Aerobic nitrous oxide production through N-nitrosating hybrid formation in ammonia-oxidizing archaea, ISME J., 8, 1135–1146, https://doi.org/10.1038/ismej.2013.220, 2014.
Stramma, L., Johnson, G. C., Sprintall, J., and Mohrholz, V.: Expanding Oxygen-Minimum Zones in the Tropical Oceans, Science, 320, 655–658, https://doi.org/10.1126/science.1153847, 2008.
Sun, X., Ji, Q., Jayakumar, A., and Ward, B. B.: Dependence of nitrite oxidation on nitrite and oxygen in low-oxygen seawater, Geophys. Res. Lett., 44, 7883–7891, https://doi.org/10.1002/2017GL074355, 2017.
Sun, X., Jayakumar, A., Tracey, J. C., Wallace, E., Kelly, C. L., Casciotti, K. L., and Ward, B. B.: Microbial N2O consumption in and above marine N2O production hotspots, ISME J., 15, 1434–1444, https://doi.org/10.1038/s41396-020-00861-2, 2021a.
Sun, X., Frey, C., Garcia-Robledo, E., Jayakumar, A., and Ward, B. B.: Microbial niche differentiation explains nitrite oxidation in marine oxygen minimum zones, ISME J., 15, 1317–1329, https://doi.org/10.1038/s41396-020-00852-3, 2021b.
Sutka, R. L., Ostrom, N. E., Ostrom, P. H., Gandhi, H., and Breznak, J. A.: Nitrogen isotopomer site preference of N2O produced by Nitrosomonas europaea and Methylococcus capsulatus Bath, Rapid Commun. Mass Sp., 17, 738–745, https://doi.org/10.1002/rcm.968, 2003.
Sutka, R. L., Ostrom, N. E., Ostrom, P. H., Gandhi, H., and Breznak, J. A.: Nitrogen isotopomer site preference of N2O produced by Nitrosomonas europaea and Methylococcus capsulatus Bath, Rapid Commun. Mass Sp., 18, 1411–1412, https://doi.org/10.1002/rcm.1482, 2004.
Sutka, R. L., Ostrom, N. E., Ostrom, P. H., Breznak, J. A., Gandhi, H., Pitt, A. J., and Li, F.: Distinguishing Nitrous Oxide Production from Nitrification and Denitrification on the Basis of Isotopomer Abundances, Appl. Environ. Microbiol., 72, 638–644, https://doi.org/10.1128/AEM.72.1.638-644.2006, 2006.
Sutka, R. L., Adams, G. C., Ostrom, N. E., and Ostrom, P. H.: Isotopologue fractionation during N2O production by fungal denitrification, Rapid Commun. Mass Sp., 22, 3989–3996, https://doi.org/10.1002/rcm.3820, 2008.
Tian, H., Xu, R., Canadell, J. G., Thompson, R. L., Winiwarter, W., Suntharalingam, P., Davidson, E. A., Ciais, P., Jackson, R. B., Janssens-Maenhout, G., Prather, M. J., Regnier, P., Pan, N., Pan, S., Peters, G. P., Shi, H., Tubiello, F. N., Zaehle, S., Zhou, F., Arneth, A., Battaglia, G., Berthet, S., Bopp, L., Bouwman, A. F., Buitenhuis, E. T., Chang, J., Chipperfield, M. P., Dangal, S. R. S., Dlugokencky, E., Elkins, J. W., Eyre, B. D., Fu, B., Hall, B., Ito, A., Joos, F., Krummel, P. B., Landolfi, A., Laruelle, G. G., Lauerwald, R., Li, W., Lienert, S., Maavara, T., MacLeod, M., Millet, D. B., Olin, S., Patra, P. K., Prinn, R. G., Raymond, P. A., Ruiz, D. J., van der Werf, G. R., Vuichard, N., Wang, J., Weiss, R. F., Wells, K. C., Wilson, C., Yang, J., and Yao, Y.: A comprehensive quantification of global nitrous oxide sources and sinks, Nature, 586, 248–256, https://doi.org/10.1038/s41586-020-2780-0, 2020.
Toyoda, S. and Yoshida, N.: Determination of nitrogen isotopomers of nitrous oxide on a modified isotope ratio mass spectrometer, Anal. Chem., 71, 4711–4718, https://doi.org/10.1021/ac9904563, 1999.
Toyoda, S., Yoshida, N., Miwa, T., Matsui, Y., Yamagishi, H., Tsunogai, U., Nojiri, Y., and Tsurushima, N.: Production mechanism and global budget of N2O inferred from its isotopomers in the western North Pacific, Geophys. Res. Lett., 29, 7-1–7-4, https://doi.org/10.1029/2001GL014311, 2002.
Toyoda, S., Mutobe, H., Yamagishi, H., Yoshida, N., and Tanji, Y.: Fractionation of N2O isotopomers during production by denitrifier, Soil Biol. Biochem., 37, 1535–1545, https://doi.org/10.1016/j.soilbio.2005.01.009, 2005.
Toyoda, S., Yoshida, O., Yamagishi, H., Fujii, A., Yoshida, N., and Watanabe, S.: Identifying the origin of nitrous oxide dissolved in deep ocean by concentration and isotopocule analyses, Sci. Rep., 9, 1–9, https://doi.org/10.1038/s41598-019-44224-0, 2019.
Toyoda, S., Kakimoto, T., Kudo, K., Yoshida, N., Sasano, D., Kosugi, N., Ishii, M., Kameyama, S., Inagawa, M., Yoshikawa-Inoue, H., Nishino, S., Murata, A., Ishidoya, S., and Morimoto, S.: Distribution and Production Mechanisms of N2O in the Western Arctic Ocean, Global Biogeochem. Cy., 35, e2020GB006881, https://doi.org/10.1029/2020GB006881, 2021.
Toyoda, S., Terajima, K., Yoshida, N., Yoshikawa, C., Makabe, A., Hashihama, F., and Ogawa, H.: Extensive Accumulation of Nitrous Oxide in the Oxygen Minimum Zone in the Bay of Bengal, Global Biogeochem. Cy., 37, e2022GB007689, https://doi.org/10.1029/2022GB007689, 2023.
Travis, N. M., Kelly, C. L., Mulholland, M. R., and Casciotti, K. L.: Nitrite cycling in the primary nitrite maxima of the eastern tropical North Pacific, Biogeosciences, 20, 325–347, https://doi.org/10.5194/bg-20-325-2023, 2023.
Trimmer, M., Chronopoulou, P.-M., Maanoja, S. T., Upstill-Goddard, R. C., Kitidis, V., and Purdy, K. J.: Nitrous oxide as a function of oxygen and archaeal gene abundance in the North Pacific, Nat. Commun., 7, 13451–13451, https://doi.org/10.1038/ncomms13451, 2016.
Vajrala, N., Martens-Habbena, W., Sayavedra-Soto, L. A., Schauer, A., Bottomley, P. J., Stahl, D. A., and Arp, D. J.: Hydroxylamine as an intermediate in ammonia oxidation by globally abundant marine archaea, P. Natl. Acad. Sci. USA, 110, 1006–1011, 2013.
Virtanen, P., Gommers, R., Oliphant, T. E., Haberland, M., Reddy, T., Cournapeau, D., Burovski, E., Peterson, P., Weckesser, W., Bright, J., van der Walt, S. J., Brett, M., Wilson, J., Millman, K. J., Mayorov, N., Nelson, A. R. J., Jones, E., Kern, R., Larson, E., Carey, C. J., Polat, İ., Feng, Y., Moore, E. W., VanderPlas, J., Laxalde, D., Perktold, J., Cimrman, R., Henriksen, I., Quintero, E. A., Harris, C. R., Archibald, A. M., Ribeiro, A. H., Pedregosa, F., and van Mulbregt, P.: SciPy 1.0: fundamental algorithms for scientific computing in Python, Nat. Method., 17, 261–272, https://doi.org/10.1038/s41592-019-0686-2, 2020.
Wan, X. S., Sheng, H.-X., Liu, L., Shen, H., Tang, W., Zou, W., Xu, M. N., Zheng, Z., Tan, E., Chen, M., Zhang, Y., Ward, B. B., and Kao, S.-J.: Particle-associated denitrification is the primary source of N2O in oxic coastal waters, Nat. Commun., 14, 8280, https://doi.org/10.1038/s41467-023-43997-3, 2023a.
Wan, X. S., Hou, L., Kao, S.-J., Zhang, Y., Sheng, H.-X., Shen, H., Tong, S., Qin, W., and Ward, B. B.: Pathways of N2O production by marine ammonia-oxidizing archaea determined from dual-isotope labeling, P. Natl. Acad. Sci. USA, 120, e2220697120, https://doi.org/10.1073/pnas.2220697120, 2023b.
Wang, R. Z., Lonergan, Z. R., Wilbert, S. A., Eiler, J. M., and Newman, D. K.: Widespread detoxifying NO reductases impart a distinct isotopic fingerprint on N 2O under anoxia, Microbiology, bioRxiv 2023.10.13.562248, https://doi.org/10.1101/2023.10.13.562248, 2023.
Wei, J., Ibraim, E., Brüggemann, N., Vereecken, H., and Mohn, J.: First real-time isotopic characterisation of N2O from chemodenitrification, Geochim. Cosmochim. Ac., 267, 17–32, https://doi.org/10.1016/j.gca.2019.09.018, 2019.
Westley, M. B., Yamagishi, H., Popp, B. N., and Yoshida, N.: Nitrous oxide cycling in the Black Sea inferred from stable isotope and isotopomer distributions, Deep-Sea Res. Pt. II, 53, 1802–1816, https://doi.org/10.1016/j.dsr2.2006.03.012, 2006.
Wrage, N., Velthof, G. L., Van Beusichem, M. L., and Oenema, O.: Role of nitrifier denitrification in the production of nitrous oxide, Soil Biol. Biochem., 33, 1723–1732, https://doi.org/10.1016/S0038-0717(01)00096-7, 2001.
Yamagishi, H., Westley, M. B., Popp, B. N., Toyoda, S., Yoshida, N., Watanabe, S., Koba, K., and Yamanaka, Y.: Role of nitrification and denitrification on the nitrous oxide cycle in the eastern tropical North Pacific and Gulf of California, J. Geophys. Res.-Biogeo., 112, G02015, https://doi.org/10.1029/2006JG000227, 2007.
Yang, H., Gandhi, H., Ostrom, N. E., and Hegg, E. L.: Isotopic Fractionation by a Fungal P450 Nitric Oxide Reductase during the Production of N2O, Environ. Sci. Technol., 48, 10707–10715, https://doi.org/10.1021/es501912d, 2014.
Zumft, W. G.: Cell biology and molecular basis of denitrification, Microbiol. Mol. Biol. Rev., 61, 533–616, https://doi.org/10.1128/mmbr.61.4.533-616.1997, 1997.
- Abstract
- Introduction
- Methods
- Results
- Discussion
- Conclusions
- Appendix A: Estimating uncertainties for nitrate isotope analyses from tracer samples
- Code and data availability
- Author contributions
- Competing interests
- Disclaimer
- Special issue statement
- Acknowledgements
- Financial support
- Review statement
- References
- Supplement