the Creative Commons Attribution 4.0 License.
the Creative Commons Attribution 4.0 License.
 | 17 Jul 2024
Variable contribution of wastewater treatment plant effluents to downstream nitrous oxide concentrations and emissions
Jeff Talbott
Timothy Jones
Bess B. Ward
Nitrous oxide (N2O), a potent greenhouse gas and ozone-destroying agent, is produced during nitrogen transformations in both natural and human-constructed environments. Wastewater treatment plants (WWTPs) produce and emit N2O into the atmosphere during the nitrogen removal process. However, the impact of WWTPs on N2O emissions in downstream aquatic systems remains poorly constrained. By measuring N2O concentrations at a monthly resolution over a year in the Potomac River estuary, a tributary of the Chesapeake Bay in the eastern United States, we found a strong seasonal variation in N2O concentrations and fluxes: N2O concentrations were larger in fall and winter, but the flux was larger in summer and fall. Observations at multiple stations across the Potomac River estuary revealed hotspots of N2O emissions downstream of WWTPs. N2O concentrations were higher at stations downstream of WWTPs compared to other stations (median: 21.2 nM vs. 16.2 nM) despite the similar concentration of dissolved inorganic nitrogen, suggesting the direct discharge of N2O from WWTPs into the aquatic system or a higher N2O production yield in waters influenced by WWTPs. Meta-analysis of N2O measurements associated with WWTPs globally revealed variable influence of WWTPs on downstream N2O concentrations and emissions. Since wastewater production has increased substantially with the growing population and is projected to continue to rise, accurately accounting for N2O emissions downstream of WWTPs is important for constraining and predicting future global N2O emissions. Efficient N2O removal, in addition to dissolved nitrogen removal, should be an essential part of water quality control in WWTPs.
- Article
(2848 KB) - Full-text XML
-
Supplement
(2714 KB) - BibTeX
- EndNote


Nitrogen (N) enters the aquatic environment from agricultural and urban runoff, atmospheric deposition, and wastewater treatment plants (WWTPs), potentially leading to eutrophication, especially in densely populated regions (Galloway et al., 2008; Morée et al., 2013). During microbial transformations of N in aquatic systems (e.g., nitrification and denitrification), a powerful greenhouse gas and ozone depleting agent – N2O – is produced (Quick et al., 2019). Aquatic systems are large but highly variable sources of N2O to the atmosphere (Wang et al., 2023). For example, on a global basis, 0.04–0.291 and 0.04–3.6 Tg N yr−1 of N2O are estimated to outgas from rivers and estuaries, respectively (Murray et al., 2015; Maavara et al., 2019; Yao et al., 2019; Rosentreter et al., 2023). The high end of the estimates in these inland and coastal waters approaches the scale of the global marine N2O emissions (2.5–4.3 Tg N yr−1 in Tian et al., 2020). The large uncertainty in the estimate of aquatic N2O emission is partly due to high spatial and temporal variabilities of N2O flux within/across rivers and estuaries and the lack of observations to capture such variability. Therefore, sampling and measurements of N2O concentration at high spatial and temporal resolutions would be desirable to constrain aquatic N2O emission.
The major factors that appear to correlate with N2O concentration are dissolved inorganic nitrogen (DIN) and oxygen status (Hu et al., 2016; Zheng et al., 2022). Waste and wastewater release large amounts of DIN into the aquatic environment. In addition, waste and wastewater emit ∼0.3 Tg N yr−1 of N2O (estimated from 2007–2016) into the atmosphere globally, an amount that is continuously increasing at a rate of 0.04±0.01 Tg N yr−1 per decade (Tian et al., 2020). N2O emission from WWTPs accounts for ∼5.2 % of total N2O emission in 2021 in the United States (US EPA, 2023). N2O emissions from different WWTPs are highly variable and are normally calculated as a function of DIN loading into the WWTPs, using an N2O emission factor (Kampschreur et al., 2009). N2O emission factors range from 0.16 % to 4.5 % (N2O emitted / DIN loading) (Eggleston et al., 2006; de Haas and Andrews, 2022). In addition to direct emission from the WWTPs, N2O can be discharged via WWTP effluent and produced due to DIN release from WWTP effluent into the creeks, rivers, and other downstream aquatic systems (McElroy et al., 1978; Beaulieu et al., 2010; Masuda et al., 2018). However, the impact of WWTPs on downstream N2O concentration is less studied, and the downstream N2O emission remains poorly constrained. Here we specifically compared the N2O concentration upstream and downstream of the WWTPs in order to assess the impact of WWTPs on N2O emission, which could help to constrain the emission factor associated with the WWTP effluents.
The Potomac River is a major tributary of the Chesapeake Bay – the largest estuary in the United States. The Potomac River estuary is located in a highly populated area, mainly surrounded by Washington, DC, and the states of Virginia and Maryland in the eastern United States. The annual mean discharge of the Potomac River from 1895 to 2002 measured at the Chain Bridge near Washington, DC, was 321 m3 s−1 with a large interannual variability (Jaworski et al., 2007). The annual total nitrogen loading was estimated to be around 27.7×10⁶ kg N yr−1 in 2008–2009 (Bricker et al., 2014). The Potomac River estuary has experienced ecological degradation for decades partly due to excess nutrient inputs including from the effluents of WWTPs (Bricker et al., 2014; Jaworski et al., 2007). For example, the Blue Plains Advanced WWTP in Washington, DC, is one of largest WWTPs in the world, treating an average of ∼ 1.4×10⁹ L of water per day. Pioneering work in 1978 showed that Blue Plains WWTP was a large source of nitrogen to the Potomac River estuary, triggering high N2O production and concentration downstream (McElroy et al., 1978). Thanks to higher standards mandated by governmental agencies (nitrogen concentration in effluents below 7.5 mg L−1) starting in the 1980s and the technical improvements in N removal from the wastewater, the nitrogen concentration in effluents of WWTPs in the Potomac River has decreased substantially (Pennino et al., 2016). However, the concurrent effect on N2O concentration is largely unknown. The Department of Environmental Quality (DEQ) of Virginia maintains an approximately monthly routine monitoring program for water quality (e.g., nitrogen concentration, phosphorus concentration, chlorophyll concentration) and physical properties (e.g., temperature, salinity, pH, and dissolved oxygen concentration) in the Potomac River estuary but not for N2O. Therefore, we collaborated with the DEQ of Virginia to measure the spatial and temporal variation of N2O concentrations in the Potomac River estuary.
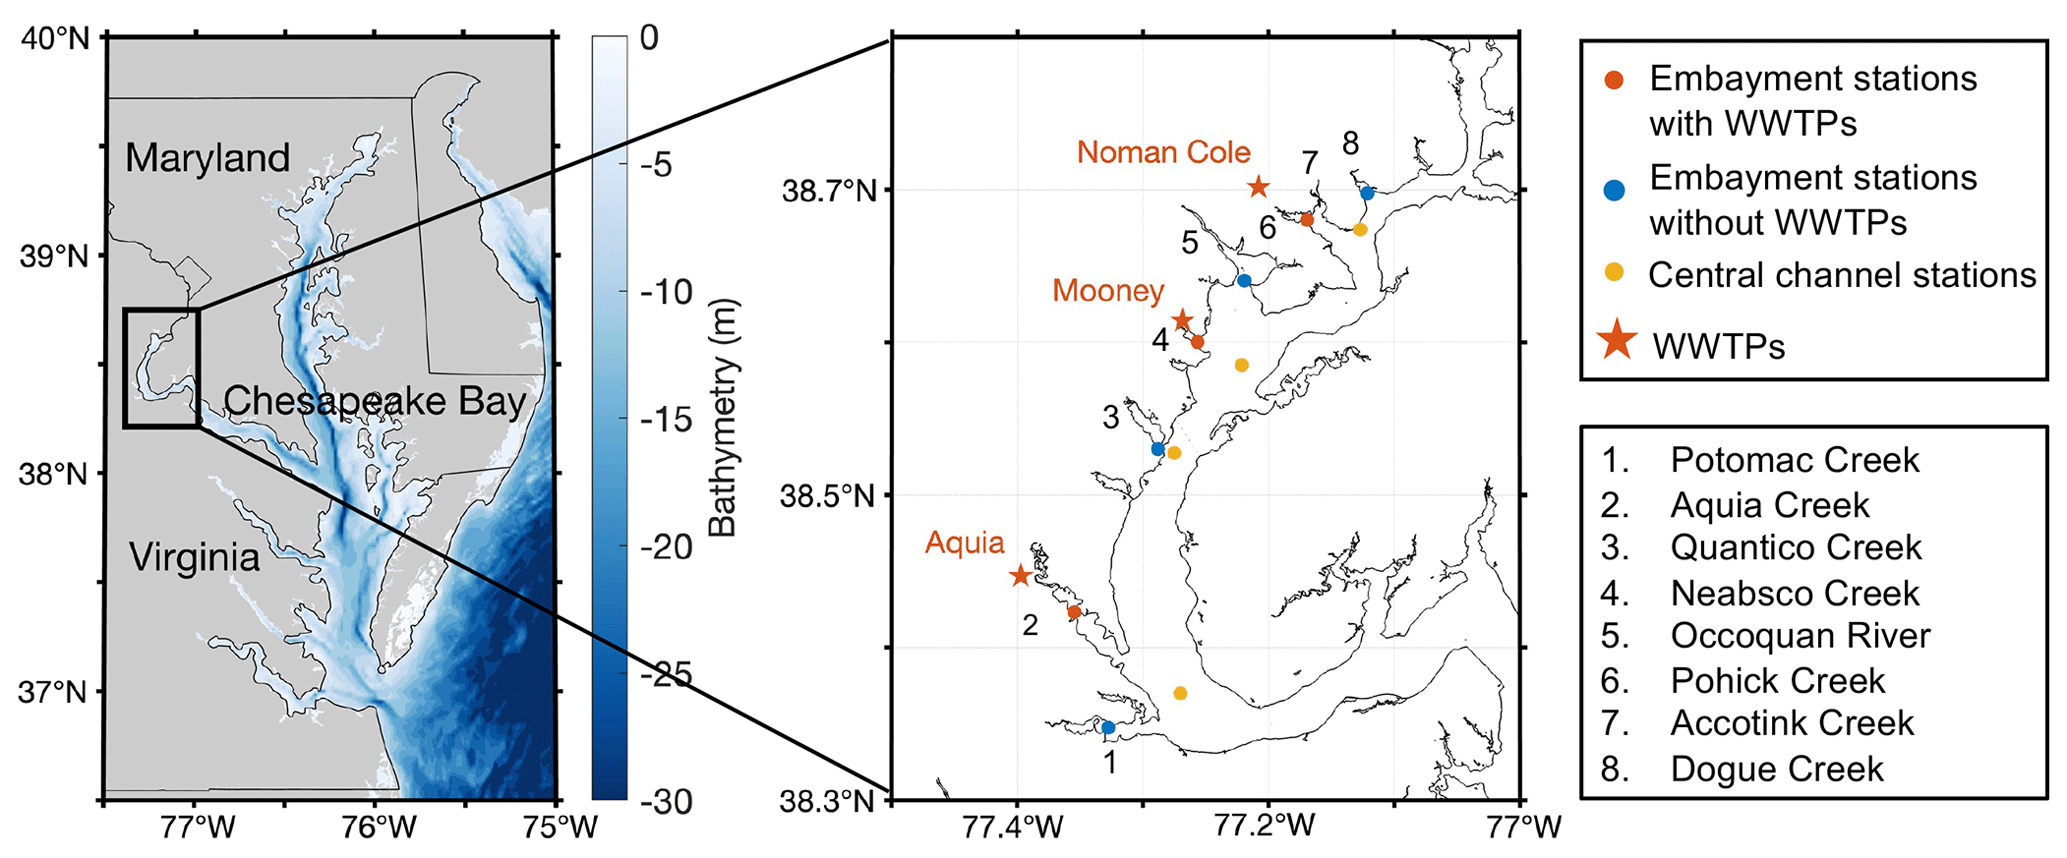
Figure 1Sampling stations in the Potomac River estuary including embayment stations with WWTPs (red circles) and without WWTPs (blue circles) and central channel stations (yellow circles). Locations of WWTPs (Noman Cole, Mooney, and Aquia) are shown in red stars. Creeks/rivers with sampling stations are numbered in the map with names shown in the legend. Stream sampling sites upstream and downstream of WWTPs in creeks 4–7 are shown in Fig. 4 below.
2.1 Sample collection for N2O and nutrients
Surface waters at ∼0.5 m depth at 11 stations in the tidal Potomac River estuary were sampled monthly or bimonthly (depending on the weather) on a vessel (Grady-White 208) for the analysis of DIN concentration and both concentration and nitrogen isotopes of N2O from April 2022 to May 2023 (Fig. 1). The 11 stations are characterized into 3 groups: embayment downstream of WWTPs, embayment not associated with WWTPs, and the central channel of the Potomac River. Three embayment stations downstream of WWTPs are associated with three different WWTPs: Noman Cole, Mooney, and Aquia, all of which implement tertiary treatment of the wastewater. We obtained the volume discharge and total N in treated water of each WWTP from the discharge monitoring report required by the Virginia Pollutant Discharge Elimination System permit. Noman Cole WWTP discharges ∼ 1.4×10⁸ L of water and 370 kg N d−1 into the Pohick Creek. Mooney WWTP discharges ∼ 5.5×10⁷ L of water and 147 kg N d−1 into the Neabsco Creek. Aquia WWTP discharges much less water and N into the Aquia Creek (∼ 2.1×10⁷ L per day and 35 kg N d−1). The distances from the embayment stations downstream of WWTPs to Noman Cole, Mooney, and Aquia WWTPs were approximately 4, 1.8, and 5.8 km, respectively.
The embayment stations were 2–3 m deep, while the average depth of central channel stations was around 8 m. The embayment stations have been routinely sampled for water quality analyses by the DEQ of Virginia since the early 1970s. The central channel stations were added for this study. The purposes of this sampling design are to evaluate the impact of WWTPs on downstream distribution of DIN and N2O and to compare DIN and N2O concentrations between the edge and central channel of the river. The central channel is likely affected both by the Potomac mainstem flow and by the input from tributaries, while the embayment stations may be mainly affected by water flow from tributaries but also influenced by the tidal cycle (see the salinity change in Fig. S1b in the Supplement). While estuarine N2O concentrations could be affected by tides (Gonçalves et al., 2015), sampling was not always conducted at the same tidal state due to logistic difficulties. Triplicate water samples for N2O concentrations and isotopes were collected via a submersible pump into 60 mL serum bottles after overflowing 3 times the bottle's volume. After removing 3 mL water to create a 3 mL air headspace via a syringe, the serum bottles were immediately sealed with butyl stoppers and aluminum crimps and preserved with 0.5 mL of 10 M NaOH solution to stop biological activities. NaOH has been shown to be an effective and less environmentally hazardous preservative for N2O and nutrient analysis (Frame et al., 2016; Wong et al., 2017).
In addition to the routine sampling in the Potomac River estuary, we also sampled its tributaries, some of which were associated with the WWTPs, on 18 May 2023 (Fig. 1) to specifically evaluate the impact of WWTPs on downstream N2O concentrations. Four creeks/rivers were sampled, including the Neabsco Creek (five stations: two stations upstream and three stations downstream of Mooney WWTP), the Occoquan River (three stations, no WWTP), the Pohick Creek (four stations: two stations upstream and two stations downstream of Noman Cole WWTP), and the Accotink Creek (two stations, no WWTP). Because Aquia WWTP discharges much less water and N into the Aquia Creek, its impact was not specifically investigated. Since water depths of these creeks/rivers were shallow, the water samples were collected by directly submerging 60 mL serum bottles into the surface water (∼0.1 m) and preserving them as described above.
Besides N2O sampling, temperature, salinity, and dissolved O2 concentrations were recorded via a YSI EXO1 sonde. Chlorophyll-a samples (300 mL) were filtered onto GF/F filters and kept on ice in a cooler. The filters were then kept frozen at −20°C in the lab until analysis within 3 months (Arar and Collins, 1997). One additional sample for total nitrogen and phosphorus (both particulate and dissolved) was collected into 250 mL HDPE bottles and kept on ice in a cooler until analysis within 48 h on land (Rice et al., 2012; US EPA, 1974). Total nitrogen is the sum of total Kjeldahl nitrogen and nitrite plus nitrate.
2.2 Measurement of N2O and nutrient concentrations
N2O in the serum bottles was stripped by helium carrier gas into a DELTA V Plus mass spectrometer (Thermo Fisher Scientific) for the analyses of N2O concentration and isotope ratio (, 45, 46) (Tang et al., 2022). The total amount of N2O in the serum bottles was determined using a standard curve of N2O peak area with N2O standards containing a known amount of N2O reference gas (0, 0.207, 0.415, 0.623, 0.831, 1.247 nmol N2O). The total amount of N2O dissolved in the water was calculated after subtracting the amount of N2O in a 3 mL air headspace. The amount of N2O in a 3 mL air headspace was generally less than 4 % of the amount of N2O dissolved in the 57 mL water samples. The N2O concentration in samples was then calculated from the total amount of N2O dissolved in the water divided by the volume of water in the serum bottles. The detection limit and precision of N2O concentration measurement were 1.29 and 0.33 nM, respectively. We used N2O produced from nitrate isotope standards (USGS34 and IAEA =4.7 ‰) to calibrate for δ15N of N2O samples. We then estimated N2O saturation (%): . The equilibrium N2O concentration () was calculated based on the solubility of N2O and atmospheric N2O concentrations (Weiss and Price, 1980). The monthly atmospheric N2O concentrations were obtained from the nearby atmospheric station in Brentwood, Maryland (https://gml.noaa.gov/, last access: 8 May 2024) (Andrews et al., 2023).
After analyzing N2O concentration, samples were neutralized to a pH of ∼7 by adding 10 % hydrochloric acid. NO NO (NO) concentration in these samples was measured using the vanadium (III) reduction method by converting NO to NO, which was then quantified by a chemiluminescence analyzer (Braman and Hendrix, 1989). The detection limit of NO concentration was 0.15 µM. NH and NO concentrations were measured at a few selected stations using the fluorometric ortho-phthalaldehyde method (Holmes et al., 1999) and the colorimetric method (Hansen and Koroleff, 1999), respectively. Their concentrations were much smaller than NO alone, mostly accounting for less than 10 % of the DIN concentration. Therefore, we only present NO data in this study.
2.3 N2O flux calculation
Surface N2O flux was calculated using the following equation: . The gas transfer velocity (k) was estimated based on three different parameterizations: (Raymond and Cole, 2001), (Jiang et al., 2008), and (Wanninkhof, 2014). U is the wind speed at the 10 m height obtained from the National Centers for Environmental Prediction (NCEP) reanalysis (Kalnay et al., 1996; https://psl.noaa.gov/data/gridded/data.ncep.reanalysis.html, last access: 8 May 2024). Sc is the Schmidt number that could be estimated as a function of temperature (Wanninkhof, 2014). Since our samples have a salinity close to 0, we used the parameterization of Sc for freshwater. Average values of the three N2O flux estimates are presented in the paper, and N2O fluxes estimated by different parameterizations are provided in the associated dataset. We acknowledge large variations in estimating k values in the riverine and estuarine systems by using different empirical models (Raymond and Cole, 2001; Borges et al., 2004; Rosentreter et al., 2021). For instance, the effect of water velocity and water depth on gas transfer velocity was not considered in the parameterizations above. Therefore, we focus on evaluating the spatiotemporal variations in N2O fluxes and their driving factors instead of their absolute magnitude.
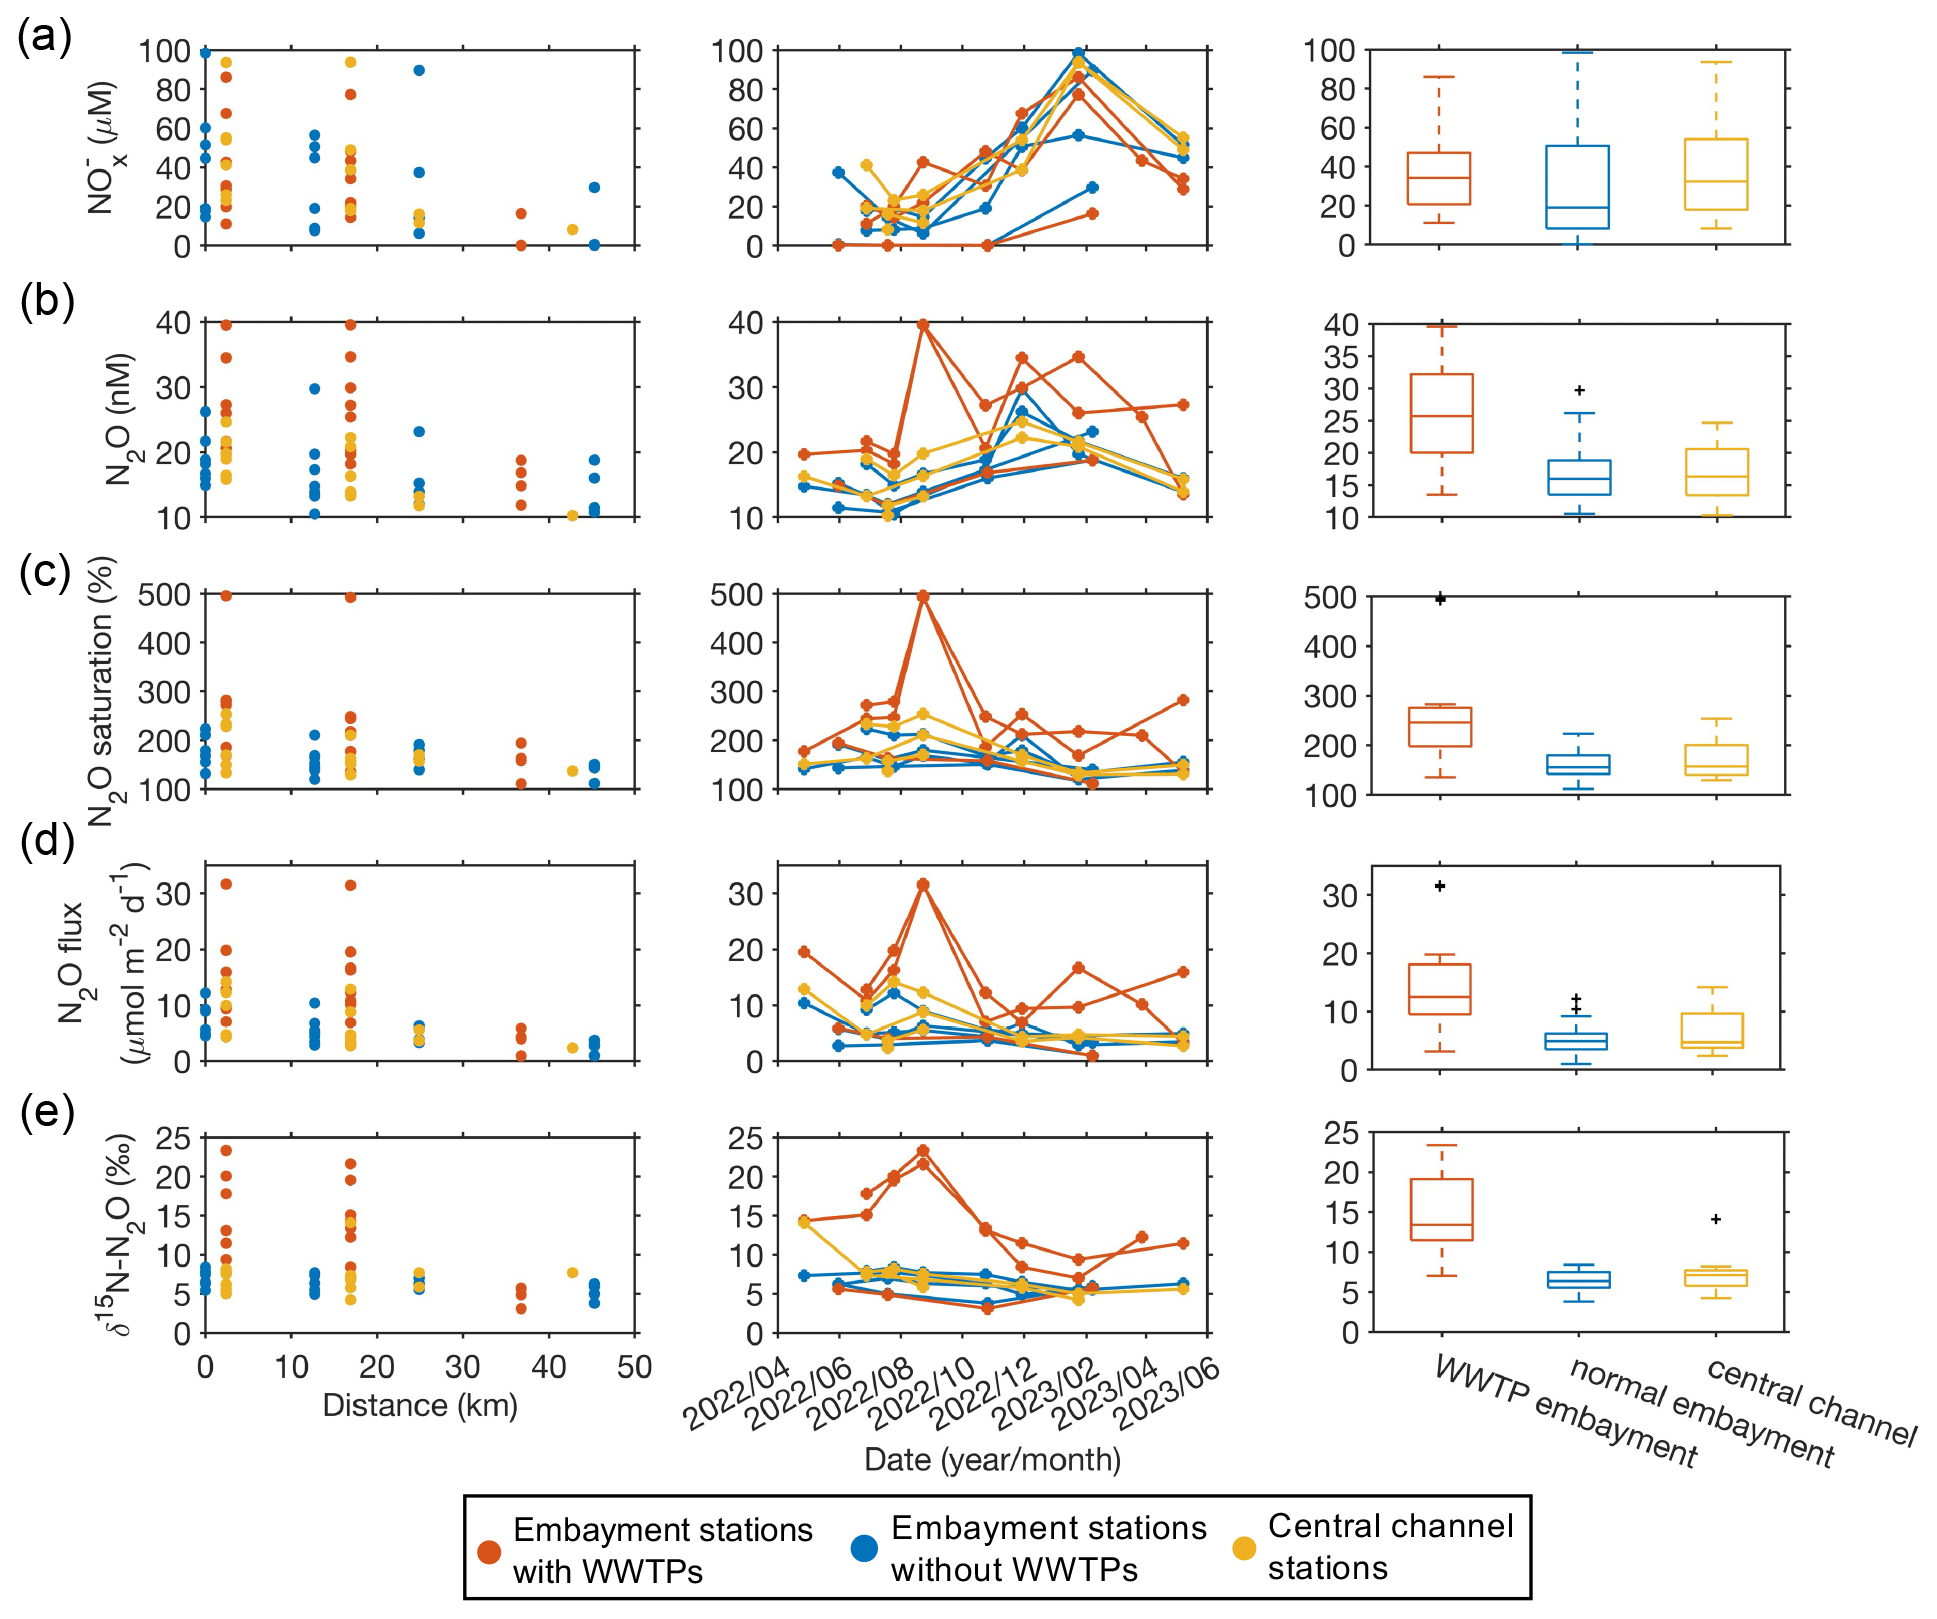
Figure 2Spatial and temporal variations of NO concentration (a), N2O concentration (b), N2O saturation (c), N2O flux (d), and δ15N of N2O (e). The distance shows, from upstream to downstream, stations in the Potomac River. Embayment stations with WWTPs (red circles and lines) and without WWTPs (blue circles and lines) and central channel stations (yellow circles and lines). For the boxplots, the red line in each box is the median. The bottom and top of each box are the 25th and 75th percentiles of the observations, respectively. The error bars represent 1.5 times the interquartile range away from the bottom or top of the box, with black + signs showing outliers beyond that range. Embayment stations associated with WWTPs had significantly higher N2O concentration, N2O saturation, N2O flux, and δ15N values compared to other stations (p<0.01, t test) but not a significantly different NO concentration.
3.1 Spatial and temporal variations of N2O concentrations in the Potomac River estuary
Along the roughly 50 km sampling transect in the Potomac River estuary, NO concentration decreased from 98 to <1 µM from upstream to downstream (Fig. 2a). NO concentration showed a clear seasonal pattern: higher in winter and spring while lower in summer and fall. The spatial and temporal patterns were likely attributable to the distribution of nutrient sources into the Potomac River, DIN uptake, and other removal processes along the river (Glibert et al., 1995; Carstensen et al., 2015). For example, the maximum N loading into the Chesapeake Bay occurs in winter and spring (Da et al., 2018). Meanwhile, N2O concentration decreased from approximately 40 to 10 nM along the sampling transect and was higher in the fall and winter (Fig. 2b). Since temperature decreased from ∼31°C in summer to 4°C in winter (Fig. S1a), the increase in N2O solubility in colder water during winter partly explained the seasonal change. In contrast, N2O saturation had higher values in summer and fall (Fig. 2c), suggesting a higher N2O production in summer and fall. It is worth noting that N2O saturation was above 100 % at all sampling stations with a maximum reaching 500 %, indicating the Potomac River estuary was a consistent and strong source of N2O to the atmosphere. N2O fluxes ranged from 1 to 31.7 µmol N2O m−2 d−1, generally decreasing from upstream to downstream (Fig. 2d). N2O fluxes showed a similar seasonal pattern to N2O saturation: higher in summer and fall. N2O concentrations (median: 18.2 nM) and fluxes (median: 5.6 µmol N2O m−2 d−1) in the Potomac River estuary were substantially higher than in the mainstem of the Chesapeake Bay (2.6 to 20.9 nM N2O with a median value at 10.6 nM and −0.3 to 4.3 µmol N2O m−2 d−1 with a median at 0.5 µmol N2O m−2 d−1; Tang et al., 2022; Laperriere et al., 2019). Therefore, the tributaries (i.e., the Potomac River) are more intense sources of N2O to the atmosphere than mainstem of the bay.
Stations close to each other had similar NO concentrations (e.g., upstream stations > downstream stations), regardless of station category (i.e., with WWTP, without WWTP, central channel of the Potomac River). In contrast, N2O concentrations and fluxes varied within locations according to the station category: N2O concentrations and fluxes were substantially higher at stations downstream of WWTPs (p<0.01, t test). N2O concentrations and fluxes were similar between stations in embayments without WWTPs and the central channel (Fig. 2). This suggests these WWTPs are efficient in removing DIN from sewage and other sources, but WWTPs may discharge N2O directly into the effluent or enhance downstream N2O production (e.g., higher N2O production yield from the same amount of DIN). This effect extended to our sampling stations ∼1.8–4 km downstream of the WWTPs. However, the effect of WWTPs on downstream N2O varied among stations. For example, elevated N2O concentrations were observed downstream of Noman Cole and Mooney WWTPs but not downstream of Aquia WWTP. This difference may be related to the different N removal processes of WWTPs that produce N2O at different yields (de Haas and Andrews, 2022; Zhao et al., 2024). However, we do not have detailed information about the three WWTPs other than that they all implement tertiary treatment. In addition, the different dilution factors by riverine discharges also matter. For example, the volume of effluent from Mooney WWTP was higher than the discharge of the Neabsco Creek, while the volume of effluent from Aquia WWTP was generally lower than the discharge of the Aquia Creek (Fig. S2a and b). Particularly, the highest N2O concentration of up to 40 nM was found at two stations downstream of the Noman Cole and Mooney WWTPs on 23 August 2022 when the river discharge was low (Fig. S2). Thus, the effect of WWTPs on downstream N2O concentrations also varies seasonally (Schulz et al., 2023; Murray et al., 2020), with a relatively more important role in the dry season. Repeated spatial and temporal sampling allowed us to capture these N2O hotspots. Previous studies have shown the impact of WWTPs on downstream N2O concentrations and emissions in aquatic environments. For example, the highest N2O concentration of ∼675 nM in the Potomac River was measured near the discharge of the Blue Plains WWTP in 1977 (McElroy et al., 1978). The highest N2O emissions in the Ohio River near Cincinnati were attributed to direct input of N2O from WWTP effluents (Beaulieu et al., 2010).
In addition, a higher nitrogen isotopic signature (δ15N) of N2O associated with WWTPs (median δ15N at 13 ‰) also suggests the distinct sources or cycling processes of N2O compared to stations of the central channel and without the influence of WWTPs (median δ15N of N2O at 6 ‰; Fig. 2e) in the Potomac River estuary. In comparison, the average δ15N of N2O in the tropospheric air is around 6.55 ‰ (Snider et al., 2015). δ15N of N2O for stations with the influence of WWTPs showed a clear seasonal variation: higher in summer than in winter (Fig. 2e). This seasonal difference may be related to the seasonal change in the relative importance of WWTP effluents versus riverine discharge (Fig. S2c). For example, a relatively larger WWTP effluent volume compared to the riverine discharge led to a larger δ15N of N2O in summer. However, no clear seasonal pattern of δ15N of N2O was seen for stations without the influence of WWTPs. δ15N of N2O produced in WWTPs depends on the treatment stages and aeration conditions (Toyoda et al., 2011; Tumendelger et al., 2014). For example, the average δ15N values were reported to be −24.5 ‰ and 0 ‰, respectively, for N2O produced from nitrification during oxic treatment versus N2O produced from anaerobic denitrification in a California WWTP (Townsend-Small et al., 2011). The δ15N values of N2O in these urban WWTPs were lower than those found in waters downstream of WWTPs in the Potomac River (median δ15N at 13 ‰). One of the reasons for the increased δ15N of N2O may be partial N2O reduction via denitrification in the WWTPs, in downstream creeks, or in sediments; this denitrification effect has been seen in the marine oxygen minimum zones (Kelly et al., 2021). Denitrification as the cause of the elevated δ15N is partly supported by the higher δ15N of N2O when NO was reduced to less than 40 µM, suggesting the occurrence of N2O reduction when the concentration of other denitrification substrates became low (Fig. S3). However, we do not know the exact locations where denitrification occurred (e.g., WWTPs, anoxic niches in suspended particles, sediments), which deserves further investigation. The influence of denitrification on unique isotopic signatures of N2O produced from WWTPs has also been observed in the Tama River in Japan (Toyoda et al., 2009).
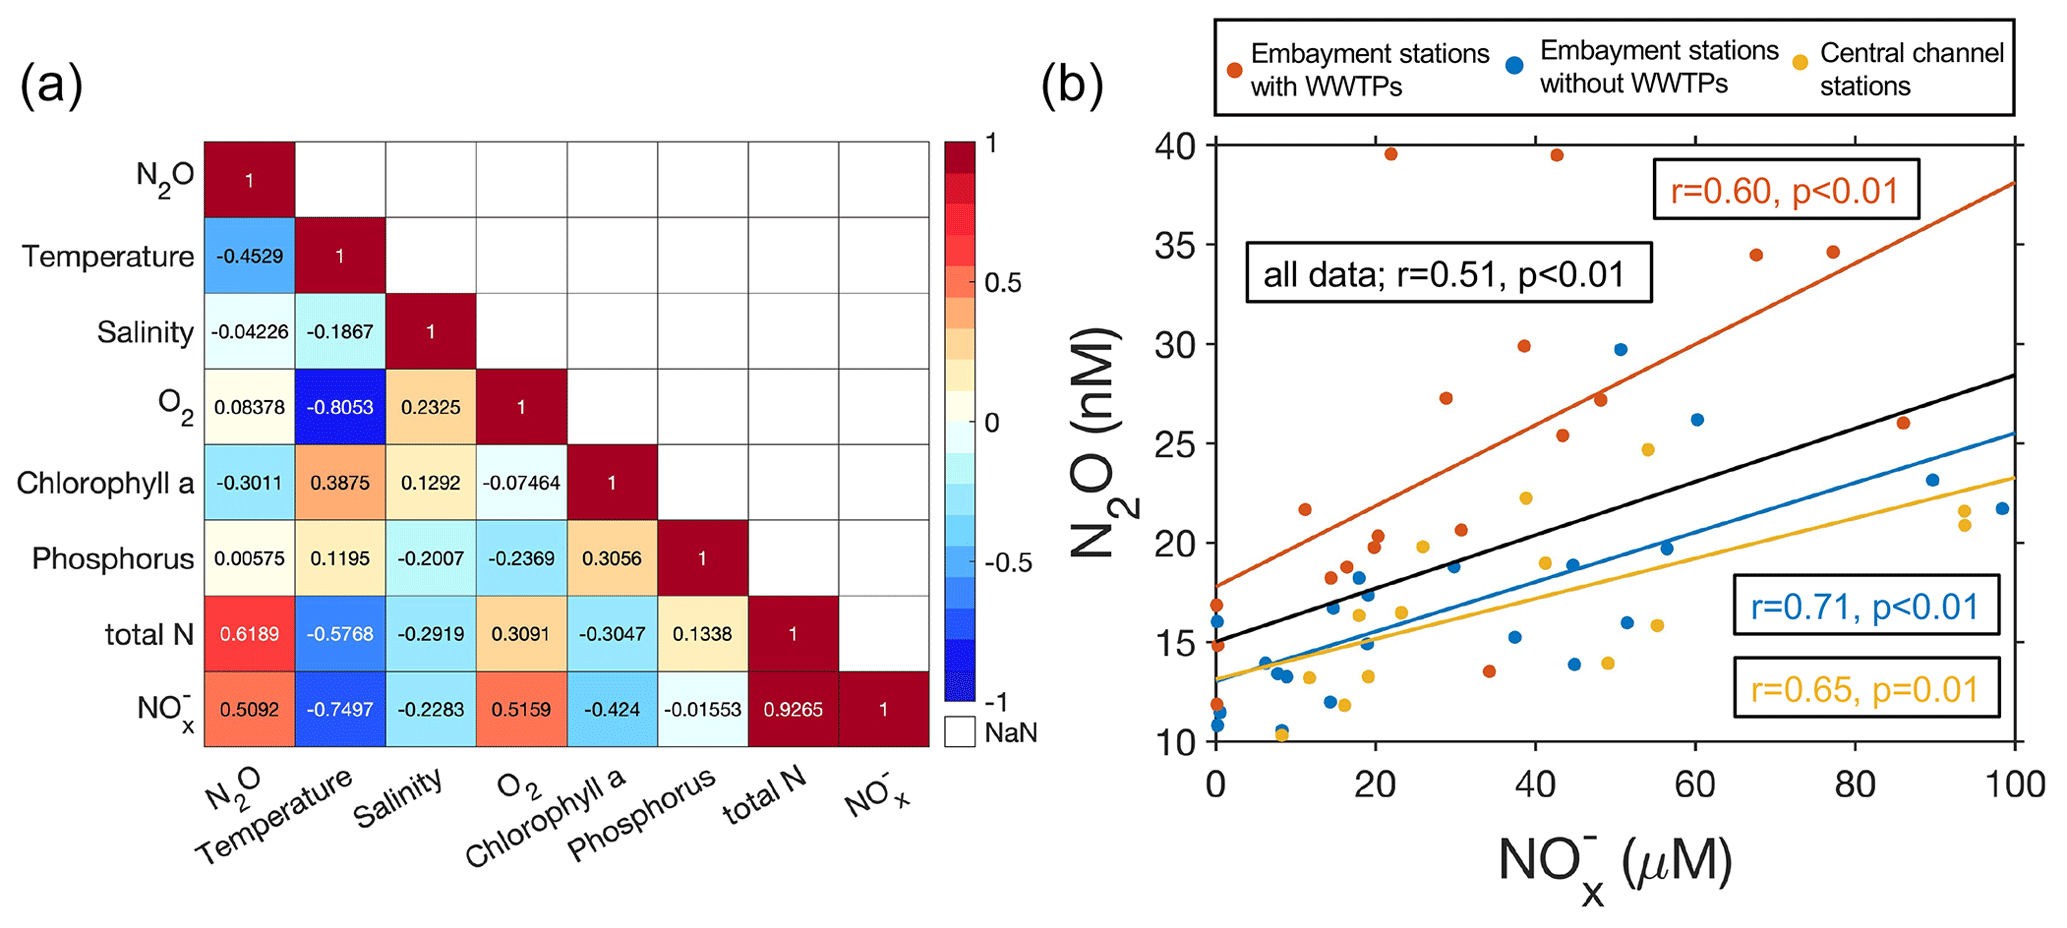
Figure 3(a) Correlation coefficients among different environmental factors and N2O concentrations. (b) Relationship between N2O and NO concentrations at different categories of sampling stations.
3.2 Environmental controls on N2O concentrations
N2O concentrations showed positive correlations with total N (r=0.62, p<0.01) and NO concentrations (r=0.51, p<0.01) (Fig. 3a). Correlation analyses done separately for stations with or without WWTPs had similar patterns (Fig. S4). A better correlation between the N2O concentration and total N may indicate the contribution of other N sources besides NO to N2O production. N2O could be produced from nitrification in the process of oxidizing NH to NO in the oxic environment as previously shown in the oxygenated mainstem of the Chesapeake Bay (Tang et al., 2022). However, we cannot exclude the possibility of N2O production from denitrification associated with anaerobic microsites in particles or in sediment (Beaulieu et al., 2011; Wan et al., 2023). Future investigations with 15N tracers should be conducted to differentiate N2O production pathways around the WWTPs. Furthermore, N2O concentration was negatively correlated with temperature since higher temperature reduced the N2O solubility. Although previous studies have showed dissolved oxygen to be an important driver of N2O concentrations or fluxes in rivers and estuaries (Rosamond et al., 2012; Wang et al., 2015; Zheng et al., 2022), we did not find a strong dependence of N2O on oxygen concentrations in the Potomac River estuary (Fig. 3a). This lack of strong dependence is probably because of the overall oxygenated conditions (Fig. S1c) and opposite correlations found in stations without WWTPs (positive) versus in stations with WWTPs (negative) (Fig. S4), which may be influenced by the different N2O production pathways.
The significant positive relationship between N2O and NO concentration existed for samples collected at stations from all three different categories (Fig. 3b). N2O concentrations at stations downstream of WWTPs were notably higher than at other stations not associated with WWTPs even in the similar range of NO concentration. The larger slope of N2O concentration versus NO concentration at stations downstream of WWTPs may be related to the direct input of N2O from WWTPs into the downstream waters or different N2O production pathways and production yields that deserve further investigation. The DIN concentration has been found to be a good predictor of N2O concentration and emission in many other rivers and estuaries (Murray et al., 2015; Reading et al., 2020; Zheng et al., 2022). However, the correlation varied spatially, which may be affected by the variable N2O emission factors from DIN cycling. The emission factors are affected by temperature, concentration, and forms of N, oxygen, and organic carbon concentration, among other factors (Hu et al., 2016). The external N2O input (e.g., input from WWTPs) could also affect the relationship between N2O and DIN concentrations (Dong et al., 2023). Compared to DIN (∼28 to 71 µM) and N2O concentrations (∼16 to 61 nM) measured approximately 45 years ago in the same section of the Potomac River (McElroy et al., 1978), current DIN and N2O concentrations have slightly decreased. Thus, an additional benefit of nutrient regulation is the reduction of greenhouse gas – N2O – emissions, beyond improving water quality.
Since N2O concentrations had the strongest correlation with total N concentrations (reflecting the N2O production potential) and temperature (affecting N2O solubility), we developed a predictive model of N2O concentration based on total N and temperature. Predictions were performed separately for stations with WWTPs (, n=18, r=0.78; p<0.01) and without WWTPs including central channel stations (, n=23, r=0.81, p<0.01). The observed N2O variability was generally captured by these simple linear models (Fig. S5), but there were variabilities in the observations remaining to be explained. The addition of other predictors did not significantly improve the model performance, so we chose a simple predictive model that is mechanistically understandable. We then applied the two predictive models separately to estimate N2O concentrations at the embayment station in the Pohick Bay (with WWTP) and the embayment station in the Occoquan Bay (without WWTP) using the total N concentration and temperature that were measured since 2008 by the DEQ of Virginia monitoring program (Figs. S6 and S7). Predicted N2O concentrations showed a clear seasonality: higher in winter and lower in summer. N2O concentrations in the Pohick Bay decreased substantially (−0.9 nM yr−1) possibly due to the nutrient reduction (total N concentration decreasing at 8.8 µM yr−1) over the last 14 years (Fig. S6). However, N2O concentrations in the Occoquan Bay only decreased slightly (−0.1 nM yr−1, not statistically significant) along with the minor nutrient reduction (total N concentration decreasing at non-statistically significant rate of 0.5 µM yr−1) (Fig. S7). Continuation of environmental monitoring in the Potomac River (e.g., N nutrients and temperature), which is much easier than sampling and measuring N2O gas, could be used to indirectly estimate the changes in N2O concentrations in the future. These predictors are likely to be important in other estuaries, but the weighting would vary among locations.
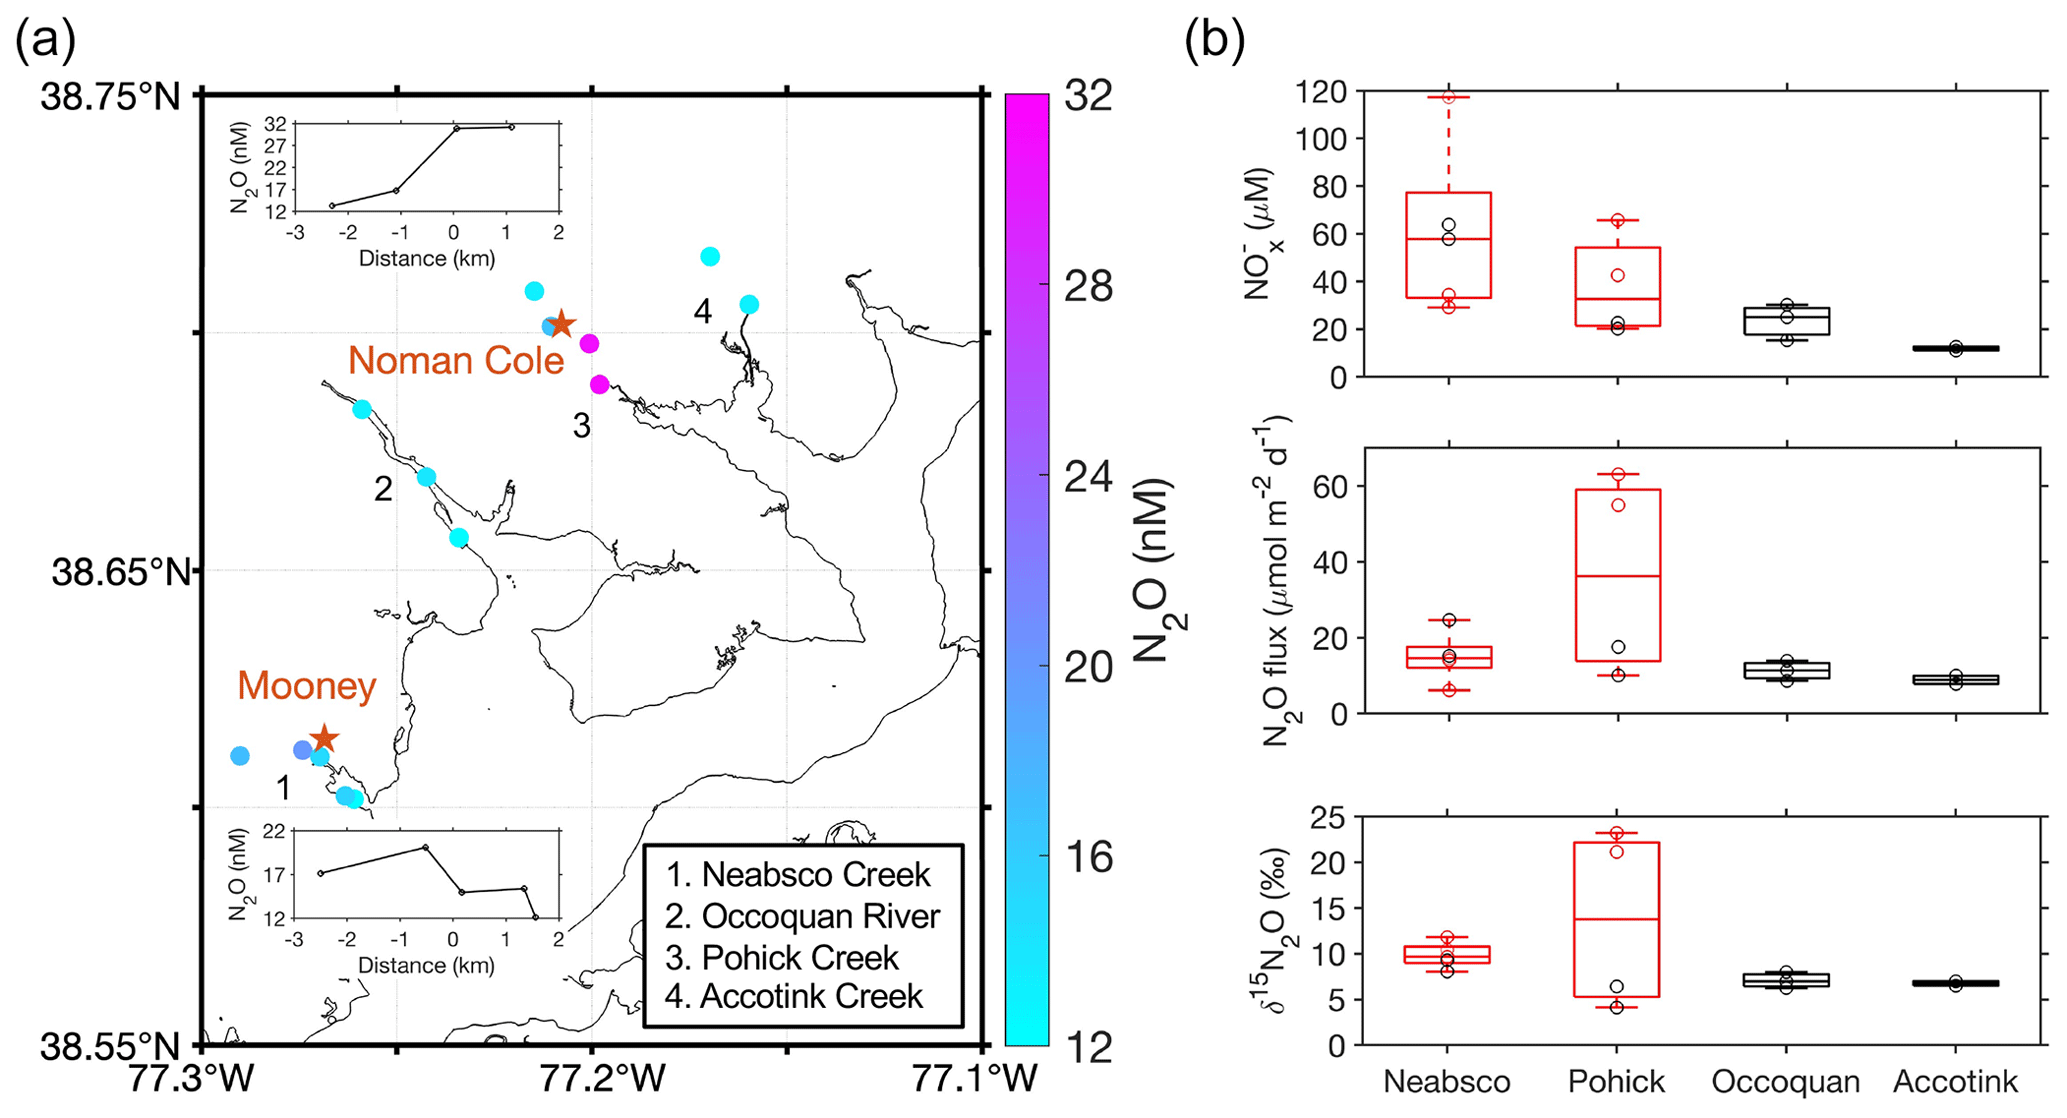
Figure 4(a) Color-coded N2O concentration at creek sampling stations on 18 May 2023. WWTPs (Mooney and Noman Cole) are shown in red stars. The inset figures show the change in N2O concentrations as a function of distance upstream or downstream of the WWTPs. Creeks/rivers with sampling stations are numbered in the map with names shown in the legend. (b) Boxplots of NO, N2O flux, and δ15N of N2O comparing four creeks. Neabsco and Pohick Creeks with WWTPs are displayed with red color boxes. Red circles in the boxplots show data points of stations downstream of WWTPs, and black circles show data points of stations upstream of WWTPs or without the influence from WWTPs. NO, N2O flux, and δ15N of N2O were clearly higher at stations downstream of the WWTP in the Pohick Creek.
Table 1Global N2O observations in aquatic systems associated with wastewater treatment plants. N2O data are presented in concentration (nM), saturation (%), or flux (µ mol N2O–N m−2 d−1) according to how they are reported in different studies.
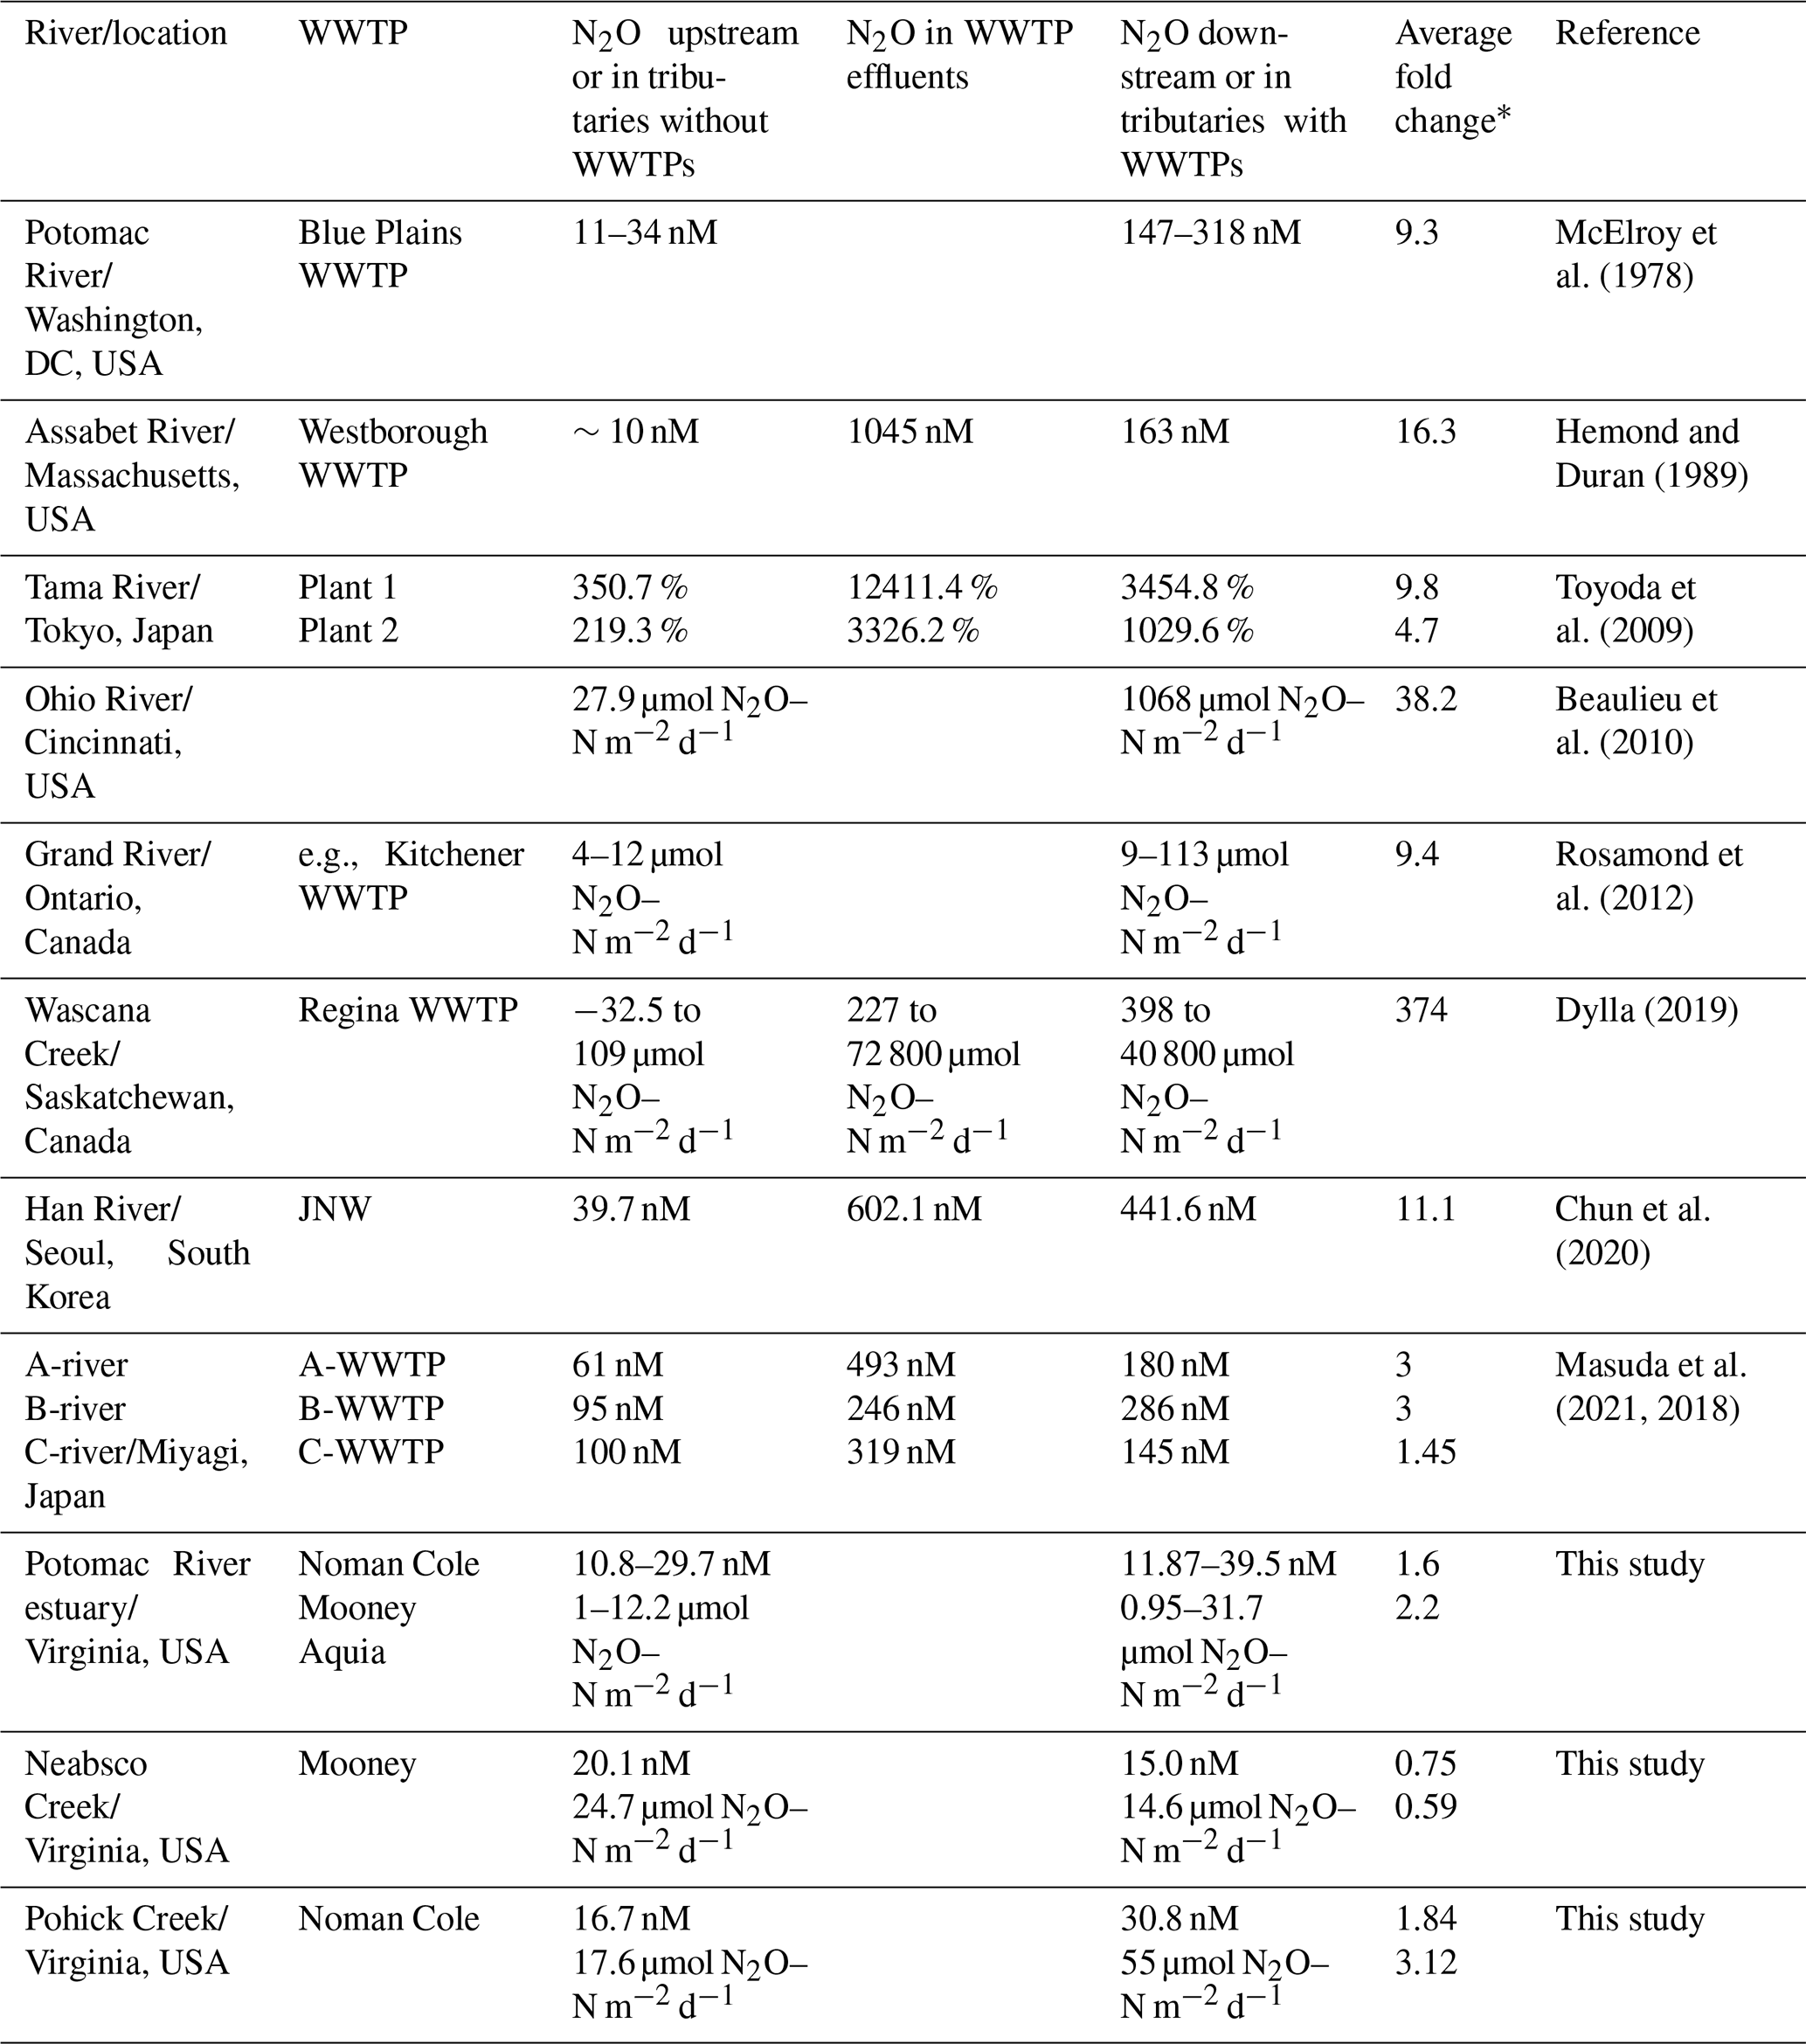
* Downstream vs. upstream.
3.3 Impact of wastewater treatment plants on N2O concentrations and emissions
To further evaluate how WWTPs affect the N2O distribution in the Potomac River, we measured N2O concentrations upstream and downstream of the two WWTP effluents (Mooney and Noman Cole in the Neabsco Creek and the Pohick Creek, respectively) and compared them to N2O concentrations measured in two creeks that do not have WWTPs (Fig. 4a). Interestingly, the N2O concentration and flux at the station downstream of Mooney WWTP in the Neabsco Creek were lower than the N2O concentration and flux at the station upstream of Mooney WWTP (15.0 nM vs. 20.1 nM; 14.6 µmol m−2 d−1 vs. 24.7 µmol m−2 d−1). The exact mechanisms were not clear, but one of the potential reasons could be the influence of tidal cycles: high tide during the sampling time (salinity was 0.17 instead of 0) may have reversed the water flow and diluted the WWTP effluent with low N2O concentration Potomac water (12.1 nM at the outflow of the Neabsco Creek into the Potomac River estuary). In contrast, we found a substantially higher N2O concentration and flux downstream of the Noman Cole WWTP than in the upstream station (30.8 nM vs. 16.7 nM; 55 µmol m−2 d−1 vs. 17.6 µmol m−2 d−1) in the Pohick Creek, which is less affected by the tidal cycle due to its semi-closed geography (salinity was 0.12). The high downstream N2O concentration and flux may suggest the direct addition of N2O from WWTP effluent to the downstream environment. Furthermore, δ15N values of N2O in stations downstream of WWTPs were generally higher than in the other two creeks that do not have WWTPs (Fig. 4b), confirming the distinct source of N2O production by WWTPs found in the Potomac River estuary. Overall, the influence of WWTP effluents on downstream distribution of N2O is variable and could be affected by the physical movement of water.
Dong et al. (2023) evaluated the potential impact of wastewater nitrogen discharge on estuarine N2O emissions globally. Here we compiled data from previous studies with direct N2O measurements in aquatic systems associated with WWTPs (not included in Dong et al., 2023) to assess the global impact of WWTPs on aquatic N2O concentrations or emissions (McElroy et al., 1978; Hemond and Duran, 1989; Toyoda et al., 2009; Beaulieu et al., 2010; Rosamond et al., 2012; Chun et al., 2020; Masuda et al., 2021, 2018; Dylla, 2019). WWTP effluents and water downstream of the WWTPs contain some of the highest N2O concentrations and fluxes observed in the aquatic system (Table 1 and Fig. S8). For example, up to 12 411.4 % saturation of N2O was measured in the effluent of WWTPs in the Tama River in Japan (Toyoda et al., 2009). In addition, N2O flux up to 40 800 µmol N2O–N m−2 d−1 was found downstream of the Regina WWTP in the Wascana Creek in Canada (Dylla, 2019). The downstream N2O flux was >300 times higher than the N2O flux upstream of the Regina WWTP. In comparison, the maximum N2O saturation and flux previously reported in a global riverine N2O dataset were around 2500 % and 12 754 µmol N2O–N m−2 d−1 (Hu et al., 2016). Across the sites listed in Table 1, N2O concentration/saturation/flux downstream of the WWTPs was 1.45 to 374-fold of the upstream waters. The only exception was our observed decrease in N2O concentrations downstream of Mooney WWTP on 18 May 2023, which was likely influenced by the tidal cycle. The wide range of apparent WWTP effect is related to many factors including the variable N2O emission factors in the WWTPs, the ratio of WWTP effluent volume to riverine discharge, the distance from the WWTPs where measurements were conducted, and the direction of water flow (e.g., tidal cycle). In addition, the estuarine type, mixing regime, and stratification are also important factors controlling N2O emissions (Brown et al., 2022). Overall, failing to account for N2O emissions downstream of the WWTPs and their variability would substantially bias estimates of aquatic N2O emissions. This uncertainty is increased by the fact that only a few observations are available (all in the Northern Hemisphere) (Fig. S8) compared to >58 000 WWTPs present globally (Ehalt Macedo et al., 2022). It is also important to restrict the N2O emission via efficient N2O reduction in the WWTPs considering the projected increase in future wastewater production (Qadir et al., 2020).
Taking advantage of the routine water monitoring program by the DEQ of Virginia, we detected strong spatial and temporal variabilities of N2O concentrations and emissions in the Potomac River estuary, a major tributary of the Chesapeake Bay. Observations across the Potomac River estuary also allowed us to identify hotspots of N2O emissions associated with WWTP effluents. Higher N2O concentrations downstream of WWTPs compared to regions with similar nitrogen nutrient concentrations suggested the direct discharge of dissolved N2O from WWTPs and/or intense N2O production. The influence of WWTPs on downstream N2O concentrations and emissions is largely affected by volumes of river discharge versus WWTP effluents. A survey of globally available data shows N2O concentrations or emissions are consistently elevated in waters downstream of WWTPs. Future 15N tracer incubations would help to explain the high N2O concentration downstream of WWTPs by disentangling the N2O production pathways. In addition, concurrent measurements of the N flux and N2O concentration downstream of WWTPs will help to constrain overall N2O emission factors associated with WWTPs. Our work could encourage potential collaborations between the scientific community, governmental agencies, and the public to better observe environmental pollution or water quality, e.g., increasing the frequency and resolution of observations of N2O and other greenhouse gases along with many regularly monitored environmental factors like temperature and nutrients. Such efforts may identify previously overlooked sources of N2O emissions and help to better estimate N2O emissions from aquatic systems.
Data presented in this study have been deposited in the Zenodo repository: https://doi.org/10.5281/zenodo.11492525 (Tang et al., 2024).
The supplement related to this article is available online at: https://doi.org/10.5194/bg-21-3239-2024-supplement.
WT conceived the study. JT, TJ, and WT collected N2O samples from the Potomac River estuary. WT analyzed samples and interpreted data with other coauthors. WT wrote the first draft of the manuscript with input from BBW. All coauthors contributed to the result discussion and manuscript writing.
The contact author has declared that none of the authors has any competing interests.
Publisher’s note: Copernicus Publications remains neutral with regard to jurisdictional claims made in the text, published maps, institutional affiliations, or any other geographical representation in this paper. While Copernicus Publications makes every effort to include appropriate place names, the final responsibility lies with the authors.
We thank Catherine Hexter for the help with water sampling in the tributaries of the Potomac River on 18 May 2023. We thank Elizabeth Wallace and Lindsay Pagaduan for analyzing the nutrient samples. We thank the Virginia Department of Environmental Quality for maintaining the routine sampling and for providing the opportunity to collect N2O samples in the Potomac River estuary. We thank the Virginia Pollutant Discharge Elimination System for providing water discharge and quality data of wastewater treatment plants.
This research is supported by Princeton University.
This paper was edited by Hermann Bange and reviewed by two anonymous referees.
Andrews, A., Crotwell, A., Crotwell, M., Handley, P., Higgs, J., Kofler, J., Lan, X., Legard, T., Madronich, M., McKain, K., Miller, J., Moglia, E., Mund, J., Neff, D., Newberger, T., Petron, G., Turnbull, J., Vimont, I., Wolter, S., and NOAA Global Monitoring Laboratory: NOAA Global Greenhouse Gas Reference Network Flask-Air PFP Sample Measurements of N2O at Tall Tower and other Continental Sites, 2005–Present, NOAA GML [data set], https://doi.org/10.15138/C11N-KD82, 2023.
Arar, E. J. and Collins, G. B.: Method 445.0: In vitro determination of chlorophyll a and pheophytin a in marine and freshwater algae by fluorescence, United States Environmental Protection Agency, Office of Research and Development, https://cfpub.epa.gov/si/si_public_record_report.cfm?Lab=NERL&dirEntryId=309417 (last access: 16 February 2024), 1997.
Beaulieu, J. J., Shuster, W. D., and Rebholz, J. A.: Nitrous Oxide Emissions from a Large, Impounded River: The Ohio River, Environ. Sci. Technol., 44, 7527–7533, https://doi.org/10.1021/es1016735, 2010.
Beaulieu, J. J., Tank, J. L., Hamilton, S. K., Wollheim, W. M., Hall, R. O., Jr., Mulholland, P. J., Peterson, B. J., Ashkenas, L. R., Cooper, L. W., Dahm, C. N., Dodds, W. K., Grimm, N. B., Johnson, S. L., McDowell, W. H., Poole, G. C., Valett, H. M., Arango, C. P., Bernot, M. J., Burgin, A. J., Crenshaw, C. L., Helton, A. M., Johnson, L. T., O'Brien, J. M., Potter, J. D., Sheibley, R. W., Sobota, D. J., and Thomas, S. M.: Nitrous oxide emission from denitrification in stream and river networks, P. Natl. Acad. Sci. USA, 108, 214–219, https://doi.org/10.1073/pnas.1011464108, 2011.
Borges, A. V., Vanderborght, J.-P., Schiettecatte, L.-S., Gazeau, F., Ferrón-Smith, S., Delille, B., and Frankignoulle, M.: Variability of the gas transfer velocity of CO2 in a macrotidal estuary (the Scheldt), Estuaries, 27, 593–603, https://doi.org/10.1007/BF02907647, 2004.
Braman, R. S. and Hendrix, S. A.: Nanogram nitrite and nitrate determination in environmental and biological materials by vanadium (III) reduction with chemiluminescence detection, Anal. Chem., 61, 2715–2718, 1989.
Bricker, S. B., Rice, K. C., and Bricker, O. P.: From Headwaters to Coast: Influence of Human Activities on Water Quality of the Potomac River Estuary, Aquat. Geochem., 20, 291–323, https://doi.org/10.1007/s10498-014-9226-y, 2014.
Brown, A. M., Bass, A. M., and Pickard, A. E.: Anthropogenic-estuarine interactions cause disproportionate greenhouse gas production: A review of the evidence base, Mar. Pollut. Bull., 174, 113240, https://doi.org/10.1016/j.marpolbul.2021.113240, 2022.
Carstensen, J., Klais, R., and Cloern, J. E.: Phytoplankton blooms in estuarine and coastal waters: Seasonal patterns and key species, Estuar. Coast. Shelf S, 162, 98–109, https://doi.org/10.1016/j.ecss.2015.05.005, 2015.
Chun, Y., Kim, D., Hattori, S., Toyoda, S., Yoshida, N., Huh, J., Lim, J. H., and Park, J. H.: Temperature control on wastewater and downstream nitrous oxide emissions in an urbanized river system, Water Res., 187, 116417, https://doi.org/10.1016/j.watres.2020.116417, 2020.
Da, F., Friedrichs, M. A. M., and St-Laurent, P.: Impacts of Atmospheric Nitrogen Deposition and Coastal Nitrogen Fluxes on Oxygen Concentrations in Chesapeake Bay, J. Geophys. Res.-Oceans, 123, 5004–5025, https://doi.org/10.1029/2018jc014009, 2018.
de Haas, D. and Andrews, J.: Nitrous oxide emissions from wastewater treatment – Revisiting the IPCC 2019 refinement guidelines, Environmental Challenges, 8, 100557, https://doi.org/10.1016/j.envc.2022.100557, 2022.
Dong, Y., Liu, J., Cheng, X., Fan, F., Lin, W., Zhou, C., Wang, S., Xiao, S., Wang, C., Li, Y., and Li, C.: Wastewater-influenced estuaries are characterized by disproportionately high nitrous oxide emissions but overestimated IPCC emission factor, Commun. Earth Environ., 4, 395, https://doi.org/10.1038/s43247-023-01051-6, 2023.
Dylla, N. P.: Downstream effects on denitrification and nitrous oxide from an advanced wastewater treatment plant upgrade, University of Saskatchewan, http://hdl.handle.net/10388/11889 (last access: 16 February 2024), 2019.
Eggleston, H., Buendia, L., Miwa, K., Ngara, T., and Tanabe, K.: 2006 IPCC guidelines for national greenhouse gas inventories, https://www.ipcc-nggip.iges.or.jp/public/2006gl/index.html (last access: 16 February 2024), 2006.
Ehalt Macedo, H., Lehner, B., Nicell, J., Grill, G., Li, J., Limtong, A., and Shakya, R.: Distribution and characteristics of wastewater treatment plants within the global river network, Earth Syst. Sci. Data, 14, 559–577, https://doi.org/10.5194/essd-14-559-2022, 2022.
US EPA (United States Environmental Protection Agency): Method 365.4: Phosphorous, total (Colorimetric, automated, block digester AA II), https://www.epa.gov/cwa-methods/approved-cwa-test-methods-inorganic-non-metals (last access: 16 February 2024), 1974.
US EPA (United States Environmental Protection Agency): Inventory of US Greenhouse gas emissions and sinks: 1990-2021, United States Environmental Protection Agency, https://www.epa.gov/ghgemissions/inventory-us-greenhouse-gas-emissions-and-sinks-1990-2021 (last access: 16 February 2024), 2023.
Frame, C. H., Lau, E., Nolan, E. J. t., Goepfert, T. J., and Lehmann, M. F.: Acidification Enhances Hybrid N2O Production Associated with Aquatic Ammonia-Oxidizing Microorganisms, Front. Microbiol., 7, 2104, https://doi.org/10.3389/fmicb.2016.02104, 2016.
Galloway, J. N., Townsend, A. R., Erisman, J. W., Bekunda, M., Cai, Z., Freney, J. R., Martinelli, L. A., Seitzinger, S. P., and Sutton, M. A.: Transformation of the nitrogen cycle: recent trends, questions, and potential solutions, Science, 320, 889–892, https://doi.org/10.1126/science.1136674, 2008.
Gonçalves, C., Brogueira, M. J., and Nogueira, M.: Tidal and spatial variability of nitrous oxide (N2O) in Sado estuary (Portugal), Estuar. Coast. Shelf S., 167, 466–474, https://doi.org/10.1016/j.ecss.2015.10.028, 2015.
Glibert, P. M., Conley, D. J., Fisher, T. R., Harding, L. W., and Malone, T. C.: Dynamics of the 1990 winter/spring bloom in Chesapeake Bay, Mar. Ecol.-Prog. Ser., 122, 27–43, 1995.
Hansen, H. P. and Koroleff, F.: Determination of nutrients, in: Methods of Seawater Analysis, WILEY‐VCH Verlag GmbH, 159–228, https://doi.org/10.1002/9783527613984.ch10, 1999.
Hemond, H. F. and Duran, A. P.: Fluxes of N2O at the sediment-water and water-atmosphere boundaries of a nitrogen-rich river, Water Resour. Res., 25, 839–846, https://doi.org/10.1029/WR025i005p00839, 1989.
Holmes, R. M., Aminot, A., Kérouel, R., Hooker, B. A., and Peterson, B. J.: A simple and precise method for measuring ammonium in marine and freshwater ecosystems, Can. J. Fish. Aquat. Sci., 56, 1801–1808, https://doi.org/10.1139/f99-128, 1999.
Hu, M., Chen, D., and Dahlgren, R. A.: Modeling nitrous oxide emission from rivers: a global assessment, Glob. Change Biol., 22, 3566–3582, https://doi.org/10.1111/gcb.13351, 2016.
Jaworski, N. A., Romano, B., Buchanan, C., and Jaworski, C.: The Potomac River Basin and its Estuary: landscape loadings and water quality trends, 1895–2005, Report, Interstate Commission on the Potomac River Basin, Rockville, Maryland, USA, https://www.potomacriver.org/publications/ (last access: 16 February 2024), 2007.
Jiang, L. Q., Cai, W. J., and Wang, Y.: A comparative study of carbon dioxide degassing in river-and marine-dominated estuaries, Limnol. Oceanogr., 53, 2603–2615, https://doi.org/10.4319/lo.2008.53.6.2603, 2008.
Kalnay, E., Kanamitsu, M., Kistler, R., Collins, W., Deaven, D., Gandin, L., Iredell, M., Saha, S., White, G., and Woollen, J.: The NCEP/NCAR 40-year reanalysis project, B. Am. Meteor. Soc., 77, 437–471, 1996.
Kampschreur, M. J., Temmink, H., Kleerebezem, R., Jetten, M. S., and van Loosdrecht, M. C.: Nitrous oxide emission during wastewater treatment, Water Res., 43, 4093–4103, https://doi.org/10.1016/j.watres.2009.03.001, 2009.
Kelly, C. L., Travis, N. M., Baya, P. A., and Casciotti, K. L.: Quantifying Nitrous Oxide Cycling Regimes in the Eastern Tropical North Pacific Ocean With Isotopomer Analysis, Global Biogeochem. Cy., 35, e2020GB006637, https://doi.org/10.1029/2020gb006637, 2021.
Laperriere, S. M., Nidzieko, N. J., Fox, R. J., Fisher, A. W., and Santoro, A. E.: Observations of Variable Ammonia Oxidation and Nitrous Oxide Flux in a Eutrophic Estuary, Estuar. Coast., 42, 33–44, https://doi.org/10.1007/s12237-018-0441-4, 2019.
Maavara, T., Lauerwald, R., Laruelle, G. G., Akbarzadeh, Z., Bouskill, N. J., Van Cappellen, P., and Regnier, P.: Nitrous oxide emissions from inland waters: Are IPCC estimates too high?, Glob. Change Biol., 25, 473–488, https://doi.org/10.1111/gcb.14504, 2019.
Masuda, S., Otomo, S., Maruo, C., and Nishimura, O.: Contribution of dissolved N2O in total N2O emission from sewage treatment plant, Chemosphere, 212, 821–827, https://doi.org/10.1016/j.chemosphere.2018.08.089, 2018.
Masuda, S., Sato, T., Mishima, I., Maruo, C., Yamazaki, H., and Nishimura, O.: Impact of nitrogen compound variability of sewage treated water on N2O production in riverbeds, J. Environ. Manage., 290, 112621, https://doi.org/10.1016/j.jenvman.2021.112621, 2021.
McElroy, M. B., Elkins, J. W., Wofsy, S. C., Kolb, C. E., Durán, A. P., and Kaplan, W. A.: Production and release of N2O from the Potomac Estuary 1, Limnol. Oceanogr., 23, 1168–1182, https://doi.org/10.4319/lo.1978.23.6.1168, 1978.
Morée, A. L., Beusen, A. H. W., Bouwman, A. F., and Willems, W. J.: Exploring global nitrogen and phosphorus flows in urban wastes during the twentieth century, Global Biogeochem. Cy., 27, 836–846, https://doi.org/10.1002/gbc.20072, 2013.
Murray, R., Erler, D. V., Rosentreter, J., Wells, N. S., and Eyre, B. D.: Seasonal and spatial controls on N2O concentrations and emissions in low-nitrogen estuaries: Evidence from three tropical systems, Mar. Chem., 221, 103779, https://doi.org/10.1016/j.marchem.2020.103779, 2020.
Murray, R. H., Erler, D. V., and Eyre, B. D.: Nitrous oxide fluxes in estuarine environments: response to global change, Glob. Change Biol., 21, 3219–3245, https://doi.org/10.1111/gcb.12923, 2015.
Pennino, M. J., Kaushal, S. S., Murthy, S. N., Blomquist, J. D., Cornwell, J. C., and Harris, L. A.: Sources and transformations of anthropogenic nitrogen along an urban river–estuarine continuum, Biogeosciences, 13, 6211–6228, https://doi.org/10.5194/bg-13-6211-2016, 2016.
Qadir, M., Drechsel, P., Jiménez Cisneros, B., Kim, Y., Pramanik, A., Mehta, P., and Olaniyan, O.: Global and regional potential of wastewater as a water, nutrient and energy source, Nat. Resour. Forum, 44, 40–51, https://doi.org/10.1111/1477-8947.12187, 2020.
Quick, A. M., Reeder, W. J., Farrell, T. B., Tonina, D., Feris, K. P., and Benner, S. G.: Nitrous oxide from streams and rivers: A review of primary biogeochemical pathways and environmental variables, Earth-Sci. Rev., 191, 224–262, https://doi.org/10.1016/j.earscirev.2019.02.021, 2019.
Raymond, P. A. and Cole, J. J.: Gas exchange in rivers and estuaries: Choosing a gas transfer velocity, Estuaries, 24, 312–317, https://doi.org/10.2307/1352954, 2001.
Reading, M. J., Tait, D. R., Maher, D. T., Jeffrey, L. C., Looman, A., Holloway, C., Shishaye, H. A., Barron, S., and Santos, I. R.: Land use drives nitrous oxide dynamics in estuaries on regional and global scales, Limnol. Oceanogr., 65, 1903–1920, https://doi.org/10.1002/lno.11426, 2020.
Rice, E. W., Bridgewater, L., and Association, A. P. H.: Standard methods for the examination of water and wastewater, American public health association Washington, DC, https://www.standardmethods.org/ (last access: 16 February 2024), 2012.
Rosamond, M. S., Thuss, S. J., and Schiff, S. L.: Dependence of riverine nitrous oxide emissions on dissolved oxygen levels, Nat. Geosci., 5, 715–718, https://doi.org/10.1038/ngeo1556, 2012.
Rosentreter, J. A., Wells, N. S., Ulseth, A. J., and Eyre, B. D.: Divergent Gas Transfer Velocities of CO2, CH4, and N2O Over Spatial and Temporal Gradients in a Subtropical Estuary, J. Geophys. Res.-Biogeo., 126, e2021JG006270, https://doi.org/10.1029/2021jg006270, 2021.
Rosentreter, J. A., Laruelle, G. G., Bange, H. W., Bianchi, T. S., Busecke, J. J., Cai, W. J., Eyre, B. D., Forbrich, I., Kwon, E. Y., Maavara, T., and Moosdorf, N.: Coastal vegetation and estuaries are collectively a greenhouse gas sink, Nat. Clim. Change, 13, 579–587, https://doi.org/10.1038/s41558-023-01682-9, 2023.
Schulz, G., Sanders, T., Voynova, Y. G., Bange, H. W., and Dähnke, K.: Seasonal variability of nitrous oxide concentrations and emissions in a temperate estuary, Biogeosciences, 20, 3229–3247, https://doi.org/10.5194/bg-20-3229-2023, 2023.
Snider, D. M., Venkiteswaran, J. J., Schiff, S. L., and Spoelstra, J.: From the ground up: global nitrous oxide sources are constrained by stable isotope values, PloS one, 10, e0118954, https://doi.org/10.1371/journal.pone.0118954, 2015.
Tang, W., Tracey, J. C., Carroll, J., Wallace, E., Lee, J. A., Nathan, L., Sun, X., Jayakumar, A., and Ward, B. B.: Nitrous oxide production in the Chesapeake Bay, Limnol. Oceanogr., 67, 2101–2116, https://doi.org/10.1002/lno.12191, 2022.
Tang, W., Talbott, J., Jones, T., and Ward, B. Nitrous oxide observations in the Potomac River, Zenodo [data set], https://doi.org/10.5281/zenodo.11492525, 2024.
Tian, H., Xu, R., Canadell, J. G., Thompson, R. L., Winiwarter, W., Suntharalingam, P., Davidson, E. A., Ciais, P., Jackson, R. B., Janssens-Maenhout, G., Prather, M. J., Regnier, P., Pan, N., Pan, S., Peters, G. P., Shi, H., Tubiello, F. N., Zaehle, S., Zhou, F., Arneth, A., Battaglia, G., Berthet, S., Bopp, L., Bouwman, A. F., Buitenhuis, E. T., Chang, J., Chipperfield, M. P., Dangal, S. R. S., Dlugokencky, E., Elkins, J. W., Eyre, B. D., Fu, B., Hall, B., Ito, A., Joos, F., Krummel, P. B., Landolfi, A., Laruelle, G. G., Lauerwald, R., Li, W., Lienert, S., Maavara, T., MacLeod, M., Millet, D. B., Olin, S., Patra, P. K., Prinn, R. G., Raymond, P. A., Ruiz, D. J., van der Werf, G. R., Vuichard, N., Wang, J., Weiss, R. F., Wells, K. C., Wilson, C., Yang, J., and Yao, Y.: A comprehensive quantification of global nitrous oxide sources and sinks, Nature, 586, 248–256, https://doi.org/10.1038/s41586-020-2780-0, 2020.
Townsend-Small, A., Pataki, D. E., Tseng, L. Y., Tsai, C. Y., and Rosso, D.: Nitrous oxide emissions from wastewater treatment and water reclamation plants in southern California, J. Environ. Qual., 40, 1542–1550, https://doi.org/10.2134/jeq2011.0059, 2011.
Toyoda, S., Iwai, H., Koba, K., and Yoshida, N.: Isotopomeric analysis of N2O dissolved in a river in the Tokyo metropolitan area, Rapid Commun. Mass Spectrom., 23, 809–821, https://doi.org/10.1002/rcm.3945, 2009.
Toyoda, S., Suzuki, Y., Hattori, S., Yamada, K., Fujii, A., Yoshida, N., Kouno, R., Murayama, K., and Shiomi, H.: Isotopomer Analysis of Production and Consumption Mechanisms of N2O and CH4 in an Advanced Wastewater Treatment System, Environ. Sci. Technol., 45, 917–922, https://doi.org/10.1021/es102985u, 2011.
Tumendelger, A., Toyoda, S., and Yoshida, N.: Isotopic analysis of N2O produced in a conventional wastewater treatment system operated under different aeration conditions, Rapid Commun. Mass Spectrom., 28, 1883–1892, https://doi.org/10.1002/rcm.6973, 2014.
Wan, X. S., Sheng, H. X., Liu, L., Shen, H., Tang, W., Zou, W., Xu, M. N., Zheng, Z., Tan, E., Chen, M., Zhang, Y., Ward, B. B., and Kao, S. J.: Particle-associated denitrification is the primary source of N2O in oxic coastal waters, Nat. Commun., 14, 8280, https://doi.org/10.1038/s41467-023-43997-3, 2023.
Wang, J., Chen, N., Yan, W., Wang, B., and Yang, L.: Effect of dissolved oxygen and nitrogen on emission of N2O from rivers in China, Atmos. Environ., 103, 347–356, https://doi.org/10.1016/j.atmosenv.2014.12.054, 2015.
Wang, J., Vilmin, L., Mogollon, J. M., Beusen, A. H. W., van Hoek, W. J., Liu, X., Pika, P. A., Middelburg, J. J., and Bouwman, A. F.: Inland Waters Increasingly Produce and Emit Nitrous Oxide, Environ. Sci. Technol., 57, 13506–13519, https://doi.org/10.1021/acs.est.3c04230, 2023.
Wanninkhof, R.: Relationship between wind speed and gas exchange over the ocean revisited, Limnol. Oceanogr.-Meth., 12, 351–362, 2014.
Weiss, R. F. and Price, B. A.: Nitrous oxide solubility in water and seawater, Mar. Chem., 8, 347–359, https://doi.org/10.1016/0304-4203(80)90024-9, 1980.
Wong, G. T. F., Li-Tzu Hou, L., and Li, K. Y.: Preservation of seawater samples for soluble reactive phosphate, nitrite, and nitrate plus nitrite analyses by the addition of sodium hydroxide, Limnol. Oceanogr.-Meth., 15, 320–327, https://doi.org/10.1002/lom3.10160, 2017.
Yao, Y., Tian, H., Shi, H., Pan, S., Xu, R., Pan, N., and Canadell, J. G.: Increased global nitrous oxide emissions from streams and rivers in the Anthropocene, Nat. Clim. Change, 10, 138–142, https://doi.org/10.1038/s41558-019-0665-8, 2019.
Zhao, Y. W., Du, L. L., Hu, B., Lin, H. Y., Liang, B., Song, Y. P., Wang, Y. Q., Wang, H. W., Li, P. F., Wang, A. J. and Wang, H. C.: Impact of influent characteristics and operational parameters on nitrous oxide emissions in wastewater treatment: Strategies for mitigation and microbial insights, Current Research in Biotechnology, 7, 100207, https://doi.org/10.1016/j.crbiot.2024.100207, 2024.
Zheng, Y., Wu, S., Xiao, S., Yu, K., Fang, X., Xia, L., Wang, J., Liu, S., Freeman, C., and Zou, J.: Global methane and nitrous oxide emissions from inland waters and estuaries, Glob. Change Biol., 28, 4713–4725, https://doi.org/10.1111/gcb.16233, 2022.