the Creative Commons Attribution 4.0 License.
the Creative Commons Attribution 4.0 License.
 | 19 Jul 2024
Assessment of carbon mass in a Mediterranean downy oak ecosystem using airborne lidar and NASA Global Ecosystem Dynamics Investigation (GEDI) data
Maëlie Chazette
Patrick Chazette
Ilja M. Reiter
Xiaoxia Shang
Julien Totems
Jean-Philippe Orts
Irène Xueref-Remy
Nicolas Montes
Forest systems are the main carbon sink after the oceans. However, due to climate change, an alarming number of tree species of the Northern Hemisphere are at risk of migrating northwards or becoming extinct. This is the case for the downy oak (Quercus pubescens), one of the main species constituting the forests close to the Mediterranean Sea in France. Our aim is to retrieve aboveground carbon (AGC) and underground root carbon (UGC) stocks of the downy oak forest at the Observatoire de Haute-Provence (OHP), located about 80 km north of Marseille, in order to provide a baseline against which to assess the effect of climate change on this model species. The study presented here is based on airborne lidar observations performed on May 2012 and field measurements from 2012, 2018 and 2023 in the OHP forest. The OHP forest consists of ∼ 75 % downy oak, which is highly sensitive to global warming. Field measurements indicate minimal changes in tree growth and density between 2012 and 2023, and thus its carbon storage efficiency remains stationary. As retrieved by lidar measurements, tree top heights (TTHs) are mostly between 5 and 12 m, with an uncertainty of around 1 m. The slow evolution of trees at the OHP site makes it appropriate to use lidar data recorded in 2012 to assess the carbon stock trapped in current forest biomass. By coupling allometric laws established from field measurements with lidar observations, we show that the quantities of carbon trapped in aboveground biomass are double those trapped in the root system. Over an area of ∼ 24 ha, mean values of 15 ± 14 tC ha−1 are assessed for the aerial biomass against 8–10 ± 3–7 tC ha−1 for the roots of diameter larger than 1 cm for low and high assessments. These values depend heavily on the height of the sampled trees themselves, as well as on their location on the OHP plateau (smaller trees, 5–6 m) or on the slope (tallest trees, 10–12 m). Using a Monte Carlo approach, the relative uncertainties in AGC were calculated to be of the order of 17 % and 11 % for trees 5–6 m and 10–12 m tall, respectively. For UGC, the relative uncertainties were calculated as 8 % and 5 % for the same tree heights, but the assumptions of the allometric model are associated with biases that can easily reach 100 %. Although the surface footprints are different, we show that there is a reasonable agreement between our airborne lidar measurements and the level 2B (TTH) and (aboveground biomass) operational products of the Global Ecosystem Dynamics Investigation (GEDI) mission on the International Space Station for data acquired between 2019 and 2022.
- Article
(11526 KB) - Full-text XML
- BibTeX
- EndNote


Since the industrial revolution, anthropogenic activities have continuously increased the carbon dioxide (CO2) concentration in the atmosphere, reaching a record average of ∼ 420 ppm in 2023 (https://gml.noaa.gov/ccgg/trends/data.html, last access: 12 July 2024) and corresponding to an increase of almost 50 % compared to the pre-industrial era, as explained by the Intergovernmental Panel on Climate Change (IPCC, 2021). According to IPCC (2021), the land and oceans sequestrate up to 56 % of annual anthropic CO2 emissions. However, the progressive destruction and deterioration of ecosystems is currently underway. Therefore, understanding how the world's carbon sinks evolve is an important matter.
Forest cover currently represents more than one-third of the total land surface on Earth (Roberntz, 1999), making it the second-most-important carbon sink after the oceans (IPCC, 2021). Disturbances in the forest ecosystem operation lead to the release of trapped carbon, either by decomposition of organic matter or by combustion (Buma and Wessman, 2013). Based on IPCC (2021), the combination of trees and forest soils amounts to 38 % of the land carbon stock. However, around 40 % of the world's forested area was destroyed in the last 3 centuries (Shvidenko et al., 2005). Since 2010, around 3.3 Mha yr−1 (∼ 6 % of the surface area of France per year) of forest was lost (Keenan et al., 2015), where permanent deforestation (25 %) and wildfires (22 %) are the main causes worldwide (Curtis et al., 2018). However, climate change itself may soon become a major cause of forest loss.
The Mediterranean area is one of the main hotspots (Giorgi, 2006) of climate change and one of the 36 world biodiversity hotspots (Médail et al., 2019) with an intensification of extreme temperature events and increasingly intense and prolonged droughts (Diffenbaugh et al., 2007; Giorgi and Lionello, 2008). This upheaval, exacerbated by the increase in vapour pressure deficit (Yuan et al., 2019), has a direct impact on the Mediterranean forest ecosystems, leading to a decrease in the amount of aboveground and belowground biomass with the change in soil moisture and temperature regimes. In turn, those accelerate the rate of decomposition of organic matter as well as the depletion of soil organic carbon (Lal, 2005). A progressive decrease in carbon content of Mediterranean forests is then expected as for all the carbon reservoirs. Mediterranean forests could become net CO2 emitters in the years to decades to come. It is also worth noting that while Mediterranean biomes represent merely 2 % of the land surface (Klausmeyer and Shaw, 2009), they are one of the 25 world ecosystems containing around 44 % of known plant species and 35 % of known vertebrate species (Myers et al., 2000). Due to their vulnerability to climate change, it is important to understand how the Mediterranean forests will evolve in the future.
In these areas, dominant species such as the downy oak (Quercus pubescens Willd.) are adequate candidates for studies related to climate change over several decades (Roberntz, 1999).
The downy oak (Quercus pubescens) holds significant scientific interest as one of the dominant tree species in European Mediterranean forests, alongside the evergreen oak (Quercus ilex L.) and Aleppo pine (Pinus halepensis Mill.) (Médail et al., 2019). Downy oaks have a wide distribution range, occupying most of central and southern Europe from western Spain to Ukraine and Anatolia, with some isolated populations in the Caucasian area (https://forest.jrc.ec.europa.eu/media/atlas/Quercus_pubescens.pdf, last access: 12 July 2024). Furthermore, the downy oak is the third oak tree species exploited for its wood (Timbal and Aussenac, 1996), as well as for being a truffle tree, sparking an economic interest for its study.
The importance of forests for climate balance and the water cycle has led the international scientific community to research experimental approaches for measuring the tree top height (TTH), a key parameter. This parameter can be linked to various structural aspects of individual trees and therefore of the forest, as well as to the quantity of aboveground biomass (Lefsky and Cohen, 2002; Shang and Chazette, 2014b) and root biomass (Di Iorio et al., 2005). Aboveground biomass can be estimated using various methods. In the field, it is possible to use a destructive method (the most direct approach for estimating carbon), which involves collecting all components of the trees present in an area of a given size and then measuring their total mass (Vashum and Jayakumar, 2012). This method is direct and fully accurate, but it is time-consuming, expensive, and impractical for vulnerable species or a large-scale assessment. A non-destructive alternative consists in estimating forest biomass by simplifying the tree into a basic form and deducing the aboveground biomass directly from the TTH using allometric equations that relate the TTH to the circumference (or diameter) (Dupouey et al., 1999; Vashum and Jayakumar, 2012). These equations can be generalized on a larger scale using remote sensing. In particular, lidar technologies have been used for nearly 30 years (Næsset and Gobakken, 2008; Lefsky et al., 1996), predominantly via airborne measurements in various forest environments. More recently, airborne radar techniques have also been tested (Sinha et al., 2015), culminating in ESA's forest mission (BIOMASS, https://www.esa.int/Applications/Observing_the_Earth/FutureEO/Biomass, last access: 13 May 2024), which will be launched in 2024 (Le Toan et al., 2011). Nonetheless, forest cover has already been observed from space with the dedicated lidar of the Global Ecosystem Dynamics Investigation (GEDI) mission, which was launched into orbit in 2018 and has been operating for just over 2 years on the International Space Station (ISS) (Duncanson et al., 2022).
This study focuses on the Oak Observatory (O3HP), a unique model site for downy oak study (Gauquelin et al., 2011), located at OHP. This site has enabled us to monitor the long-term impact of water stress on trees and assess their resilience to global warming. The site is extensively documented in terms of both vegetation and soil, making it an ideal location for combining ground-based with airborne measurements to assess the carbon stock of one of the three emblematic tree species of the Mediterranean climate. Until now, O3HP has principally been characterized by very localized in situ measurements at ground level, but its monitoring over time in relation to climate change has necessitated the implementation of more regionalized methods. These methods are essential for estimating more precisely the role of downy oaks in carbon storage, especially considering the prolonged periods of drought in recent years. To address this major scientific question, this study was undertaken with the synergy of allometric laws derived from in situ measurements in the OHP forest during 2012, 2018 and 2023, along with airborne lidar observations obtained in May 2012. The main objective of this study is to establish a fine-scale reference map of carbon quantities stored in forest aerial and root biomasses. GEDI observations were also used to demonstrate their consistency with airborne lidar measurements.
2.1 Campaign site – O3HP
Created on March 2009, the Oak Observatory at the OHP (O3HP) is an experimental platform designed to study the oak woodland ecosystem and its evolution in the context of climate change (Gauquelin et al., 2018). The site is in the forest of the Observatoire de Haute-Provence (Fig. 1a), at the Saint-Michel-l'Observatoire in Provence-Alpes-Côte d'Azur region (43°56′ 17′′ N, 5°42′27′′ E). The main in situ studies are performed within the O3HP area (∼ 0.25 ha) located on a limestone plateau. However, forest observations by airborne lidar remote sensing were carried out over a much larger area of more than 24 ha, including sloping areas (Fig. 1b).
Downy oak (Fig. 1c) is the main tree species found at O3HP. The experimental site is part of the national facilities for studying these dominant species, joining the Centre d'Ecologie Fonctionnelle et Evolutive (CEFE, https://www.cefe.cnrs.fr/fr/, last access: 31 October 2023) in Montpellier, which focuses on holm oak studies, and the Fontblanche site in the Bouches-du-Rhône, dedicated to studying Aleppo pine.
The forest of the OHP site has the particularity of not having been logged for over 80 years, making it an ideal subject for study due to its old-growth-forest quality (Gauquelin et al., 2011). The O3HP site is also characterized by a 300 m2 rain exclusion system. The purpose of this system is to simulate prolonged periods of drought in order to observe tree behaviour under such stressful conditions. This research is conducted in anticipation of regional droughts predicted by IPCC climate simulations for the coming decades. Consequently, continuous measurements are taken, including humidity, temperature, radial growth of trees in the field and species richness of phanerophytes. The surveys show that 74 % of the OHP forest is made up of downy oaks, with the remainder being predominantly Acer monspessulanum. Among these trees, around 15 % are dead and still standing.
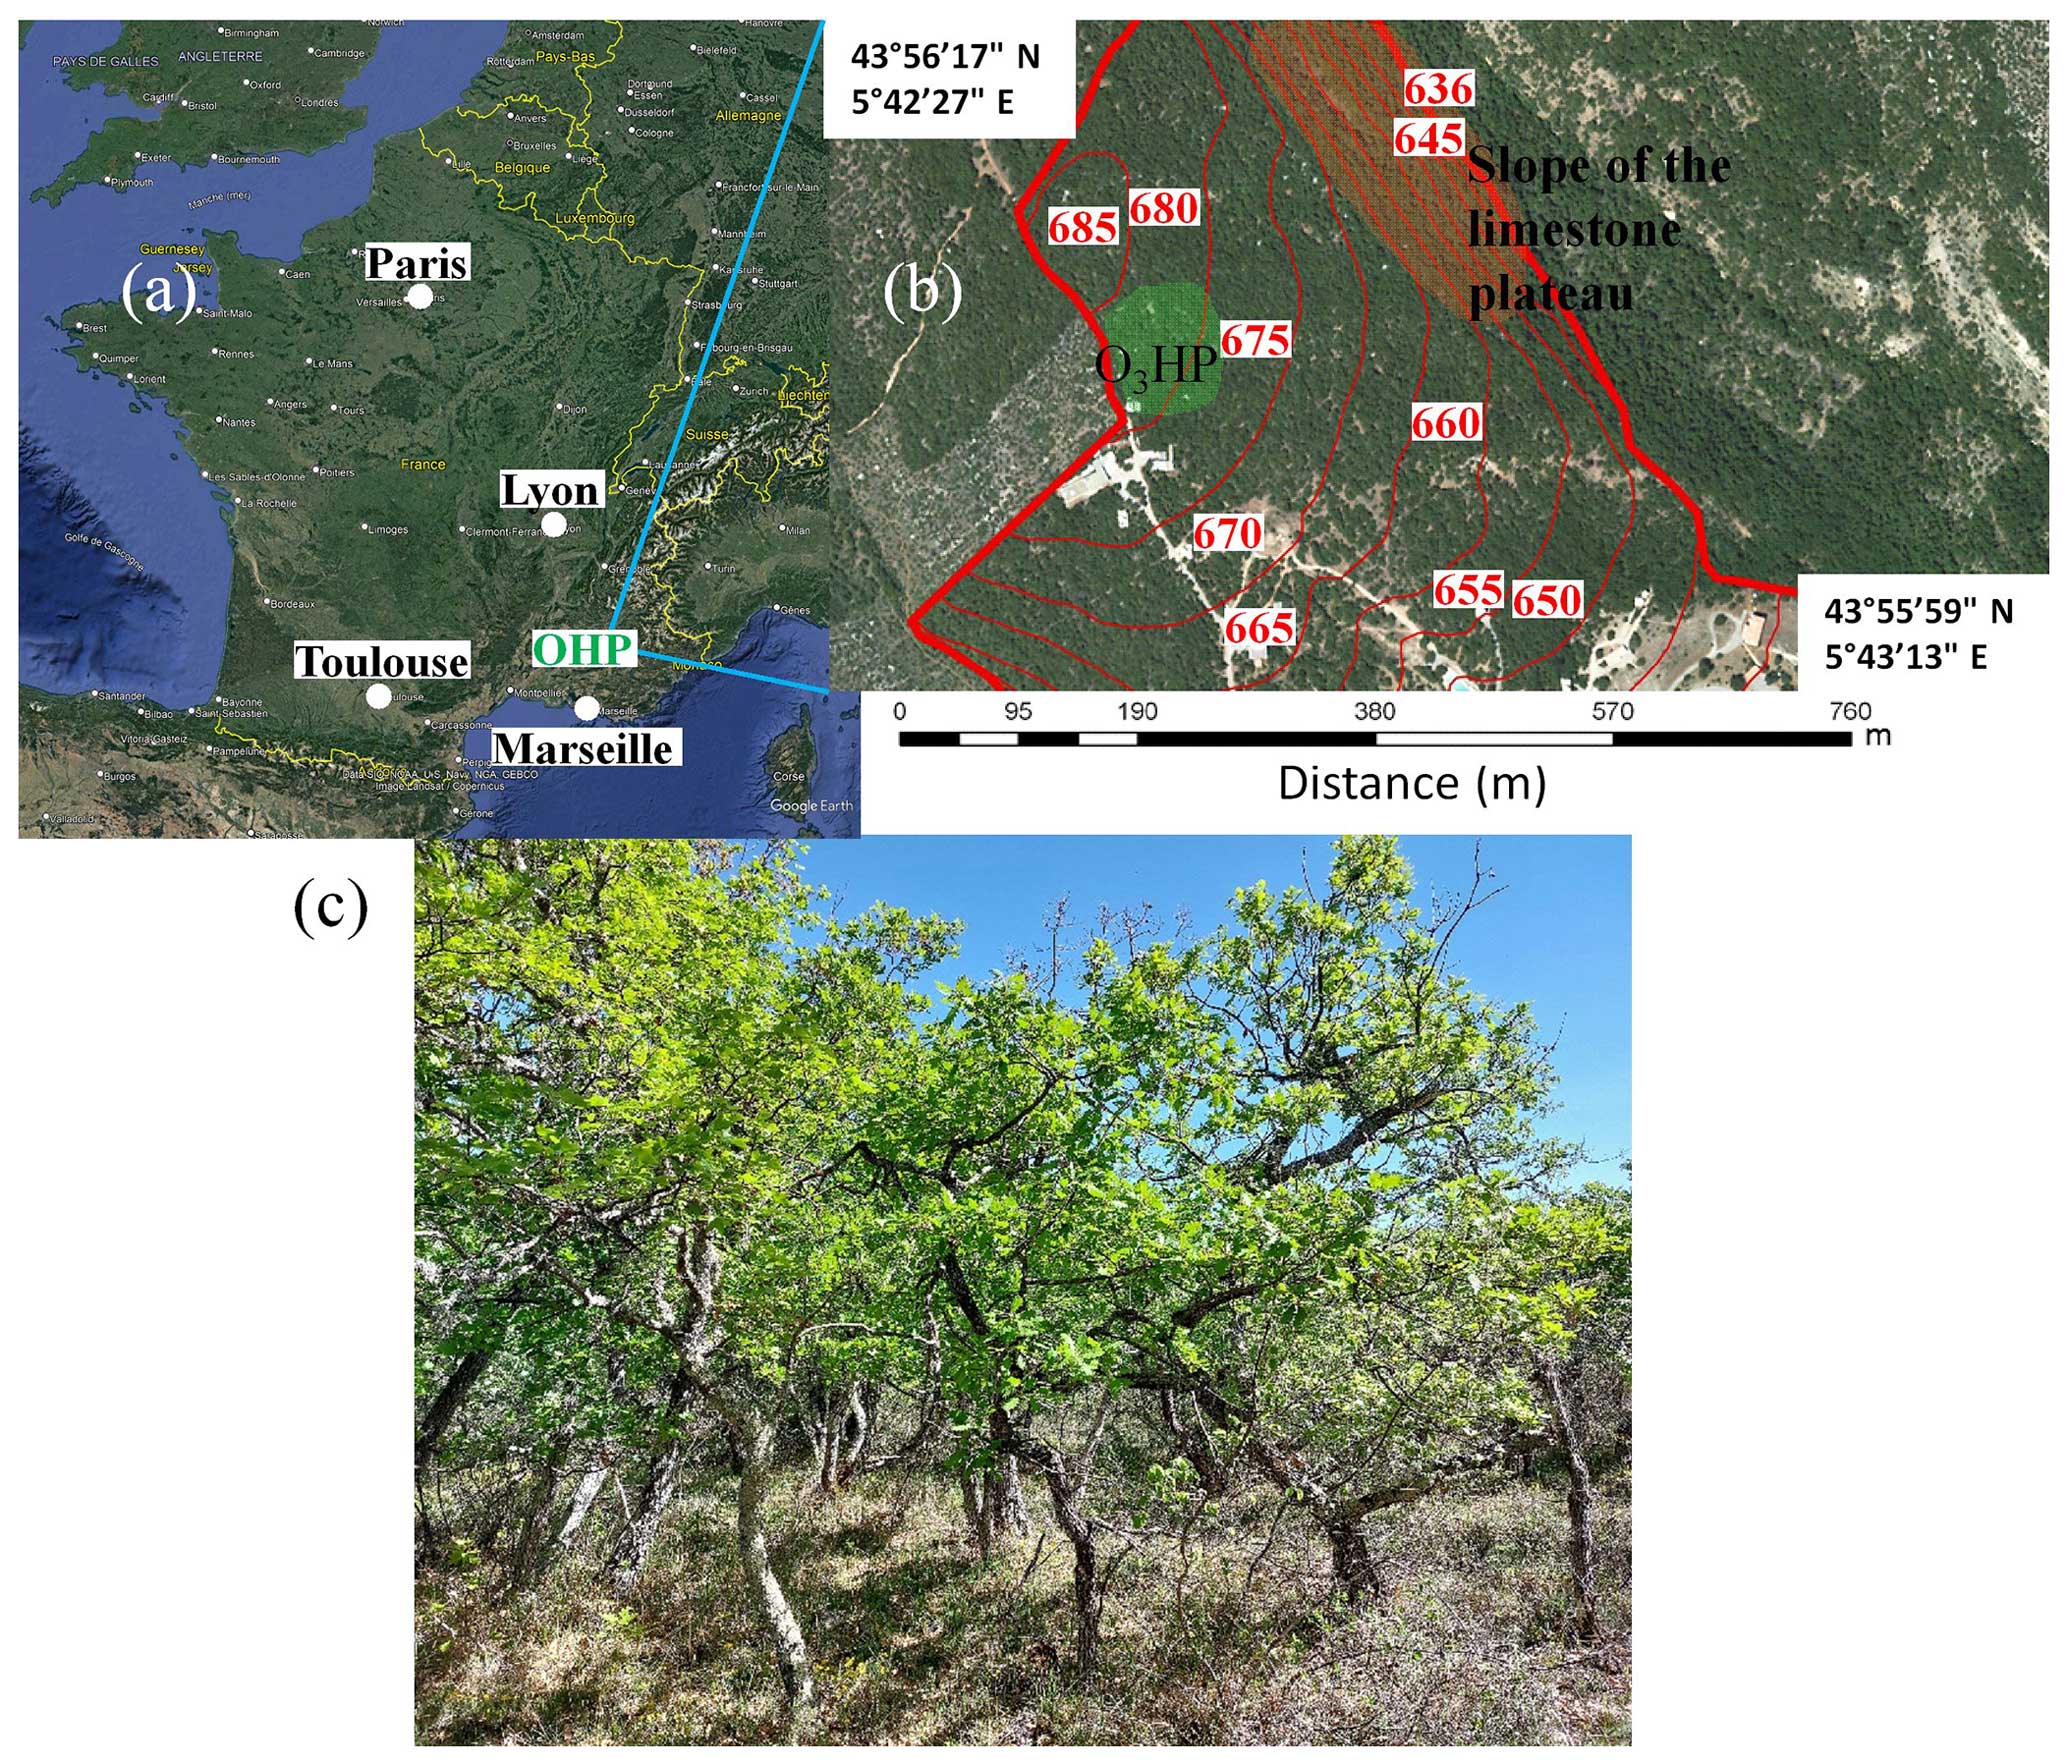
Figure 1(a) Geographical location of the O3HP site from ©Google Earth; (b) topography of the site and surrounding area (red values in m) from ©Google Earth – the slope of the limestone plateau where airborne lidar measurements have been extended is also indicated as the O3HP area (in green); and (c) typical downy oak trees (Quercus pubescens) on the O3HP site and surrounding area.
2.2 Experimental strategy
2.2.1 Airborne lidar
ULICE-2 (Ultraviolet Lidar for Canopy Experiments; Fig. 2) is a simple and robust research instrument developed at the LSCE for joint surveys of both the forest canopy and the atmospheric composition in terms of aerosol particles (Chazette et al., 2018; Chazette and Totems, 2017). It has been successfully deployed on board ultralight aircraft on multiple campaigns, yielding significant data from the Landes forest in the southwest of France (Allouis et al., 2010; Cuesta et al., 2010), the Fontainebleau forest near Paris (Shang and Chazette, 2014a) and various tropical forests on Reunion Island (Shang et al., 2016b). Thanks to a large laser beam footprint and a so-called full-waveform measurement scheme, tropical forest cover was characterized in terms of both TTH and LAI (leaf area index), even for the densest canopies which typically obscure the ground echo.
ULICE-2 was mounted on an ultralight aircraft and flown over O3HP in early summer 2012 to elaborate on the spatial characterization of forest plots on the OHP plateau and its adjacent hill (Fig. 1b).
For the OHP overflight, ULICE-2 was composed of a Quantel Ultra 100 laser, emitting 15 mJ at a repetition rate of 20 Hz at 355 nm wavelength, with a ∼ 1.2 m footprint at ground level, as well as two 150 mm diameter receiving telescopes, including one dedicated to forest studies with ∼ 5 mrad field of view. The echo signal from photomultiplier tube detectors was digitized at 500 MHz sampling frequency corresponding to 0.30 m height resolution for a range of 1 km along the line of sight.
The full ultralight-aircraft payload was carried on the passenger seat of the Air Creation Tanarg two-seat pendular aircraft. It included an XSense MTiG three-angle inclinometer (magnetic cape, pitch, roll) and a GPS receiver attached to the lidar head protruding from the side of the aircraft. Acquired at 100 Hz, these data allowed the full 3D localization of every forest lidar profile, with a precision of ∼ 1 m.
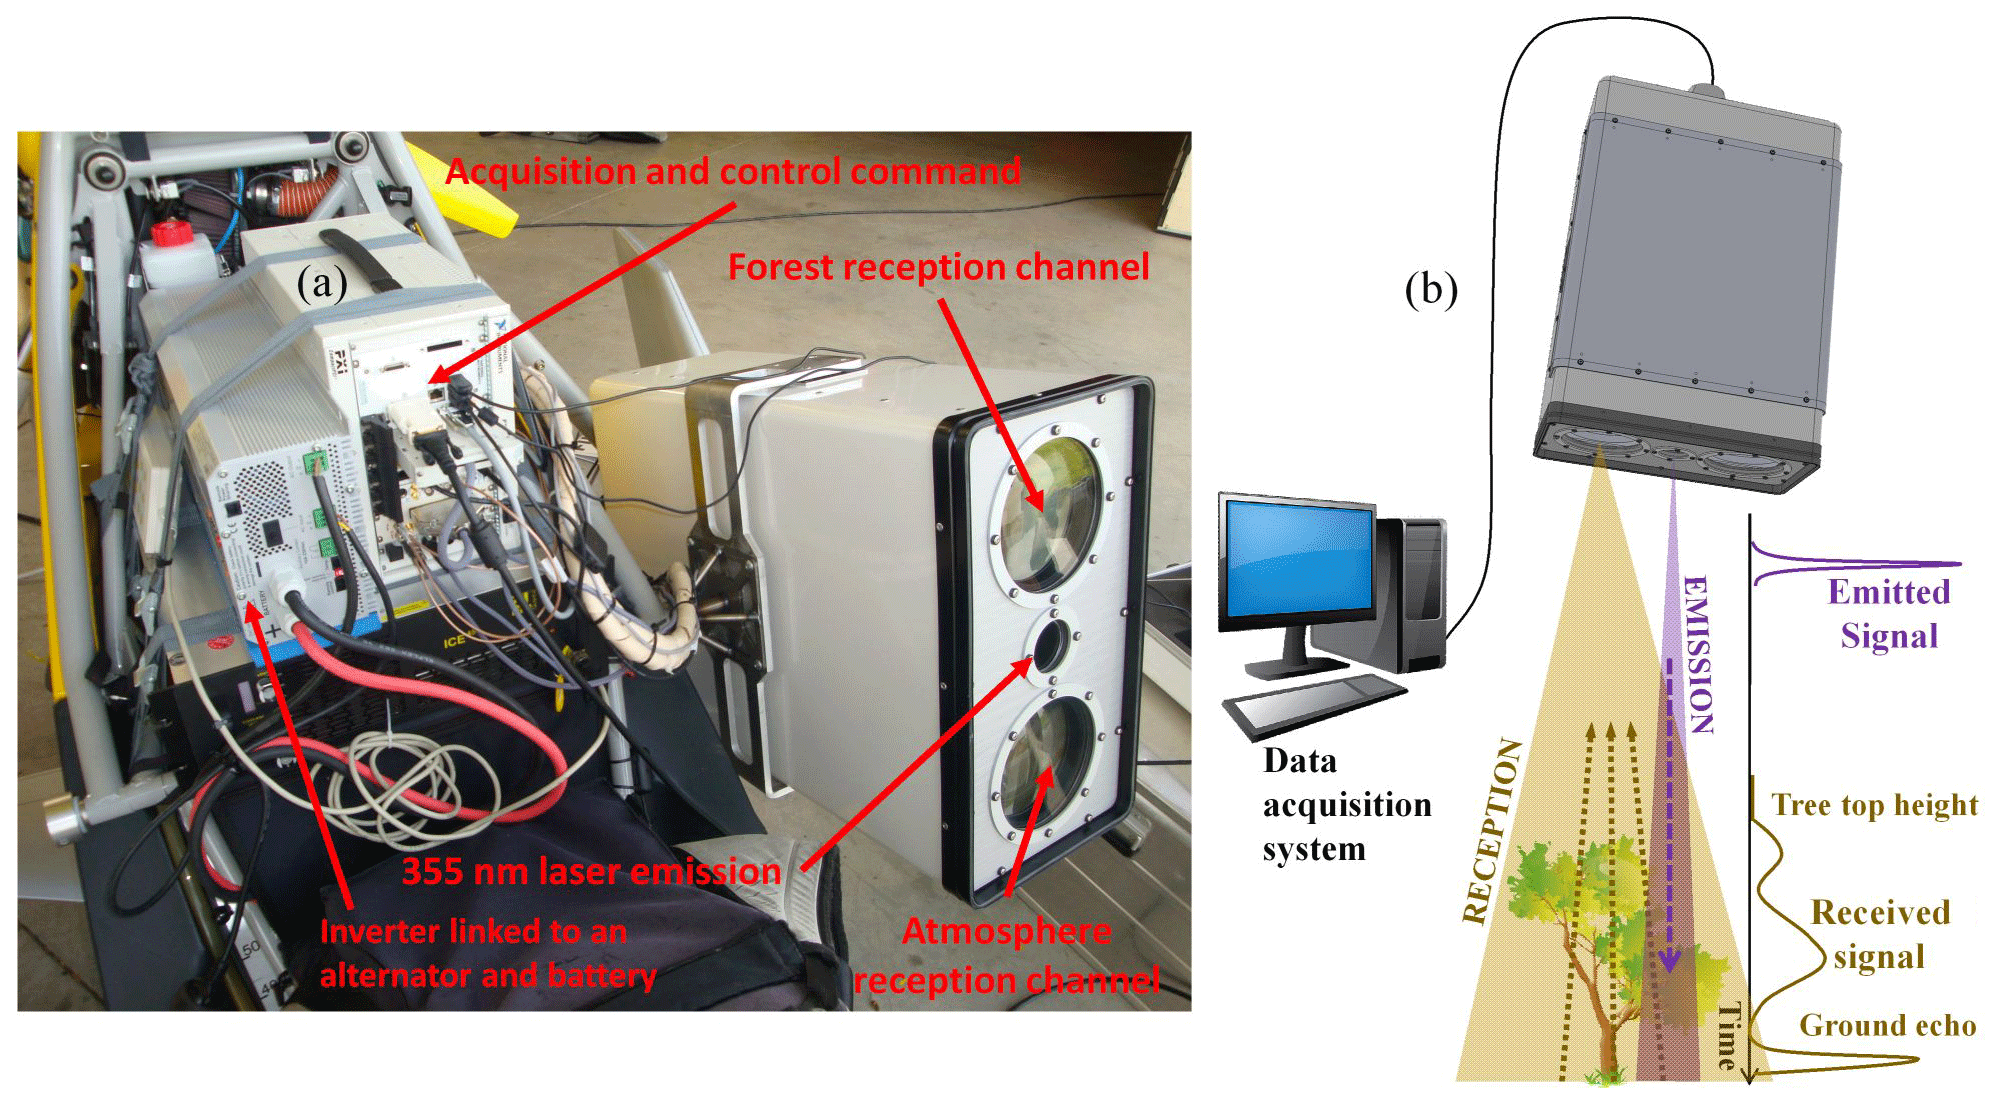
Figure 2(a) ULICE-2 (Ultraviolet Lidar for Canopy Experiment) on board the ultralight aircraft. (b) Principle of canopy lidar measurements using a laser emission at 355 nm and a receiving telescope.
2.2.2 Sampling strategy
Four flights (∼ 2 h each) were performed over the sampling site, among which three were west–east and one north–south (Fig. 3a). The horizontal sampling path pattern is illustrated in Fig. 3b. The laser footprints (d) were about ∼ 1.2 m in diameter, associated with a ∼ 300 m flight altitude. The along-track distances (ΔX) were about 1.3 m, accounting for the flight speed (∼ 26 m s−1 on average) and the laser repetition rate. The cross-track distances (ΔY) varied from 0 to 15 m, with a value below 5 m for most tracks. More than 58 000 backscatter lidar profiles were collected to create a dataset representative of the forest structure of the sampling site around O3HP.
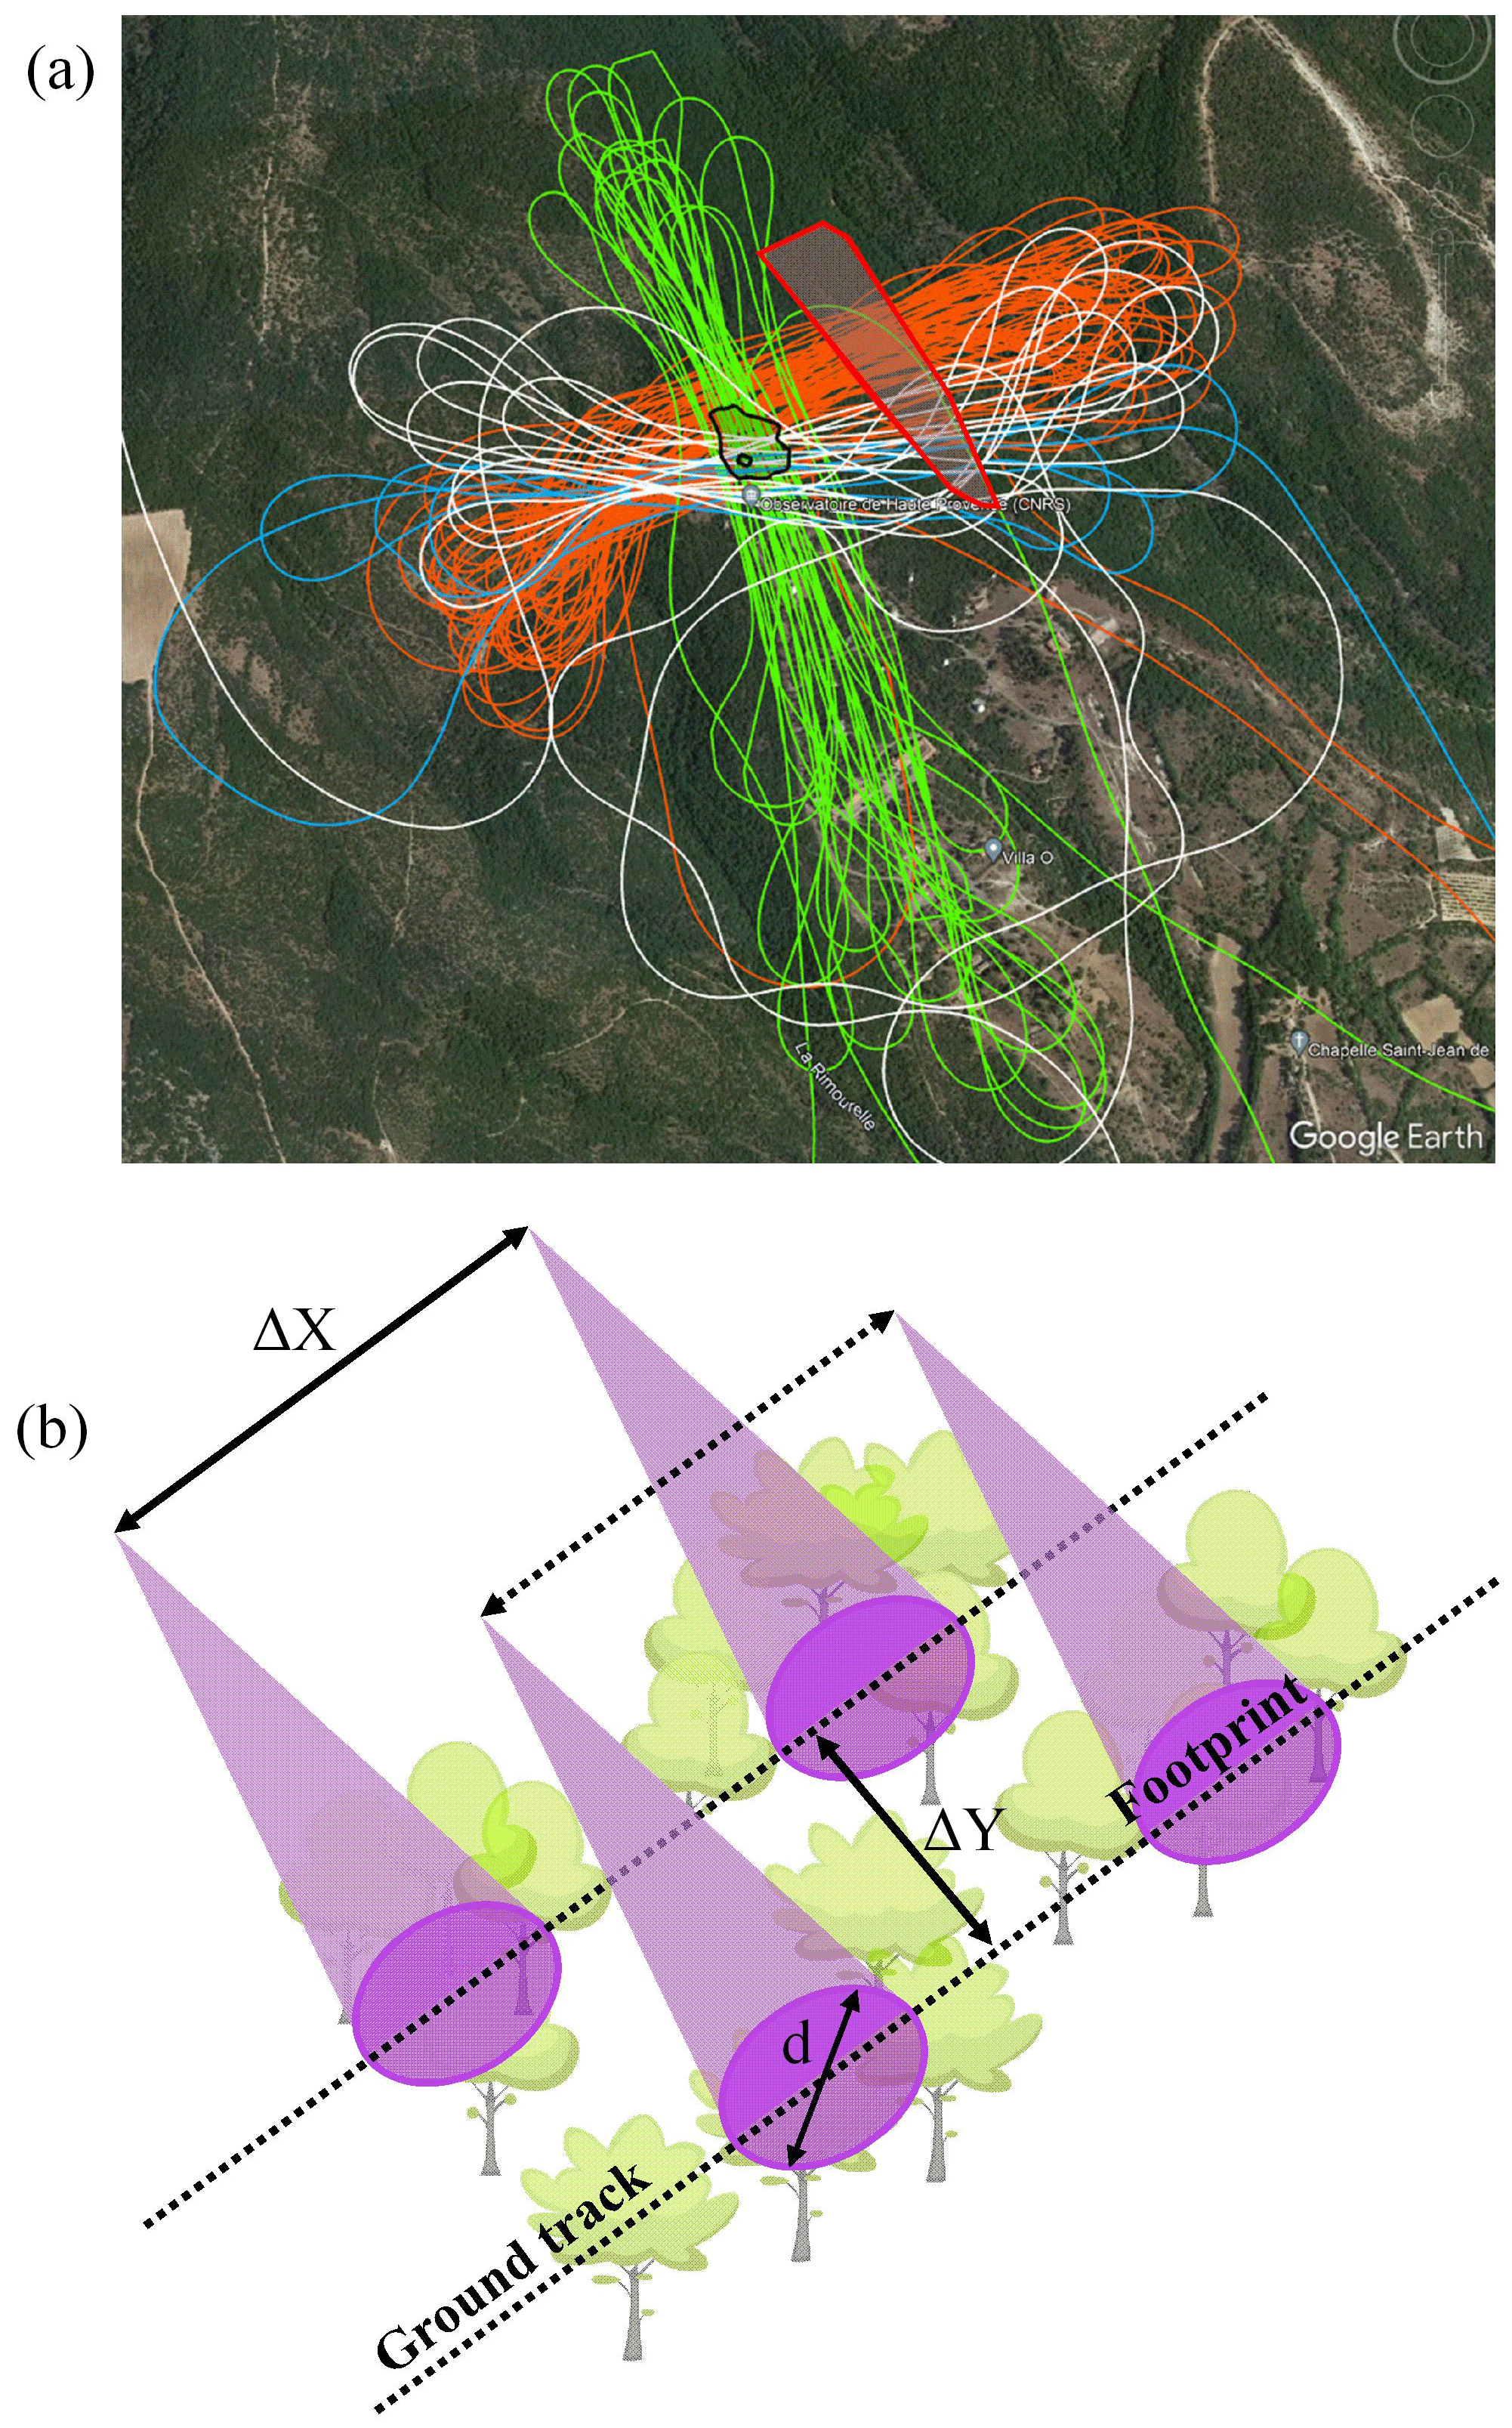
Figure 3(a) Four flight tracks superimposed in colour over the sampling site (© Google Earth). The O3HP site is delineated by a black contour and the sloping plot by a red one with light-grey area. (b) Illustration of the horizontal sampling pattern of lidar measurements at nadir, where d is the footprint diameter, ΔX is the horizontal resolution along the flight direction and ΔY is the horizontal distance between two consecutive ground tracks.
The amount of aboveground carbon (AGC) trapped in the aboveground biomass was determined following three stages: (i) deriving TTHs and circumference at breast height (CBH), (ii) searching for an allometric relationship linking tree circumference to TTH and (iii) selecting a model to relate tree geometric properties to the amount of carbon trapped in both the aboveground biomass and roots.
3.1 Structural parameters of trees
Two structural parameters of trees need to be assessed to determine the quantity of AGC: TTH and CBH. For that, over an area of 400 m × 780 m, more than 58 000 lidar profiles were acquired in May 2012 from the ULICE-2. These profiles can be used to derive the TTH, as demonstrated by numerous studies (e.g. Cuesta et al., 2010; Shang and Chazette, 2013). The equation applied to infer forest structures from lidar data is detailed in Chazette et al. (2016), and the approach to derive the TTH is presented in Shang and Chazette (2014b), with an accuracy of about 1 m per individual tree.
An additional relationship is required to link TTH to CBH, which is determined from an allometric relationship established against field measurements (e.g. Shang et al., 2016a). To establish this relationship, 90 trees were sampled in 2018, taking into account the TTH variability encountered at the O3HP site. TTH was measured with a calibrated Vertex IV dendrometer (Haglöf Company Group), and CBH was measured with a measuring tape. Figure 4 shows the different measurements with the relevant error bars. By repeating the measurements six times on several trees with two independent operators, uncertainties on TTH and CBH were assessed as ∼ 30 and ∼ 2 cm, respectively. A logarithmic distribution was thus fitted on the cloud samplings of Fig. 4, with a correlation coefficient of 0.73:
Statistical uncertainties are indicated by exponents in the equation after the “±” sign. This estimate was made using a Monte Carlo approach as in Shang and Chazette (2014b). The regression parameters are also associated with a bias of −0.9 for the slope and 1.7 for the intercept. It should be noted that Montpellier maples have been retained in the regression because they can also be sampled by airborne lidar without being identifiable by this measurement.
It is worth noting that, simultaneously with the lidar measurements, nine ground spots of 16 m2 were selected as reference in the O3HP area where dendrometric measurements of the tallest tree were made. The average distance between tree trunks was also measured and found to be between 1.5 and 2.5 m. This operation was first conducted in 2010 and then repeated in June 2023 on the same spots to assess the evolution of the trees' structural parameters.
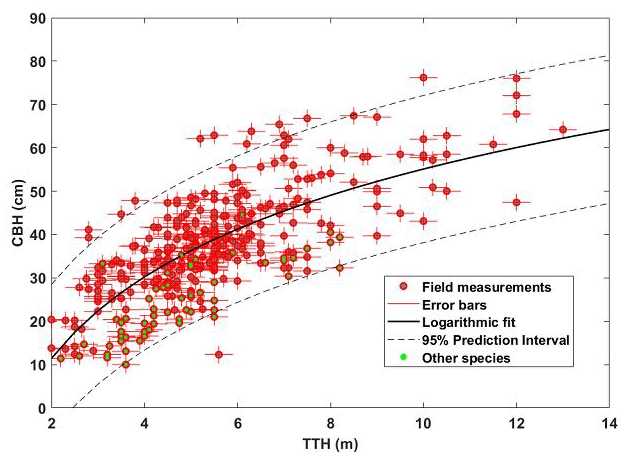
Figure 4Allometric relationship between TTH and CBH. Field measurements (90 trees) are shown as red dots with error bars. Dots with a green mark correspond to species other than downy oaks, mostly Montpellier maple (Acer monspessulanum). The logarithmic regression is represented by the solid black line with the 95 % confidence interval represented by the dashed line.
3.2 Model for aboveground carbon retrieval
In order to link the geometric properties TTH and CBH to AGC, we considered the model proposed by Vallet et al. (2006). This model has already been tested for sessile oaks from the Barbeau forest by Shang and Chazette (2014b) using the same type of airborne lidar. The total volume (Vtot) of the tree's vegetative apparatus, i.e. the volume of the entire trunk, branches and leaves, is expressed according to the relationship (Vallet et al., 2006)
with
Equation (2) represents the volume (in m3) of a cylinder of height TTH (in m) and CBH (in cm) weighted by the form factor ξ. The expression of ξ was established by regression on field datasets of different tree species. This relationship depends directly on TTH and CBH calculated at 1.3 m from the base of the trees. For sessile oaks, the parameters α, β, γ and ε each have the values , m−1, m0.5 and ε ∼ 0.002. They correspond to model variations for each tree form. Therefore, these values change depending on the tree species considered. Since we found no values in the literature for downy oaks, we decided to use the sessile oak values. The variability of parameters was assessed by calculating the standard deviation on each of them, using the results of Table 4 from Vallet et al. (2006).
AGC for an individual tree (AGCt) can thus be deduced by knowing the dry matter stock (DEN) and the proportion of carbon (CAR) in it, via the relationship
For downy oak, DEN = 0.648 kg m−3 and CAR = 49.63 % according to Krajnc et al. (2021). As in Shang and Chazette (2014b), the ground lidar footprints are synthesized into a regular grid composed of pixels of surface Splot. AGC (AGCplot) is therefore calculated per unit area in tC ha−1 for each plot expected to contain only one tree as
The surface Splot is representative of the forest canopy heterogeneity, which also depends on the spatial sampling. On the study site, field surveys show trees spaced at an average distance of 2 m apart, leading to an elementary surface of 4 m2, which defines what we call the elementary grid. The quantity of AGC for a larger surface area is calculated by averaging the elementary contributions. This implies that the lidar sampling is sufficiently representative of the forest density on the surface considered, the size of which must be chosen accordingly. For the study presented here, we selected a surface area of 64 m2, including 16 elementary surfaces.
3.3 Retrieval of root carbon stock
Root biomass is also estimated through allometric relationships developed in the field. This type of information is very sparse in the literature (Drexhage and Colin, 2001), and we have selected two laws established on forest environments close to that of O3HP. The first laws are derived from the works of Slot et al. (2012) for Quercus pubescens forest in a dry alpine valley. The second law is given by Drexhage and Colin (2001) for roots over 1 cm in diameter of 32 Quercus ilex trees in a forest in northeastern Spain (Canadell and Roda, 1991). The two possible laws that link the amount of underground root carbon (UGC) stock in tC ha−1 to CBH are then given for each tree by the respective relationships
and
The proportion of root carbon was taken to be 50 %, knowing that this is undoubtedly an overestimate (Lamlom and Savidge, 2003). By considering these two plausible relationships for the OHP forest, we can estimate the uncertainty in the choice of regression parameters, which are themselves associated with clearly similar soil types between the different sites. Equation (6) gives a low estimate, while Eq. (7) gives a high estimate. Generalization over a larger area was obtained in the same way as for AGC.
The TTHs determined from each lidar profile over the entire area covered by the flights are first presented. We then present the choice of the regular grid on which we have chosen to work in order to first compare field and lidar observations for validation purposes, and then we give an estimate of the carbon stocks trapped in the trees.
4.1 Individual TTH
The TTHs found on and around the OHP site for each lidar profile are shown in Fig. 5. Values range from less than 2 m to ∼ 10 m. Trees are therefore underdeveloped due to the available depth of soil but also due to strong competition between individuals (Di Iorio et al., 2005). The boot-shaped area shown in blue to the southwest of O3HP in Fig. 5 corresponds to a clear cut made 2 years before the flight period. It can also be seen on the aerial photography in Fig. 1b. The highest TTHs are mainly located on the slope of the OHP hill.
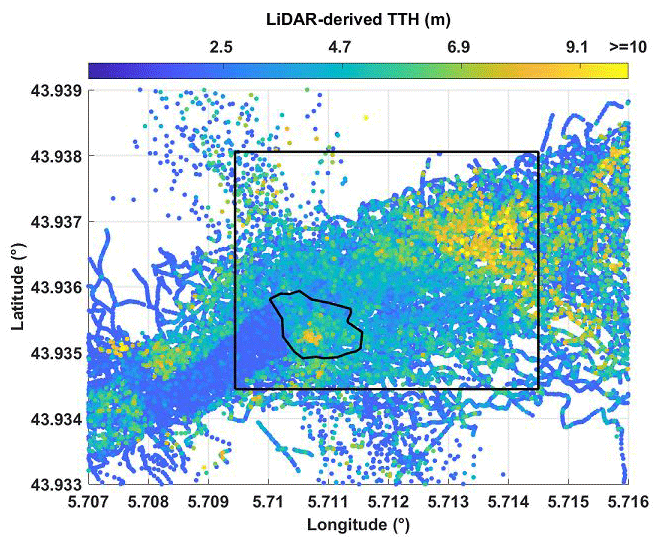
Figure 5TTHs derived from airborne lidar measurements. The study area is identified by the black rectangle. The O3HP site is also surrounded by a black line.
4.2 Regular grid of TTH
To enable a comparison of lidar-derived TTHs with in situ measurements, we have chosen to use a regular 8×8 m synthesis horizontal grid. This grid size also corresponds to the accuracies we can expect from GPS locations (Shang and Chazette, 2014b). It also provides a representative number of lidar profiles at each grid point. The result of this synthesis is shown in Fig. 6 for the maximum TTH (TTHmax; Fig. 6a) and mean tree height (TTHmean; Fig. 6c) of each grid point. Figure 6e shows the standard deviation on TTHmax calculated for each grid point from the elementary grid. The histograms to the right of the figures summarize the resulting dataset. As expected, standard deviation is greater on the slope where the tallest trees are located, with values over 2 m. On the OHP plateau, the standard deviation is comparable to the uncertainty of the lidar-derived TTH on individual trees. There, mean TTHs are fairly uniform, and standard deviations are of the order of 0.37 m on average.
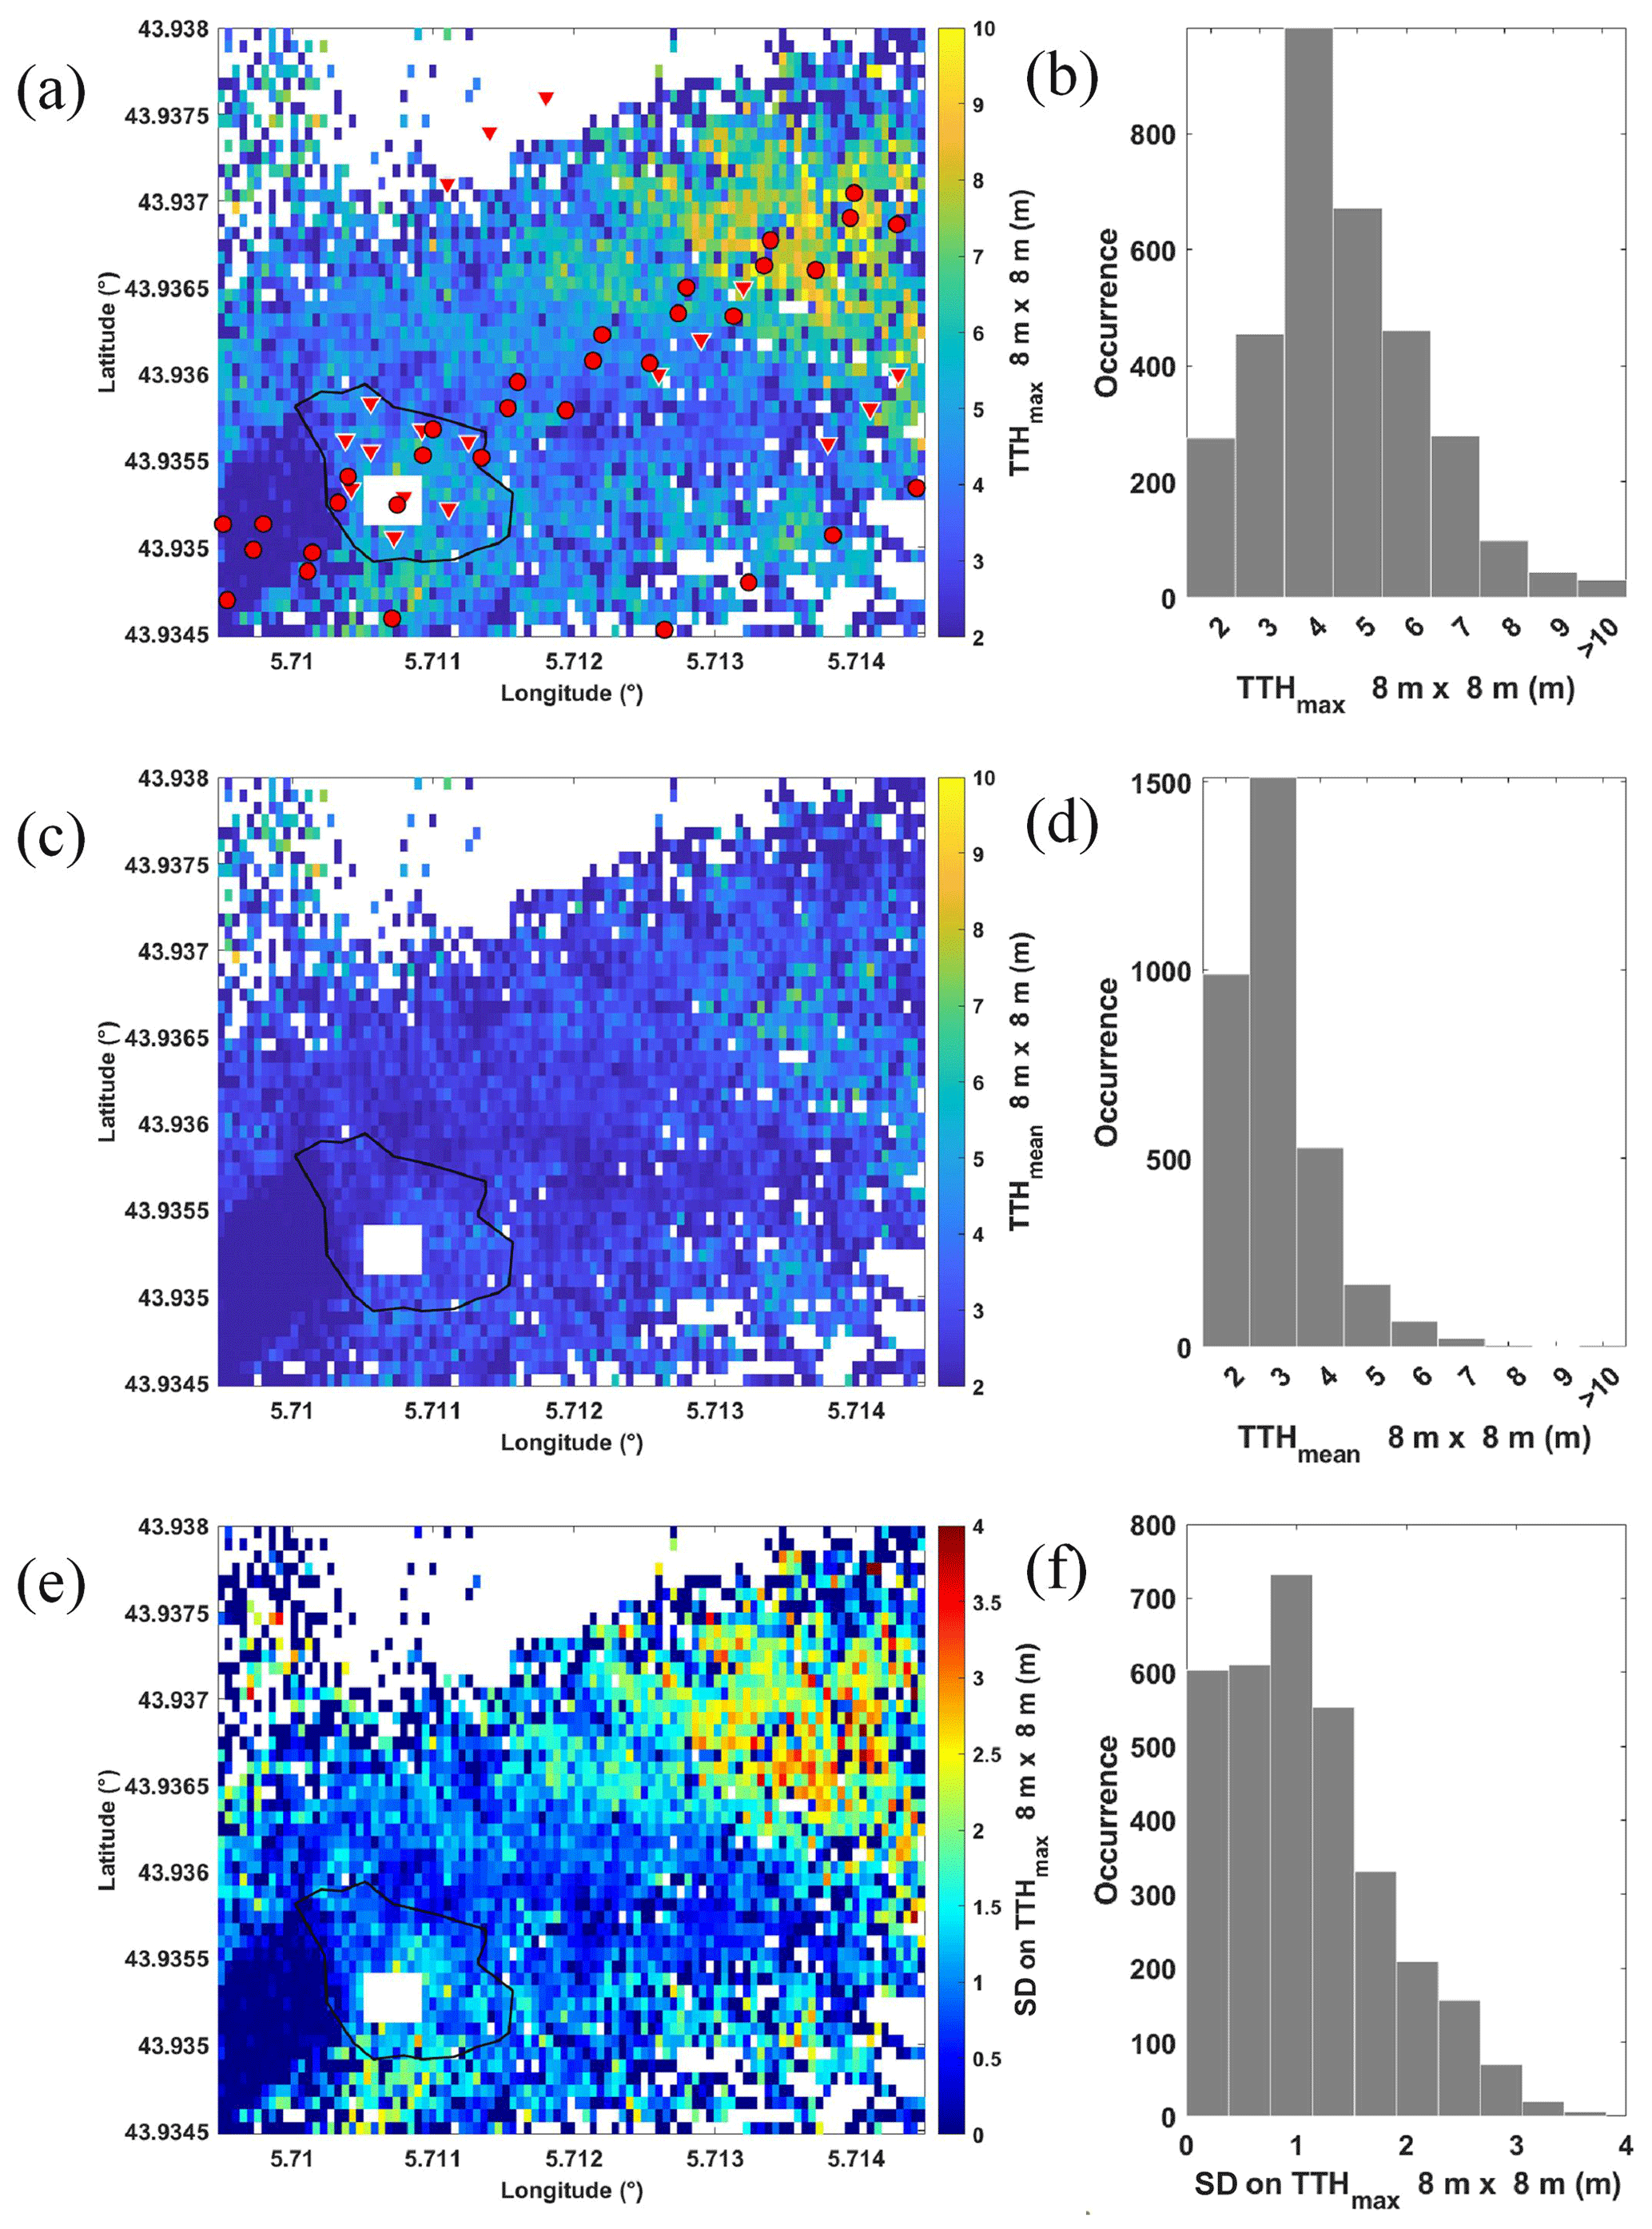
Figure 6Regular grid of (a) TTHmax, (c) TTHmean, and (e) standard deviation on TTH (TTHSD). The histograms corresponding to the values given in panels (a), (c) and (e) are shown in panels (b), (d) and (f), respectively. Inverted red triangles represent the location of in situ dendrometric measurements. The red circles represent the location of the ground footprints of the GEDI lidar on the ISS. White areas correspond to locations not sampled by airborne lidar. The rain exclusion system is also highlighted by a white rectangle.
4.3 Data coherence between 2012 and 2023
The airborne lidar measurements were not obtained at the same time as the actual surveys of the OHP forest. To assess the 2023 biomass carbon stock, it is therefore necessary to check whether the 2012 airborne measurements are representative of the site conditions in 2023. In Fig. 7a, we have therefore compared TTHmax retrieved from dendrometric measurements for identical geographical locations from 2012 and 2018–2023. Taking into account location errors, but with the advantage of great homogeneity of the TTHs on the OHP plateau, TTH variations remain on average below the 1 m precision value of the lidar measurements. The comparison shown in Fig. 7b was drawn for TTHmax on the same locations, between lidar and dendrometric measurements taken in 2012 and 2018–2023, respectively. Measurements at the O3HP site and on the slope of the forest area are identified by red and blue dots, respectively. A standard deviation of less than 1.2 m between lidar-derived TTHmax and dendrometric measurements and a correlation coefficient of 0.73 are computed. By comparing these two previous figures, we can therefore conclude that the lidar measurements collected in 2012 are relevant for the assessment of forest biomass in 2023.
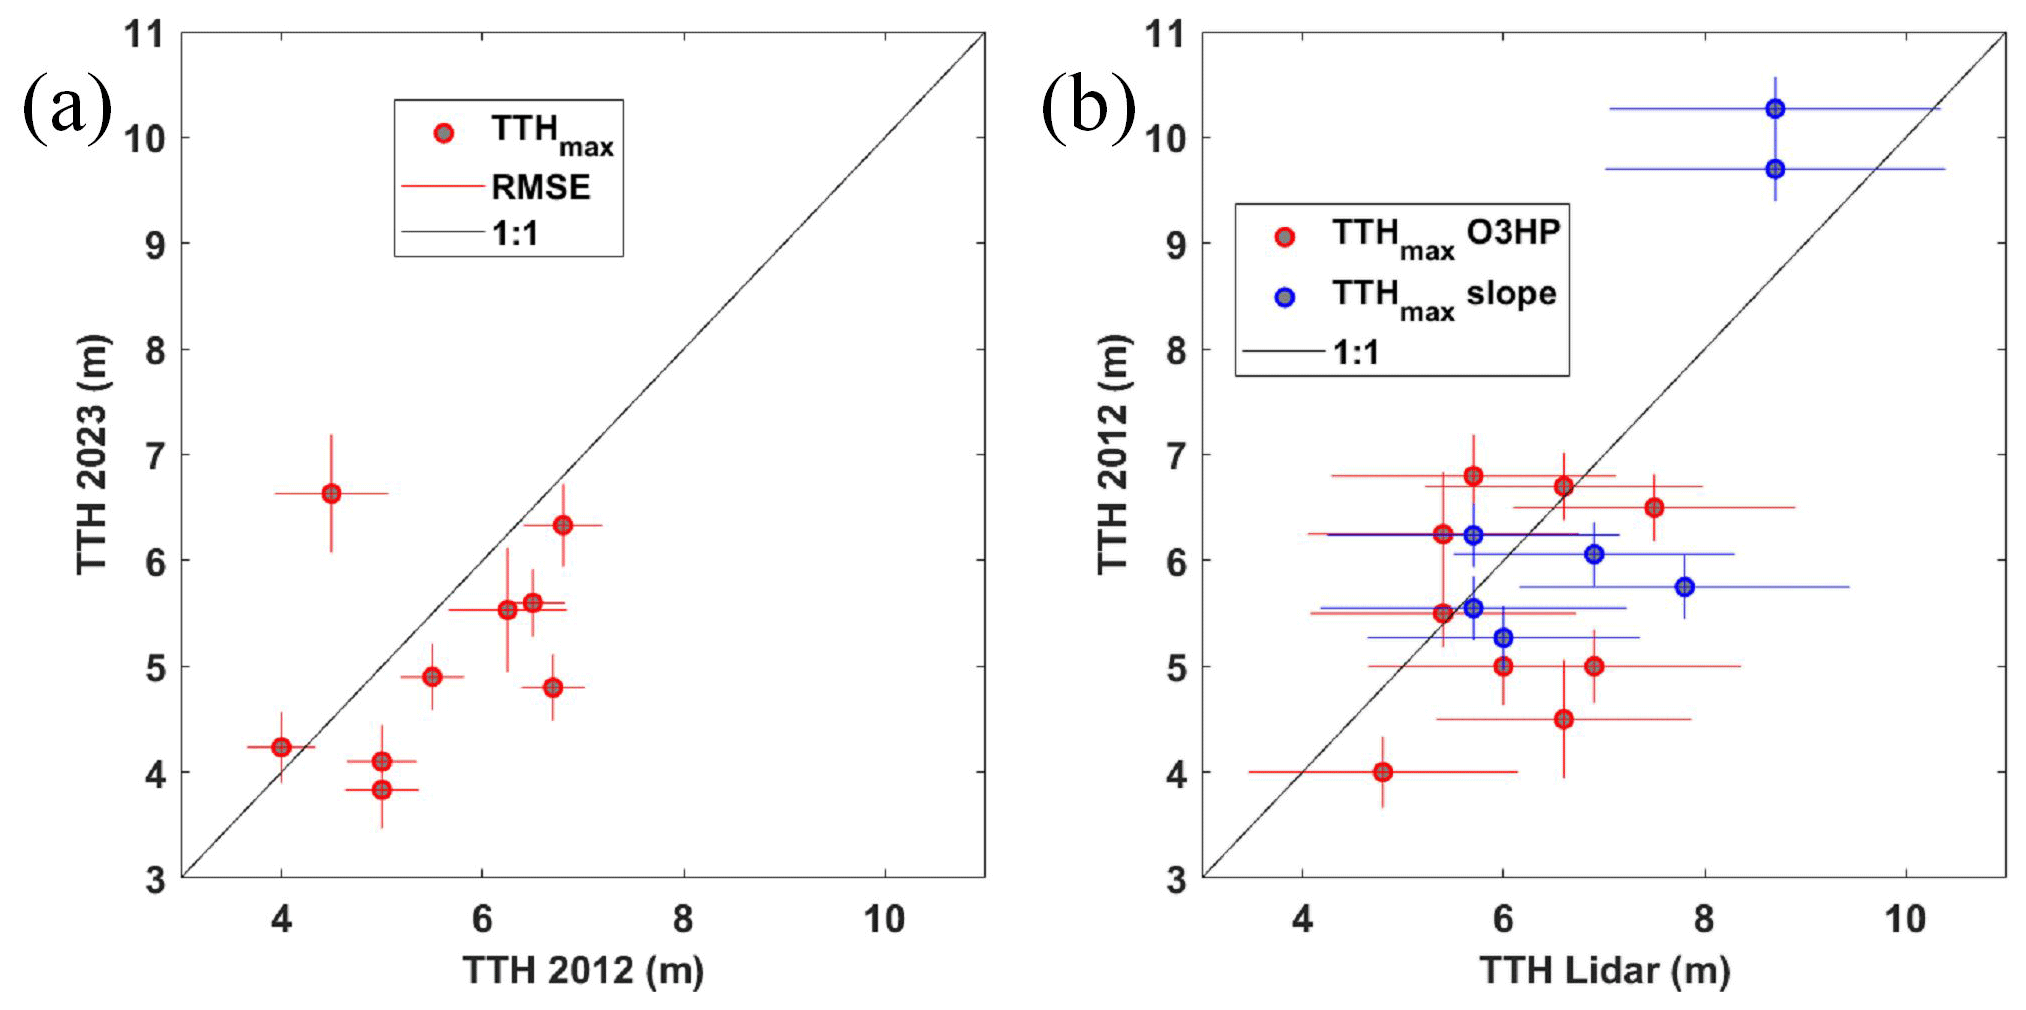
Figure 7Comparison between (a) the dendrometric measurements of the tallest TTH from 2012 (TTH 2012) and 2023 (TTH 2023) on the O3HP site and (b) lidar-derived TTH (TTH lidar) and the dendrometric measurements of the TTH from 2012 (TTHmax O3HP, red dots) and in 2023 along the slope (TTHmax slope, blue dots). The root mean square error (RMSE) for each measurement is shown by the horizontal and vertical lines.
Applying the allometric relationships given in Sect. 3.2 and 3.3 to the TTH data retrieved from airborne lidar measurements results in AGC and UGC stocks.
5.1 Aboveground carbon stock
UGC mapping is shown in Fig. 8a. Carbon stocks of over 40 tC ha−1 are associated with the tallest tree area on the slope. It is also for these areas that the statistical dispersion around AGC is greatest (Fig. 8c), as they are surrounded by trees of very variable size. On the plateau where the O3HP site is located, statistical dispersion is lower, ranging between 2 and 3 tC ha−1 for AGC values of the order of 6–7 tC ha−1. Histograms of AGC values and their statistical dispersion are also shown in Fig. 8b and Fig. 8d, respectively. The transition between AGC values on the plateau and on the slope is gradual, which may explain the lognormal shape of the distributions. Averaged over the whole sampled area, the value of AGC is ∼ 15 tC ha−1 with a statistical dispersion of 14 tC ha−1, mainly due to the TTH contrast between the plateau and the slope. We see in Sect. 5.3 how these values compare with measurement uncertainties. In Shang and Chazette (2014b), Table 5 shows different AGC assessments for different forest types composed of great-height (> 20 m) mature trees. AGC reported for predominantly oak forests is of the order of 100 tC ha−1 (Le Maire et al., 2005; Lefsky et al., 1996; Vallet et al., 2009). We stand much below this value for the O3HP site, chiefly composed of old and stagnant trees.
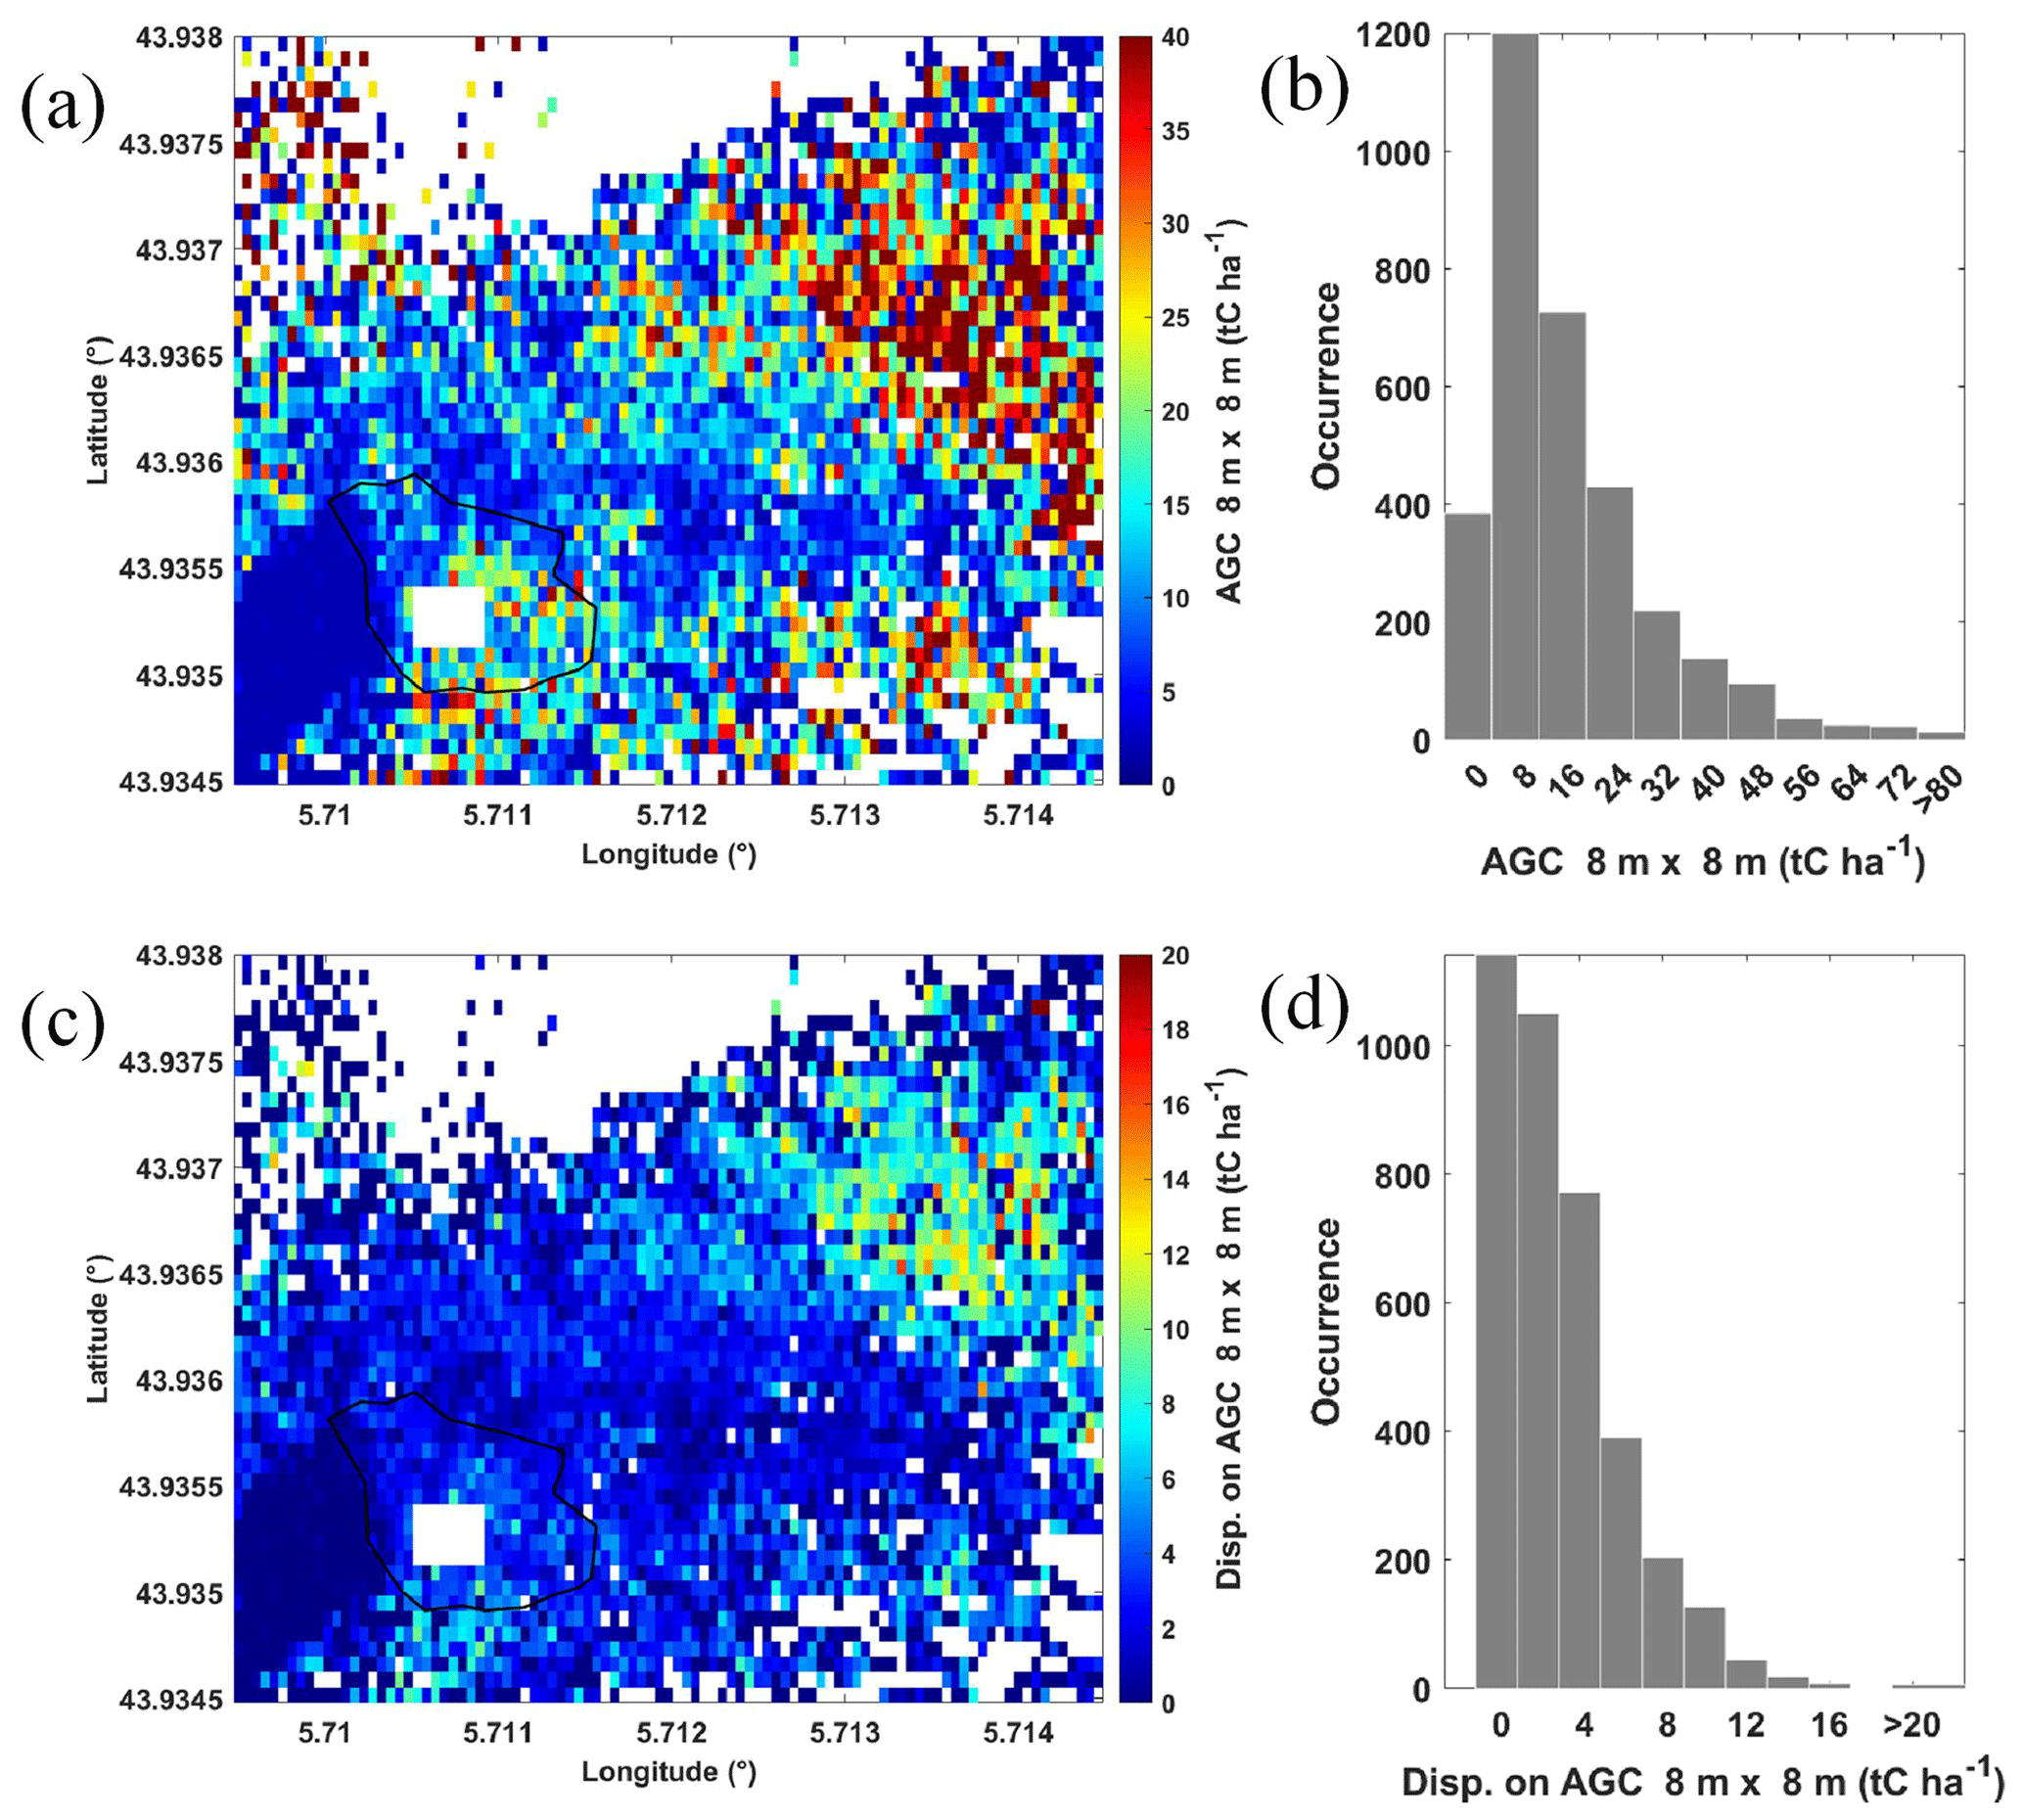
Figure 8(a) AGC derived from the lidar and allometric measurements at the O3HP site and surrounding area. (b) Histogram of AGC related to panel (a). (c) Statistical dispersion around values of the panel (a) and panel (d) associated histogram. White areas correspond to locations not sampled by airborne lidar. The rain exclusion system is also highlighted by a white rectangle.
5.2 Underground carbon stock (roots)
The carbon stock associated with roots is calculated using the allometric relationships of Sect. 3.2 and 3.4 applied to lidar-derived TTH. Figure 9a shows UGC stock of roots following the modelling of Slot et al. (2012), which is the low estimate. The corresponding histogram of UGC is shown in Fig. 9b. With this model, UGC represents between a quarter and a third of AGC for the tallest tree. On the plateau, UGC and AGC are more closely matched. This may be explained by the higher relative root system of the trees on the plateau, as they compete more in less nutrient-rich soil (Gauquelin et al., 2018). The allometric law used here was established by applying a regression fit on data acquired at a site located in an environment similar to that of O3HP and primarily populated by downy oaks. The quantity of UGC associated with the roots averages to 8 ± 3 tC ha−1 over the entire sampled area, i.e. about half that of AGC for the same surface. For the tallest trees, UGC is ∼ 30 % of the total carbon stock. Considering the modelling of Drexhage and Colin (2001), the contribution of roots to total tree carbon stock is higher. Figure 9c shows the differences between the two models, and Fig. 9d shows the associated histogram. The average UGC is then 10 ± 7 tC ha−1 with this second model. The contribution of roots becomes significant for the tallest trees (∼ 40 %) but remains comparable to that established via the first model for trees located on the plateau. There is scarce information on root biomass in the literature. For mature forests, such as the one at OHP, but mainly composed of spruce and pine (∼ 95 %), Næsset and Gobakken (2008) attribute ∼ 25 % of tree biomass to roots.
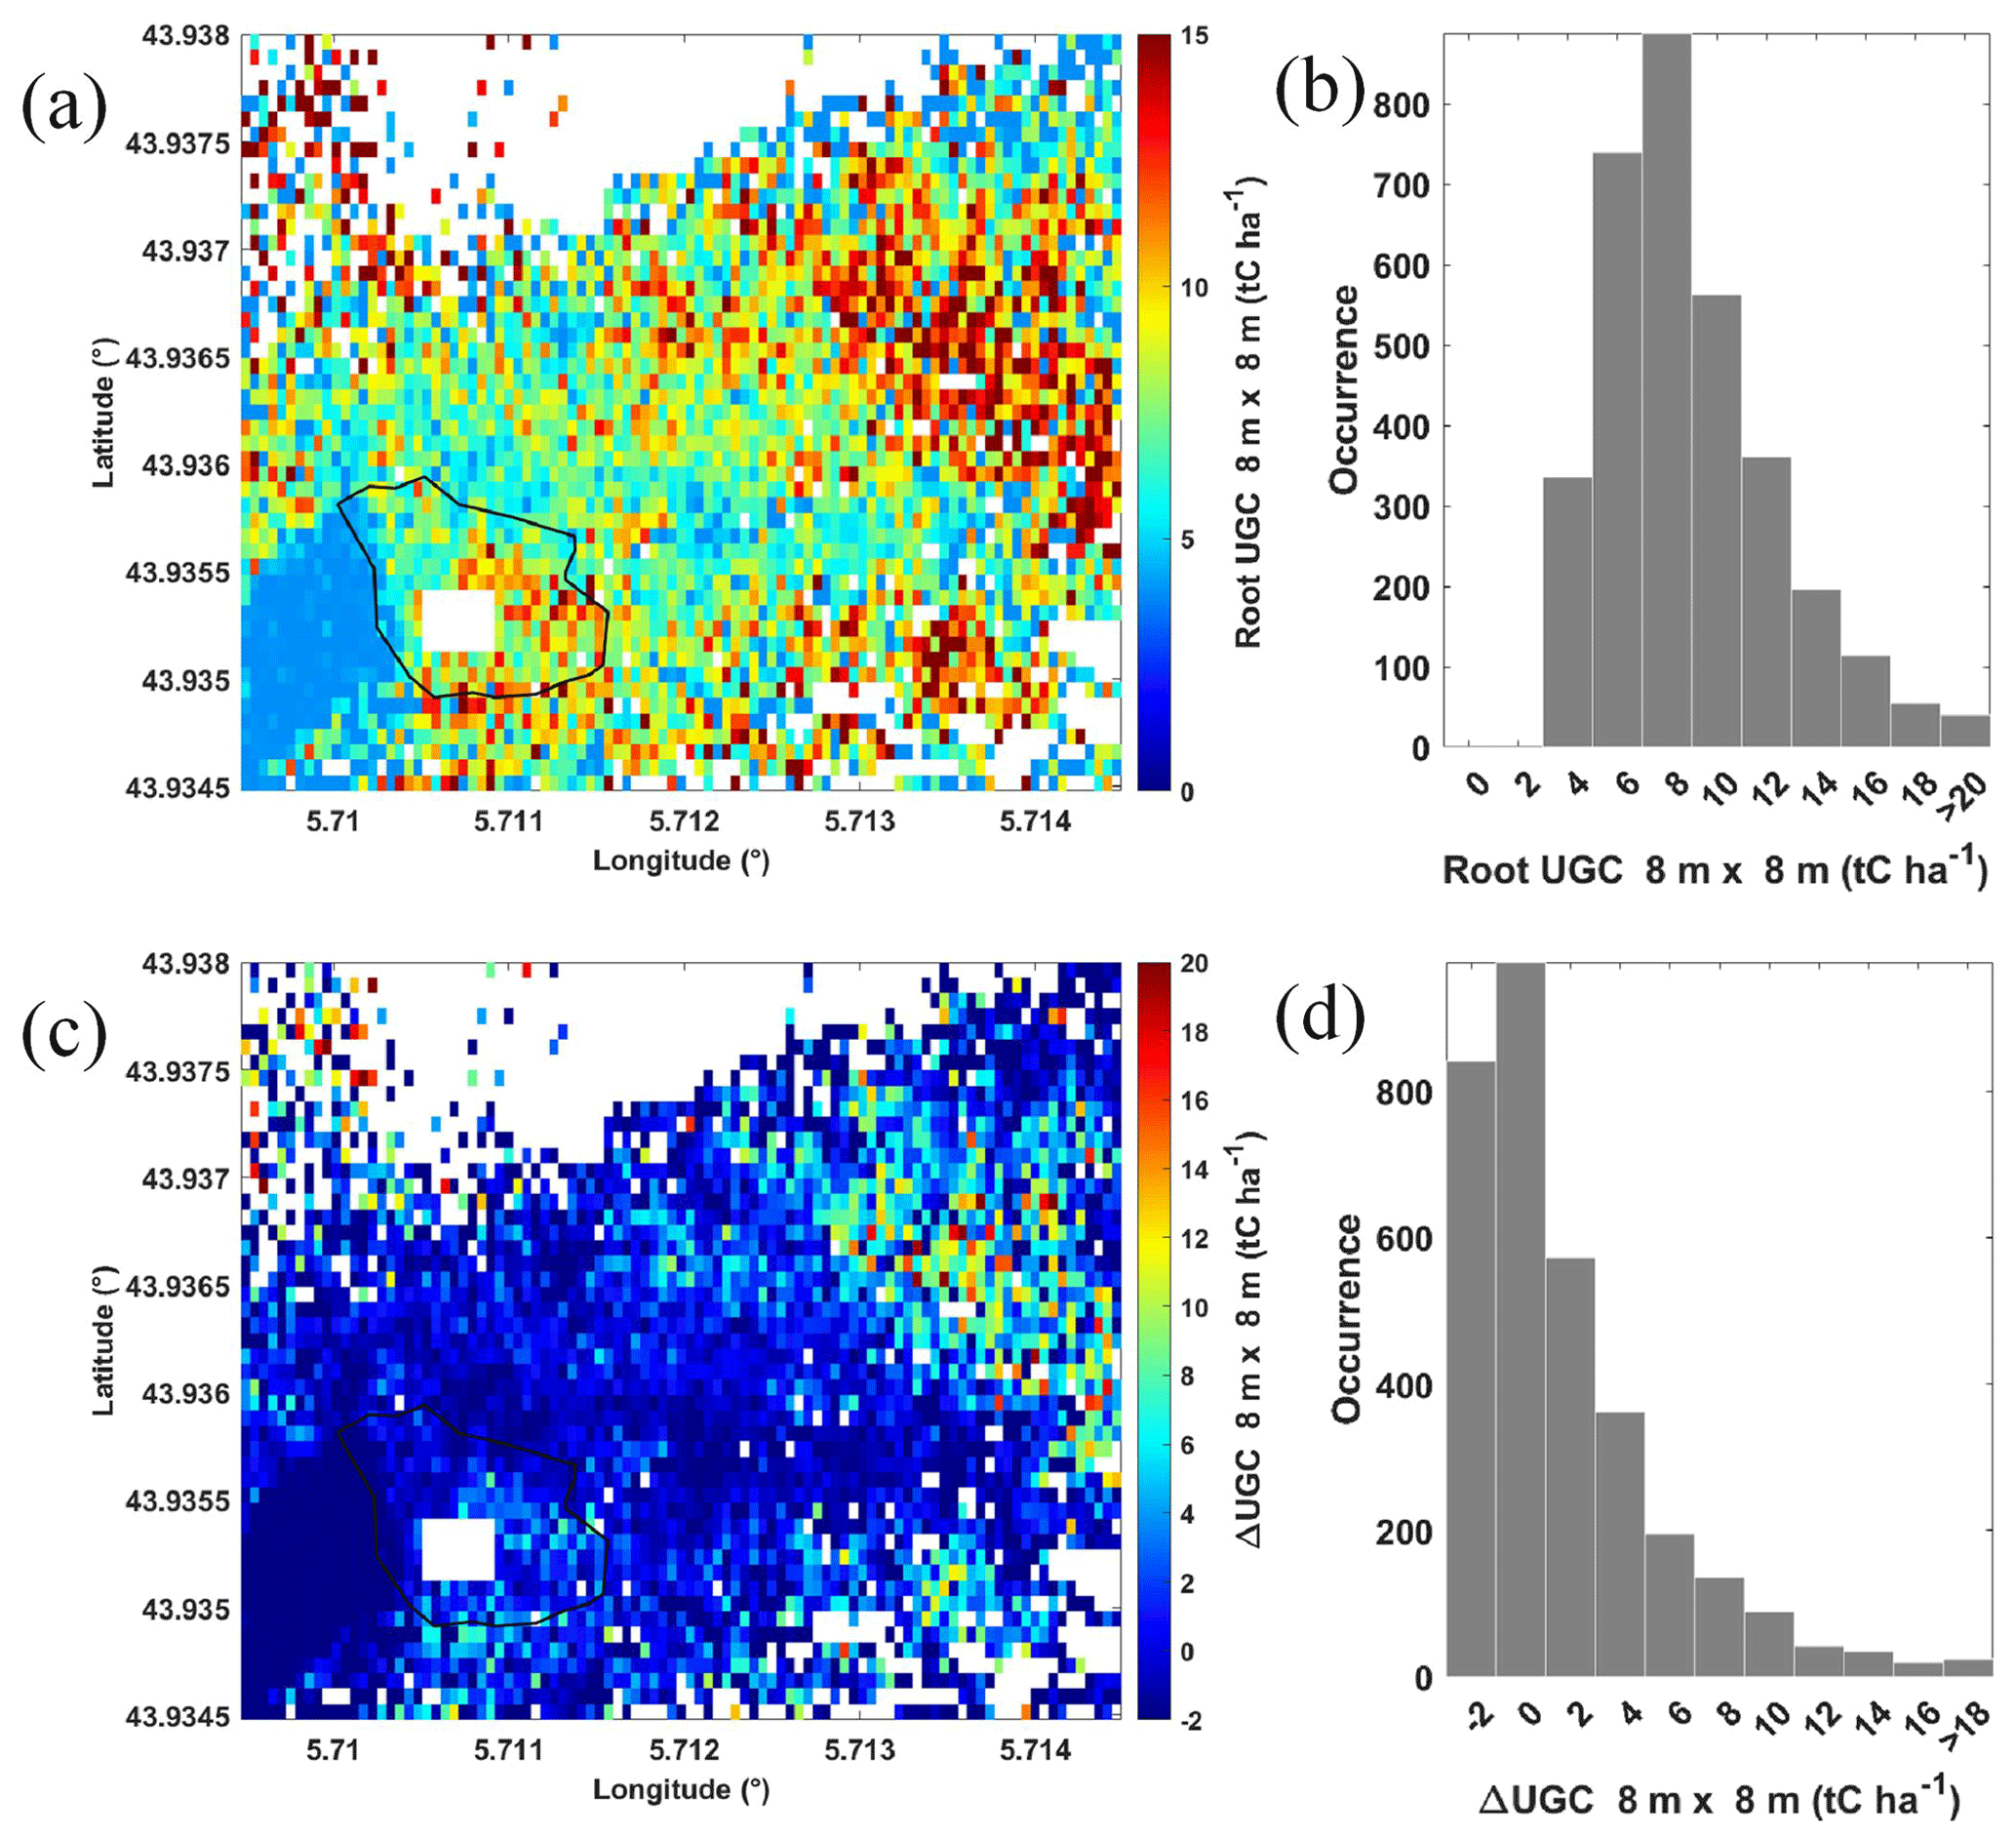
Figure 9(a) UGC stock following the allometric law of Slot et al. (2012) (Slot et al., 2012) (low estimate) and (b) corresponding histogram. (c) Difference between the modelling of Drexhage and Colin (2001) and Slot et al. (2012) (Drexhage and Colin, 2001; Canadell and Roda, 1991) (high minus low estimate) and (d) corresponding histogram. White areas correspond to locations not sampled by airborne lidar. The rain exclusion system is also highlighted by a white rectangle.
5.3 Uncertainties
Calculating tree carbon stocks is associated with numerous uncertainties that are not always easy to assess. Nevertheless, in this section we give an uncertainty estimate by gathering the contributions of uncertainties in field and airborne lidar measurements. As the mathematical relationships used are highly non-linear and the sources of statistical error can be large, we have used a Monte Carlo approach (Shang and Chazette, 2015; Chazette et al., 2001). For this purpose, we assumed that the statistical errors follow normal statistical distributions and that the sources of uncertainty are independent of each other, which is justified by the sheer diversity of observations used.
The first source of uncertainty is linked to the accuracy of spot TTH retrieval by lidar measurements. The second depends on the choice of the allometric law and the regression performed on dendrometric measurements, with each measurement point having associated errors. The allometric law must correspond to the forest environment studied, which is often highly specific. Even if the individual trees studied belong to the same species, allometric laws can vary significantly depending on the environmental conditions in which the trees have grown. To limit this effect, which is difficult to quantify, we used TTH and CBH measurements taken directly on the O3HP site and its surroundings.
It should be noted that there is a non-negligible proportion (∼ 20 %) of Montpellier maples, which may bias the allometric law slightly downwards (Fig. 4) but which are indistinguishable by lidar measurements alone. They are part of the local forest biomass regardless. The allometric law used to calculate the quantity of AGC of a tree is provided by Vallet et al. (2006), with the uncertainties on several coefficients applied in the equation, and these values were considered in our error calculations. As previously explained, for UGC, we used two laws from the literature on the same types of trees in the Mediterranean region and under analogous climatic conditions. These two laws provide high and low estimates of root UGC.
The third source of uncertainty is the wood density and the carbon content. These values are also highly dependent on the environmental conditions where the tree grows, as well as its age. We have selected the values given in the literature for the tree species studied. Still, the CAR may vary by a few percent for hardwood species (3 % to 4 %) (Lamlom and Savidge, 2003), and this should be similar for wood density, especially in the presence of species other than oak, such as maple (Acer velutinum), with DEN estimated to be between 520 ± 70 and 560 ± 40 kg m−3 (Le Maire et al., 2005) for Asian maple. This uncertainty directly affects the carbon density estimate. Considering the proportion of maples, it leads to a relative uncertainty of AGC of ∼ 5 %, assuming that Montpellier and Asian maples have identical wood densities. Finally, for UGC, a significant uncertainty may be linked to the estimation of root quantity. There is little information about the previous parameter in the literature, and the associated error is therefore difficult to quantify. The laws used in this study were established for roots > 1 cm in diameter and therefore underestimate root carbon stock. As with AGC, the proportion of carbon in roots is often considered to be equal to 50 %. This is certainly associated with an uncertainty at least identical to that for stem wood. Thus, the relative uncertainty associated with UGC could be estimated to be ∼ 4 % without being able to assess the influence of smaller roots. We have not considered the uncertainties associated with slope effects and multiple scattering, as they are not significant for the small-footprint lidar employed (Shang and Chazette, 2014a).
Figure 10 shows the relative statistical errors resulting from the Monte Carlo computations. TTH uncertainties derived from lidar measurements are the most significant ones. Obviously, the smaller the tree, the greater the relative measurement uncertainty is. For a 5–6 m (10–12 m) tall tree typical of the O3HP site on the plateau, the error in the lidar estimates of AGC is ∼ 12 % (∼ 7 %) (blue squares of Fig. 10). The allometric law linking CBH to TTH, on the other hand, induces a statistical uncertainty of ∼ 10 % (5 %) (green dots of Fig. 10), with a negligible bias. The uncertainty associated with the precision of the regression law used to determine AGC is lower than the latter, with a value of ∼ 5 % (∼ 4 %) (purple diamonds of Fig. 10). The total relative statistical uncertainty, including that on DEN and CAR, is therefore ∼ 17 % (11 %). For AGC, this is comparable to that estimated by Shang and Chazette (2014b).
The same type of calculation was applied for UGC. It leads to a total statistical error of ∼ 8 % (5 %) (light-blue squares and red dots of Fig. 10). This error does not account for the bias induced by the chosen allometric law or the assessment of root quantity. We can get an idea of this by looking at Fig. 11, which shows the evolution of root UGC as a function of TTH for both models, as well as that of AGC for comparison. This figure was drawn using a 2×2 m elementary grid. We can thus see in Fig. 11 that a bias of the order of 100 % can be reached by not considering the right model. Note that UGC represents just under 50 % of the quantity of AGC with the model associated with the high estimate and ∼ 25 % with the model associated with the low estimate, which is closer to what is generally published (Næsset and Gobakken, 2008).
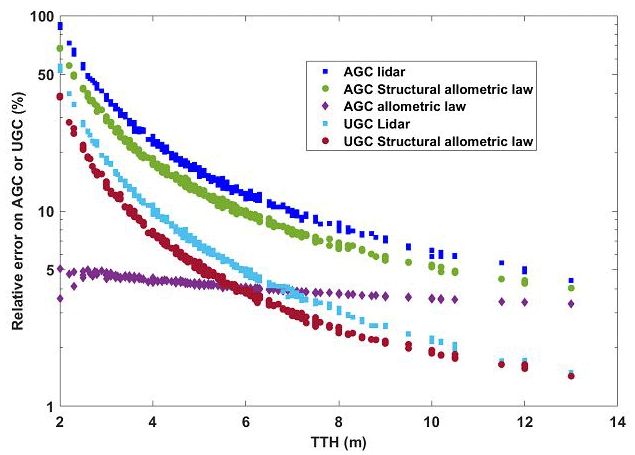
Figure 10Relative uncertainties computed from a Monte Carlo approach for AGC and UGC. They are due to uncertainties on lidar measurements, structural allometric law relating CBH to TTH and AGC allometric law.
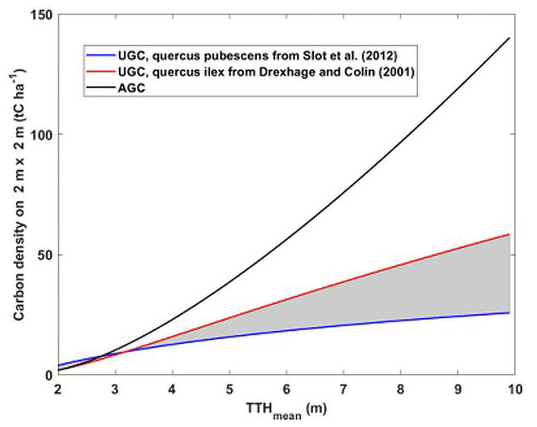
Figure 11Root UGC and AGC both derived from allometric laws against TTH. UGC is computed from Eqs. (6) and (7), whereas AGC is computed from Eq. (5). The shaded area between the two root UGC curves represents the possible zone for the carbon density for downy oaks. It is bounded by the estimate on Quercus pubescens trees (blue curve) and Quercus ilex trees (red curve).
5.4 Coherence with GEDI for aboveground carbon density
The GEDI mission led by NASA involves a lidar system aboard the spaceborne station ISS, orbiting at an altitude of around 400 km. This mission aims at characterizing ecosystem structure and dynamics, thereby enhancing the quantification and understanding of Earth's carbon cycle and biodiversity (Dubayah et al., 2020). In our study, we assess the consistency between airborne lidar measurements and those obtained from the GEDI lidar. We used GEDI level 2B version 2.1 and 4A version 2.1 data for TTH and biomass products, respectively. These data are derived from allometric equations based on waveform metrics calibrated using biomass measurements from various forest plots (Duncanson et al., 2022; Kellner et al., 2023). They are available from 18 April 2019 to 22 December 2022. The GEDI footprint is 25 m approximately every 60 m along the track. TTHs derived from GEDI have an expected standard deviation of 2.7 m with low bias (Lang et al., 2022).
Figure 12 compares TTHmax and AGC calculated from airborne and GEDI lidar profiles for the same locations identified in Fig. 6a. The airborne measurements have been scaled down to match the size of the GEDI footprint, with the same method as described in Sect. 3.3. The operational biophysical metrics applied to each GEDI waveform appear to be generally relevant for the OHP forest, which is not very dense and for which the effects of multiple scattering at 1064 nm (Shang and Chazette, 2015) probably have only a minor influence. Accounting for the error bars, we observe very good agreement on the assessment of TTHmax (Fig. 12a) except for some taller trees identified by GEDI. As the taller trees are located on the slope, the GEDI measurement is likely to be biased, given its associated footprint. For a slope of ∼ 30 % (∼ 17°) like the one observed on the site, a possible bias can be between 1 and 3 m (Shang and Chazette, 2015).
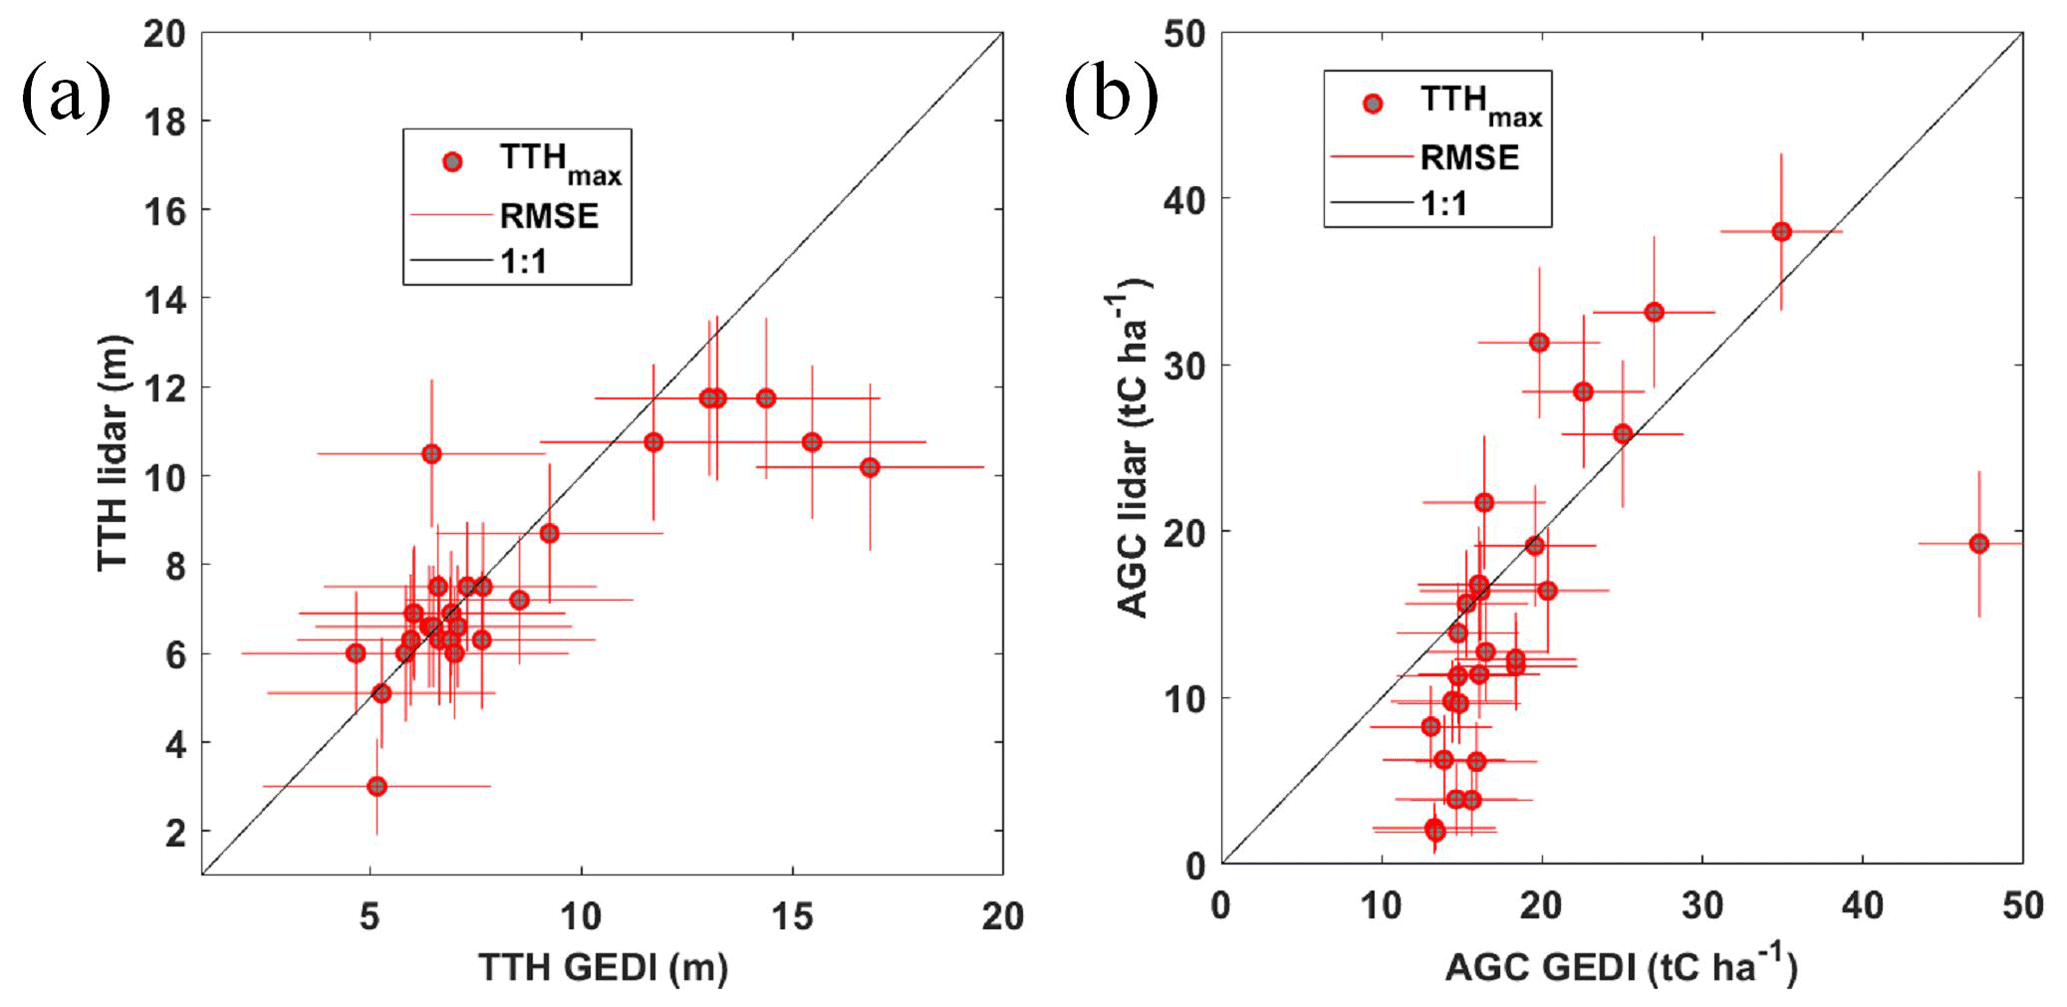
Figure 12(a) GEDI-derived (TTH GEDI) and airborne-lidar-derived (TTH lidar) tree top heights. (b) GEDI-derived (AGC GEDI) and airborne-lidar-derived (AGC lidar) aboveground carbon stocks. The RMSE is given for each measurement by the red lines. The tree top height for the tallest tree (TTHmax) is shown by the red circles.
Applied to AGC (Fig. 12b), the same type of comparison reveals good agreement for the taller trees associated with the higher carbon stocks. On the other hand, a threshold phenomenon can be observed for areas with lower AGC (< 15 tC ha−1) for the GEDI retrievals. This phenomenon may be linked to the operational allometric modelling used to derive AGC from GEDI profiles for downy oaks. We note that the disagreement observed on the TTH of tall trees does not necessarily induce a significant difference in AGC, except for one GEDI footprint which may have included the OHP site buildings.
When it comes to TTH and carbon content of aboveground and root biomasses characterization, high resolution (8×8 m) is an essential prerequisite for monitoring the climatic impact on sensitive ecosystems such as Mediterranean downy oak forests. The calculation relies on the coupling of an allometric law and airborne lidar measurements on a ∼ 24 ha study site at OHP. Tallest trees are associated with a TTH of ∼ 6 m on the plateau and ∼ 8–12 m on the slope. AGC was assessed as equal to 15 tC ha−1 with a statistical dispersion of 14 tC ha−1 over the whole study site. The root carbon stock is at most 50 % of AGC, with a more likely value of 25 % using the low estimate considered.
The error study budget has been completed to the best of current knowledge, leading to relative uncertainties of 11 %–17 % and 7 % for AGC and root UGC, respectively, for trees between 5 and 12 m tall. Additional non-negligible biases need to be considered, above all for UGC. They are first and foremost linked to the choice of allometric law, and their evaluation is limited by the number of samples available in the literature, given the wide diversity of environmental conditions where trees grow. For our study, the allometric law relating CBH to TTH was evaluated on the OHP site itself. On the other hand, allometric laws for biomass calculations are taken from the literature and established on other sites with distinct species that may therefore differ significantly. This is the most important source of bias, which can lead to errors over 100 % when considering high or low estimates for root biomass. For aboveground biomass, the law considered was established for oak species and forest ecosystems different from those found in the Mediterranean region. We have no way of assessing the associated bias, as we lack comparable studies for Mediterranean ecosystems, which need to be implemented.
Be that as it may, the consistency observed between the airborne lidar measurements and those from the ISS's GEDI lidar is very encouraging. Given the resolution of the GEDI footprint, TTHs are found to be similar with both instruments. The discrepancies observed for larger trees can be attributed to the slope effect on GEDI footprint size. For AGC, the agreement is also favourable, given that the allometric laws considered are not necessarily the same over the OHP site. We do not consider here validating the level 2B and 4B products of the GEDI mission's operational processing chain but rather demonstrate a significant consistency with the results of small-scale airborne lidar measurements.
There is also a potential interest in a precise absolute quantification of carbon stocks in forest biomass worldwide. Their evolution in time needs to be quantified as precisely as possible in order to gauge entropic activities' impact on biodiversity. It is therefore essential to define initial conditions on reference sites using a well-established methodology and to repeat the approach in the years/decades to come.
The data are available upon request from the authors in the form of ASCII files.
MC: field campaign, methodology, data processing and writing (original draft preparation). PC: conceptualization, campaign coordination, methodology, lidar data processing and writing (original draft preparation). IMR: allometric measurements and paper review. XS: field campaign, lidar data processing and paper review. JT: instrument preparation, field campaign and paper review. JPO: field campaign and paper review. IXR: paper review. NM: allometric measurements and paper review. All authors have read and agreed to the published version of the paper.
The contact author has declared that none of the authors has any competing interests.
Publisher’s note: Copernicus Publications remains neutral with regard to jurisdictional claims made in the text, published maps, institutional affiliations, or any other geographical representation in this paper. While Copernicus Publications makes every effort to include appropriate place names, the final responsibility lies with the authors.
We acknowledge the ultralight-aircraft pilot Franck Toussaint. The authors would like to thank AnaEE-France, AnaEE-ERIC, UAR 3470 Pythéas and the ECCOREV federation (FR3098) for support and granting permission to access the O3HP site and associated data. Thomas Germain, Nicolas Pouchard, Daniel Larouelle, and the ECOSOM and POE teams of the IMBE are particularly thanked for the tree and soil data.
This research was funded by the Centre National d'Etudes Spatiales (CNES) and the Commissariat à l'Energie Atomique et aux Energies Alternatives (CEA). In situ data acquisition, processing and interpretation have been possible thanks to AOI ECCOREV 2014 “TRANSECT”, ERASMUS+ Strategic Partnership “EduSaPMan” and AnaEE-France (ANR-11-INBS-0001) funding the project.
This paper was edited by Paul Stoy and reviewed by Alexandros D. Papayannis and one anonymous referee.
Allouis, T., Durrieu, S., Cuesta, J., Chazette, P., Flamant, P. H., and Couteron, P.: Assessment of tree and crown heights of a maritime pine forest at plot level using a fullwaveform ultraviolet lidar prototype, 2010 IEEE International Geoscience and Remote Sensing Symposium, 25–30 July 2010, Honolulu, HI, USA, 1382–1385, https://doi.org/10.1109/IGARSS.2010.5651026, 2010.
Buma, B. and Wessman, C. A.: Forest resilience, climate change, and opportunities for adaptation: A specific case of a general problem, Forest Ecol. Manag., 306, 216–225, https://doi.org/10.1016/j.foreco.2013.06.044, 2013.
Canadell, J. and Roda, F.: Root biomass of Quercus ilex in a montane Mediterranean forest, Can. J. Forest Res., 21, 1771–1778, https://doi.org/10.1139/x91-245, 1991.
Chazette, P. and Totems, J.: Mini N2-Raman Lidar onboard ultra-light aircraft for aerosol measurements: Demonstration and extrapolation, Remote Sens., 9, 1226, https://doi.org/10.3390/rs9121226, 2017.
Chazette, P., Pelon, J., and Mégie, G.: Determination by spaceborne backscatter lidar of the structural parameters of atmospheric scattering layers., Appl. Opt., 40, 3428–3440, https://doi.org/10.1364/AO.40.003428, 2001.
Chazette, P., Totems, J., Hespel, L., and Bailly, J. S.: Principle and Physics of the LiDAR Measurement, in: Optical Remote Sensing of Land Surface: Techniques and Methods, Elsevier, 201–247, https://doi.org/10.1016/B978-1-78548-102-4.50005-3, 2016.
Chazette, P., Raut, J. C., and Totems, J.: Springtime aerosol load as observed from ground-based and airborne lidars over northern Norway, Atmos. Chem. Phys., 18, 13075–13095, https://doi.org/10.5194/acp-18-13075-2018, 2018.
Cuesta, J., Chazette, P., Allouis, T., Flamant, P. H. P. H., Durrieu, S., Sanak, J., Genau, P., Guyon, D., Loustau, D., and Flamant, C.: Observing the Forest Canopy with a New Ultra-Violet Compact Airborne Lidar, Sensors, 10, 7386–7403, https://doi.org/10.3390/s100807386, 2010.
Curtis, P. G., Slay, C. M., Harris, N. L., Tyukavina, A., and Hansen, M. C.: Classifying drivers of global forest loss, Science, 361, 1108–1111, https://doi.org/10.1126/science.aau3445, 2018.
Diffenbaugh, N. S., Pal, J. S., Giorgi, F., and Gao, X.: Heat stress intensification in the Mediterranean climate change hotspot, Geophys. Res. Lett., 34, 11706, https://doi.org/10.1029/2007GL030000, 2007.
Drexhage, M. and Colin, F.: Estimating root system biomass from breast-height diameters, Forestry, 74, 491–497, https://doi.org/10.1093/forestry/74.5.491, 2001.
Dubayah, R., Blair, J. B., Goetz, S., Fatoyinbo, L., Hansen, M., Healey, S., Hofton, M., Hurtt, G., Kellner, J., Luthcke, S., Armston, J., Tang, H., Duncanson, L., Hancock, S., Jantz, P., Marselis, S., Patterson, P. L., Qi, W., and Silva, C.: The Global Ecosystem Dynamics Investigation: High-resolution laser ranging of the Earth's forests and topography, Sci. Remote Sens., 1, 100002, https://doi.org/10.1016/j.srs.2020.100002, 2020.
Duncanson, L., Kellner, J. R., Armston, J., Dubayah, R., Minor, D. M., Hancock, S., Healey, S. P., Patterson, P. L., Saarela, S., Marselis, S., Silva, C. A. E. A. E., Bruening, J., Goetz, S. J., Tang, H., Hofton, M., Blair, B., Luthcke, S., Fatoyinbo, L., Abernethy, K., Alonso, A., Andersen, H. E., Aplin, P., Baker, T. R., Barbier, N., Bastin, J. F., Biber, P., Boeckx, P., Bogaert, J., Boschetti, L., Boucher, P. B., Boyd, D. S., Burslem, D. F. R. P., Calvo-Rodriguez, S., Chave, J., Chazdon, R. L., Clark, D. A. D. B., Clark, D. A. D. B., Cohen, W. B., Coomes, D. A., Corona, P., Cushman, K. C., Cutler, M. E. J., Dalling, J. W., Dalponte, M., Dash, J., De-Miguel, S., Deng, S., Ellis, P. W., Erasmus, B., Fekety, P. A., Fernandez-Landa, A., Ferraz, A., Fischer, R., Fisher, A. G., García-Abril, A., Gobakken, T., Hacker, J. M., Heurich, M., Hill, R. A., Hopkinson, C., Huang, H., Hubbell, S. P., Hudak, A. T., Huth, A., Imbach, B., Jeffery, K. J., Katoh, M., Kearsley, E., Kenfack, D., Kljun, N., Knapp, N., Král, K., Krůček, M., Labrière, N., Lewis, S. L., Longo, M., Lucas, R. M., Main, R., Manzanera, J. A., Martínez, R. V., Mathieu, R., Memiaghe, H., Meyer, V., Mendoza, A. M., Monerris, A., Montesano, P., Morsdorf, F., Næsset, E., Naidoo, L., Nilus, R., O'Brien, M., Orwig, D. A., Papathanassiou, K., Parker, G., Philipson, C., Phillips, O. L., Pisek, J., Poulsen, J. R., Pretzsch, H., Rüdiger, C., Saatchi, S., Sanchez-Azofeifa, A., Sanchez-Lopez, N., Scholes, R., Silva, C. A., Simard, M., Skidmore, A., Stereńczak, K., Tanase, M., Torresan, C., Valbuena, R., Verbeeck, H., Vrska, T., Wessels, K., White, J. C., White, L. J. T., Zahabu, E., and Zgraggen, C.: Aboveground biomass density models for NASA's Global Ecosystem Dynamics Investigation (GEDI) lidar mission, Remote Sens. Environ., 270, 112845, https://doi.org/10.1016/j.rse.2021.112845, 2022.
Dupouey, J. L., Pignard, G., Badeau, V., Thimonie, A., Dhôte, J. F., Nepveu, G., Bergès, L., Augusto, L., Belkacem, S., and Nys, C.: Stocks et flux de carbone dans les forêts françaises, Comptes rendus l'Académie d'Agriculture Fr., 85, 293–310, 1999.
Gauquelin, T., Boer, M., Baldy, V., Fernandez, C., Montes, N., Santonja, M., Orts, J., and Reiter, I.: L'O3HP, Oak Observatory at OHP Un site expérimental pour l'étude du fonctionnement et de la biodiversité de la chênaie pubescente face aux changements climatiques, Forêt Méditerranéenne, XXXII, Forêt Méditerranéenne, hal-03556133, 127–132, 2011.
Gauquelin, T., Michon, G., Joffre, R., Duponnois, R., Génin, D., Fady, B., Bou Dagher-Kharrat, M., Derridj, A., Slimani, S., Badri, W., Alifriqui, M., Auclair, L., Simenel, R., Aderghal, M., Baudoin, E., Galiana, A., Prin, Y., Sanguin, H., Fernandez, C., and Baldy, V.: Mediterranean forests, land use and climate change: a social-ecological perspective, Reg. Environ. Chang., 18, 623–636, https://doi.org/10.1007/S10113-016-0994-3/METRICS, 2018.
Giorgi, F.: Climate change hot-spots, Geophys. Res. Lett., 33, 8707, https://doi.org/10.1029/2006GL025734, 2006.
Giorgi, F. and Lionello, P.: Climate change projections for the Mediterranean region, Glob. Planet. Change, 63, 90–104, https://doi.org/10.1016/j.gloplacha.2007.09.005, 2008.
Di Iorio, A., Lasserre, B., Scippa, G. S., and Chiatante, D.: Root system architecture of Quercus pubescens trees growing on different sloping conditions, Ann. Bot., 95, 351–361, https://doi.org/10.1093/aob/mci033, 2005.
IPCC: Climate Change 2021 The Physical Science Basis Summary for Policymakers Working Group I Contribution to the Sixth Assessment Report of the Intergovernmental Panel on Climate Change, edited by: Masson-Delmotte, V., Zhai, P., Pirani, A., Connors, S. L., Péan, C., Berger, S., Caud, N., Chen, Y., Goldfarb, L., Gomis, M. I., Huang, M., Leitzell, K., Lonnoy, E., Matthews, J. B. R., Maycock, T. K., Waterfield, T., Yelekçi, O., Yu, R., and Zhou, B., Cambridge University Press, Cambridge, United Kingdom and New York, NY, USA, 2391 pp., https://doi.org/10.1017/9781009157896, 2021.
Keenan, R. J., Reams, G. A., Achard, F., de Freitas, J. V., Grainger, A., and Lindquist, E.: Dynamics of global forest area: Results from the FAO Global Forest Resources Assessment 2015, Forest Ecol. Manag., 352, 9–20, https://doi.org/10.1016/j.foreco.2015.06.014, 2015.
Kellner, J. R., Armston, J., and Duncanson, L.: Algorithm Theoretical Basis Document for GEDI Footprint Aboveground Biomass Density, Earth Sp. Sci., 10, e2022EA002516, https://doi.org/10.1029/2022EA002516, 2023.
Klausmeyer, K. R. and Shaw, M. R.: Climate change, habitat loss, protected areas and the climate adaptation potential of species in mediterranean ecosystems worldwide, PLoS One, 4, e6392, https://doi.org/10.1371/journal.pone.0006392, 2009.
Krajnc, L., Hafner, P., and Gričar, J.: The effect of bedrock and species mixture on wood density and radial wood increment in pubescent oak and black pine, Forest Ecol. Manag., 481, 118753, https://doi.org/10.1016/j.foreco.2020.118753, 2021.
Lal, R.: Forest soils and carbon sequestration, For. Ecol. Manage., 220, 242–258, https://doi.org/10.1016/j.foreco.2005.08.015, 2005.
Lamlom, S. H. and Savidge, R. A.: A reassessment of carbon content in wood: Variation within and between 41 North American species, Biomass Bioenerg., 25, 381–388, https://doi.org/10.1016/S0961-9534(03)00033-3, 2003.
Lang, N., Kalischek, N., Armston, J., Schindler, K., Dubayah, R., and Wegner, J. D.: Global canopy height regression and uncertainty estimation from GEDI LIDAR waveforms with deep ensembles, Remote Sens. Environ., 268, 112760, https://doi.org/10.1016/j.rse.2021.112760, 2022.
Lefsky, M. A. and Cohen, W. B.: Lidar remote sensing of above- ground biomass in three biomes, Global Ecol. Biogeogr., 11, 393–399, 2002.
Lefsky, M. A., Harding, D., Cohen, W. B., Parker, G., and Shugart, H. H.: Surface lidar remote sensing of basal area and biomass in deciduous forests of eastern Maryland, USA, Remote Sens. Environ., 4257, 83–98, https://doi.org/10.1016/S0034-4257(98)00071-6, 1996.
Le Maire, G., Davi, H., Soudani, K., François, C., Le Dantec, V., Dufrêne, E., Maire, G. L. E., Davi, H., Soudani, K., François, C., Dantec, V. L. E., and Dufrêne, E.: Modeling annual production and carbon fluxes of a large managed temperate forest using forest inventories, satellite data and field measurements, Tree Physiol., 25, 859–872, https://doi.org/10.1093/treephys/25.7.859, 2005.
Médail, F., Monnet, A. C., Pavon, D., Nikolic, T., Dimopoulos, P., Bacchetta, G., Arroyo, J., Barina, Z., Albassatneh, M. C., Domina, G., Fady, B., Matevski, V., Mifsud, S., and Leriche, A.: What is a tree in the mediterranean basin hotspot? A critical analysis, Forest Ecosyst., 6, 1–19, https://doi.org/10.1186/s40663-019-0170-6, 2019.
Myers, N., Fonseca, G. A. B., Mittermeier, R. A., Fonseca, G. A. B., Kent, J., Mittermeler, R. A., Mittermeler, C. G., Da Fonseca, G. A. B., Kent, J., Fonseca, G. A. B., Mittermeier, R. A., Fonseca, G. A. B., and Kent, J.: Biodiversity hotspots for conservation priorities, Nature, 403, 853–858, https://doi.org/10.1038/35002501, 2000.
Næsset, E. and Gobakken, T.: Estimation of above- and below-ground biomass across regions of the boreal forest zone using airborne laser, Remote Sens. Environ., 112, 3079–3090, https://doi.org/10.1016/j.rse.2008.03.004, 2008.
Roberntz, P.: Effects of long-term CO2 enrichment and nutrient availability in Norway spruce. I. Phenology and morphology of branches, Trees-Struct. Funct., 13, 188–198, https://doi.org/10.1007/PL00009750, 1999.
Shang, X. and Chazette, P.: Interest of a full-waveform UV lidar to derive forest vertical structures and aboveground biomass, Forest, 5, 1454–1480, https://doi.org/10.3390/f5061454, 2013.
Shang, X. and Chazette, P.: An UV full-waveform airborne LiDAR as a demonstrator for future space missions dedicated to forest studies, 2014 IEEE Geoscience and Remote Sensing Symposium, Quebec City, QC, Canada, 2014, 1361–1364, https://doi.org/10.1109/IGARSS.2014.6946687, 2014a.
Shang, X. and Chazette, P.: Interest of a Full-Waveform Flown UV Lidar to Derive Forest Vertical Structures and Aboveground Carbon, Forests, 5, 1454–1480, https://doi.org/10.3390/f5061454, 2014b.
Shang, X. and Chazette, P.: End-to-End Simulation for a Forest-Dedicated Full-Waveform Lidar onboard a Satellite Initialized from UV Airborne Lidar Experiments, Remote Sens., 7, 5222–5255, https://doi.org/10.3390/rs70505222, 2015.
Shang, X., Chazette, P., and Totems, J.: Airborne UV Lidar for Forest Parameter Retrievals, The 27th International Laser Radar Conference (ILRC 27), EPJ Web of Conferences, 119, 22006, https://doi.org/10.1051/epjconf/201611922006, 2016a.
Shang, X., Chazette, P., Totems, J., Dieudonné, E., Hamonou, E., Duflot, V., Strasberg, D., Flores, O., Fournel, J., and Tulet, P.: Tropical Forests of Réunion Island Classified from Airborne Full-Waveform LiDAR Measurements, Remote Sens., 8, 43–63, https://doi.org/10.3390/rs8010043, 2016b.
Shvidenko, A., Barber, C., and Persson, R.: Forest and woodland systems, in: Ecosystems and Human Well-being: Current State and Trends, Vol. 1, edited by: Hassan, R. and Scholes, R., and Ash, N., Island Press, Washington, DC, USA, 587–621, ISBN: 978-1559632287, 2005.
Sinha, S., Jeganathan, C., Sharma, L. K., and Nathawat, M. S.: A review of radar remote sensing for biomass estimation, Int. J. Environ. Sci. Technol., 12, 1779–1792, https://doi.org/10.1007/s13762-015-0750-0, 2015.
Slot, M., Janse-ten Klooster, S. H., Sterck, F. J., Sass-Klaassen, U., and Zweifel, R.: A lifetime perspective of biomass allocation in Quercus pubescens trees in a dry, alpine valley, Trees-Struct. Funct., 26, 1661–1668, https://doi.org/10.1007/s00468-012-0717-4, 2012.
Vashum, K. T. and Jayakumar, S.: Methods to Estimate Above-Ground Biomass and Carbon Stock in Natural Forests – A Review, J. Ecosyst. Ecogr., 2, 116, https://doi.org/10.4172/2157-7625.1000116, 2012.
Timbal, J. and Aussenac, G.: An overview of ecology and silviculture of indigenous oaks in France, Ann. Sci. Forest, 53, 649–661, https://doi.org/10.1051/forest:19960243, 1996.
Le Toan, T., Quegan, S., Davidson, M. W. J. J., Balzter, H., Paillou, P., Papathanassiou, K., Plummer, S., Rocca, F., Saatchi, S., Shugart, H., and Ulander, L.: The BIOMASS mission: Mapping global forest biomass to better understand the terrestrial carbon cycle, Remote Sens. Environ., 115, 2850–2860, https://doi.org/10.1016/j.rse.2011.03.020, 2011.
Vallet, P., Dhôte, J. F., Moguédec, G. Le, Ravart, M., and Pignard, G.: Development of total aboveground volume equations for seven important forest tree species in France, Forest Ecol. Manag., 229, 98–110, https://doi.org/10.1016/j.foreco.2006.03.013, 2006.
Vallet, P., Meredieu, C., Seynave, I., Bélouard, T., and Dhôte, J. F.: Species substitution for carbon storage: Sessile oak versus Corsican pine in France as a case study, Forest Ecol. Manag., 257, 1314–1323, https://doi.org/10.1016/j.foreco.2008.11.034, 2009.
Yuan, W., Zheng, Y., Piao, S., Ciais, P., Lombardozzi, D., Wang, Y., Ryu, Y., Chen, G., Dong, W., Hu, Z., Jain, A. K., Jiang, C., Kato, E., Li, S., Lienert, S., Liu, S., Nabel, J. E. M. S., Qin, Z., Quine, T., Sitch, S., Smith, W. K., Wang, F., Wu, C., Xiao, Z., and Yang, S.: Increased atmospheric vapor pressure deficit reduces global vegetation growth, Sci. Adv., 5, eaax1396, https://doi.org/10.1126/sciadv.aax1396, 2019.
- Abstract
- Introduction
- Airborne field campaign
- Method and data used to retrieve the aboveground and root carbon stocks
- Lidar-derived TTH on O3HP
- Assessment of the carbon stocks
- Conclusions
- Data availability
- Author contributions
- Competing interests
- Disclaimer
- Acknowledgements
- Financial support
- Review statement
- References