the Creative Commons Attribution 4.0 License.
the Creative Commons Attribution 4.0 License.
 | 30 Jul 2024
Effects of grain size and seawater salinity on magnesium hydroxide dissolution and secondary calcium carbonate precipitation kinetics: implications for ocean alkalinity enhancement
Charly A. Moras
Tyler Cyronak
Lennart T. Bach
Renaud Joannes-Boyau
Kai G. Schulz
Understanding the impacts that mineral grain size and seawater salinity have on magnesium hydroxide (Mg(OH)2) dissolution and secondary calcium carbonate (CaCO3) precipitation is critical for the success of ocean alkalinity enhancement. We tested Mg(OH)2 dissolution kinetics in seawater using three Mg(OH)2 grain sizes (<63, 63–180 and >180 µm) at three salinities (∼36, ∼28 and ∼20). While Mg(OH)2 dissolution occurred more quickly the smaller the grain size, salinity did not significantly impact measured rates. Our results also demonstrate that grain size can impact secondary CaCO3 precipitation, suggesting that an optimum grain size exists for ocean alkalinity enhancement (OAE) using solid Mg(OH)2. Of the three grain sizes tested, the medium grain size (63–180 µm) was optimal in terms of delaying secondary CaCO3 precipitation. We hypothesise that in the lowest-grain-size experiments, the higher surface area provided numerous CaCO3 precipitation nuclei, while the slower dissolution of bigger grain sizes maintained a higher alkalinity and pH at the surface of particles, increasing CaCO3 precipitation rates and making them observable much more quickly than for the intermediate grain size. Salinity also played a role in CaCO3 precipitation, where the decrease in magnesium (Mg) allowed secondary precipitation to occur more quickly, similar in effect size to another known inhibitor, i.e. dissolved organic carbon (DOC). In summary, our results suggest that OAE efficiency as influenced by CaCO3 precipitation depends not only on seawater composition but also on the physical properties of the alkaline feedstock used.
- Article
(2949 KB) - Full-text XML
- BibTeX
- EndNote


The concentration of carbon dioxide (CO2) in the atmosphere remained in a relatively narrow band from ∼180 to ∼280 ppmv for 800 000 years but has risen rapidly over the last 250 years to approximately 420 ppmv today (Lüthi et al., 2008; Monnin et al., 2001; Siegenthaler et al., 2005). This is the result of increasing utilisation of fossil fuels, cement production and land-use change, driving subsequent global climate change (IPCC, 2021). While about 42 % of CO2 emissions remain in the atmosphere and are mainly responsible for global warming, about 26 % are currently absorbed by the oceans, leading to ocean acidification (Friedlingstein et al., 2022; IPCC, 2021). To mitigate the effects of ocean acidification locally and slow down the increase in the Earth's global temperature, CO2 reduction efforts are not sufficient, and carbon dioxide removal (CDR) strategies have become necessary as a supplement to emission reduction (Hoegh-Guldberg et al., 2019).
One emerging marine CDR approach is ocean alkalinity enhancement (OAE). Over long timescales, the natural CO2-facilitated weathering of alkaline rocks supplies alkalinity to the oceans, influencing their CO2 uptake potential and storage. OAE builds upon this weathering feedback in the Earth system and can be accomplished by actively spreading pulverised alkaline minerals in and around marine environments or by electrochemically removing acidity from seawater (Eisaman et al., 2023). In both cases, the seawater total alkalinity (AT) is increased, thereby increasing the atmospheric CO2storage capacity of seawater (GESAMP, 2019; Kheshgi, 1995). On local scales around areas where the OAE perturbation is performed, the increases in alkalinity and pH may also mitigate ocean acidification (Hartmann et al., 2013).
Recent studies have investigated the carbonate chemistry changes following OAE, and a major outcome was the risk of runaway calcium carbonate (CaCO3) precipitation (Fuhr et al., 2022; Hartmann et al., 2023; Moras et al., 2022). There are several inorganic CaCO3 precipitation mechanisms that have been described in the literature (Morse et al., 2007; Pytkowicz, 1965). CaCO3 can precipitate homogeneously in the absence of solid or soluble organic and inorganic particles, pseudo-homogeneously in the presence of organic surfaces, and heterogeneously in the presence of mineral solids (Marion et al., 2009). The key parameter that governs whether precipitation occurs is the calcium carbonate saturation state (Ω), which is calculated from seawater Ca2+ and concentrations as
where Ca2+ and are the concentrations of calcium and carbonate in solution, respectively, and Ksp the solubility product of CaCO3 in the solution. Ω is therefore closely related to the composition of the solution and its salinity but is also highly temperature dependent (Zeebe and Wolf-Gladrow, 2001). For aragonite, the CaCO3 morphotype that inorganically precipitates in modern seawater, the saturation state (ΩA) has to be higher than 12.3 for pseudo-homogeneous precipitation to occur in water with a salinity of 35 and at 25 °C (Marion et al., 2009). Homogeneous precipitation will occur at much higher ΩA values, while heterogeneous precipitation will occur at much lower ΩA but depends on the actual lattice compatibility of CaCO3 with the mineral particles present (Morse et al., 2007; Zhong and Mucci, 1989). Another important aspect is that once precipitation becomes measurable, it will continue in a “runaway” fashion, i.e. quickly ramping up until it slows down once ΩA approaches 1 again.
Several studies have reported such behaviour after the addition of alkaline minerals (Fuhr et al., 2022; Hartmann et al., 2023; Moras et al., 2022), with a critical threshold of ΩA = ∼7.0 for the two calcium-based OAE minerals – calcium oxide (CaO) and calcium hydroxide (Ca(OH)2) – and report precipitation stopping at ΩA values of 1.8–2.0 (Moras et al., 2022). Precipitation has also been observed for magnesium-based minerals such as brucite or reagent-grade magnesium hydroxide – Mg(OH)2 – but actual thresholds have not been determined (Hartmann et al., 2023). Furthermore, the effect of grain size, the determining factor for the surface area available for mineral dissolution and CaCO3 precipitation, has not been studied. Similarly, the effect of potential CaCO3 precipitation inhibitors, such as seawater magnesium (Mg) concentrations governed by salinity and dissolved organic carbon (DOC), are relatively unknown (Chave and Suess, 1970; Millero et al., 2001; Pan et al., 2021; Zhong and Mucci, 1989). This study focuses on the impact of Mg(OH)2 grain size on its dissolution kinetics in natural seawater as well as the impact of salinity. Furthermore, the subsequent runaway CaCO3 precipitation that is triggered, along with its kinetics, are reported. Finally, the effects of increased Mg and DOC in seawater on the CaCO3 precipitation process is explored.
2.1 Seawater collection and experimental setup
Using 25 L jerrycans, seawater was collected at Broken Head, New South Wales, Australia ( S, E), about 200 m from the shore to avoid sampling sand and suspended particles. The collected seawater was stored in the dark at 4 °C for 3 d to reduce microbial activity and to allow particles to settle to the bottom, facilitating filtration. The entire contents of the jerrycans were then sterile filtered using a peristaltic pump and a 0.2 µm Whatman Polycap 75 AS filter before being stored in cleaned and autoclaved 25 L polycarbonate bottles. Prior to conducting the experiments, each seawater batch was equilibrated to laboratory air pCO2 by bubbling it with H2O-saturated air for at least a week (Moras et al., 2023). This ensured comparable starting conditions for the various experiments, with a calculated starting pCO2 of 420.6 ± 28.6 µatm in all experiments. All experiments utilised reagent grade Mg(OH)2 (>98 %, supplied by Atlas Materials) that had been ground in a pulveriser laboratory mill.
2.2 Grain size and salinity experiments
Approximately 1.5 L of seawater was placed in a clean 2 L borosilicate 3.3 beaker surrounded by a water jacket set to 21 °C and controlled by a TK-1000 tank chiller line. A floating lid with three ports was placed on the water surface, allowing concurrent Mg(OH)2 addition, pH measurement and water sampling. After Mg(OH)2 addition, the seawater was incubated for 18 h to allow for full Mg(OH)2 dissolution. Thereafter the beaker contents were transferred to a clean 1 L borosilicate 3.3 Schott bottle that was tightly closed without any headspace to minimise CO2 ingassing. The bottle was placed in a dark room on a stirring platform at 200 rpm at room temperature (24.8 ± 1.3 °C). All grain size and salinity treatments were run in triplicate for up to 34 d.
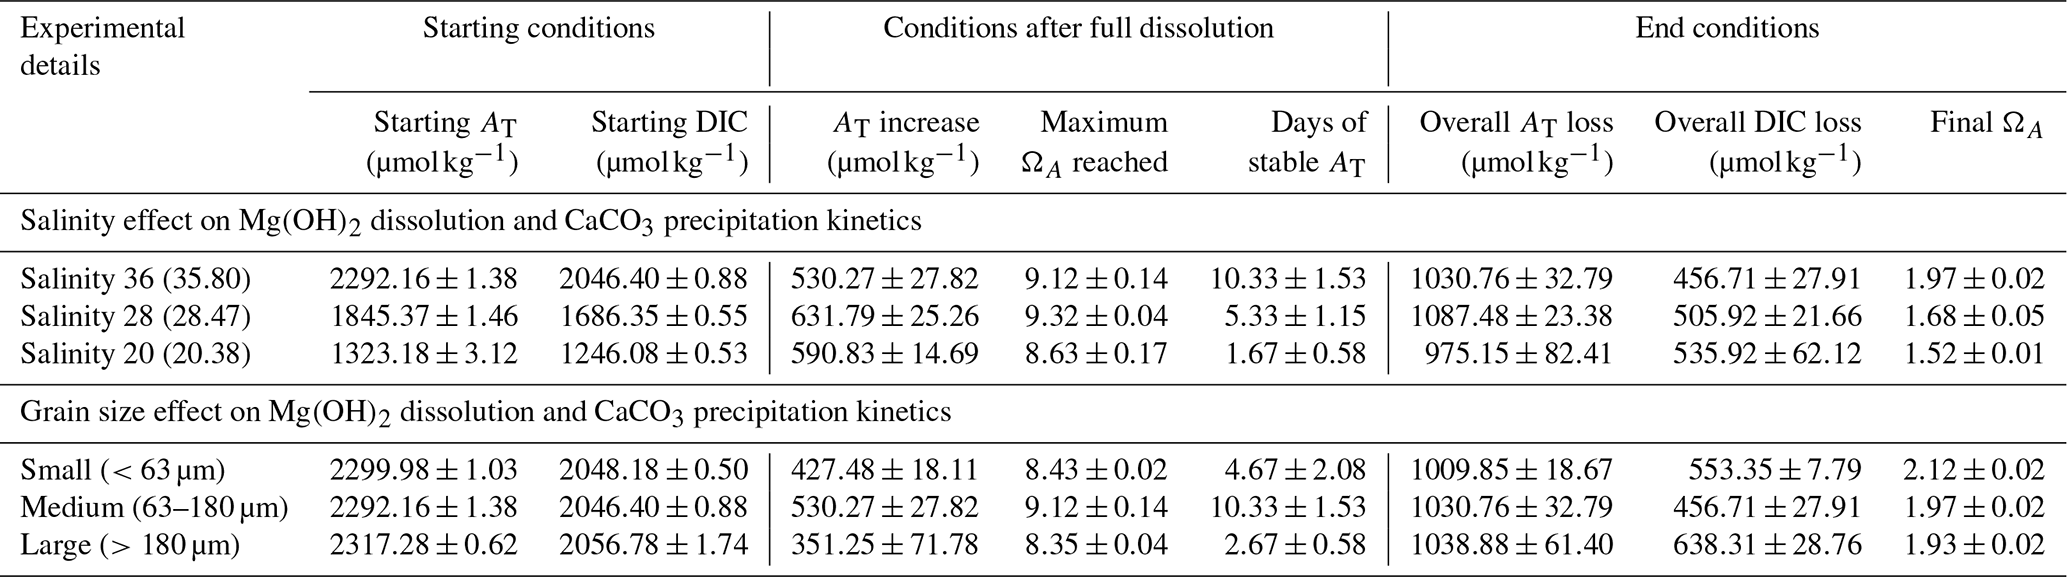
For the grain size experiments, three grain size ranges were produced using two stainless steel sieves with 63 and 180 µm mesh sizes. The medium range, i.e. 63–180 µm, was also used for the salinity experiments at ∼36, ∼28 and ∼20. The lower-salinity seawater was produced by mixing natural seawater with MilliQ water. Exact salinities of the 200 mL of seawater samples equilibrated to room temperature in a gas-tight polycarbonate container were determined by measuring conductivity and temperature with a 914 pH/conductometer and converting to salinity using the 1978 practical salinity scale (Lewis and Perkin, 1981). For all experiments, Mg(OH)2 additions were adjusted to yield an ΩA of ∼9 (Table 1) to allow for a significant AT increase and secondary CaCO3 precipitation, based on previously found thresholds for CaO and Ca(OH)2 and with the assumption that the CaCO3 inhibition role of Mg2+ requires a higher ΩA for CaCO3 precipitation within days (Moras et al., 2022). Varying amounts of Mg(OH)2 were used in the salinity experiments. The decrease in dissolved Ca following dilution with MilliQ led to higher amounts of Mg(OH)2 being added with decreasing salinity to reach a similar ΩA of about 9. Furthermore, preliminary tests conducted with the Mg(OH)2 powder used for these experiments, despite the powder having reagent-grade properties (>98 % pure), have shown that only about 75 % of the theoretical maximum AT was generated. Therefore, the Mg(OH)2 additions were adjusted accordingly, with additions varying from 23.3 mg kg−1 in the salinity 36 experiments (and all grain size experiments) to 30.2 mg kg−1 in the salinity 20 experiments.
Table 1Summary of the main experimental parameters for each of the incubations investigating the salinity and grain size effects on Mg(OH)2 dissolution and CaCO3 precipitation kinetics. “Days of stable AT” encompasses the time between maximum ΔAT recorded and the start of CaCO3 runaway precipitation.
In all experiments, the first 18 h of reaction were monitored by measuring the pH on the free scale (pHF) with an Aquatrode Plus with Pt1000 (Metrohm) connected to an 888 Titrando (Metrohm) before transferring the contents of the 2 L beaker into the clean 1 L Schott bottles. A sample for AT and dissolved inorganic carbon (DIC) measurements was taken before Mg(OH)2 addition and after 18 h. The temperature and pHF were then recorded twice a day until a sudden drop in pHF was observed, linked to CaCO3 precipitation. A new sample for AT and DIC measurements was then taken. The time at which CaCO3 runaway precipitation was deemed to have started was considered to be the last stable pHF measurement before the sudden drop. AT and DIC samples were taken at varying intervals during CaCO3 precipitation (see Figs. 2 and 4) to cover most of the CaCO3 precipitation process, and at least 300 mL of water was reserved for two AT and DIC samples at the end of the experiment. Between 9 and 10 AT and DIC samples per experiment were collected to monitor the changes in DIC and AT over time. Their decrease in a 2:1 ratio was further used to reconstruct AT and DIC from pH measurements in the experiments on the effect of Mg and DOC on CaCO3 precipitation (see below for details).
2.3 Manipulation of dissolved organic carbon and magnesium
Seawater dilution with MilliQ to decrease salinity also decreased the concentration of various seawater components, such as Mg and DOC. To disentangle a potentially general effect of salinity on Mg(OH)2 dissolution and secondary precipitation kinetics from reductions in Mg and DOC concentrations, two additional experiments were designed. In the first, the experiments at a salinity of 20 were replicated, but the Mg concentration was increased to a concentration representative of a salinity of 35, i.e. 52.8 mmol kg−1 (Dickson et al., 2007), by the addition of magnesium chloride (MgCl2) from a 3 M stock solution (molarity verified by inductively coupled plasma mass spectrometer measurements). This experiment was run in triplicate. For the second experiment, a DOC-enriched seawater solution at a salinity of 20 was produced by ultrafiltration (molecular weight cutoff of 2000 Daltons, Vivaflow200 Hydrosart, Sartorius). A DOC gradient was then created in five bottles by mixing the DOC-enriched salinity 20 seawater with the MilliQ-diluted seawater. The DOC concentrations ranged from approximately 120 to approximately 325 µmol kg−1.
In both the Mg and DOC experiments, dissolution and secondary CaCO3 precipitation kinetics were mainly monitored using pHF measurements, although a sample for AT and DIC measurement was also taken before Mg(OH)2 addition and at the end of each treatment. These samples, coupled with the pHF measurements, allowed the changes in AT and DIC to be estimated over time. The reconstruction occurred in two steps, where the increase in pH following Mg(OH)2 was assumed to be linked to an increase in AT at constant DIC. Then, any decrease in pH was assumed to be due to CaCO3 precipitation, so the estimated AT and DIC loss after Mg(OH)2 dissolution decreased in a 2:1 ratio, as observed in the salinity and grain size experiments. Finally, to account for CO2 ingassing over time, the difference between estimated maximum AT and final measured AT was used as a proxy. Half of the difference, representing CaCO3 precipitation, was used to estimate the theoretical DIC loss. Once compared to the final measured DIC, an ingassing rate was estimated.
2.4 Analytical procedures
The pH electrode was calibrated using three Metrohm buffer solutions (pH 4, 7 and 9), corresponding to a pH measurement on the free scale. AT analyses were conducted using a potentiometric titration with an 848 Titrino Plus coupled to an 869 Compact Sample Changer from Metrohm. A 0.05 M HCl solution with the ionic strength adjusted to 0.72 mol kg−1 (representative of a salinity of 35) using NaCl was used as the titrant (Dickson et al., 2007). The DIC concentration was measured using an Automated Infra-Red Inorganic Carbon Analyzer (AIRICA) coupled to a LI-COR Li7000 Infra-Red detector (Gafar and Schulz, 2018). Both AT and DIC measurements were corrected against in-house reference material (previously calibrated against certified reference material), with measurement uncertainties of ±2.20 and ±1.98 µmol kg−1 (Moras et al., 2023). ΩA and carbonate chemistry speciation were calculated from measured AT and DIC, providing temperature and salinity measurements, using CO2SYS (Sharp et al., 2021). To do so, the boric acid dissociation constant from Uppström (1974), the carbonic acid dissociation constant from Lueker et al. (2000) and the sulfuric acid dissociation constant from Dickson (1990) were selected.
For scanning electron microscopy (SEM), discrete samples of about 10 mL of AT-enriched seawater were filtered through 0.2 µm polycarbonate filters (Whatman Cyclopore). These filters were rinsed with 20 mL of MilliQ to remove salts and dried overnight at 60 °C. Once dried, the filters were kept in a desiccator until analysis. The filters were attached to double-sided carbon tabs and placed on aluminium mounts before being coated with gold. SEM analysis was performed using a tabletop Scanning Electron Microscope TM4000 Plus from Hitachi coupled to an Energy Dispersive X-Ray (EDX) Analyser, allowing us to determine the elemental composition of observed particles.
The concentration of the MgCl2 stock solution was measured by inductively coupled plasma mass spectrometer (ICP-MS) measurements using an Agilent 7700 ICP-MS coupled to a laser ablation unit (NWR213, Electro Scientific Industries, Inc.). Seawater reference materials from the National Research Council of Canada NASS-6 were used to correct the measurements. The DOC concentration of the DOC-enriched stock solution was determined using a Thermo Fisher Flash Elemental Analyzer after acidifying the sample with nitric acid (Carvalho, 2023).
3.1 Grain size effects on Mg(OH)2 dissolution kinetics
Three Mg(OH)2 grain sizes were dissolved in seawater at a salinity of ∼36 (Fig. 1). The starting pHF was similar for all incubations, at 8.11 ± 0.03, 8.09 ± 0.01 and 8.07 ± 0.03 for the small (<63 µm), medium (63–180 µm) and large (>180 µm) grain sizes, respectively. Upon dissolution, pHF increased quite rapidly, reaching a maximum after about 2 h for the small-particle-size experiments and about 6 to 8 h in the medium- and large-particle-size experiments (Fig. 1). In each incubation, a logarithmic trend in pHF was observed, with the dissolution being much quicker for smaller grain sizes. After 2 h, the maximum pHF recorded for the smaller grain size was 8.76 ± 0.04, which continuously decreased to 8.68 ± 0.00 between 11 and 12 h after the addition of Mg(OH)2. In contrast, the pHF for the medium and larger grain size increased to 8.72 ± 0.00 and 8.68 ± 0.03, respectively, after about 8 h and remained stable thereafter (Fig. 1).
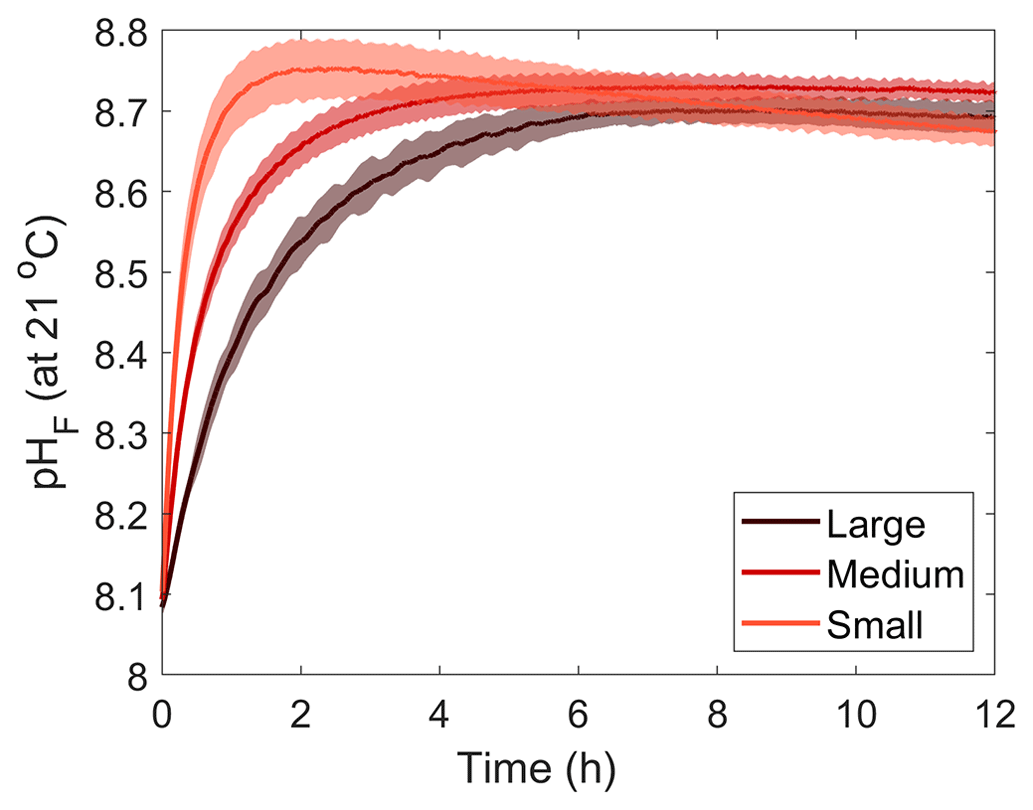
Figure 1Changes in pHF at 21 °C following dissolution of three Mg(OH)2 grain sizes in natural seawater over 12 h. Each grain size was run in triplicate, with the averages presented as the solid lines and the standard deviation ranges as the transparent areas.
3.2 Grain size effect on CaCO3 precipitation kinetics
The pH increase was reflected by increasing AT, measured prior to the Mg(OH)2 addition and 18 h later, by about 430, 530 and 350 µmol kg−1, in the small-, medium- and large-grain-size incubations, respectively (Fig. 2). AT remained stable for 3–7, 9–12 and 2–3 d before dropping in each grain size treatment (small, medium and large). In all incubations, AT concentrations decreased in a similar fashion, with a strong drop in the first 2 d before slowly decreasing for another week and stabilising. The overall AT loss for the duration of the experiments was ∼1035 µmol kg−1 in the medium- and large-grain-size incubations, while the AT dropped by about 1010 µmol kg−1 in the small-grain-size incubations (Table 1).
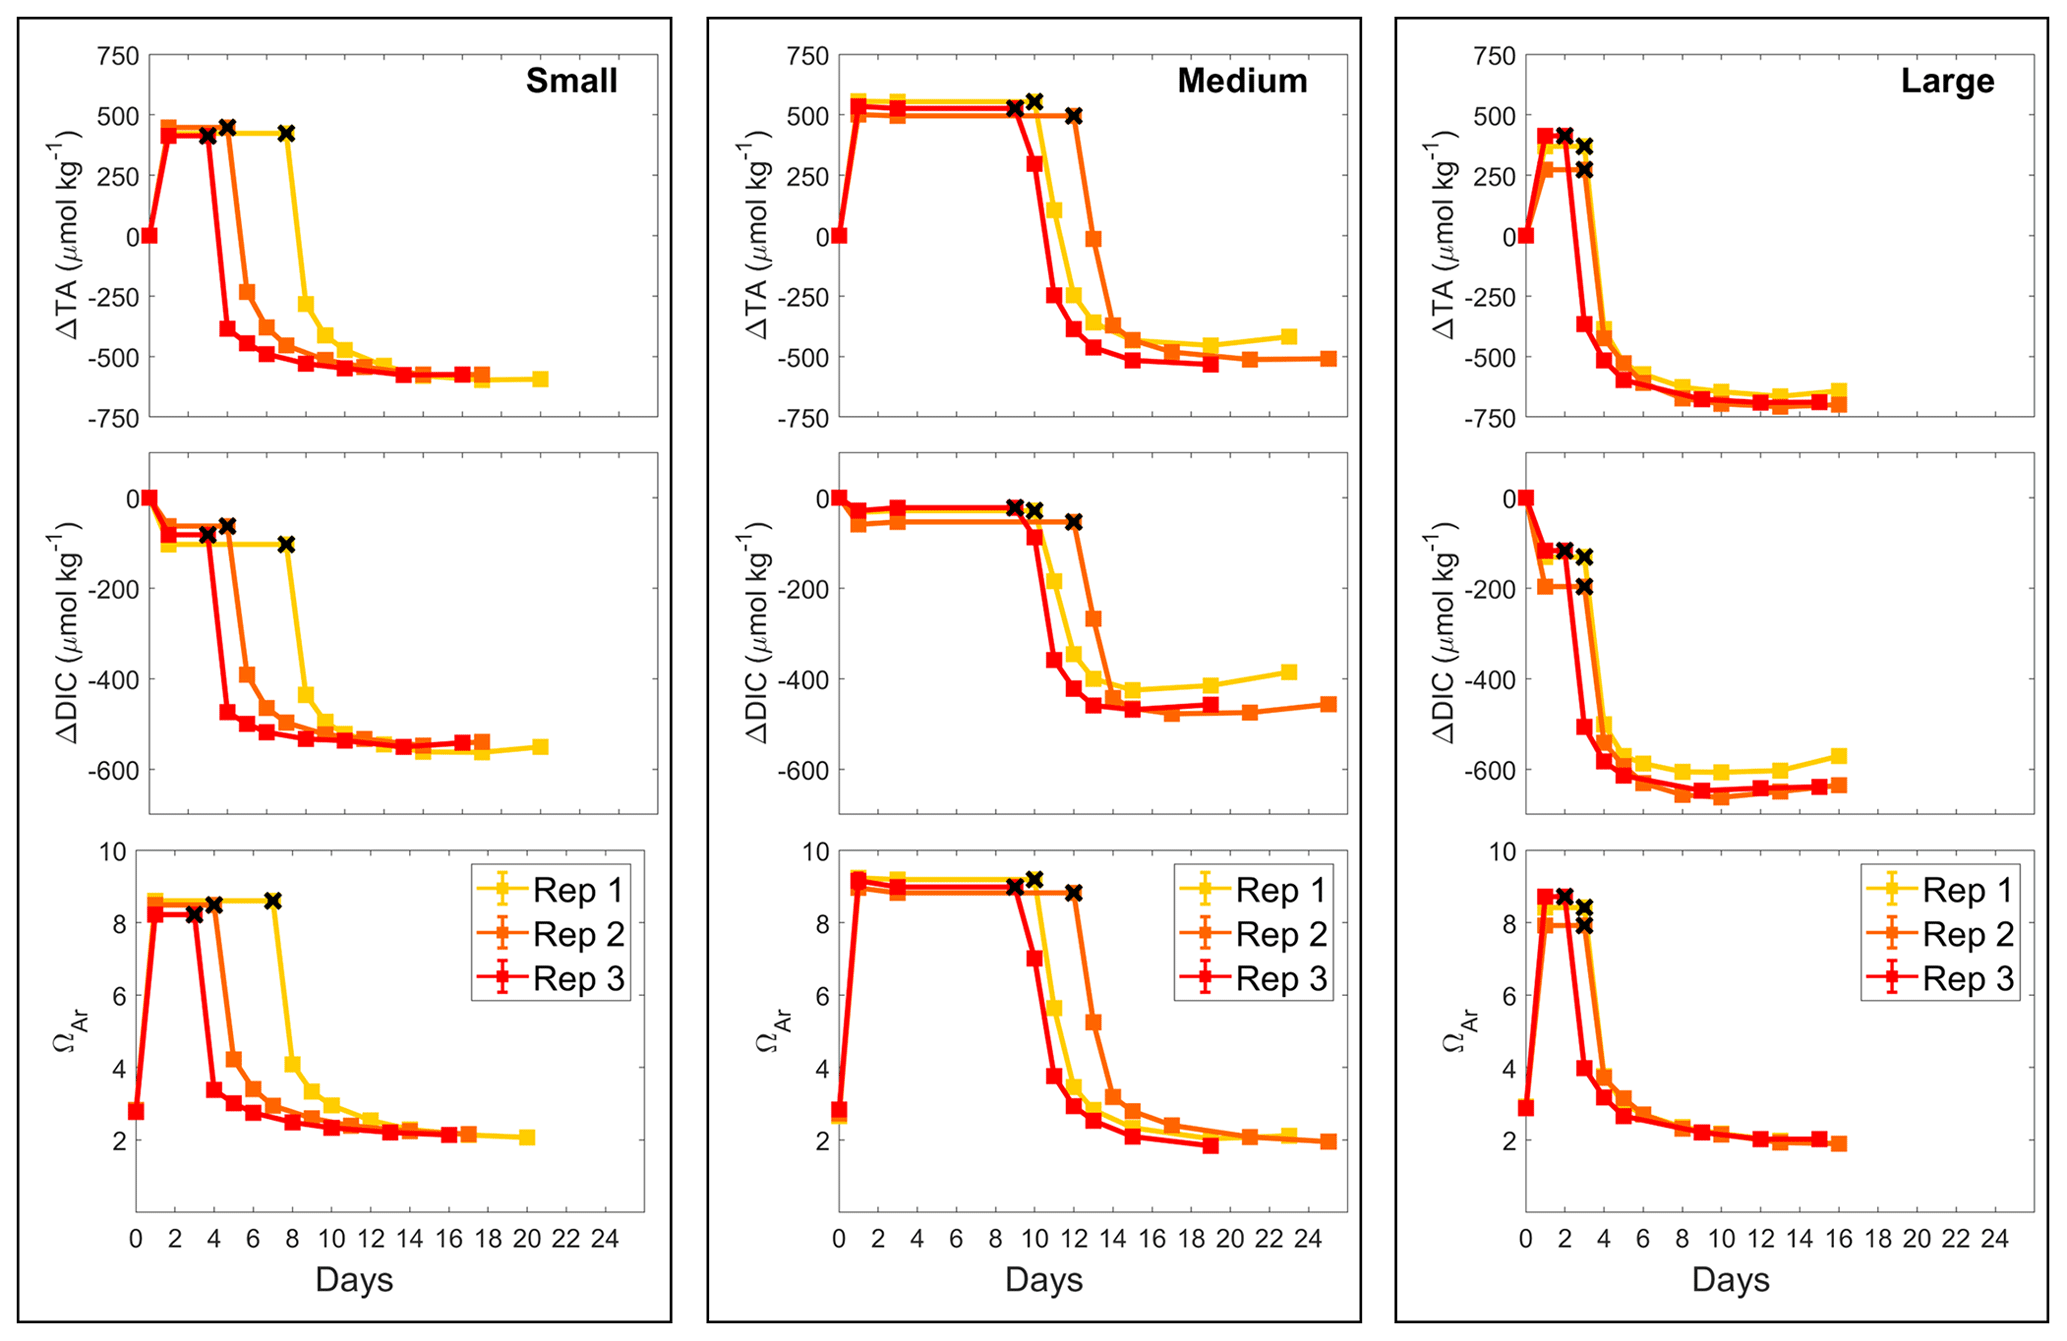
Figure 2Changes in AT, DIC and ΩA during dissolution of three Mg(OH)2 grain sizes in natural seawater over a maximum of 25 d. Three replicates were conducted for each grain size and are represented in red, orange and yellow. The last stable AT and DIC conditions estimated by pHF measurements are represented by black crosses.
The changes in ΩA followed a similar pattern as those in AT, increasing from ∼2.8 on average to ∼9.1 in the medium-grain-size incubation and to ∼8.4 in the small- and large-grain-size experiments. ΩA decreased at the same time as AT in the respective experiments, stabilising around ∼2.0 in all experiments.
Finally, a small drop in DIC was observed after Mg(OH)2 addition in all experiments, of about 80, 30 and 140 µmol kg−1 in the small-, medium- and large-grain-size incubations, respectively. The DIC then remained relatively stable until the rapid AT drop, where the overall DIC drops for the small-, medium- and large-grain-size incubations were calculated at ∼550, ∼455 and ∼640 µmol kg−1, respectively. While AT and ΩA remained stable after this drop, DIC increased slightly, which was particularly obvious in the medium- and large-grain-size incubations.
3.3 Salinity effect on Mg(OH)2 dissolution kinetics
To test the effects of salinity on Mg(OH)2 dissolution and CaCO3 precipitation kinetics, three sets of experiments were conducted at three different salinities, i.e. 20.38, 28.47 and 35.80, using medium-grain-size Mg(OH)2. From here on, the salinities of 20.38, 28.47 and 35.80 will be referred to as salinities of 20, 28 and 36, respectively. Similarly to the grain size experiments, the dissolution of Mg(OH)2 occurred rapidly at all three salinities, with the maximum pHF recorded after approximately 8 h (Fig. 3). Starting pHF values were slightly different, recorded at 7.99 ± 0.05, 8.06 ± 0.01 and 8.09 ± 0.01 in the salinity 20, 28 and 36 incubations and increasing to a maximum of 9.19, ±0.00, 8.91 ± 0.00 and 8.72 ± 0.00, respectively. In all incubations, similar logarithmic trends were observed for pHF (Fig. 3).
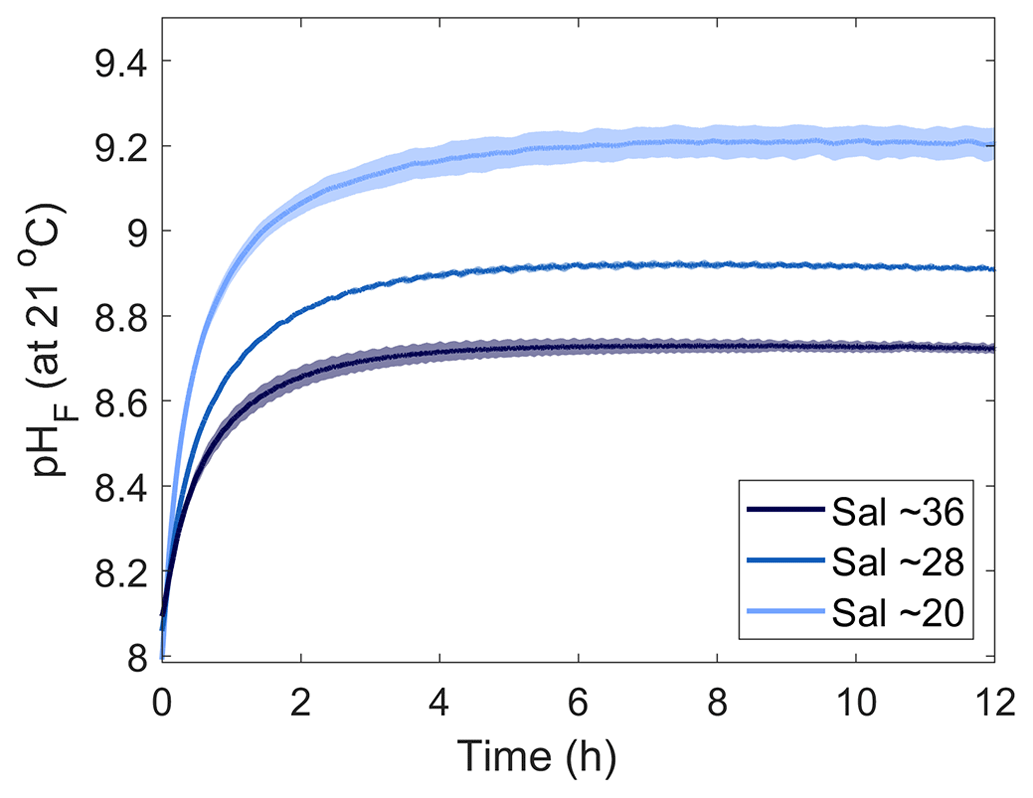
Figure 3Changes in pHF at 21 °C following Mg(OH)2 dissolution in three different seawater salinities over 12 h. Each salinity has been run in triplicate, with the averages presented as the solid lines and the standard deviation ranges as the transparent areas. Please note that different maximum pH levels were reached because of increasing Mg(OH)2 addition with decreasing salinity to reach a similar ΩA.
3.4 Salinity effect on CaCO3 precipitation kinetics
In all incubations, AT increased as was suggested by the pHF trends, by ∼590, ∼630 and ∼530 µmol kg−1 in the salinity 20, 28 and 36 incubations, respectively (Fig. 4). AT remained stable for different periods of time in each treatment: 1–2 d in the salinity 20 incubations, 4–6 d in the salinity 28 incubations and 9–12 d in the salinity 36 incubations. Thereafter, AT dropped quickly for the first 2 d in all incubations and stabilised quickly in the salinity 20 experiments. In the salinity 28 incubations, AT slowly decreased over 5 d after the first strong drop and then stabilised, while in the salinity 36 experiments, the AT decreased slowly over 7 d after the initial drop before finally stabilising. The overall AT losses for the salinity 20, 28 and 36 experiments were estimated at ∼975, ∼1090 and ∼1030 µmol kg−1, respectively (Table 1).
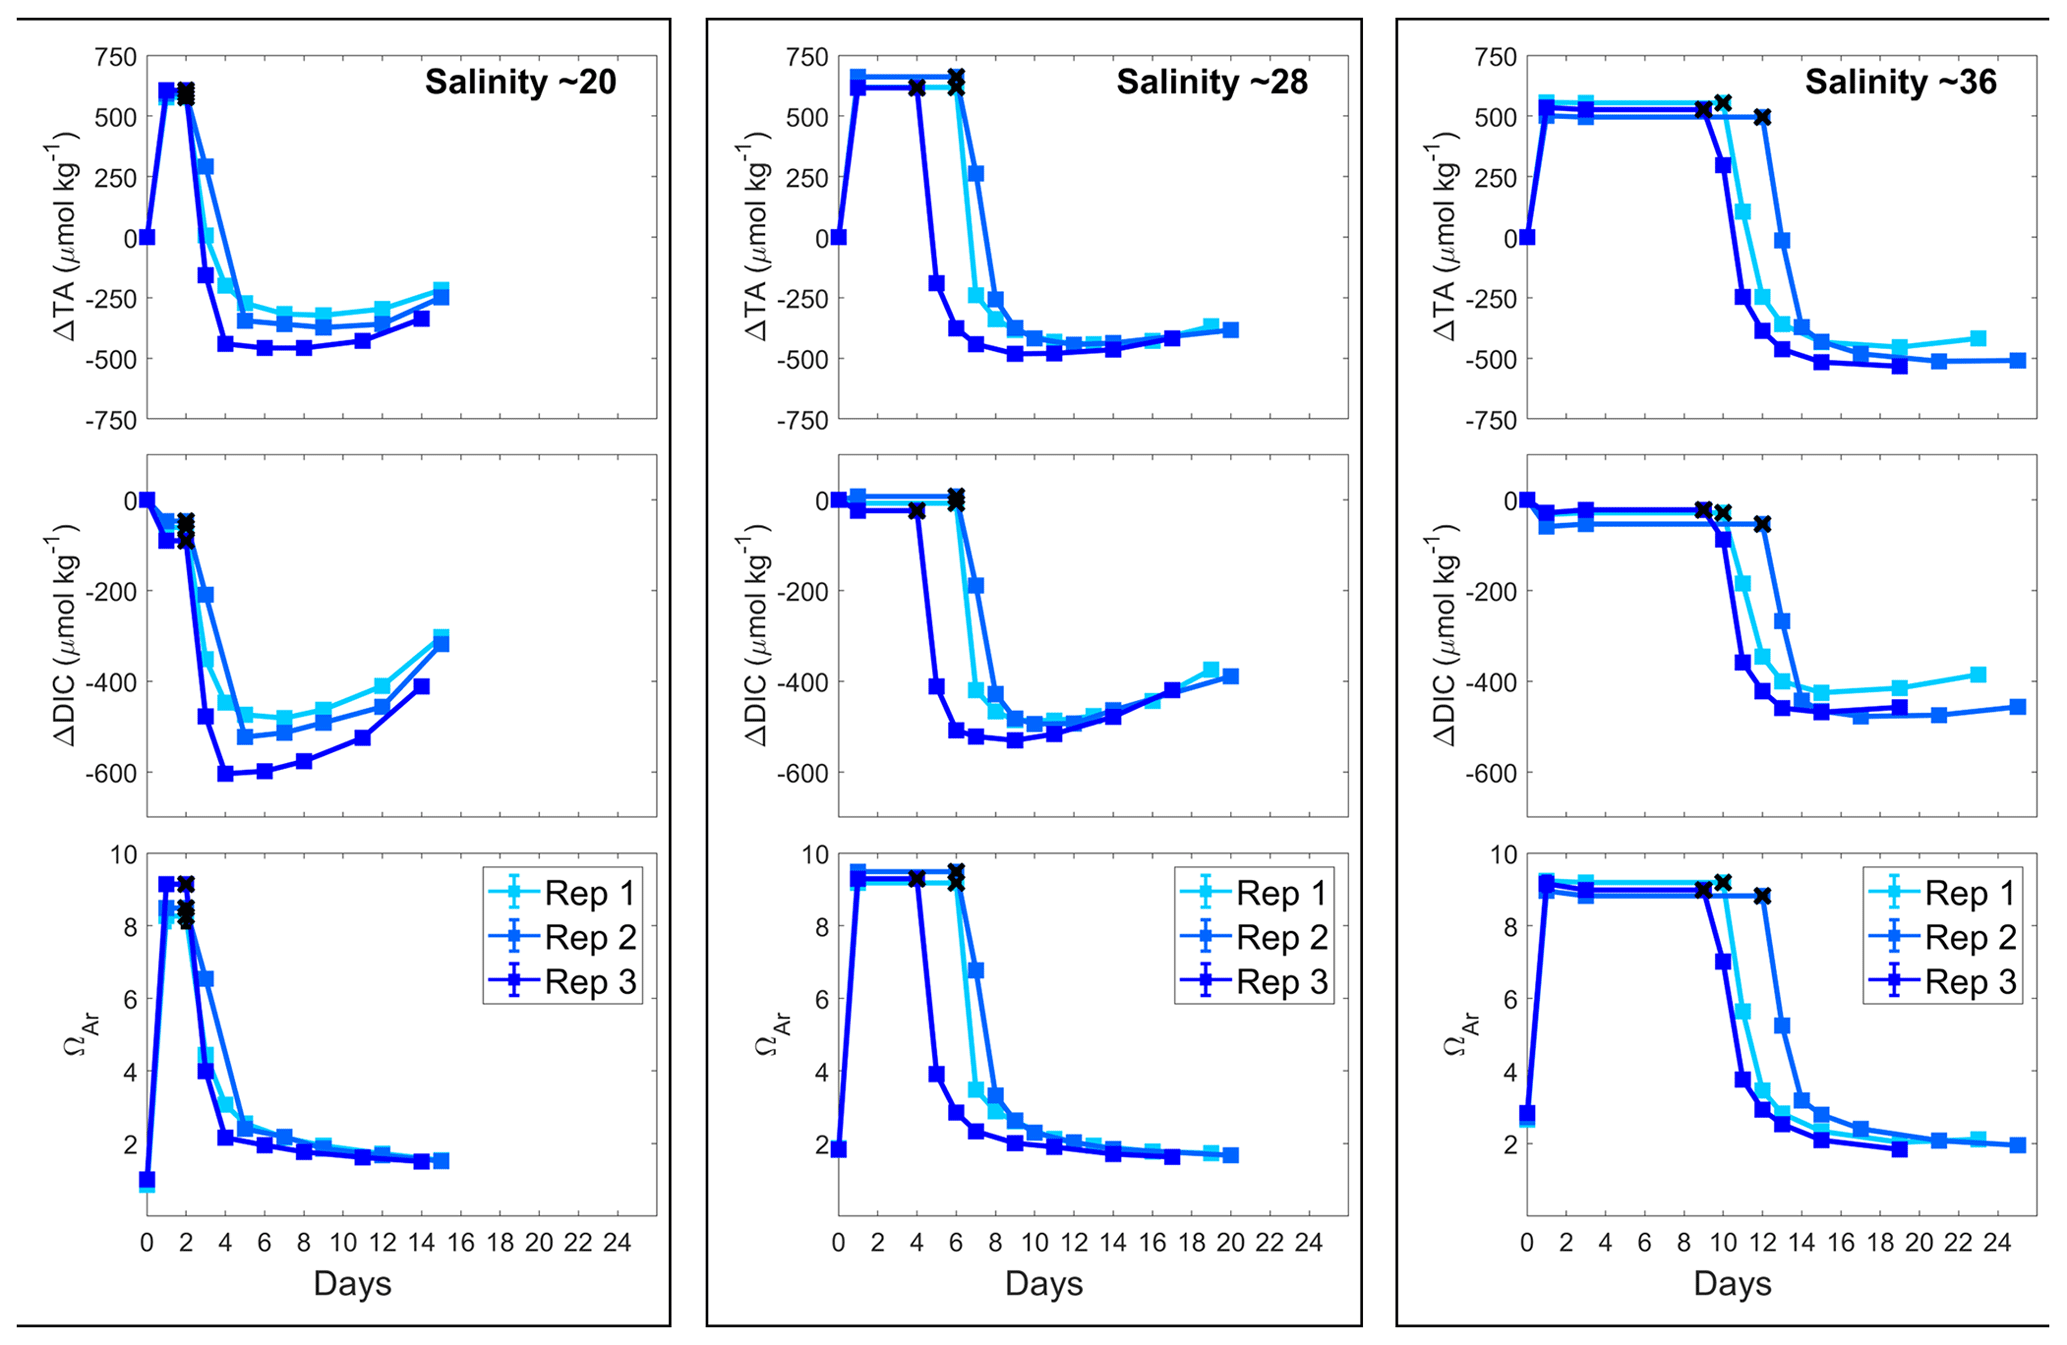
Figure 4Changes in AT, DIC and ΩA during Mg(OH)2 dissolution in three different salinities over a maximum of 25 d. Three replicates were conducted for each salinity and are represented in shades of blue. The last stable AT and DIC conditions estimated by pHF measurements are represented by black crosses.
ΩA values followed a similar pattern as AT in all experiments. The starting ΩA values were different, varying from 1.0 for the salinity 20 incubations to 2.0 and 2.8 for the salinity 28 and 36 incubations, respectively. Similarly, following Mg(OH)2 addition, ΩA quickly increased to reach 8.6, 9.3 and 9.1 with increasing salinity. Together with AT, ΩA eventually started dropping and then stabilised at different values, around 1.5 for a salinity of 20, around 1.7 for a salinity of 28 and around 2.0 for a salinity of 36.
Finally, DIC also decreased after Mg(OH)2 addition. An initial DIC drop was observed directly after Mg(OH)2 addition: about 60 µmol kg−1 at the lowest salinity and 30 µmol kg−1 at the highest salinity. At a salinity of 28, a much smaller DIC drop was observed in one replicate. After a period of stable DIC conditions, DIC also dropped in a similar fashion as AT, with an overall DIC loss of about 535, 505 and 455 µmol kg−1 from the lower- to higher-salinity incubations. While no DIC increase was observed towards the end of the experiment in the salinity 36 incubations, strong DIC increases were observed in the salinity 28 incubations and even more prominent ones in the salinity 20 incubations.
3.5 Magnesium and DOC effects on CaCO3 precipitation
A similar pattern was observed for the salinity 20 experiments at natural and increased Mg concentrations, i.e. a rapid increase in AT reaching a maximum on day 1, followed by a steady decline over the next 2 weeks (Fig. 5). The maximum ΔAT reached was slightly different, with about 600 µmol kg−1 of AT increase in the salinity 20 experiment and nearly 800 µmol kg−1 in the salinity 20+MgCl2 incubations. Another interesting difference is the slower AT decrease with MgCl2 compared to that at a salinity of 20. After about 18 d, the lowest ΔAT was reached, while it only took about 6 d for the salinity 20 ΔAT to reach the minimum. Similarly, DIC appeared to decrease less rapidly when MgCl2 was present, and ΩA followed a similar trend after the initial strong increase.
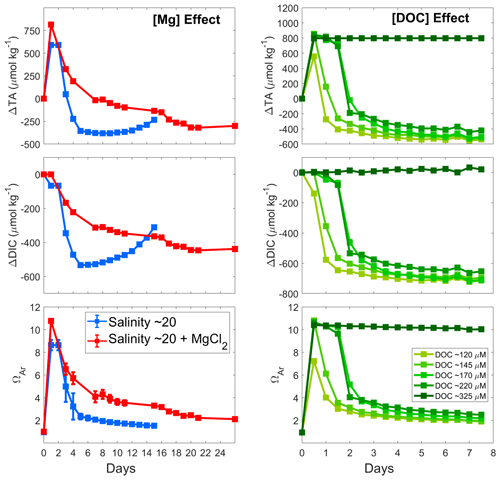
Figure 5Comparison of the calculated AT, DIC and ΩA changes at 21 °C following Mg(OH)2 addition to seawater with a salinity of 20 (blue), to seawater with a salinity of 20 and Mg concentration equal to a salinity of 35 (red), and to seawater with varying DOC concentrations (green). Values reported in the Mg effect panels represent the average of triplicate experiments run at a salinity of 20 and a salinity of 20+MgCl2, with standard deviations represented by the error bars.
Out of the five DOC experiments, four incubations showed a drop in AT (Fig. 5). Similar maximum ΔAT values were reached in most experiments, with a ΔAT of ∼800 µmol kg−1. However, in the incubation with ∼120 µmol kg−1 DOC, AT increased by only ∼600 µmol kg−1. Following this increase, AT decreased within a day in both the 120 and 145 µmol kg−1 DOC incubations and stayed stable until day 3 in incubations with 170 and 220 µmol kg−1. These four incubations also show a similar levelling pattern over time, even though it appears that in the higher DOC incubations the total loss in AT was lower than for the lower DOC incubations. ΔDIC also followed a similar trend to ΔAT, with an early drop at 120 µmol kg−1 of DOC, a drop after 1 d at 145 µmol kg−1 of DOC, and a slow decrease from day 1 and a stronger drop on day 2 at 170 and 220 µmol kg−1 of DOC. ΩA followed a very similar pattern to ΔAT, with higher final ΩA in the experiments with higher DOC concentrations. Finally, in the experiment with the highest DOC concentration, i.e. 325 µmol kg−1, no drop in AT, DIC or ΩA was observed (the experiment was run for 42 d).
4.1 Grain size and salinity effects on Mg(OH)2 dissolution
Maximum Mg(OH)2 dissolution directly after its addition was negatively correlated with grain size (Figs. 1 and 3). The smaller the grain size, the faster the maximum pHF was reached, indicative of complete dissolution. This can be explained by the fact that smaller particles have a larger surface area per gram of material than larger particles do. The increasing dissolution rate with decreasing particle size is particularly noticeable when AT changes were estimated using the pHF data and starting DIC measurements (Fig. 6). Assuming a constant DIC over the first 30 min of reaction, i.e. no significant CaCO3 precipitation and/or CO2 ingassing, AT can be reconstructed using CO2SYS. The maximum ΔAT reached with the larger particle size occurred within 8 h, while it only took about 2 h for the ΔAT to reach a maximum with the small particle size. The initial dissolution rate, i.e. within the first 30 min, was also significantly different between the various grain sizes. The AT generation of smaller grain size particles was estimated at about 796.5 ± 7.1 µmol AT mg−1 min−1. The medium particles dissolved about twice as slowly over the first 30 min, estimated at 391.6 ± 2.6 µmol AT mg−1 min−1, while the larger grain sizes dissolved more than 4 times more slowly, at about 168.7 ± 6.9 µmol AT mg−1 min−1. Another important difference between the smaller-grain-size experiments and the two others is the constant decrease in pHF observed right after reaching the maximum pHF value (Fig. 1). This decrease in pHF can only be linked to either CaCO3 precipitation decreasing AT and ultimately pHF or CO2 ingassing increasing the dissolved CO2 concentration and ultimately decreasing the pHF. The constant and linear trend suggests that the latter is responsible for the decrease. If CaCO3 precipitation was responsible for these pHF changes, the changes would follow a similar pattern to a negative exponential function. This is due to the fact that the more CaCO3 nucleates, the more surface area becomes available for further nucleation (Zhong and Mucci, 1989). However, in our case, the changes appear to be linear. Such a pattern is indicative of CO2 ingassing at an early stage, i.e. before the ingassing starts plateauing, dictated by the difference between atmospheric and seawater pCO2. Such ingassing is also occurring in the other experiments but is likely hidden by the pHF increase occurring during the longer dissolution of Mg(OH)2 with a bigger grain size.
For salinity, there was a difference in initial dissolution rates within the range of salinities tested, with dissolution rates for salinities of 36, 28 and 20 estimated at 391.6 ± 2.6, 359.8 ± 0.2 and 301.9 ± 0.3 µmol AT mg−1 min−1, respectively. While these differences are not as significant as those in the grain size experiments, the dissolution rate decreased by about 23 % between salinities of 36 and 20. Overall, the AT generation potential of smaller-grain-size Mg(OH)2 (<63 µm) at a salinity of 36 was similar to that of Ca(OH)2 (Moras et al., 2022) which was also sieved through a 63 µm filter. Assuming the same molar AT generation potential, the same maximum ΩA should have been reached. However, for Ca(OH)2 it was ∼7.4, while our small-grain-size Mg(OH)2 incubations reached a maximum ΩA of ∼8.4. Such a difference is likely due to the difference in the starting conditions and experimental settings. In the experiments shown here, the starting ΩA was ∼2.8, while it was about ∼2.5 in Moras et al. (2022). This is explained by the differences in the starting water composition and salinity ultimately affecting the final ΩA despite similar AT increases. Furthermore, higher amounts of Mg(OH)2 were added compared to Moras et al. (2022), leading to a higher ΩA and a higher theoretical ΔAT if no early CaCO3 nucleation occurred. However, dissolution kinetics appear to differ between the minerals, with Ca(OH)2 dissolving within 20–30 min, while it took 2 h for Mg(OH)2 to dissolve. These two minerals still dissolve at a relatively quick pace compared to other OAE feedstock, for instance olivine (Montserrat et al., 2017). Olivine took much longer to dissolve, with a maximum increase in recorded pH of ∼0.15 units within 4–9 d. Ca(OH)2 and Mg(OH)2 additions required ∼20 mg of materials, while to obtain such olivine results, more than 30 g of olivine were added per kg of filtered seawater, meaning that the AT generation potential is several orders of magnitude lower.
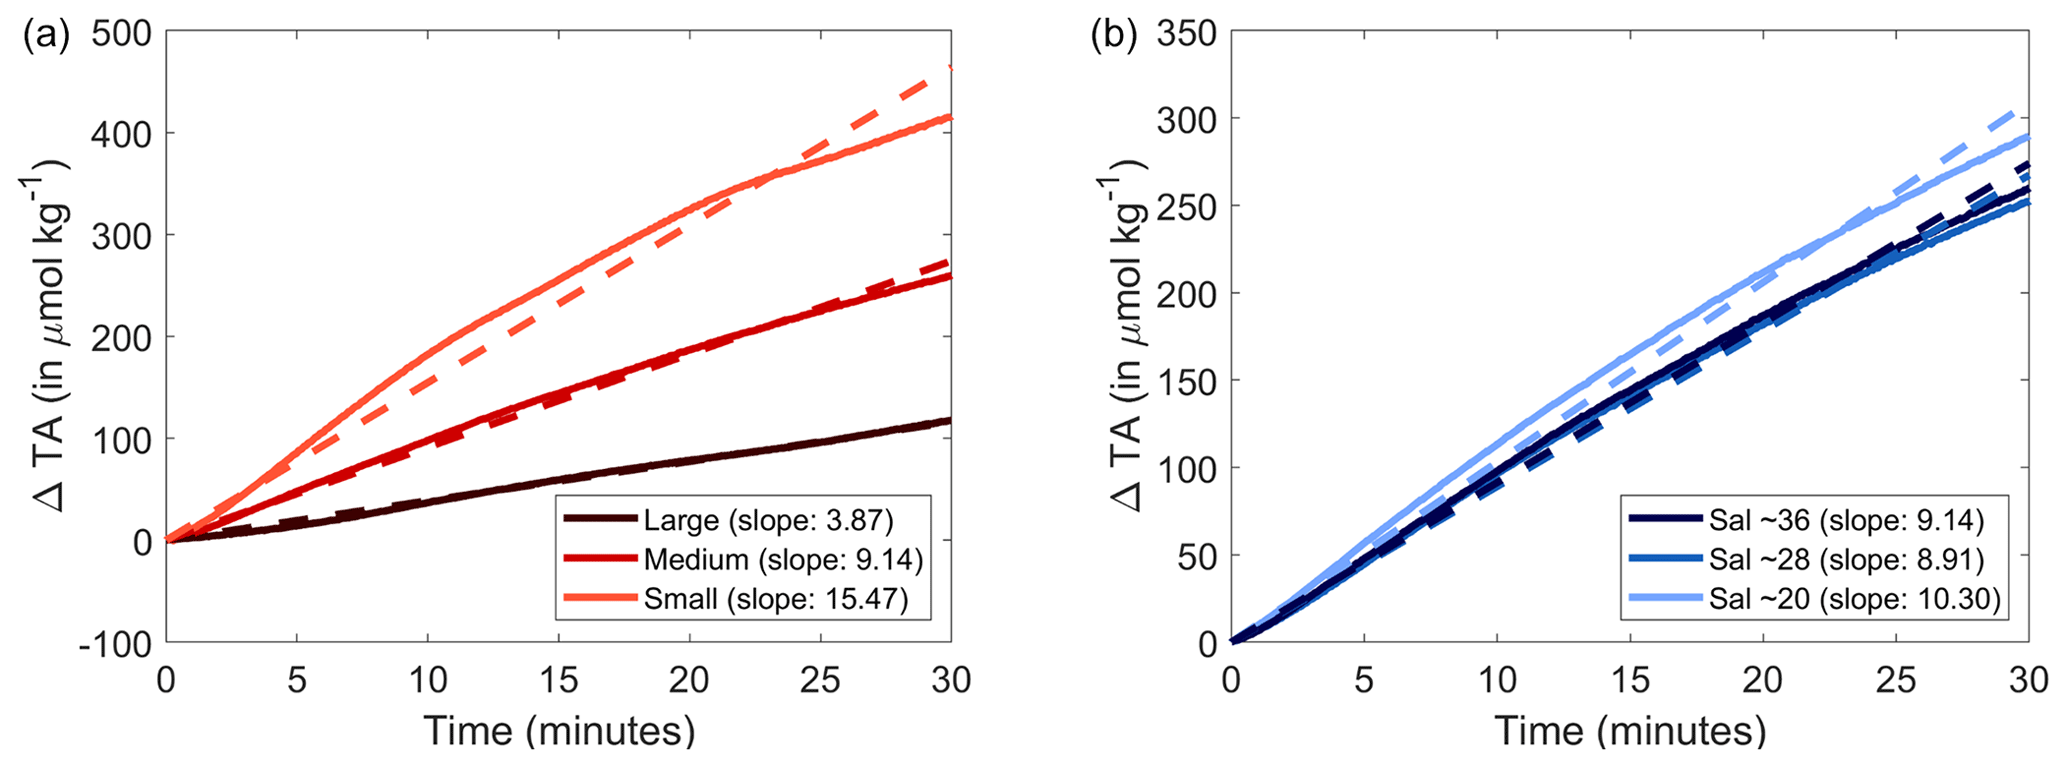
Figure 6Normalised changes in calculated AT over the first 30 min following the addition of Mg(OH)2 with three different grain sizes to natural seawater (a) and to three different salinities (b). A linear fit was calculated and is represented by the dashed line, and each slope is reported in the legend in parentheses.
4.2 Grain size and salinity effects on CaCO3 precipitation
In all experiments, Mg(OH)2 additions were chosen to reach an ΩA at which secondary CaCO3 precipitation would be expected based on our experience with CaO and Ca(OH)2 (Moras et al., 2022). Based on our suspicion that CaCO3 might precipitate onto magnesium-rich particles less easily than onto calcium-rich particles, we chose a saturation state of ∼9, slightly higher than the level of ∼7 observed for CaO and Ca(OH)2 (Moras et al., 2022). Precipitation kinetics were similar for all grain sizes; i.e. after the first precipitation was observed, a new steady state was achieved in about 2 weeks. Precipitation seemingly stopped at ΩA values close to 2.0 in experiments with seawater at a salinity of 36, similar to observations made by Moras et al. (2022) using CaO and Ca(OH)2. For the smallest grain size, AT was stable for 3–7 d, which is longer than what has been observed for CaO and Ca(OH)2 of the same size (Moras et al., 2022). This could be related to higher lattice compatibility of CaCO3 for calcium-based minerals when it comes to precipitation onto mineral surfaces (Lioliou et al., 2007). Interestingly, however, the rate at which CaCO3 precipitated was similar to that of CaO and Mg(OH)2, while Ca(OH)2 took almost twice as long to reach a new steady state (compare Fig. 1 to Fig. 2 in Moras et al., 2022).
AT remained stable for longer, i.e. 9–12 d when using medium grain size. However, similarly to the smaller-grain-size experiments, AT was also less stable with at a larger grain size, i.e. 2–3 d. As such, there appears to be an optimum grain size for keeping AT stable for longer. To explain this, there must be two opposing processes at work. As discussed earlier, smaller particles have larger surface areas per gram of material than larger ones; i.e. smaller particles in our experiments had on average more than 23 times the area of larger particles for the same amount of material, assuming round particles of 63 and 180 µm, respectively. Hence, heterogeneous precipitation will be quicker for smaller particles (Zhong and Mucci, 1989). In contrast, the mechanism that could favour quicker precipitation for larger particles with smaller surface areas remains to be understood. Here, it could be higher pH levels and hence ΩA that is reached at a particle's surface with larger diffusive boundary layer. Hence, pH and ΩA levels are likely to be much higher and remain higher for longer due to the slower dissolution of larger particles at the site of CaCO3 nucleation, which positively affects CaCO3 precipitation rates.
At varying salinities, CaCO3 precipitation became noticeable at different points in time: earlier at low salinity and later at higher salinity. While the first assumption was that at lower salinity the decrease in Ca would prevent early CaCO3 precipitation, it appears that another mechanism is at play. The natural CaCO3 inhibition potential of seawater due to dissolved Mg and DOC concentrations was affected during MilliQ dilution. It now appears that at a lower salinity, the decrease in inhibition allowed CaCO3 precipitation to occur despite a decrease in Ca and starting ΩA. Under such circumstances, early CaCO3 nucleation onto yet-to-be-dissolved Mg(OH)2 particles would occur at a faster rate at a lower salinity, which could be explained by the early drops in DIC after the addition of Mg(OH)2. The absence of such a decrease in the salinity 28 experiments is an interesting outcome but could be explained by early CO2 ingassing. The increase in DIC through CO2 ingassing could have compensated for the DIC decrease from early CaCO3 formation.
While EDX analysis did not, to our surprise, reveal significant magnesium concentrations in early precipitated aragonite crystals, i.e. ∼18 h after Mg(OH)2 addition, some aragonite crystals were observed early on. The presence of Mg could have been expected if CaCO3 precipitated heterogeneously onto Mg(OH)2 particles (Fig. 7). The absence of Mg after EDX analysis suggests that while some Mg(OH)2 could have been used as precipitation nuclei for CaCO3 early on, it completely dissolved within the first 18 h. Only the freshly precipitated CaCO3 would then remain in suspension, eventually acting as precipitation nuclei for runaway CaCO3 precipitation. Finally, it is interesting to highlight that some traces of early aragonite crystals were present in all experiments and that the needle-shaped crystals were 2 to 3 times smaller in the larger-grain-size experiments than those sampled at the end of the medium-grain-size experiments (Fig. 7). One explanation that supports the previously mentioned boundary layer theory is that the larger-grain-size particles dissolving at a slower pace maintained an Mg-rich environment, while CaCO3 started nucleating. The presence of this Mg during nucleation could have ultimately prevented CaCO3 from fully forming bigger, needle-like crystals. However, these are speculations that are hard to prove or disprove.
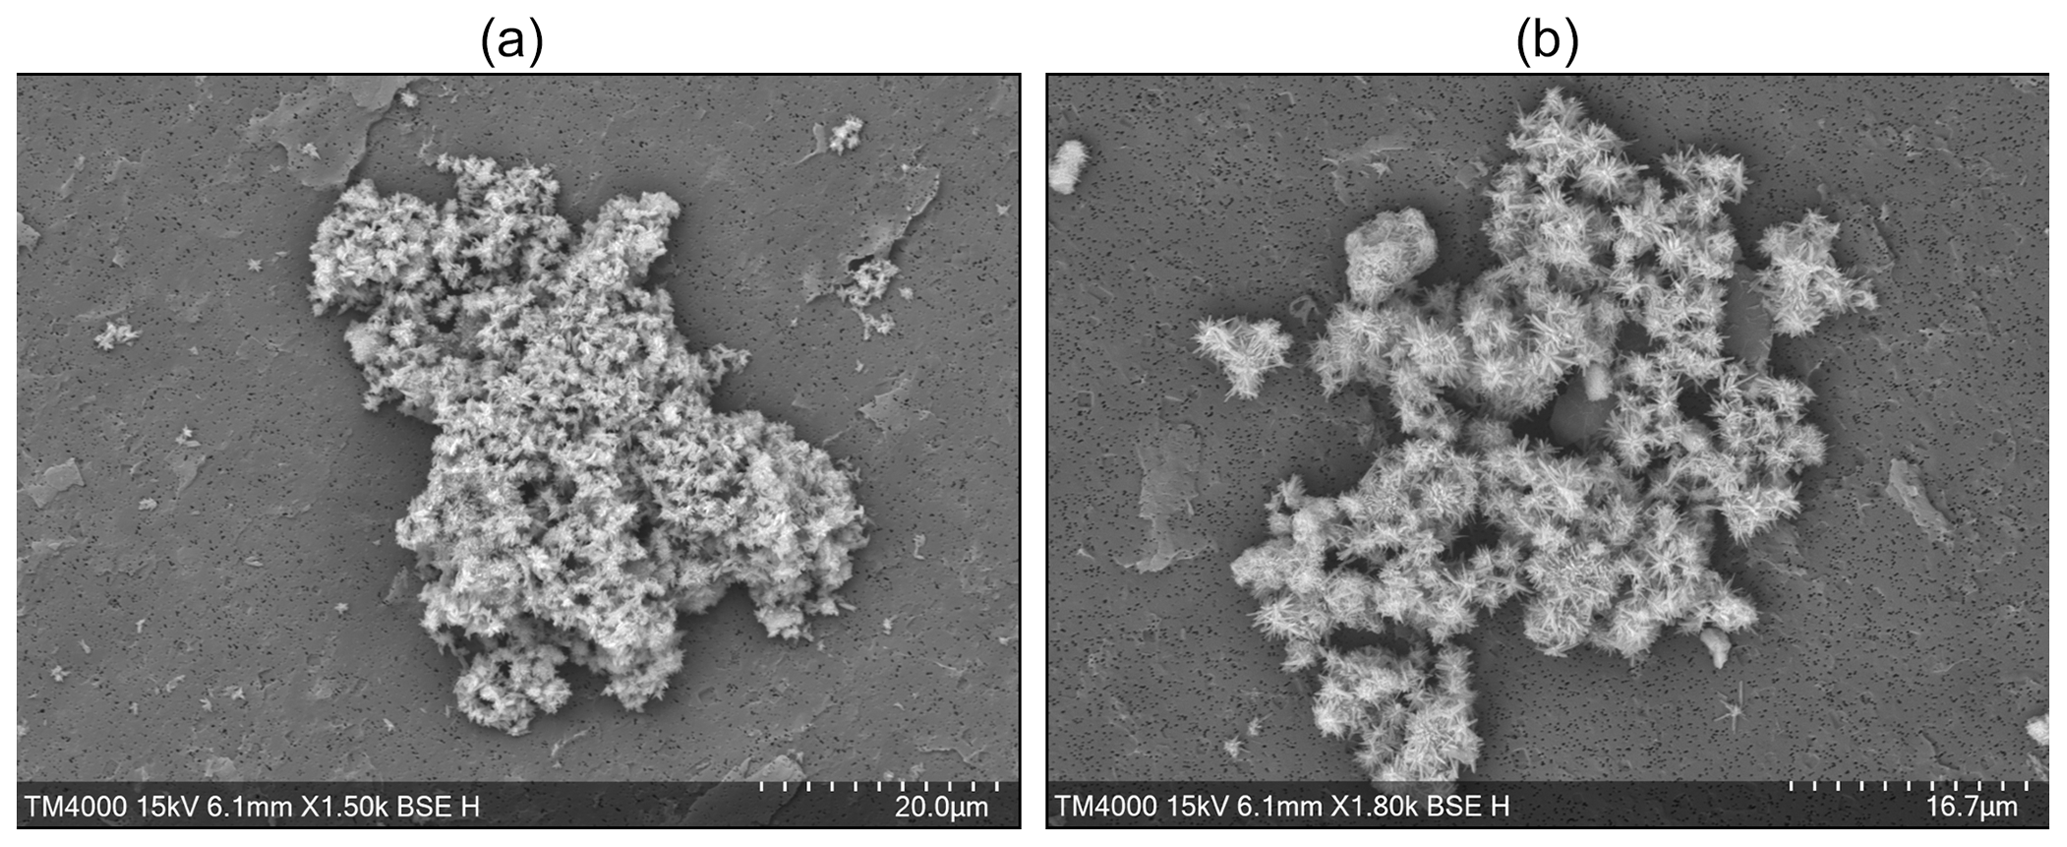
Figure 7SEM images of aragonite crystals sampled ∼18 h after the addition of larger-grain-size Mg(OH)2 (a) and sampled at the end of the medium-grain-size incubations (b).
4.3 The role of dilution and potential effects of Mg and DOC concentrations
The role of Mg in inhibiting CaCO3 nucleation is well known (Morse et al., 2007; Pan et al., 2021; Pytkowicz, 1965). Another known CaCO3 nucleation inhibitor is organic matter, particularly dissolved organic matter (Chave and Suess, 1970). While the role of organic matter is not as well understood as that of Mg, both have been linked to a decrease in CaCO3 nucleation and precipitation rates.
In our experiments involving dilution with MilliQ water, all dissolved components of the seawater were diluted, including Mg and DOC. Such decreases could explain the quicker CaCO3 precipitation in the salinity 20 experiments compared to a salinity of 36, as lower Mg and DOC concentrations did not inhibit precipitation as they did in the higher-salinity treatments. To test this, a new salinity 20 batch was prepared in triplicate and Mg was added to raise the total Mg concentration to ∼52 mmol kg−1, similar to the Mg concentration in natural seawater at a salinity of 35. The Mg increase did affect CaCO3 precipitation kinetics, as shown by changes in AT (Fig. 5): it was slightly slower and apparently reached a new steady state at higher ΔAT and ΩA. Furthermore, it is important to highlight that despite CaCO3 precipitation being triggered at a similar time, i.e. within 1 to 2 d, a difference was observed regarding the maximum ΔAT reached. In the salinity 20+MgCl2 experiments, the maximum ΔAT value was higher than the one in the salinity 20 experiments. This suggests that with a higher dissolved Mg concentration, less CaCO3 is precipitated early on. Following this early precipitation, an overall slower precipitation rate is observed until reaching a steady state (Fig. 5).
However, the slightly reduced CaCO3 precipitation rate due to decreased Mg concentration alone cannot explain such stark differences in AT stability between the salinity 36 and 20 experiments (Fig. 4). It is most likely linked to the decrease in both Mg and DOC concentrations when diluting with MilliQ. The gradient of five salinity 20 replicates with increasing DOC concentrations clearly showed that secondary CaCO3 precipitation could be delayed by modifying the DOC concentrations alone. For instance, secondary precipitation became measurable after 12 h at DOC concentrations of 120 µmol kg−1, i.e. a salinity of 35 diluted to 20, but there was almost no secondary precipitation at a DOC concentration of 325 µmol kg−1, i.e. about 1.5 times higher than in the salinity 35 experiment. CaCO3 precipitation was delayed by about 2 d when doubling the DOC concentration and completely prevented at even higher levels (Fig. 5) within the time frame of the experiment (1 week). Together, these data suggest that seawater DOC and Mg act in synergy when it comes to inhibiting CaCO3 precipitation.
Another interesting finding was the new steady state reached after runaway CaCO3 precipitation. In natural seawater at a salinity of 36, the equilibrated ΩA was estimated around 2.0, which is about 0.8 units lower than the starting conditions (Fig. 4). The decrease in ΩA after runaway precipitation has important implications for OAE: when CaCO3 precipitates in a runaway fashion, seawater can become more acidic than it was prior to mineral dissolution and less able to sequester atmospheric CO2 (Moras et al., 2022). While further work is required to understand these carbonate chemistry mechanisms at lower salinities, we can note that after runaway precipitation in seawater at a salinity of 20, the final ΩA was higher than the starting one. Such a difference is likely due to the lower starting Ca2+ concentration at a lower salinity.
One main objective of this research was to assess the dissolution of Mg(OH)2 in seawater at varying salinities using different mineral grain sizes and report on the subsequent CaCO3 precipitation kinetics. The dissolution of Mg(OH)2 in natural seawater occurred at a much faster rate when using grain sizes lower than 63 µm due to the higher surface area in contact with seawater. In contrast, bigger particles (>63 µm) took about 4 times as long to fully dissolve. In all experiments, CaCO3 precipitation occurred in a runaway fashion; i.e. after a period of seeming stability, AT decreased rapidly before a new steady state was reached at which AT concentrations were far lower than prior to the Mg(OH)2 addition. Such a pattern was also observed for Ca-rich minerals but at lower ΩA. While further research is required to precisely determine the critical ΩA for both Ca- and Mg-rich minerals, the longer time for the initiation of CaCO3 runaway precipitation and the overall higher ΩA may suggest that Mg(OH)2 is a safer alkaline feedstock for OAE. One major finding of this research was that two processes seem to occur during CaCO3 precipitation in relation to grain size, where in one process the higher surface area of smaller particles could increase precipitation rates, while the second may maintain higher pH around larger particles due to a larger diffusive boundary layer compared to smaller particles, which increased precipitation rates. Hence, there appears to be an optimum grain size to minimise secondary CaCO3 precipitation. The second objective of this research was to understand the role of salinity in Mg(OH)2 dissolution and CaCO3 precipitation kinetics. While no obvious changes in dissolution were observed, CaCO3 precipitation differed, with quicker precipitation observed at lower salinities. The decrease in Mg concentrations was identified as the root cause, although in our experiments it was also linked to the lowered DOC concentration, an artefact of low-salinity seawater preparation when diluted with MilliQ. Nevertheless, this highlights the importance of DOC in modifying CaCO3 precipitation kinetics and hence AT stability.
All data can be found on Zenodo at https://doi.org/10.5281/zenodo.11483882 (Moras, 2024).
CAM and KGS designed the initial experiments with inputs from TC and LTB. CAM ran all the experiments and with the help of KGS designed the follow-up experiments using MgCl2 and DOC. The ICP-MS analyses were performed by CAM and RJB, while CAM and KGS performed the SEM analyses. The first draft of the manuscript was written by CAM with inputs from KGS, and all co-authors helped to write and review the final paper for submission.
At least one of the (co-)authors is a member of the editorial board of Biogeosciences. The peer-review process was guided by an independent editor, and the authors also have no other competing interests to declare.
Publisher's note: Copernicus Publications remains neutral with regard to jurisdictional claims made in the text, published maps, institutional affiliations, or any other geographical representation in this paper. While Copernicus Publications makes every effort to include appropriate place names, the final responsibility lies with the authors.
We would like to sincerely thank Atlas Materials for providing the magnesium hydroxide. We are also thankful to Nick Ward for accommodating our use of the Scanning Electron Microscope, as well as Matheus Carvalho de Carvalho for the dissolved organic carbon analyses.
This research is part of the PhD project of Charly A. Moras that is funded by a Cat. 5 – SCU graduate school scholarship from Southern Cross University, Lismore, Australia. The ICP-MS analyses were made possible by Australian Research Council grants to Renaud Joannes-Boyau and Kai G. Schulz (grant no. LE200100022) and to Renaud Joannes-Boyau (grant no. LE120100201).
This paper was edited by Olivier Sulpis and reviewed by two anonymous referees.
Carvalho, M. C.: Adapting an elemental analyser to perform high-temperature catalytic oxidation for dissolved organic carbon measurements in water, Rapid Commun. Mass Sp., 37, e9451, https://doi.org/10.1002/rcm.9451, 2023.
Chave, K. E. and Suess, E.: Calcium carbonate saturation in seawater: Effects of dissolved organic matter, Limnol. Oceanogr., 15, 633–637, https://doi.org/10.4319/lo.1970.15.4.0633, 1970.
Dickson, A. G.: Standard potential of the reaction: , and the standard acidity constant of the ion in synthetic sea water from 273.15 to 318.15 K, J. Chem. Thermodyn., 22, 113–127, https://doi.org/10.1016/0021-9614(90)90074-Z, 1990.
Dickson, A. G., Sabine, C. L., and Christian, J. R.: Guide to best practices for ocean CO2 measurements, PICES Special Publication 3, IOCCP Report 8, Sidney, British Columbia, North Pacific Marine Science Organization, 191 pp., https://doi.org/10.25607/OBP-1342, 2007.
Eisaman, M. D., Geilert, S., Renforth, P., Bastianini, L., Campbell, J., Dale, A. W., Foteinis, S., Grasse, P., Hawrot, O., Löscher, C. R., Rau, G. H., and Rønning, J.: Assessing the technical aspects of ocean-alkalinity-enhancement approaches, in: Guide to Best Practices in Ocean Alkalinity Enhancement Research, edited by: Oschlies, A., Stevenson, A., Bach, L. T., Fennel, K., Rickaby, R. E. M., Satterfield, T., Webb, R., and Gattuso, J.-P., Copernicus Publications, State Planet, 2-oae2023, 3, https://doi.org/10.5194/sp-2-oae2023-3-2023, 2023.
Friedlingstein, P., Jones, M. W., O'Sullivan, M., Andrew, R. M., Bakker, D. C. E., Hauck, J., Le Quéré, C., Peters, G. P., Peters, W., Pongratz, J., Sitch, S., Canadell, J. G., Ciais, P., Jackson, R. B., Alin, S. R., Anthoni, P., Bates, N. R., Becker, M., Bellouin, N., Bopp, L., Chau, T. T. T., Chevallier, F., Chini, L. P., Cronin, M., Currie, K. I., Decharme, B., Djeutchouang, L. M., Dou, X., Evans, W., Feely, R. A., Feng, L., Gasser, T., Gilfillan, D., Gkritzalis, T., Grassi, G., Gregor, L., Gruber, N., Gürses, Ö., Harris, I., Houghton, R. A., Hurtt, G. C., Iida, Y., Ilyina, T., Luijkx, I. T., Jain, A., Jones, S. D., Kato, E., Kennedy, D., Klein Goldewijk, K., Knauer, J., Korsbakken, J. I., Körtzinger, A., Landschützer, P., Lauvset, S. K., Lefèvre, N., Lienert, S., Liu, J., Marland, G., McGuire, P. C., Melton, J. R., Munro, D. R., Nabel, J. E. M. S., Nakaoka, S.-I., Niwa, Y., Ono, T., Pierrot, D., Poulter, B., Rehder, G., Resplandy, L., Robertson, E., Rödenbeck, C., Rosan, T. M., Schwinger, J., Schwingshackl, C., Séférian, R., Sutton, A. J., Sweeney, C., Tanhua, T., Tans, P. P., Tian, H., Tilbrook, B., Tubiello, F., van der Werf, G. R., Vuichard, N., Wada, C., Wanninkhof, R., Watson, A. J., Willis, D., Wiltshire, A. J., Yuan, W., Yue, C., Yue, X., Zaehle, S., and Zeng, J.: Global Carbon Budget 2021, Earth Syst. Sci. Data, 14, 1917–2005, https://doi.org/10.5194/essd-14-1917-2022, 2022.
Fuhr, M., Geilert, S., Schmidt, M., Liebetrau, V., Vogt, C., Ledwig, B., and Wallmann, K.: Kinetics of Olivine Weathering in Seawater: An Experimental Study, Front. Clim., 4, 831587, https://doi.org/10.3389/fclim.2022.831587, 2022.
Gafar, N. A. and Schulz, K. G.: A three-dimensional niche comparison of Emiliania huxleyi and Gephyrocapsa oceanica: reconciling observations with projections, Biogeosciences, 15, 3541–3560, https://doi.org/10.5194/bg-15-3541-2018, 2018.
GESAMP (IMO/FAO/UNESCO-IOC/UNIDO/WMO/IAEA/UN/UN Environment/UNDP/ISA Joint Group of Experts on the Scientific Aspects of Marine Environmental Protection): High level review of a wide range of proposed marine geoengineering techniques, edited by: Boyd, P. W. and Vivian, C. M. G., Rep. Stud. GESAMP no. 98, 144 pp. ISSN 1020-4873, 2019.
Hartmann, J., West, A. J., Renforth, P., Köhler, P., De La Rocha, C. L., Wolf-Gladrow, D. A., Dürr, H. H., and Scheffran, J.: Enhanced chemical weathering as a geoengineering strategy to reduce atmospheric carbon dioxide, supply nutrients, and mitigate ocean acidification, Rev. Geophys., 51, 113–149, https://doi.org/10.1002/rog.20004, 2013.
Hartmann, J., Suitner, N., Lim, C., Schneider, J., Marín-Samper, L., Arístegui, J., Renforth, P., Taucher, J., and Riebesell, U.: Stability of alkalinity in ocean alkalinity enhancement (OAE) approaches – consequences for durability of CO2 storage, Biogeosciences, 20, 781–802, https://doi.org/10.5194/bg-20-781-2023, 2023.
Hoegh-Guldberg, O., Jacob, D., Taylor, M., Guillén Bolaños, T., Bindi, M., Brown, S., Camilloni, I. A., Diedhiou, A., Djalante, R., Ebi, K., Engelbrecht, F., Guiot, J., Hijioka, Y., Mehrotra, S., Hope, C. W., Payne, A. J., Pörtner, H.-O., Seneviratne, S. I., Thomas, A., Warren, R., and Zhou, G.: The human imperative of stabilizing global climate change at 1.5 °C, Science, 365, eaaw6974, https://doi.org/10.1126/science.aaw6974, 2019.
IPCC: Summary for Policymakers, in: Climate Change 2021: The Physical Science Basis. Contribution of Working Group I to the Sixth Assessment Report of the Intergovernmental Panel on Climate Change, edited by: Masson-Delmotte, V., Zhai, P., Pirani, A., Connors, S. L., Péan, C., Berger, S., Caud, N., Chen, Y., Goldfarb, L., Gomis, M. I., Huang, M., Leitzell, K., Lonnoy, E., Matthews, J. B. R., Maycock, T. K., Waterfield, T., Yelekçi, O., Yu, R., and Zhou, B., Cambridge University Press, Cambridge, United Kingdom and New York, NY, USA, 3–32, https://doi.org/10.1017/9781009157896.001, 2021.
Kheshgi, H. S.: Sequestering atmospheric carbon dioxide by increasing ocean alkalinity, Energy, 20, 915–922, https://doi.org/10.1016/0360-5442(95)00035-F, 1995.
Lewis, E. L. and Perkin, R. G.: The practical salinity scale 1978: conversion of existing data, Deep-Sea Res., 28, 307–328, https://doi.org/10.1016/0198-0149(81)90002-9, 1981.
Lioliou, M. G., Paraskeva, C. A., Koutsoukos, P. G., and Payatakes, A. C.: Heterogeneous nucleation and growth of calcium carbonate on calcite and quartz, J. Colloid Interf. Sci., 308, 421–428, https://doi.org/10.1016/j.jcis.2006.12.045, 2007.
Lueker, T. J., Dickson, A. G., and Keeling, C. D.: Ocean pCO2 calculated from dissolved inorganic carbon, alkalinity, and equations for K1 and K2: Validation based on laboratory measurements of CO2 in gas and seawater at equilibrium, Mar. Chem., 70, 105–119, https://doi.org/10.1016/S0304-4203(00)00022-0, 2000.
Lüthi, D., Le Floch, M., Bereiter, B., Blunier, T., Barnola, J.-M., Siegenthaler, U., Raynaud, D., Jouzel, J., Fischer, H., Kawamura, K., and Stocker, T. F.: High-resolution carbon dioxide concentration record 650 000–800 000 years before present, Nature, 453, 379–382, https://doi.org/10.1038/nature06949, 2008.
Marion, G. M., Millero, F. J., and Feistel, R.: Precipitation of solid phase calcium carbonates and their effect on application of seawater SA–T–P models, Ocean Sci., 5, 285–291, https://doi.org/10.5194/os-5-285-2009, 2009.
Millero, F., Huang, F., Zhu, X., Liu, X., and Zhang, J.-Z.: Adsorption and desorption of phosphate on calcite and aragonite in seawater, Aquat. Geochem., 7, 33–56, https://doi.org/10.1023/A:1011344117092, 2001.
Monnin, E., Indermühle, A., Dällenbach, A., Flückiger, J., Stauffer, B., Stocker, T. F., Raynaud, D., and Barnola, J. M.: Atmospheric CO2 concentrations over the last glacial termination, Science, 291, 112–114, https://doi.org/10.1126/science.291.5501.112, 2001.
Montserrat, F., Renforth, P., Hartmann, J., Leermakers, M., Knops, P., and Meysman, F. J. R.: Olivine dissolution in seawater: Implications for CO2 sequestration through enhanced weathering in coastal environments, Environ. Sci. Technol., 51, 3960–3972, https://doi.org/10.1021/acs.est.6b05942, 2017.
Moras, C.: Dataset on the effects of mineral grain size and seawater salinity on Mg(OH)2 dissolution and CaCO3 precipitation kinetics, Zenodo [data set], https://doi.org/10.5281/zenodo.11483882, 2024.
Moras, C. A., Bach, L. T., Cyronak, T., Joannes-Boyau, R., and Schulz, K. G.: Ocean alkalinity enhancement – avoiding runaway CaCO3 precipitation during quick and hydrated lime dissolution, Biogeosciences, 19, 3537–3557, https://doi.org/10.5194/bg-19-3537-2022, 2022.
Moras, C. A., Bach, L. T., Cyronak, T., Joannes-Boyau, R., and Schulz, K. G.: Preparation and quality control of in-house reference materials for marine dissolved inorganic carbon and total alkalinity measurements, Limnol. Oceanogr.-Meth., 21, 637–644, https://doi.org/10.1002/lom3.10570, 2023.
Morse, J. W., Arvidson, R. S., and Lüttge, A.: Calcium carbonate formation and dissolution, Chem. Rev., 107, 342–381, https://doi.org/10.1021/cr050358j, 2007.
Pan, Y., Li, Y., Ma, Q., He, H., Wang, S., Sun, Z., Cai, W.-J., Dong, B., Di, Y., Fu, W., and Chen, C.-T. A.: The role of Mg2+ in inhibiting CaCO3 precipitation from seawater, Mar. Chem., 237, 104036, https://doi.org/10.1016/j.marchem.2021.104036, 2021.
Pytkowicz, R. M.: Rates of inorganic calcium carbonate nucleation, J. Geol., 73, 196–199, https://doi.org/10.1086/627056, 1965.
Sharp, J., Pierrot, D., Humphreys, M., Epitalon, J., Orr, J., Lewis, E., and Wallace, D.: CO2SYSv3 for MATLAB, Zenodo [code], https://doi.org/10.5281/zenodo.3950562, 2021.
Siegenthaler, U., Stocker, T. F., Monnin, E., Lüthi, D., Schwander, J., Stauffer, B., Raynaud, D., Barnola, J. M., Fischer, H., Masson-Delmotte, V., and Jouzel, J.: Stable carbon cycle-climate relationship during the Late Pleistocene, Science, 310, 1313–1317, https://doi.org/10.1126/science.1120130, 2005.
Uppström, L. R.: The boron/chlorinity ratio of deep-sea water from the Pacific Ocean, Deep Sea Research and Oceanographic Abstracts, 21, 161–162, https://doi.org/10.1016/0011-7471(74)90074-6, 1974.
Zeebe, R. E. and Wolf-Gladrow, D.: CO2 in seawater: equilibrium, kinetics, isotopes, vol. 65, Gulf Professional Publishing, 360 pp., ISBN: 9780444509468, 2001.
Zhong, S. and Mucci, A.: Calcite and aragonite precipitation from seawater solutions of various salinities: Precipitation rates and overgrowth compositions, Chem. Geol., 78, 283–299, https://doi.org/10.1016/0009-2541(89)90064-8, 1989.