the Creative Commons Attribution 4.0 License.
the Creative Commons Attribution 4.0 License.
 | 02 Aug 2024
Patterns and drivers of organic matter decomposition in peatland open-water pools
Julien Arsenault
Julie Talbot
Tim R. Moore
Klaus-Holger Knorr
Henning Teickner
Jean-François Lapierre
Peatland pools are unvegetated, inundated depressions that cover up to 30 % of the surface of many temperate and boreal peatlands and that are net carbon (C) sources within C-accumulating ecosystems. The emission of carbon dioxide (CO2) and methane (CH4) from peatland pools comes from the degradation of organic matter (OM) that comprises the surrounding matrix. It is, however, not clear how decomposition rates in pools, which define their function and distinguish them from other aquatic ecosystems, vary spatially and what mechanisms drive these variations. We first quantified rates of OM decomposition from fresh litter at different depths in six pools of distinct morphological characteristics in a temperate ombrotrophic peatland using litterbags of Sphagnum capillifolium and Typha latifolia over a 27-month period. Rates of decomposition were faster for T. latifolia than S. capillifolium and, overall, faster at the pool surface and decreased with increasing depth. We then measured potential CO2 and CH4 production from the sediments of the same six pools by performing 35 d laboratory incubations. Pool sediment chemistry was variable among pools and influenced the production of CH4 and CO2 from sediments, with decreasing CO2 production with increasing OM humification and decreasing CH4 production with increasing nitrogen-to-phosphorus ratio. Both CH4 production and CO2 production from pool sediments were higher in the 1 m deep pools but similar in the shallow < 1 and the > 1.5 m deep pools. When combining both experiments, our results indicate that OM decomposition in peatland pools is highly variable and mostly related to the environmental conditions in which it occurs as a function of general pool depth rather than to OM chemistry. Overall, we show that OM degradation and C emissions in peatland open-water pools may increase over time in warmer and drier climate conditions.
- Article
(2505 KB) - Full-text XML
-
Supplement
(670 KB) - BibTeX
- EndNote


Peatlands are among the largest carbon (C) reservoirs on the planet, storing twice the C found in forest soils (Loisel et al., 2021; Pan et al., 2011) but covering only 3 % of the Earth's surface (Xu et al., 2018). The positive C balance of peatlands is the result of slower organic matter (OM) decomposition rates compared to net primary production in response to anoxic conditions in cool and water-saturated soils, to functionally limited decomposer communities, and to plant species that are slow to decompose (Rydin and Jeglum, 2013). Open-water pools that develop in many temperate and boreal peatlands are small (often < 2000 m2 and < 2 m deep; Arsenault et al., 2022) and generally have a negative C balance because of distinct environmental conditions (e.g. higher oxygen (O2) availability and warmer temperature) compared to the surrounding soils (Foster and Glaser, 1986) that lead to rates of OM decomposition that are faster than rates of OM production (Pelletier et al., 2015). However, C cycling in peatland pools (and thus decomposition processes occurring within) is strongly influenced by the state of the peatland (disturbed or unperturbed) and, more broadly, its geographical settings (e.g. Arsenault et al., 2023; Chapman et al., 2022). Hence, undisturbed ombrotrophic peatlands that have pool covers greater than 37 % may be net sources of C in the atmosphere (Pelletier et al., 2014).
Within a single peatland, pool morphology (i.e. depth, area, shape) and OM quality may be heterogeneous (Arsenault et al., 2019), which influences the biogeochemical patterns of pools and the magnitude of the processes that control them. For example, shallow pools (< 1 m) have higher concentrations in dissolved organic C (DOC), total nitrogen (TN), carbon dioxide (CO2), and methane (CH4) and lower pH than deep pools (> 1.5 m) (Arsenault et al., 2018). Moreover, in a spatiotemporal study of peatland pool biogeochemistry, Hassan et al. (2023) found that dissolved OM (DOM) concentrations and composition drove intra- and inter-regional patterns in pool CO2 and CH4 dynamics. Assuming most of the DOM processed in temperate and boreal peatland pools originates from the surrounding peat and vegetation (Prijac et al., 2022) and considering the role of pool morphology in biogeochemical patterns and processes, OM degradation rates may vary spatially in response to different environmental conditions. It is, however, unclear how environmental heterogeneity affects decomposition processes in peatland pools and, more broadly, how it affects the overall capacity of peatlands to sequester C.
Spatial variations in decomposition and C emission rates from pools may emerge as a function of pool depth and hydrological connectivity with the surrounding peat soil. Pools are more oxygenated, warmer, and light penetrates deeper in their profile than in the surrounding peat, but O2 concentrations, temperature, and light intensity reaching the sediments decrease with increasing pool depth (Arsenault et al., 2018). Anoxia, temperature, and luminosity are major drivers of OM decay in aquatic ecosystems as they control microbial activity of production and decomposition (Pace and Prairie, 2005). Subsequently, OM decomposition rates may be higher in shallow pools than in deeper pools because of increased microbial activity at the water–peat interface.
Decomposition rates in aquatic and terrestrial ecosystems are also related to the chemical and physical composition of the substrate. For example, in northern peatlands, decay rates (k) of litter ranged, over a maximum of 6 years, from 0.02 yr−1 for some Sphagnum species to 0.25 yr−1 for vascular plants and > 0.9 yr−1 in soft-tissued plants such as Maianthemum (Moore et al., 2007). Spatial variations in peat-forming vegetation composition affect the chemistry of the peat and potentially that of the litter that falls in the pools (e.g. Kaštovská et al., 2018). Peat chemistry also varies in depth, with deeper layers of peatland soils generally being depleted in phosphorus (P) and enriched in nitrogen (N) and aromatic organic C molecules that are more recalcitrant to decomposition compared to the surface layers (Cocozza et al., 2003; Wang et al., 2015). It is thus possible that OM decomposition rates in pools also vary within a peatland because of vegetation heterogeneity and changing substrate quality with increasing pool depth. However, to our knowledge, the relationships between the physical conditions of temperate peatland pools and the chemical properties of decaying OM, and the control they exert on decomposition rates in peatland pools, have never been studied.
The litterbag technique is a commonly used method to measure monthly to multi-year decomposition rates in aquatic (Tonin et al., 2018) and terrestrial (Karberg et al., 2008) ecosystems. In peatlands, litterbags have been used to compare decomposition rates of peat-forming plants in different environmental conditions, ranging from anoxic peat layers to oxygenated beaver pond water (e.g. Moore et al., 2007). While litterbags provide insights into environmental controls of OM decomposition, they can hardly account for variation in material molecular composition such as that observed along peat profiles, as both peat quality and environmental conditions change with depth. Laboratory incubations of peat and pool sediments, where decomposition of different materials can be measured under controlled conditions (Schädel et al., 2020), can provide this extra information on the degradability of OM of different molecular composition. Thus, a combination of in situ and laboratory experiment approaches is needed to isolate the mechanisms controlling OM decomposition in peatland pools.
Pools are often overlooked in peatland studies (Loisel et al., 2017), and little attention has been given to the mechanisms controlling the rates at which decomposition processes occur in such features. Hence, the relationships between the structure of peatland pools and OM processing and, more generally, the role pools play in the C budget of a peatland remain unclear. In this context, this study aimed at providing a mechanistic understanding of OM decomposition in peatland pools. Specifically, the objectives were to (i) quantify rates of similar, fresh OM litter decomposition in pools of different morphological and chemical properties; (ii) measure the degradability of individual pool sediments under controlled conditions; and (iii) assess the role OM chemistry plays in decomposition rates for both litter and sediments. Using the litterbag technique for a 27-month in situ experiment and laboratory incubations of pool sediments, we measured rates of decomposition of OM in and from peatland pools (Fig. 1) and characterized spatiotemporal changes in OM composition.
2.1 Site description
In situ experiments and organic matter (OM) samples for degradation experiments were collected in Grande plée Bleue (GPB), a mostly undisturbed 15 km2 ombrotrophic peatland located 12 km southeast of Québec, Canada (46°47′ N, 71°03 W; altitude ∼ 88 m). Its climate is cool continental, with a mean annual air temperature of 4.8 °C and a mean annual precipitation of 1066 mm (206 mm of which fell as snow) for the 1991–2020 interval at the nearest meteorological station (4.2 km from the study site) (Canadian Climate Data – Saint-Michel Station, 2022). The peatland was initiated over marine sediments of the Goldthwait Sea 9500 years ago and expanded laterally through the paludification of surrounding forests (Lavoie et al., 2012). Ombrotrophic conditions prevailed for the last 8300 years, and peat depth reaches 5 m in the center of the peatland (Lavoie et al., 2012). Vegetation composition varies in the peatland, with some areas dominated by Sphagnum mosses, small ericaceous shrubs (e.g. Kalmia angustifolia, Chamaedaphne calyculata), or graminoid (e.g. Carex spp., Eriophorum virginicum, and Rhyncospora spp.); some by continuous shrub covers (e.g. K. angustifolia, Rhododendron spp., and Gaylussacia baccata) underlain by Sphagnum mosses; and others by dense coniferous trees (e.g. Picea mariana and Larix laricina).
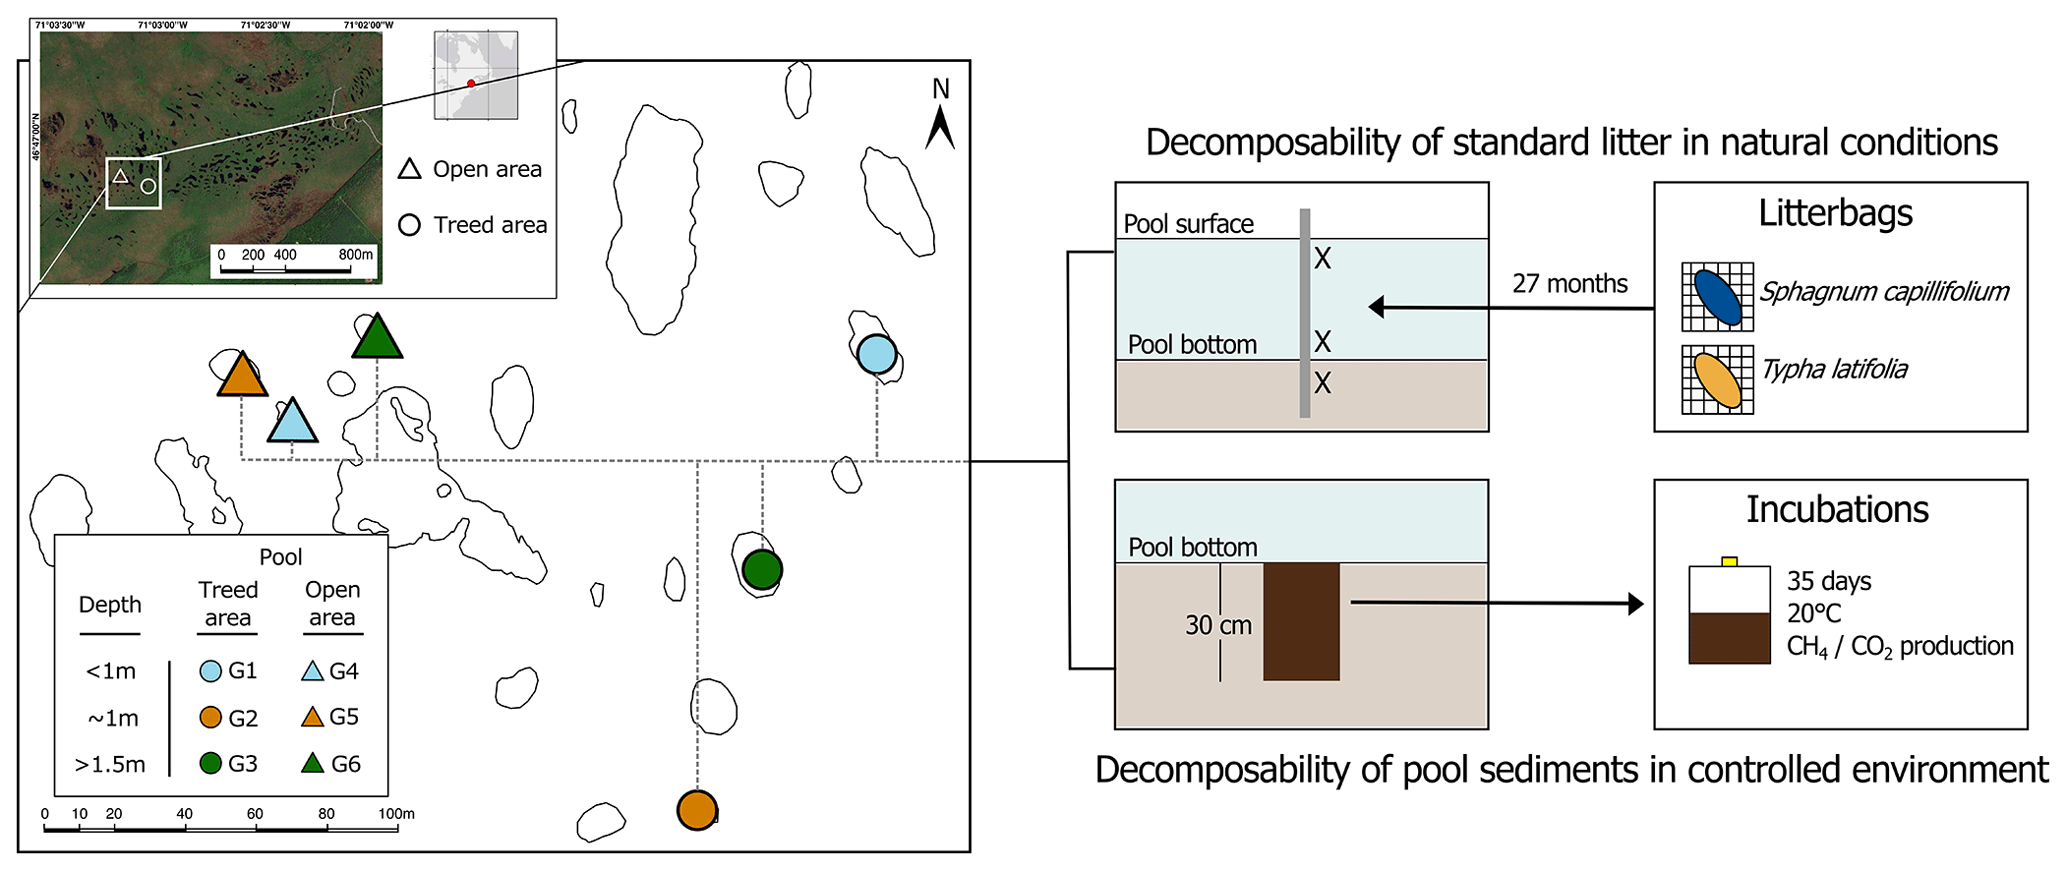
Figure 1Conceptual framework of the experiment. Six pools of different depth categories were selected in two areas of the peatland characterized by distinct vegetation assemblages. We installed litterbags of Sphagnum capillifolium and Typha latifolia over a period of 27 months at the surface, near the bottom, and in the sediments of each pool to measure the decomposability of standard fresh litter under natural conditions. We conducted incubations on sediment samples collected at the center of each pool to measure the decomposability of pool bottom material under controlled settings and assessed pool sediment chemistry and changes in litter chemical composition after 27 months. The satellite photo of the site is from DigitalGlobe WorldView-2 imagery.
The southern and central parts of the peatland are characterized by the presence of > 600 pools of different shapes, areas (10–2350 m2, mean 381 m2; n=156), and depths (15–219 cm, mean 93 cm; n=156); the surface extent and water level of these pools vary little over time (Arsenault et al., 2018, 2019). For this study, we selected six pools: three pools located in an open area with vegetation mainly composed of extensive Sphagnum moss mats and small, sparse C. calyculata and K. angustifolia shrubs and three pools in a treed area with P. mariana (height > 2 m) dominating the canopy (Fig. 1). In each area, the three pools that we selected were of different depths (shallow, < 1 m; average, ∼ 1 m; deep, > 1.5 m). In each pool, we installed litterbags, took samples of the sediment and underlying peat, and collected water and gas samples.
2.2 Litterbags
To assess the effect of pool chemical and physical characteristics on decomposition rates, we installed litterbags of Typha latifolia leaf and stem tissues (collected at Mer Bleue peatland, Ontario, and cut in 10 cm lengths) and Sphagnum capillifolium (capitulum and first 5 cm of the stem, harvested in situ) in each of the six pools and in the surrounding peat. We chose T. latifolia even though it was not found at the site because it decomposes moderately quickly, so we were assured of measuring a reasonable mass loss over the duration of the experiment, contrary to S. capillifolium, which decomposes slowly and may not show significant differences with the litterbag emplacement locations (Moore et al., 2007). T. latifolia from the same source was also used in a variety of wetland locations as a standard litter, thus allowing for the comparison of the decomposability potential of peatland pools with other wetland environments (Clarkson et al., 2014; Dong et al., 2024). Upon collection, litter was oven-dried (40 °C) to clear it from any residual moisture and discourage Sphagnum from regrowing upon installation. Litterbags were made of fiberglass mosquito netting with a 1×1 mm mesh size. Bags were numbered, weighed, and filled with approximately 2 g of dry material, then weighed again to obtain the initial mass of the litter. Material was then rewetted using deionized water prior to field installation.
In June 2019, we installed triplicates of both types of litter at three depths (at the surface, 15 cm above the pool bottom, and 15 cm below the sediment–water interface) in each pool. Surface litterbags were attached to a buoy. To reach deep locations, bags were fixed on wood stakes that were inserted in the pool sediments. In the two areas, we also installed triplicates of litterbags of the two litter types in the unsaturated surface layer of the peat surrounding the pools (5 cm under the peatland surface) to compare decomposition rates between the acrotelm and the pools.
Litterbags were retrieved five times over the course of three growing seasons to provide an indication of the times during the year when decomposition occurs and to obtain enough data (litter weight loss over time) to estimate the exponential decay parameters. A first set of bags was retrieved from each pool and from the peat in the two zones at the end of the 2019 growing season (4 months after installation). The other bags were retrieved in the spring and fall of 2020 (11 and 16 months after installation respectively) and again in the spring (23 months) and fall of 2021 (27 months). Upon collection, litterbags were stored at −20 °C until analysis. After thawing at 4 °C, bags were carefully washed using deionized water and tweezers to remove any alien material. The remaining litter was oven-dried (40 °C) for 72 h to ensure a uniform residual moisture content, then weighed, and the percentage of the original mass was calculated. For the samples that were retrieved after 27 months, we then milled the litter and analyzed for molecular composition of C compounds and C, N, and P concentrations to assess changes between the original material and the material that has been exposed to environmental conditions for 27 months in the pools.
2.3 Incubations
To test for differences in peat composition and degradability among pools, we collected samples of bottom material at the center of the six studied pools. Using a Kajak–Brinkhurst corer, in the spring of 2021, we sampled the first 30 cm of pool sediments to reach both limnic sediments and the underlying peat. We transferred each core in clean low-density polyethylene bags and homogenized the material. Back in the lab, we drained the samples of excess water using a cheesecloth (24 h at 4 °C). We then brought the samples to room temperature for another 24 h before we started the incubations.
From each pool sediment sample, we took five subsamples for incubations. At the initial time, we half-filled 250 mL glass jars with the drained, homogenized pool bottom subsample, added 30 mL of deionized water to measure DOC production after incubations, and sealed the jars with lids equipped with stopcock valves attached to rubber tubes for headspace sampling. Jars were kept at 20 °C with no direct sunlight for the entire incubation time. For each set of pool subsample, we also added a sealed, empty jar to measure ambient air gas concentrations.
Gas samples of 5 mL were taken from the headspace of each jar using a syringe at initial time (T=0 d) and after T=0.5, 1, 2, 3, 5, 7, 11, 14, 21, 29, and 35 d. Gas sampled in the headspace was replaced with ambient air to add O2 in the jars and mimic natural O2 production at the water–sediment interface in the pools (Arsenault et al., 2018). Gas samples were rapidly analyzed for CH4 and CO2 concentrations on a Shimadzu GC-14 gas chromatograph, equipped with a flame ionization detector for CH4, and a methanizer with a 0.7 m column of Ni-reduced catalyst for CO2. Concentrations were corrected to account for the addition of ambient air at each sampling time.
At the end of the incubations, material from each jar was drained to collect water, oven-dried for 5 d at 40 °C, and weighed. We also dried the remaining original material at the same time. Because we were unable to retrieve more than 5 mL of water from any jar, we bulked the incubation water samples per pool and analyzed for DOC and TDN concentrations on a Shimadzu TOC-V total organic carbon analyzer after acidification with HCl (ASTM methods D7573-09 and D8083-16). All dried material was milled and analyzed for molecular composition to characterize differences in sediment material between pools.
We calculated CH4 and CO2 production rates in each jar between each sampling as the linear change in gas concentration in the headspace over time, allowing for changes from replacing headspace with ambient air (Kim et al., 2015). We measured ambient CO2 and CH4 concentrations and estimated the post-sampling concentration as the new concentration in the jars until the next sampling by taking into account the addition of 5 mL of ambient air in each jar. Production rates from the five replicates were averaged and reported relative to the dry mass of C. We estimated the 35 d total production of CH4 and CO2 by summing the rates of production in a sampling interval multiplied by the number of days between samplings. Rates were treated as production when > 0 and as consumption when < 0. Rates were expressed in micrograms of CO2 per gram of carbon per day (µg CO2 g C−1 d−1) and in micrograms of CH4 per gram of carbon per day (µg CH4 g C−1 d−1).
2.4 Litter and peat chemistry
To account for temporal changes in fresh litter chemistry and spatial variations in pool sediment chemistry, we analyzed final and initial litter and sediment elemental contents (C, N, P, K, Ca, Na, K, Mg), isotope signatures δ13C (‰ V-PDB) and δ15N (‰ AIR nitrogen), and absorbance of mid-infrared radiation in the range of 650 to 4000 cm−1, providing information on the relative abundances of molecular structures.
Concentrations and isotopic composition of C and N were measured with an elemental analyzer (EA3000, EuroVector, Pavia, Italy) coupled to an isotope ratio mass spectrometer (IRMS; Nu Horizon, NU Instruments, Wrexham, UK), using certified reference materials and working standards. All other elemental contents (P, K, Ca, Na, Mg) were measured on a wavelength dispersive X-ray fluorescence (WD-XRF) spectroscope calibrated with certified and custom reference standards (ZSX Primus II, Rigaku, Tokyo, Japan). To this end, 500 mg of ground, powdered samples was pressed to pellets with 13 mm diameter (without pelleting aids) at a load of approximately 7 t.
Mid-infrared spectra (MIRS) were measured on 13 mm diameter pellets pressed from a mixture of 2 mg of milled sample material and 200 mg of KBr (FTIR grade, Sigma Aldrich) on a transmission Fourier transformed infrared spectrometer (Cary 660 FTIR spectrometer, Agilent) in the range of 600 to 4000 cm−1 at a resolution of 2 cm−1 and by averaging 32 scans per spectrum. Prior to each measurement, the optical path was purged for 180 s with synthetic dry air. Spectra were background corrected by subtracting a KBr background and converted to absorbance.
In a next step, the spectra were exported to R version 4.2.0 (R Core Team, 2022), and the following preprocessing steps were applied using the ir package version 0.3.0 (Teickner, 2023): (1) baseline correction using a convex-hull-based algorithm in the hyperSpec package version 0.100.0 (Beleites and Sergo, 2021), (2) clipping of the first and last 5 cm−1 and a second baseline correction step to remove artifacts from the first baseline correction step, and (3) normalization (so that all intensity values of a spectrum sum to 1). These preprocessing steps are commonly applied heuristic procedures to reduce effects such as internal reflectance that are not directly related to the relative abundance of molecular structures in the sample.
The preprocessed MIRS were analyzed with the irpeat package version 0.2.0 (Teickner and Hodgkins, 2022) by computing the four humification indices defined in Broder et al. (2012): ratios of the intensities at 1420 (OH and CO of phenols, CH2 and CH3 groups, C–O–H in-plane bending), 1510 (C=C stretching of aromatics, N–H bending, and C–N stretching in proteins), 1630 (NH2 bending and C=O stretching in proteins, aromatic C=C and COO− stretching), and 1720 cm−1 (C=O stretching in carbonyls, carboxyls, esters) to the intensity at 1090 cm−1 (mainly attributed to C–O stretching of cellulose in the absence of silicates) (Broder et al., 2012; Parikh et al., 2014; Stuart, 2004).
2.5 Pool water chemistry
At each litterbag retrieval, we collected water samples from each pool. Samples were taken 20 cm below the surface at the center of the pools and analyzed for dissolved organic carbon (DOC), total nitrogen (TN), total phosphorus (TP), nitrate (NO3), ammonium (NH4), phosphate (PO4), pH, and absorbance (A254) to calculate specific UV absorbance at 254 nm (SUVA254) and estimate DOC aromaticity (Weishaar et al., 2003). During the summer of 2021, we measured methane (CH4) and carbon dioxide (CO2) fluxes in each of the six pools using a Li-Cor 8200-01S Smart Chamber coupled to a Li-Cor LI-7810 analyzer. At the same time, we measured pool dissolved CH4, CO2, and N2O concentrations using the headspace technique. Dissolved gas samples were analyzed in the lab on a Shimadzu GC-14 gas chromatograph, and concentrations in the pools were obtained using Henry's law for the headspace concentrations. Barometric pressure, wind speed, and air temperature were measured in situ using a Kestrel 4000 weather meter. Pool water temperature was measured with a DO200A YSI probe. Laboratory analyses were performed as described in Arsenault et al. (2018).
2.6 Statistical analyses
We first determined the differences and similarities in pool morphometry and water chemistry among the six studied pools using Kruskal–Wallis rank and Dunn post hoc tests for non-normally distributed variables. We measured pool depth and water chemistry at all retrievals, and we used the average to compare the pools. We did not compare pools with regard to variables for which we only had one sampling time (e.g. area; dissolved CH4, CO2, and N2O concentrations; and CH4 and CO2 fluxes).
To determine litterbag decomposition over time, we calculated decay rates (k value) by computing a single-exponential linear regression model (ln[y] = a−kt) based on the average percentage of mass remaining (y) of triplicates of litter at each retrieving time, where a is the intercept, k is the decay constant, and t is the time in years (Trofymow et al., 2002). After testing for homogeneity in variances, we used two-way ANOVAs to compare k among pool, depth, and litter types and to account for the possible interacting effects of pool characteristics (i.e. morphology and chemistry) and depth of incubation on decomposition. To determine the effect of water chemistry on decomposition rates, we used generalized linear models (GLMs) with a gamma distribution and log-link function of the percentage of mass remaining in the bags at the surface and at the bottom of the pools at each retrieving time with water chemistry measured at the same time. We also used GLMs (gamma distribution, log-link function) and Spearman's rank correlations for non-normally distributed variables to quantify the relationship of k and depth of incubation and to assess the influence of k on final litter material chemistry.
We used Kruskal–Wallis rank and Dunn post hoc tests for non-normally distributed variables to compare differences in CO2 and CH4 production and sediment chemical properties among pools and between the treed and open areas of the peatland. We also used Spearman's rank correlations and a principal component analysis (PCA) to explore the relationships between CO2 and CH4 total production and sediment chemistry.
All statistical analyses were performed on R, version 4.1.2 (R Core Team, 2022).
3.1 Decomposability of standard litter in natural conditions
3.1.1 Effects of litterbag position on decomposition rates
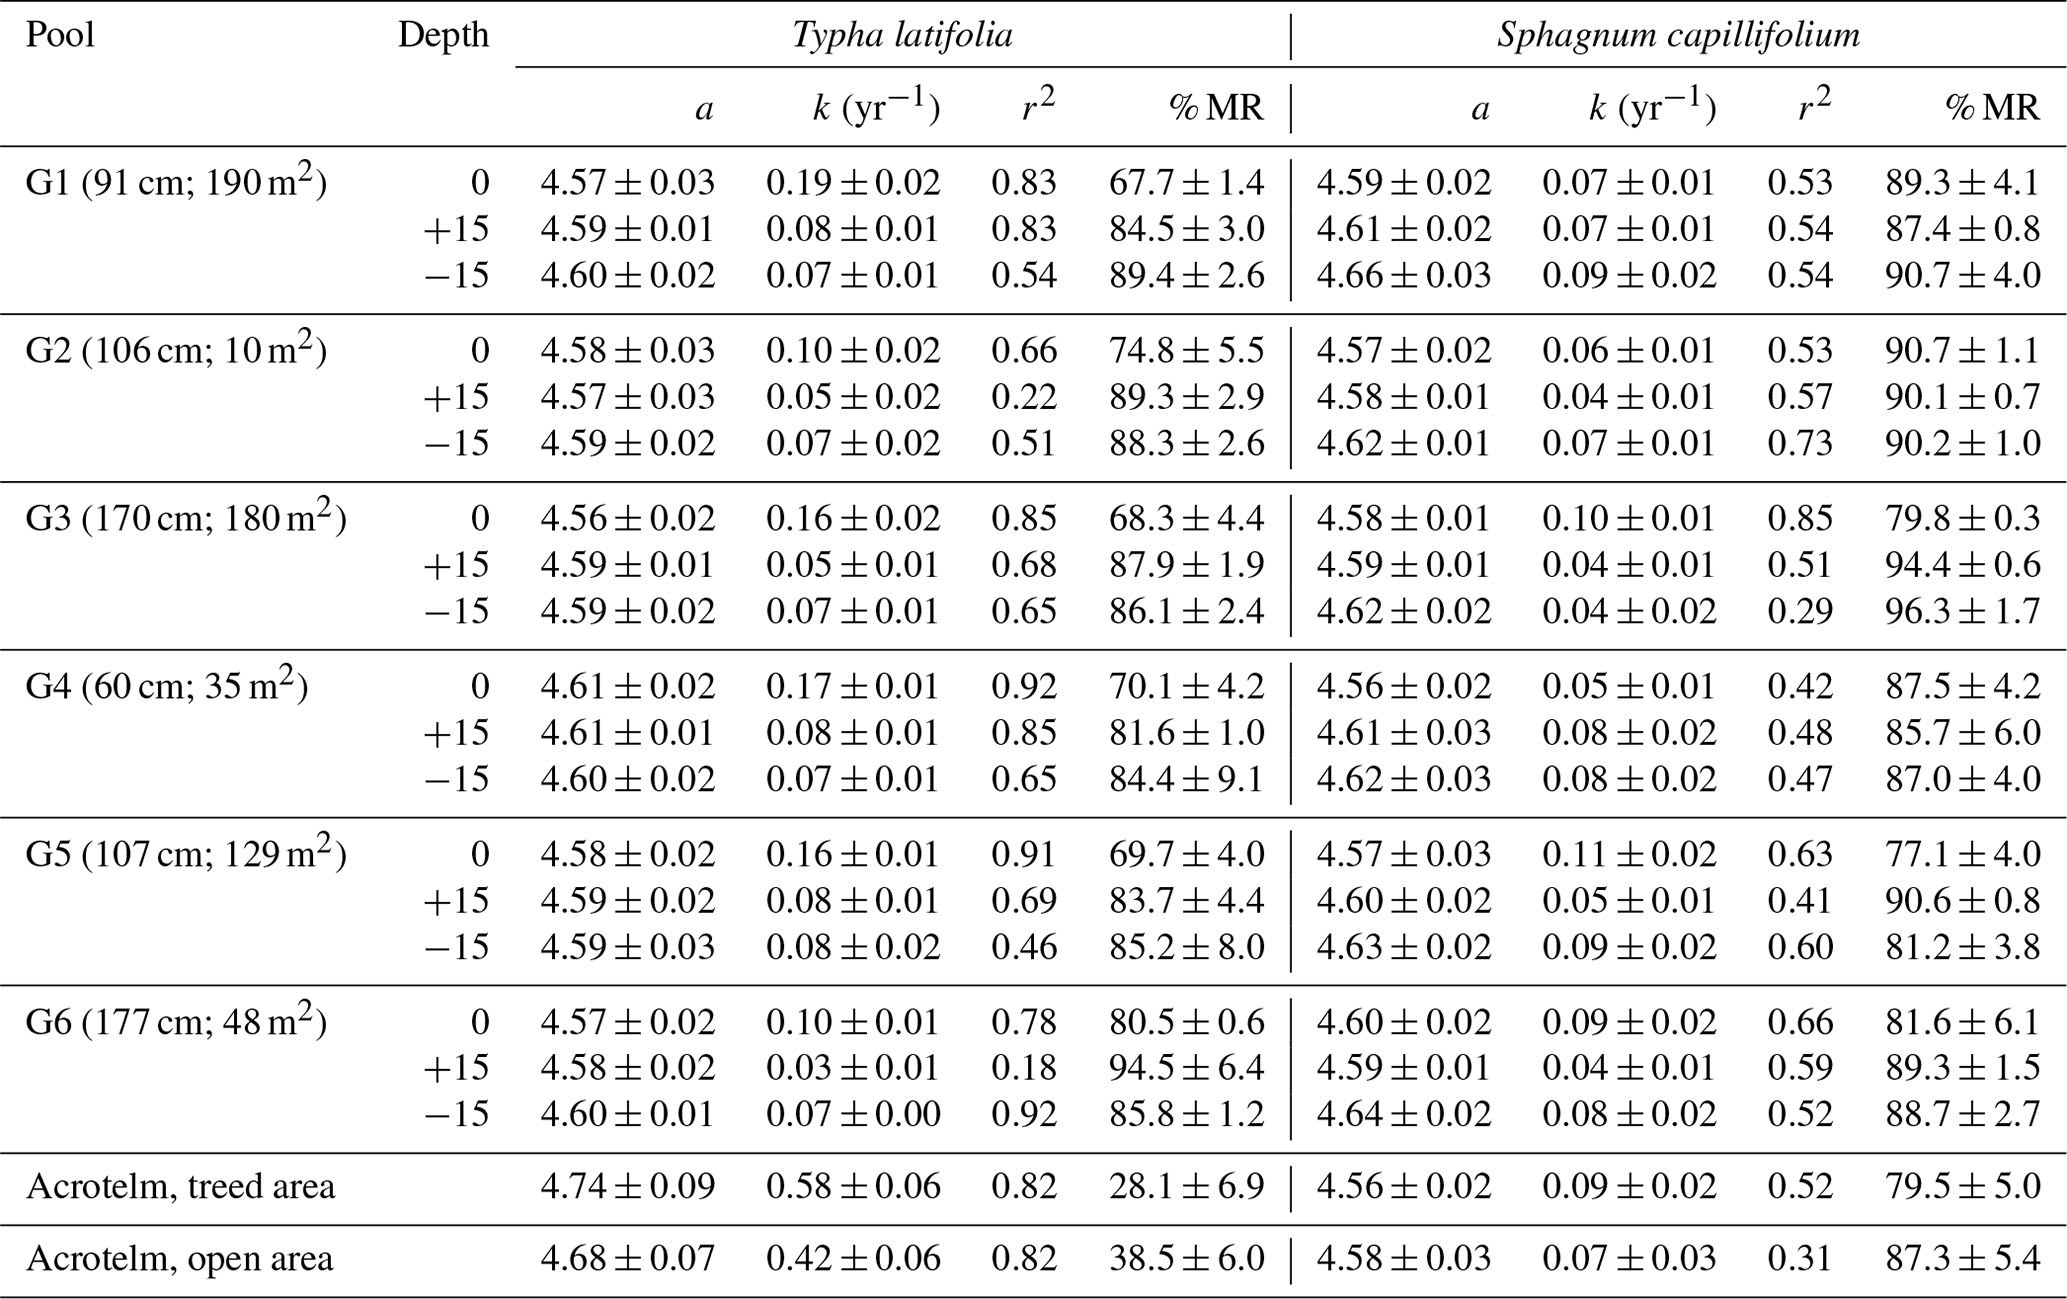
After 27 months in the pools, T. latifolia was more degraded than S. capillifolium, and decomposition rates were faster at the surface of the pools than at depth (Table 1). In particular, decomposition rate constants derived from single-exponential linear regression models for T. latifolia ranged from 0.10 to 0.19 yr−1 at the surface of the pools and from 0.03 to 0.08 yr−1 at depth (Table 1). For S. capillifolium, decomposition rate constants ranged from 0.05 to 0.11 yr−1 at the surface of the pools and from 0.04 to 0.09 yr−1 at depth (Table 1). In the surface layer of the soil surrounding the pools (10 cm under the surface), T. latifolia had decomposition rate constants of 0.56 yr−1 in the treed area and 0.39 yr−1 in the open area, while S. capillifolium had decomposition rate constants of 0.09 to 0.07 yr−1 respectively (Table 1).
Two-way ANOVAs showed no evidence of differences in decomposition rate constants among pools (P=0.524) or interacting effects of pools and depth on decomposition (P=0.965) (Table S1). In all pools, there was strong evidence that decomposition rates for T. latifolia were faster at the surface than at the bottom of the pools and in the sediments (Fig. 2; Table 1, P < 0.011), but there was no evidence of differences in decomposition rates between the bottom of the pools and in the sediments (P=0.978) (Table S2). There was little difference in decomposition rates for S. capillifolium between the different depths (P=0.1) (Tables 1, S3). Overall, T. latifolia had faster decomposition rates than S. capillifolium at the surface (P < 0.001) but not at depth (P=0.248) (Tables 1, S4). Decomposition rates also seemed faster in the surface layer of the peat than at any depth in the pools for T. latifolia (Table 1; P < 0.001) but were similar in all locations for S. capillifolium (Table 1; P > 0.1). These results suggest that both environmental conditions and litter chemistry are important drivers of OM decomposition in peatland pools.
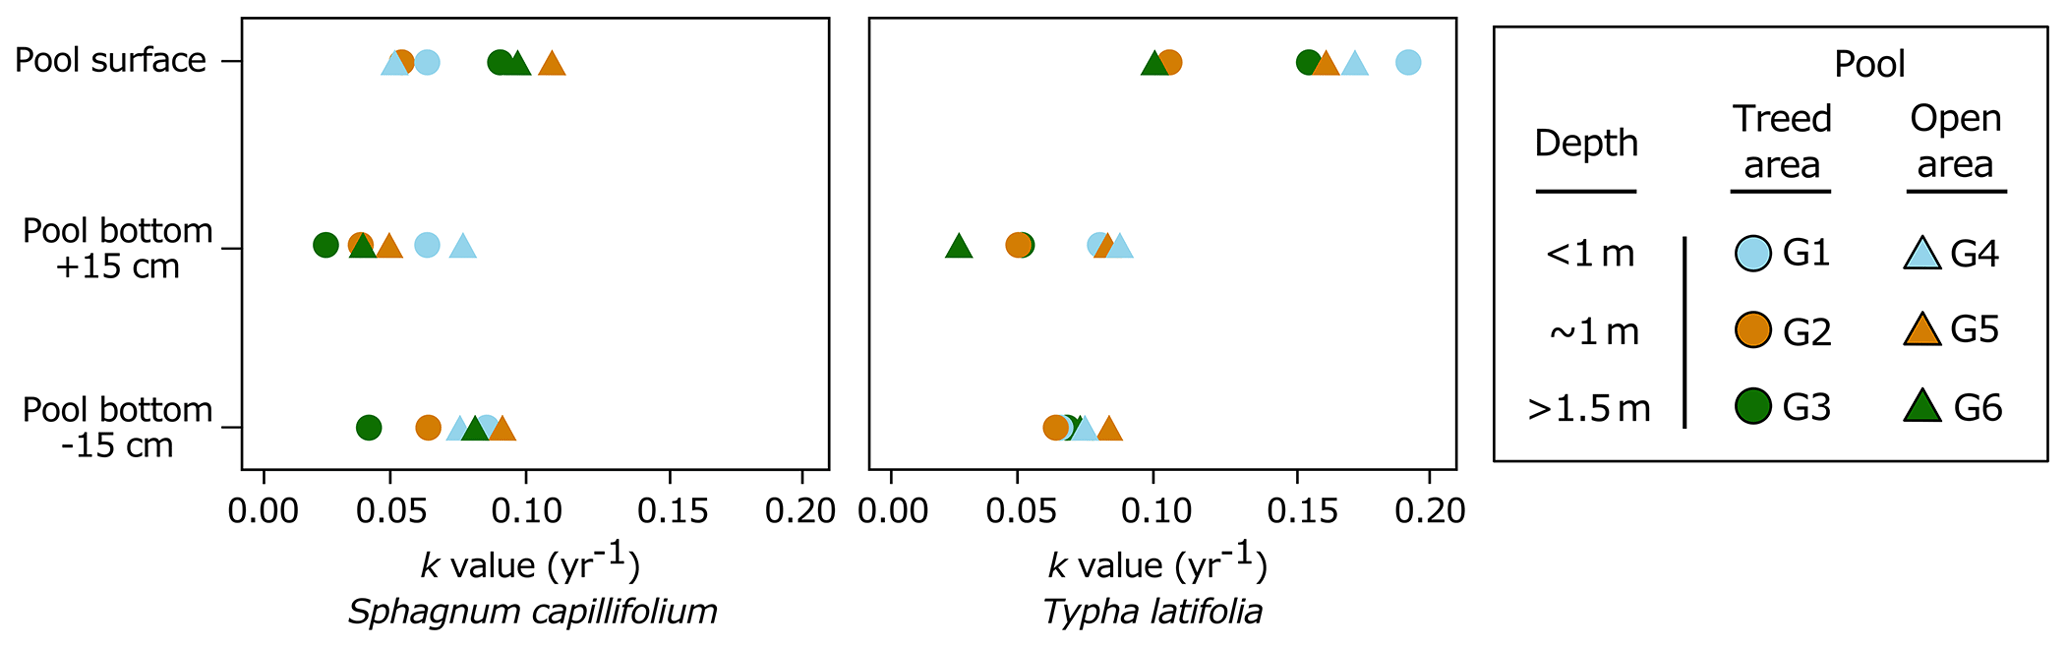
Figure 2Decomposition rate constants (yr−1) of Sphagnum capillifolium and Typha latifolia along the pool depth profiles in both treed and open areas of the peatland after 27 months of incubation.
Table 1Single-exponential linear regression models and percentage of the remaining mass (± standard deviation) of Typha latifolia and Sphagnum capillifolium litterbags after 27 months of incubation in six pools of different morphometries (depth at the center and surface area shown) and in the unsaturated, surficial layer of the surrounding peat. Litterbags were incubated at the surface of the pools (depth of 0), 15 cm above the pool bottoms in the center of the pools (depth of +15), and 15 cm below the pools in the sediments (depth of −15). In the peat, litterbags were installed ∼ 5 cm under the surface. The single-exponential linear regression model (ln[y] = a−kt) was based on the percentage of mass remaining (y), where a is the intercept, k is the decay rate constant, and t is the time in years. The percentage of original mass remaining in the litterbags after 27 months is denoted as % MR. Standard errors (± SEs) are shown for parameters a, k, and % MR.
3.1.2 Effects of incubation depth on litter chemistry
Distinctive patterns in overall litter chemistry appeared after 27 months of incubation. At the end of the experiment, there was no detectable change in C concentration at any position of incubation for both litter types, with an overall final C concentration of 106 ± 1 % and 98 ± 3 % for the initial material of T. latifolia and S. capillifolium respectively. However, for T. latifolia, there was generally a net relative gain of both N and P compared to C, with respective final concentrations of 334 ± 78 % and 192 ± 41 % for the initial material. The highest N concentration increase was measured at the surface of the pools (416 ± 64 % N for the initial concentration vs. 303 ± 61 % at the bottom and 284 ± 23 % in the sediments), but there were little variations among the depths of incubation for P (191 ± 31 % for the initial concentration at the surface, 190 ± 65 % at the bottom, 195 ± 25 % in the sediments). For S. capillifolium, there were large variations in N and P, with respective final concentrations of 102 ± 22 % and 65 ± 12 % for the initial material, primarily indicative of P loss over time. Final N and P concentrations were generally higher at the surface of the pools (119 ± 20 % N and 70 ± 16 % P for the initial material), followed by the bottom (95 ± 16 % N and 63 ± 9 % P) and the sediments (91 ± 8 % N and 60 ± 7 %). In all six pools, Spearman's correlations showed that (ρ=0.50, P=0.002) and (, P < 0.001) ratios in both T. latifolia and S. capillifolium respectively increased and decreased with depth of incubation (Fig. 3).
We measured changes in litter isotopic signatures in relation to the position of the litterbags in the pools, with values of δ13C for S. capillifolium increasing slightly at depth, from −27.5 ‰ at the surface to −27.3 ‰ at the bottoms of the pools and in the sediments. For T. latifolia, δ13C also increased slightly at depth from −27.0 ‰ at the surface to −26.6 ‰ at the bottoms of the pools and to −26.7 ‰ in the sediments. Changes in δ15N followed the same trends for both litter types, with decreasing values from the surface > to the bottom of the pools > sediments (0.45 ‰ > −1.10 ‰ > −2.59 ‰ and −5.97 ‰ > −7.72 ‰ > −7.90 ‰ for T. latifolia and S. capillifolium respectively).
For both litter types, there was no variation in humification indices (HIs) among the positions of the incubations, and all HIs increased over time, except for the ratio (C=O stretching in carbonyls, carboxyls, and esters relative to C–O stretching of cellulose) of S. capillifolium, which decreased from 0.51 in the initial material to 0.47 on average at the end of the experiment (Fig. S1). Compared to the initial material, HIs (C=C stretching of aromatics, N–H bending, and C–N stretching in proteins relative to C–O stretching of cellulose) and (NH2 bending and C=O stretching in proteins, aromatic C=C and COO− stretching relative to C–O stretching of cellulose) were higher for both S. capillifolium and T. latifolia after 27 months in the pools. There was also an increase in HI over time for S. capillifolium but a decrease for T. latifolia.
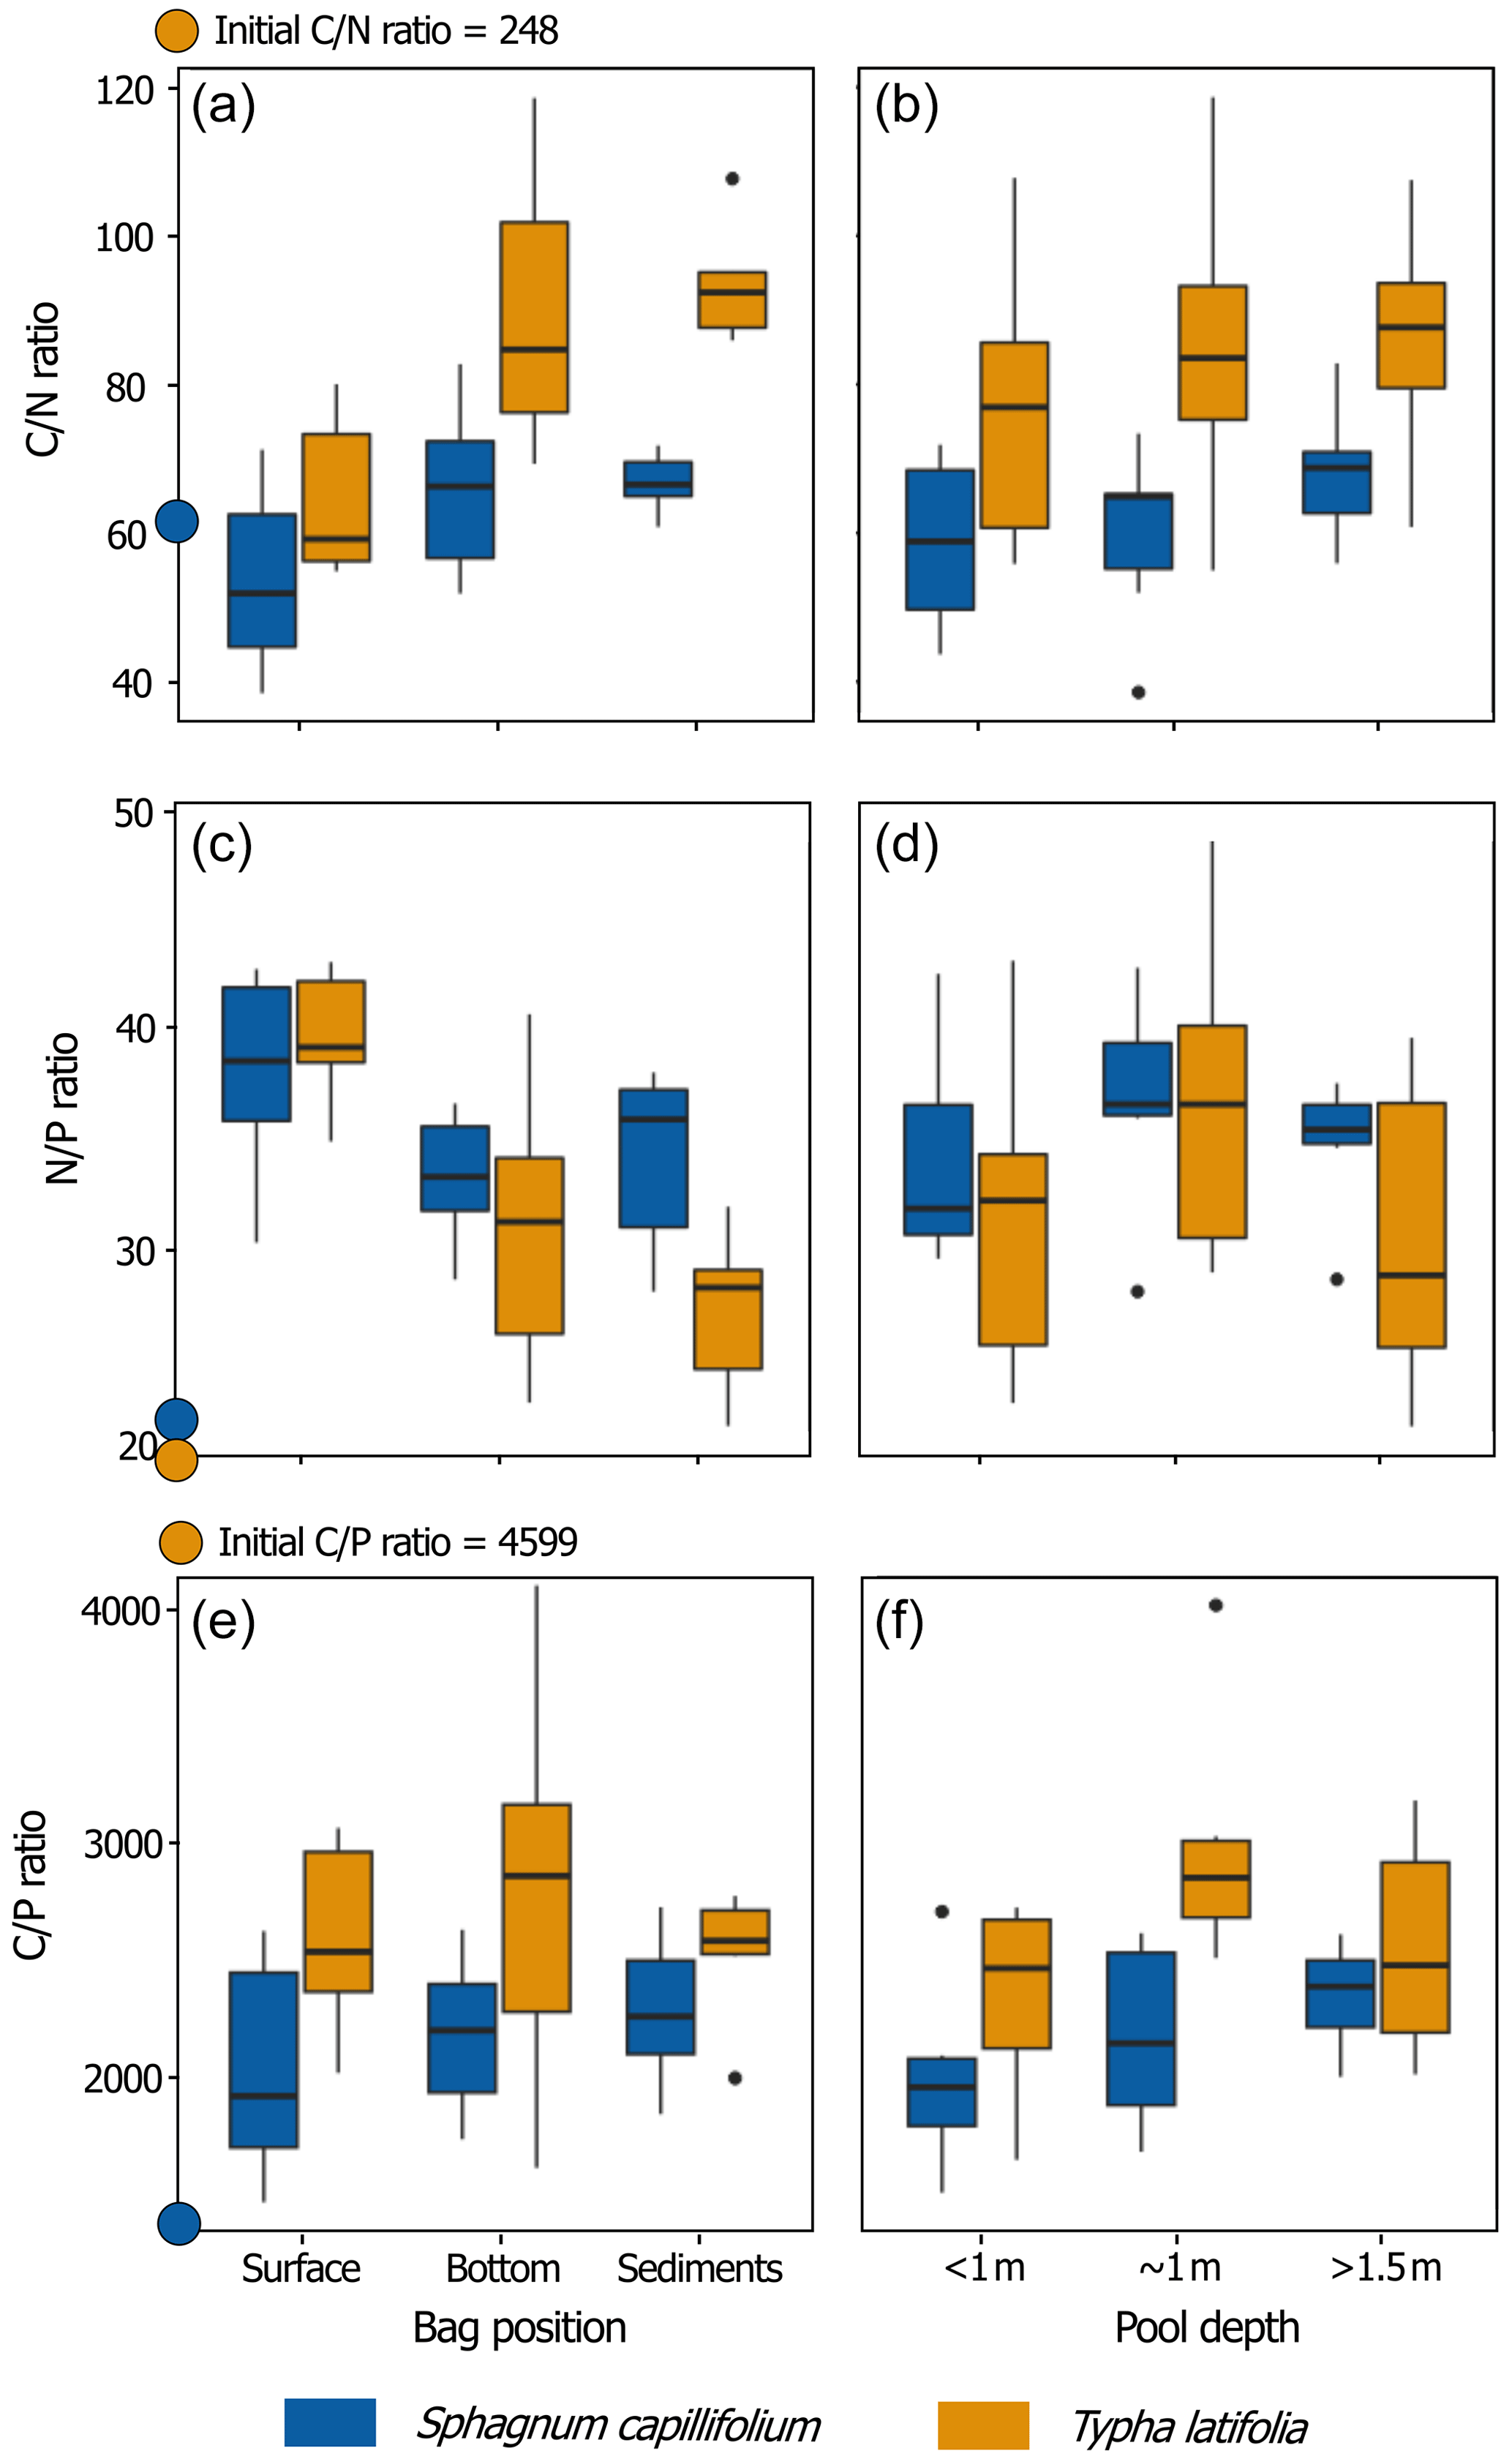
Figure 3Sphagnum capillifolium (blue) and Typha latifolia (orange) ratios after 27 months in relation to the positions of incubation in the pools (surface, at the bottom, in the sediments, and all pools together) and pool depth category (< 1, ∼ 1, and > 1.5 m, regardless of the position of incubation within the pool and area of the peatland). Each box shows the median and the 25th and 75th percentiles of the distributions of six samples (n = 6), and the whiskers show the 10th and 90th percentiles. The coloured dots on the y axes of the graphs show the initial chemistry of the litter.
3.1.3 Relationships between litter chemistry and decomposition rates
There were strong relationships between decomposition rates and litter chemistry for T. latifolia, as shown by the GLMs of decomposition rates and δ13C, δ15N, and and ratios, (Fig. 4b–e; Table S5). There were also strong interactions between T. latifolia decomposition rates and humification indices ( and ), showing increasing proportions of aromatics and proteins relative to carbohydrates with increasing decomposition rates (Fig. 4f–i). There was however no discernible relationship between decomposition rates and OM chemistry for S. capillifolium.
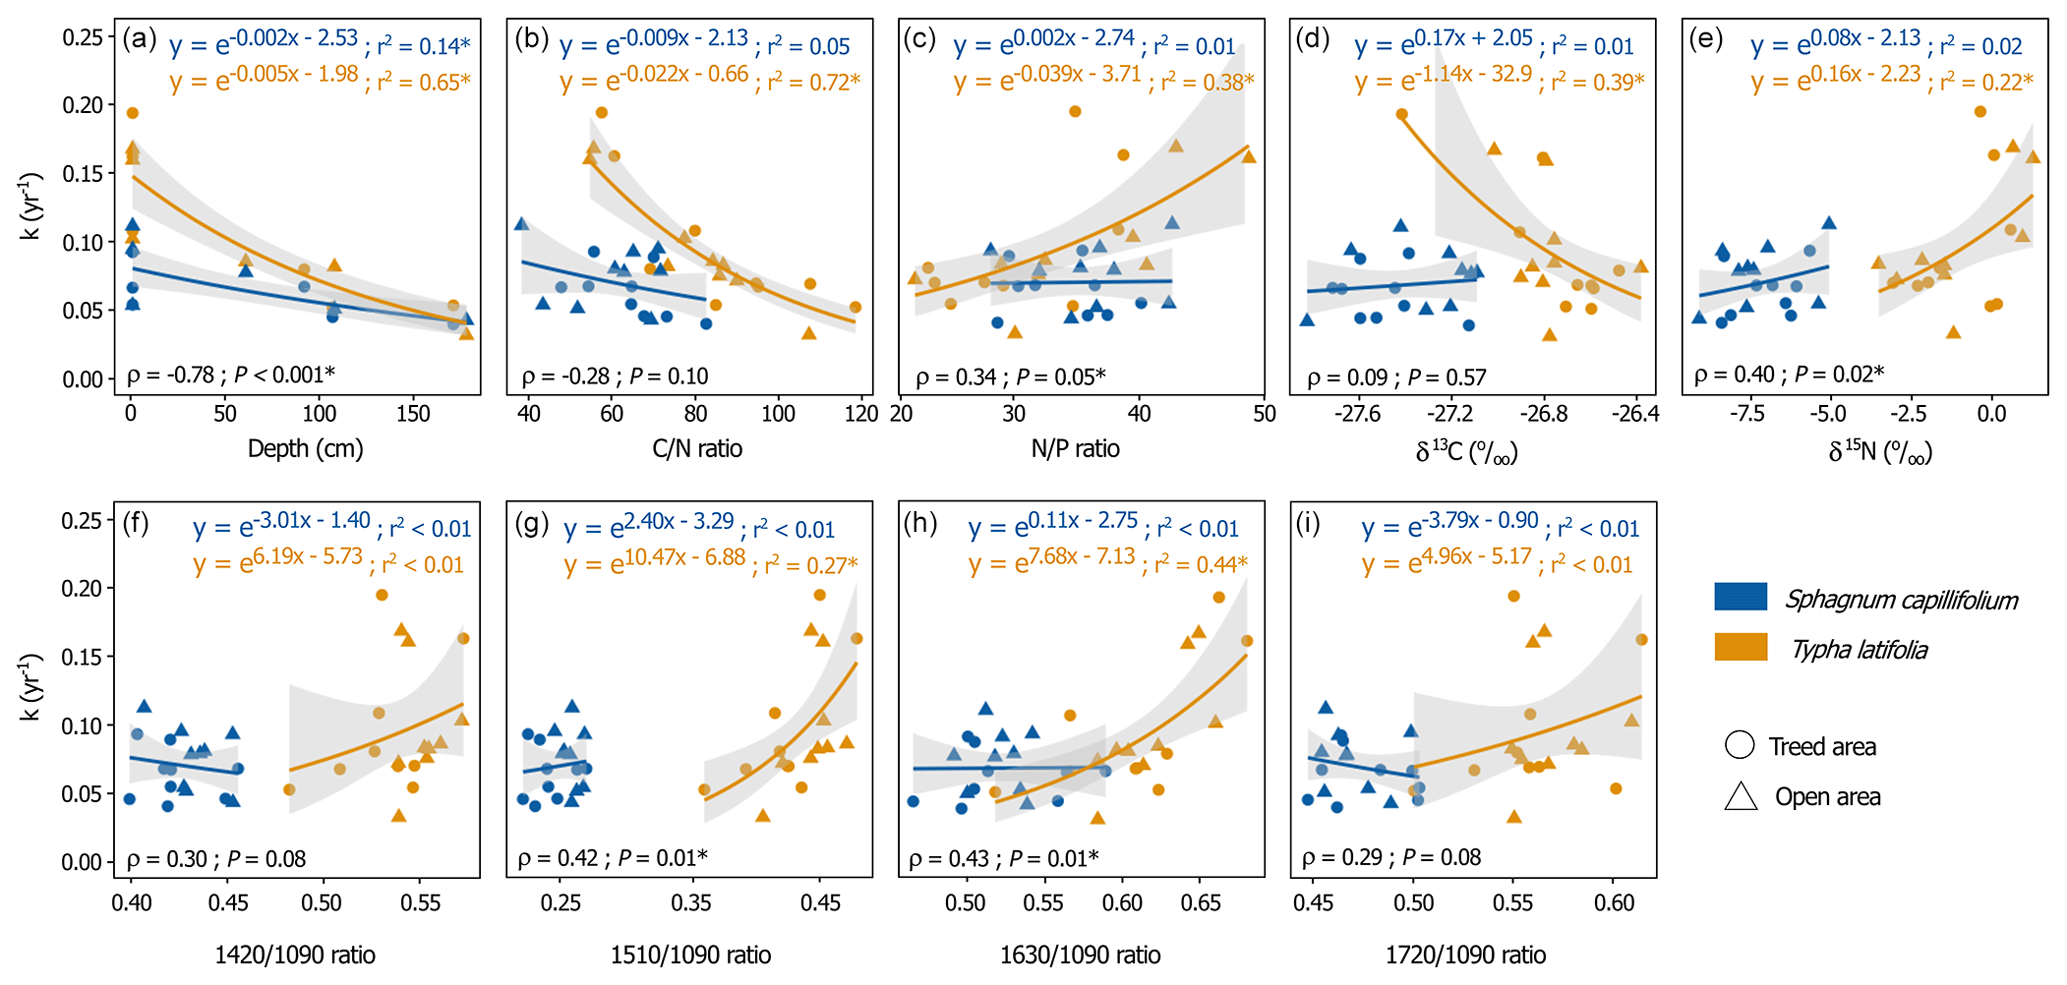
Figure 4Average decomposition rates (k) and 95 % confidence intervals for Sphagnum capillifolium and Typha latifolia in relation to (a) the depth of incubation in the pools and final litter chemistry (after 27 months of incubation in the pools): (b) ratio; (c) ratio; (d) δ13C (‰); (e) δ15N(‰); and humification index ratios of MIRS intensities at (f) 1420, (g) 1510, (h) 1630, and (i) 1720 cm−1 to the intensity at 1090 cm−1. In (a), bags that were incubated in the pool sediments are not shown. Colours (blue and orange) and shapes (circles and triangle) respectively represent litter type and the peatland area in which the litter was incubated (treed or open area). Generalized linear models for individual litter types using gamma distribution (log-link function), model r2, and Spearman's correlation (ρ) and p values (P) of the relationships of k values to the identified properties, regardless of litter type, are shown. Models and correlations with p values < 0.05 are indicated with an asterisk (*).
Regardless of litter type, there were correlations between decomposition rates and residual (i.e. after 27 months) litter chemistry (Fig. 4b–i). Decomposition rates were indeed negatively correlated to the ratio (ρ = −0.28, P=0.1) and positively correlated to the ratio (ρ=0.34, P=0.05) and δ15N (ρ= 0.40, P= 0.02). Similarly, litter humification indices were all positively correlated to decomposition rates: (ρ= 0.30, P= 0.08), (ρ= 0.42, P= 0.01), (ρ= 0.43, P= 0.01), and (ρ= 0.29, P= 0.08). Regardless of environmental conditions, these results suggest close relationships between litter chemistry and decomposition rates.
3.1.4 Effects of pool morphology and chemistry on litter decomposition
The six pools we selected had different physical and chemical characteristics. Pools located in the treed area generally had higher DOC concentration (P= 0.007), higher SUVA (P= 0.044), and lower pH (P= 0.002) than pools of the open area (Table 2), although tests showed little evidence of differences in pool depth between both areas (Kruskal–Wallis; P= 0.967). Regardless of the differences in vegetation assemblages surrounding the pools, deep pools (> 1.5 m) had lower TN (P= 0.002), TP (P= 0.009), and NO3 (P= 0.015) concentrations than shallow (< 1 m) and average (∼ 1 m) pools, which had similar chemistry (Table 2). Individually, pools also had different chemical characteristics. For example, pool G2 had higher DOC and TP concentrations than any other pool throughout the study (Table 2). However, GLMs showed few relationships between water chemistry and litter mass loss (Table S6), indicating that mass losses mostly vary depending on litter type and the position in the pool (Fig. 2).
3.2 Decomposability of pool sediments under controlled conditions
3.2.1 Spatial variations in sediment chemistry and CO2 and CH4 production
There were large differences in sediment chemistry among pools and between areas of the peatland (Table 3). For example, P concentrations of pool sediments were higher in pools of the open area of the peatland,, while the lowest and highest N concentrations were recorded in the shallowest pools of the treed and open area respectively. There were also large variations in δ13C and humification indices among pools.
After 35 d of incubation, mean total production for CO2 and CH4 ranged between 1393 and 2449 µg CO2 g C−1 and −0.6 and 123 µg CH4 g C−1 respectively (Table 3). The highest total CO2 production and CH4 production were from ∼ 1 m deep pools from both the treed and the open areas, while shallow and deep pools had similar production. There was however little evidence of differences in CO2 (Kruskal–Wallis; P= 0.35) and CH4 (Kruskal–Wallis; P= 0.44) production between pools of the treed and open areas. Production rates of CO2 were usually the highest in the first week of incubation and decreased afterward (Fig. 5c). For all pools, rates varied over time and between pools but were generally similar among replicates. For CH4, total production and production rates were close to zero in the first days of incubation but generally increased from day 5 to day 35, possibly indicating the development of anaerobic conditions in the jars past the first week that would not be counterbalanced by the addition of ambient air after subsampling (Fig. 5c–d). There was no significant correlation between CO2 and CH4 production rates (ρ= 0.04, P= 0.75).
Table 2Mean values (± standard deviation) of pool water physical and chemical variables measured at the beginning and at the end of the 2019, 2020, and 2021 growing seasons. The letters in the indices show the levels of difference in water chemistry between individual pools for variables measured at each sampling time as determined by Kruskal–Wallis and Dunn post hoc tests at P < 0.05.
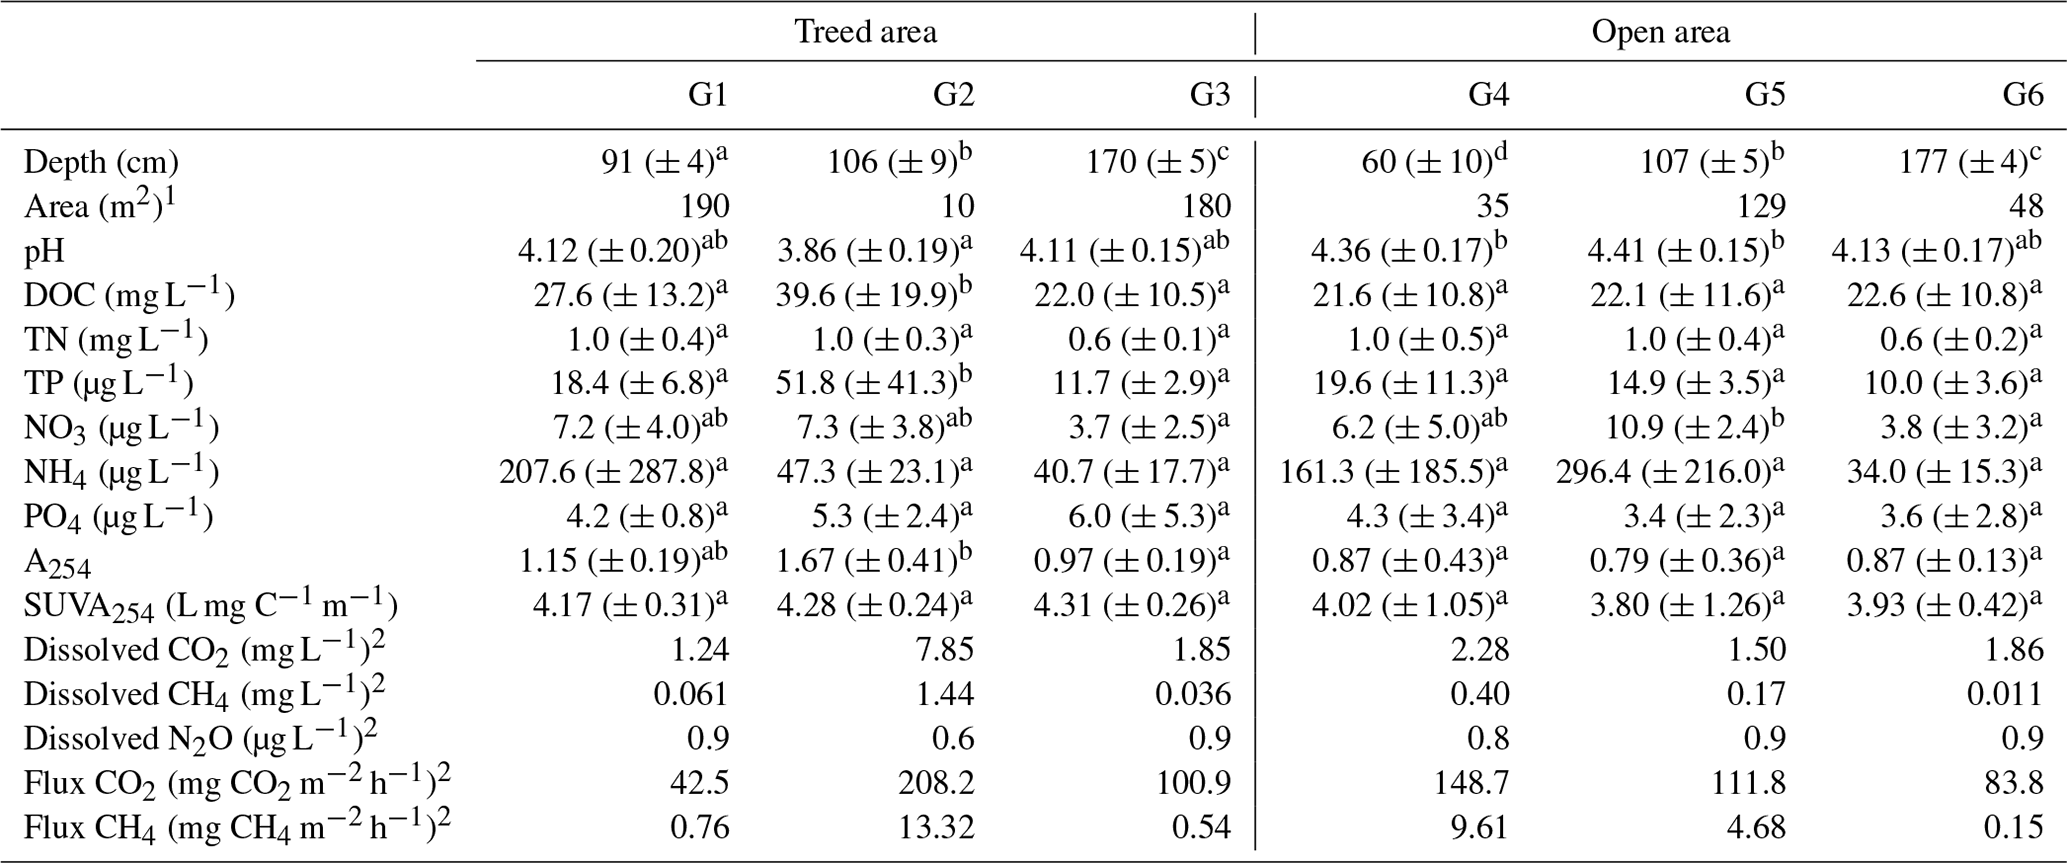
1 Pool area was measured once using a 2020 0.12 m × 0.12 m resolution satellite photo. 2 GHG dissolved concentrations and fluxes were only measured at the end of the 2021 growing season.
3.2.2 Effects of sediment chemistry on CO2 and CH4 production
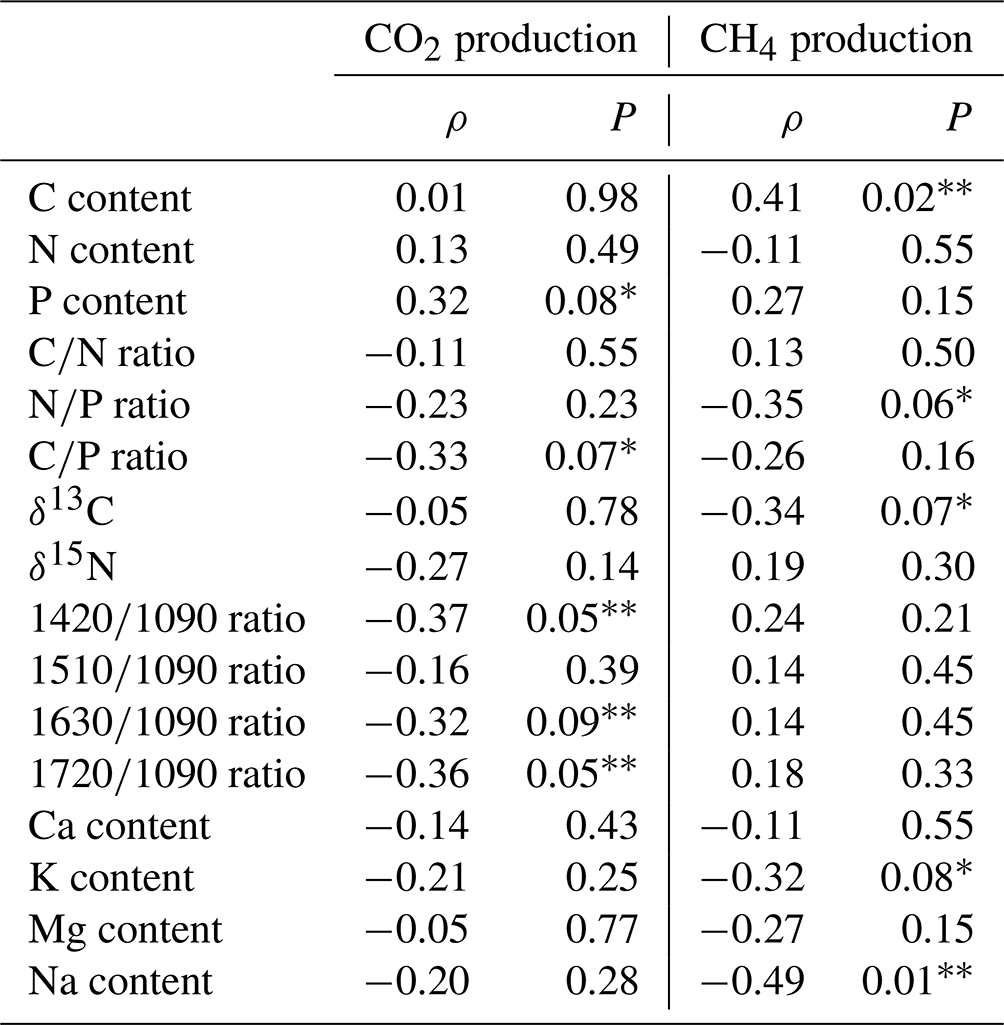
Production of CO2 and CH4 varied between pools and replicates in relation to different sediment chemical properties. For example, both CO2 and CH4 production tended to be higher for sediments with high P content (Fig. 6; Table 4). Humification indices were also negatively correlated to CO2 production ( ratio, ρ= −0.37, P= 0.05; ratio, ρ= −0.31, P= 0.09; ratio, ρ = −0.36, P= 0.05) but had no effect on CH4 (P > 0.1) (Fig. 6; Table 4). For CH4, the sediment C content (ρ= 0.41, P= 0.02), δ13C (ρ= −0.34, P= 0.07), and ratio (ρ= −0.35, P= 0.06) had an influence on production (Table 4). Content in Na and K was also negatively correlated to CH4 production but not to CO2 production (Table 4).
Table 3Mean total production for CO2 and CH4 and chemical properties of pool sediments (± standard deviation, n = 5 replicates per pool) after 35 d incubations. For gas production, negative values are considered consumption. The letters in the indices show the levels of difference between individual pools as determined by Kruskal–Wallis and Dunn post hoc tests at p values < 0.05.
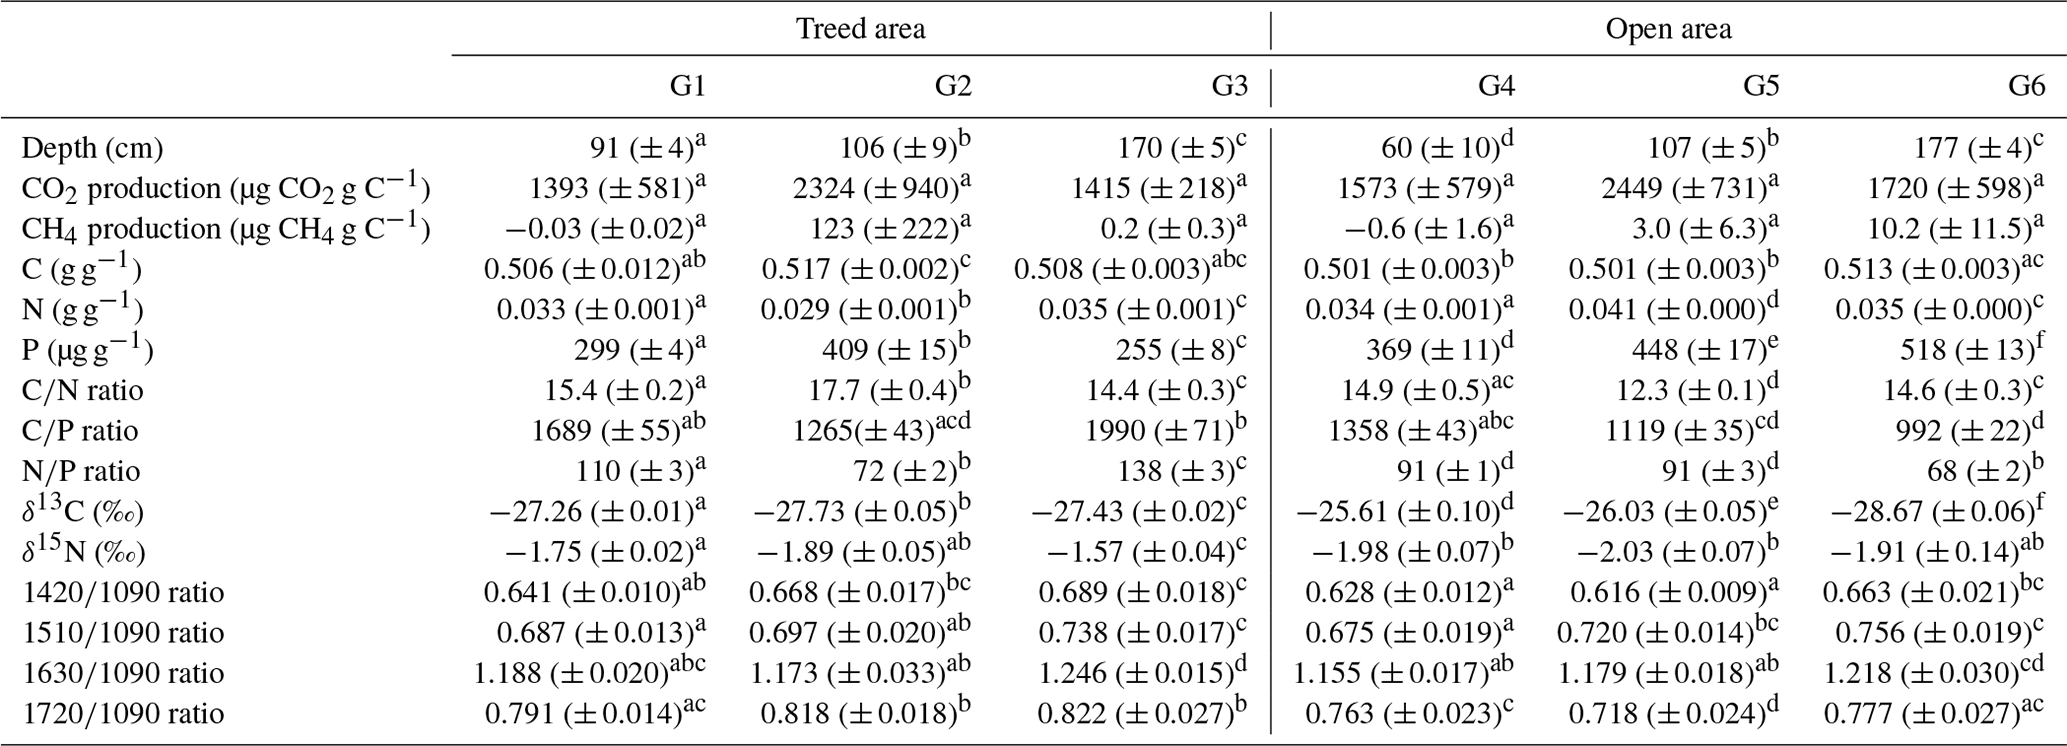
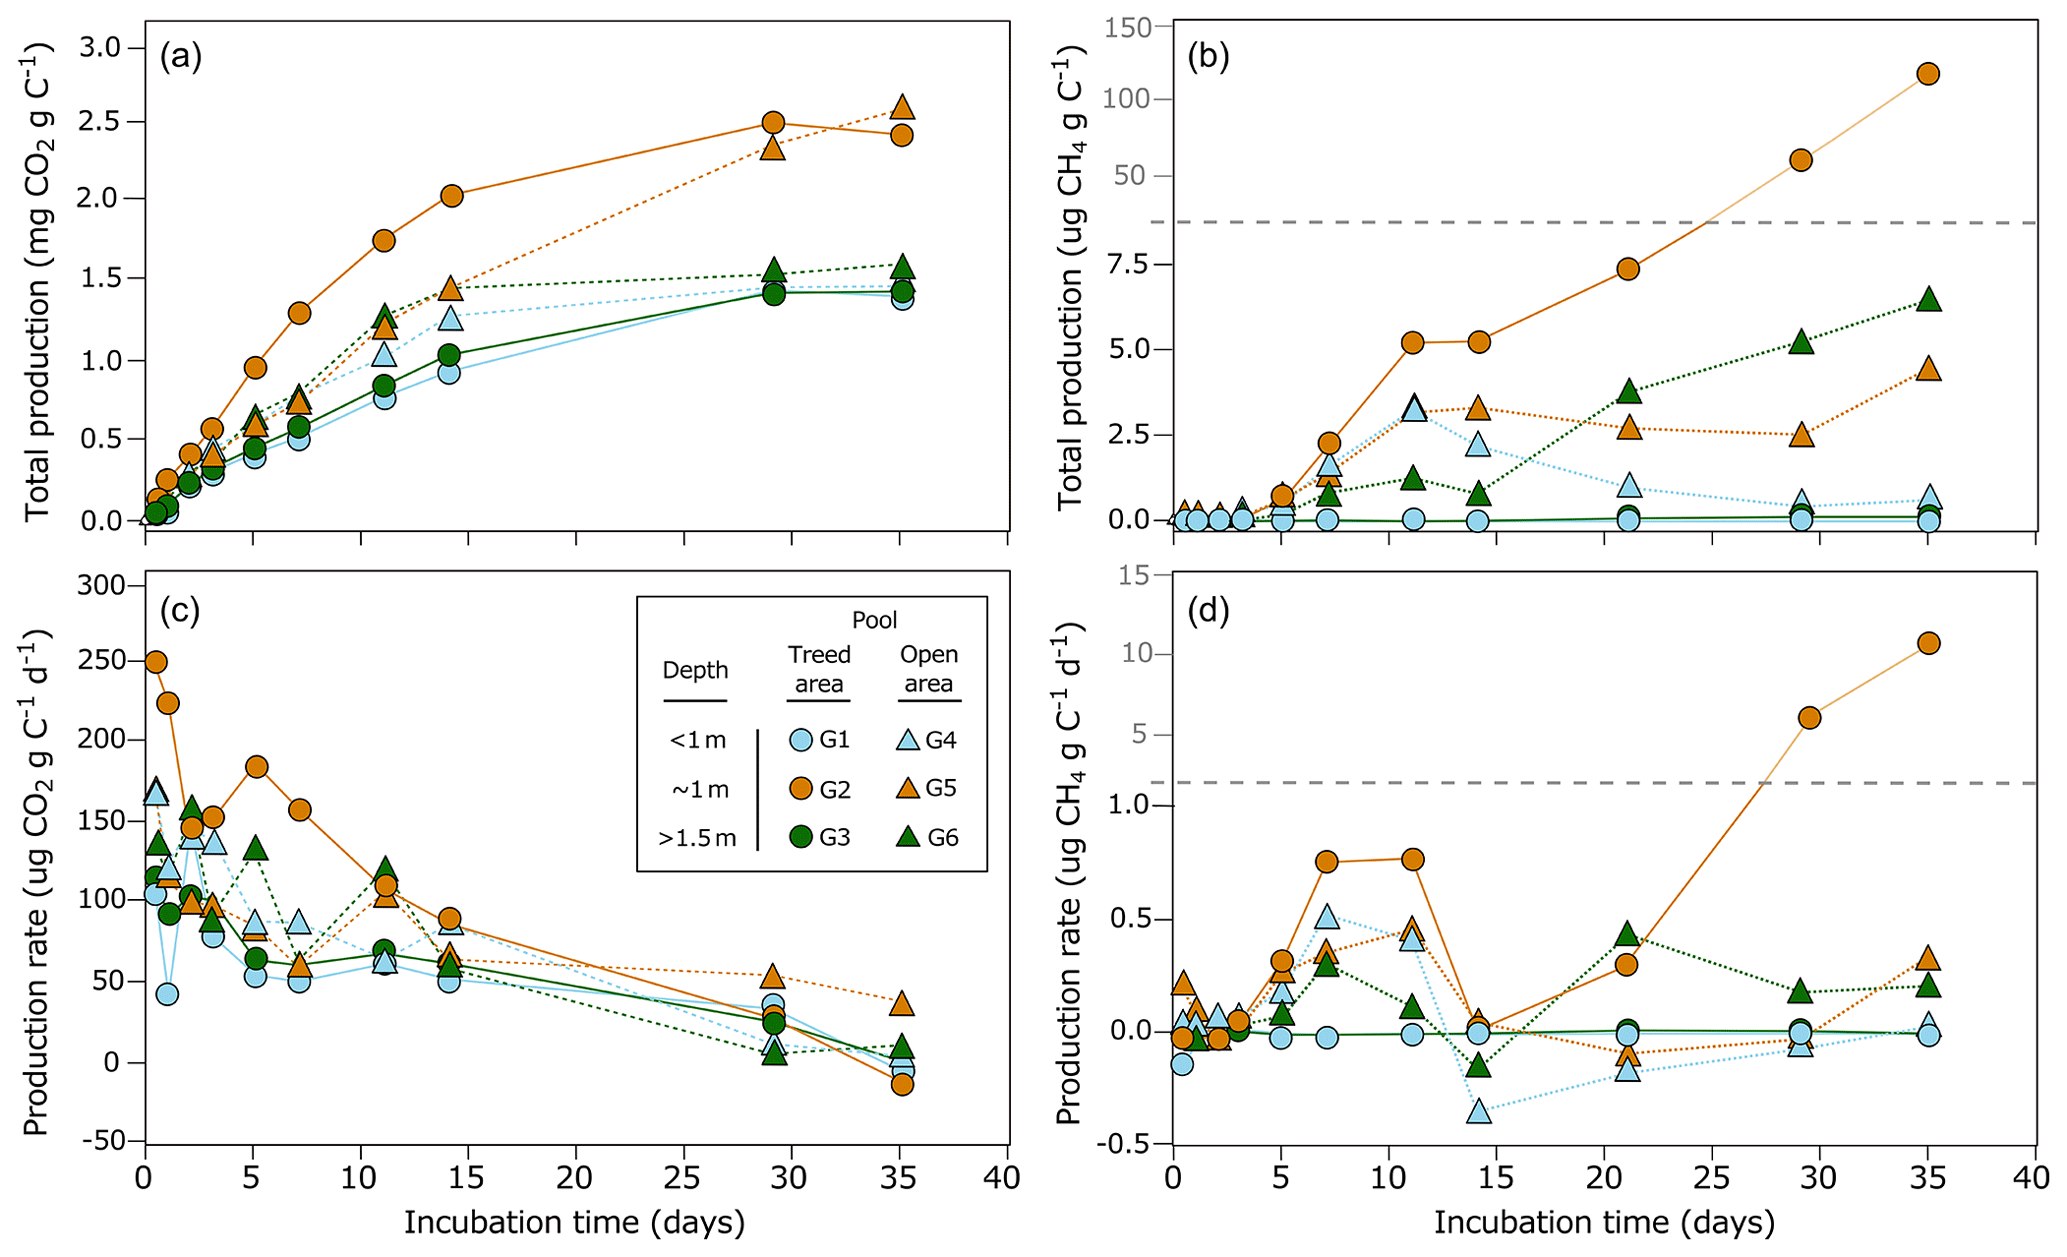
Figure 5(a) Total CO2 and (b) total CH4 produced from the incubation of the first 30 cm of bottom material (including limnic material and the underlying peat) of the six studied pools (G1 to G6) over the 35 d period. (c) Potential production rates for CO2 (µg CO2 g peat−1 d−1) and (d) CH4 (µg CH4 g peat−1 d−1) for each pool sediment. Dots are average values of five replicates.
3.3 Comparing OM decomposition rates from fresh litter and pool sediments
Spatial patterns emerged, and pools of different morphologies and locations clustered differently when comparing fresh OM decomposition rates at the bottom of each pool and CO2 and CH4 production from pool sediments (Fig. 7). CO2 (P= 0.43) and CH4 (P= 0.35) production rates were not significantly different between the shallowest and deepest pools, but decomposition rates of S. capillifolium and T. latifolia were (P= 0.03). Opposingly, CO2 production was higher in sediments from pools that were ∼ 1 m deep than in other pools (P= 0.01), but decomposition rates of fresh litter were not significantly different (P= 0.20). Therefore, when comparing all pairs of variables (k vs. CO2 and k vs. CH4, regardless of pool morphology and location), there seemed to be little relationship between CO2 and CH4 production rates from pool sediments and litter decomposition rates.
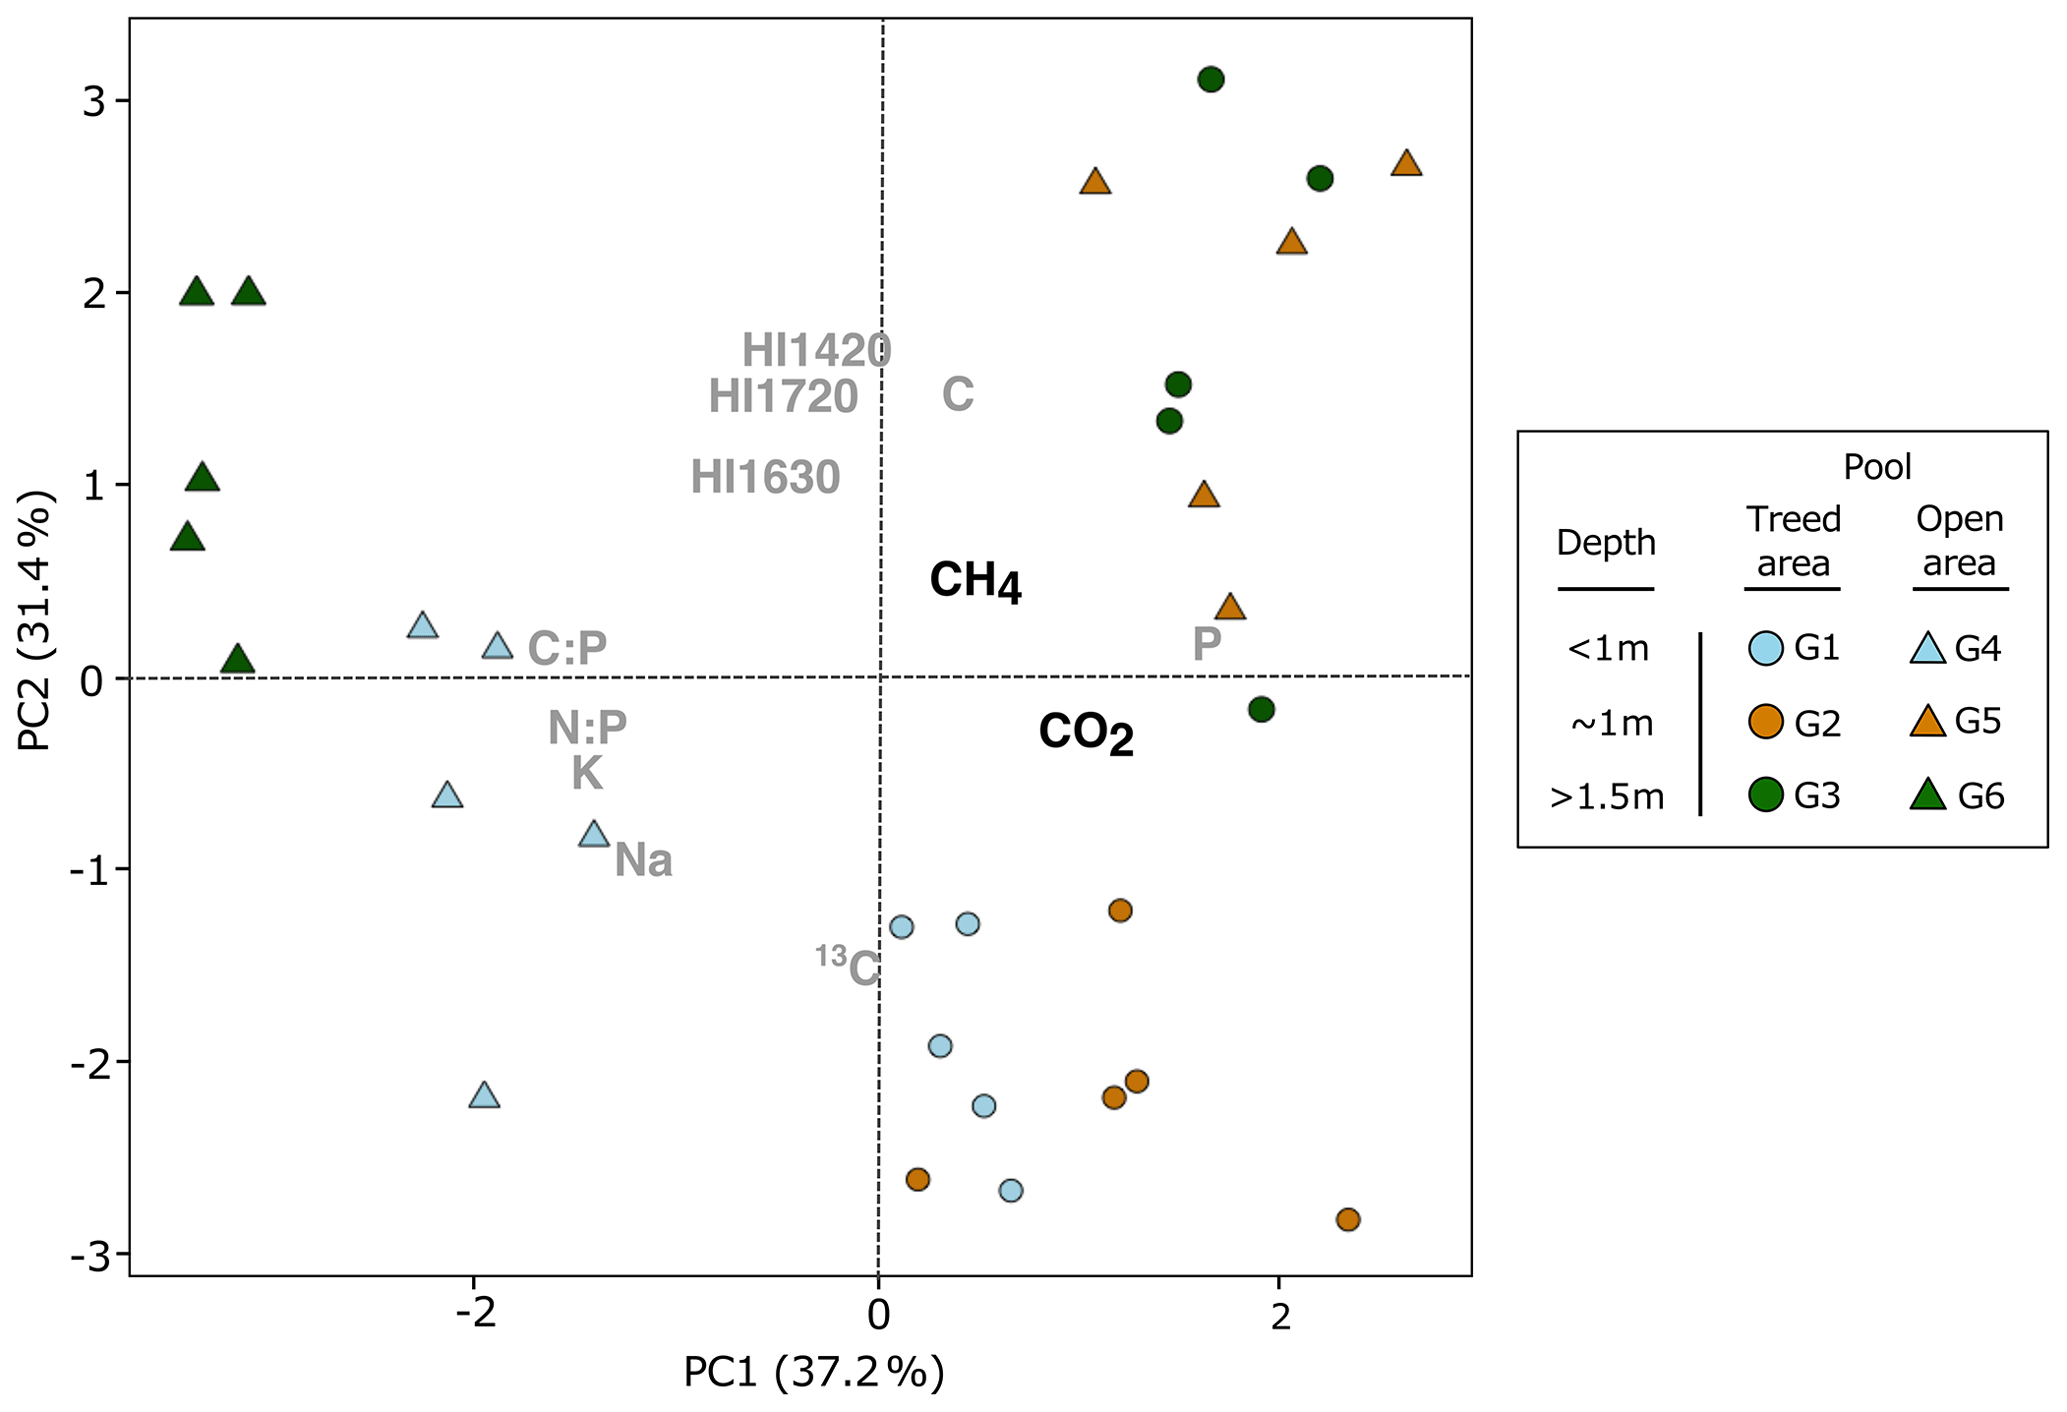
Figure 6Principal component analysis of pool sediment chemistry and carbon dioxide (CO2) and methane (CH4) total production after 35 d of incubation. Only chemical variables that were correlated to CO2 and CH4 total production were included in the analysis (Table 4; P < 0.1).
Table 4Spearman's rank correlation coefficient (ρ) of CO2 and CH4 total production and sediment chemical properties. Asterisks show correlations with p values (P) < 0.05 () or < 0.1 (*).
4.1 Decomposability of fresh OM in peatland pools
Our findings provide evidence of environmental and chemical controls on OM degradability in the water and sediments of peatland pools. In particular, our results show variations in decomposition rates of standardized litter among pools, among depths of incubation, and also between the litter types, with decomposition rates for T. latifolia being much higher than for S. capillifolium. Differences in environmental conditions, biological activity, and litter quality are major drivers of spatial variability in OM decomposition in terrestrial and aquatic systems (Bradford et al., 2016; Joly et al., 2023). For example, decomposition rates of Sphagnum species are usually slow compared to those of vascular plants like T. latifolia because of their high content in recalcitrant organic compounds (e.g. phenolics and sphagnan) and low nutrient concentrations (Hájek et al., 2011).
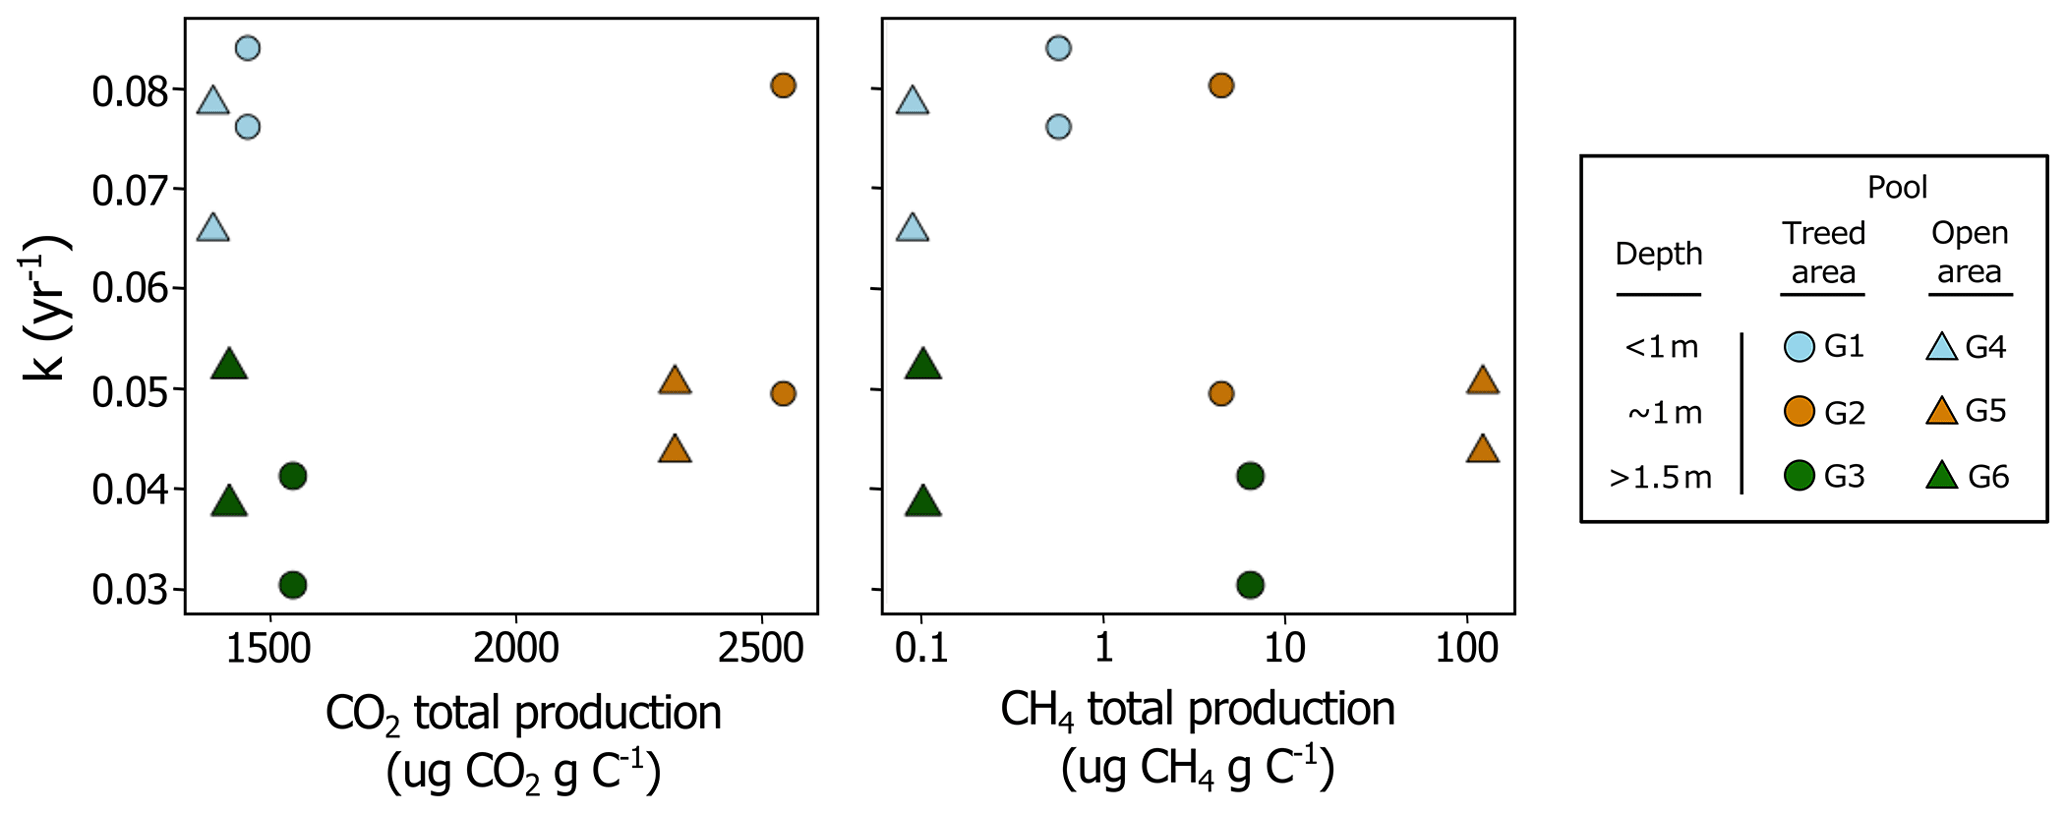
Figure 7Relationship between fresh litter decomposition rates (k) at the bottom of each pool and carbon dioxide (CO2) and methane (CH4) total production from pool sediments after 35 d of incubation. On each graph, there are two identical symbols per pool, one for Sphagnum capillifolium and one for Typha latifolia.
In our study, the depth at which fresh OM decomposition occurred, rather than litter chemistry, was the most important driver of spatial variations in decomposition rates after 27 months. At the surface of the pools, decomposition rates for S. capillifolium and T. latifolia were faster than at any other depth and, at the bottom, slowed with increasing pool depth. In aquatic ecosystems, litter decomposition rates are positively correlated to O2 availability and temperature (e.g. Hardwick et al., 2022; Lecerf et al., 2007) and are faster under high light intensity (Kuehn et al., 2014) because of increased microbial activity. At the study site, summer dissolved O2 concentrations, water temperature, and light intensity all decreased with increasing depth from the pool surface (Arsenault et al., 2018). Unfortunately, we only measured these variables in our pools when installing and retrieving our litterbags, and our sample size (n = 6) is thus too small to statistically indicate correlations between environmental conditions (i.e. O2 concentration, temperature, and light) and OM decomposition. However, based on the literature as outlined in the following paragraphs, we here argue that the differences in the decomposition rates we measured were largely driven by within-pool variations in such environmental conditions that could influence the structure of microbial communities and the magnitude of decomposition processes.
Dissolved O2 concentration is a major control of litter decay in freshwater systems (LaRowe and Van Cappellen, 2011). When O2 concentration decreases, other biogeochemical processes intensify (e.g. anaerobic respiration or fermentation), and this results in slower decomposition rates (Blodau, 2011). Dissolved O2 in aquatic systems is positively correlated to litter decomposition rates because the proportion of microorganisms with the ability to decompose litter in microbial communities is larger under high O2 availability (Liu et al., 2022). This relationship may then explain the slower decomposition rates for both S. capillifolium and T. latifolia with increasing depth from the pool surface (Fig. 4a), as peatland pool water is depleted in O2 at depth. Thus, decomposition of any type of litter material that falls in deep pools would be slower than in shallow pools. Given the spatial heterogeneity in pool depth that exists in many temperate peatlands (Arsenault et al., 2023), the effects pools have on the C balance of the peatlands in which they develop may then be larger than currently expected. Indeed, small and shallow pools emit more C than larger and deeper pools (McEnroe et al., 2009; Pelletier et al., 2014), but there is currently no inventory of the number, distribution, or morphology of temperate peatland pools, which limits our comprehension of their role in peatland C emissions. Then, an ombrotrophic raised peatland with pools that are mostly small and shallow could be a smaller C sink than a peatland of similar geographical settings but with pools that are mostly large and deep. This also highlights a still unknown but possible effect climate change could have on peatland C balance if peatland pool number, extent, or morphology were to increase or decrease under changing environmental conditions.
Warmer temperature increases decomposition rates in both aquatic and terrestrial environments (e.g. Kim et al., 2015; Treat et al., 2014). A mesocosm experiment has shown that warmer water temperature accelerated the decomposition of plant material in aquatic systems and increased the activity and diversity of decomposition-related bacteria (Pan et al., 2021). In our study, water temperature at the pool surface was similar in all pools, suggesting other environmental drivers were controlling the differences in litter decomposition among pools at the surface. However, during the growing season when most of the biological activity occurs, pool water temperature decreased with increasing depth from the surface (Arsenault et al., 2018), supporting the idea that spatial variations in litter decomposition within pools were partly related to water temperature. With increasing summer temperature under current and future climate warming, litter decomposition rates may increase in peatland pools, especially in the shallowest ones, and considerably affect their C budget.
Light has an indirect effect on litter decomposition as it influences microbial biomass and activity (Danger et al., 2013; Halvorson et al., 2019). For example, in aquatic ecosystems, light may increase algae growth and the production of labile OM (Singh and Singh, 2015), which could stimulate the overall microbial activity of decomposition (Halvorson et al., 2019). Increased light intensity at the surface compared to depth could then enhance litter decomposition in the upper layer of the water column. Light penetration is however influenced by dissolved and suspended matter (Wetzel, 2001). In our pools, we estimated dissolved matter concentration and composition by measuring water colour (A254) and SUVA. Water colour was negatively correlated to decomposition rates of T. latifolia at the surface and of both litter types in depth, meaning that light attenuation due to dissolved matter may influence litter decomposition rates in peatland pools. However, we did not measure suspended matter in our pools, which could possibly have explained differences in litter decomposition rates among pools and areas (Table 1). Without identifying light as a clear driver of C cycling in pools, our results nonetheless indicate that possible pool water browning in response to climate change (Fenner et al., 2021) may counterbalance some of the effects the expected higher temperatures during the growing season may have on litter decomposition.
The slow rates of decomposition of S. capillifolium in pools of both the open and the treed areas were similar to those found in the surface of bog and fen peatlands in temperate and boreal regions (e.g. Moore et al., 2007; Moore and Basiliko, 2006), and there was little differentiation between rates within the pools. The faster rates of decomposition of T. latifolia at the surface of the pools (0.10 to 0.19 yr−1) are similar to rates obtained in the surface of peatlands and in freshwater marshes, where k values range from 0.14 to 0.59 yr−1 (e.g. Dong et al., 2024; Moore et al., 2007). The decrease in the k value with depth of emplacement in the pools (from an average of 0.15 yr−1 near the water surface to an average of 0.07 yr−1 in the pool sediment) is also consistent with studies that placed the T. latifolia leaves at depth in peatlands, resulting in a strong correlation between the k value and the period of saturation derived from the water table position, with k values declining from about 0.2 yr−1 when never saturated to 0.05 yr−1 when continuously saturated (Clarkson et al., 2014; Moore et al., 2007). This suggests that anoxic conditions are a major control on decomposition rates of fresh organic matter in these peatlands.
However, decomposition rates for both S. capillifolium and T. latifolia in the pool sediments were similar to those measured at the bottom of the pools, meaning that the environmental conditions 15 cm below the pools were not as limiting as we might have expected, even though we measured hypoxia below the water–sediment interface (Arsenault et al., 2018). In peatlands or in aquatic ecosystems, litter decomposition rates are slower in anoxic than in oxic conditions (e.g. Moore et al., 2007; Neckles and Neill, 1994). However, Liu et al. (2022) found that litter decomposition was still effective in anaerobic conditions because of distinct structures in microorganism communities. It is then possible that similar variations in microbial communities sustained fresh litter decomposition in the anoxic, low-temperature, and light-free conditions that normally prevail in peatland pool sediments.
4.2 Decomposability of pool sediments
The results of our incubation experiment showed a link between OM chemistry and decomposition and greenhouse gas production from pool sediments, but this influence could only partly explain spatial variations in pool sediment decomposition. For example, CO2 production was negatively related to an increase in OM humification, but CH4 production was mostly related to C concentration but not to humification indices (Table 4). Hence, while the incubations were conducted under the same conditions and samples were treated in the same way, our results do not point towards a specific control of inherent sediment properties on decomposition rates. In fact, the relatively small influence sediment chemistry exerts on its degradability is supported by the results of the litterbag component of the study. Indeed, we observed relationships between OM chemistry and decomposition for T. latifolia but not for S. capillifolium (Fig. 4). Given that peat at the study site is mostly composed of Sphagnum species, variations in CH4 and CO2 production from our pool sediments may thus be explained by other factors we did not measure, such as the structure of microbial communities found in the sediments (Oloo et al., 2016), or the effects of chemical properties were too small compared to the observed variation in the data. One of our main objectives was to assess the role OM chemistry plays in decomposition rates and to increase knowledge of the mechanisms controlling OM decomposition in peatland pools. However, because we focused our work on a small number of pools, we can only point to possible drivers of OM decomposition. For example, as suggested by the negative correlation between CO2 production and humification indices or the positive correlations between C emissions and sediment P concentration (Fig. 6, Table 4), it is possible that decomposition rates in peatland pools are in part driven by OM quality and P limitation. This emphasizes the lack of available information on peatland pool biogeochemical patterns and processes and calls for further studies on the specific mechanisms responsible for sediment degradation in such unique freshwater systems.
4.3 Drivers of OM decomposition rates in peatland pools
Many studies have quantified the C budget of peatlands (e.g. Yu, 2012), but relatively little effort has been invested in understanding the effects C-emitting features like pools have on this budget or determining the factors controlling C emissions. By combining both the litterbag and the incubation experiment, we were able to disentangle the effect of OM chemistry and environmental conditions on OM decomposition rates and greenhouse gas production in peatland pools. Here, we argue that OM decomposition rates in peatland pools are mostly controlled by several mechanisms that are regulated by the environmental condition in which this decomposition occurs. For example, both litterbag and incubation experiments indicate controls of OM decomposition in peatland pools that are not only chemical, but also physical (e.g. pool morphology) and biological (e.g. surrounding vegetation composition). Spatial variations in fresh litter decay and pool sediment decomposition did not follow the same trends, and there was no relationship between both components of the study (Fig. 7). While we may correlate CO2 and CH4 production to OM chemistry, litter decomposition in pool water primarily slowed with increasing depth from the pool surface. This suggests that the chemistry of OM alone could not explain variations in OM decomposition in peatland pools.
Our results show that pool depth, by influencing the environmental and possibly biological and thermodynamic conditions in which decomposition occurs, is a more important control of decomposition processes in peatland pools than OM chemistry. Overall, CO2 production and CH4 production were the highest in the ∼ 1 m deep pools (pools G2 and G5; Table 3, Fig. 5a), in which OM may be ideal for supporting high rates of decomposition. For example, along with pool G6, which also had high CO2 and CH4 production (Fig. 5), pools G2 and G5 had the largest sediment P concentration (Table 3). Given that P is limiting in peatland pools (Arsenault et al., 2018), higher P concentrations in the substrate may enhance its decomposition (Moore et al., 2008). The negative correlation between CO2 production and humification indices of the remaining litter after incubation (Table 4) is also indicative of chemical controls of sediment decomposability, with higher CO2 production from sediments that contained higher relative proportions of polysaccharides to proteins and aromatics. This means that a larger abundance of shrubs relative to Sphagnum species under climate change, as suggested by previous studies (e.g. Dieleman et al., 2015), would also influence decomposition rates and increase C emissions from peatland pools. The relationships of CO2 production to humification indices are in agreement with the hypothesis of reduced decomposition rates with increasing OM aromaticity. Because we would expect the sediments of shallower pools to be composed of less degraded peat, higher CO2 production from the ∼ 1 m deep pool and the correlations between CO2 and humification indices also show that the chemical composition of pool sediments and peat varies spatially but that other mechanisms we did not study, e.g. related to the structure of microbial communities, are potentially key drivers of OM decomposition in peatland pools.
Peatland pool biogeochemistry responds strongly to changes in temperature (Arsenault et al., 2023). A recent study in a subboreal raised bog has also shown that pool surface area, hence possibly also depth, has declined in the last 6 decades because of increased mean air temperature (Colson et al., 2023). With our results clearly showing that environmental conditions are a major driver of OM decomposition, this means that decomposition rates in peatland pools may increase over time in response to decreasing pool depth under climate change. Indeed, regardless of litter type, we have measured the highest rates of decomposition in the warmest and more oxygenated locations of our pools. Then, expected structural changes in peatland pools under climate change (e.g. Karofeld and Tõnisson, 2014) would likely lead to changes in the magnitude of their C emission function, but this still needs to be tested.
Our study showed that OM decomposition in peatland pools is highly variable and depends primarily on the environmental conditions in which it occurs, with spatial patterns emerging in the decomposability of both fresh litter and pool sediment as a function of pool depth (Fig. 7). Then, regardless of the type of litter that falls at the bottom of the pools, we may expect faster decomposition rates in shallow pools than in deep pools in response to distinct biogeochemical mechanisms and pathways. These mechanisms that lead to CO2 and CH4 production in pools; the relationship between such production and pool structure; and, more generally, the role pools play in the C budget of peatlands nonetheless remain unclear. Overall, the degradation potential of OM in peatland pools is spatially heterogeneous, with large variations emerging in fresh litter and sediment decomposition within a small area of a temperate ombrotrophic peatland. This means that the estimation of the C budget of a given peatland with pools may be imprecise if pools and their specificities are not considered.
The data that support the findings of this study are openly available on Zenodo at https://doi.org/10.5281/zenodo.10581234 (Arsenault et al., 2024).
The supplement related to this article is available online at: https://doi.org/10.5194/bg-21-3491-2024-supplement.
JA, JT, JFL, and TRM designed the study. JA carried out the litterbag and incubation experiments. HT performed the statistical preprocessing of the litter and peat chemical measurements. JA analyzed the data and prepared the paper with contributions from all co-authors.
The contact author has declared that none of the authors has any competing interests.
Publisher’s note: Copernicus Publications remains neutral with regard to jurisdictional claims made in the text, published maps, institutional affiliations, or any other geographical representation in this paper. While Copernicus Publications makes every effort to include appropriate place names, the final responsibility lies with the authors.
We thank all students from the Laboratoire d'Étude des Fonctions Écosystémiques, de leur Stabilité Spatiotemporelle et des Enjeux Socioenvironnementaux at UdeM, who have provided invaluable assistance in installing and retrieving the experimental setup at GPB. We also thank Mike Dalva for his help during the incubation phase of the research. This research was funded by NSERC and FRQNT through PhD fellowships to Julien Arsenault and by the NSERC Discovery Grant to JT (RGPIN-2020-05310). Elemental and isotopic analyses and MIR spectroscopy were carried out in the central laboratory of the Institute of Landscape Ecology, University of Münster. The assistance of Jonas Kurth, Daniel Brüggemann, and several student assistants is greatly appreciated. Henning Teickner was funded by the German Research Foundation (grant no. KN 929/23-1) through Klaus-Holger Knorr.
This research has been supported by the Natural Sciences and Engineering Research Council of Canada (grant no. RGPIN-2020-05310) and the German Research Foundation (grant no. KN 929/23-1).
This paper was edited by Sebastian Naeher and reviewed by two anonymous referees.
Arsenault, J., Talbot, J., and Moore, T. R.: Environmental controls of C, N and P biogeochemistry in peatland pools, Sci. Total Environ., 631/632, 714–722, 2018.
Arsenault, J., Talbot, J., Moore, T. R., Beauvais, M.-P., Franssen, J., and Roulet, N. T.: The spatial heterogeneity of vegetation, hydrology and water chemistry in a peatland with open-water pools, Ecosystems, 22, 1352–1367, 2019.
Arsenault, J., Talbot, J., Brown, L., Holden, J., Martinez-Cruz, K., Sepulveda-Jauregui, A., Swindles, G. T., Wauthy, M., and Lapierre, J. F.: Biogeochemical distinctiveness of peatland ponds, thermokarst waterbodies, and lakes, Geophys. Res. Lett., 49, e2021GL097492, https://doi.org/10.1029/2021GL097492, 2022.
Arsenault, J., Talbot, J., Brown, L. E., Helbig, M., Holden, J., Hoyos-Santillan, J., Jolin, É., Mackenzie, R., Martinez-Cruz, K., Sepulveda-Jauregui, A., and Lapierre, J.: Climate-driven spatial and temporal patterns in peatland pool biogeochemistry, Glob. Change Biol., 29, 4056–4068, 2023.
Arsenault, J., Talbot, J., Moore, T. R., Knorr, K.-H., Teickner, H., and Lapierre, J.-F.: Patterns and drivers of organic matter decomposition in peatland open-water pool, Zenodo [data set], https://doi.org/10.5281/zenodo.10581235, 2024.
Beleites, C. and Sergo, V.: hyperSpec: A package to handle hyperspectral data sets in R, https://doi.org/10.32614/CRAN.package.hyperSpec, 2021.
Blodau, C.: Thermodynamic Control on Terminal Electron Transfer and Methanogenesis, in: Aquatic Redox Chemistry, Am. Chem. Soc., 1071, 65–83, https://doi.org/10.1021/bk-2011-1071.ch004, 2011.
Bradford, M. A., Berg, B., Maynard, D. S., Wieder, W. R., and Wood, S. A.: Understanding the dominant controls on litter decomposition, J. Ecol., 104, 229–238, 2016.
Broder, T., Blodau, C., Biester, H., and Knorr, K. H.: Peat decomposition records in three pristine ombrotrophic bogs in southern Patagonia, Biogeosciences, 9, 1479–1491, https://doi.org/10.5194/bg-9-1479-2012, 2012.
Chapman, P. J., Moody, C. S., Turner, T. E., McKenzie, R., Dinsmore, K. J., Baird, A. J., Billett, M. F., Andersen, R., Leith, F., and Holden, J.: Carbon concentrations in natural and restoration pools in blanket peatlands, Hydrol. Proc., 36, 14520, https://doi.org/10.1002/hyp.14520, 2022.
Clarkson, B. R., Moore, T. R., Fitzgerald, N. B., Thornburrow, D., Watts, C. H., and Miller, S.: Water table regime regulates litter decomposition in restiad peatlands, New Zealand, Ecosystems, 17, 317–326, https://doi.org/10.1007/s10021-013-9726-4, 2014.
Cocozza, C., D'Orazio, V., Miano, T. M., and Shotyk, W.: Characterization of solid and aqueous phases of a peat bog pro?le using molecular ?uorescence spectroscopy, ESR and FT-IR, and comparison with physical properties, Org. Geochem., 34, 49–60, 2003.
Colson, D. W., Morris, P. J., Smith, M. W., Rydin, H., Granath, G., and Quincey, D. J.: Six Decades of Changes in Pool Characteristics on a Concentric-Patterned Raised Bog, Ecosystems, 27, 278–294, https://doi.org/10.1007/s10021-023-00889-3, 2023.
Danger, M., Cornut, J., Chauvet, E., Chavez, P., Elger, A., and Lecerf, A.: Benthic algae stimulate leaf litter decomposition in detritus-based headwater streams: a case of aquatic priming effect?, Ecology, 94, 1604–1613, 2013.
Dieleman, C. M., Branfireun, B. A., Mclaughlin, J. W., and Lindo, Z.: Climate change drives a shift in peatland ecosystem plant community: Implications for ecosystem function and stability, Glob. Change Biol., 21, 388–395, 2015.
Dong, D., Badiou, P., Moore, T. R., and Von Sperber, C.: Litter decomposition and nutrient dynamics of four macrophytes in intact, restored, and constructed freshwater marshes of Canada, Restor. Ecol., 32, e14135, https://doi.org/10.1111/rec.14135, 2024.
Canadian Climate Data – Saint-Michel Station: Canadian Climate Normals, https://climate.weather.gc.ca/climate_normals/index_e.html, last access: 15 September 2022.
Fenner, N., Meadham, J., Jones, T., Hayes, F., and Freeman, C.: Effects of Climate Change on Peatland Reservoirs: A DOC Perspective, Global Biogeochem. Cy., 35, e2021GB006992, https://doi.org/10.1029/2021GB006992, 2021.
Foster, D. R. and Glaser, P. H.: The raised bogs of South-Eastern Labrador, Canada: Classification, distribution, vegetation and recent dynamics, J. Ecol., 74, 47–71, 1986.
Hájek, T., Ballance, S., Limpens, J., Zijlstra, M., and Verhoeven, J. T. A.: Cell-wall polysaccharides play an important role in decay resistance of Sphagnum and actively depressed decomposition in vitro, Biogeochemistry, 103, 45–57, https://doi.org/10.1007/s10533-010-9444-3, 2011.
Halvorson, H. M., Barry, J. R., Lodato, M. B., Findlay, R. H., Francoeur, S. N., and Kuehn, K. A.: Periphytic algae decouple fungal activity from leaf litter decomposition via negative priming, Funct. Ecol., 33, 188–201, 2019.
Hardwick, L. J., Fryirs, K. A., and Hose, G. C.: Spatial and temporal variation in macrophyte litter decomposition in a rare chain-of-ponds, an intermittent stream and wetland system, Wetlands, 42, 33, https://doi.org/10.1007/s13157-022-01550-w, 2022.
Hassan, M., Talbot, J., Arsenault, J., Martinez-cruz, K., and Sepulveda-, A.: Linking Dissolved Organic Matter to CO2 and CH4 Concentrations in Canadian and Chilean Peatland Pools, Global Biogeochem. Cy., 37, e2023GB007715, https://doi.org/10.1029/2023GB007715, 2023.
Joly, F.-X., Scherer-Lorenzen, M., and Hättenschwiler, S.: Resolving the intricate role of climate in litter decomposition, Nat. Ecol. Evol., 7, 214–223, 2023.
Karberg, N. J., Scott, N. A., and Giardina, C. P.: Methods for estimating litter decomposition, in: Field Measurements for Forest Carbon Monitoring, edited by: Hoover, C. M., Springer, Springer Dordrecht, 103–111, https://doi.org/10.1007/978-1-4020-8506-2, 2008.
Karofeld, E. and Tõnisson, H.: Spatio-temporal changes in bog pool bottom topography – temperature effect and its influence on pool development: An example from a raised bog in Estonia, Hydrol. Process., 28, 958–968, 2014.
Kaštovská, E., Straková, P., Edwards, K., Urbanová, Z., Bárta, J., Mastný, J., Šantrůčková, H., and Picek, T.: Cotton-grass and blueberry have opposite effect on peat characteristics and nutrient transformation in peatland, Ecosystems, 21, 443–458, 2018.
Kim, Y., Ullah, S., Roulet, N. T., and Moore, T. R.: Effect of inundation, oxygen and temperature on carbon mineralization in boreal ecosystems, Sci. Total Environ., 511, 381–392, 2015.
Kuehn, K. A., Francoeur, S. N., Findlay, R. H., and Neely, R. K.: Priming in the microbial landscape: periphytic algal stimulation of litter-associated microbial decomposers, Ecology, 95, 749–762, 2014.
LaRowe, D. E. and Van Cappellen, P.: Degradation of natural organic matter: A thermodynamic analysis, Geochim. Cosmochim. Ac., 75, 2030–2042, https://doi.org/10.1016/j.gca.2011.01.020, 2011.
Lavoie, M., Colpron-Tremblay, J., and Robert, É. C.: Développement d'une vaste tourbière ombrotrophe non perturbée en contexte périurbain au Québec méridional, Ecoscience, 19, 285–297, 2012.
Lecerf, A., Risnoveanu, G., Popescu, C., Gessner, M. O., and Chauvet, E.: Decomposition of diverse litter mixtures in streams, Ecology, 88, 219–227, 2007.
Liu, S., He, G., Fang, H., Xu, S., and Bai, S.: Effects of dissolved oxygen on the decomposers and decomposition of plant litter in lake ecosystem, J. Clean. Prod., 372, 133837, https://doi.org/10.1016/j.jclepro.2022.133837, 2022.
Loisel, J., van Bellen, S., Pelletier, L., Talbot, J., Hugelius, G., Karran, D., Yu, Z., Nichols, J., and Holmquist, J.: Insights and issues with estimating northern peatland carbon stocks and fluxes since the Last Glacial Maximum, Earth-Sci. Rev., 165, 59–80, 2017.
Loisel, J., Gallego-Sala, A. V., Amesbury, M. J., Magnan, G., Anshari, G., Beilman, D. W., Benavides, J. C., Blewett, J., Camill, P., Charman, D. J., Chawchai, S., Hedgpeth, A., Kleinen, T., Korhola, A., Large, D., Mansilla, C. A., Müller, J., van Bellen, S., West, J. B., Yu, Z., Bubier, J. L., Garneau, M., Moore, T., Sannel, A. B. K., Page, S., Väliranta, M., Bechtold, M., Brovkin, V., Cole, L. E. S., Chanton, J. P., Christensen, T. R., Davies, M. A., De Vleeschouwer, F., Finkelstein, S. A., Frolking, S., Gałka, M., Gandois, L., Girkin, N., Harris, L. I., Heinemeyer, A., Hoyt, A. M., Jones, M. C., Joos, F., Juutinen, S., Kaiser, K., Lacourse, T., Lamentowicz, M., Larmola, T., Leifeld, J., Lohila, A., Milner, A. M., Minkkinen, K., Moss, P., Naafs, B. D. A., Nichols, J., O'Donnell, J., Payne, R., Philben, M., Piilo, S., Quillet, A., Ratnayake, A. S., Roland, T. P., Sjögersten, S., Sonnentag, O., Swindles, G. T., Swinnen, W., Talbot, J., Treat, C., Valach, A. C., and Wu, J.: Expert assessment of future vulnerability of the global peatland carbon sink, Nat. Clim. Change, 11, 70–77, 2021.
McEnroe, N. A., Roulet, N. T., Moore, T. R., and Garneau, M.: Do pool surface area and depth control CO2 and CH4 fluxes from an ombrotrophic raised bog, James Bay, Canada?, J. Geophys. Res.-Biogeo., 114, G01001, https://doi.org/10.1029/2007JG000639, 2009.
Moore, T. R. and Basiliko, N.: Decomposition in boreal peatlands, in: Boreal Peatland Ecosystems, edited by: Wieder, R. K. and Vitt, D. H., Springer, Springer Berlin, 125–143, https://doi.org/10.1007/978-3-540-31913-9, 2006.
Moore, T. R., Bubier, J. L., and Bledzki, L.: Litter decomposition in temperate peatland ecosystems: The effect of substrate and site, Ecosystems, 10, 949–963, 2007.
Moore, T. R., Trofymow, J. A., Siltanen, M., and Kozak, L. M.: Litter decomposition and nitrogen and phosphorus dynamics in peatlands and uplands over 12 years in central Canada, Oecologia, 157, 317–325, 2008.
Neckles, H. A. and Neill, C.: Hydrologic control of litter decomposition in seasonally flooded prairie marshes, Hydrobiologia, 286, 155–165, 1994.
Oloo, F., Valverde, A., Quiroga, M. V., Vikram, S., Cowan, D., and Mataloni, G.: Habitat heterogeneity and connectivity shape microbial communities in South American peatlands, Sci. Rep., 6, 25712, https://doi.org/10.1038/srep25712, 2016.
Pace, M. L. and Prairie, Y. T.: Respiration in lakes, in: Respiration in Aquatic Ecosystems, edited by: Del Giorgio, P. A. and Williams, P., Oxford University Press, 103–121, https://doi.org/10.1093/acprof:oso/9780198527084.001.0001, 2005.
Pan, M., Wang, T., Hu, B., Shi, P., Xu, J., and Zhang, M.: Mesocosm experiments reveal global warming accelerates macrophytes litter decomposition and alters decomposition-related bacteria community structure, Water, 13, 1940, https://doi.org/10.3390/w13141940, 2021.
Pan, Y., Birdsey, R. A., Fang, J., Houghton, R., Kauppi, P. E., Kurz, W. A., Phillips, O. L., Shvidenko, A., Lewis, S. L., Canadell, J. G., Ciais, P., Jackson, R. B., Pacala, S. W., McGuire, A. D., Piao, S., Rautiainen, A., Sitch, S., and Hayes, D.: A large and persistent carbon sink in the world's forests, Science, 333, 988–993, 2011.
Parikh, S., Goyne, K. W., Margenot, A. J., Mukome, F. N. D., and Calderon, F. J.: Soil chemical insights provided through vibrational spectroscopy, in: Advances in Agronomy, volume 126, edited by: Sparks, D. L., Academic Press, 1–64, ISBN: 978-0-12-800132-5, 2014.
Pelletier, L., Strachan, I. B., Garneau, M., and Roulet, N. T.: Carbon release from boreal peatland open water pools: Implication for the contemporary C exchange, J. Geophys. Res.-Biogeo., 119, 207–222, 2014.
Pelletier, L., Strachan, I. B., Roulet, N. T., and Garneau, M.: Can boreal peatlands with pools be net sinks for CO2?, Environ. Res. Lett., 10, 035002, https://doi.org/10.1088/1748-9326/10/3/035002, 2015.
Prijac, A., Gandois, L., Jeanneau, L., Taillardat, P., and Garneau, M.: Dissolved organic matter concentration and composition discontinuity at the peat–pool interface in a boreal peatland, Biogeosciences, 19, 4571–4588, https://doi.org/10.5194/bg-19-4571-2022, 2022.
R Core Team: R: A language and environment for statistical computing, https://www.R-project.org (last access: 1 May 2022), 2022.
Rydin, H. and Jeglum, J. K.: The Biology of Peatlands, 2nd Edn., Oxford University Press, https://doi.org/10.1093/acprof:osobl/9780199602995.001.0001, 2013.
Schädel, C., Beem-Miller, J., Aziz Rad, M., Crow, S. E., Hicks Pries, C. E., Ernakovich, J., Hoyt, A. M., Plante, A., Stoner, S., Treat, C. C., and Sierra, C. A.: Decomposability of soil organic matter over time: the Soil Incubation Database (SIDb, version 1.0) and guidance for incubation procedures, Earth Syst. Sci. Data, 12, 1511–1524, https://doi.org/10.5194/essd-12-1511-2020, 2020.
Singh, S. P. and Singh, P.: Effect of temperature and light on the growth of algae species: A review, Renew. Sustain. Energ. Rev., 50, 431–444, https://doi.org/10.1016/j.rser.2015.05.024, 2015.
Stuart, B. H.: Infrared Spectroscopy: Fundamentals and Applications, 1st Edn., John Wiley & Sons, https://doi.org/10.1002/0470011149, 2004.
Teickner, H.: ir: Functions to handle and preprocess infrared spectra, Zenodo, https://doi.org/10.5281/zenodo.5747170, 2023.
Teickner, H. and Hodgkins, S. B.: irpeat 0.2.0: Functions to analyze mid-infrared spectra of peat samples, Zenodo, https://doi.org/10.5281/zenodo.5792918, 2022.
Tonin, A. M., Ubiratan Hepp, L., and Gonçalves, J. F.: Spatial variability of plant litter decomposition in stream networks: From litter bags to watersheds, Ecosystems, 21, 567–581, 2018.
Treat, C. C., Wollheim, W. M., Varner, R. K., Grandy, A. S., Talbot, J., and Frolking, S.: Temperature and peat type control CO2 and CH4 production in Alaskan permafrost peats, Glob. Change Biol., 20, 2674–2686, 2014.
Trofymow, J. A., Moore, T. R., Titus, B., Prescott, C., Morrison, I., Siltanen, M., Smith, S., Fyles, J., Wein, R., Camiré, C., Duschene, L., Kozak, L., Kranabetter, M., and Visser, S.: Rates of litter decomposition over 6 years in Canadian forests: Influence of litter quality and climate, Can. J. Forest Res., 32, 789–804, 2002.
Wang, M., Moore, T. R., Talbot, J., and Riley, J. L.: The stoichiometry of carbon and nutrients in peat formation, Global Biogeochem. Cy., 29, 113–121, 2015.
Weishaar, J. L., Aiken, G., Bergamaschi, B., Fram, M., Fujii, R., and Mopper, K.: Evaluation of specific ultra-violet absorbance as an indicator of the chemical content of dissolved organic carbon, Environ. Sci. Technol., 37, 4702–4708, 2003.
Wetzel, R. G.: Limnology: lake and river ecosystems, 3rd Edn., Academic Press, 1006 pp., https://doi.org/10.1016/C2009-0-02112-6, 2001.
Xu, J., Morris, P. J., Liu, J., and Holden, J.: PEATMAP: Refining estimates of global peatland distribution based on a meta-analysis, Catena, 160, 134–140, 2018.
Yu, Z. C.: Northern peatland carbon stocks and dynamics: a review, Biogeosciences, 9, 4071–4085, https://doi.org/10.5194/bg-9-4071-2012, 2012.