the Creative Commons Attribution 4.0 License.
the Creative Commons Attribution 4.0 License.
 | 22 Jan 2024
Seasonal particulate organic carbon dynamics of the Kolyma River tributaries, Siberia
Kirsi H. Keskitalo
Lisa Bröder
Tommaso Tesi
Paul J. Mann
Dirk J. Jong
Sergio Bulte Garcia
Anna Davydova
Sergei Davydov
Nikita Zimov
Negar Haghipour
Timothy I. Eglinton
Jorien E. Vonk
Arctic warming is causing permafrost thaw and release of organic carbon (OC) to fluvial systems. Permafrost-derived OC can be transported downstream and degraded into greenhouse gases that may enhance climate warming. Susceptibility of OC to decomposition depends largely upon its source and composition, which vary throughout the seasonally distinct hydrograph. Most studies on carbon dynamics to date have focused on larger Arctic rivers, yet little is known about carbon cycling in lower-order rivers and streams. Here, we characterize the composition and sources of OC, focusing on less studied particulate OC (POC), in smaller waterways within the Kolyma River watershed. Additionally, we examine how watershed characteristics control carbon concentrations. In lower-order systems, we find rapid initiation of primary production in response to warm water temperatures during spring freshet, shown by decreasing δ13C-POC, in contrast to larger rivers. This results in CO2 uptake by primary producers and microbial degradation of mainly autochthonous OC. However, if terrestrially derived inorganic carbon is assimilated by primary producers, part of it is returned via CO2 emissions if the autochthonous OC pool is simultaneously degraded. As Arctic warming and hydrologic changes may increase OC transfer from smaller waterways to larger river networks, understanding carbon dynamics in smaller waterways is crucial.
- Article
(3983 KB) - Full-text XML
- BibTeX
- EndNote


The Arctic is warming at up to 4 times the rate of the global average (Meredith et al., 2019; Rantanen et al., 2022), which affects hydrology, carbon cycling and permafrost (Turetsky et al., 2019; Walvoord and Kurylyk, 2016). Terrestrial permafrost thaw adds organic carbon (OC) to fluvial systems via active layer leaching and abrupt thaw processes (e.g., riverbank erosion), the former releasing predominantly dissolved OC (DOC) and the latter particulate OC (POC) (Guo et al., 2007; Schuur et al., 2015). Mineralization of terrestrially derived permafrost OC in fluvial systems adds greenhouse gases into the atmosphere, enhancing climate warming (Meredith et al., 2019; Schuur et al., 2015).
Mineralization dynamics of fluvial OC are largely determined by its composition. Modern-aged DOC predominantly fuels CO2 emissions from Arctic waters (Dean et al., 2020), yet permafrost DOC is preferentially degraded when present (Mann et al., 2015; Vonk et al., 2013). The fluxes, composition and degradation of mainstem POC have been addressed in large Arctic rivers (e.g., Bröder et al., 2020; Guo and Macdonald, 2006; Keskitalo et al., 2022; McClelland et al., 2016), but our understanding of the carbon dynamics, especially regarding POC, and seasonality of smaller waterways is lacking.
Here, we investigate carbon characteristics (POC, DOC, dissolved inorganic carbon – DIC, the stable carbon isotope δ13C of these carbon pools and radiocarbon Δ14C-POC) and water chemistry (temperature, pH, conductivity, and water isotopes δ18O and δ2H) in lower-order streams and rivers within the Kolyma watershed (Fig. 1). We perform source apportionment modeling to characterize sources of POC and investigate how seasons and spatial characteristics (e.g., slope, soil OC content) affect carbon contributions in these streams. A future intensification of the Arctic hydrological cycle combined with a longer growing season, earlier onset of spring freshet and ongoing permafrost thaw is expected to shunt organic matter more rapidly from land into lower-order streams and rivers and into large river systems. It is therefore necessary to understand carbon dynamics of lower-order systems in order to project future changes within Arctic rivers (Collins et al., 2021; Mann et al., 2022; Raymond et al., 2016; Stadnyk et al., 2021).
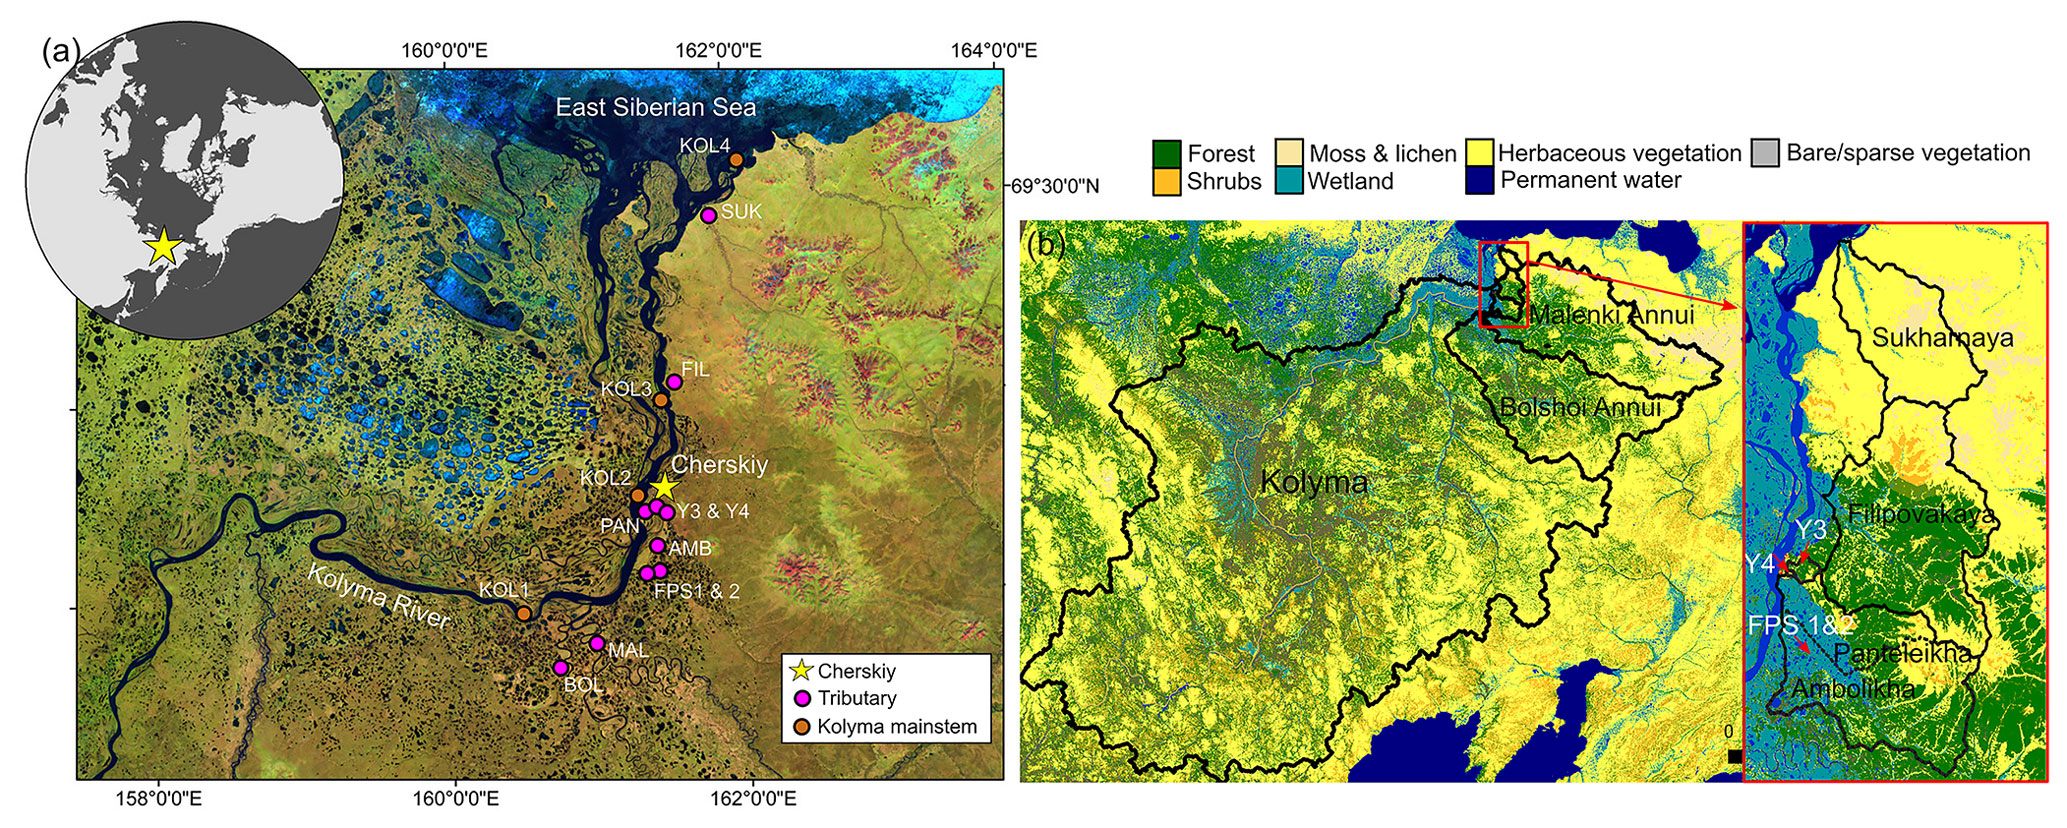
Figure 1(a) Sampling locations of the Kolyma River and tributaries (i.e., lower-order streams and rivers). The tributaries are Sukharnaya (SUK), Filipovkaya (FIL), Panteleikha (PAN), Malenki Annui (MAL) and Bolshoi Annui (BOL). Ambolikha (AMB), Y3 and Y4 are tributaries of Panteleikha, and floodplain streams (FPS1 and FPS2) are tributaries of Ambolikha. All the sites were sampled in both seasons: summer (July–August 2018) and freshet (June 2019). Map adapted from Mann et al. (2012). (b) Land cover of the Kolyma and its tributary watersheds. Land cover classes according to Buchhorn et al. (2020).
2.1 Study area and background
The Kolyma River drains 100 % continuous permafrost terrain (Holmes et al., 2012) with variable landscapes including wetlands, tundra and forests (Mann et al., 2012). Here, permafrost consists partially of the OC- and ice-rich Yedoma sediments, which date to the Pleistocene (Strauss et al., 2017, 2021; Zimov et al., 2006). The continental climate encompasses cold winters (January mean −32.7 ∘C) and mild summers (July mean 13.2 ∘C) (Fedorov-Davydov et al., 2018b). River hydrology is characterized by a discharge peak (> 30 000 m3 s−1) during spring freshet (May–June), followed by a lower discharge (average of 6200 ± 3000 m3 s−1 in 2007–2017) during summer (July–August) (Shiklomanov et al., 2021). River OC concentrations follow the same pattern as discharge with higher concentrations during freshet than summer (Holmes et al., 2012; McClelland et al., 2016). All tributaries investigated in this study are partially underlain by Yedoma and located within the taiga or the tundra zone (Fig. 1) (Siewert et al., 2015; Strauss et al., 2021, 2022). Mean active layer thickness varies between catchments, ranging from 154 cm in Panteleikha, 90 cm across the uplands (Y3) and 65 cm at Ambolikha to 48 cm in tundra (measured at Cape Maliy Chukochiy) (Fedorov-Davydov et al., 2018a, b).
2.2 Field sampling
Surface water samples were collected in summer (July–August) 2018 and spring (June) 2019 (Fig. 1, Table A1) from ∼ 20 cm depth from the middle of the tributary river/stream (one sample per river/stream per season, total n= 10 tributaries per season) and additionally in the Kolyma mainstem (n= 6 in spring and n= 4 in summer) using pre-rinsed 1 L Nalgene bottles, which were decanted into a 10 L sterile and pre-rinsed polyethylene bag to maximize the sample size. During the spring freshet sampling campaign, all the rivers were ice-free during sampling. A few larger lakes in the area still had visible ice cover (5 June 2019), but snow had largely melted and was only present in landscape depressions. The ice broke up in the Kolyma River mainstem on 1 June 2019 around the Northeast Science Station in Cherskiy. Water quality parameters were recorded using a multi-parameter sonde (Eijkelkamp Aquaread AP-800 in 2018, YSI Professional Plus in 2019).
Water samples were filtered (within 12 h) using pre-combusted (350 ∘C, 6 h) glass-fiber filters (Whatman, 0.7 µm). Prior to filtering, samples were vigorously agitated to ensure thorough particle mixing. Filters (POC samples) were frozen to −20 ∘C, while the filtrate (DOC samples, ∼ 30 mL) was acidified with 30 µL of HCl (37 %) and stored cool (+5 ∘C). Samples for stable water isotopes (δ18O, δ2H) were filtered and stored cool (+5 ∘C) without headspace.
2.3 Analytical methods
2.3.1 Total suspended solids, organic carbon and carbon isotope analyses
The quantity of total suspended solids (TSS, mg L−1) was calculated by the difference in filter weight before and after filtering divided by the volume of water filtered. For POC concentrations, δ13C-POC and total particulate nitrogen (TPN) filters were freeze-dried and subsampled by punching 18 % of the 45 mm filter area and fitted into silver capsules/boats. The subsamples were treated with 1 M HCl to remove inorganic carbon and then placed into an oven at 60 ∘C until dry. Afterwards, the samples were wrapped in tin capsules/boats to aid combustion during analysis. The samples were analyzed with a Thermo Fisher elemental analyzer (FLASH 2000 CHNS O) coupled with a Thermo Finnigan Delta+ isotope ratio mass spectrometer (IRMS) at the National Research Council, Institute of Polar Sciences in Bologna, Italy.
For the 14C analysis, filters (see above for the subsampling method) were fumigated over 37 % HCl (72 h at 60 ∘C) to remove all inorganic carbon. After fumigation, samples were neutralized by removing excess acid (60 ∘C, a minimum of 48 h) in the presence of NaOH pellets and subsequently wrapped in tin boats. The samples were analyzed using a coupled elemental analyzer–accelerator mass spectrometer (EA-AMS) system (vario MICRO cube, Elementar; Mini Carbon Dating System (MICADAS), Ionplus, Dietikon, Switzerland) (Synal et al., 2007). The filter samples were blank-corrected for constant contamination according to the method presented in Haghipour et al. (2019). The 14C analysis was carried out at the Laboratory of Ion Beam Physics at the Swiss Federal Institute of Technology (ETH Zurich), Zurich, Switzerland.
The DOC samples from summer 2018 were analyzed for OC and δ13C-DOC with an Aurora 1030 total organic carbon (TOC) analyzer (OI Analytical) coupled to a DELTA V Advantage IRMS via a custom-built cryotrapping interface at KU Leuven, Belgium. Quantification and calibration were performed with IAEA-C6 (δ13C = −10.4 ‰) and an in-house sucrose standard (δ13C = −26.9 ‰) prepared in different concentrations. All δ13C data are reported in the notation relative to VPDB (Vienna Pee Dee Belemnite). The precision in duplicate samples was < 5 % for DOC and 0.2 ‰ for δ13C-DOC in > 95 % cases. The DOC samples from freshet 2019 were analyzed for OC and δ13C-DOC at the North Carolina State University, Raleigh, NC, USA. For the method details, see Osburn and St-Jean (2007).
2.3.2 Dissolved inorganic carbon analyses
Samples for DIC were collected by filtering 4 mL of water into pre-evacuated 12 mL Exetainers (Labco, UK) containing 100 µL of H3PO4 in 2018, while in 2019, DIC samples were filtered into Exetainers containing 100 µL of saturated KI and filled to the rim. The samples were stored cool (+5 ∘C) and dark until analysis. Headspace CO2 of the DIC samples from 2018 was analyzed using a GasBench interfaced to a Thermo DELTA V IRMS at the Northumbria University, UK. The DIC samples from 2019 were inserted into Exetainers (pre-flushed with He) containing three drops of concentrated H3PO4. Subsequently, the CO2 was measured with a Finnigan GasBench II interfaced with a Thermo Finnigan Delta+ mass spectrometer at the Vrije Universiteit Amsterdam, the Netherlands. Analytical standard deviation for both instruments was < 0.15 ‰.
2.3.3 Analysis of water isotopes
We measured stable isotopes of oxygen and hydrogen (δ18O, δ2H) in water to characterize the hydrological conditions in the Kolyma River and its tributaries. Samples were analyzed with a Picarro Inc L2140-i wavelength-scanning cavity ring-down spectrometer in replicates of seven, of which the first three were discarded to avoid carry-over effects. After a sequence of 10 samples, three in-house standards, all calibrated against IAEA standards (SLAP and VSMOW), were analyzed. The fourth in-house standard (KONA) was used to control precision and accuracy of the measurements (standard deviation < 0.1 ‰ for δ18O and < 2 ‰ for δ2H). The analysis was carried out at the Vrije Universiteit Amsterdam, the Netherlands.
2.4 Spatial analysis and landscape characterization
We delineated catchments using a 90 m digital elevation model (DEM) (Santoro and Strozzi, 2012) and determined mean soil OC content (SOCC) (Hugelius et al., 2013) and land cover (Buchhorn et al., 2020) and calculated the slope for each catchment using QGIS 3.16.1 with GRASS 7.8.4 (Fig. 1b). Prior to the spatial analysis, the DEM was pre-processed by filling all data gaps and sinks using the algorithm described in Wang and Liu (2006). Two of the smallest catchments, FPS1 and FPS2, were delineated manually using a satellite image as a template, as the DEM resolution was too coarse for delineating these small and flat catchments. For the Kolyma River watershed, we used a delineation from Shiklomanov et al. (2021). Based on size and land cover, we grouped catchments into floodplain (FPS1, FPS2), headwater (Y3, Y4), tundra (Sukharnaya, Malenki Annui), wetland (Panteleikha, Ambolikha) and forest (Bolshoi Annui, Filipovkaya) stream/rivers and the Kolyma mainstem as its own catchment.
2.5 Source apportionment
For the source apportionment of POC, we used a Markov chain Monte Carlo model to quantify contributions between autochthonous (i.e., primary production), active layer, terrestrial vegetation and permafrost sources. The source apportionment model accounts for uncertainties in the sources (i.e., endmembers) and estimates the residual error for the model (Stock and Semmens, 2016b). We used a trophic discrimination factor (TDF) of zero assuming no discrimination (Stock and Semmens, 2016b) and sampling year (i.e., season) and river classes (e.g., tundra, headwater) as fixed effects for the model. The δ13C and Δ14C endmembers used were autochthonous (δ13C −32.6 ± 5.2 ‰, n= 157; Δ14C −43.2 ± 79 ‰, n= 79), active layer (δ13C −26.4 ± 0.8 ‰, n= 56; Δ14C −198 ± 148 ‰, n= 60), terrestrial vegetation (δ13C −27.7 ± 1.3 ‰, n= 94; Δ14C 97 ± 125‰, n= 58) and permafrost (δ13C −26.3 ± 0.7 ‰, n= 414; Δ14C −777 ± 106 ‰, n= 527) according to Behnke et al. (2023), Levin et al. (2013), Vonk et al. (2012), Wild et al. (2019) and Winterfeld et al. (2015). See further details about the endmembers in Appendix A2.
For the model prior, we used a Dirichlet distribution as an uninformative (on the simplex) prior. We used the model with a chain length of 300 000, burn-in period of 200 000 and thinning of 100. The model was run in R (R Core Team, 2020) with a package MixSIAR (Stock and Semmens, 2016a). To evaluate the model convergence, we used the Gelman–Rubin and Geweke diagnostics, as well as the deviance information criterion. We report results as a mean ± standard deviation.
2.6 Statistical analyses
We used linear regression to test how water temperature affects δ13C-POC and how carbon isotopes depict POC percent (POC-%) to better understand river carbon dynamics. Additionally, we used linear regression to relate spatial catchment characteristics to organic carbon concentrations in rivers. For the linear regression model of water temperature and δ13C-POC, δ13C-POC and POC-%, and Δ14C-POC and POC-%, we used a function lm. The same function was used for the linear regression of spatial parameters (slope and SOCC) and OC concentrations.
To test the difference in means in water chemistry parameters (water temperature, electrical conductivity – EC, pH and δ18O) and carbon data (POC, DOC, DIC, δ13C-OC, δ13C-DIC and Δ14C-POC) between seasons (freshet vs. summer) in the tributaries and the Kolyma mainstem, we used a paired t test. For the tributaries, n= 10 for each season for each parameter (except n= 8 for DIC and δ13C-DIC for summer), and for the Kolyma mainstem, n= 4 during freshet and n= 4 during summer for each parameter.
Additionally, we tested differences in the abovementioned carbon parameters between differently sized streams and rivers separately during freshet and summer using analysis of variance (ANOVA). We grouped the rivers into small (FPS1, FPS2, Y3, Y4), midsized (Panteleikha, Ambolikha, Sukharnaya, Filipovkaya) and large rivers (Malenki Annui, Bolshoi Annui, Kolyma mainstem). In the freshet, we analyzed small rivers n= 4, midsized rivers n= 4 and larger rivers n= 6 for each parameter, and for summer, n= 4 in small and midsized rivers and n= 6 in large rivers (except for DIC and δ13C-DIC, n= 3 for small and midsized rivers and n= 5 for large rivers). The significance level of all the statistical testing was 0.05. Testing was conducted in R (R Core Team, 2020). For further details on statistical methods, see Appendix A3.
Some of the Kolyma River mainstem data that we present here have already been reported in Keskitalo et al. (2022), including water chemistry, OC concentrations, and isotopes for organic and inorganic carbon (Tables A1, A2, A3).
3.1 Catchment characteristics and water chemistry
Tributary catchments ranged in size from < 1 to nearly 60 000 km2 (Table A1). Mean SOCC varied between 269 and 414 hg C m−2 with the highest SOCC in the floodplain streams (FPS1, FPS2) and lowest in the tundra river Sukharnaya (Table A1). The mean catchment slope ranged from 0.01 to 7∘ with the lowest slope in the floodplain streams and highest in the tundra river Malenki Annui (Table A1). Bolshoi Annui, Filipovkaya, Y3 and Y4 were largely covered by forest (55 %–74 %), while Sukharnaya and Malenki Annui showed the highest coverage of herbaceous vegetation (53 %–84 %; Fig. 1b, Table A2). The floodplain streams had the highest fraction of wetland coverage (76 %–80 %).
Surface water temperatures did not significantly differ between freshet and summer in the tributaries (p= 0.946) or in the Kolyma mainstem (p= 0.167) but showed a larger spatial variability during freshet (6.7 to 21 ∘C in tributaries; 7.2 to 18.0 ∘C in mainstem) compared to summer (8.5 to 17 ∘C in tributaries; 12.5 to 15.0 ∘C in mainstem; Fig. 2a, Table A6). The EC and water isotope (δ18O) signature were lower during freshet than summer in both the tributaries (p= < 0.001 and p= < 0.001, respectively) and the Kolyma mainstem (p= < 0.001 and p= 0.006, respectively; Tables 1, A2 and A6).
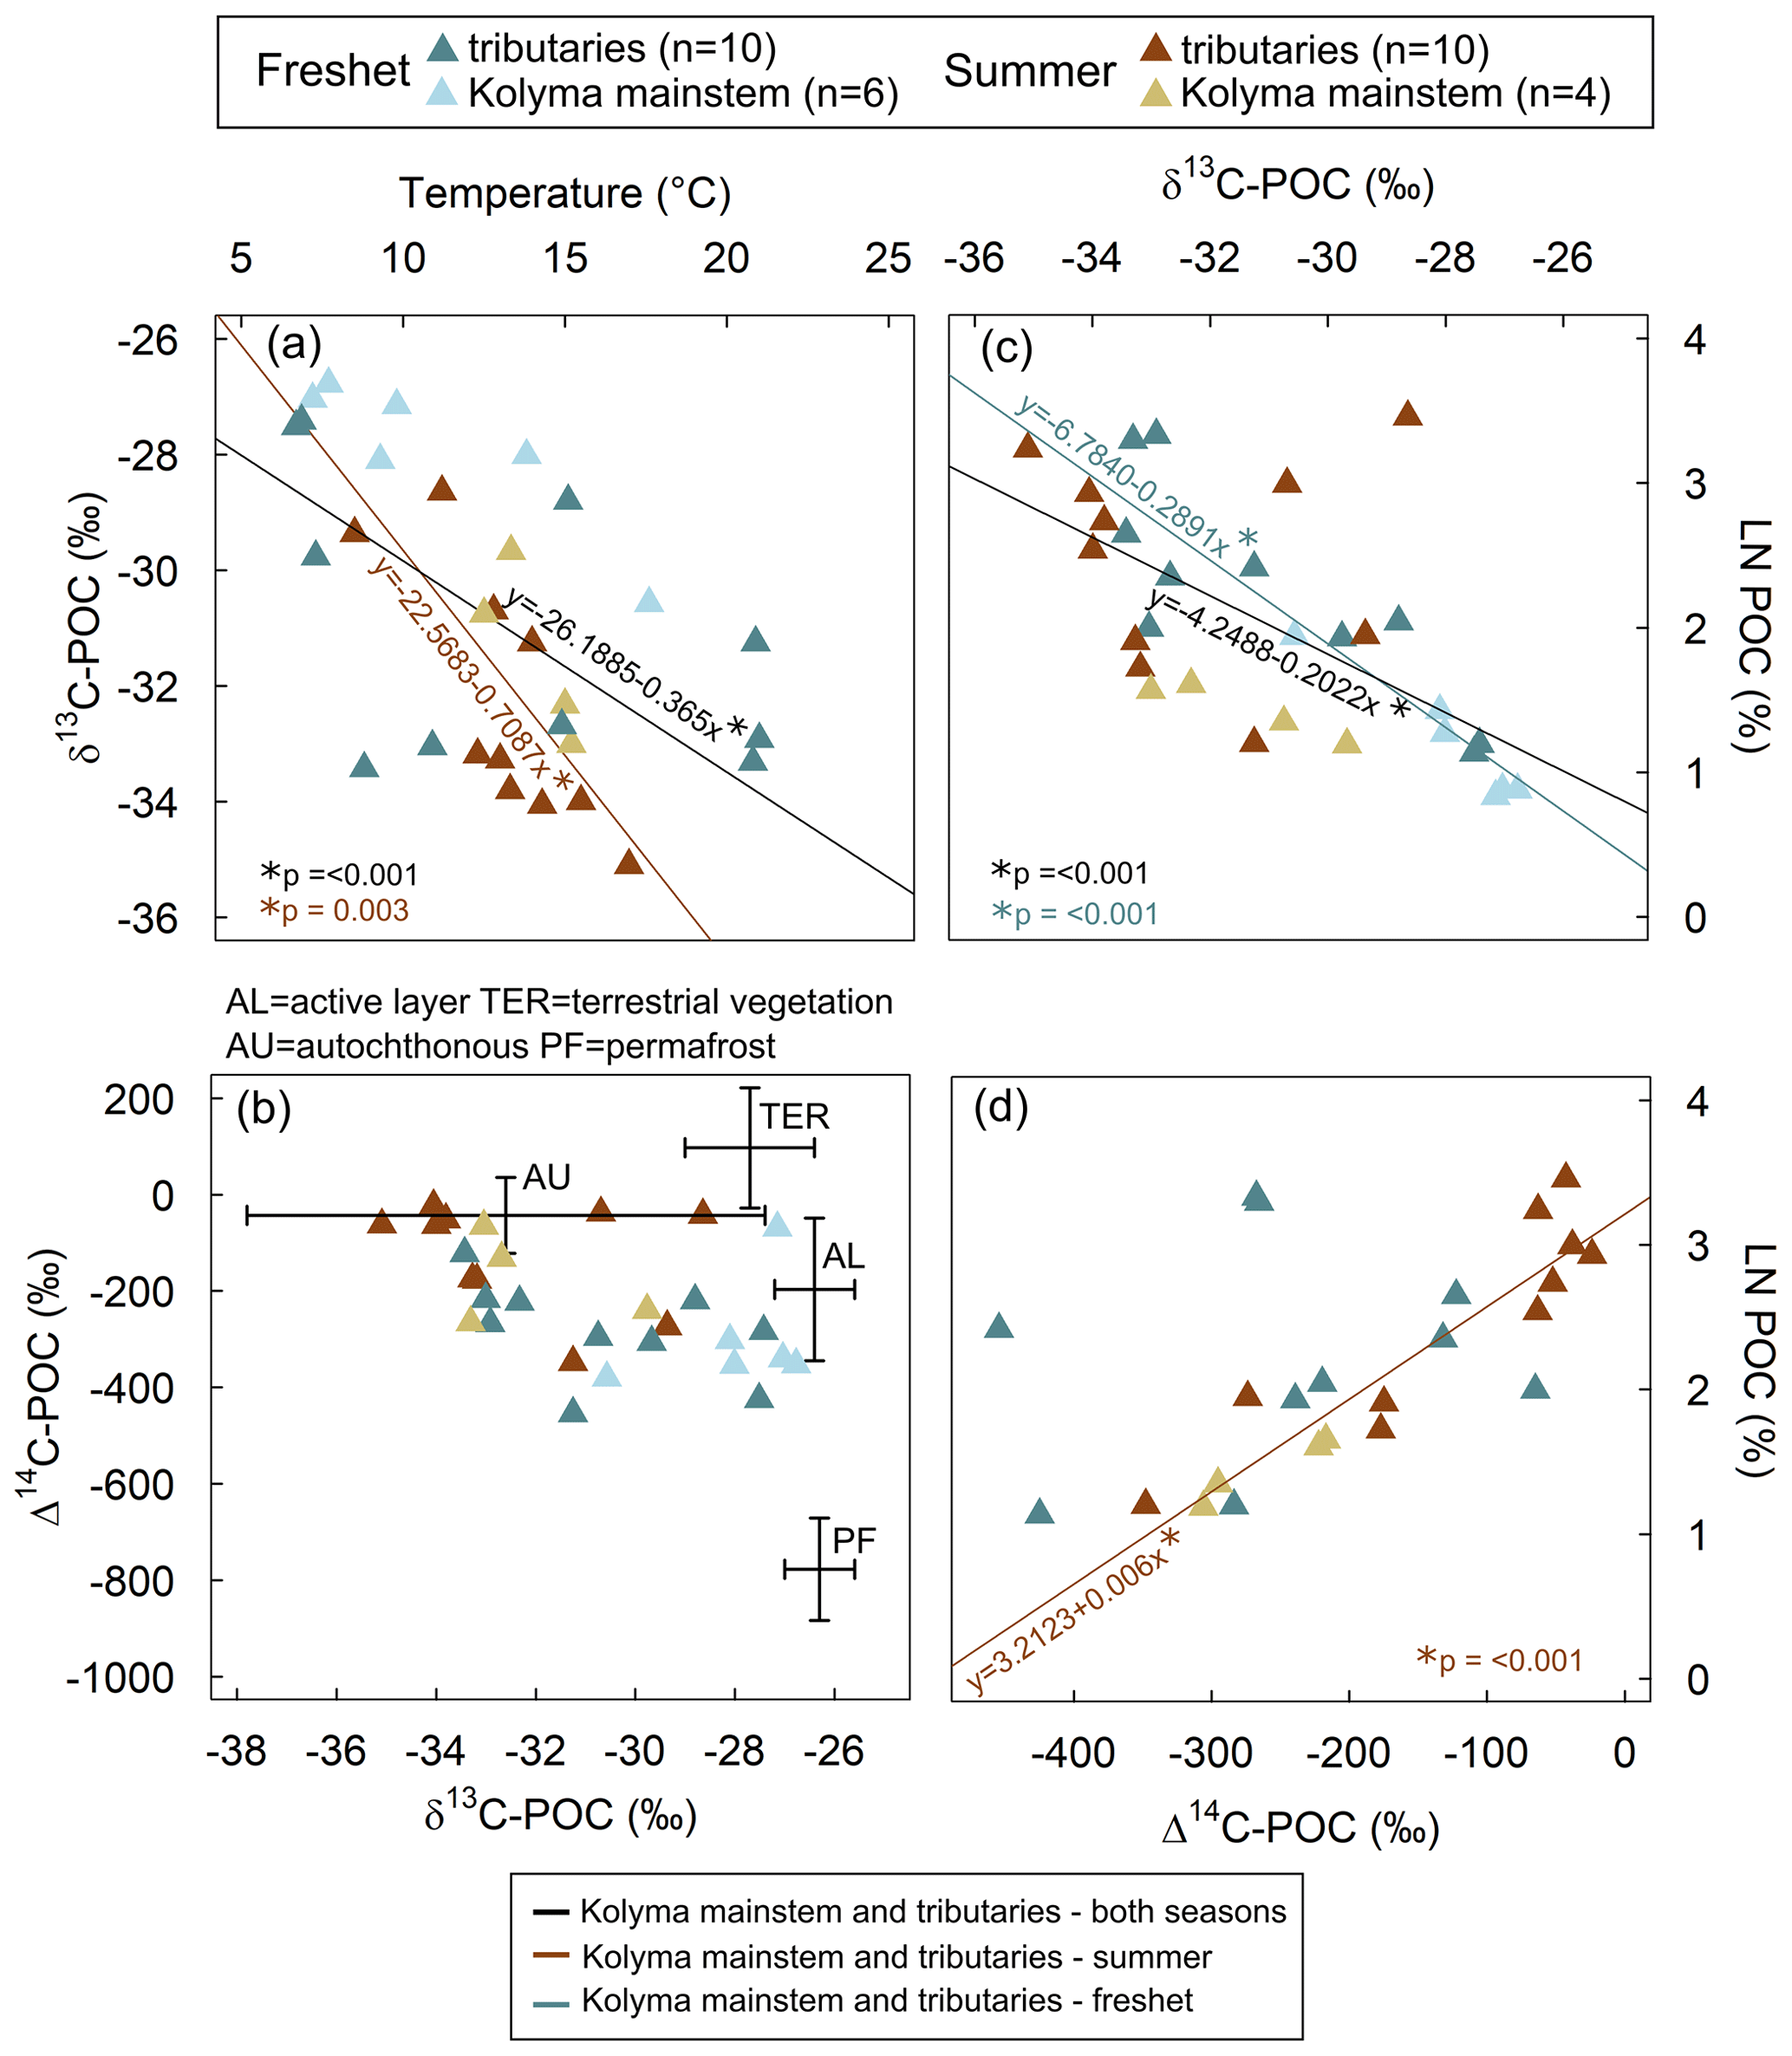
Figure 2(a) Surface water temperature and δ13C of particulate organic carbon (POC). The linear regression for tributaries and the Kolyma mainstem during both freshet and summer (R2= 0.33, 15.07, p= < 0.001; black line) and only during summer (R2= 0.49, 13.58, p= 0.003; brown line) was statistically significant, while for freshet or the Kolyma mainstem and the tributaries separately, it was not (not shown). (b) The Δ14C-POC and δ13C-POC. Endmembers are indicated with crossed lines: OC from the active layer (AL), terrestrial vegetation (TER), and autochthonous (AU) and permafrost (PF) sources. Endmembers are according to Behnke et al. (2023), Levin et al. (2013), Vonk et al. (2012), Wild et al. (2019) and Winterfeld et al. (2015). See Appendix A for more details about endmembers. (c) The δ13C-POC and natural logarithm (LN) of POC-% (amount of POC of total suspended solids). The linear regression for the Kolyma mainstem and tributaries (both freshet and summer, R2= 0.39, 19.36, p= < 0.001; black line) and separately for freshet (R2= 0.82, 67.57, p= < 0.001; blue line) was statistically significant. Linear regression for summer only or for tributaries and the Kolyma mainstem separately was not significant (not shown). (d) The Δ14C-POC as a function of LN POC-%. Linear regression for summer (both Kolyma mainstem and tributaries) was significant (R2= 0.85, 75.4, p= < 0.001; brown line). Linear regression for the Kolyma mainstem or tributaries separately was not significant (not shown). All panels include data from freshet (June 2019) and summer (July–August 2018) in the Kolyma River mainstem and its tributaries. Some of the Kolyma data have been previously reported in Keskitalo et al. (2022).
3.2 Total suspended solids, carbon concentrations and isotopes of carbon
3.2.1 Seasonal carbon patterns across the catchment
Concentrations of TSS were higher during freshet than summer at most sites, except at FPS1, FPS2 and Y3, but were not statistically significant (p= 0.1309; Tables 1, A6). Concentrations of POC and TPN largely followed the same trend (not statistically significant, p= 0.391 and p= 0.599, respectively; Table A6). In the Kolyma mainstem, POC concentrations were higher during freshet than summer (p= 0.049; Table A6), while TSS and TPN showed a similar pattern (not statistically significant, p= 0.09 and p= 0.06, respectively). In the tributaries, DOC concentrations did not differ between seasons (p= 0.153), while DIC concentrations were lower during freshet than summer (p= < 0.003; Table A6). In the Kolyma mainstem, DOC concentrations were higher during freshet than summer (p= 0.001), while DIC showed the opposite pattern (not statistically significant p= 0.08; Table A6). Of the total carbon pool (POC, DOC and DIC), POC was the smallest carbon fraction during both freshet and summer (Fig. 3, Table A7).
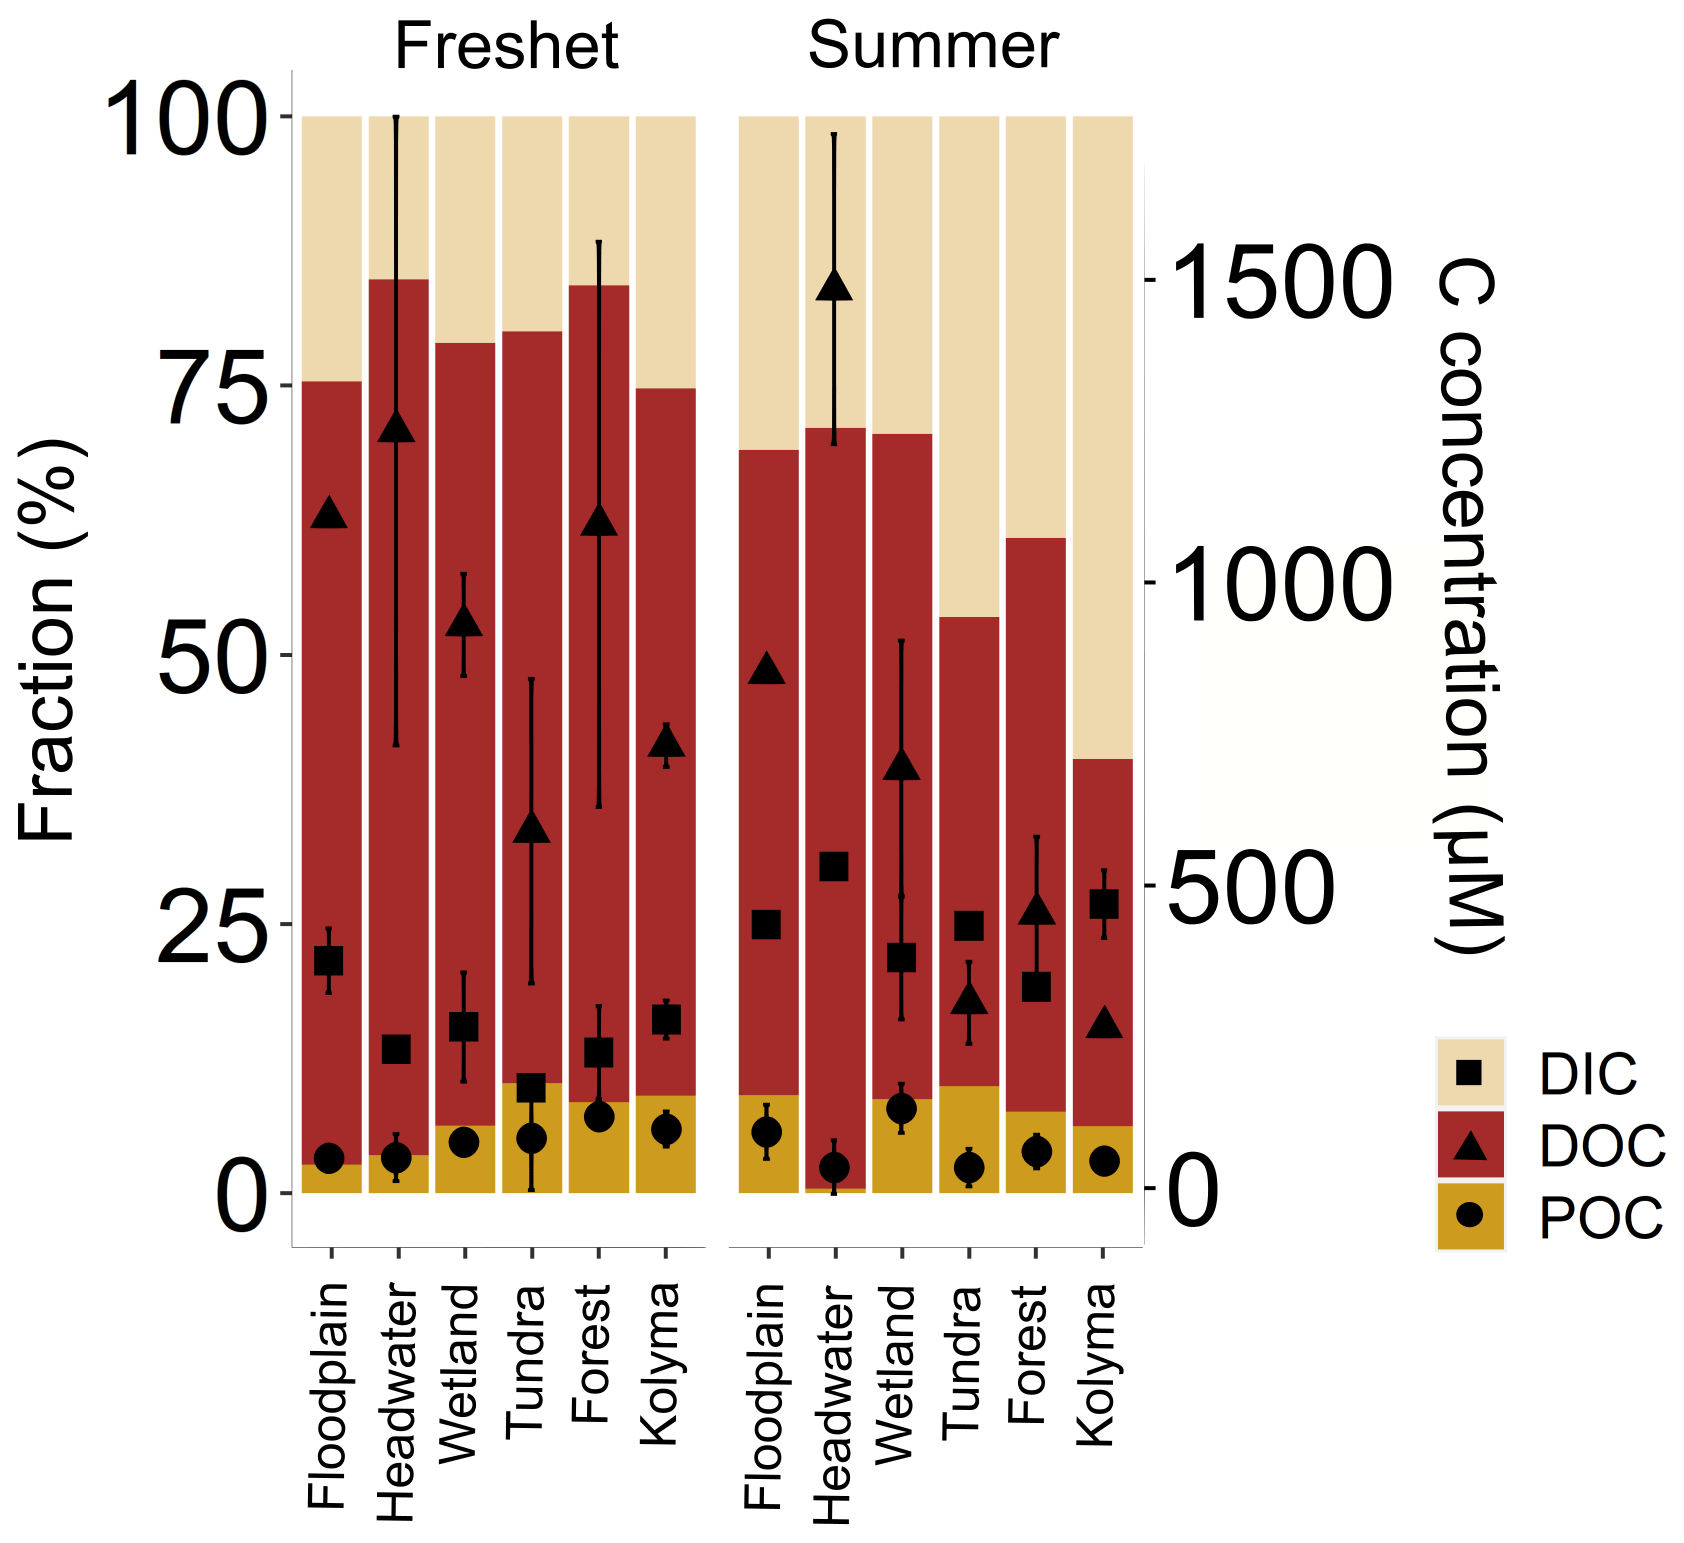
Figure 3Fraction (%) of different carbon pools: particulate and dissolved organic carbon (POC and DOC, respectively) and dissolved inorganic carbon (DIC) in the Kolyma River and its tributary rivers and streams during freshet (2019) and summer (2018). With the scale on the right-hand y axis, concentrations of the respective carbon pools are shown with square (DIC), triangle (DOC) and circle (POC) symbols with mean ± standard deviation between samples. The tributaries are grouped based on their land cover and size as follows (n= 2 per group per season except for the Kolyma mainstem n= 6 during freshet and n= 4 during summer): tundra – Sukharnaya and Malenki Annui; headwater (small forested watersheds) – Y3, Y4; floodplain – FPS1 and FPS2; wetland (influenced) – Ambolikha and Panteleikha; forest (larger forested watersheds) – Filipovkaya and Bolshoi Annui; Kolyma – Kolyma mainstem. The DIC concentrations were not measured for Sukharnaya and Y3 during summer.
In the tributaries, the δ13C-POC did not differ between seasons (p= 0.281), while δ13C-DOC values were higher during freshet than in summer (p= < 0.001; Table A6). In the Kolyma mainstem, both δ13C-POC (not statistically significant p= 0.05) and δ13C-DOC (p= 0.002; Table A6) showed higher values during freshet than summer. The Δ14C-POC values were lower (i.e., older) during freshet than summer in the tributaries (p= 0.026), while in the Kolyma mainstem the trend was similar but not statistically significant (p= 0.95; Fig. 2b, Table A6). While we did not measure Δ14C-DOC, we report previously unpublished data (May–October 2006–2011) at a floodplain stream (FPS) similar to FPS1 and FPS2, Y3, Y4, and Pantheleikha (Table A10) showing that all DOC is modern. The δ13C-DIC was lower during freshet than summer both in the tributaries (p= < 0.001) and in the Kolyma mainstem (p= 0.002; Table A6).
3.2.2 Carbon patterns between differently sized rivers during freshet and summer
During freshet, large rivers showed higher concentrations of TSS and POC and lower DOC than small ones (p= 0.001, p= 0.048 and p= 0.029, respectively), while TPN and DIC did not differ between differently sized rivers (Table A8). The POC-% (amount of OC of TSS) was higher in small and midsized rivers than large ones during freshet (p= 0.034 and 0.016, respectively) and summer (p= 0.016 and 0.048, respectively; Fig. 4, Table A8). In summer, DOC concentrations were higher in small rivers than in large ones (p= 0.029), while TSS and POC were lower (p= 0.001 and 0.048, respectively). TPN and DIC did not differ between differently sized rivers during summer (Table A8).
During freshet, small and midsized rivers showed lower δ13C-POC than large rivers (p= 0.03), while only midsized rivers also showed lower δ13C-DOC (p= 0.026; Table A8). During summer, the Δ14C-POC was higher (i.e., younger) in the small and midsized rivers than in the large ones (only significant for the small ones p= 0.044; Fig. 4). In summer, there was no significant difference in δ13C-OC and δ13C-DIC between differently sized rivers (Table A8).
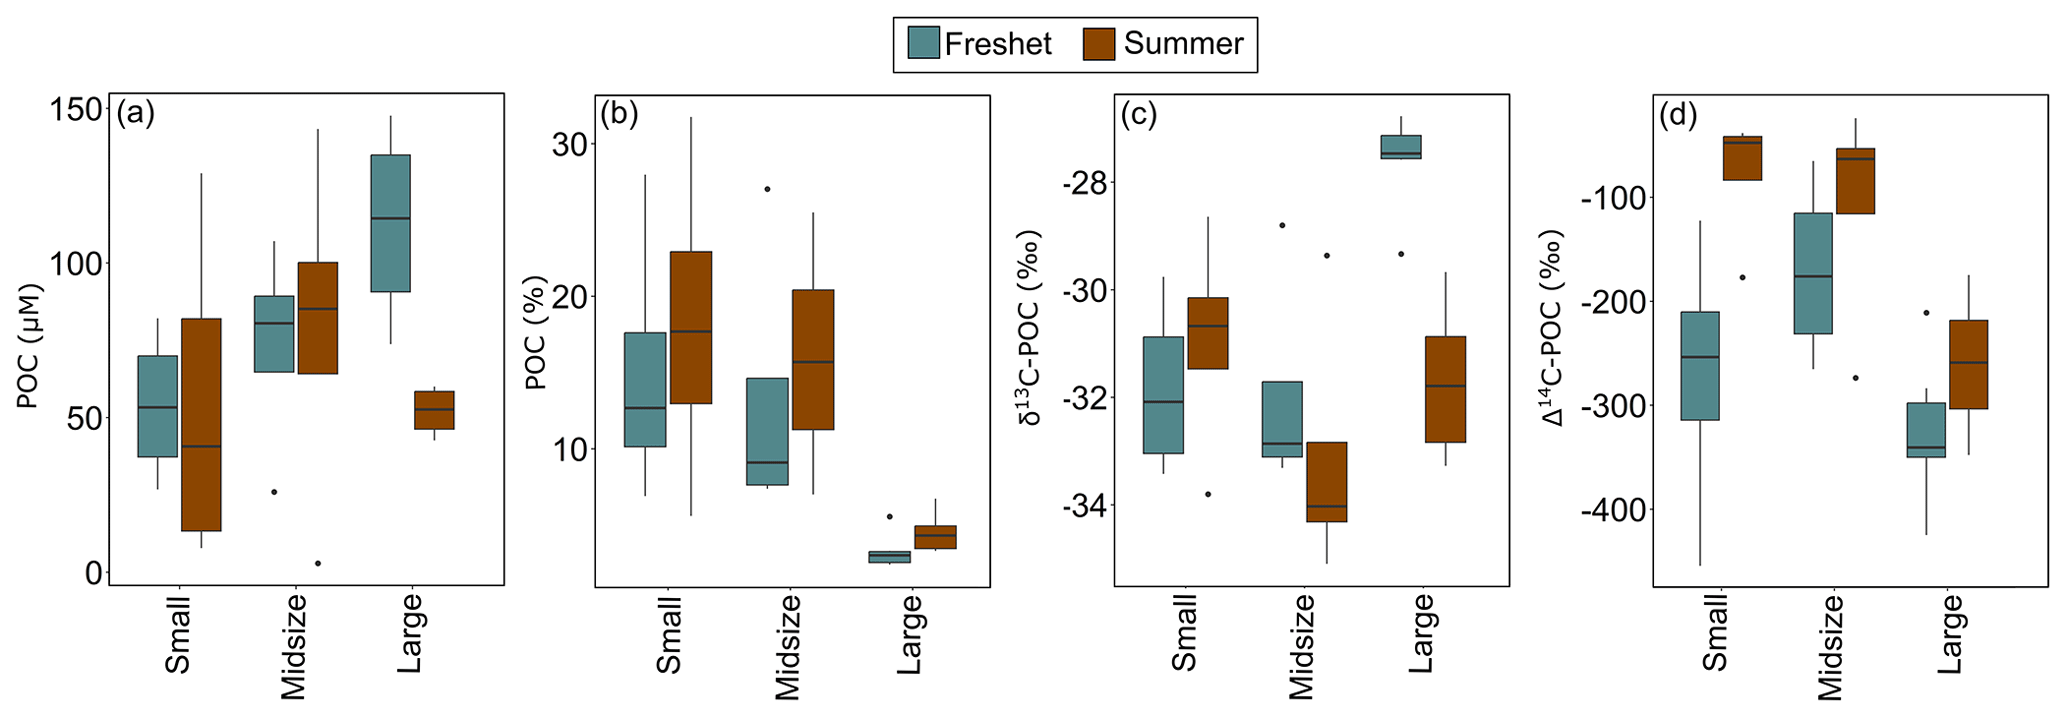
Figure 4Concentrations of particulate organic carbon (POC) in (a) micromolar concentration (µM; no statistically significant differences between different size groups) and (b) percent POC in small, midsized and large rivers during freshet and summer (small and midsized rivers were significantly different from the large rivers during both summer and freshet). The (c) δ13C-POC (small and midsized rivers were significantly different from large rivers during freshet) and (d) Δ14C-POC in small, midsized and large rivers during freshet and summer (small rivers were significantly different from large ones during summer). Boxplots show the median (line), interquartile range (the box) and minimum and maximum (whiskers). For small rivers n= 4, for midsized rivers n= 4 and for large rivers n= 6 per season. See Table A8 for analysis of variance (ANOVA) results regarding statistically significant differences between differently sized rivers.
Table 1Concentrations of total suspended solids (TSS), particulate and dissolved organic carbon (POC and DOC, respectively), and dissolved inorganic carbon (DIC) in the tributary streams and the Kolyma River during freshet (June 2019) and summer (July–August 2018). Watershed types (WST) are abbreviated as headwaters (H), floodplain (FP), wetland (W), tundra (T) and forest (F). Tributary streams are abbreviated as AMB – Ambolikha, SUK – Sukharnaya, PAN – Panteleikha, FIL – Filipovkaya, MAL – Malenki Annui and BOL – Bolshoi Annui. The Kolyma mainstem is abbreviated as KOL. Also shown are stable and radioisotopes of carbon – δ13C of POC, DOC and DIC and Δ14C-POC – and concentrations of total particulate nitrogen (TPN), the molar ratio of and water isotopes (δ18O). For DIC, δ13C-DIC, Δ14C-POC and water isotopes, the mean ± analytical standard deviation is shown. For the Kolyma River, the mean ± standard deviation between different sampling locations (freshet n= 6, summer n= 4) is indicated, including standard deviation between replicate samples (Table A2) and analytical uncertainties when applicable. Additionally, we show the mean (avg) ± standard deviation of all tributaries. Further information regarding the watersheds (e.g., size, land cover) is available in Appendix A. Note that NA stands for not available.
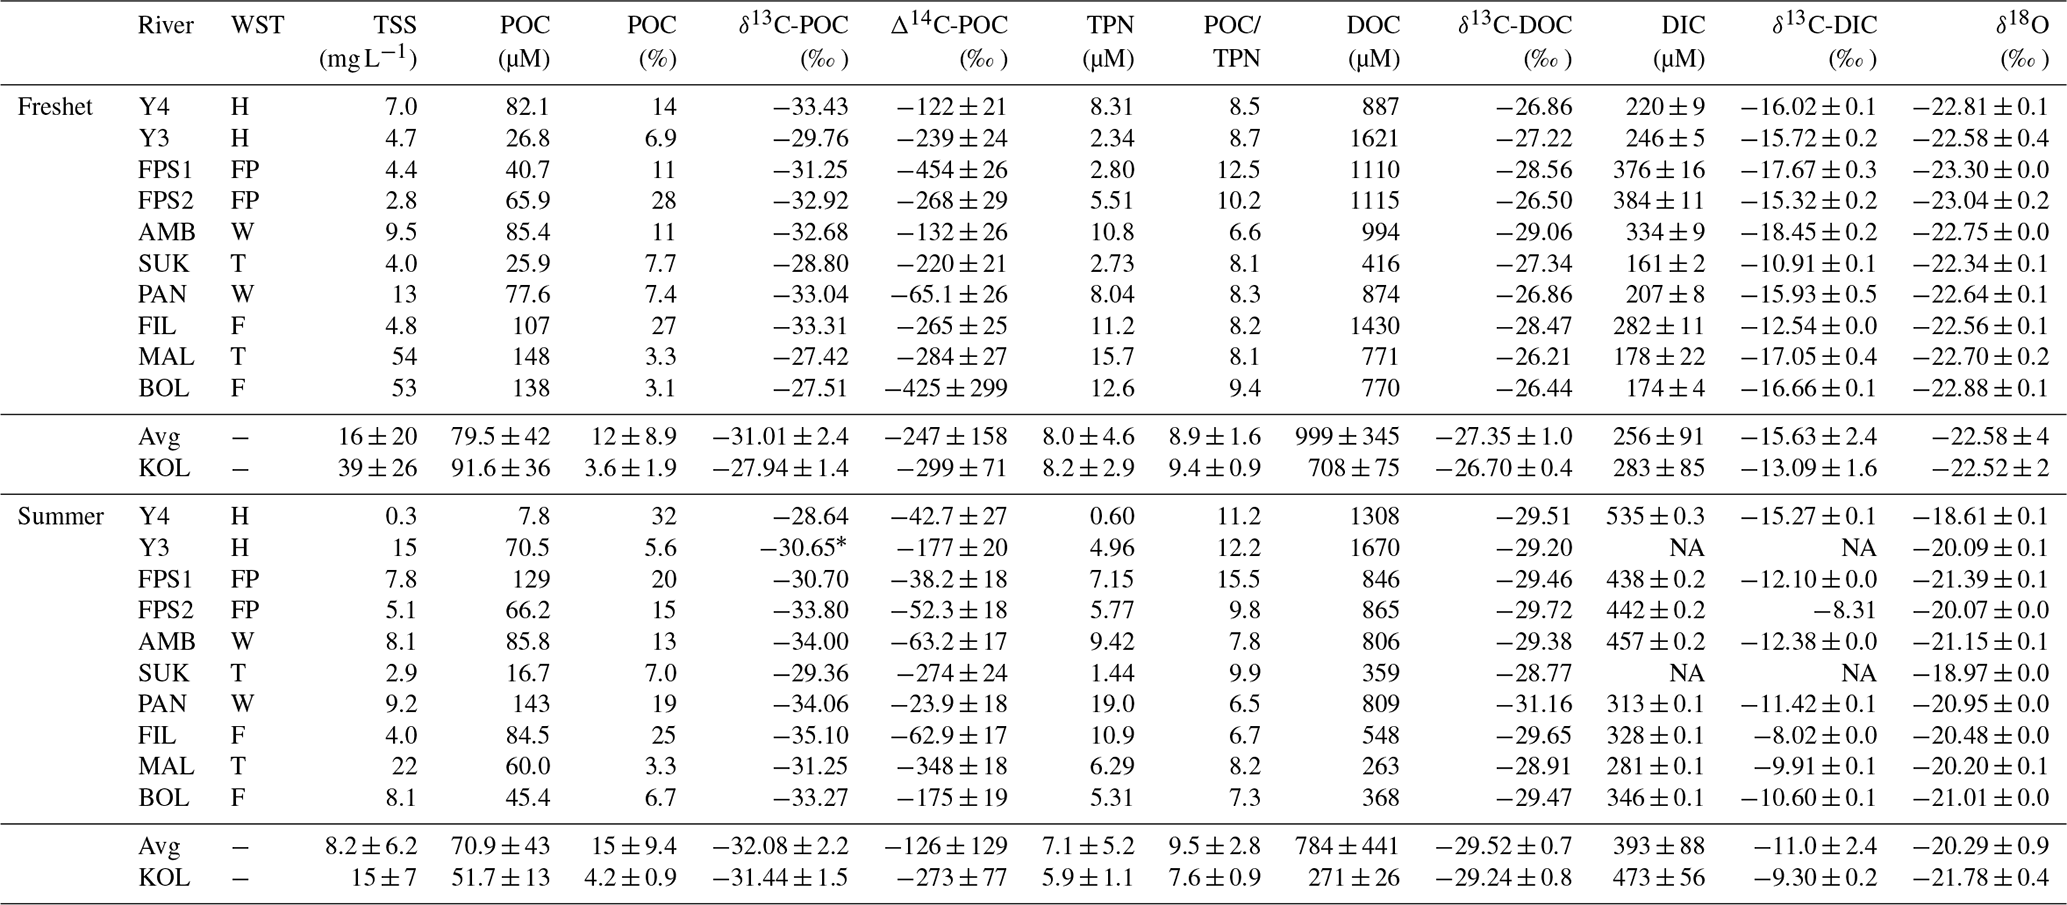
* Average of a tributary of Y3 and the Y3 mainstem upstream of the sampling site in 2018 as δ13C analysis at the sampling location was not successful.
3.3 Source apportionment
During both freshet and summer, POC was largely autochthonous in the tributaries (34 %–82 % and 56 %–92 %, respectively; Fig. 5, Table A11) and in the Kolyma mainstem (35 % and 59 %, respectively). Permafrost-derived POC was higher during freshet than summer at all sites (tributaries 8 %–33 % during freshet and 3 %–22 % during summer; mainstem 34 % during freshet and 22 % during summer). Contributions from active layer and terrestrial vegetation were the lowest to tributary POC (8 %–24 % and 4 %–10% during freshet, respectively; 3 %–16 % and 2 %–7 % during summer, respectively; Fig. 5). Similarly, active layer and terrestrial vegetation contributed least to the Kolyma POC during freshet (9 %–22 %) and summer (6 %–13 %; Table A11).
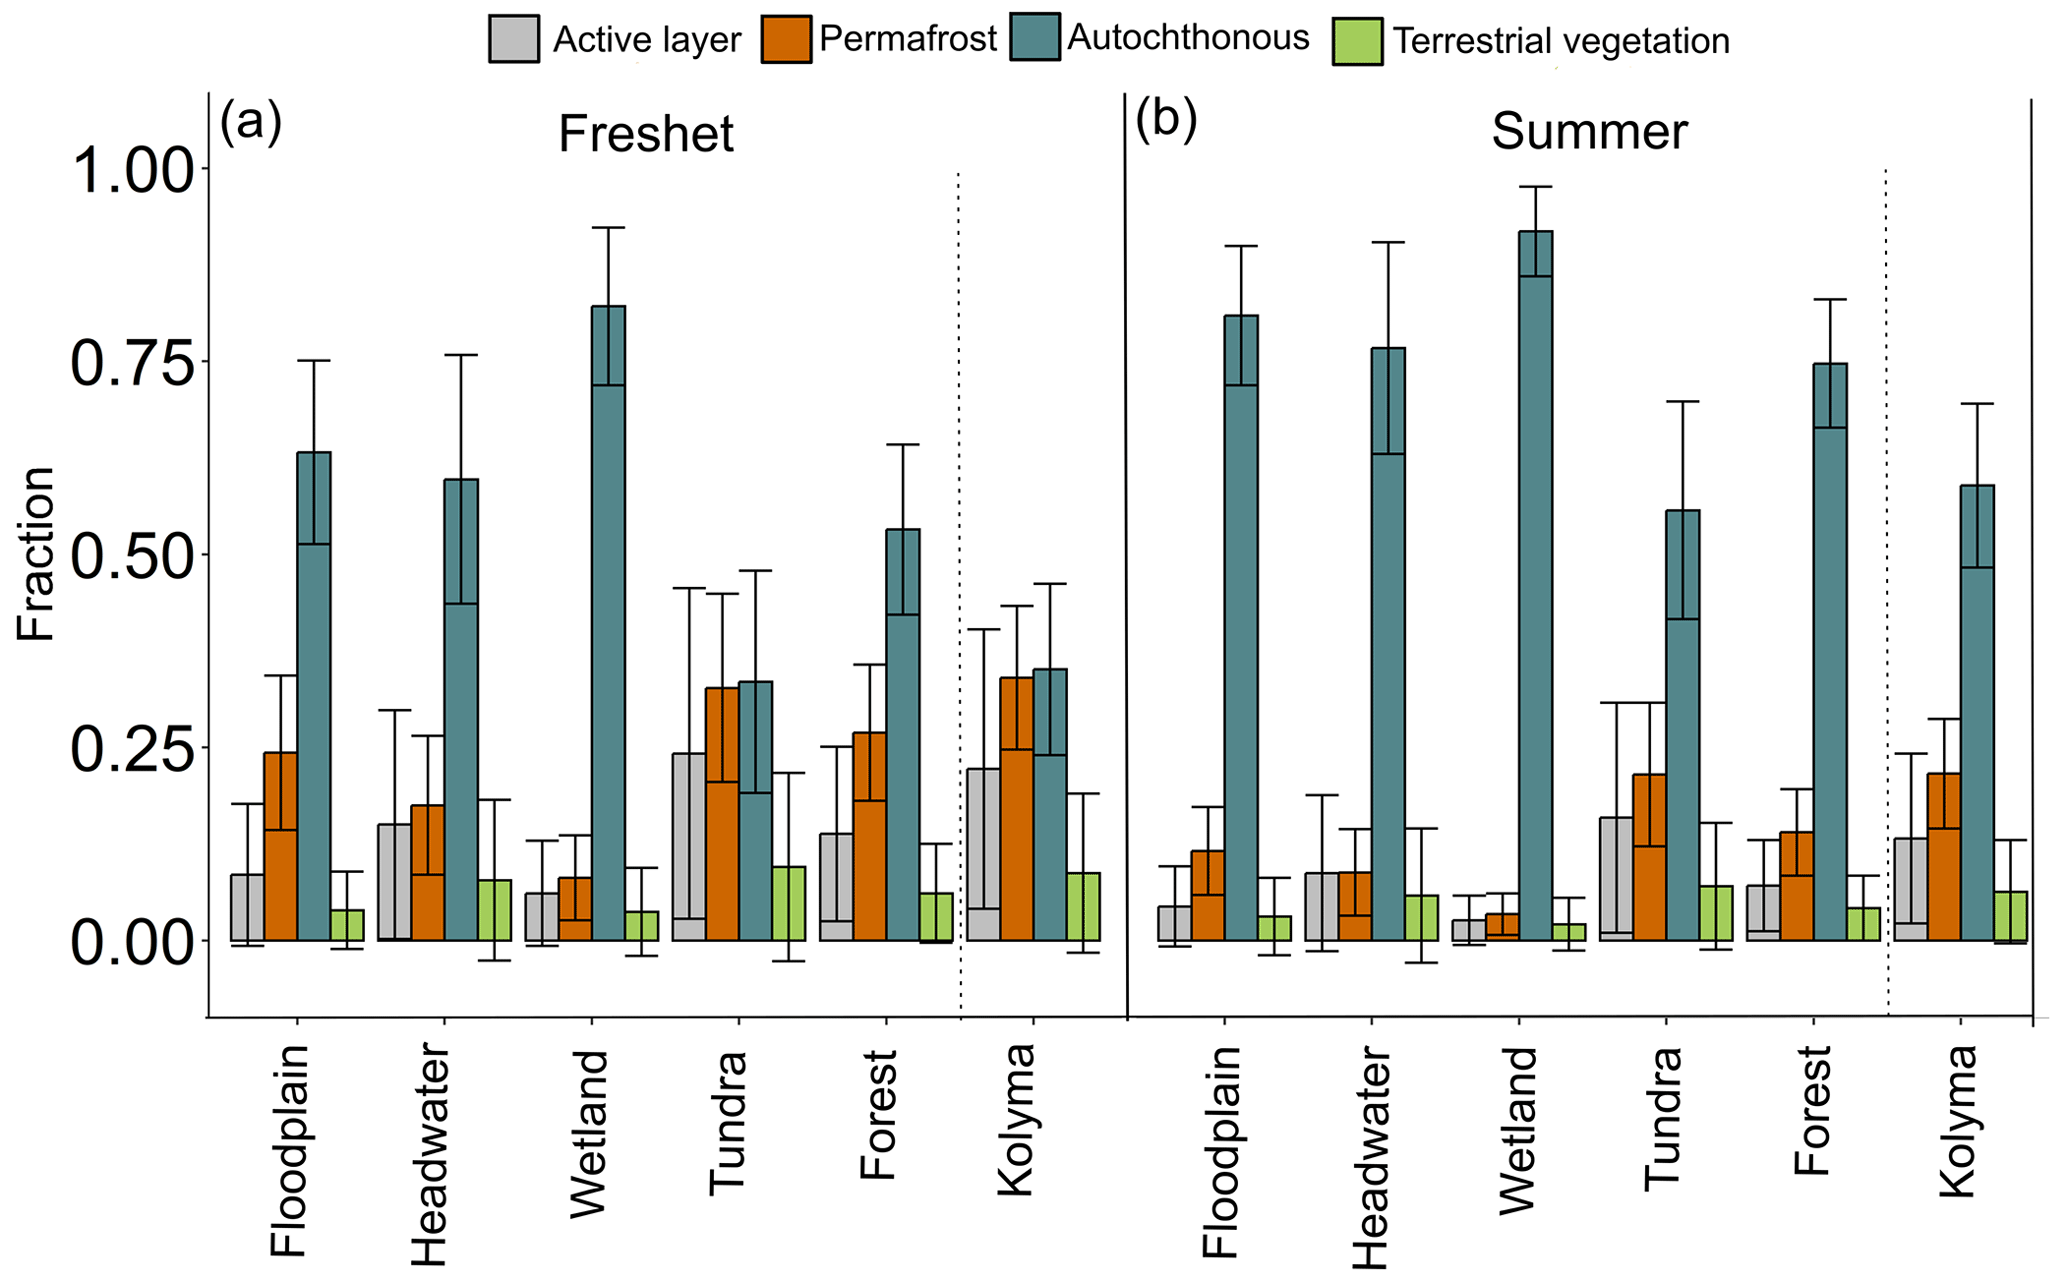
Figure 5Fraction of different particulate organic carbon (POC) sources (active layer, terrestrial vegetation, autochthonous and permafrost) according to Markov chain Monte Carlo source apportionment modeling using δ13C and Δ14C during (a) freshet and (b) summer. The dashed lines separate the Kolyma mainstem from the tributaries. For each catchment type (floodplain, headwater, wetland, tundra and forest) n= 2 for the number of tributaries per season, while for the Kolyma mainstem n= 6 during freshet and n= 4 during summer. The endmembers were according to Behnke et al. (2023), Levin et al. (2013), Vonk et al. (2012), Wild et al. (2019) and Winterfeld et al. (2015); see more information in Appendix A.
Our results show contrasting water chemistry and carbon dynamics between spring freshet and summer in the Kolyma River tributaries and mainstem, while the POC pool is mostly autochthonous in both the tributaries and the Kolyma mainstem during both seasons. Small and midsized rivers differ in their POC composition from large rivers with higher POC-% (freshet and summer), lower δ13C-POC (freshet) and higher Δ14C (summer).
4.1 Smaller tributary streams may start primary production earlier than larger rivers in the spring
In all tributaries and the Kolyma mainstem, the water isotope δ18O signature significantly differed between seasons (Table A6). Lower δ18O signal during freshet suggests that snowmelt was the dominant water source (Welp et al., 2005), supported by lower EC values (Table A6). However, water temperatures varied more within a season than between seasons both in the tributaries and in the Kolyma (Table A6). Air temperatures were particularly warm during freshet 2019 (see Fig. A2 for average air temperatures in 2007–2017), which was reflected as warm water temperatures especially in Filipovkaya and the floodplain streams (> 20 ∘C). These high temperatures likely promoted a rapid onset of autochthonous production as suggested by relatively low δ13C-POC (up to −33.43 ‰) for the season, combined with high POC-% (11 %–28 %, Fig. 2c). However, in tributaries Y4, Panteleikha and Ambolikha, low δ13C-POC had already occurred prior to the high air temperatures (Table A3), suggesting that other factors such as higher nutrient fluxes during freshet likely also play a role in inducing primary production (Harrison and Cota, 1991; Holmes et al., 2012; Mann et al., 2012). While the POC pool is dominated by autochthonous OC, it is likely that allochthonous OC is also present, as suggested by ratios (e.g., Meyers, 1994) and our source apportionment results (see Sect. 4.3 and Fig. 5). Water temperature explained 33 % of the variability in δ13C-POC overall (higher temperature indicating lower δ13C-POC), while during summer it explained ∼ 50 % of its variability (Fig. 2a), confirming that other factors affect δ13C-POC. Overall, freshet δ13C-POC was lower and POC-% higher in small and midsized rivers compared to the large ones (Fig. 4; Table A8), suggesting that river size may play a role in the timing for primary production onset during freshet. Higher input of (terrestrial) DOC (via degradation to inorganic carbon to be taken up by primary producers) and/or nutrients combined with shorter transport times may enhance primary production in smaller streams during freshet. In contrast, large rivers have longer transport times, and nutrients may already have been utilized (in headwaters) and terrestrially derived DOC degraded (Denfeld et al., 2013). Our POC data suggest that autochthonous production may start sooner in small and midsized tributaries than in large rivers during freshet.
4.2 Organic and inorganic carbon dynamics differ between the tributaries and the Kolyma River mainstem
4.2.1 Suspended matter dynamics
During freshet, mean concentrations of TSS and POC were higher in the large rivers than in the small tributary rivers (statistically significant only for TSS; Table A8) likely due to higher river power causing greater bank erosion (delivering sediment and POC) as well as higher turbulence promoting particle suspension (Striegl et al., 2007). Spatial characteristics such as catchment slope or SOCC did not show a linear relationship with summer POC, indicating that other factors, such as abrupt permafrost thaw, primary production and water temperature, likely play a more important role in driving POC concentrations (Fig. A3, Sect. 4.3). In the Kolyma, POC and δ13C-POC differed between seasons (significant only for POC), while in the tributaries there was no significant difference (Table A6). This likely suggests both local variability and stronger fluctuations in the tributaries that react faster to environmental changes such as high air temperatures.
4.2.2 Dissolved matter dynamics
Previous studies have shown that lower-order streams differ from the Kolyma River in their dissolved carbon concentrations and composition (Drake et al., 2018a; Mann et al., 2012; Rogers et al., 2021). Similarly, our results show that DOC concentrations were higher in the small tributaries than in the large ones during both freshet and summer, while δ13C-DOC differed only between midsized and large rivers during freshet (lower for midsized rivers; Table A8). In the tributaries, SOCC predicted nearly half of the variability in DOC concentrations during summer (Fig. A3). It has been shown that the majority of DOC in the Kolyma mainstem originates from modern vegetation rather than permafrost sources (Rogers et al., 2021), potentially due to rapid degradation of permafrost-derived DOC during transit from the headwaters (Mann et al., 2015). Similarly, the Δ14C-DOC shows a modern signal for FPS, Y4, Y3 and Panteleikha (Table A10), implying that small- and midsized-stream DOC is also predominantly modern.
In the tributaries, DIC and δ13C-DIC differed significantly between seasons (Table A6) and followed a previously reported trend in fluvial systems of lower concentrations and δ13C-DIC during freshet compared to summer (Campeau et al., 2017; Waldron et al., 2007). In the Kolyma, only δ13C-DIC was significantly lower during freshet than summer. Our Kolyma DIC concentrations were close to a previously reported concentration (Drake et al., 2018b), while δ13C-DIC values were ∼ 2 ‰ higher in our study. The higher DIC concentrations during summer may reflect an increase in leaching from the active layer and/or re-mineralization of DOC, while the higher δ13C-DIC suggests primary production and/or partial CO2 evasion, where part of the CO2 is likely sourced from degraded permafrost (Campeau et al., 2017; Drake et al., 2018b; Powers et al., 2017; Waldron et al., 2007). During freshet, DIC concentrations were higher in watersheds with higher water temperatures, a trend not observed during summer (Tables 1, A3). While higher temperatures may increase CO2 evasion and thus lower DIC concentrations (and increase δ13C-DIC) (Campeau et al., 2017), ongoing OC degradation and/or leaching of terrestrially derived DIC potentially keeps the concentrations high. The higher δ13C-DIC of the Kolyma mainstem, Sukharnaya and Filipovkaya suggests that they may be affected by CO2 evasion during turbulent freshet conditions. At Filipovkaya, these high ratios may be partially due to primary production (i.e., biological consumption of DIC) as the δ13C-POC is relatively low (Table 1). In headwater streams, contribution of OC mineralization to the DIC pool has been suggested to be negligible relative to terrestrial input (Winterdahl et al., 2016). Smaller streams have been shown to evade more CO2 to the atmosphere than larger rivers during summer, thus suggesting that CO2 evasion from smaller streams is mainly driven by hydrological flow paths and terrestrial OC, while in the larger rivers autochthonous production dominates as a CO2 sink (Denfeld et al., 2013). Finally, weathering, dominated by carbonates and silicates in the Kolyma watershed, may add to the DIC concentrations (Tank et al., 2012).
4.3 The importance of autochthonous production: riverine POC dominates in the tributaries
Tributary POC is mostly autochthonous during both freshet (58 ± 33 %) and summer (76 ± 27 %), indicating high primary production, especially in summer (Fig. 5), supported by a higher OC percentage (OC-%) in small and midsized tributaries (6.9 %–20 % and 5.6 %–32 %, respectively) than in the large rivers (∼ 3 % and 3 %–7 %, respectively; Table A8). The Δ14C-POC was significantly higher (i.e., younger) in tributaries during summer than freshet, likely due to higher primary production, while in the Kolyma, Δ14C-POC did not significantly differ between seasons as shown previously (Bröder et al., 2020; McClelland et al., 2016). Filipovkaya and the floodplain streams (FPS1, FPS2) showed relatively low Δ14C-POC combined with high POC-% and low δ13C-POC (Fig. 2c–d), suggesting incorporation of old CO2 into biomass, likely originating from rapid degradation of permafrost-derived DOC (Drake et al., 2018b). The permafrost fraction was relatively low during summer due to the dominance of primary production (Behnke et al., 2023), which was particularly pronounced in the smaller waterways (Fig. 5).
In an earlier incubation study, we showed that riverine-produced POC (with low δ13C-POC) in Kolyma summer waters degrades rapidly (degradation constant k= −0.026 d−1), while terrestrially produced POC in freshet waters did not show OC loss (Keskitalo et al., 2022). Furthermore, we showed that a lower initial δ13C-POC corresponded to a higher POC loss. Therefore, the low δ13C-POC of small and midsized streams during freshet suggests that POC may be prone to degradation, while POC degradation in the Kolyma likely lags behind as it is still dominated by terrestrially derived POC. While warmer water temperatures have been shown to increase microbial degradation at a similar rate to primary production, additional supply of terrestrial OC may increase degradation rates, resulting in higher CO2 emissions (Demars et al., 2016). Furthermore, Denfeld et al. (2013) have shown that leaching of terrestrial DOC and permafrost carbon may fuel stronger degradation of OC in the smaller streams than in the larger ones (Denfeld et al., 2013).
While larger rivers may be able to emit more greenhouse gases than smaller ones given their size, smaller rivers and streams play an important role in CO2 evasion (Denfeld et al., 2013). Smaller waterways have been shown to convey more allochthonous OC-derived CO2 emissions than larger rivers (Hotchkiss et al., 2015). With the predicted earlier onset of freshet and warmer temperatures occurring earlier in the season in the future (Meredith et al., 2019; Stadnyk et al., 2021) (i.e., creating more favorable conditions for both primary production and OC degradation), lower-order streams will largely fix CO2 (by primary producers) but could also potentially increase CO2 evasion via degradation of autochthonous POC that likely comprises a fraction of old permafrost OC taken up by primary producers (Drake et al., 2018b). Furthermore, degradation of autochthonous POC may enhance degradation of allochthonous OC via priming effects (Hotchkiss et al., 2014). This may be particularly relevant in the Arctic, where the high proportion of allochthonous permafrost OC present during freshet could be susceptible to decomposition (Fig. 5). However, further studies are needed to decipher whether this has implications for CO2 emissions at the whole-system level. Furthermore, smaller rivers may transport permafrost carbon, in the form of aquatic biomass, downstream, where its signal is mixed with modern OC sources and is not detectable anymore (Drake et al., 2018b). Understanding the dynamics of smaller rivers and streams is important given that river size may affect their response to environmental drivers (Battin et al., 2023). On the whole, the intensification of hydrological cycling could mean that in the future, processes currently happening in lower-order streams may shift towards larger fluvial systems.
Here, we present seasonal contrasts, including the hydrologically important spring freshet period, in water chemistry and carbon characteristics of lower-order streams and the Kolyma mainstem. During freshet small and midsized streams and rivers are more dynamic and seem to respond faster to environmental changes such as air temperature increases. While POC concentrations did not significantly differ between large and small/midsized rivers during freshet, the composition of POC showed clear differences: the δ13C-POC was lower and POC-% higher in small and midsized streams and rivers than in large ones, indicating an early onset of primary production in these lower-order streams. This will result in uptake of CO2 by primary producers; however, it may also fuel CO2 evasion via degradation of autochthonous POC if partly comprised of allochthonous/permafrost OC (when terrestrially derived CO2 is fixed by primary producers) and/or via priming degradation of allochthonous OC. Further studies are needed to discern implications for CO2 uptake and emission balance on a system level. Furthermore, hydrological intensification may increase the shunting and shift decomposition of organic matter from smaller to larger river systems and transport permafrost-derived OC downstream in the form of autochthonous POC. An increased understanding of the carbon and water chemistry of lower-order streams and their linkages to hydrology is therefore crucial to understanding catchment-wide OC dynamics.
A1 Representativeness of surface water samples
As all our samples were of surface water, we compared our Kolyma River δ13C-POC data to the Arctic Great Rivers Observatory (Arctic-GRO) to assess how our surface water samples would compare to depth-integrated sampling (data and sampling protocol are available at https://arcticgreatrivers.org/data/, last access: 10 May 2023, water quality) that has been carried out since 2003 in the Kolyma River mainstem. All the water samples collected during 2003–2011 (programs PARTNERS, ARCTIC-GRO I) were depth-integrated, while samples collected between 2012 and 2021 (programs ARCTIC-GRO II–IV; data from 2020–2021 are provisional) are a combination of samples collected from the surface and at depth (sampled at depths of 4–15 m). The Arctic-GRO average ± SD δ13C-POC for freshet (sampled in June 2004–2021) was −28.2 ± 1.4 ‰ (n= 19) and for summer (sampled in July–August 2003–2021) was −29.8 ± 2.1 ‰ (n= 19). In comparison, our Kolyma River mainstem δ13C-POC sampled during freshet (June 2019) was −27.94 ± 1.4 ‰ (n= 6) and in summer (July–August 2018) was −31.44 ± 1.5 ‰ (n= 4; Table A2). Given that our δ13C-POC signature falls within the standard deviation of the depth-integrated samples, we consider our samples to be sufficiently representative of the entire water column.
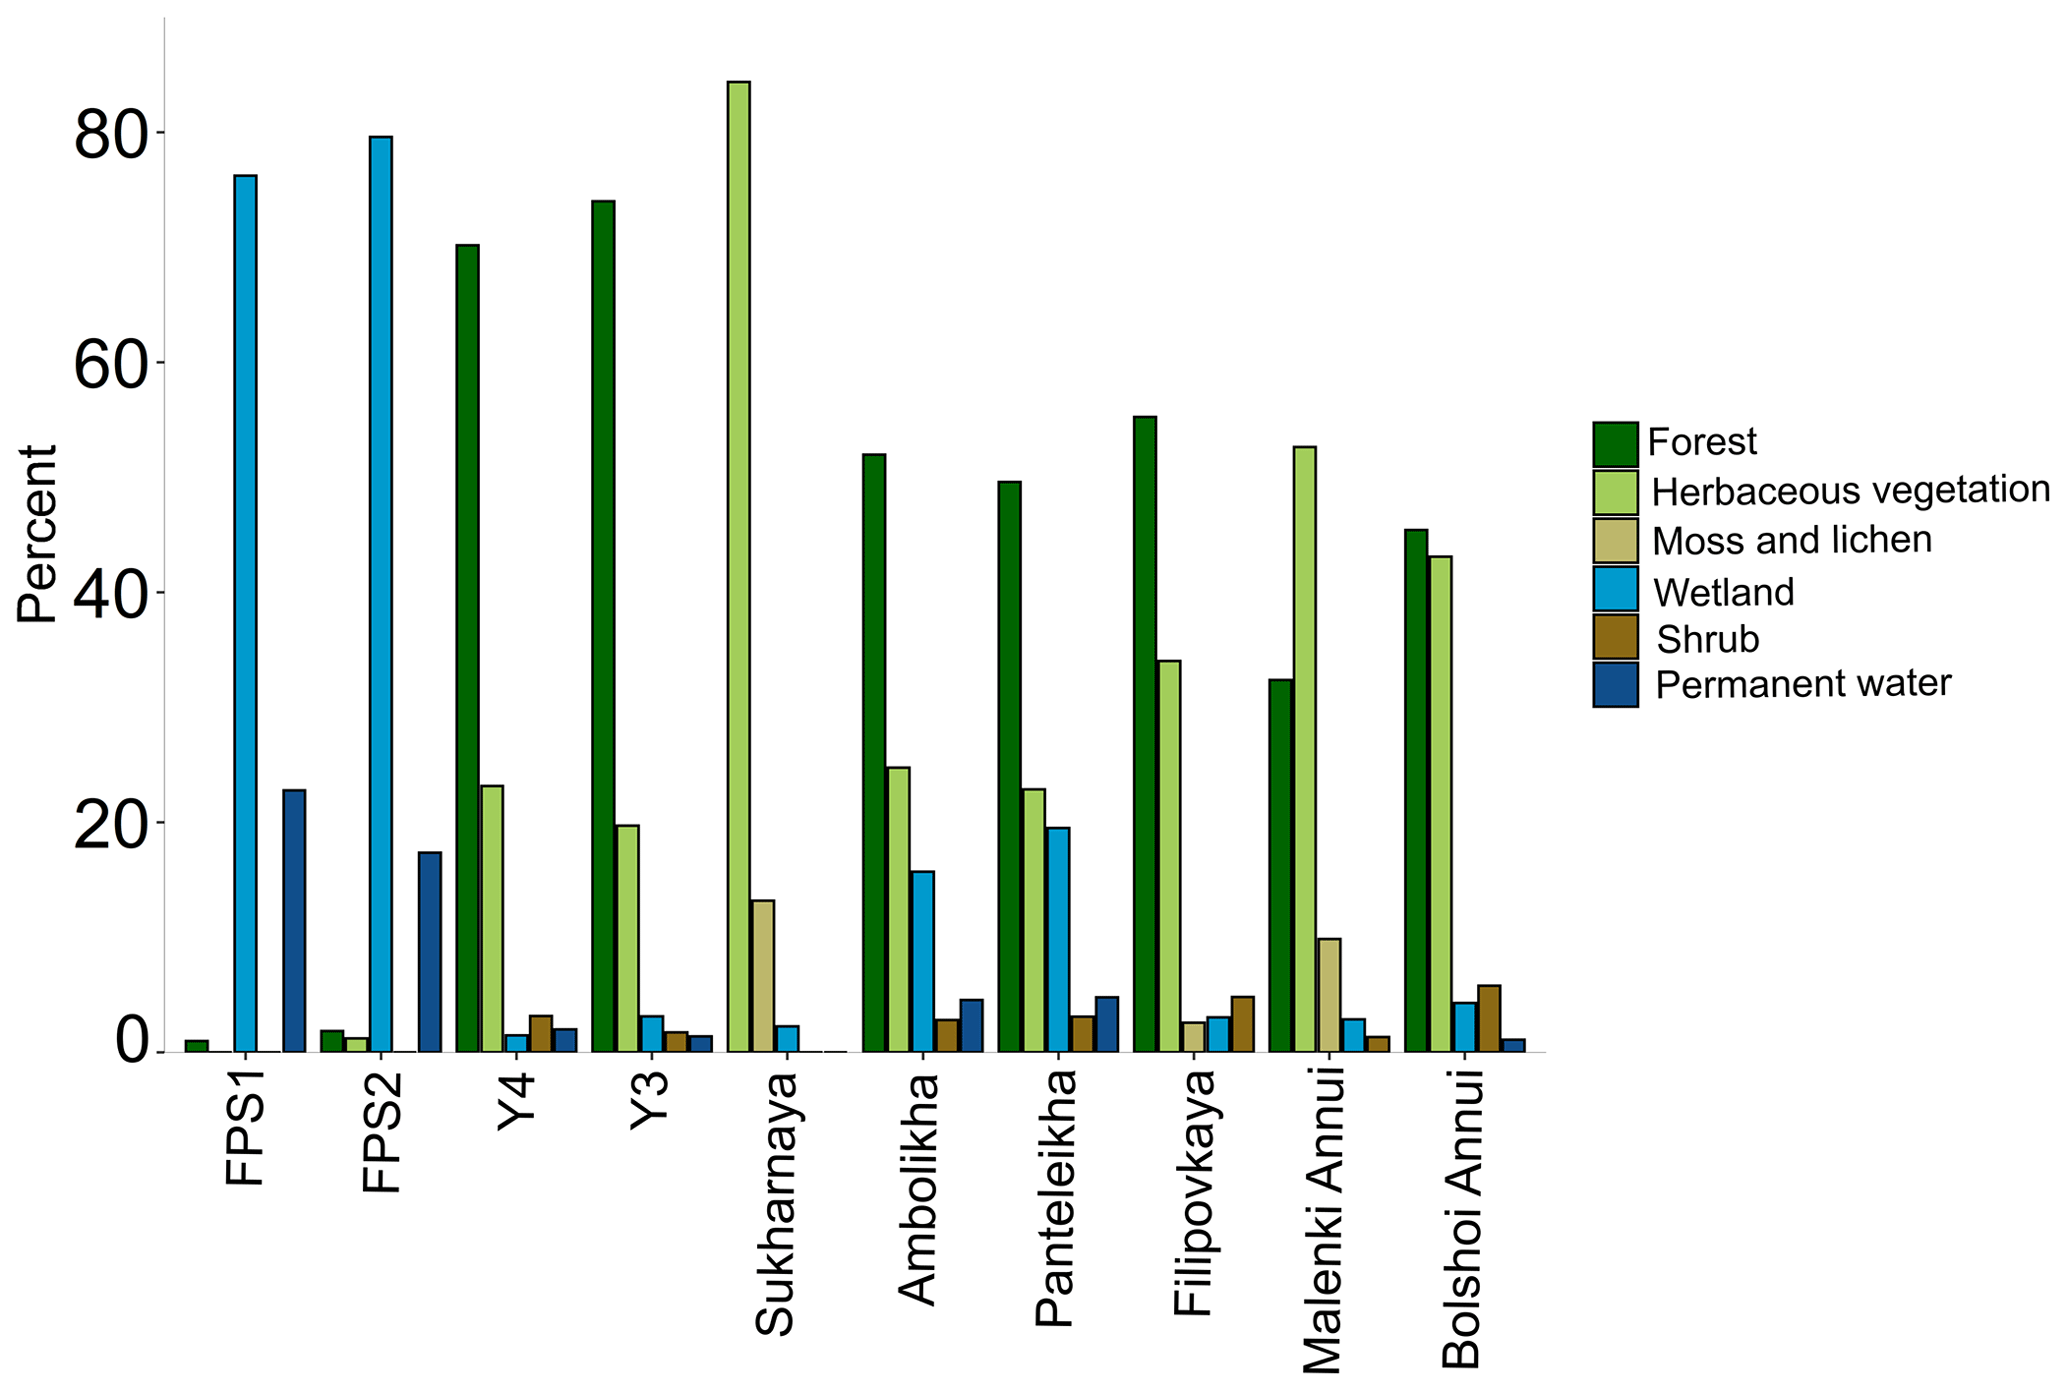
Figure A1Land cover of the tributary watersheds. The watersheds are organized by their size starting from the smallest (FPS1) on the left. The land cover types with < 1 % contribution are not included in the figure; see Table A5 for full land cover data.
A2 Endmembers for the source apportionment
The endmember for autochthonous POC was according to Wild et al. (2019; δ13C −30.6 ± 3 ‰, n= 24), Winterfeld et al. (2015; δ13C −30.5 ± 2.5 ‰, n= NA), Levin et al. (2013; Δ14C −39.6 ± 5.5 ‰, n= 73) and Behnke et al. (2023; δ13C −33.1 ± 4.7 ‰, Δ14C 106 ± 164 ‰) combined with our own POC sample collected at the Panteleikha River during an algal bloom in 2019 (Δ14C −26 ‰; δ13C −33.5‰, n= 1). The δ13C endmember values from Wild et al. (2019) and Winterfeld et al. (2015) are of riverine phytoplankton from the Ob and Yenisei rivers and from the Lena River, respectively, while the values from Levin et al. (2013) are of atmospheric CO2 (May–August 2009–2012). Endmember values from Behnke et al. (2023) are (mostly benthic) of biofilms, algae and invertebrates from Alaska, Canada and Svalbard. As our samples were of surface water, we combined the Δ14C of atmospheric CO2 from Levin et al. (2013) (following the approach used by Winterfeld et al., 2015, and Wild et al., 2019) with the Δ14C of biofilms, algae and invertebrates (following Behnke et al., 2023) as the autochthonous endmember. The autochthonous δ13C endmember was a compilation of phytoplankton (Winterfeld et al., 2015; Wild et al., 2019) and biofilms, algae and invertebrates (Behnke et al., 2023). For the active layer and terrestrial vegetation endmember, we used the endmembers compiled in Wild et al. (2019): endmember for the active layer (Δ14C −197.5 ± 148.4 ‰, n= 60; δ13C −26.4 ± 0.8 ‰, n= 56) and modern vegetation (Δ14C 97 ± 124.8 ‰, n= 58; δ13C −27.7 ± 1.3 ‰, n= 94). The active layer and terrestrial vegetation endmembers include data from Siberia, Alaska, northern Canada and Scandinavia. For the permafrost endmember, we combined the Yedoma Ice Complex (Δ14C −954.8 ± 65.8 ‰, n= 329) and Holocene permafrost (Δ14C −567.5 ± 156.7 ‰, n= 138) endmember from Wild et al. (2019) with the Holocene permafrost endmember from Winterfeld et al. (2015; Δ14C 282 ± 133 ‰, n= 60; δ13C −26.6 ± 1 ‰, n= 40) and Vonk et al. (2012; δ13C −26.3 ± 0.7 ‰, n= 374). All endmembers were weighted by the number of observations. We recognize that having robust endmember values is important for the best modeling results, and ideally these values would come from within or close to the studied system. While the permafrost, active layer and terrestrial vegetation endmembers are relatively well defined, the scientific literature lacks well-constrained autochthonous endmembers, especially for phytoplankton. Endmembers were recently discussed in Behnke et al. (2023).
A3 Statistical analyses – assumptions and hypotheses
For the linear regression model of water temperature and δ13C-POC, δ13C-POC and POC-%, and Δ14C-POC and POC-%, we used a function lm. The same function was used for the linear regression of spatial parameters (slope and soil organic carbon concentration – SOCC) and OC concentrations. The POC concentrations did not show a linear relationship with the spatial parameters; thus they were not modeled. We log-transformed the DOC data as well as the POC-% prior to executing the model. For all the linear regression models, we checked the assumptions of normality and homoscedasticity of the model residuals visually and using a Shapiro–Wilk test and a Breusch–Pagan test, respectively. The significance level of the test was 0.05.
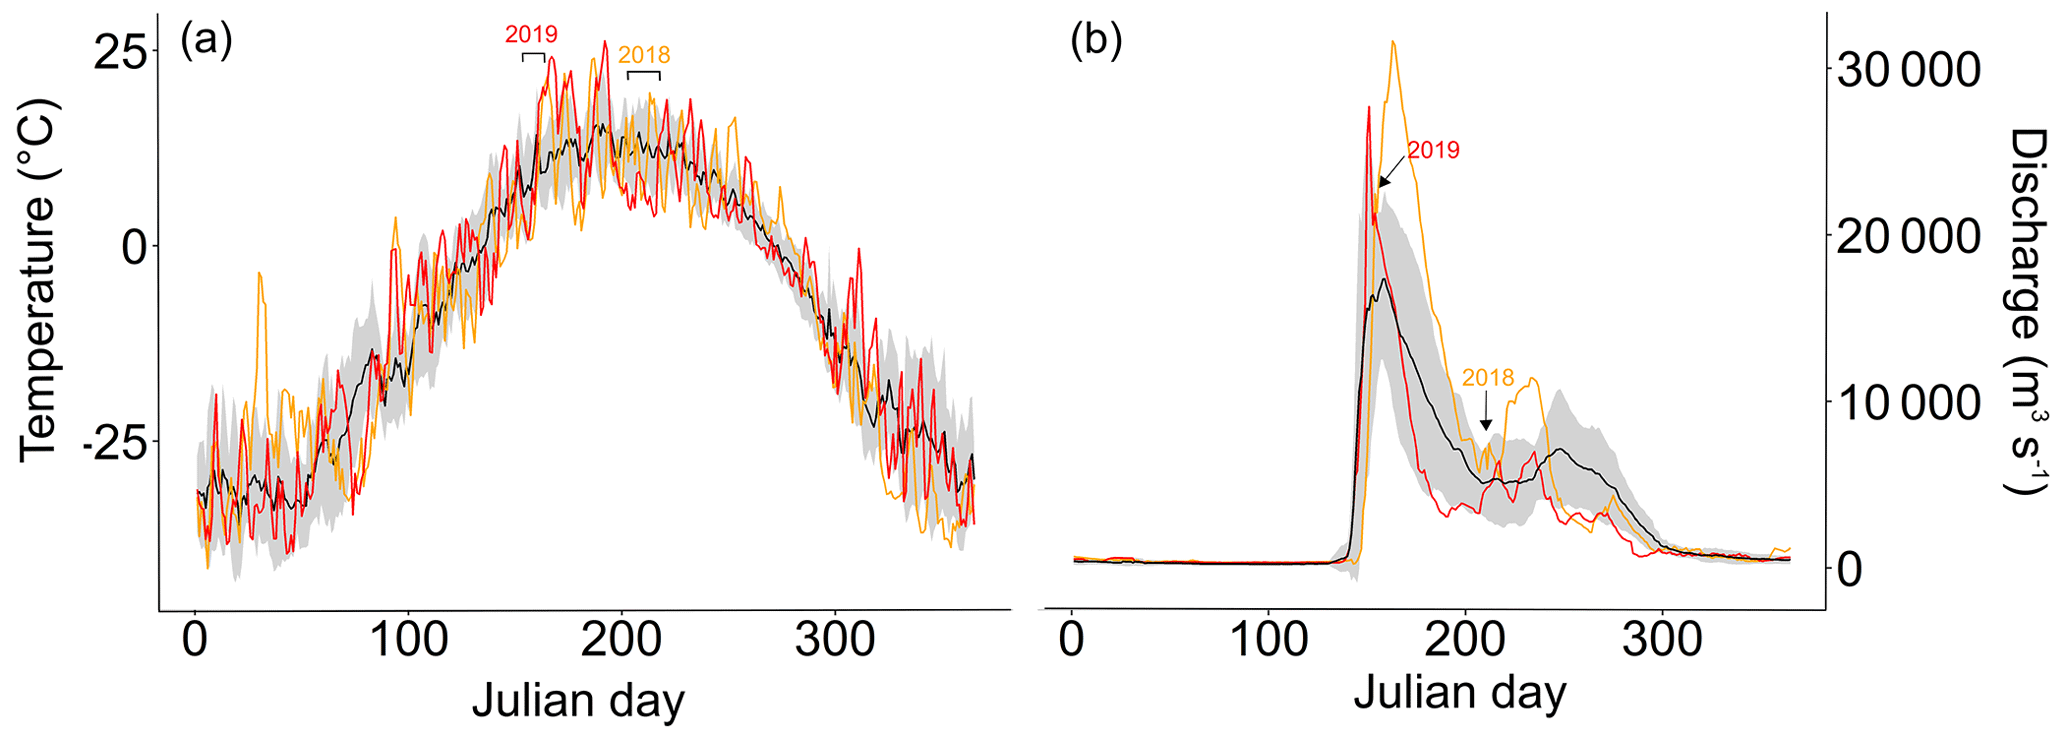
Figure A2(a) average air temperature ± standard deviation (black line ± grey background) 2007–2017 in Cherskiy with air temperatures during the sampling years 2018 (orange line) and 2019 (red line). The weather data were retrieved from the Cherskiy weather station. Timing of the sampling campaigns is marked above the plot. See Table S3 for air temperatures on sampling days. (b) The average ± standard deviation of discharge measured at Kolymskoye 2007–2017 (Shiklomanov et al., 2021). The red line shows the discharge of the year 2019 and orange line the year 2018. The timing of the sampling campaigns is marked with arrows above the plot.
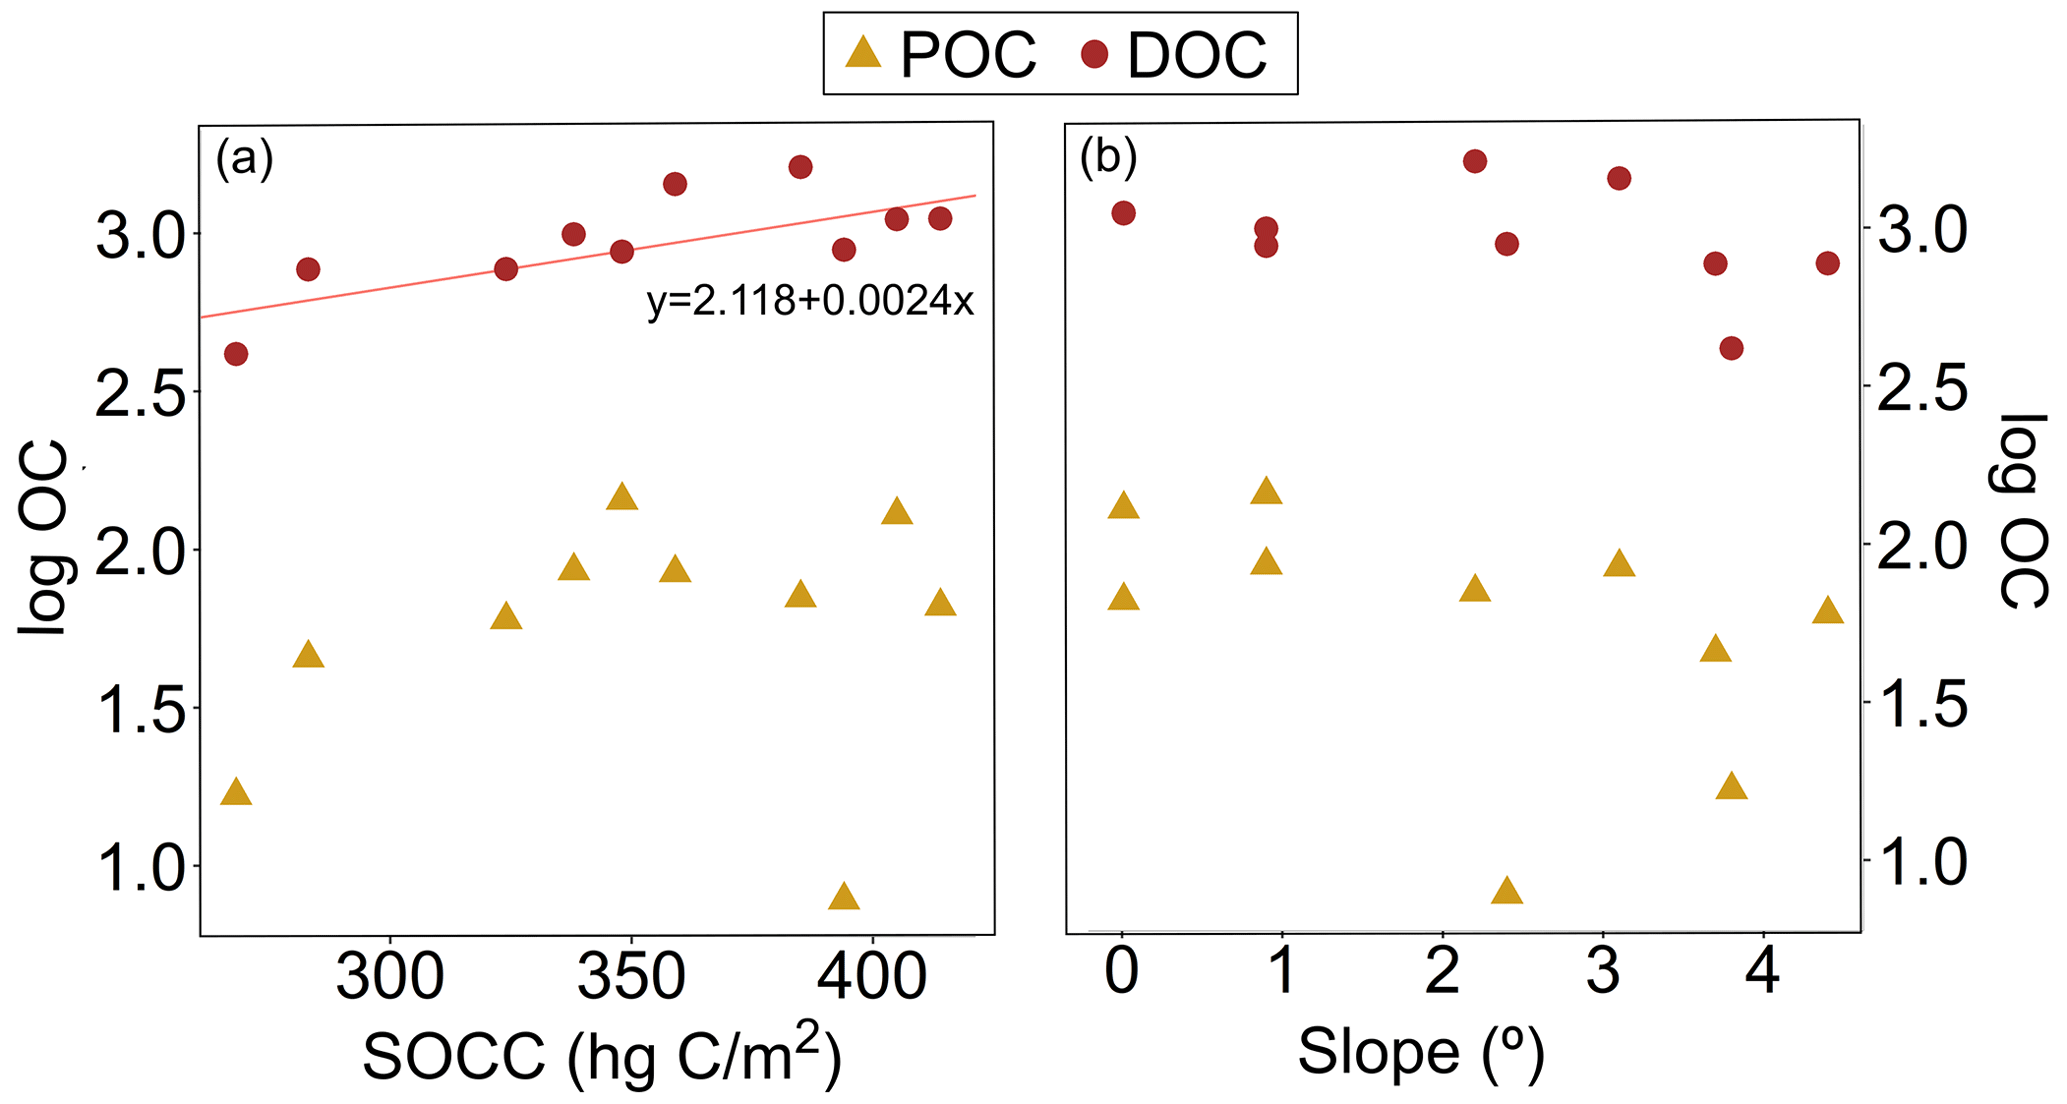
Figure A3(a) Particulate and dissolved organic carbon (POC and DOC, respectively) concentration (log) and soil organic carbon content (SOCC). The linear regression for DOC was statistically significant (R2= 0.49, 9.59, p= 0.001). (b) Concentrations (log) of POC and DOC against the median slope. The regression model did not show statistically significant results. All the organic carbon data are from the Kolyma River tributaries sampled during summer 2018.
To test the difference in means in water chemistry parameters (water temperature, electrical conductivity – EC, pH and δ18O) and carbon data (POC, DOC, DIC, δ13C-OC, δ13C-DIC and Δ14C-POC) between seasons (i.e., freshet and summer) in the tributaries and the Kolyma River, we used a paired t test (or Wilcoxon rank sum test if the assumptions for a paired t test were not met). For the tributaries, n= 10 for each season for each parameter except for DIC and δ13C-DIC with n= 8. For the Kolyma River mainstem, n= 4 for each season (for freshet an average of the replicate samples at sites K3 and K4 was used) except for DIC and δ13C-DIC with n= 3. Our H0 hypothesis was that the means are equal between seasons, and the H1 hypothesis was that the means are not equal. The test significance level was 0.05. We checked the normality of the differences using the Shapiro–Wilk test.
To test whether there was a significant difference between small streams, midsized rivers and large rivers regarding carbon parameters (POC, DOC, DIC, δ13C-OC, δ13C-DIC and Δ14C-POC), we used (one-way) analysis of variance (ANOVA) or a Kruskal–Wallis test (when assumptions for ANOVA were not met) for each season separately. The floodplain streams (FPS1 and FPS2), Y3 and Y4 were classed as small streams; Panteleikha, Ambolikha, Filipovkaya and Sukharnaya as midsized rivers; and Malenki Annui, Bolshoi Annui and the Kolyma mainstem as large rivers. For the small and midsized rivers during freshet, n= 4, while for large rivers n= 6 for each parameter. For the summer, n= 4 for each parameter in small and midsized rivers, and n= 6 in large rivers except for DIC and δ13C-DIC with n= 3 in small and midsized rivers and n= 5 in large rivers. We checked the assumptions of normality and equal variances visually and further with a Shapiro–Wilk test and Breusch–Pagan test, respectively. Our H0 hypothesis was that the means are equal between differently sized rivers/streams, and the H1 hypothesis was that the means are not all equal. With significant results, we used Tukey's test as a post hoc test for ANOVA and Dunn's test for the Kruskal–Wallis test. The significance level of all the tests was 0.05. All the statistical testing was executed in R (R Core Team, 2020).
Table A1Sampling coordinates and dates of the Kolyma tributaries and Kolyma mainstem during spring freshet (2019) and summer (2018) sampling campaigns. Data from sites KOL1–KOL4 during freshet and KOL1–KOL3 during summer were previously reported in Keskitalo et al. (2022).
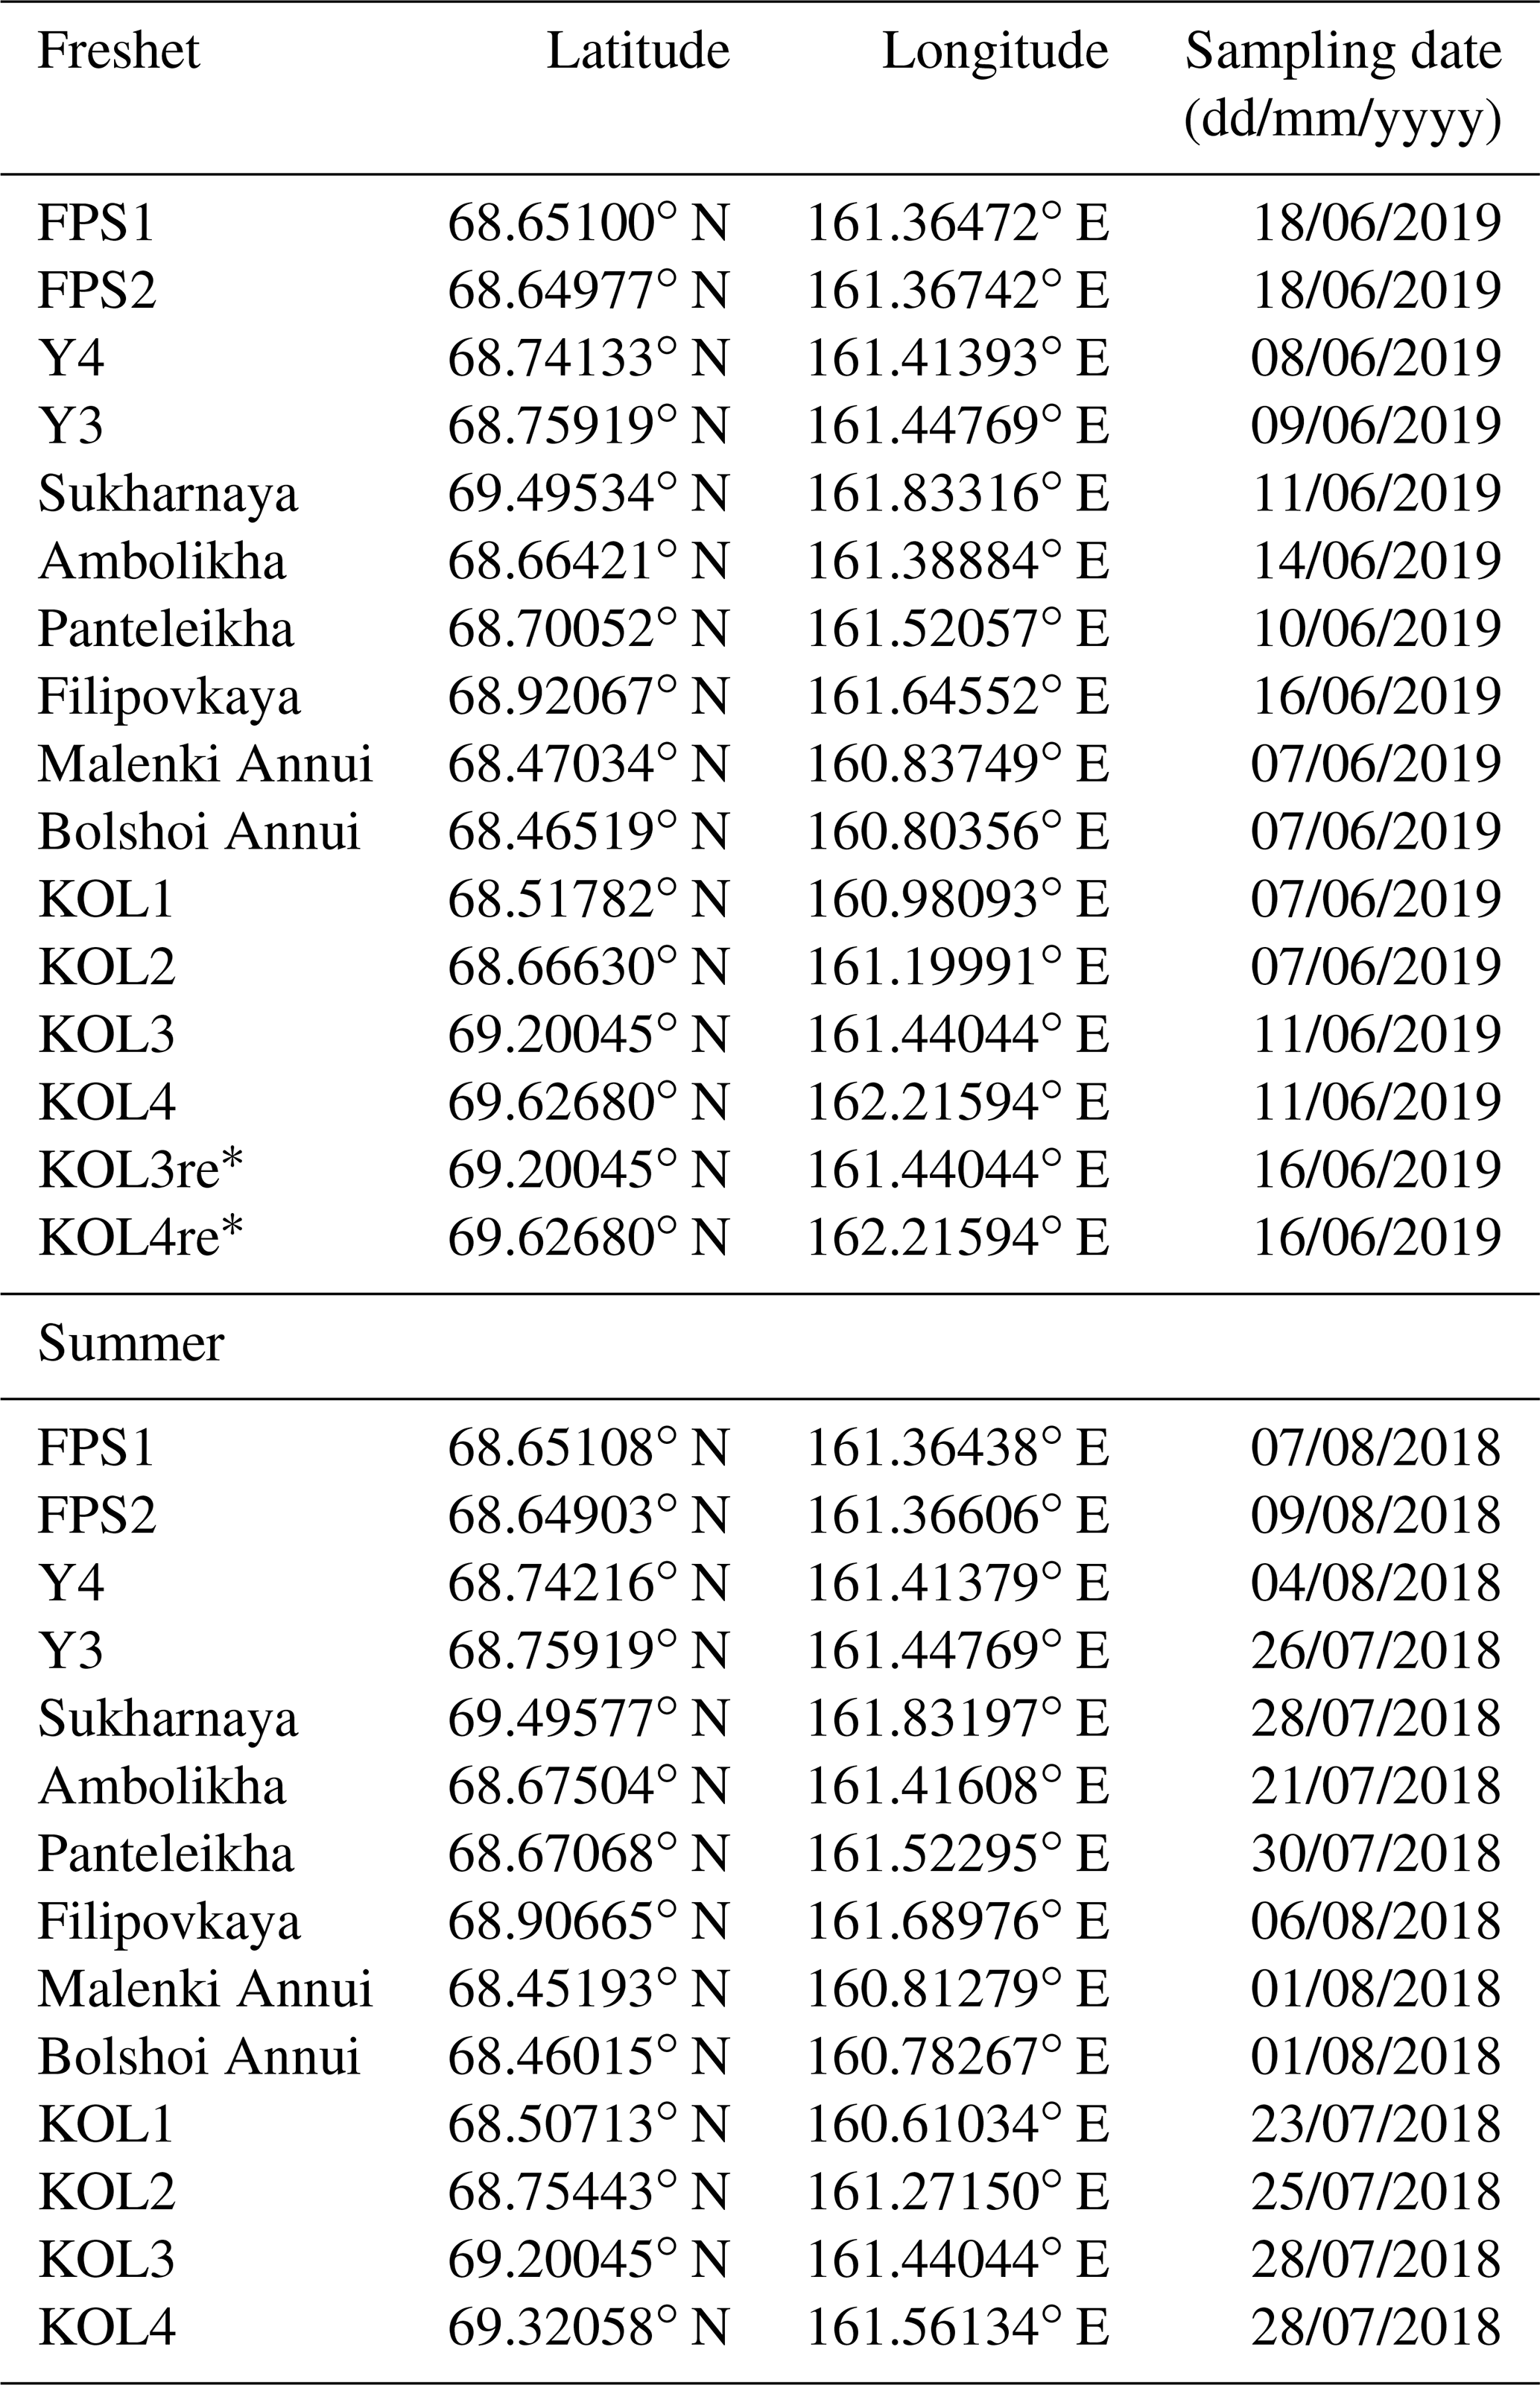
* Repeat measurement.
Table A2Concentrations of total suspended solids (TSS), particulate and dissolved organic carbon (POC and DOC, respectively), and dissolved inorganic carbon (DIC) in the Kolyma River during freshet (June 2019) and summer (July–August 2018). Also shown are stable isotopes of carbon – δ13C of POC, DOC and DIC – and concentrations of total particulate nitrogen (TPN) and the molar ratio of . For Δ14C-POC, see Table A7. The mean and standard deviation between replicate samples (n= 4) are shown for freshet at sites KOL1–KOL4 and for summer at KOL1–KOL3 (n= 3; for KOL3, n= 4) including analytical uncertainty for DIC and δ13C-DIC. For KOL3re and KOL4re n= 1. For water isotopes (δ18O, δH) and summer DIC and δ13C-DIC, only the analytical error (no replicates) is shown. All data from KOL1–KOL4 during freshet and KOL1–KOL3 during summer (except DIC concentrations) were previously published in Keskitalo et al. (2022). Note that NA stands for not available.
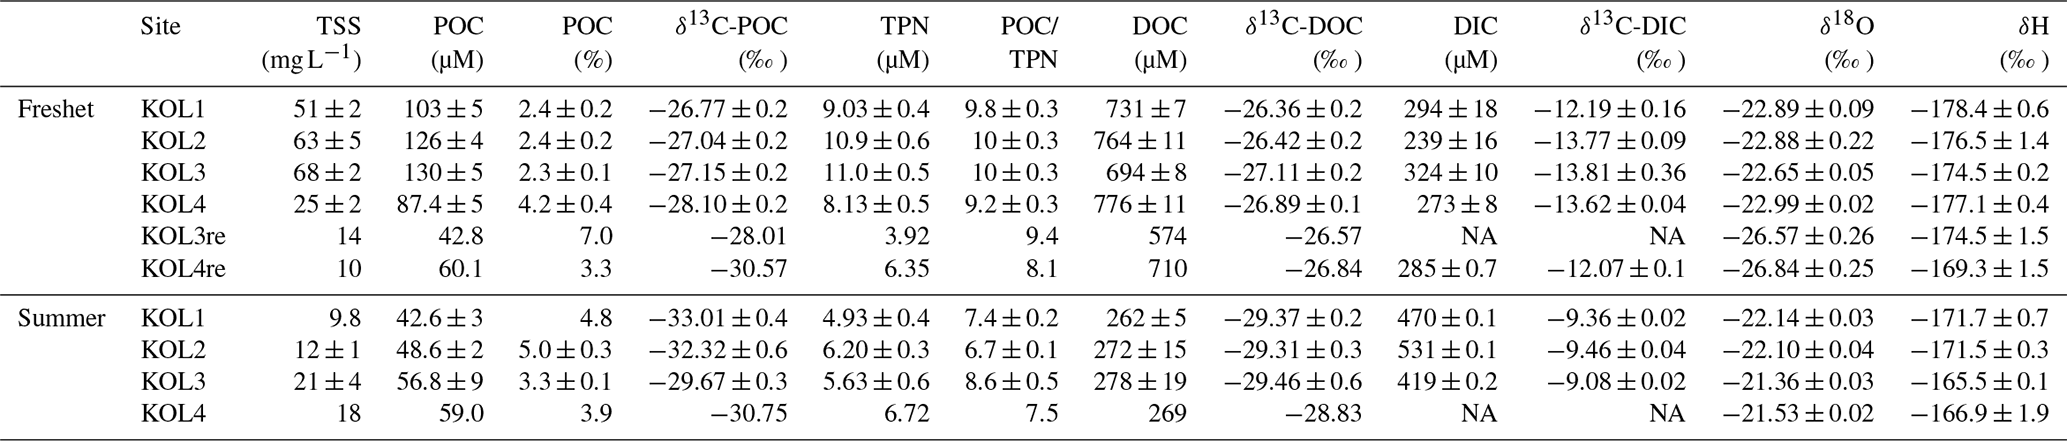
Table A3Water chemistry parameters including water temperature (Water temp), dissolved oxygen (DO), electrical conductivity (EC) and pH in the Kolyma River and its tributary streams and rivers during freshet (early June 2019) and summer (July–August 2018). Also shown is air temperature (Air temp) on the sampling day measured at the Cherskiy weather station. All data from KOL1–KOL4 during freshet and KOL1–KOL3 during summer were previously published in Keskitalo et al. (2022). Note that NA stands for not available.
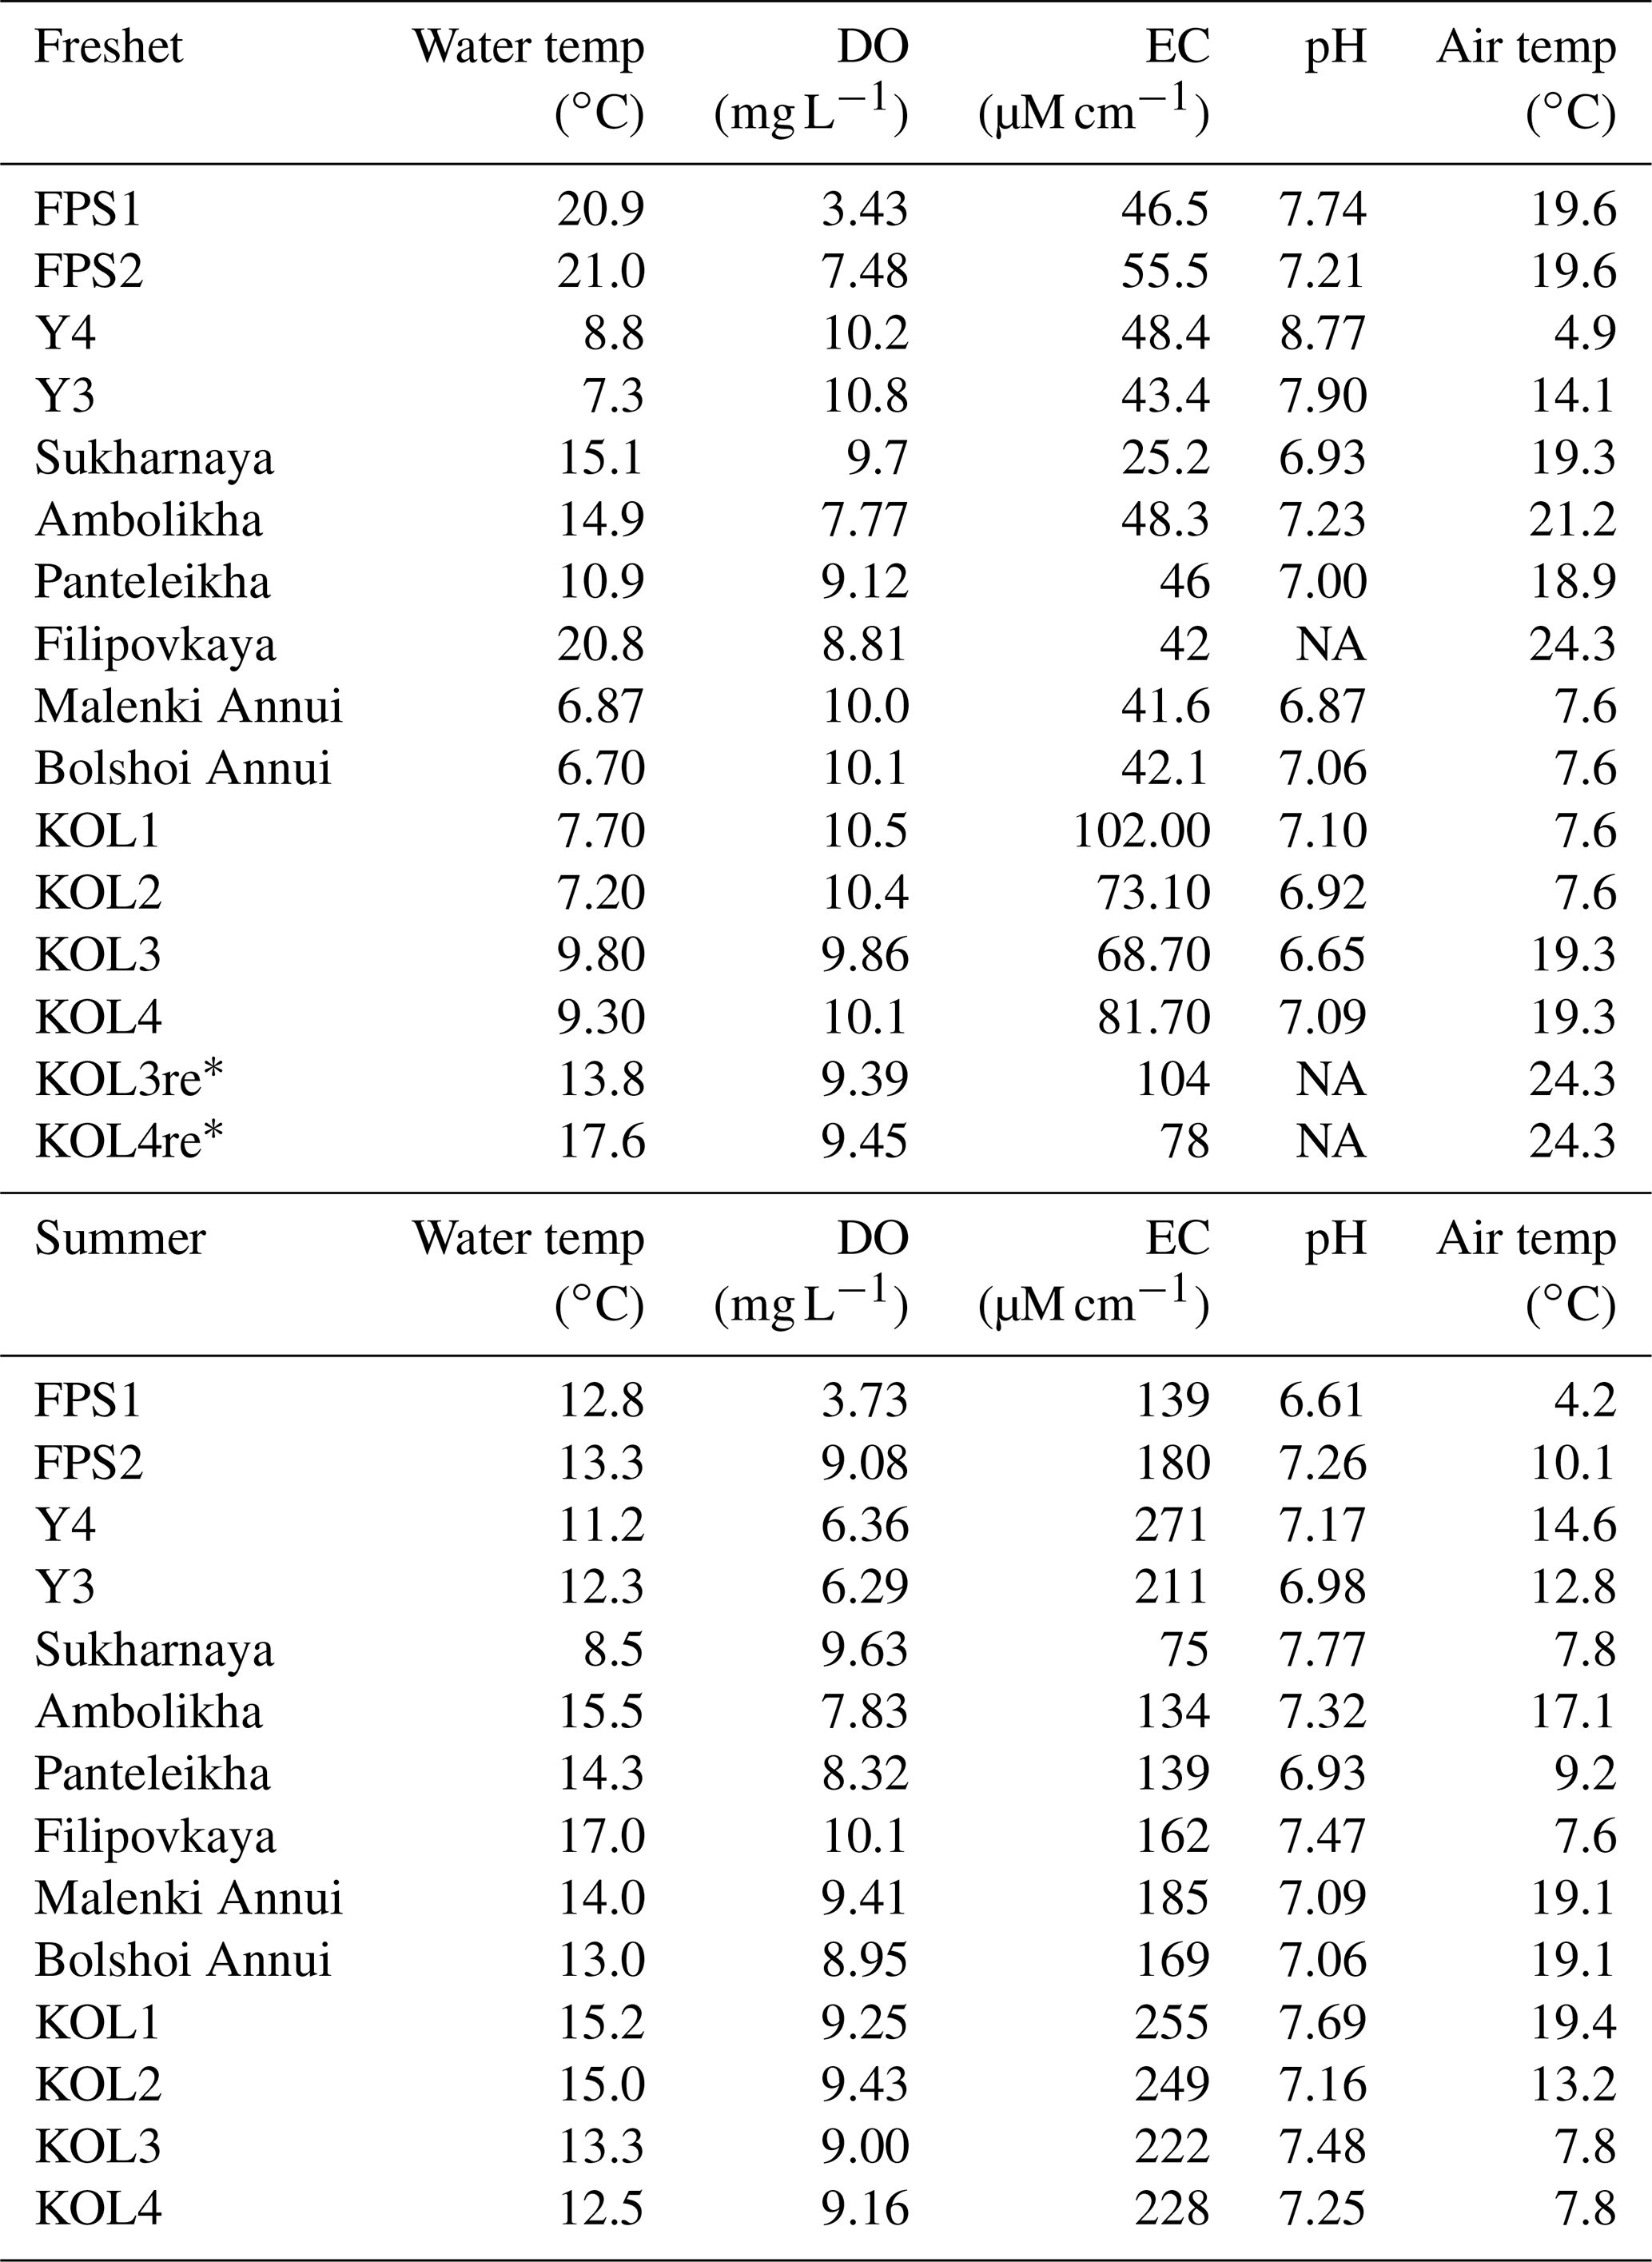
* Repeat samples of KOL3 and KOL4 taken on 16 June 2019.
Table A4Watershed size, slope and soil organic carbon content (SOCC) in the top 100 cm (Hugelius et al., 2013). Slope and SOCC are shown as the mean ± standard deviation; the slope median is also shown.
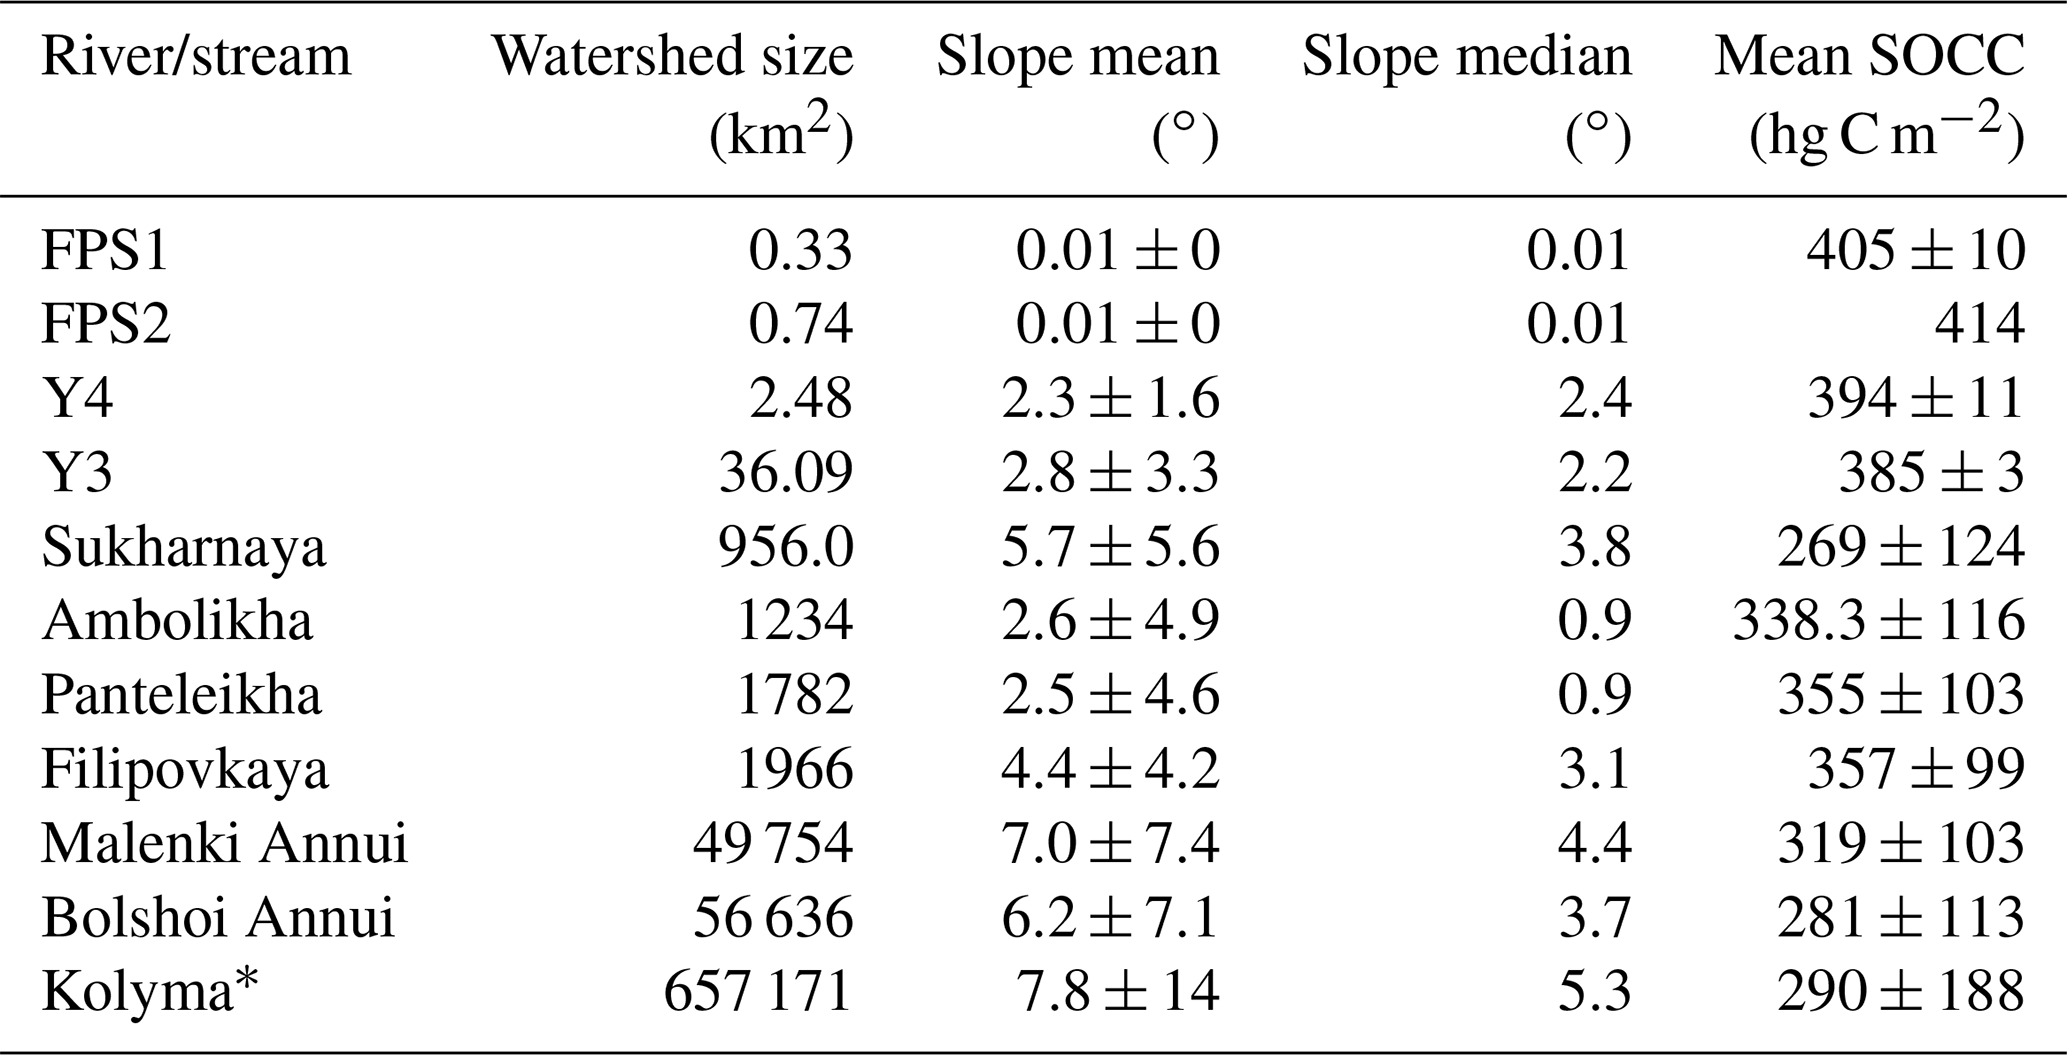
* Kolyma delineation from Shiklomanov et al. (2021).
Table A5Land cover types per watershed in percentages (%). Land cover classes are according to Buchhorn et al. (2020).
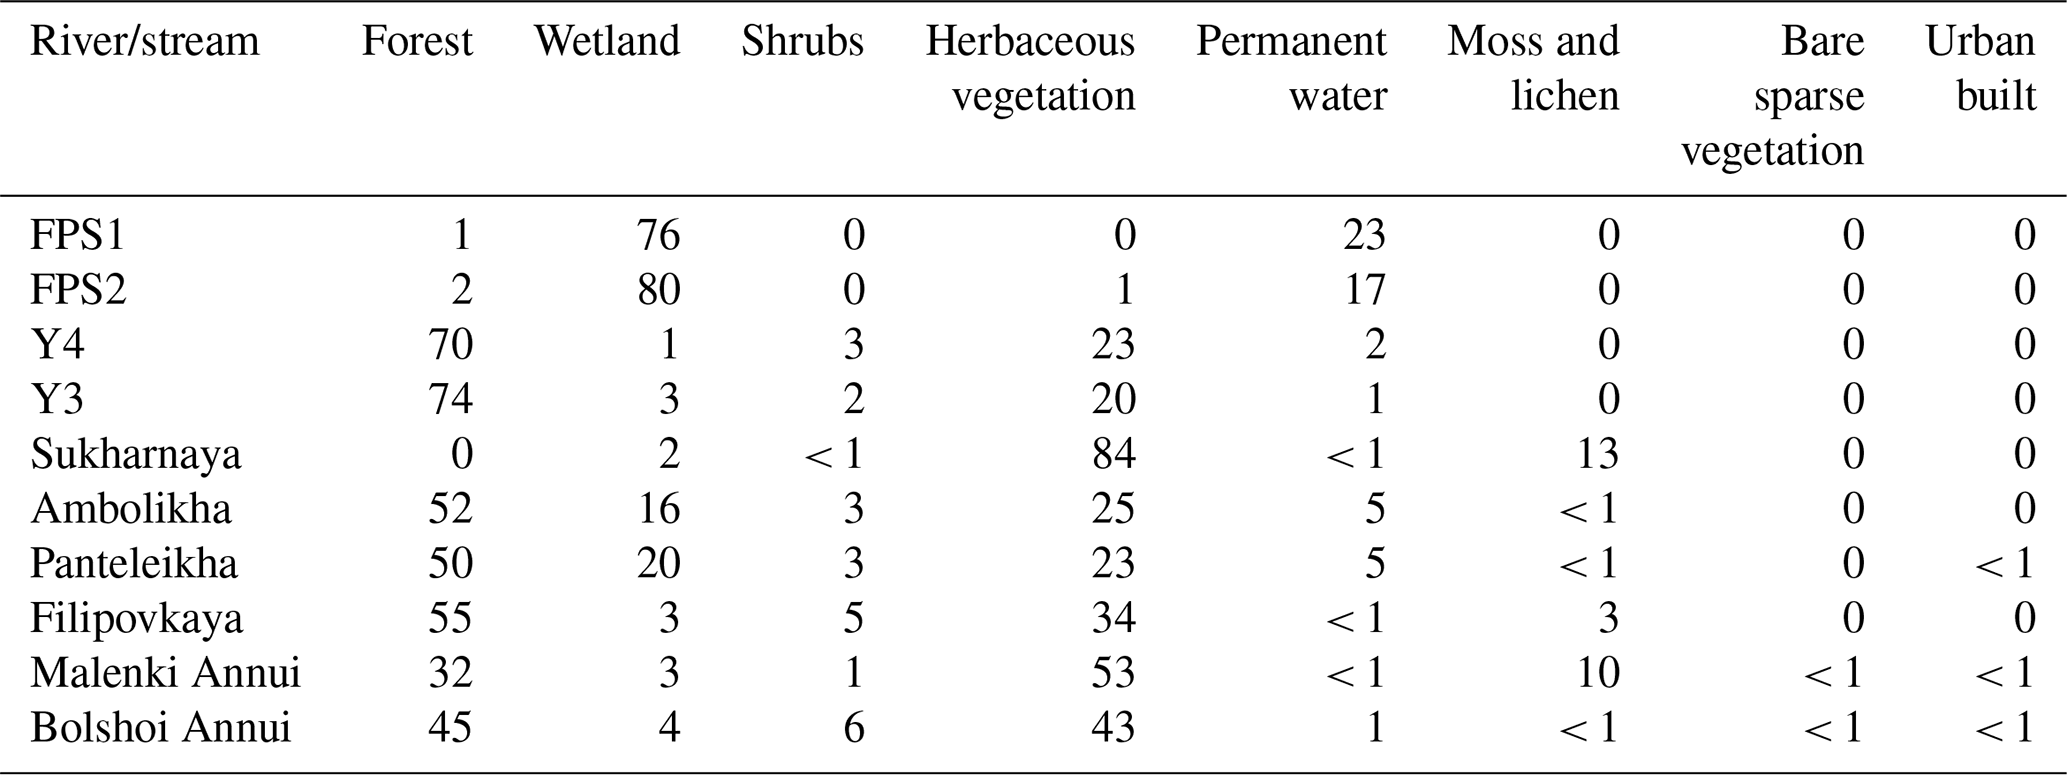
Table A6Paired t-test results for the difference in the means of electrical conductivity (EC); water temperature (Temp); pH; water isotope δ18O; total suspended solids (TSS); particulate and dissolved organic carbon (POC and DOC); dissolved inorganic carbon (DIC); δ13C of POC, DOC and DIC; and Δ14C-POC between seasons (freshet and summer) in the Kolyma mainstem and its tributaries. The significantly different results are highlighted in bold. The significance level is 0.05. For TSS, a Wilcoxon signed rank test was used. For tributaries, n= 10 for all parameters except for DIC and δ13C-DIC with n= 8 for each season. For the Kolyma mainstem, n= 4 for all parameters except for DIC and δ13C-DIC with n= 3 for each season. See more details in Appendix A3.
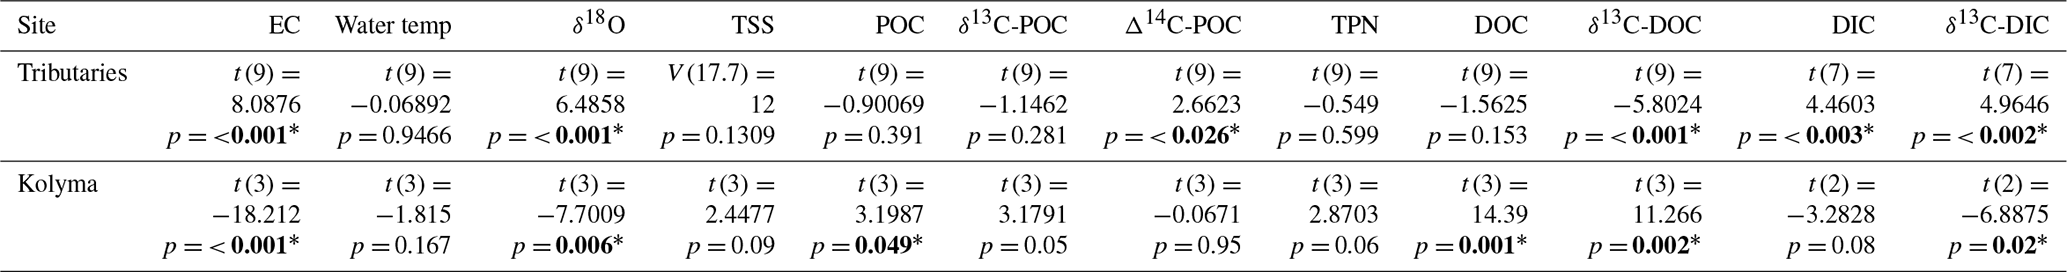
* The asterisk indicates a statistically significant result.
Table A7Fractions (%) of different carbon pools, particulate organic carbon (POC), dissolved organic carbon (DOC) and dissolved inorganic carbon (DIC), during freshet (June 2019) and summer (July–August 2018).
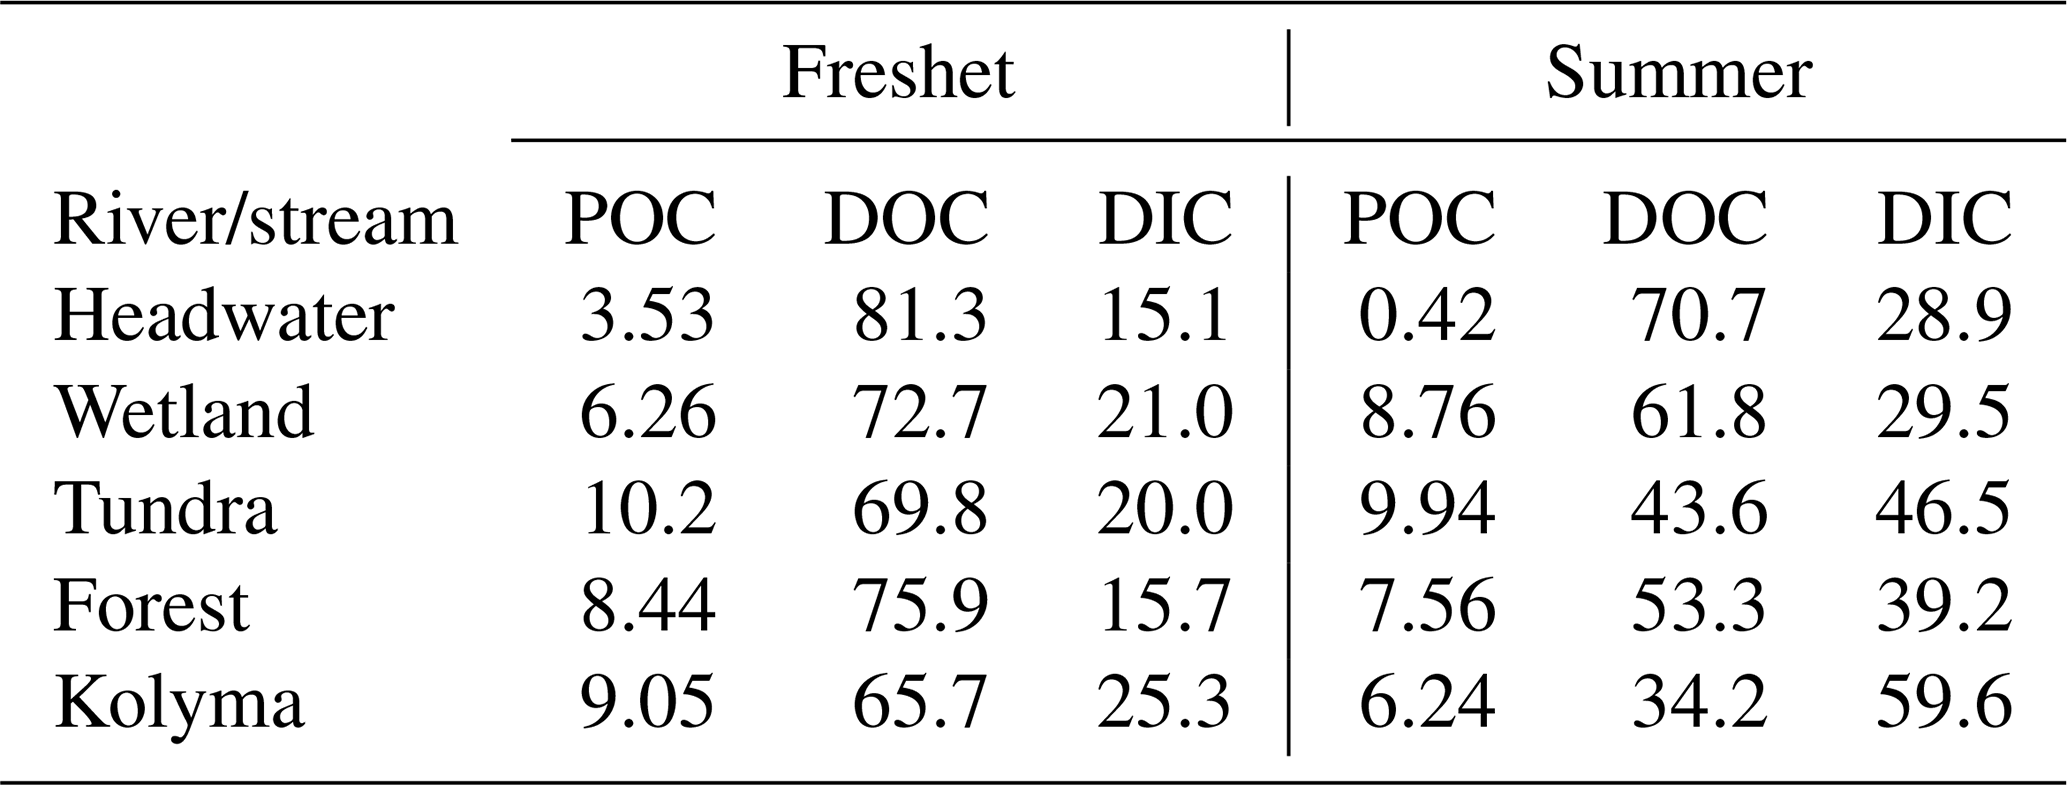
Table A8Analysis of variance (ANOVA) and Kruskal–Wallis test results for the difference in means of total suspended solids (TSS); particulate and dissolved organic carbon (POC and DOC); total particulate nitrogen (TPN); dissolved inorganic carbon (DIC); δ13C of POC, DOC and DIC; and Δ14C-POC between small rivers (FPS1, FPS2, Y3, Y4), midsized (mid) rivers (Panteleikha, Ambolikha, Sukharnaya, Filipovkaya) and large rivers (Malenki Annui, Bolshoi Annui and Kolyma mainstem) during freshet and summer separately with F statistics (from ANOVA) or H statistics (from Kruskal–Wallis test), degrees of freedom and p values. The statistically significant (p< 0.05) results are highlighted in bold. When ANOVA or Kruskal–Wallis test results were significant, a post hoc test (Tukey's test for ANOVA and Dunn's test for the Kruskal–Wallis test) was conducted, and these results (p values) are listed below to indicate whether the difference was between small and midsize rivers, small and large rivers, and/or midsize and large rivers (n/a indicates not applicable when a post hoc test was not executed due to ANOVA or the Kruskal–Wallis test not showing significant results). See more details in Appendix A3.
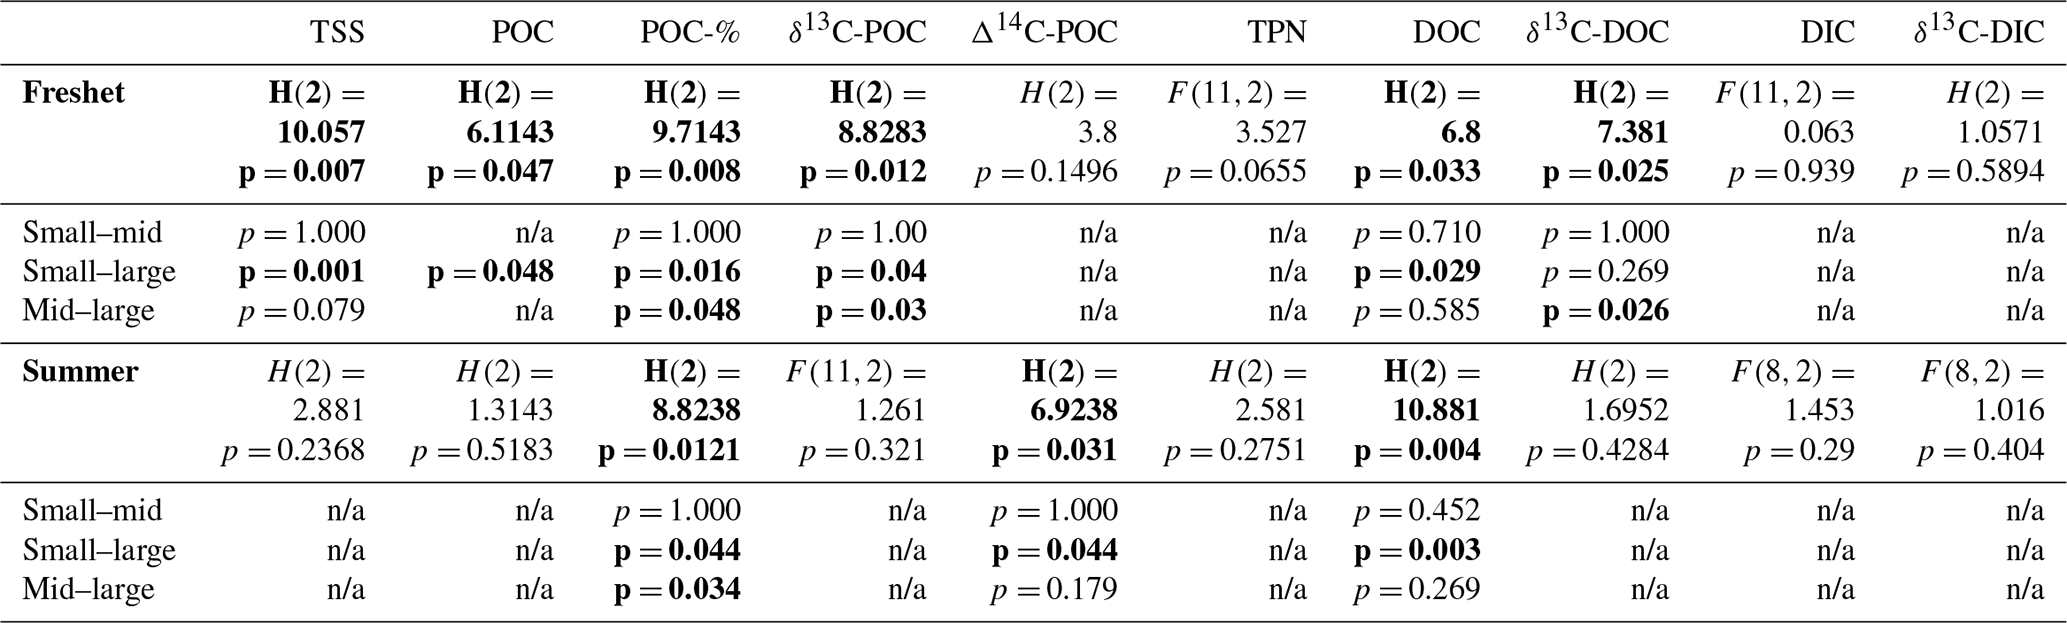
Table A9Radiocarbon measurements for particulate organic carbon (POC) including the fraction modern (Fm), Δ14C and uncalibrated 14C ages. The ETH code is a unique analysis ID assigned for each sample analyzed at the Laboratory of Ion Beam Physics, ETH Zurich. The uncertainties are according to the method described in Haghipour et al. (2019). Note that NA stands for not available.
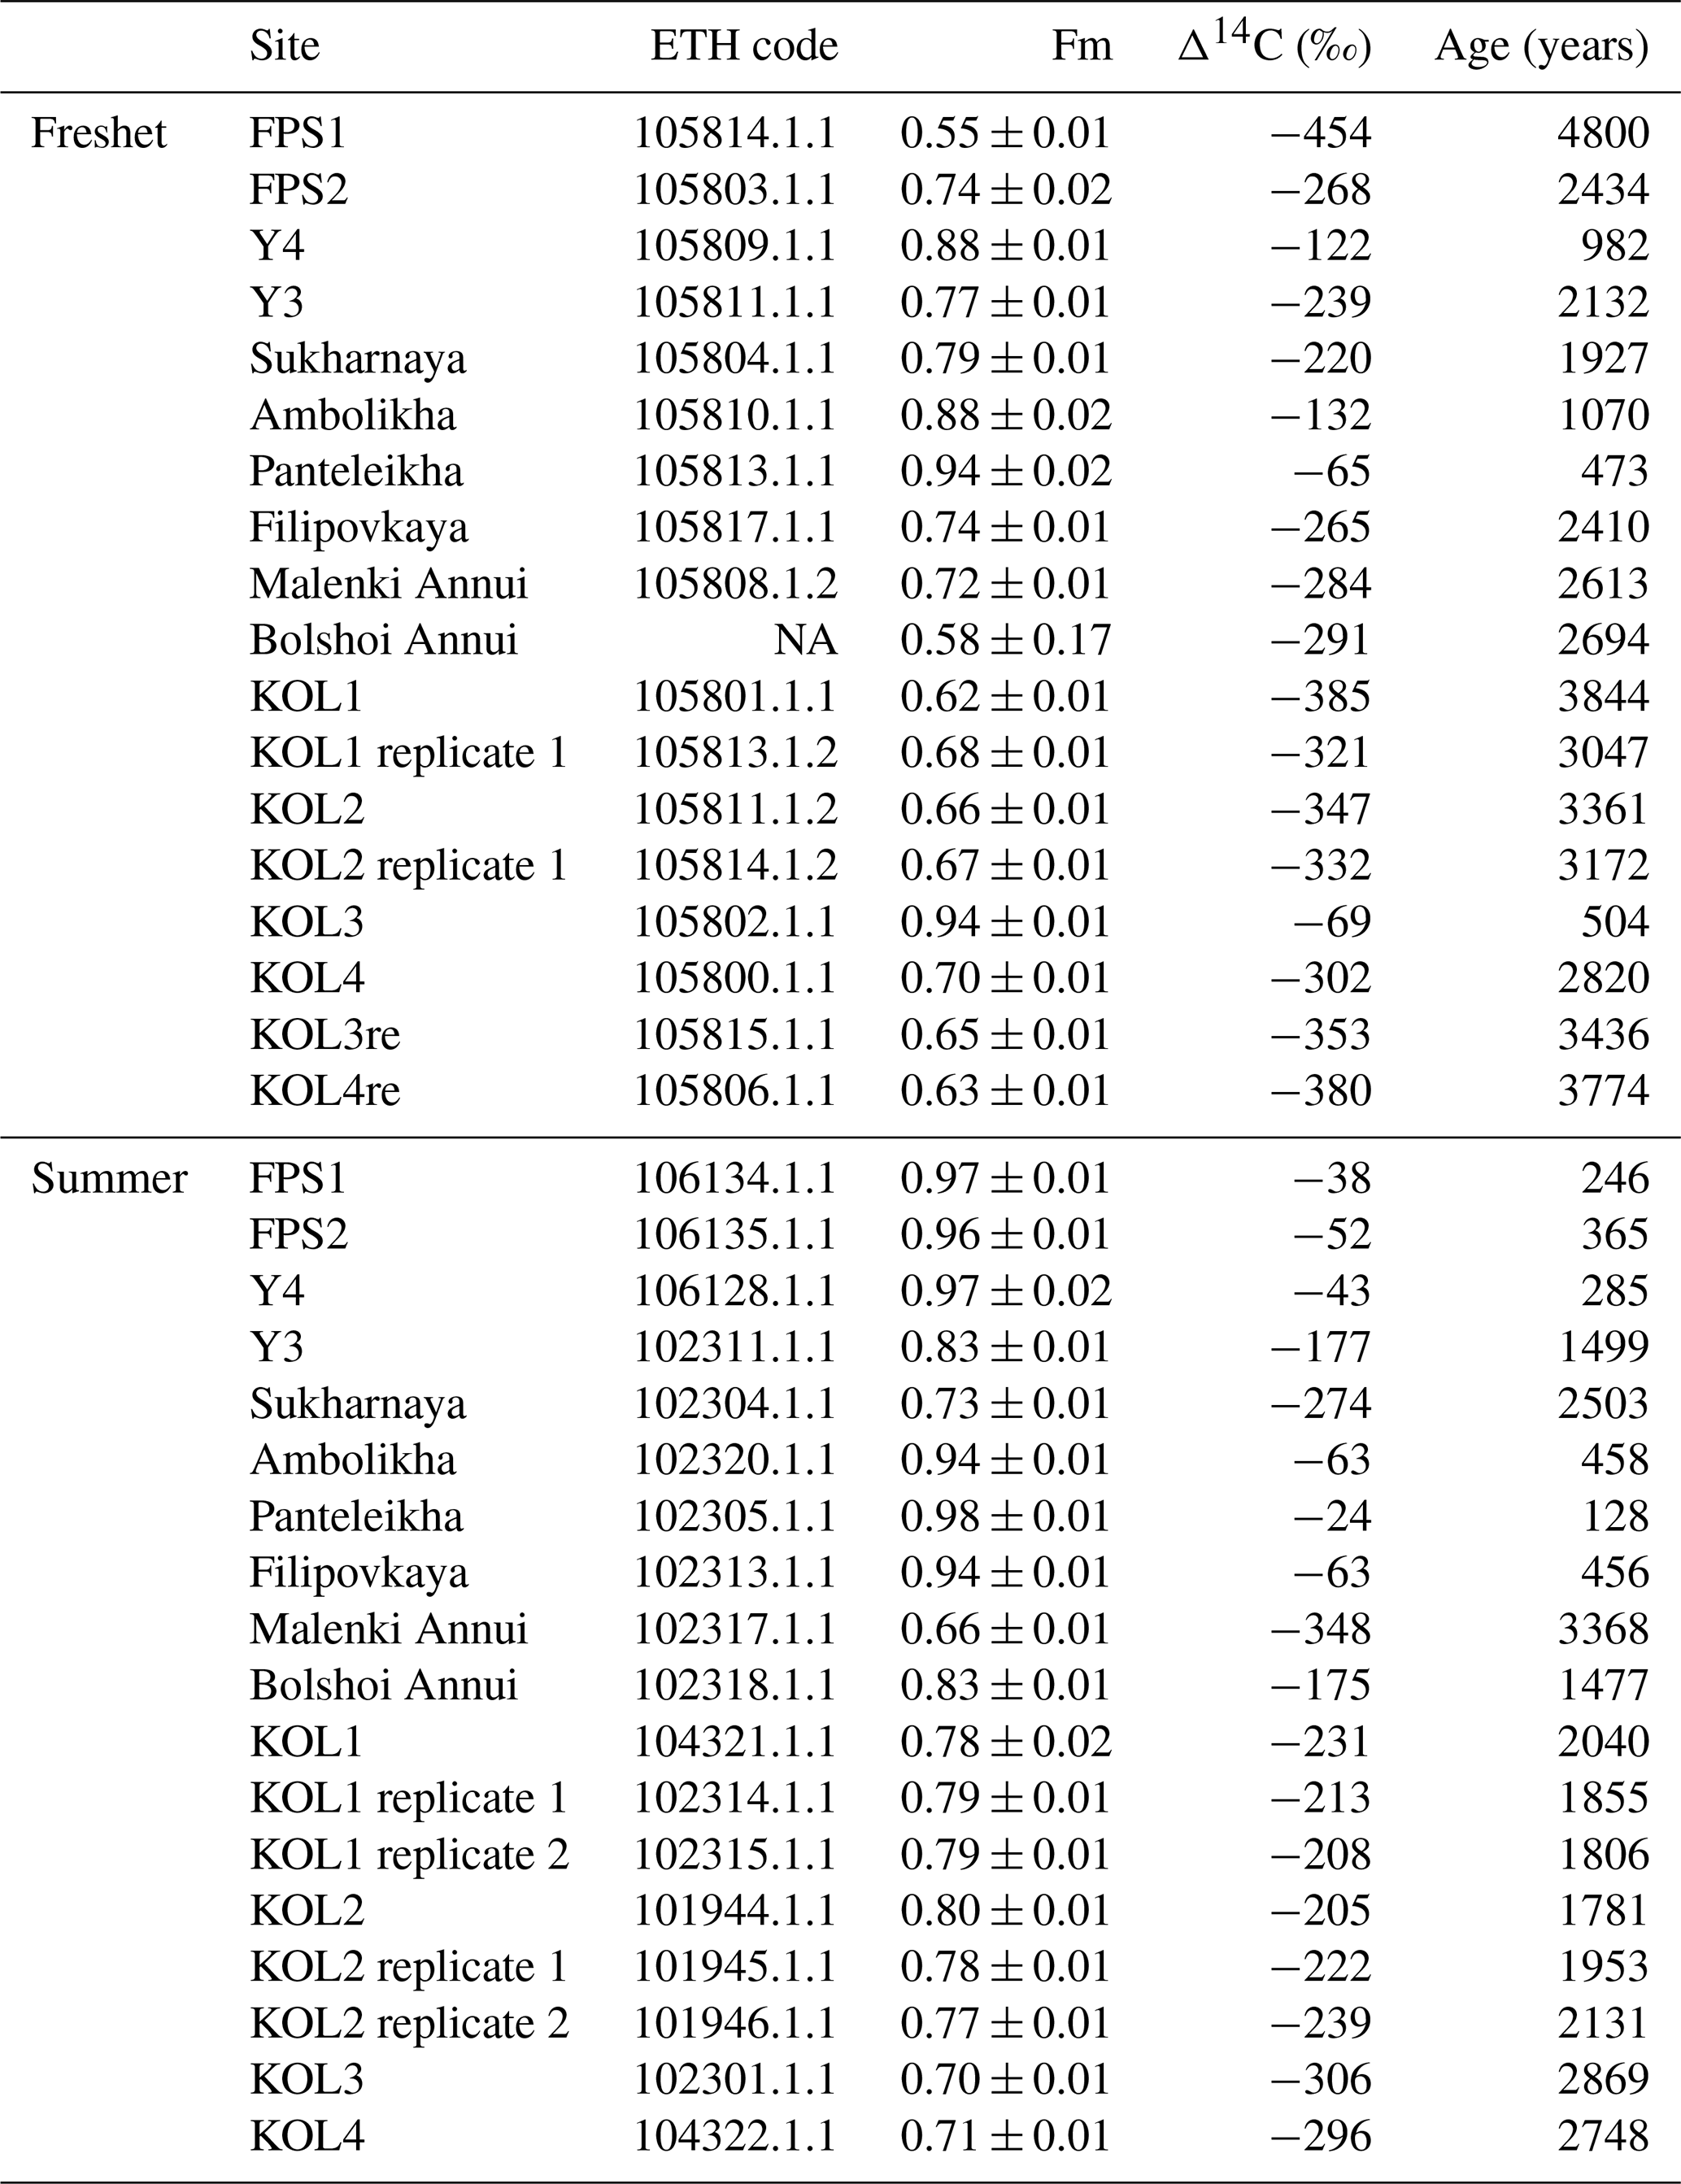
Table A10Sampling date, concentrations of dissolved organic carbon (DOC) and Δ14C-DOC of floodplain stream (FPS), Y4, Y3 and Panteleikha sampled during 2006–2011 (previously unpublished data; all sampling by Anya Davydova and Sergei Davydov). The location of FPS is 68.73515∘ N, 161.40408∘ E, and is thus different from FPS locations in this study. The ETH code is a unique analysis ID assigned for each sample analyzed at the Laboratory of Ion Beam Physics, ETH Zurich. Note that NA stands for not available.
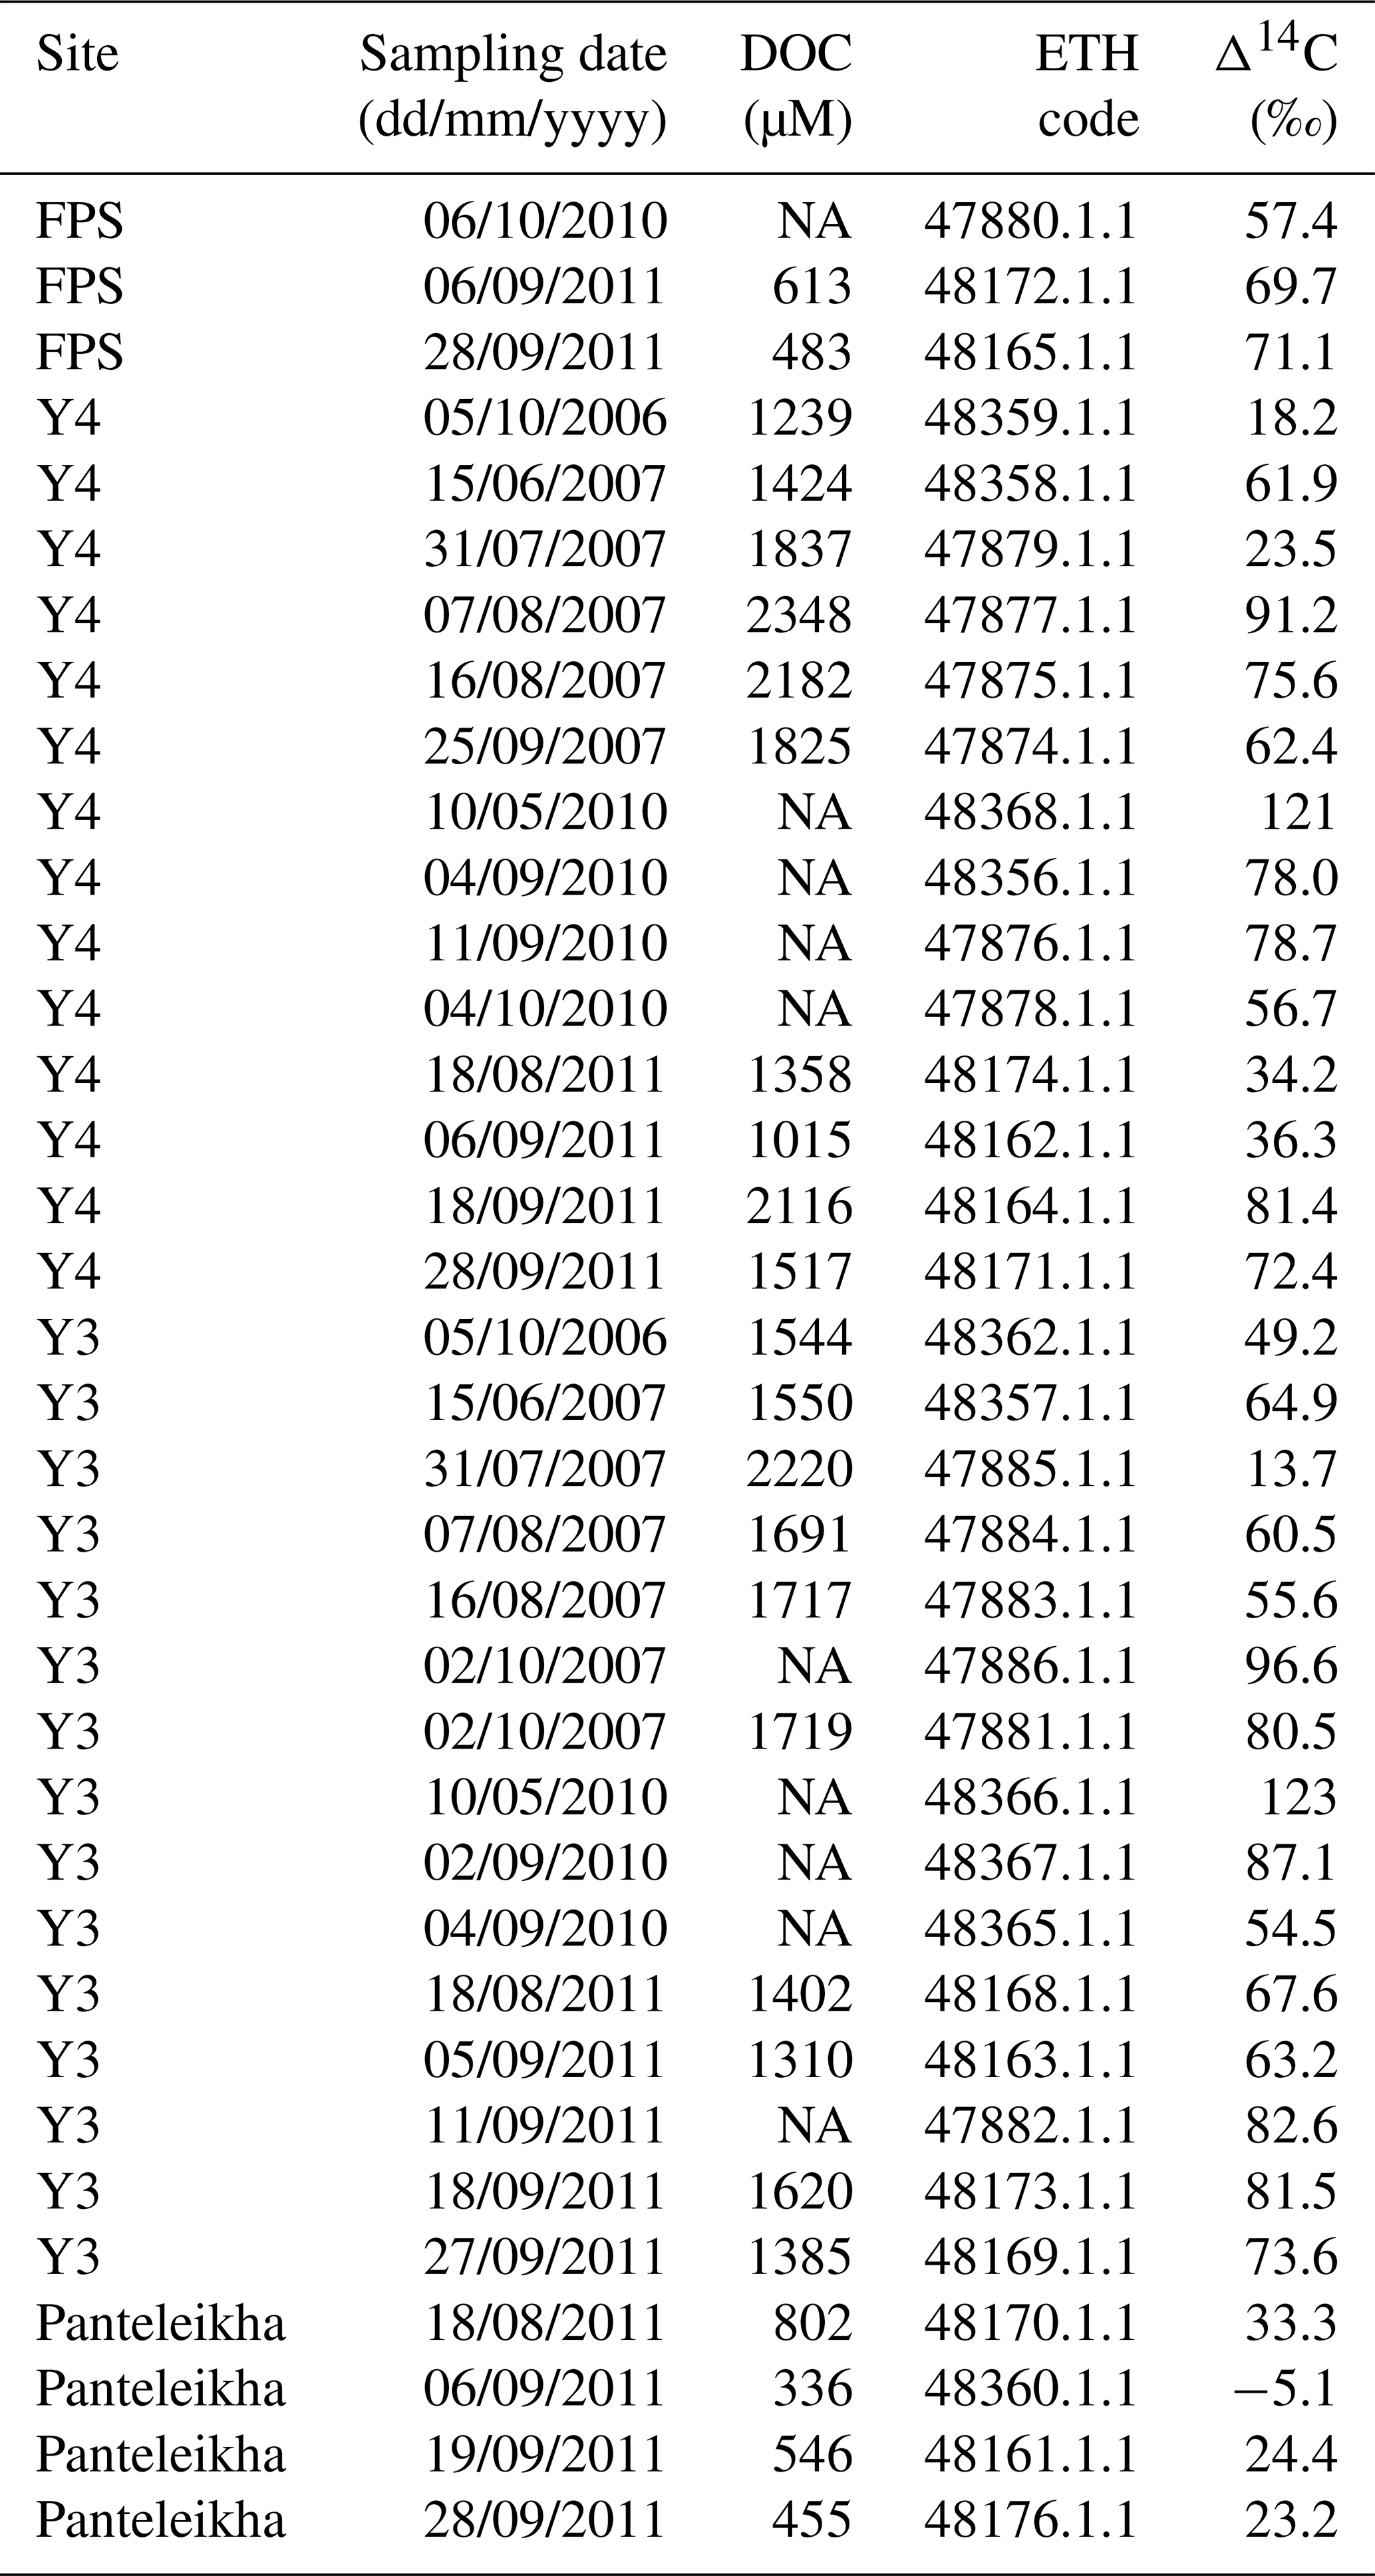
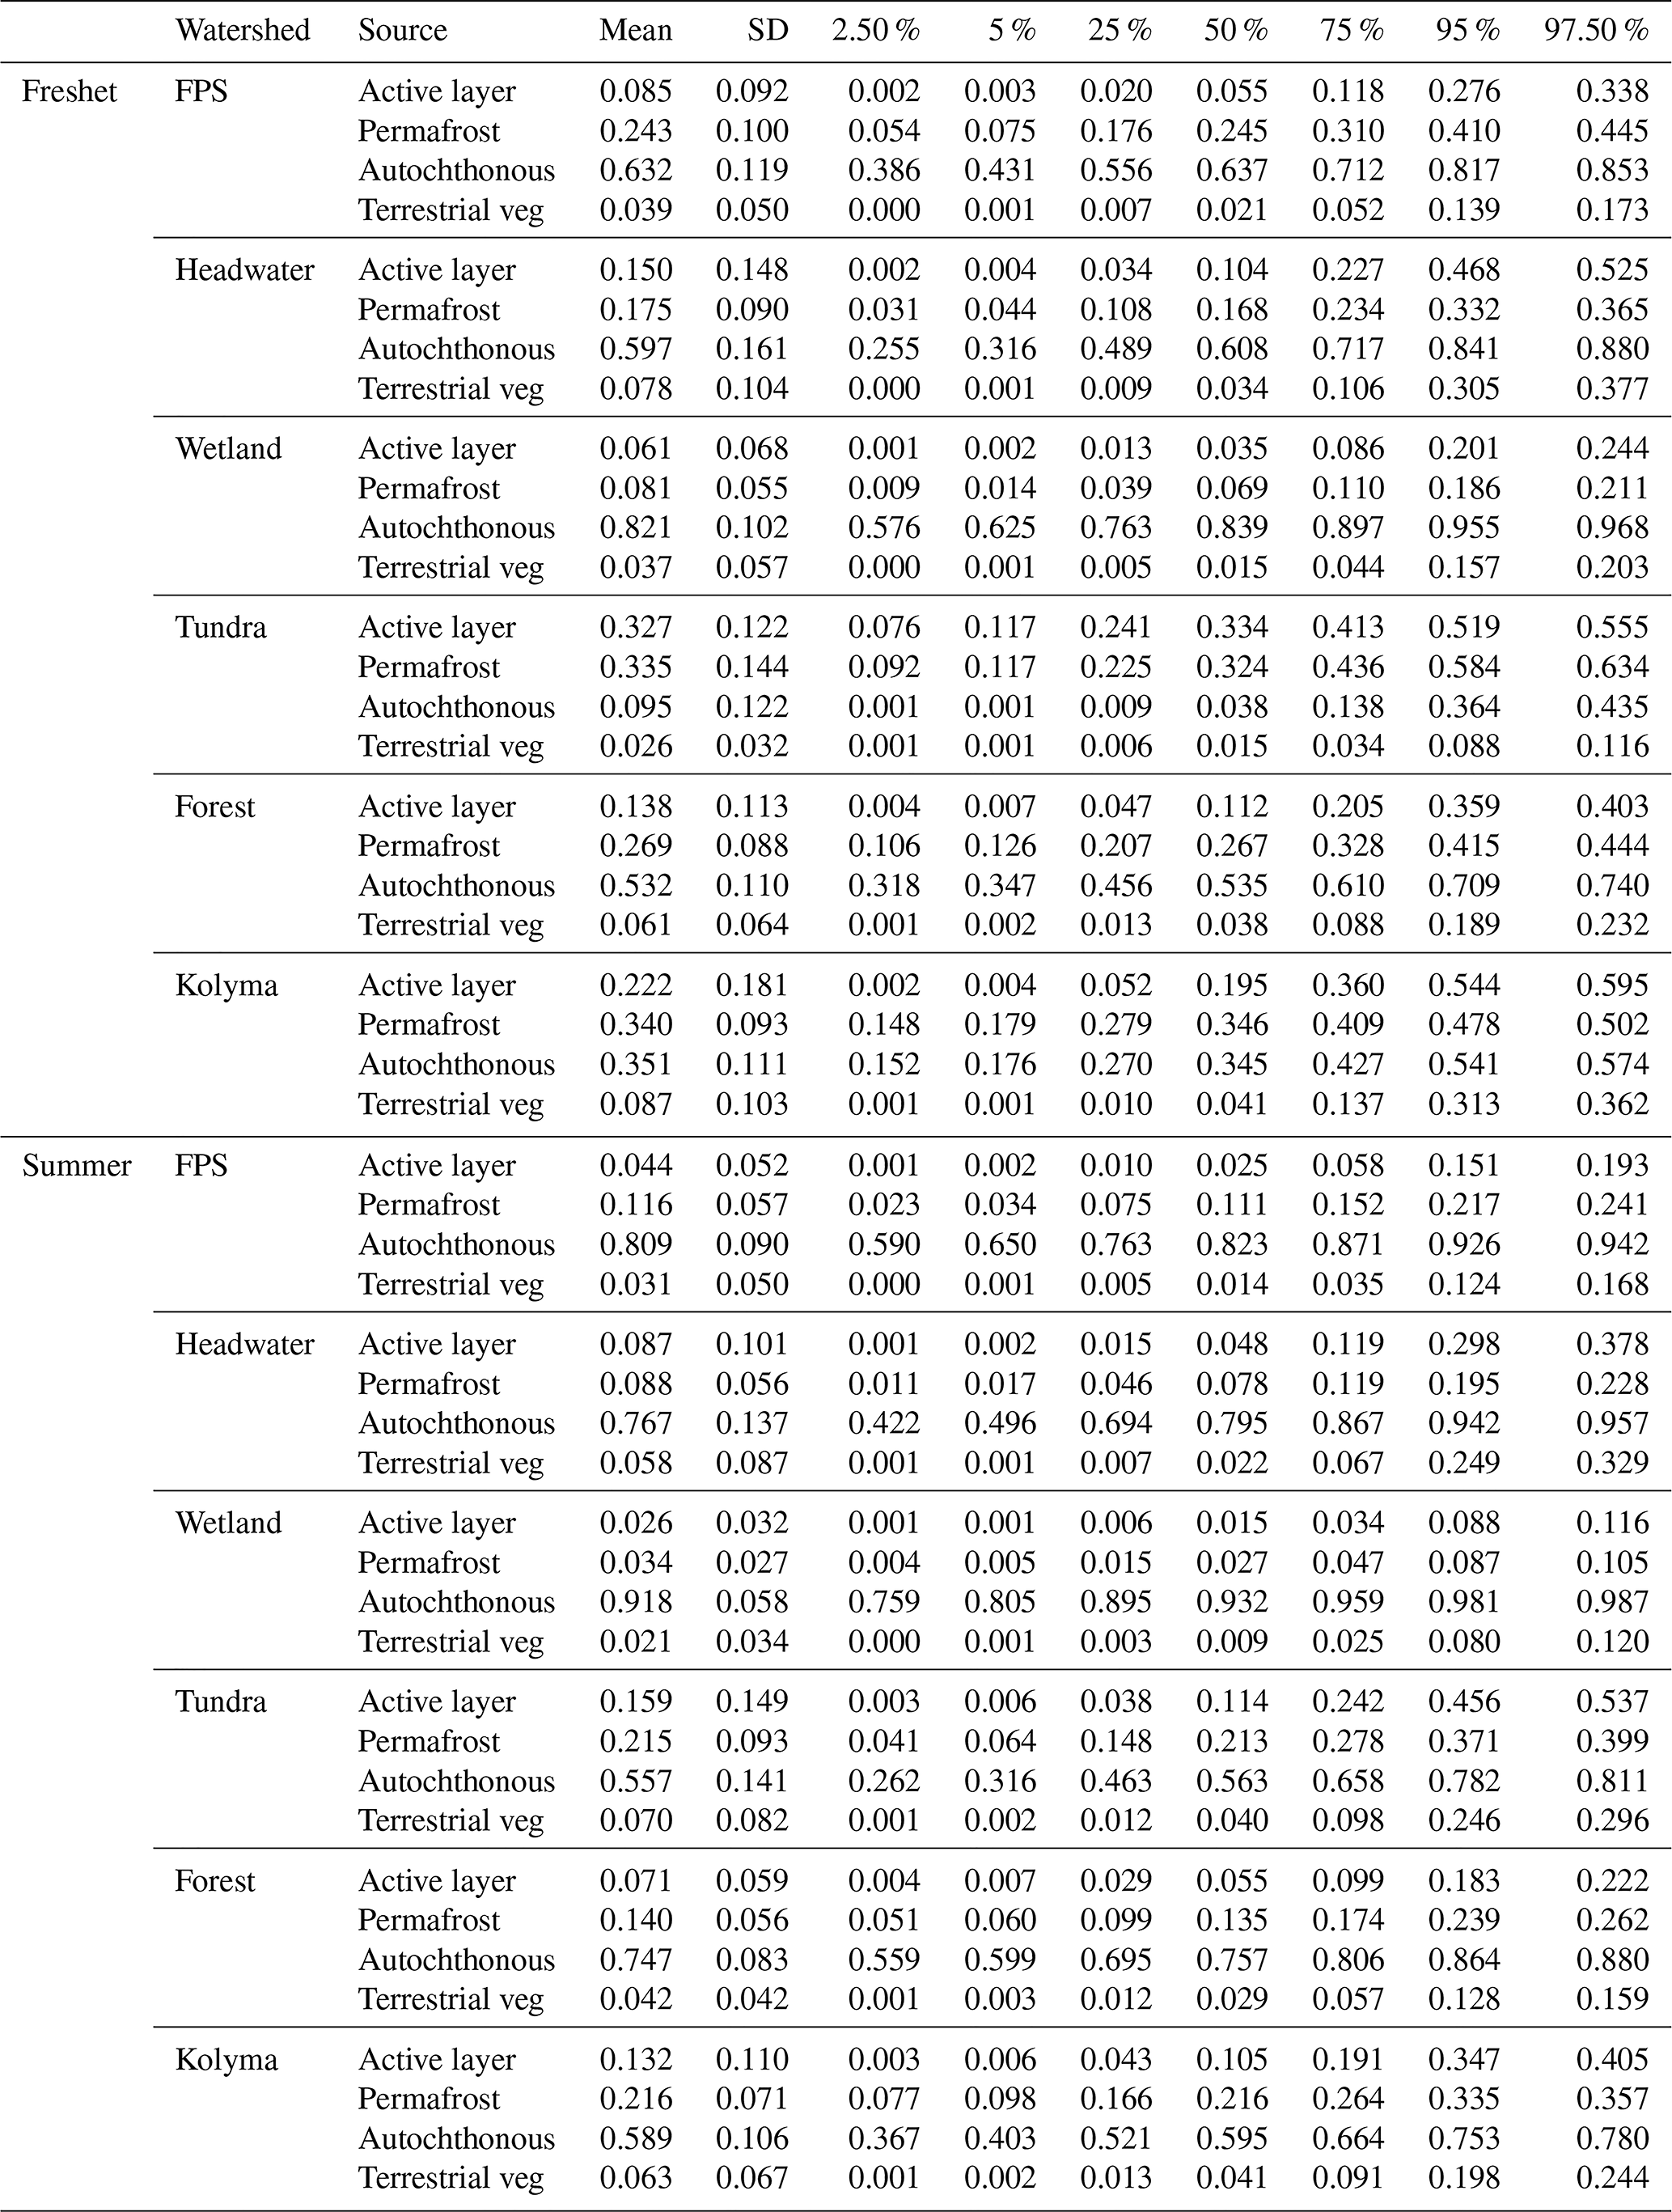
Table A11Source apportionment results from Markov chain Monte Carlo analysis showing the mean, standard deviation (SD) and quantiles (2.5 %, 5 %, 25 %, 75 %, 95 % and 97.5 %) of particulate organic carbon (POC) from active layer, permafrost, autochthonous and terrestrial vegetation (terrestrial veg) sources during freshet and summer in floodplain (FPS), headwater, wetland, tundra, forest and the Kolyma mainstem. For endmembers and further details, see Sect. A2.
Data are available within the article or in Appendix A.
JEV and KHK led the design of the study with contributions from LB. KHK, LB, DJJ, AD, SD and NZ conducted all the fieldwork. KHK, LB and DJJ executed all preparatory laboratory work. NH and TIE conducted the AMS analyses and TT and PJM analytical laboratory work regarding carbon concentrations and stable isotope analysis. KHK carried out the statistical analyses. KHK and SBG conducted the spatial analysis. KHK led the manuscript writing with contributions from all the co-authors.
The contact author has declared that none of the authors has any competing interests.
Publisher’s note: Copernicus Publications remains neutral with regard to jurisdictional claims made in the text, published maps, institutional affiliations, or any other geographical representation in this paper. While Copernicus Publications makes every effort to include appropriate place names, the final responsibility lies with the authors.
We thank the staff of the Northeast Science Station (NESS) for their support during fieldwork and for providing laboratory facilities. We want to thank Karel Castro Morales and her team (Friedrich Schiller University, Jena) and Juri Palmtag (Northumbria University) for their support in the field. Equally, we want to thank both Suzanne Verdegaal-Warmerdam and Richard Logtestijn (Vrije Universiteit Amsterdam) for their help with fieldwork preparations. Finally, we thank Niek Speetjens (Vrije Universiteit Amsterdam) for his advice with the spatial analysis. The study of Sergei Davydov, Anna Davydova and Nikita Zimov was partly carried out within the framework of state assignment number 122020900184-5 of the Pacific Geographical Institute of RAS.
This research has been supported by Horizon 2020 with a starting grant from the European Research Council (ERC) to Jorien E. Vonk (grant no. THAWSOME 676982), by a UK Research and Innovation (UKRI) grant to Paul J. Mann (grant no. CACOON NE/R012806/1), and by a Nederlandse Organisatie voor Wetenschappelijk Onderzoek (NWO; the Aard- en Levenswetenschappen) grant to Kirsi H. Keskitalo (Rubicon, grant no. 019.212EN.033).
This paper was edited by Jack Middelburg and reviewed by two anonymous referees.
Battin, T. J., Lauerwald, R., Bernhardt, E. S., Bertuzzo, E., Gómez Gener, L., Hall Jr., R. O., Hotchkiss, E., Maavara, T., Pavelsky, T. M., Ran, L., Raymond, P., Rosentreter, J. A., and Regnier, P.: River ecosystem metabolism and carbon biogeochemistry in a changing world, Nature, 613, 449–459, https://doi.org/10.1038/s41586-022-05500-8, 2023.
Behnke, M. I., Tank, S. E., McClelland, J. W., Holmes, R. M., Haghipour, N., Eglinton, T. I., Raymond, P. A., Suslova, A., Zhulidov, A. V., Gurtovaya, T., Zimov, N., Zimov, S., Mutter, E. A., Amos, E., and Spencer, R. G. M.: Aquatic biomass is a major source to particulate organic matter export in large Arctic rivers, P. Natl. Acad. Sci. USA, 120, 1–9, https://doi.org/10.1073/pnas.2209883120, 2023.
Bröder, L., Davydova, A., Davydov, S., Zimov, N., Haghipour, N., Eglinton, T. I., and Vonk, J. E.: Particulate Organic Matter Dynamics in a Permafrost Headwater Stream and the Kolyma River Mainstem, J. Geophys. Res.-Biogeo., 125, 1–16, https://doi.org/10.1029/2019JG005511, 2020.
Buchhorn, M., Smets, B., Bertels, L., De Roo, B., Lesiv, M., Tsendbazar, N.-E., Herold, M., and Fritz, S.: Copernicus Global Land Service: Land Cover 100m: collection 3: epoch 2019, Globe 2020, Zenodo [data set], https://doi.org/10.5281/zenodo.3939050, 2020.
Campeau, A., Wallin, M. B., Giesler, R., Löfgren, S., Mörth, C. M., Schiff, S., Venkiteswaran, J. J., and Bishop, K.: Multiple sources and sinks of dissolved inorganic carbon across Swedish streams, refocusing the lens of stable C isotopes, Sci. Rep., 7, 1–14, https://doi.org/10.1038/s41598-017-09049-9, 2017.
Collins, C. G., Elmendorf, S. C., Hollister, R. D., Henry, G. H. R., Clark, K., Bjorkman, A. D., Myers-Smith, I. H., Prevéy, J. S., Ashton, I. W., Assmann, J. J., Alatalo, J. M., Carbognani, M., Chisholm, C., Cooper, E. J., Forrester, C., Jónsdóttir, I. S., Klanderud, K., Kopp, C. W., Livensperger, C., Mauritz, M., May, J. L., Molau, U., Oberbauer, S. F., Ogburn, E., Panchen, Z. A., Petraglia, A., Post, E., Rixen, C., Rodenhizer, H., Schuur, E. A. G., Semenchuk, P., Smith, J. G., Steltzer, H., Totland, Ø., Walker, M. D., Welker, J. M., and Suding, K. N.: Experimental warming differentially affects vegetative and reproductive phenology of tundra plants, Nat. Commun., 12, 1–12, https://doi.org/10.1038/s41467-021-23841-2, 2021.
Dean, J. F., Meisel, O. H., Martyn Rosco, M., Marchesini, L. B., Garnett, M. H., Lenderink, H., van Logtestijn, R., Borges, A. V., Bouillon, S., Lambert, T., Röckmann, T., Maximov, T., Petrov, R., Karsanaev, S., Aerts, R., van Huissteden, J., Vonk, J. E., and Dolman, A. J.: East Siberian Arctic inland waters emit mostly contemporary carbon, Nat. Commun., 11, 1–10, https://doi.org/10.1038/s41467-020-15511-6, 2020.
Demars, B. O. L., Gíslason, G. M., Ólafsson, J. S., Manson, J. R., Friberg, N., Hood, J. M., Thompson, J. J. D., and Freitag, T. E.: Impact of warming on CO2 emissions from streams countered by aquatic photosynthesis, Nat. Geosci., 9, 758–761, https://doi.org/10.1038/ngeo2807, 2016.
Denfeld, B. A., Frey, K. E., Sobczak, W. V, Mann, P. J., and Holmes, R. M.: Summer CO2 evasion from streams and rivers in the Kolyma River basin, north-east Siberia, Polar Res., 32, 19704, https://doi.org/10.3402/polar.v32i0.19704, 2013.
Drake, T. W., Raymond, P. A., and Spencer, R. G. M.: Terrestrial carbon inputs to inland waters: A current synthesis of estimates and uncertainty, Limnol. Oceanogr., 3, 132–142, https://doi.org/10.1002/lol2.10055, 2018a.
Drake, T. W., Guillemette, F., and Hemingway, J. D.: The Ephemeral Signature of Permafrost Carbon in an Arctic Fluvial Network, J. Geophys. Res.-Biogeo., 123, 1475–1485, https://doi.org/10.1029/2017JG004311, 2018b.
Fedorov-Davydov, D. G., Davydov, S. P., Davydova, A. I., Ostroymov, V. E., Kholodov, A. L., Sorokovikov, V. A., and Shmelev, D. G.: The temperature regime of soils in Northern Yakutia, Earth's Cryosph., 22, 15–24, 2018a.
Fedorov-Davydov, D. G., Davydov, S. P., Davydova, A. I., Shmelev, D. G., Ostroymov, V. E., Kholodov, A. L., and Sorokovikov, V. A.: The thermal state of soils in Northern Yakutia, Earth's Cryosph., 22, 52–66, 2018b.
Guo, L. and Macdonald, R. W.: Source and transport of terrigenous organic matter in the upper Yukon River: Evidence from isotope (δ13C, Δ14C, and δ15N) composition of dissolved, colloidal, and particulate phases, Global Biogeochem. Cy., 20, 1–12, https://doi.org/10.1029/2005GB002593, 2006.
Guo, L., Ping, C. L., and Macdonald, R. W.: Mobilization pathways of organic carbon from permafrost to arctic rivers in a changing climate, Geophys. Res. Lett., 34, 1–5, https://doi.org/10.1029/2007GL030689, 2007.
Harrison, W. G. and Cota, G. F.: Primary production in polar waters: relation to nutrient availability, Polar Res., 10, 87–104, https://doi.org/10.3402/polar.v10i1.6730, 1991.
Haghipour, N., Ausin, B., Usman, M. O., Ishikawa, N., Wacker, L., Welte, C., Ueda, K., and Eglinton, T. I.: Compound-Specific Radiocarbon Analysis by Elemental Analyzer-Accelerator Mass Spectrometry: Precision and Limitations Anal. Chem., 91, 2042–2049, doi:101021/acsanalchem8b04491, 2019.
Holmes, R. M., McClelland, J. W., Peterson, B. J., Tank, S. E., Bulygina, E., Eglinton, T. I., Gordeev, V. V., Gurtovaya, T. Y., Raymond, P. A., Repeta, D. J., Staples, R., Striegl, R. G., Zhulidov, A. V., and Zimov, S. A.: Seasonal and Annual Fluxes of Nutrients and Organic Matter from Large Rivers to the Arctic Ocean and Surrounding Seas, Estuar. Coast., 35, 369–382, https://doi.org/10.1007/s12237-011-9386-6, 2012.
Hotchkiss, E. R., Hall, R. O., Baker, M. A., Rosi-Marshall, E. J., and Tank, J. L.: Modeling priming effects on microbial consumption of dissolved organic carbon in rivers, J. Geophys. Res.-Biogeo., 119, 982–995, https://doi.org/10.1002/2013JG002599, 2014.
Hotchkiss, E. R., Hall, R. O., Sponseller, R. A., Butman, D., Klaminder, J., Laudon, H., Rosvall, M., and Karlsson, J.: Sources of and processes controlling CO2 emissions change with the size of streams and rivers, Nat. Geosci., 8, 696–699, https://doi.org/10.1038/ngeo2507, 2015.
Hugelius, G., Tarnocai, C., Broll, G., Canadell, J. G., Kuhry, P., and Swanson, D. K.: The Northern Circumpolar Soil Carbon Database: spatially distributed datasets of soil coverage and soil carbon storage in the northern permafrost regions, Earth Syst. Sci. Data, 5, 3–13, https://doi.org/10.5194/essd-5-3-2013, 2013.
Keskitalo, K. H., Bröder, L., Jong, D., Zimov, N., Davydova, A., Davydov, S., Tesi, T., Mann, P. J., Haghipour, N., Eglinton, T. I., and Vonk, J. E.: Seasonal variability in particulate organic carbon degradation in the Kolyma River, Siberia, Environ. Res. Lett., 17, 034007, https://doi.org/10.1088/1748-9326/ac4f8d, 2022.
Levin, I., Kromer, B., and Hammer, S: Atmospheric δ14CO2 trend in Western European background air from 2000 to 2012, Tellus B, 65, 1–7, https://doi.org/10.3402/tellusb.v65i0.20092, 2013.
Mann, P. J., Davydova, A., Zimov, N., Spencer, R. G. M., Davydov, S., Bulygina, E., Zimov, S., and Holmes, R. M.: Controls on the composition and lability of dissolved organic matter in Siberia's Kolyma River basin, J. Geophys. Res.-Biogeo., 117, 1–15, https://doi.org/10.1029/2011JG001798, 2012.
Mann, P. J., Eglinton, T. I., McIntyre, C. P., Zimov, N., Davydova, A., Vonk, J. E., Holmes, R. M., and Spencer, R. G. M.: Utilization of ancient permafrost carbon in headwaters of Arctic fluvial networks, Nat. Commun., 6, 1–7, https://doi.org/10.1038/ncomms8856, 2015.
Mann, P. J., Strauss, J., Palmtag, J., Dowdy, K., Ogneva, O., Fuchs, M., Bedington, M., Torres, R., Polimene, L., Overduin, P., Mollenhauer, G., Grosse, G., Rachold, V., Sobczak W. V., Spencer, R. G. M., and Juhls, B.: Degrading permafrost river catchments and their impact on Arctic Ocean nearshore processes, Ambio, 51, 439-455, https://doi.org/10.1007/s13280-021-01666-z, 2022.
McClelland, J. W., Holmes, R. M., Peterson, B. J., Raymond, P. A., Striegl, R. G., Zhulidov, A. V, Zimov, S. A., Zimov, N., Tank, S. E., Spencer, R. G. M., Staples, R., Gurtovaya, T. Y., and Griffin, C. G.: Particulate organic carbon and nitrogen export from major Arctic rivers, Global Biogeochem. Cy., 30, 629–643, https://doi.org/10.1002/2015GB005351, 2016.
Meredith, M., Sommerkorn, M., Cassotta, S., Derksen, C., Ekaykin, A., Hollowed, A., Kofinas, G., Mackintosh, A., Melbourne-Thomas, J Muelbert, M. M. C., Ottersen, G., Pritchard, H., and Schuur, E. A. G.: Polar Regions, in: IPCC Special Report on the Ocean and Cryosphere in a Changing Climate, edited by: Pörtner, H.-O., Pörtner, D.-O., Roberts, D. C., Masson-Delmotte, V., Zhai, P., Tignor, M., Petzold, J., Rama, B., and Weyer, N. M., Cambridge University Press, Cambridge, UK and New York, NY, USA, https://doi.org/10.1017/9781009157964.005, 2019.
Meyers, P. A.: Preservation of elemental and isotopic source identification of sedimentary organic matter, Chem. Geol., 114, 289–302, https://doi.org/10.1016/0009-2541(94)90059-0, 1994.
Osburn, C. L. and St-Jean, G.: The use of wet chemical oxidation with high-amplification isotope ratio mass spectrometry (WCO-IRMS) to measure stable isotope values of dissolved organic carbon in seawater Limnol. Oceanogr.-Meth., 5, 296–308, doi:104319/lom20075296, 2007.
Powers, L. C., Brandes, J. A., Miller, W. L., and Stubbins, A.: Using liquid chromatography-isotope ratio mass spectrometry to measure the δ13C of dissolved inorganic carbon photochemically produced from dissolved organic carbon, Limnol. Oceanogr.-Meth., 15, 103–115, https://doi.org/10.1002/lom3.10146, 2017.
Rantanen M., Karpechko A.Y., Lipponen A., Nordling, K., Hyvärinen, O., Ruosteenoja, K., Vihma, T., and Laaksonen, A.: The Arctic has warmed nearly four times faster than the globe since 1979, Commun. Earth Environ., 3, 1–10, https://doi.org/10.1038/s43247-022-00498-3, 2022.
Raymond, P. A., Saiers, J. E., and Sobczak, W. V.: Hydrological and biogeochemical controls on watershed dissolved organic matter transport: Pulse-shunt concept, Ecology, 97, 5–16, https://doi.org/10.1890/14-1684.1, 2016.
R Core Team: A language and environment for statistical computing. R Foundation for Statistical Computing, Vienna, Austria, https://www.R-project.org/ (last access: 20 November 2023), 2020.
Santoro, M. and Strozzi, T.: Circumpolar digital elevation models > 55∘ N with links to geotiff images DUEPermafrost_DEM, https://doi.org/10.1594/PANGAEA.779748, 2012.
Rogers, J. A., Galy, V., Kellerman, A. M., Chanton, J. P., Zimov, N., and Spencer, R. G. M.: Limited Presence of Permafrost Dissolved Organic Matter in the Kolyma River, Siberia Revealed by Ramped Oxidation, J. Geophys. Res.-Biogeo., 126, 1–18, https://doi.org/10.1029/2020JG005977, 2021.
Schuur, E. A. G., McGuire, A. D., Schädel, C., Grosse, G., Harden, J. W., Hayes, D. J., Hugelius, G., Koven, C. D., Kuhry, P., Lawrence, D. M., Natali, S. M., Olefeldt, D., Romanovsky, V. E., Schaefer, K., Turetsky, M. R., Treat, C. C., and Vonk, J. E.: Climate change and the permafrost carbon feedback, Nature, 520, 171–179, https://doi.org/10.1038/nature14338, 2015.
Shiklomanov, A. I., Holmes, R. M., McClelland, J. W., Tank, S. E., and Spencer, R. G. M.: Arctic Great Rivers Observatory. Discharge Dataset, Version 20211118, https://arcticgreatrivers.org/ (last access: 15 May 2023), 2021.
Siewert, M. B., Hanisch, J., Weiss, N., Kuhry, P., Maximov, T. C., and Hugelius, G.: Comparing carbon storage of Siberian tundra and taiga permafrost ecosystems at very high spatial resolution, J. Geophys. Res.-Biogeo., 120, 707–723, https://doi.org/10.1002/2015JG002999, 2015.
Stadnyk, T. A., Tefs A., Broesky, M., Déry, S. J., Myers, P. G., Ridenour, N. A., Koenig, K., Vonderbank, L., and Gustafsson, D.: Changing freshwater contributions to the Arctic: A 90-year trend analysis (1981–2070), Elementa, 9, 00098, https://doi.org/10.1525/elementa.2020.00098, 2021.
Stock, B. C. and Semmens, B. X.: MixSIAR GUI User Manual, Zenodo [code], https://doi.org/10.5281/zenodo.1209993, 2016a.
Stock, B. C. and Semmens, B. X.: Unifying error structures in commonly used biotracer mixing models, Ecology, 97, 2562–2569, https://doi.org/10.1002/ecy.1517, 2016b.
Strauss, J., Schirrmeister, L., Grosse, G., Fortier, D., Hugelius, G., Knoblauch, C., Romanovsky, V., Schädel, C., Schneider, T., Deimling, V., Schuur, E. A. G., Shmelev, D., Ulrich, M., and Veremeeva, A.: Deep Yedoma permafrost: A synthesis of depositional characteristics and carbon vulnerability, Earth-Sci. Rev., 172, 75–86, https://doi.org/10.1016/j.earscirev.2017.07.007, 2017.
Strauss, J., Laboor, S., Schirrmeister, L., Fedorov, A. N., Fortier, D., Froese, D., Fuchs, M., Günther, F., Grigoriev, M., Harden, J., Hugelius, G., Jongejans, L. L., Kanevskiy, M., Kholodov, A., Kunitsky, V., Kraev, G., Lozhkin, A., Rivkina, E., Shur, Y., Siegert, C., Spektor, V., Streletskaya, I., Ulrich, M., Vartanyan, S., Veremeeva, A., Anthony, K. W., Wetterich, S., Zimov, N., and Grosse, G.: Circum-Arctic Map of the Yedoma Permafrost Domain, Front. Earth Sci., 9, 1–15, https://doi.org/10.3389/feart.2021.758360, 2021.
Strauss, J., Laboor, S., Schirrmeister, L., Fedorov, A. N., Fortier, D., Froese, D. G., Fuchs, M., Günther, F., Grigoriev, M. N., Harden, J. W., Hugelius, G., Jongejans, L. L., Kanevskiy, M. Z., Kholodov, A. L., Kunitsky, V., Kraev, G., Lozhkin, A. V., Rivkina, E., Shur, Y., Siegert, C., Spektor, V., Streletskaya, I., Ulrich, M., Vartanyan, S. L., Veremeeva, A., Walter Anthony, K. M., Wetterich, S., Zimov, N. S., and Grosse, G.: Database of Ice-Rich Yedoma Permafrost Version 2 (IRYP v2), PANGAEA [data set], https://doi.org/10.1594/PANGAEA.940078, 2022.
Striegl, R. G., Dornblaser, M. M., Aiken, G. R., Wickland, K. P., and Raymond, P. A.: Carbon export and cycling by the Yukon, Tanana, and Porcupine rivers, Alaska, 2001–2005, Water Resour. Res., 43, W02144, https://doi.org/10.1029/2006WR005201, 2007.
Tank, S. E., Raymond, P. A., Striegl, R. G., McClelland, J. W., Holmes, R. M., Fiske, G. J., and Peterson, B. J.: A land-to-ocean perspective on the magnitude, source and implication of DIC flux from major Arctic rivers to the Arctic Ocean, Global Biogeochem. Cy., 26, 1–15, https://doi.org/10.1029/2011GB004192, 2012.
Synal, H. A., Stocker, M., and Suter, M.: MICADAS: A new compact radiocarbon AMS system, Nucl. Instrum. Methods, 25, 7-13, doi:101016/jnimb200701138, 2007.
Turetsky, M. R., Jones, M. C., Walter Anthony, K., Olefeldt, D., Schuur, E. A. G., Koven, C., McGuire, A. D., and Grosse, G.: Permafrost collapse is accelerating carbon release, Nature, 569, 32–34, https://doi.org/10.1038/d41586-019-01313-4, 2019.
Vonk, J. E., Sánchez-García, L., van Dongen, B. E., Alling, V., Kosmach, D., Charkin, A., Semiletov, I. P., Dudarev, O. V., Shakhova, N., Roos, P., Eglinton, T. I., Andersson, A., and Gustafsson, Ö.: Activation of old carbon by erosion of coastal and subsea permafrost in Arctic Siberia, Nature, 489, 137–140, https://doi.org/10.1038/nature11392, 2012.
Vonk, J. E., Mann, P. J., Davydov, S., Davydova, A., Spencer, R. G. M., Schade, J., Sobczak, W. V., Zimov, N., Zimov, S., Bulygina, E., Eglinton, T. I., and Holmes, R. M.: High biolability of ancient permafrost carbon upon thaw, Geophys. Res. Lett., 40, 2689–2693, https://doi.org/10.1002/grl.50348, 2013.
Waldron, S., Scott, E. M., and Soulsby, C.: Stable isotope analysis reveals lower-order river dissolved inorganic carbon pools are highly dynamic, Environ. Sci. Technol., 41, 6156–6162, https://doi.org/10.1021/es0706089, 2007.
Walvoord, M. A. and Kurylyk, B. L.: Hydrologic Impacts of Thawing Permafrost – A Review, Vadose Zone J., 15, 1–20, https://doi.org/10.2136/vzj2016.01.0010, 2016.
Welp, L. R., Randerson, J. T., Finlay, J. C., Davydov, S. P., Zimova, G. M., Davydova, A. I., and Zimov, S. A.: A high-resolution time series of oxygen isotopes from the Kolyma River: Implications for the seasonal dynamics of discharge and basin-scale water use, Geophys. Res. Lett., 32, 1–5, https://doi.org/10.1029/2005GL022857, 2005.
Wang, L. and Liu, H.: An efficient method for identifying and filling surface depressions in digital elevation models for hydrologic analysis and modelling, Int. J. Geogr. Inf. Sci., 20, 193–213, https://doi.org/10.1080/13658810500433453, 2006.
Wild, B., Andersson, A., Bröder, L., Vonk, J., Hugelius, G., McClelland, J. W., Song, W., Raymond, P. A., and Gustafsson, Ö.: Rivers across the Siberian Arctic unearth the patterns of carbon release from thawing permafrost, P. Natl. Acad. Sci. USA, 116, 10280–10285, https://doi.org/10.1073/pnas.1811797116, 2019.
Winterfeld, M., Goñi, M. A., Just, J., Hefter, J., and Mollenhauer, G.: Characterization of particulate organic matter in the Lena River delta and adjacent nearshore zone, NE Siberia – Part 2: Lignin-derived phenol compositions, Biogeosciences, 12, 2261–2283, https://doi.org/10.5194/bg-12-2261-2015, 2015.
Winterdahl, M., Wallin, M. B., Karlsen, R. H., Laudon, H., Öquist, M., and Lyon, S. W.: Decoupling of carbon dioxide and dissolved organic carbon in boreal headwater streams, J. Geophys. Res.-Biogeo., 121, 2630–2651, https://doi.org/10.1002/2016JG003420, 2016.
Zimov, S. A., Schuur, E. A. G., and Stuart Chapin, F.: Permafrost and the global carbon budget, Science, 312, 1612–1613, https://doi.org/10.1126/science.1128908, 2006.