the Creative Commons Attribution 4.0 License.
the Creative Commons Attribution 4.0 License.
 | 24 Sep 2024
Impact of meteorological conditions on the biogenic volatile organic compound (BVOC) emission rate from eastern Mediterranean vegetation under drought
Qian Li
Gil Lerner
Einat Bar
Efraim Lewinsohn
A comprehensive characterization of drought's impact on biogenic volatile organic compound (BVOC) emissions is essential for understanding atmospheric chemistry under global climate change, with implications for both air quality and climate model simulation. Currently, the effects of drought on BVOC emissions are not well characterized. Our study aims to test (i) whether instantaneous changes in meteorological conditions can serve as a better proxy for drought-related changes in BVOC emissions compared to the absolute values of the meteorological parameters, as indicated by previous BVOC mixing-ratio measurements and (ii) the impact of a plant under drought stress receiving a small amount of precipitation on BVOC emission rate, and on the manner in which the emission rate is influenced by meteorological parameters. To address these objectives, we conducted our study during the warm and dry summer conditions of the eastern Mediterranean region, focusing on the impact of drought on BVOC emissions from natural vegetation. Specifically, we conducted branch-enclosure sampling measurements in Ramat Hanadiv Nature Park, under natural drought and after irrigation (equivalent to 5.5–7 mm precipitation) for six selected branches of Phillyrea latifolia, the highest BVOC emitter in this park, in September–October 2020. The samplings were followed by gas chromatography–mass spectrometry analysis for BVOC identification and flux quantification. The results corroborate the finding that instantaneous changes in meteorological parameters, particularly relative humidity (RH), offer the most accurate proxy for BVOC emission rates under drought compared to the absolute values of either temperature (T) or RH. However, after irrigation, the correlation of the detected BVOC emission rate with the instantaneous changes in RH became significantly more moderate or even reversed. Our findings highlight that under drought, the instantaneous changes in RH and to a lesser extent in T are the best proxy for the emission rate of monoterpenes (MTs) and sesquiterpenes (SQTs), whereas under moderate drought conditions, T or RH serves as the best proxy for MT and SQT emission rate, respectively. In addition, the detected emission rates of MTs and SQTs increased by 150 % and 545 %, respectively, after a small amount of irrigation.
- Article
(3829 KB) - Full-text XML
-
Supplement
(1480 KB) - BibTeX
- EndNote


Biogenic volatile organic compounds (BVOCs) are released by plants and other organisms into the atmosphere. They play a critical role in both climate change and photochemical air pollution (Calfapietra et al., 2013; Curci et al., 2009; Kesselmeier and Staudt, 1999; Cai et al., 2021; Guenther, 2013; Peñuelas et al., 2009). BVOCs are thought to be emitted by plants as a defense mechanism against biotic and abiotic stresses such as herbivory and high temperatures (Peñuelas and Munné-Bosch, 2005; Blande et al., 2007; Brilli et al., 2009; Berg et al., 2013). BVOCs may also be involved in plant–plant and plant–animal communication, allowing plants to signal to other organisms about their response to environmental conditions (Baldwin et al., 2006; Filella et al., 2013; Niinemets and Monson, 2013).
The emission rate and composition of BVOCs can vary widely depending on various factors such as meteorological conditions, rate of synthesis, and physicochemical properties (Niinemets and Monson, 2013). Climate change is expected to significantly impact the BVOC emission rate and composition. As temperature rises, the emission rate of most BVOCs increases in an Arrhenius-type manner (Goldstein et al., 2004; Greenberg et al., 2012; Guenther et al., 1995; Monson et al., 1992; Niinemets et al., 2004; Tingey et al., 1990). On the other hand, drought can have a more complex effect on the emission and composition of BVOCs. Depending on the type of vegetation, the level of drought stress, and additional ambient conditions, the emission of BVOCs can be partially or completely suppressed (Fortunati et al., 2008; Peñuelas and Staudt, 2010; Holopainen and Gershenzon, 2010; Llusia et al., 2016; Schade et al., 1999) or enhanced in a way that has not yet been characterized (Potosnak et al., 2014; Geron et al., 2016; Fitzky et al., 2023).
The effect of drought on isoprene emission has been extensively studied, and it was discovered to be postponed relative to and/or less significant than the effect on photosynthetic rate (Asensio et al., 2007; Brilli et al., 2007; Fortunati et al., 2008; Pegoraro et al., 2006; Ryan et al., 2014). However, isoprene emission may only slightly decrease or increase under moderate drought stress, but it was shown to decrease considerably under severe or prolonged drought stress (Fortunati et al., 2008; Jiang et al., 2018; Han et al., 2022). The impact of drought on the emission of other BVOCs, such as monoterpenes (MTs) and sesquiterpenes (SQTs), has been studied less.
The eastern Mediterranean has a unique climate characterized by a hot and dry summer, making it an ideal location to study the impact of drought on BVOC emissions. The semiarid and arid regions are particularly vulnerable to climate change, and climate simulations predict that the eastern Mediterranean region will experience more frequent and severe droughts in the future (Lionello, 2012; Giorgi and Lionello, 2008). Research conducted in Israel has investigated the impact of drought on BVOC emissions from a range of local plant species. For example, Llusia et al. (2016) examined the effect of drought on terpene emissions from Yatir Forest, a pine forest in the northern Negev. They found that some of the MT and SQT emissions increased under moderate drought conditions but strongly decreased under severe drought conditions. Another measurement by Li et al. (2024), performed in late autumn 2016 in Shibli Forest in northern Israel, found that under severe drought stress, BVOC emissions respond more significantly to the instantaneous changes in meteorological parameters (especially relative humidity, RH) than to the meteorological parameters themselves. These studies suggest that the impact of drought on BVOC emissions is not well-characterized and varies in a complex manner depending on plant species, BVOC type, and meteorological parameters such as temperature (T) and RH, as well as according to the level of drought stress. Hence, more research is needed to better characterize the effect of drought on BVOC emission rates and composition, which can in turn improve air quality and climate modeling.
In this study, we use the severe drought conditions during the autumn in the eastern Mediterranean to study the effect of drought on the emission of BVOCs from natural vegetation. The main specific objectives of this study were (i) to identify whether instantaneous changes in meteorological parameters can serve as a better proxy for BVOC emission rates under drought than their absolute values and (ii) to determine the extent to which small amounts of precipitation, under drought conditions, can impact BVOC emission rates and determine the manner in which the emission rate is influenced by meteorological parameters.
We used an enclosure-based measurement system to quantify BVOC emissions, allowing for direct measurement of BVOC fluxes at the branch level. The measurements were performed in autumn under the prolonged drought stress conditions typical to this region. BVOC measurements in the eastern Mediterranean are rare, and to the best of our knowledge, our study is the first to apply direct measurements of BVOC flux from specific branches of natural vegetation in this region. Plants were sampled before and after the application of a small amount of irrigation to study the response of BVOC emissions, under exposure to natural drought conditions, to a small amount of precipitation. This was followed by gas chromatography–mass spectrometry (GC–MS) to identify and quantify the emitted BVOCs. Closed chambers are often used for measurement of BVOCs at the branch level (Duhl et al., 2008). Compared to open-system methods, the enclosure-based system (including a glass cuvette or Tedlar bag) can focus on specific vegetation in a more controlled manner. To investigate the effects of drought on BVOC emission rates and composition, we performed two sets of measurements – before and after irrigation – for comparison. To study the effect of meteorological conditions on BVOC flux, we monitored meteorological parameters inside the bag and at a meteorological station that was 300–600 m from the branches.
2.1 Sampling site and studied species
The on-site branch measurements were conducted at Ramat Hanadiv Nature Park ( N, E), 3.6 km from the eastern Mediterranean seashore and exposed to a typical eastern Mediterranean climate with annual precipitation of 640 mm (averaged over the last 5 years and occurring mainly between November and March). The vegetation at the site is dominated by mixed Mediterranean shrubbery. More details about the site and vegetation can be found in Li et al. (2018) and Dayan et al. (2020). The measurements were conducted at the end of summer and beginning of autumn under drought conditions. No precipitation was recorded for 108 d between 24 May 2020 and the beginning of the study on 9 September 2020.
Phillyrea latifolia (broad-leaved phillyrea), identified as the greatest BVOC-contributing plant species in the Ramat Hanadiv Nature Park, was sampled. The species is native to the Mediterranean Basin and belongs to the family Oleaceae. In Ramat Hanadiv, it accounts for 7.5 % of all vegetation but up to ∼35 % of all BVOC emissions, according to the Model of Emissions of Gases and Aerosols from Nature (MEGAN v2.1; Guenther et al., 2012; Dayan et al., 2020; Li et al., 2018). The selected plants were mature and did not show any visible signs of senescence. Sampled branches were shaded, to eliminate the effect of non-natural high temperature in the enclosure system, and measurements were performed at 1.5 to 2 m above ground.
2.2 Branch-enclosure sampling system and setup
Figure 1 presents the self-made branch-sampling system that was used for this study. All tubes and connections are Teflon, while valves and flowmeters are stainless steel. A compressor provides a controllable rate of ambient airflow through an adjustable T-junction valve (to adjust the flow rate) to a zero-air device (model 1150 dual reactor, Thermo Fisher Scientific, Waltham, MA, USA), which includes a catalytic converter heated to ∼350 °C to oxidize carbon monoxide (CO) and hydrocarbons (HC) to carbon dioxide (CO2) and water (H2O). From the zero-air device, the air flows through a copper coil to cool it down and then through a mass flowmeter into a Tedlar bag (CEL Scientific Corporation, Cerritos, CA, USA) at a flow rate of about 7 L min−1 (monitored by flowmeter A), a high-enough inflow to produce slight overpressure inside the bag. The inert and transparent 10 L Tedlar bag is tied tightly around a tree branch, along with an EL-MOTE-TH temperature and RH sensor (Lascar Electronics, Whiteparish, Wiltshire, UK). The outlet airflow (∼4 L min−1, monitored by flowmeter B) is directed to the C2-CAXX-5032 hydrophobic inert-coated stainless-steel adsorbent tube (CSLR, Markes International, Llantrisant, UK), filled with a mixture of Tenax TA and Carbograph as adsorbent, at a rate of ∼0.2 L min−1 (monitored by flowmeter C), regulated by the T-junction valve downstream of flowmeter B. The flow rate through the adsorbent tube, as well as T and RH, were recorded with a CR1000 data logger (Campbell Scientific, Logan, UT, USA).
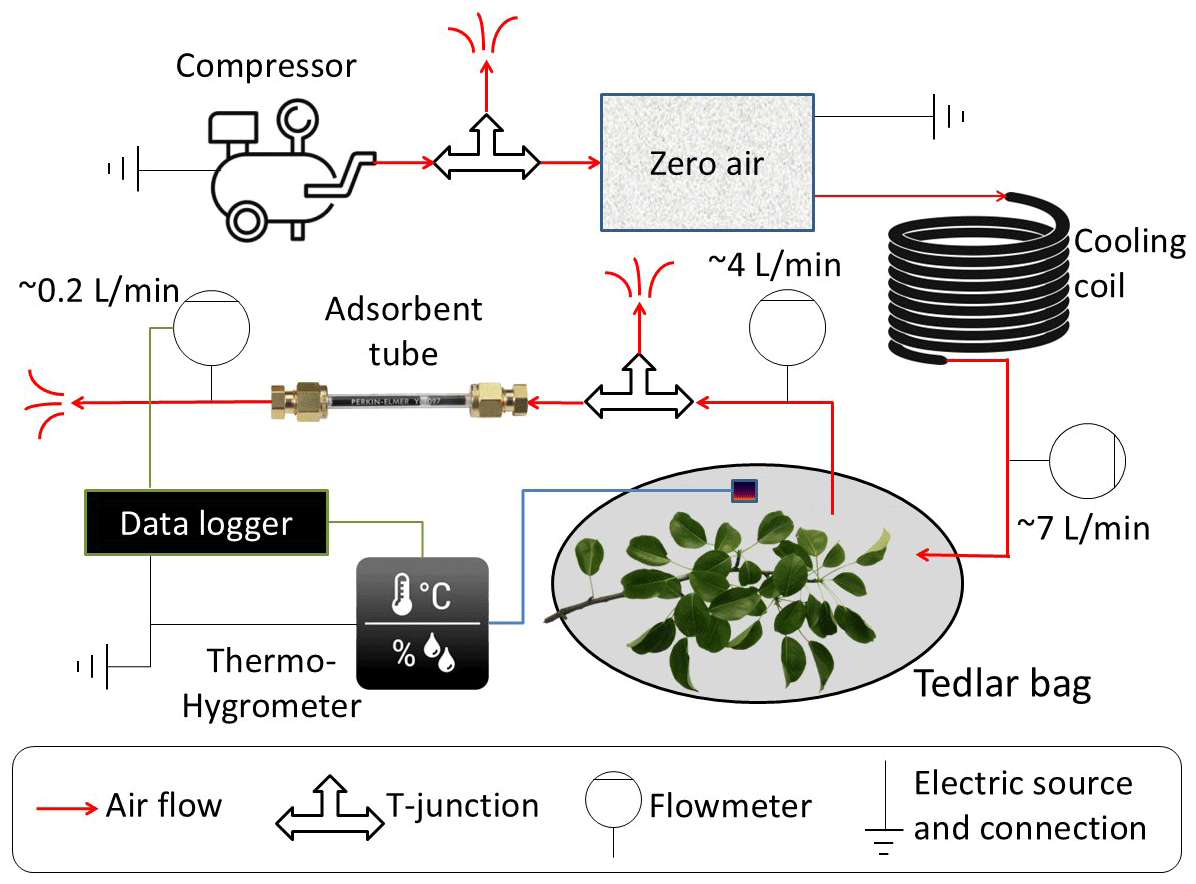
Figure 1Schematic of the branch-enclosure sampling system. VOCs are removed from the ambient air before entering a transparent Tedlar bag and an adsorbent tube to monitor BVOC emissions from the enclosed branch, using a flow-controlled system (see Sect. 2.2).
2.3 Analytical quantification of the sampled BVOCs
A Centri™ (Markes International) preconcentration system was used to desorb the tubes into the cold trap (graphitized carbon trap used for sampling VOCs of C4/5 to C30/32) under the following conditions: desorption for 5 min at 280 °C with a trap flow of 30 mL min−1. Desorption of the trap was at a rate of 20 °C s−1 to 300 °C into an Agilent GC–MS (7890A/5975C) system (Santa Clara, CA, USA) equipped with a Stabilwax column (Restek, 30 m, 0.25 mm ID capillary column and polyethylene glycol, 0.25 µm film thickness). The general run parameters were as follows: injector – 230 °C; column oven – initial temperature of 45 °C for 5 min followed by a ramp of 5 °C min−1 to 120 °C, then 20 °C min−1 to 240 °C final temperature and 5 min hold (for a total run time of 31.5 min); carrier gas – He 32 psi; mass spectrometer ionization energy – 70 eV; – 41 to 300; and scan time – 5.4 s. The chromatograms were analyzed using MassHunter Quant Analysis (B.10.00, Agilent Technologies, Santa Clara, CA, USA) software. Compounds were identified by comparing their relative retention indices and mass spectra with those of authentic standards or those found in the literature, supplemented by the W10N14 and 2205 GC–MS libraries.
We chose to analyze the most abundant BVOC species: for MTs, cis-β-ocimene (E, Z), and for SQTs, β-caryophyllene, α-humulene, α-farnesene, and germacrene-D. For calibration, analytical-grade standard solutions (7–12 concentrations) were prepared, ranging in concentrations from 0.25 to 1000 ng mL−1, by diluting known masses of pure chemicals with methanol. The calibration analytes were injected using a GC syringe into clean sorbent tubes connected to a calibration-solution-loading rig (Markes International) at a nitrogen flow of 80 mL min−1 for 5 min. The standards for the BVOC species were cis-β-ocimene (E, Z) (W353977, Sigma-Aldrich) for MTs, and β-caryophyllene (22075-1ML-F, Sigma-Aldrich), α-humulene (PHL83351, Sigma-Aldrich), α-farnesene (Biosynth® Carbosynth Ltd., UK), and germacrene-D (Toronto Research Chemicals, Canada) for SQTs, according to the most abundant species (see Sect. 2.4). The sampled solution was mixed with 5 µL of each compound in the solvent. All standard-loaded tubes were prepared in triplicate and the results were averaged. The loaded tubes were analyzed under the same conditions used for the other samples. Standard curves of peak area counts vs. VOC mass (µg) were fitted using linear regression analyses; both yielded high regression coefficients (r2≥0.99 in most cases). More details on the calibration are provided in Sect. S1 in the Supplement. For the minor MTs and SQTs, the calibration curve of cis-β-ocimene (E, Z) and the averaged calibration curve of the four most abundant SQTs were used for a rough estimation of their emission rates.
2.4 Experimental setup
2.4.1 Branch sampling, meteorological parameter measurements, and flux evaluation
The field measurements were performed from late summer to early autumn – 9 September to 27 October 2020. Sampling was conducted on six selected Phillyrea latifolia branches on different bushes. Each branch was measured over 2 sequential days: 8–9 September, 14–15 September, 22–23 September, 12–13 October, 19–20 October, and 26–27 October. The bushes were at least 20 m apart, to enable selective irrigation of individual shrubs. Meteorological parameters were measured at a distance of 300–600 m from the branch measurements. These parameters included T and RH, measured using a Campbell HC2S3 probe; net radiation, measured with a CNR4 Kipp & Zonen net radiometer; and wind speed and direction, recorded by a 05103 R. M. Young sensor. Eight 30 min samplings were performed per measurement day. In addition, two reference samplings were performed with the full equipment setup but no branch inside the bag. These reference samplings were performed before and after the eight measurements. On each measurement day after completing the first sampling for reference, the system and branches were given at least 60 min to adapt to the different conditions after placing the branch into the bag and setting up the equipment. At the end of the first measurement day, the sampled branch was removed from the bag and returned after the reference sampling on the second day. Following the ninth sampling on the second measurement day of each 2-sequential-day period, the sampled branch was cut and sent to the laboratory for leaf analysis. Leaf wet weight and area were evaluated within 24 h of cutting the branch. All leaves were scanned, and a digital color-based image-processing method was used to identify the total (RGB values of 40–200, 50–200, 30–200) and healthy (RGB values of 40–110, 50–105, 30–80) leaf areas. The leaves were then dried for 72 h at 60 °C, and their net dry weight was recorded.
The sampling tubes were kept in a cooler with a temperature below 5 °C after the measurement and analyzed within 5 d of sampling by GC–MS (see Sect. 2.3). Of the identified species, one MT and four SQT compounds (cis-β-ocimene, β-caryophyllene, α-humulene, α-farnesene, and germacrene D) with the highest sampled mass for each of the branches were chosen for quantification by GC–MS (see Sect. 2.3).
The emission rate of BVOCs per leaf area, EA (), for a branch was evaluated using the following formula:
where m (ng) is the evaluated mass of any BVOC compound inside the tube; Fin-B (L min−1) and Fout-T (mL min−1) are the flow rate pumped into the bag and the flow rate through the adsorbent tube, respectively; A (cm2) is the total leaf area of the branch; and t (h) is the sampling time.
The emission rate of BVOCs per biomass, EM (), was evaluated using
where M (g) is the leaf biomass of the branch.
2.4.2 Irrigation and soil water content quantification
Manual irrigation was applied at the end of the first measurement day of each 2-sequential-day measurement period (see Fig. 2). The irrigation amounts were 50–70 L within a radius of 1–2 m from the stem of the plants used for sampling (equivalent to 5.5–7 mm rain). This irrigation served to identify the potential effect of a small precipitation event during a drought period on the BVOC emission rate and composition.
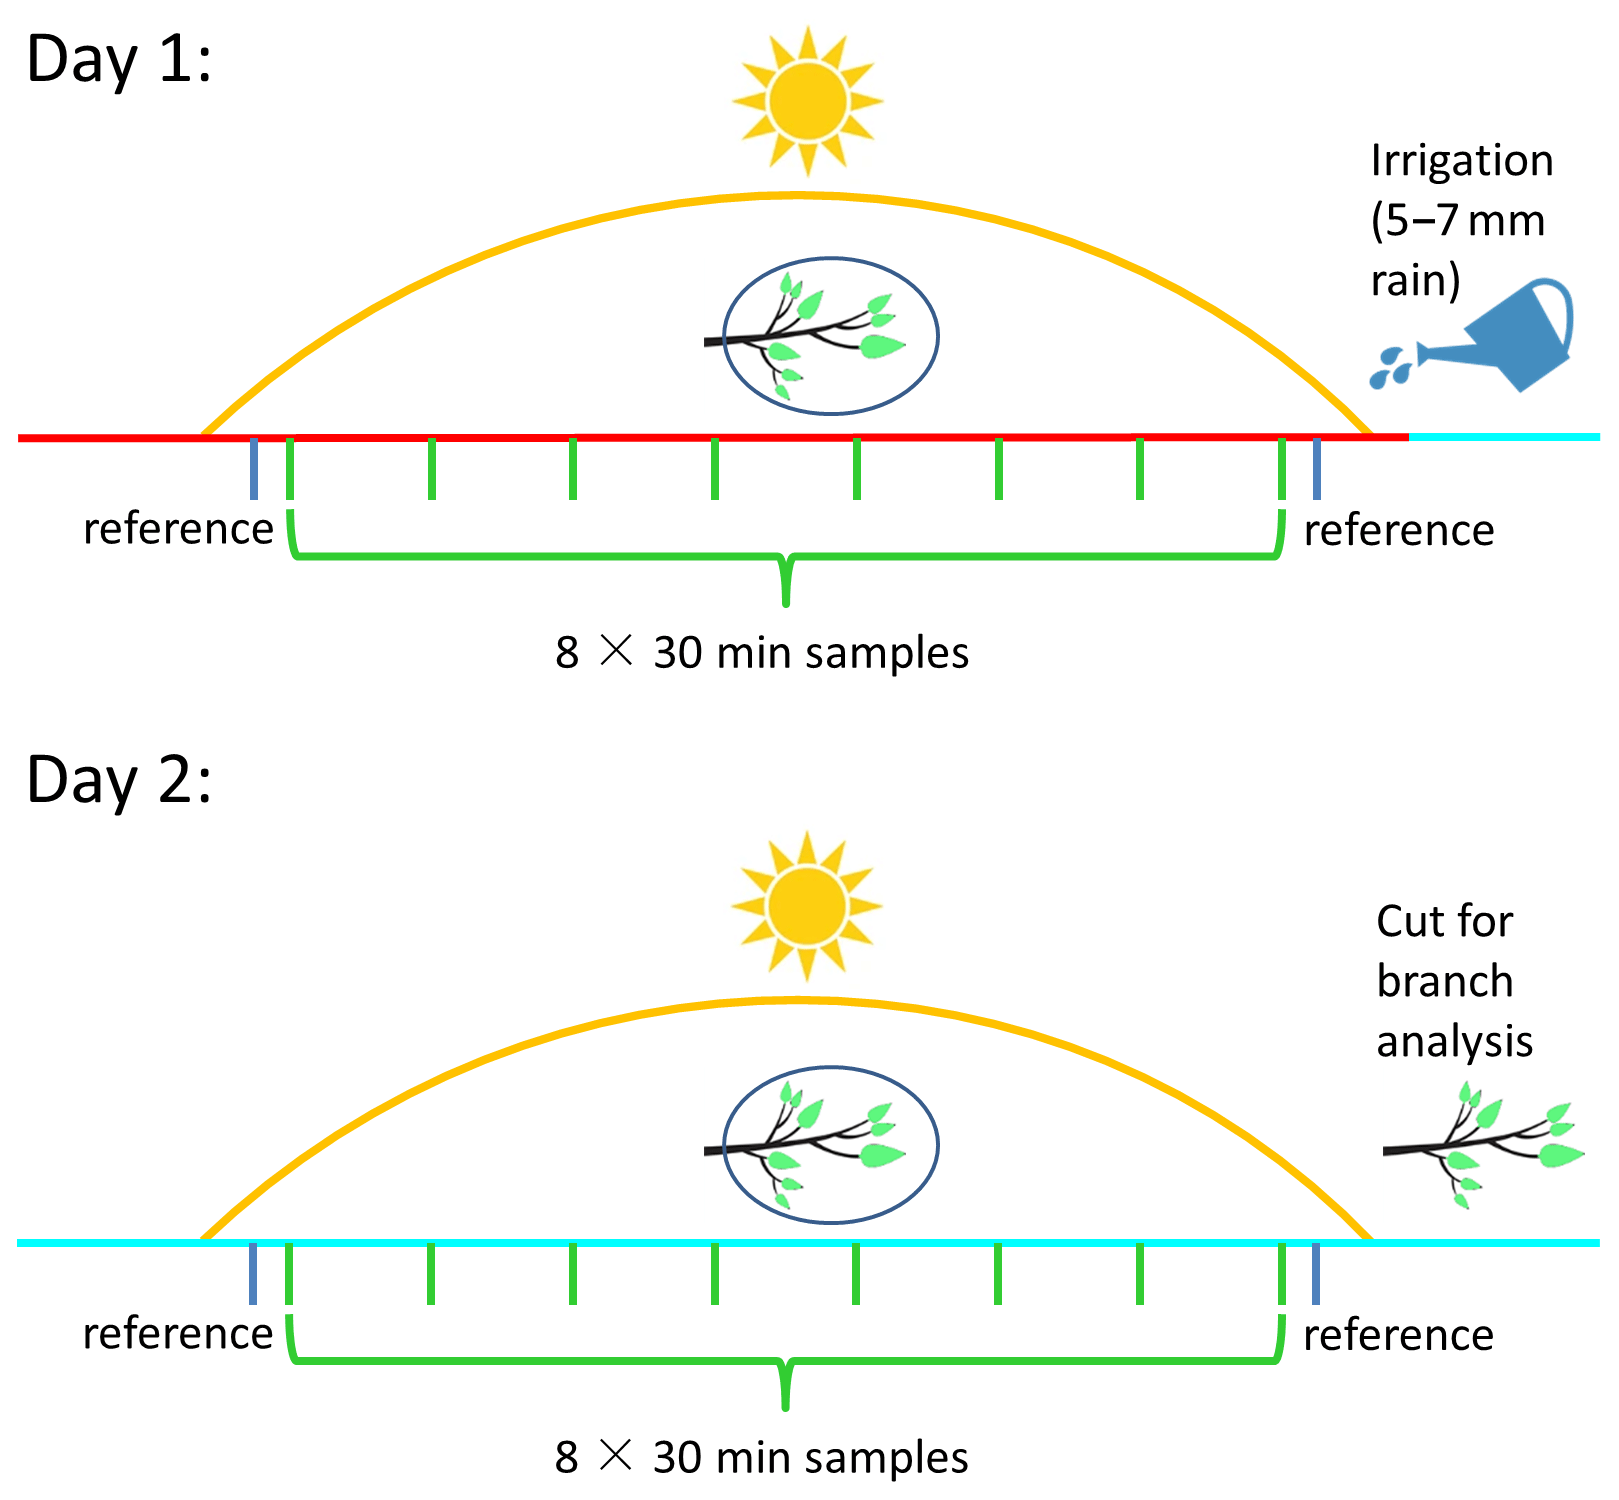
Figure 2Schematic of the experimental design. Day 1 and day 2 represent, respectively, the first and second day of each two-sequential-day sampling period for a specific branch. Green and blue bars represent sampling measurements and reference measurements, respectively. The red and cyan lines mark sampling prior to manual irrigation on day 1 and after manual irrigation on day 2, respectively.
Ten soil samples were collected at solar noon within 2 m of the sampled plant on every experimental day. To evaluate the soil water content, soil samples were weighed on the day of collection and weighed again after drying them in an oven at 105 °C for 24 h. The following formula was used to calculate the soil water content:
where w (g g−1) is the soil gravimetric water content and Mtot (g) and Mdry (g) are the total and dried soil mass, respectively.
2.4.3 Correlation between BVOC emission rate and temporal changes in RH and T
To test the effect of instantaneous changes in RH and T on the emission rate of the sampled BVOCs, we studied the correlation between the temporal changes in both ambient air RH and T with the BVOC emission rate during the sampling. The BVOC sampling length was 30 min, with a gap of 1 h between each sampling. To account for instantaneous changes in RH and T, we introduce δRH and δT, respectively. δRH is defined as follows:
where i is the 10 min time step according to the available measurement frequency, and n is the number of time steps.
δT is defined in the same manner as follows:
The correlations between δRH, δT, and the BVOC fluxes for all samples were tested for different values of n. In a preliminary test, it was found that the highest average correlations of δRH and δT with the BVOC emission rate were obtained when n=9. Accordingly, the calculation duration of δRH and δT began 60 min before each 30 min BVOC emission rate sampling. This finding is consistent with a similar analysis conducted by Li et al. (2024). Similarly, the correlation between δRH and δT and BVOC emission rate in that study applied δRH and δT, which were calculated for 90 min cycles, while the beginning of each cycle was 60 min prior to the beginning of each compatible 30 min BVOC sampling.
2.4.4 Afternoon emission trend (AET) analysis
Under drought conditions, the increased stomatal resistance can largely reduce the BVOC emission rate (see Sect. 1). Accordingly, it was found that the BVOC mixing ratio tends to reach a minimum around noontime, when RH tends to reach its daily minimum and stomatal conductance is limited (Nobel, 1999), and then gradually increases in the afternoon (Li et al., 2024). Our observations indicated a clear increase in BVOC emission rates during the afternoon for the days before the irrigation. On those days, no clear decrease in BVOC emission was observed before noon; instead, the BVOCs generally exhibited lower emission rates. Here we introduce a method for quantifying the trend in emission rates right after the midday minimum, which applies the afternoon emission trend (AET) index:
where Ei is the emission rate of the ith sample, and i=1 indicates the minimum value around noontime, between 12:00 and 14:00 LT. Hence, the AET indicates the trend and magnitude of the emission in the afternoon of any measurement day.
3.1 Analysis of branch leaves
Figure 3 shows the total leaf area (cm2), green leaf area (cm2), leaf water content, and soil moisture before and after irrigation of each sampling branch. Leaf green area ranged from 68 % to 89 % of the total leaf area. Soil moisture ranged from 12.5 % to 14.0 % before irrigation and from 14.3 % to 26.2 % after irrigation. Interestingly, the leaf water content after irrigation increased gradually during the experimental period, indicating that the capacity for water uptake from the soil increases with drought prolongation.
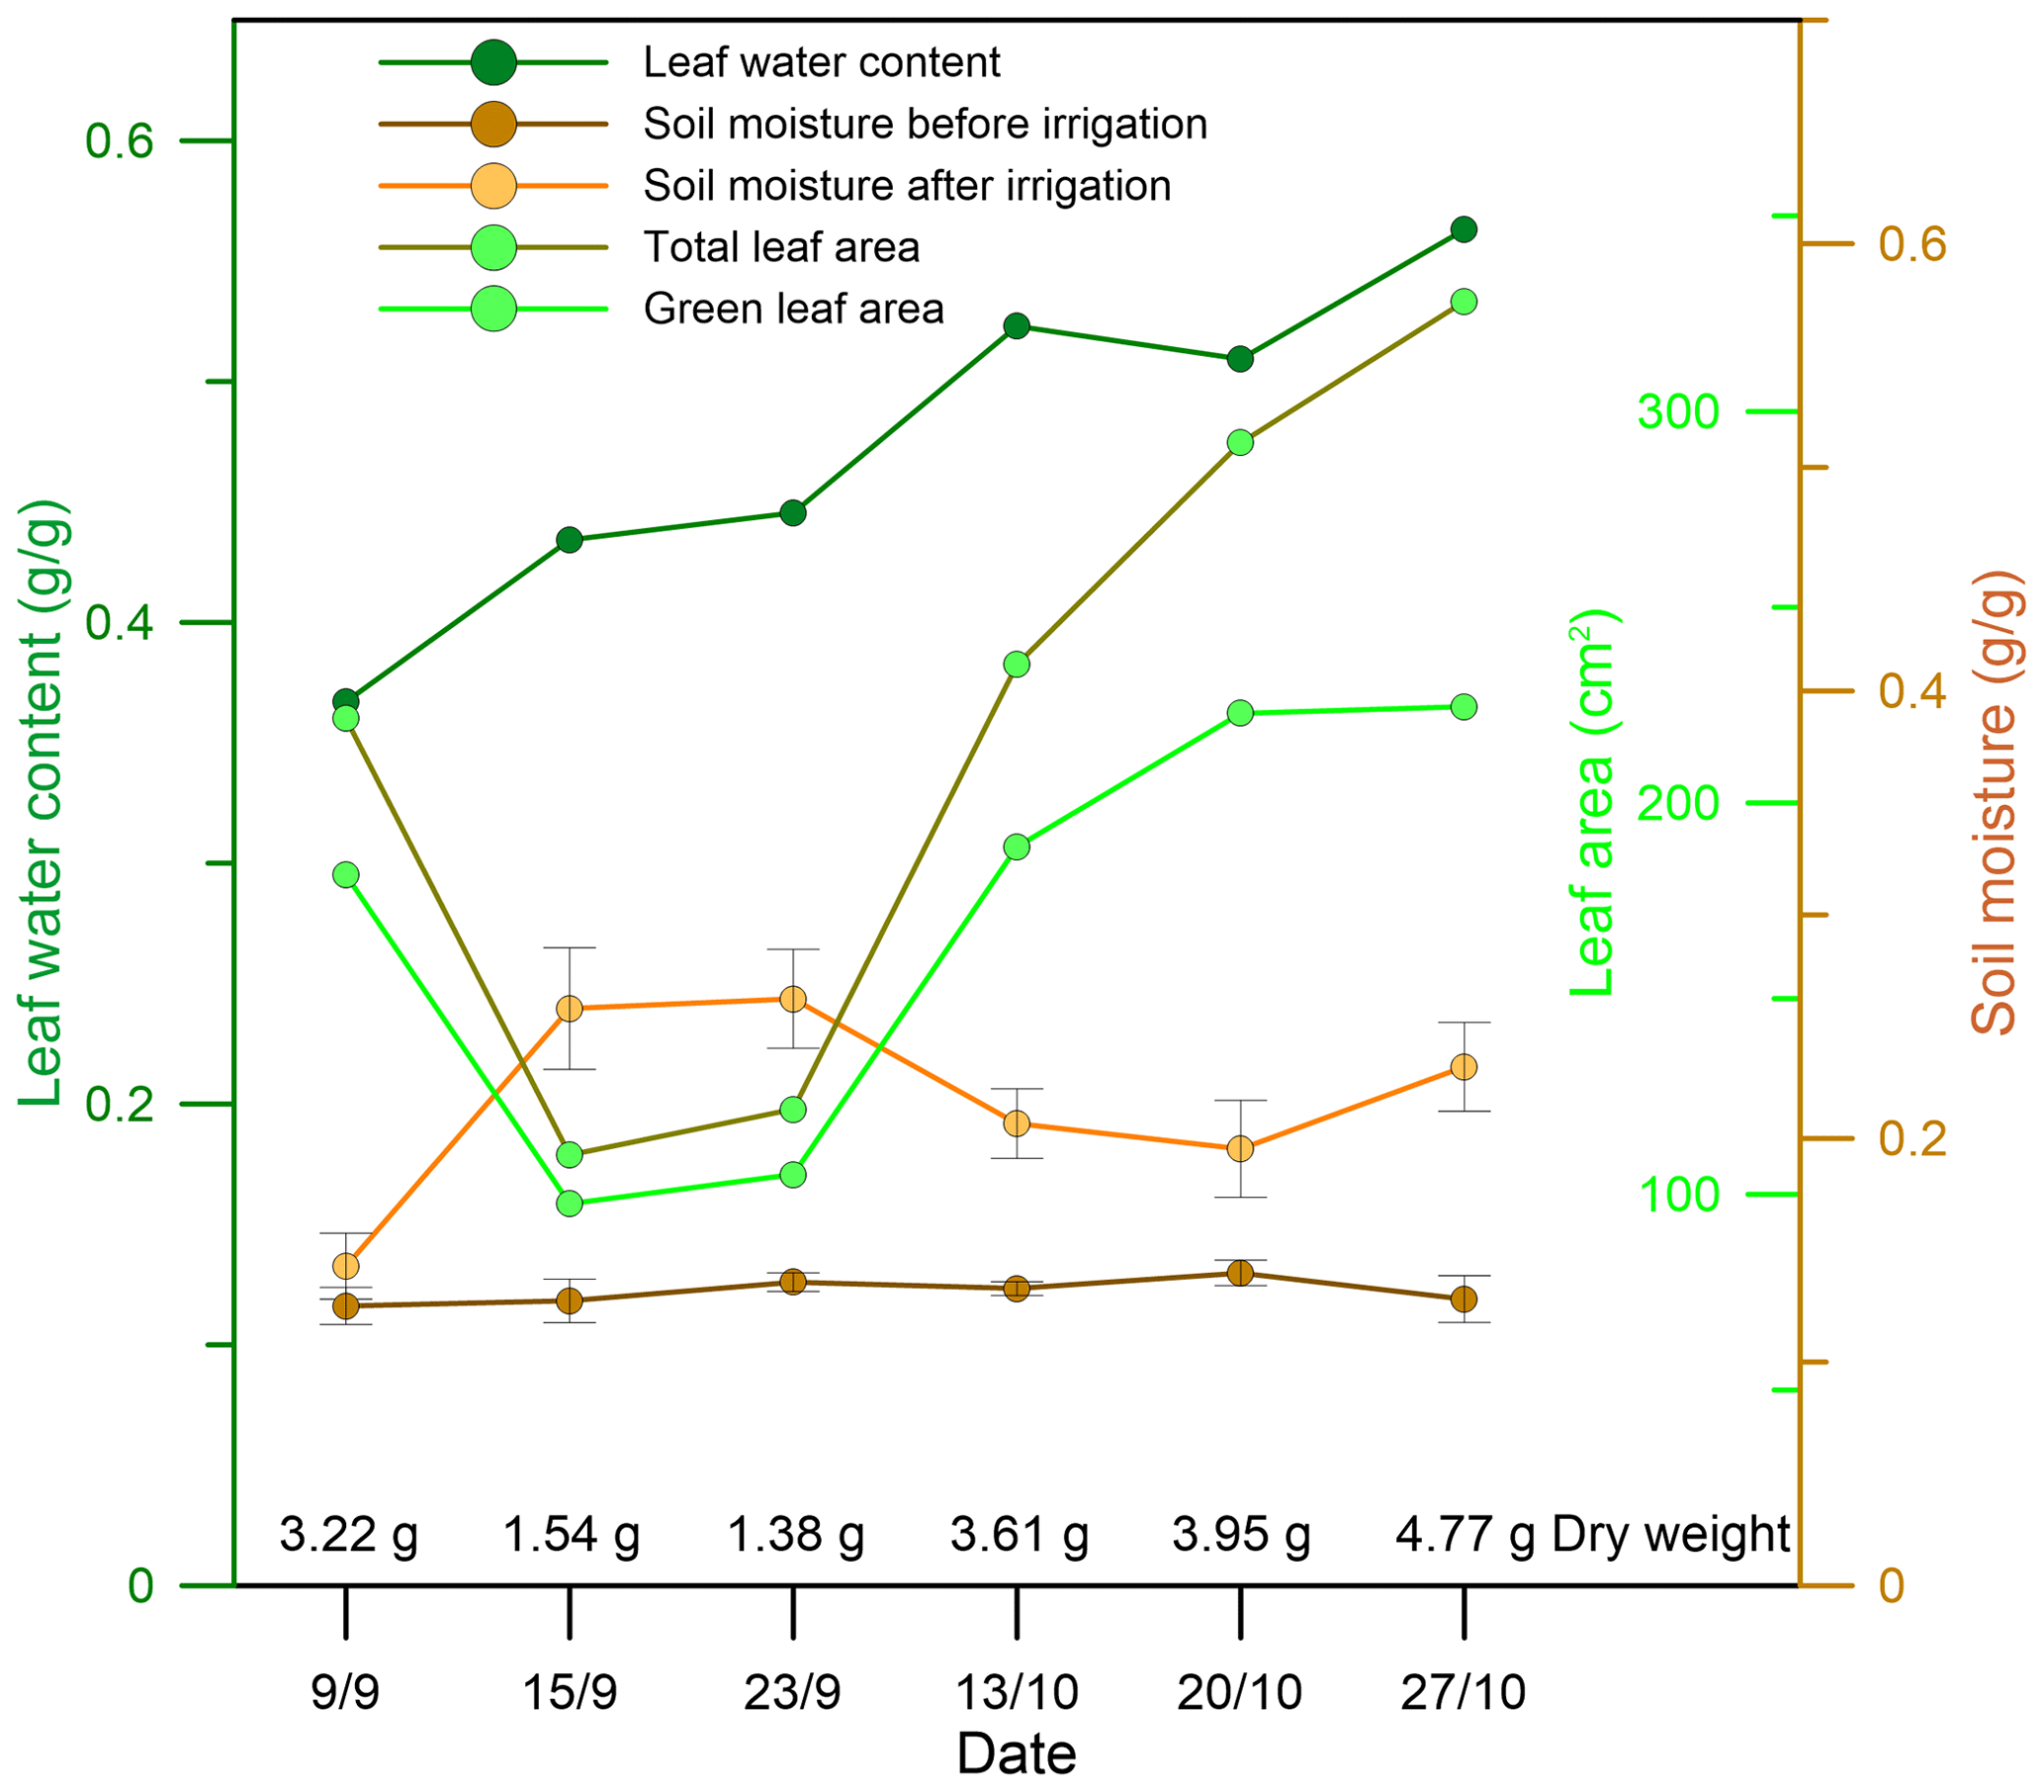
Figure 3Properties of the sampled branch leaves and soil moisture within a radius of 1 m from the stem of the sampled plant. Leaf property values presented are averages over all sampled branch leaves.
3.2 Emission rates of MTs and SQTs
While previous branch-enclosure studies focused primarily on isoprene emissions (Genard-Zielinski et al., 2015, 2018; Saunier et al., 2017), our measurements did not detect large amounts of isoprene emissions from the selected Phillyrea latifolia, in line with previous studies showing that some plant types do not emit notable amounts of isoprene (Bracho-Nunez et al., 2013; Aydin et al., 2014). Our analysis focused on the MTs and SQTs detected in our observations, as described in the following section.
3.2.1 MTs
On all 10 sampling days for which MTs were identified, the 5 d prior to irrigation were under drought conditions (i.e., more than 100 d since the last precipitation event), and 5 d were under irrigation conditions on the same branches (see Sect. 2.4.2). The branch that was sampled on 14–15 September did not show any detectable MT emissions. The diurnal emission fluxes of MTs from the branches are shown in Fig. 4.
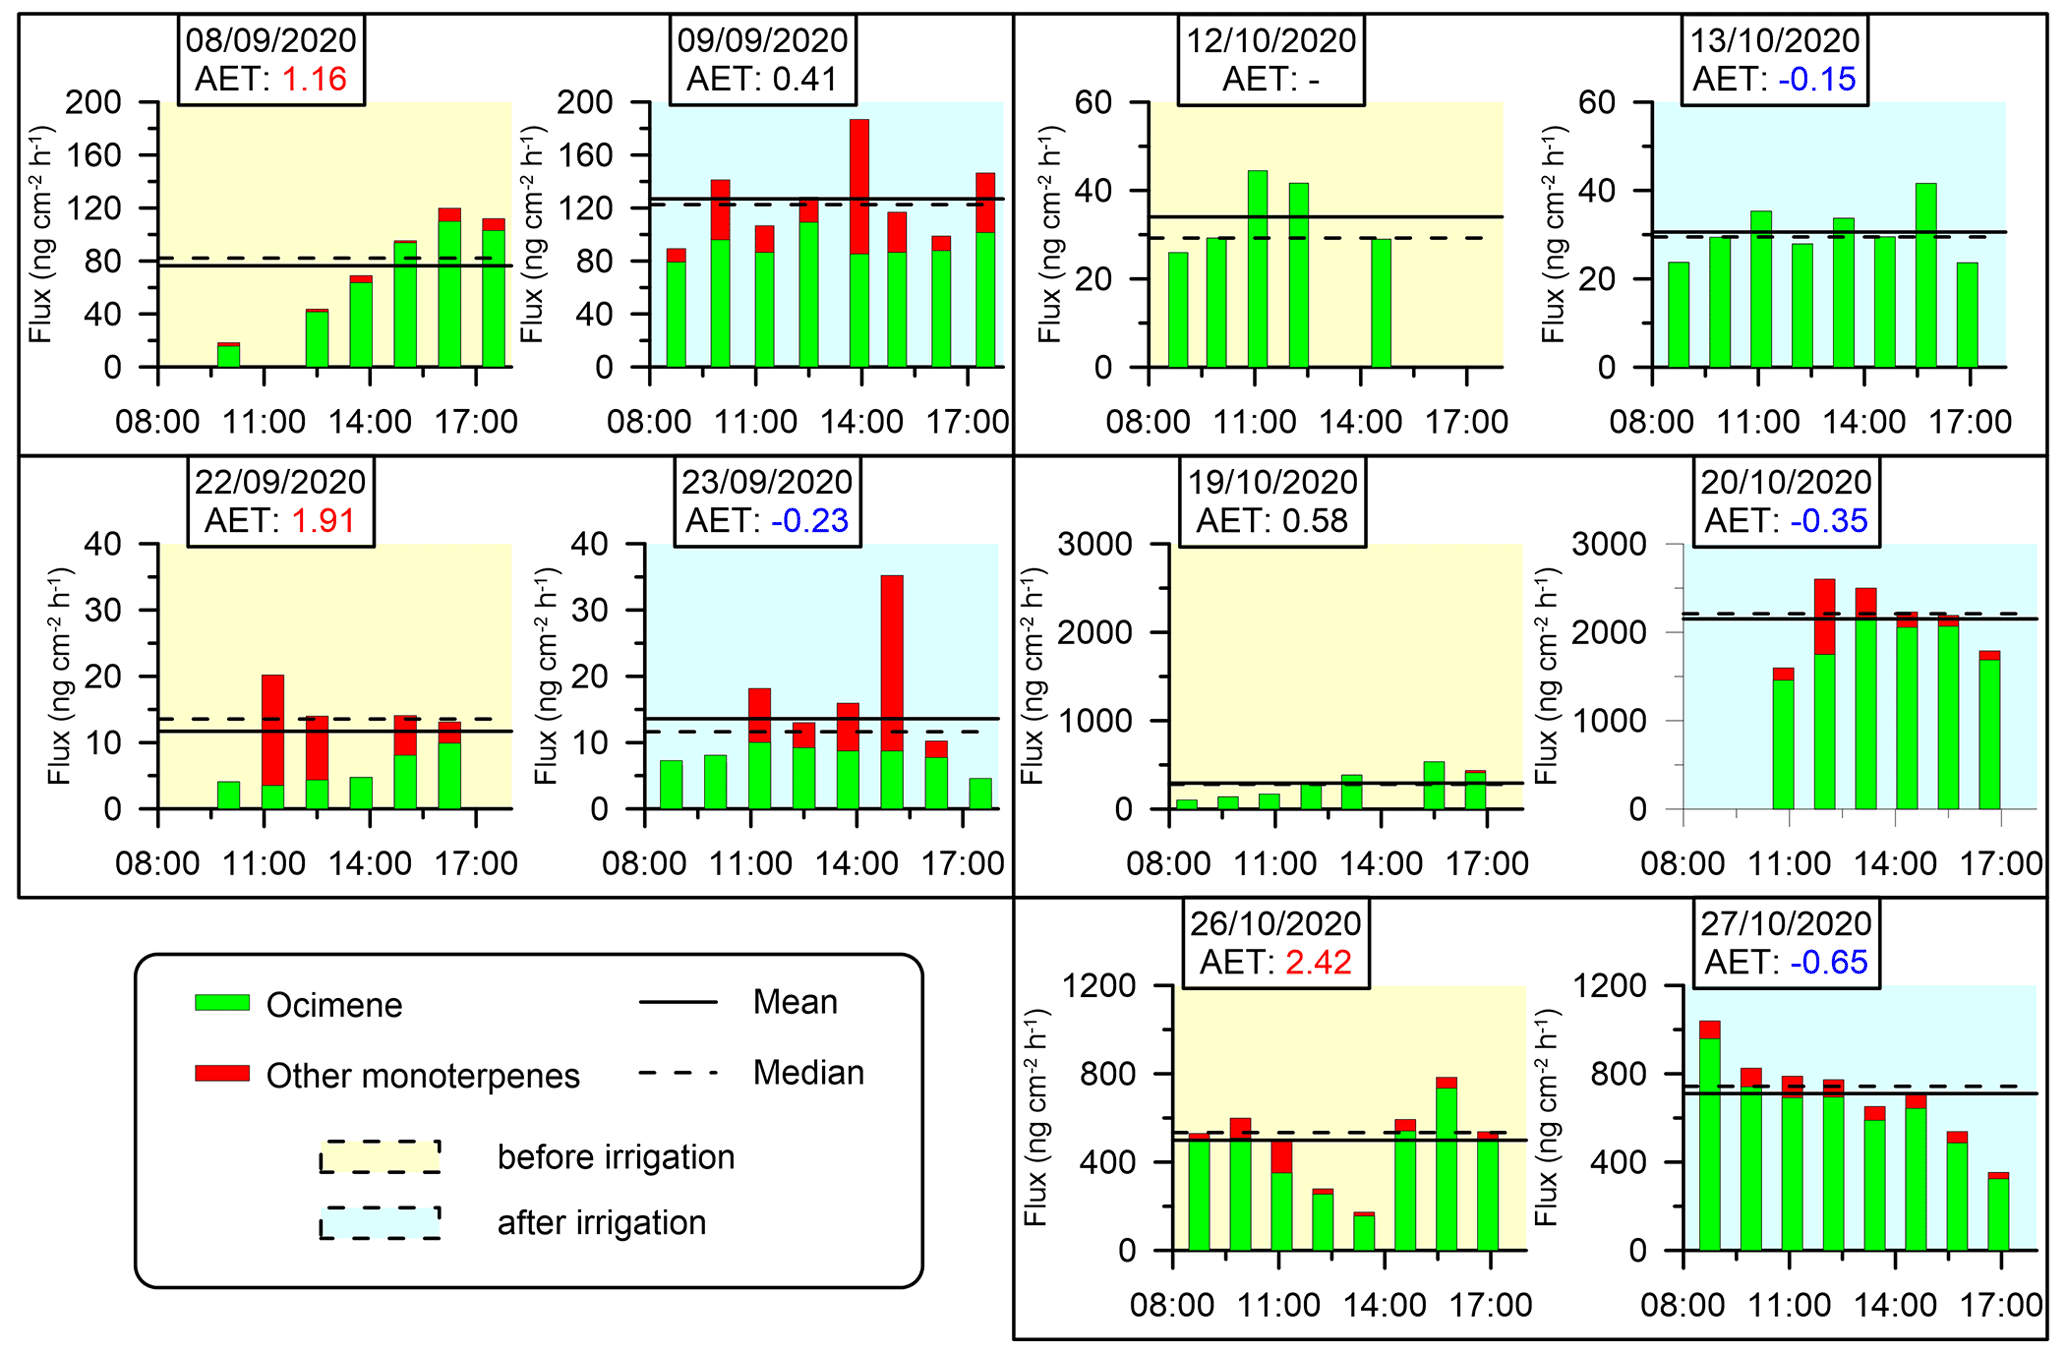
Figure 4Branches' diurnal MT emission fluxes. No MTs were detected for the branch sampled on 14–15 September. Yellow and blue shading indicates the days before and after irrigation, respectively (see Sect. 2.4.2). Solid and dashed horizontal lines are the daytime mean and median fluxes of MTs, respectively. AET values (see Sect. 2.4.4) are marked in red and blue when they are larger than 1 or when negative, respectively.
The daily average emission rate of MTs over all sampling days ranged from 11.7 to 2151.4 (0.89–121.5 ), with cis-β-ocimene being the most abundant for each of the sampling branches, averaging to 88 % of all detected MTs. These MT emission rates are similar to previous branch-enclosure studies conducted predominantly between May and October under western Mediterranean conditions, where the rates ranged from 0 to approximately 140 (Bracho-Nunez et al., 2013; Street et al., 1997; Owen and Hewitt, 2000; Staudt et al., 2001; Núñez et al., 2002; Owen et al., 1997; Llusià and Peñuelas, 2000). Less information is available on the emission rates of MTs in the eastern Mediterranean. Aydin et al. (2014) used a branch-enclosure system to detect emission rates ranging from 0.0047 to 14.2 in 14 different forested areas in Türkiye. Seco et al. (2017) quantified MT emissions using eddy covariance method in pine forests in Israel, studying a semiarid site (Yatir) and a Mediterranean sub-humid site (Birya) in the spring. Emission fluxes were found to average to 40 (Yatir) and 100 (Birya), with peak values of 100 (Yatir) and 190 (Birya) , while the daytime standardized MT emission capacities were similar across both sites.
In our study, MT emissions under drought conditions ranged from 11.7 to 499.0 , which are somewhat higher than other values reported in the eastern Mediterranean. It is important to note that differences in emission rates between our study and the previously reported values in this region might be attributed to the different measurement methodologies employed. Following irrigation, the mean daily MT emission rates increased in four out of the five investigated branches and ranged from 13.6 to 2151.4 . This reflects a 150 % average increase for all sampling days in the range of emission rates following irrigation, indicating that even a small amount of water during a period of drought stress can significantly influence MT emissions. This effect may be related to the dramatic increase in stomatal conductance due to the increase in water availability following irrigation (Miyashita et al., 2005; Medrano et al., 2002; Vilagrosa et al., 2003). It is also observed that on some of the sampling days, the composition of MTs tends to become more diverse after irrigation compared to before irrigation, warranting further study.
AET (Sect. 2.4.4) values specified in Figs. 4 and 5 reinforced the significant effect of small amounts of irrigation on BVOC emission rates under drought, considering that on drought days, AETs were high and positive, whereas after irrigation, AETs became moderate or negative. This observation is consistent with previous studies showing that the emission of BVOCs can be affected by the vegetation's stomatal activity, which tends to be lower around noontime during drought stress (Li et al., 2019; Seco et al., 2017). Stomatal resistance is typically 2 orders of magnitude larger than cuticular resistance (Nobel, 1999), and therefore, the midday minimum and the following increase in MT emissions under drought conditions may be mostly due to stomatal resistance, which can limit the exchange of gases between the plant and the atmosphere. In other words, the increased emission of MTs after irrigation may be due to reopening of the stomata, which allows for the release of VOCs.
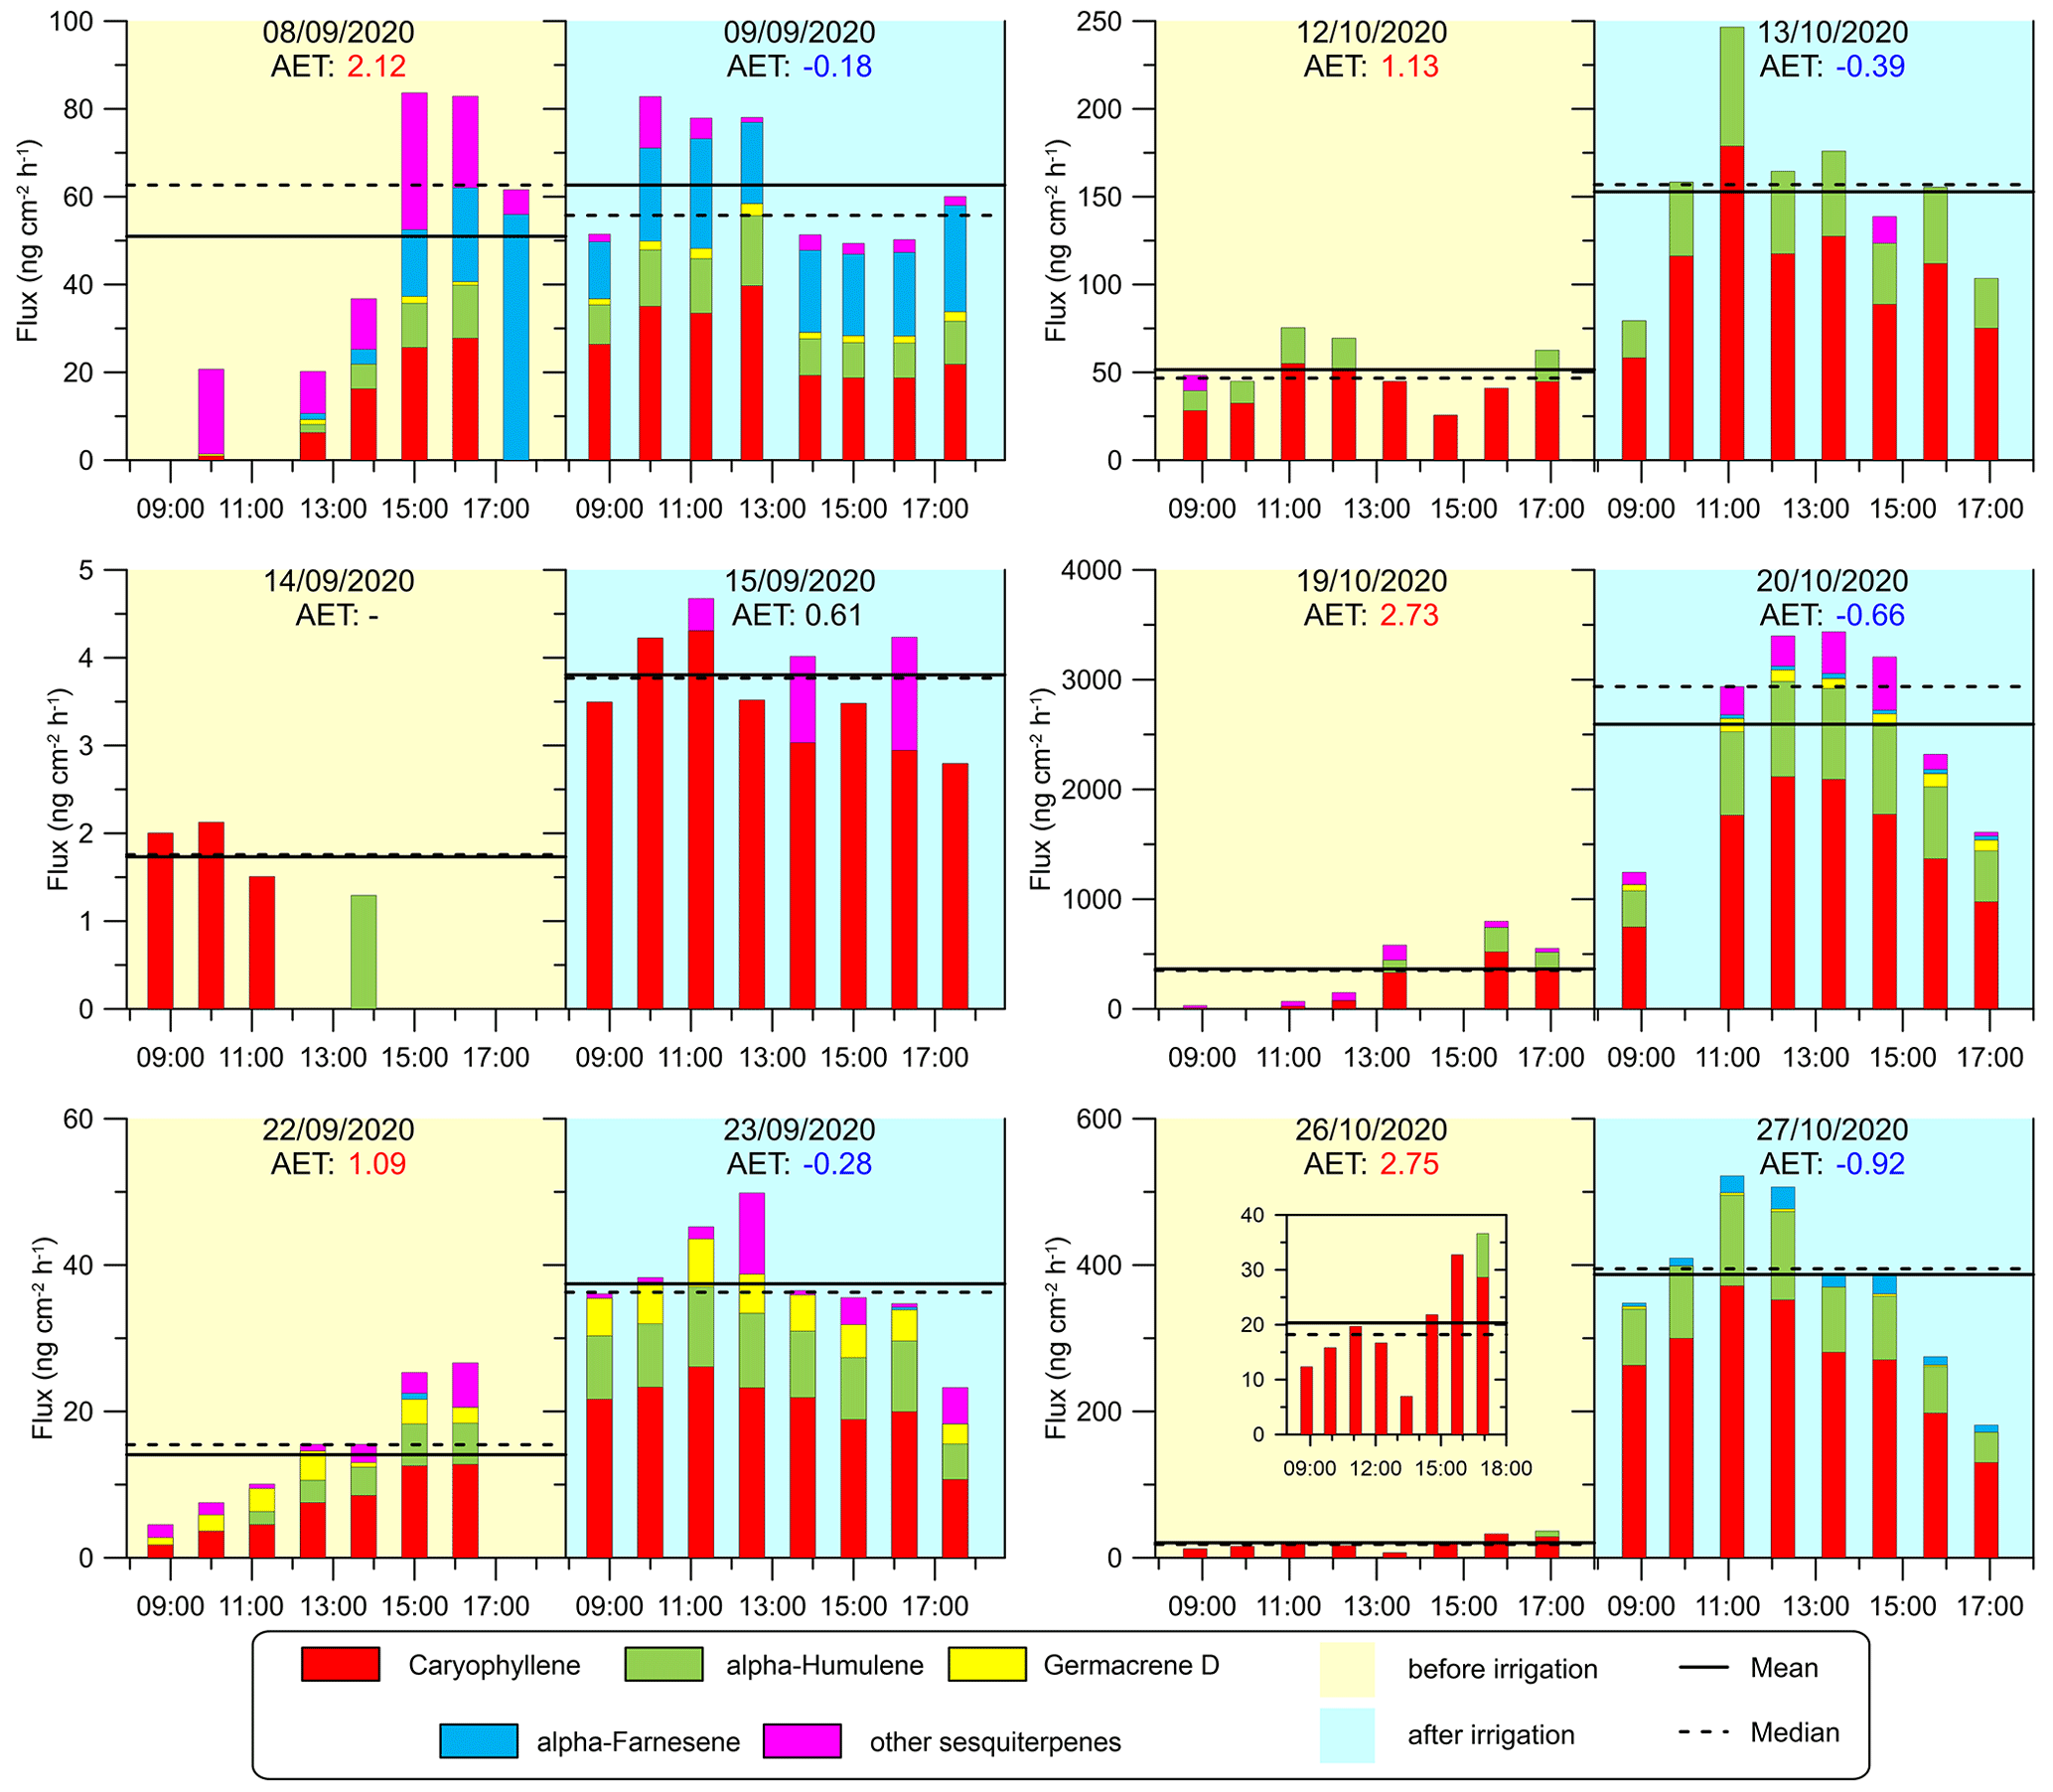
Figure 5Diurnal SQT emission fluxes from the sampled branches. Column colors represent the emission fluxes of four types of SQTs, and the magenta sections of the columns refer to other SQTs. Yellow and blue shading indicates the days before and after irrigation, respectively (see Sect. 2.4.2). Solid and dashed horizontal lines are the daytime mean and median SQT flux rates, respectively. AET values (see Sect. 2.4.4) are marked in red and blue when they are larger than 1 or when negative, respectively. To better present the trend on 26 October, a smaller figure with a smaller scale has been added.
3.2.2 SQTs
Figure 5 shows the emission fluxes of SQTs for the branches under drought and irrigation conditions. The four most abundant SQTs detected for each of the sampled branches were β-caryophyllene, α-humulene, germacrene D, and α-farnesene. These compounds comprised 90 % of all detected SQTs from all the branches together. The daily average emission rate of the SQTs ranged from 1.7 to 2595.7 (0.11–146.6 ). In contrast to MTs, few studies provide branch-enclosure measurements for SQTs. Notably, our study found significantly higher emission rates than previous research conducted between June and October under eastern Mediterranean conditions, where rates ranged from 0.0011 to 0.63 (Bracho-Nunez et al., 2013; Aydin et al., 2014). The emission fluxes of the SQTs were overall comparable to those of the MTs, which is a notable finding considering that SQT emission rates are frequently around a quarter of the MT flux (Sindelarova et al., 2014; Saunders et al., 2003). The finding of relatively high SQT emission rates appears to be in line with the findings of Li et al. (2024), who reported relatively high mixing ratios of SQTs (33.6 times higher than isoprene, and 18.9 times higher than MTs) under drought conditions in the same region.
Furthermore, we found that the increase in SQT emission flux following irrigation (by 545 % on average) was more significant than that of the MTs (by 150 % on average). This suggests that the response of SQT emissions to water availability is stronger than that of MTs, which could be related to the chemical properties and physiological functions of SQTs in plants. Bonn et al. (2019) found that a sharp increase in SQT emission occurs close to the wilting point to protect the plant against oxidative damage, as also supported by Caser et al. (2019). The latter found that drought can induce the SQT-synthesis mechanism. The strong increase in SQT emission after irrigation in our study further supports the notion that enhanced synthesis of SQTs occurs shortly after the release of drought stress. In addition, the SQT composition, like MT composition, was observed to be more diverse after irrigation in most cases, warranting further study.
Interestingly, the high SQT emission rates found in this study are consistent with the findings of a previous study conducted in the same area (Li et al., 2024), which also reported higher emission fluxes of SQTs compared to other studies. This suggests that there may be a unique level of drought or plant characteristics that contribute to the high emission fluxes of SQTs in this region.
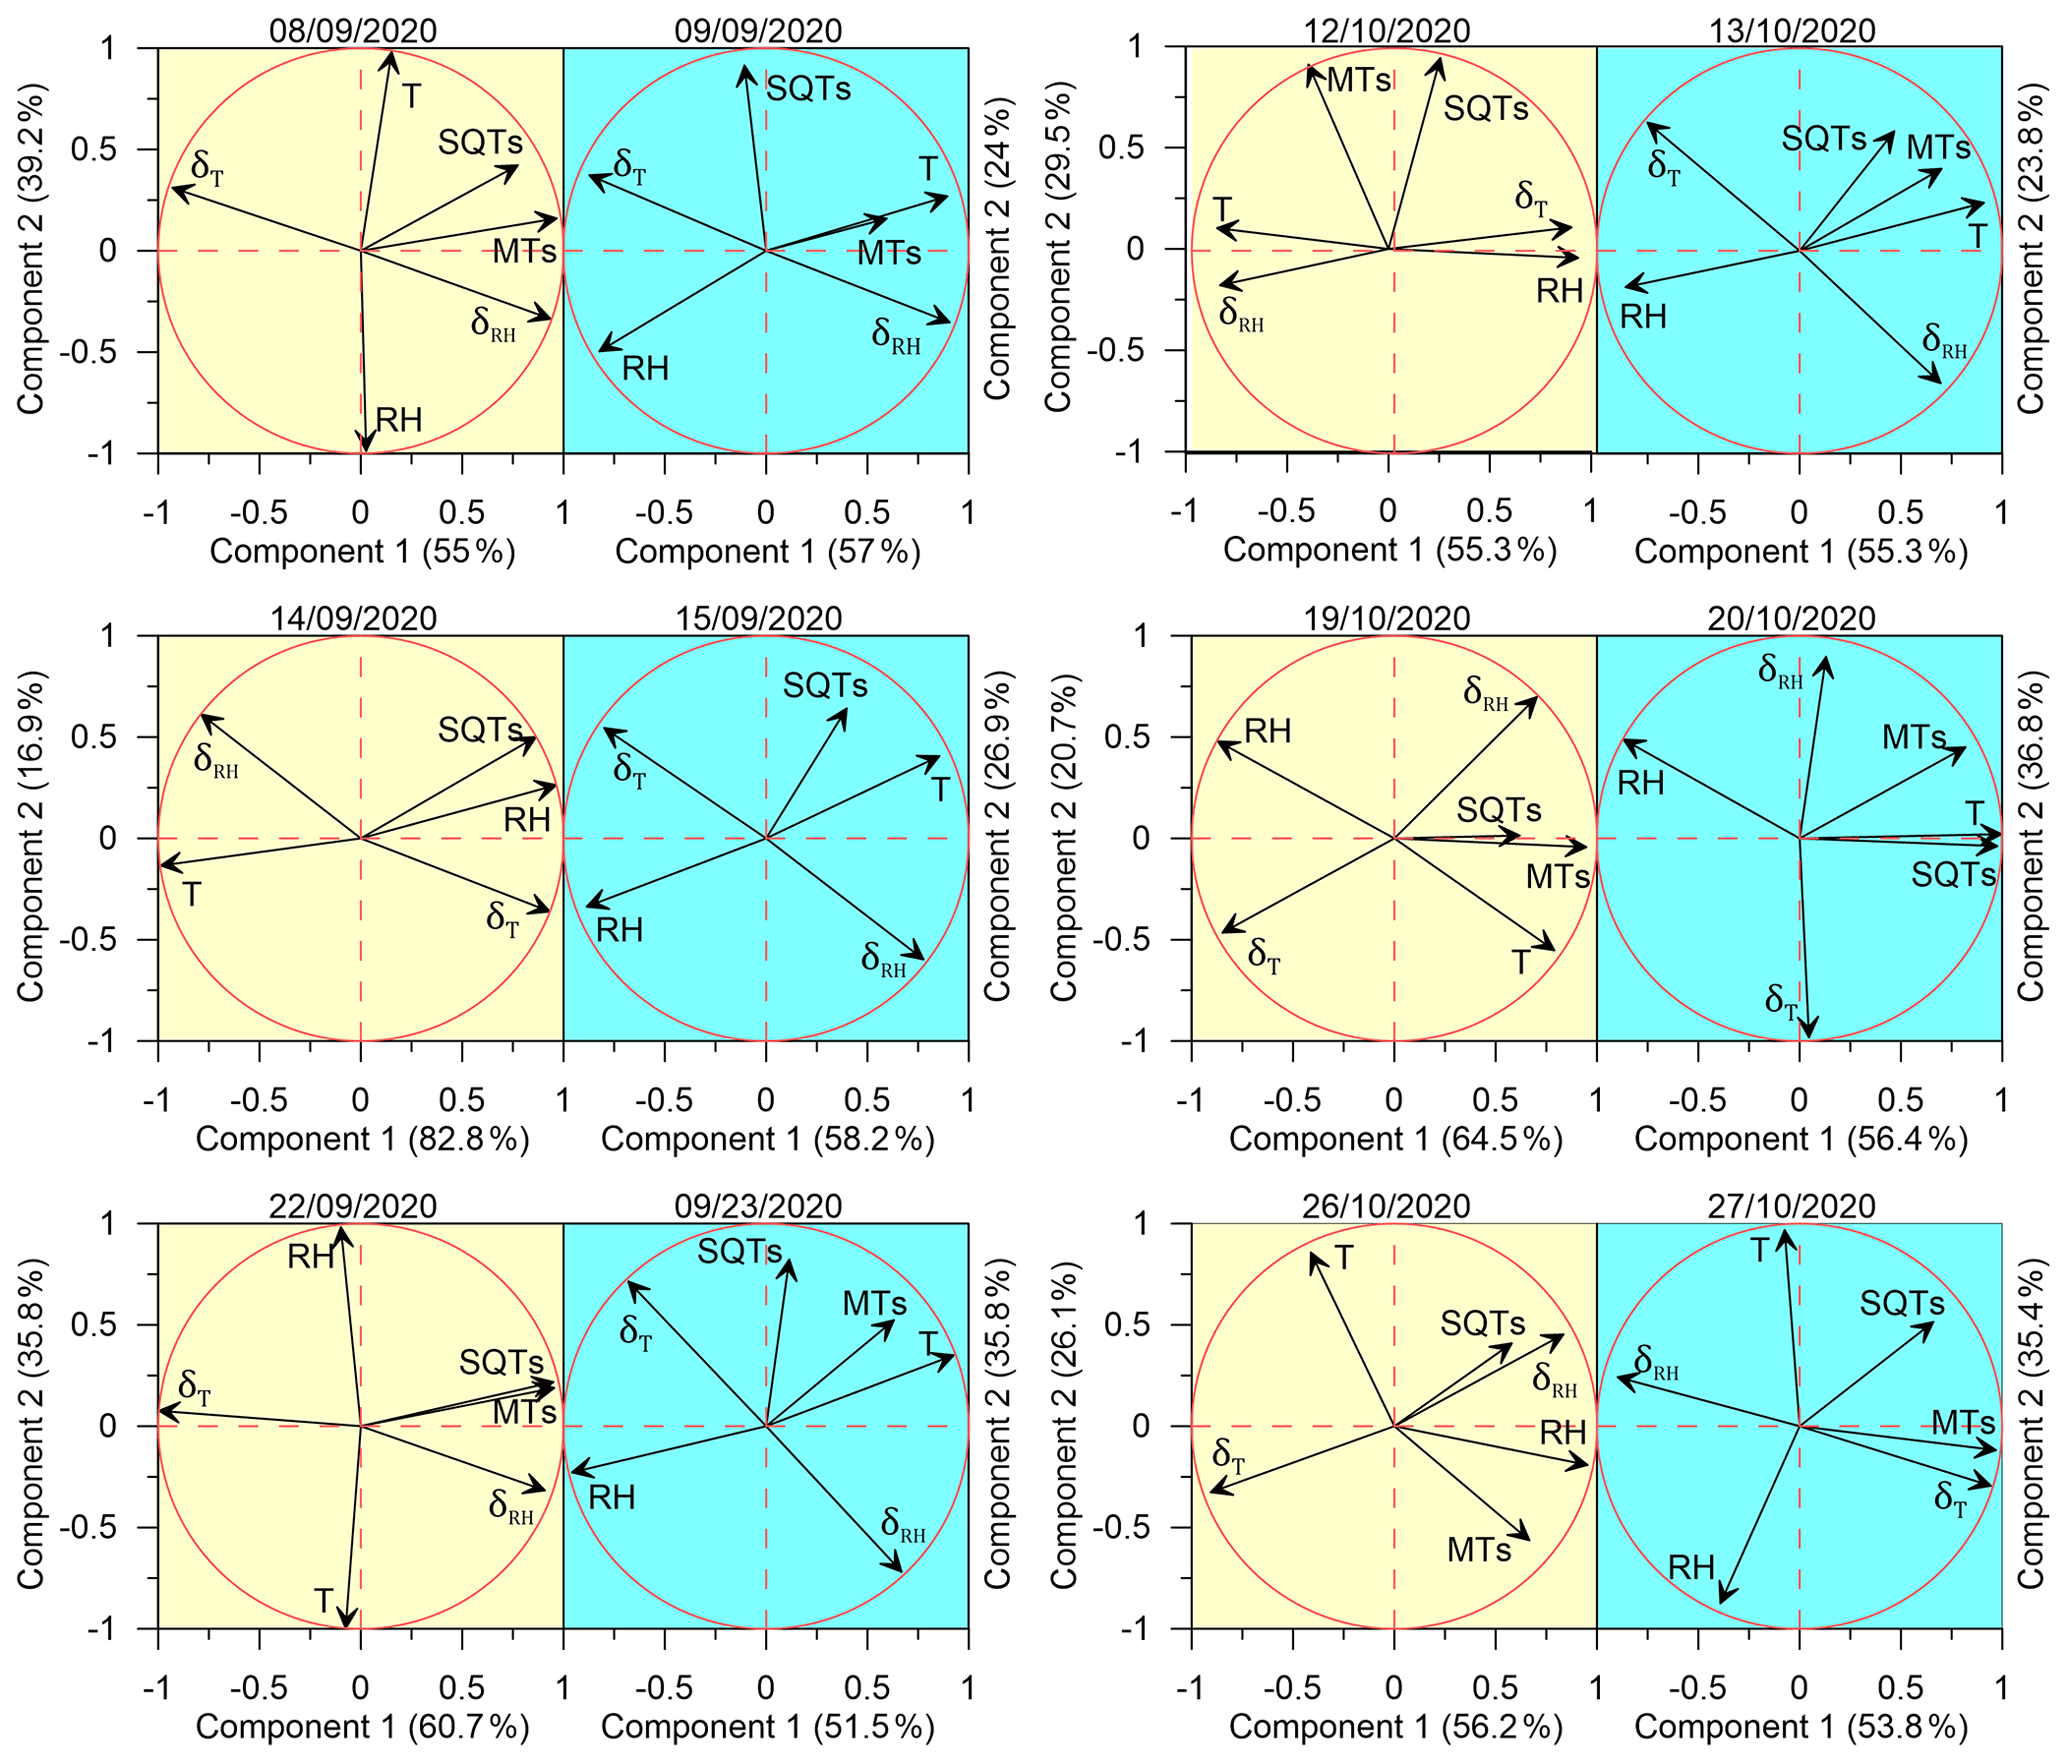
Figure 6Principal component analysis (PCA) for the response of SQTs and MTs to meteorological parameters. The results are presented for SQTs, MTs, T, RH, δT, and δRH individually for each measurement day. The yellow and blue shaded areas refer to the days before and after irrigation, respectively.
3.3 The impact of meteorological parameters on MT and SQT emission rates under drought conditions
The effect of meteorological conditions on the BVOC emission rate under drought conditions is complex and depends on many factors including vegetation type, BVOC type, and ambient stress. In the eastern Mediterranean region, Li et al. (2024) found that under drought, the best proxy for BVOC emission is the instantaneous temporal change in RH; temporal changes in T were also better correlated with the BVOC mixing ratio than absolute values of T. Here, we examined the impact of instantaneous changes in ambient air RH and T – δRH and δT, respectively (see Sect. 2.4.3) – as well as of ambient air T and RH on the BVOC emission rate. Due to the large variation in BVOC emissions across different branches, the r values were calculated separately for each branch and each sampling day. Figure 6 presents a principal component analysis (PCA) for the correlation of both δRH and δT with the BVOC emission rates. Before irrigation, when the plants were under drought on 8 September, 22 September, 19 October, and 26 October, the emission rates of the measured BVOCs (including both MTs and SQTs) were better correlated with δRH and δT (average Pearson values (r) of 0.56 and −0.61, respectively) than with RH and T (r of −0.22 and 0.29, respectively). Exceptional are 14 September and 12 October, also sampled under drought conditions; on 14 September, the SQT emissions showed the best correlation with RH (r=0.97), and on 12 October, the emission rates of BVOCs tended not to correlate with any of the tested meteorological parameters because of a strong correlation of T and δRH ().
Table 1Correlation between the emission rates of MTs and SQTs and the meteorological parameters examined. Presented are the Pearson r values for the correlation between the MT or SQT emission rate and RH, T, δRH, and δT (green shading for SQT emissions and lavender shading for MT emissions). The values are the average of r values across multiple individual branches. Blue and red shading indicates positive and negative correlations, respectively, and the darkness of the colors indicate their values. The P values for the correlations are shown in parentheses.
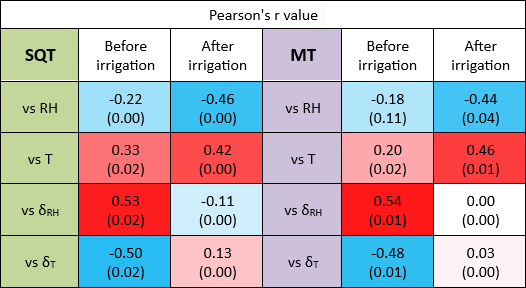
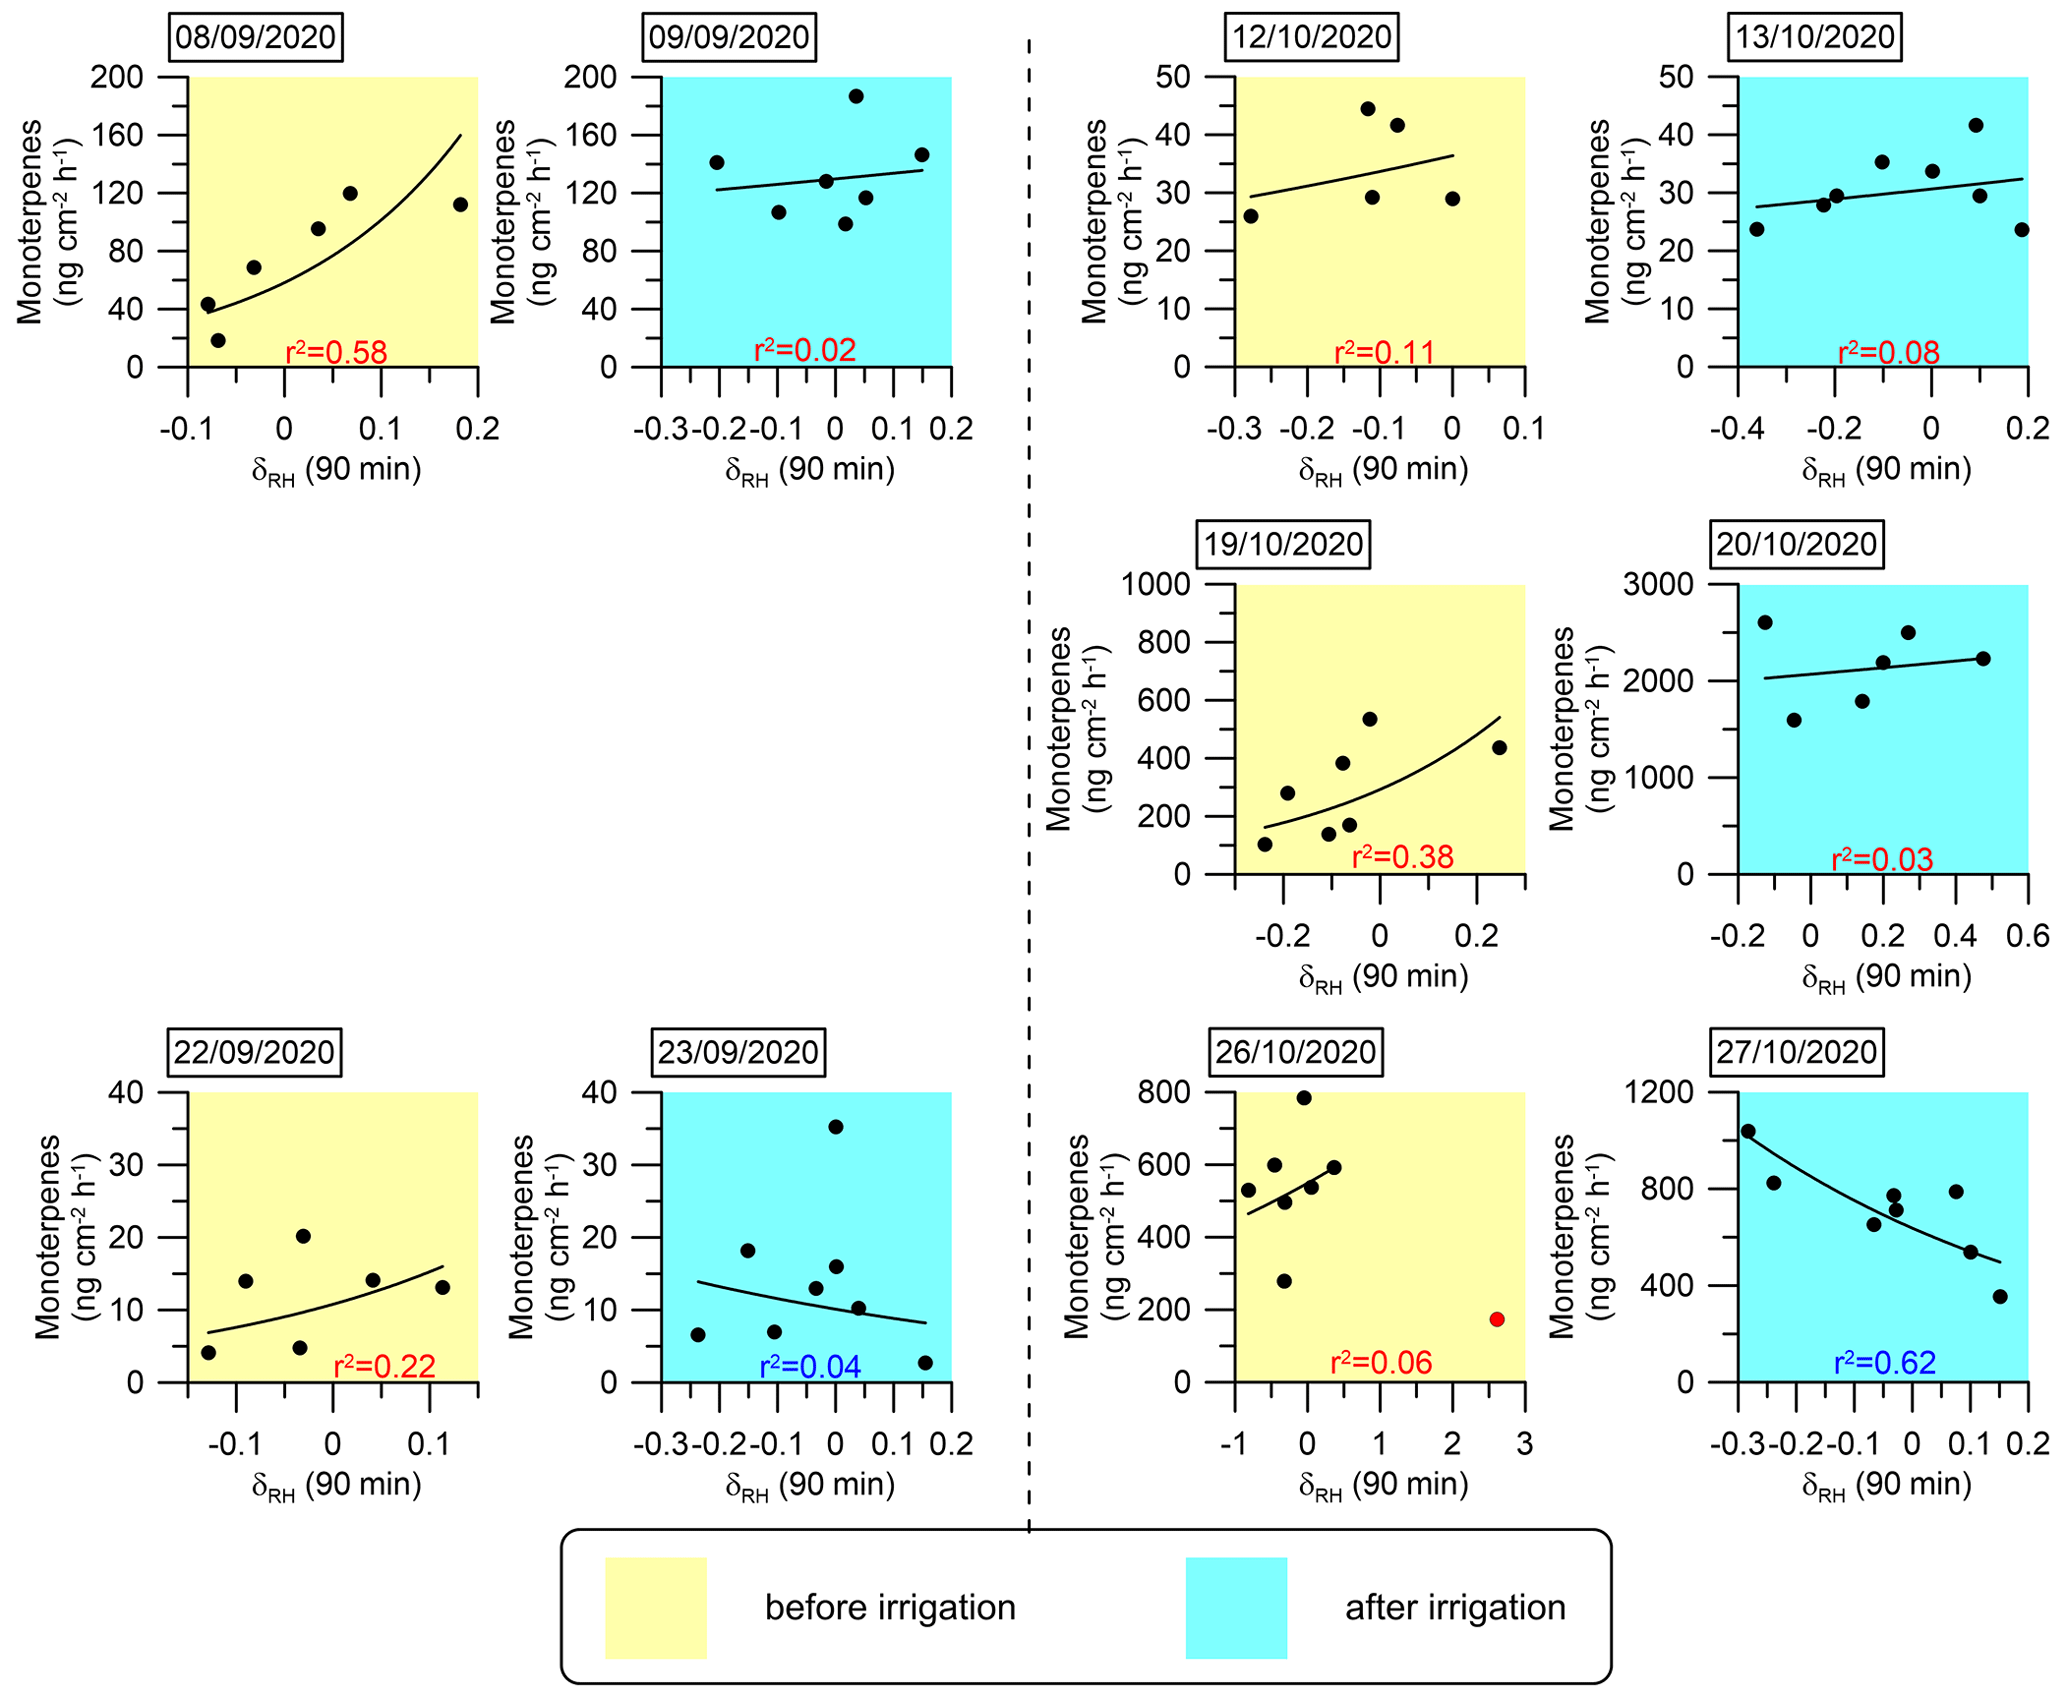
Figure 7Daily correlations between MT emission fluxes and δRH An exponential fitting function was used to fit the curves. The coefficient of determination (r2) for each day is marked in red or blue when the correlation is positive or negative, respectively.
When focusing only on the days after irrigation, except for 27 October, the BVOC emissions were better correlated with T (averaging r values across all relevant days, r=0.52) than with any other parameter. Interestingly, on 27 October, the SQTs tended to correlate with RH (−0.58), while the MT emission was better correlated with δT (0.94). The PCA results show some similarities between the different sampled branches, in their stronger response to δRH than to the other tested meteorological parameters and in their almost complete lack of correlation with T when under drought conditions. However, after irrigation, all BVOC emission rates were highly responsive to T, more than to any other parameter, reflecting the well-known Arrhenius-type increase for BVOC emissions with temperature, as mentioned in Sect. 1.
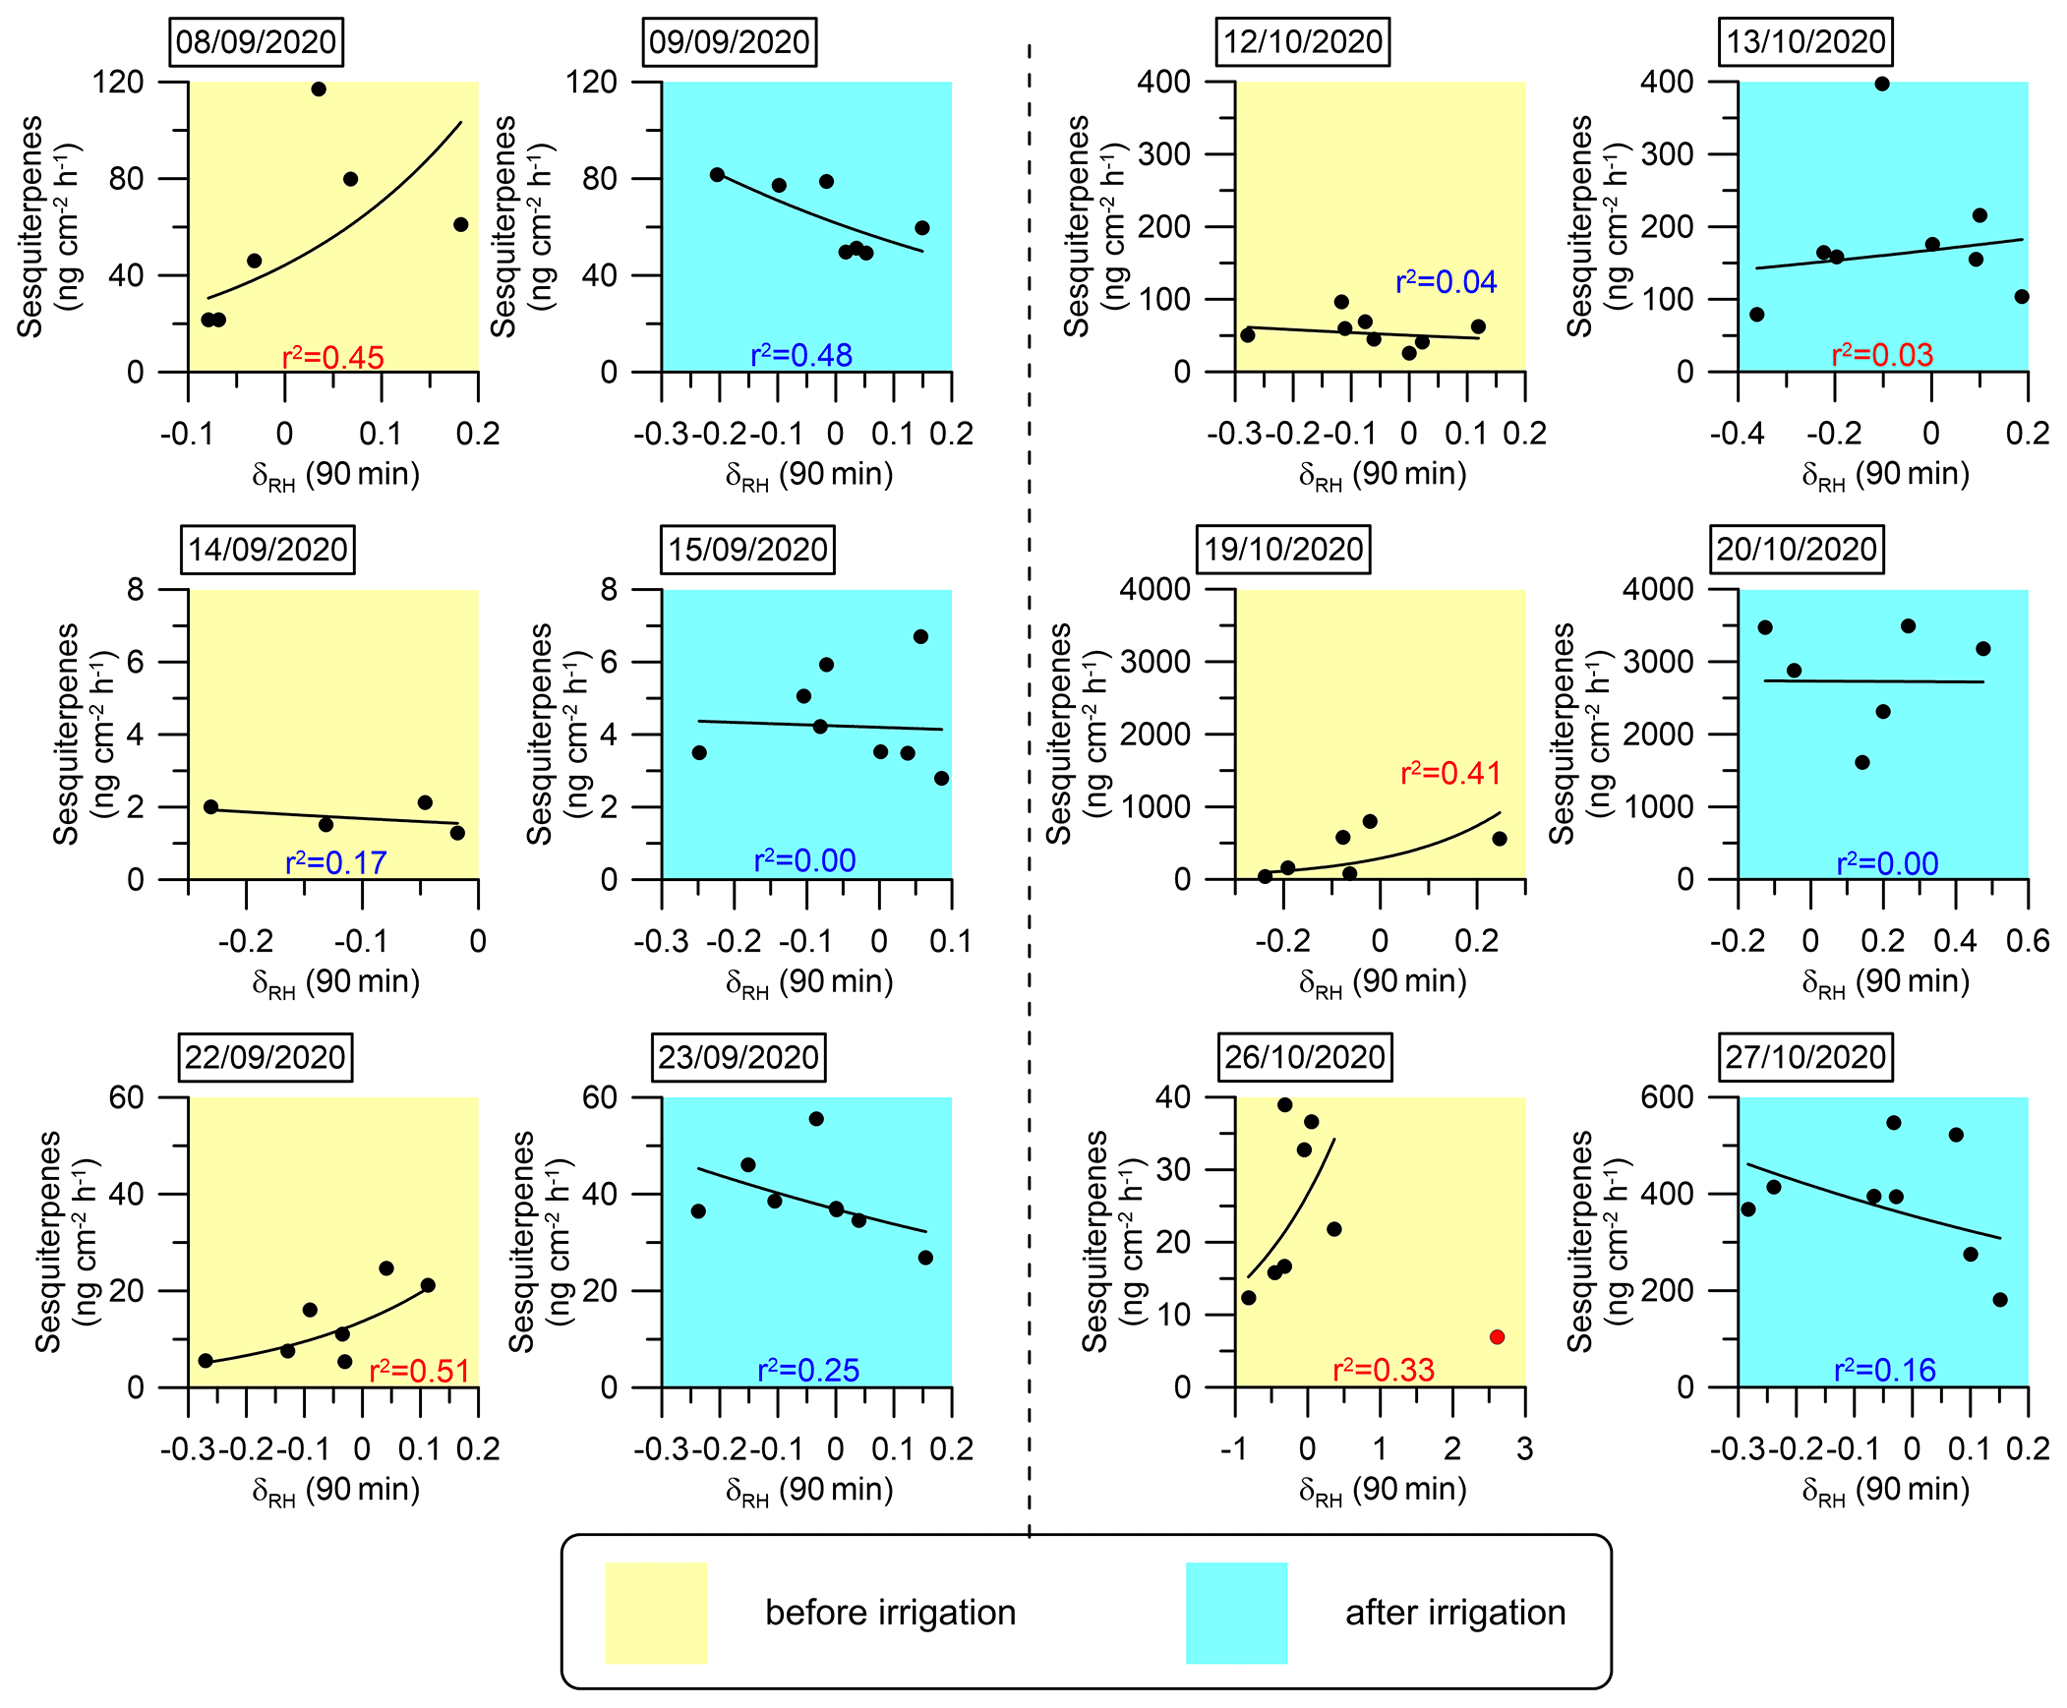
Figure 8Daily correlations between SQT emission fluxes and δRH. An exponential fitting function was used to fit the curves. The coefficient of determination (r2) for each day is marked in red or blue when the correlation is positive or negative, respectively. The sample at 12:10 on 26 October 2020 (marked in red) was not considered in the fitting curve for that day because an extremely sharp increase in RH (from 10 % to 31 %) occurred within 10 min, which we considered an outlier.
Table 1 summarizes the correlation coefficients between the emission rates of SQTs or MTs and RH, T, δRH, and δT both before and after irrigation. Considering the significant variability in the emission rates of SQTs and MTs across different branches, the r values presented in the table are averages calculated from individual-branch-level r values, separately before and after irrigation. Li et al. (2024) showed that under drought conditions, the temporal gradient of meteorological parameters in general was more strongly correlated with BVOC emission rates – not only for RH but also for T and vapor-pressure deficit. Before irrigation, both SQT and MT emission rates were more strongly correlated with δRH and δT than with RH and T. However, after irrigation, the r values for the correlations with δRH and δT were dramatically weakened. Moreover, following irrigation, the correlations with T and RH for both MTs and SQTs were notably stronger than before the irrigation. This indicates that under drought, the temporal gradients in T and RH have a stronger impact on BVOC emissions than the absolute values of T and RH, in agreement with findings by Li et al. (2024). Here, we demonstrate that even a relatively minor precipitation event leads to T becoming the dominant factor in the BVOC emission rate as expected under non-drought conditions. Interestingly, after irrigation, the highest r value for MTs was with T, but for SQTs, it was with RH.
The analysis presented in Fig. 6 and Table 1 reinforces the finding that instantaneous changes in meteorological parameters, particularly δRH, serve as a better proxy for the BVOC emission rate under drought conditions. This finding suggests that modeling BVOC emission rates under drought conditions can rely on δRH. In light of this insight, we investigated the mathematical connection between δRH and the emission rates of the MT and SQT fluxes. Exponential fitting corresponded with a relatively strong correlation between these emission rates and δRH Other fitting types used to test this relationship are presented in Sect. S2 in the Supplement. Figures 7 and 8 depict the exponential fitting curves for MTs and SQTs, respectively. These curves are presented separately for each branch and individually for drought and post-irrigation conditions. The r2 for MTs with δRH ranged from 0.06 to 0.58 (r=0.24–0.76, average 0.48) under drought, whereas following irrigation, the corresponding correlations ranged from 0.02 to 0.62 (–0.28, average −0.08). For SQTs, the corresponding r2 values were somewhat higher, ranging from 0.04 to 0.51 (–0.67, average +0.33) and 0.00 to 0.48 (–0.17, average −0.24) under drought and following irrigation, respectively.
Overall, these results suggest that while δRH is likely a better proxy for MT and SQT emission rates (see Table 1 and Sect. S3 in the Supplement), the correlation of δRH with these BVOCs appears to be too weak to accurately predict their emission rates using δRH values in atmospheric modeling. Additional study is needed before δRH can effectively serve as a parameter for modeling BVOC emission rates.
Following irrigation, the correlations between the emission flux rates and δRH became more moderate (4 cases out of 11) or even negative (5 cases out of 11). This further demonstrates the high sensitivity of δRH's effect on BVOC emissions to changes in water availability. Further research is required to examine the physiological and biochemical processes underlying the sensitivity of BVOC emission rates to δRH
We investigated BVOC emission rates from branches of Phillyrea latifolia under both drought and minor irrigation conditions in the eastern Mediterranean region, with the aim of assessing the influence of low precipitation levels and meteorological parameters on MT and SQT emission rates during drought stress. We found that leaf water content increases gradually during prolonged periods of drought, indicating the plant's enhanced capacity for water uptake under more severe drought conditions. The highest emission rate among all detected MTs was of cis-β-ocimene, and among the detected SQTs, we found β-caryophyllene, α-humulene, germacrene D, and α-farnesene. Both the MT and SQT emission rates were significantly influenced by the availability of soil water. In response to irrigation, the MT and SQT emission rates increased by 150 % and 545 %, respectively, indicating that even a small amount of water (equivalent to 5.5–7 mm precipitation) can significantly impact their emission rates.
This study highlights the complex way in which meteorological conditions affect BVOC emissions under drought conditions. In line with Li et al.'s (2024) findings, under drought, the instantaneous change in relative humidity, δRH, was the best proxy for BVOC emission rates, as its correlation with MT and SQT emission rates (r=0.54 and 0.53, respectively) was the strongest among all tested meteorological parameters. However, after a small amount of irrigation (equivalent to 5.5–7 mm precipitation), no correlation was observed between δRH and the MT emission rate, whereas a negative correlation with δRH was observed for the SQT emission rate. The increase in soil water availability led to T (for MTs) or RH (for SQTs) becoming the dominant meteorological parameter affecting BVOC emission rate, making them the best proxies for BVOC emission rates among all tested meteorological parameters. This indicates that changes in water availability can dramatically alter the manner in which BVOC emissions respond to meteorological conditions.
Hence, according to the conditions used in this study, under more-severe drought, δRH can serve as the best proxy for BVOC emission rate, whereas under more-moderate drought, either T or RH is the best proxy for BVOCs, in agreement with previous findings presented by Li et al. (2024). Our findings indicate that even a small amount of precipitation can lead to a transition from a drought to a non-drought regime in terms of BVOC emission rates and the manner in which they respond to meteorological conditions.
The data for this study can be found at https://doi.org/10.5281/zenodo.13283380 (Tas, 2024).
The supplement related to this article is available online at: https://doi.org/10.5194/bg-21-4133-2024-supplement.
ET designed the experiments, QL and GL carried out the field measurements; QL performed the data acquisition. QL performed the analytical analysis together with EB and EL. QL and ET led the data analyses with contributions from all co-authors. QL and ET prepared the paper with contributions from EB.
The contact author has declared that none of the authors has any competing interests.
Publisher's note: Copernicus Publications remains neutral with regard to jurisdictional claims made in the text, published maps, institutional affiliations, or any other geographical representation in this paper. While Copernicus Publications makes every effort to include appropriate place names, the final responsibility lies with the authors.
This study was supported by the Israel Science Foundation, grant nos. 1787/15 and 543/22. Eran Tas holds the Joseph H. and Belle R. Braun senior lectureship in agriculture.
This research has been supported by the United States – Israel Binational Science Foundation (grant nos. 1787/15 and 543/22).
This paper was edited by Kerneels Jaars and reviewed by two anonymous referees.
Asensio, D., Peñuelas, J., Llusià, J., Ogaya, R., and Filella, I.: Interannual and interseasonal soil CO2 efflux and VOC exchange rates in a Mediterranean holm oak forest in response to experimental drought, Soil Biol. Biochem., 39, 2471–2484, https://doi.org/10.1016/j.soilbio.2007.04.019, 2007.
Aydin, Y. M., Yaman, B., Koca, H., Dasdemir, O., Kara, M., Altiok, H., Dumanoglu, Y., Bayram, A., Tolunay, D., Odabasi, M., and Elbir, T.: Biogenic volatile organic compound (BVOC) emissions from forested areas in Turkey: Determination of specific emission rates for thirty-one tree species, Sci. Total Environ., 490, 239–253, https://doi.org/10.1016/j.scitotenv.2014.04.132, 2014.
Baldwin, I. T., Halitschke, R., Paschold, A., von Dahl, C. C., and Preston, C. A.: Volatile signaling in plant-plant interactions: “talking trees” in the genomics era, Science, 311, 812–815, https://doi.org/10.1126/science.1118446, 2006.
Berg, A. R., Heald, C. L., Huff Hartz, K. E., Hallar, A. G., Meddens, A. J. H., Hicke, J. A., Lamarque, J.-F., and Tilmes, S.: The impact of bark beetle infestations on monoterpene emissions and secondary organic aerosol formation in western North America, Atmos. Chem. Phys., 13, 3149–3161, https://doi.org/10.5194/acp-13-3149-2013, 2013.
Blande, J. D., Tiiva, P., Oksanen, E., and Holopainen, J. K.: Emission of herbivore-induced volatile terpenoids from two hybrid aspen (Populus tremula × tremuloides) clones under ambient and elevated ozone concentrations in the field, Glob. Change Biol., 13, 2538–2550, https://doi.org/10.1111/j.1365-2486.2007.01453.x, 2007.
Bonn, B., Magh, R.-K., Rombach, J., and Kreuzwieser, J.: Biogenic isoprenoid emissions under drought stress: different responses for isoprene and terpenes, Biogeosciences, 16, 4627–4645, https://doi.org/10.5194/bg-16-4627-2019, 2019.
Bracho-Nunez, A., Knothe,, N. M., Welter, S., Staudt, M., Costa, W. R., Liberato, M. A. R., Piedade, M. T. F., and Kesselmeier, J.: Leaf level emissions of volatile organic compounds (VOC) from some Amazonian and Mediterranean plants, Biogeosciences, 10, 5855–5873, https://doi.org/10.5194/bg-10-5855-2013, 2013.
Brilli, F., Barta, C., Fortunati, A., Lerdau, M., Loreto, F., and Centritto, M.: Response of isoprene emission and carbon metabolism to drought in white poplar (Populus alba) saplings, New Phytol., 175, 244–254, https://doi.org/10.1111/j.1469-8137.2007.02094.x, 2007.
Brilli, F., Ciccioli, P., Frattoni, M., Prestininzi, M., Spanedda, A. F., and Loreto, F.: Constitutive and herbivore-induced monoterpenes emitted by Populus × euroamericana leaves are key volatiles that orient Chrysomela populi beetles, Plant Cell Environ., 32, 542–552, https://doi.org/10.1111/j.1365-3040.2009.01948.x, 2009.
Cai, M., An, C., and Guy, C.: A scientometric analysis and review of biogenic volatile organic compound emissions: Research hotspots, new frontiers, and environmental implications, Renew. Sust. Energ. Rev., 149, 111317, https://doi.org/10.1016/j.rser.2021.111317, 2021.
Calfapietra, C., Fares, S., Manes, F., Morani, A., Sgrigna, G., and Loreto, F.: Role of Biogenic Volatile Organic Compounds (BVOC) emitted by urban trees on ozone concentration in cities: A review, Environ. Pollut., 183, 71–80, https://doi.org/10.1016/j.envpol.2013.03.012, 2013.
Caser, M., Chitarra, W., D'Angiolillo, F., Perrone, I., Demasi, S., Lovisolo, C., Pistelli, L., Pistelli, L., and Scariot, V.: Drought stress adaptation modulates plant secondary metabolite production in Salvia dolomitica Codd, Ind. Crop. Prod., 129, 85–96, https://doi.org/10.1016/j.indcrop.2018.11.068, 2019.
Curci, G., Beekmann, M., Vautard, R., Smiatek, G., Steinbrecher, R., Theloke, J., and Friedrich, R.: Modelling study of the impact of isoprene and terpene biogenic emissions on European ozone levels, Atmos. Environ., 43, 1444–1455, https://doi.org/10.1016/j.atmosenv.2008.02.070, 2009.
Dayan, C., Fredj, E., Misztal, P. K., Gabay, M., Guenther, A. B., and Tas, E.: Emission of biogenic volatile organic compounds from warm and oligotrophic seawater in the Eastern Mediterranean, Atmos. Chem. Phys., 20, 12741–12759, https://doi.org/10.5194/acp-20-12741-2020, 2020.
Duhl, T. R., Helmig, D., and Guenther, A.: Sesquiterpene emissions from vegetation: a review, Biogeosciences, 5, 761–777, https://doi.org/10.5194/bg-5-761-2008, 2008.
Filella, I., Primante, C., Llusià, J., Martín González, A. M., Seco, R., Farré-Armengol, G., Rodrigo, A., Bosch, J., and Peñuelas, J.: Floral advertisement scent in a changing plant-pollinators market, Sci. Rep.-UK, 3, 3434, https://doi.org/10.1038/srep03434, 2013.
Fitzky, A. C., Kaser, L., Peron, A., Karl, T., Graus, M., Tholen, D., Halbwirth, H., Trimmel, H., Pesendorfer, M., Rewald, B., and Sandén, H.: Same, same, but different: Drought and salinity affect BVOC emission rate and alter blend composition of urban trees, Urban For. Urban Gree., 80, 127842, https://doi.org/10.1016/j.ufug.2023.127842, 2023.
Fortunati, A., Barta, C., Brilli, F., Centritto, M., Zimmer, I., Schnitzler, J.-P., and Loreto, F.: Isoprene emission is not temperature-dependent during and after severe drought-stress: A physiological and biochemical analysis, Plant J., 55, 687–697, https://doi.org/10.1111/j.1365-313X.2008.03538.x, 2008.
Genard-Zielinski, A.-C., Boissard, C., Fernandez, C., Kalogridis, C., Lathière, J., Gros, V., Bonnaire, N., and Ormeño, E.: Variability of BVOC emissions from a Mediterranean mixed forest in southern France with a focus on Quercus pubescens, Atmos. Chem. Phys., 15, 431–446, https://doi.org/10.5194/acp-15-431-2015, 2015.
Genard-Zielinski, A.-C., Boissard, C., Ormeño, E., Lathière, J., Reiter, I. M., Wortham, H., Orts, J.-P., Temime-Roussel, B., Guenet, B., Bartsch, S., Gauquelin, T., and Fernandez, C.: Seasonal variations of Quercus pubescens isoprene emissions from an in natura forest under drought stress and sensitivity to future climate change in the Mediterranean area, Biogeosciences, 15, 4711–4730, https://doi.org/10.5194/bg-15-4711-2018, 2018.
Geron, C., Daly, R., Harley, P., Rasmussen, R., Seco, R., Guenther, A., Karl, T., and Gu, L.: Large drought-induced variations in oak leaf volatile organic compound emissions during PINOT NOIR 2012, Chemosphere, 146, 8–21, https://doi.org/10.1016/j.chemosphere.2015.11.086, 2016.
Giorgi, F. and Lionello, P.: Climate change projections for the Mediterranean region, Global Planet. Change, 63, 90–104, https://doi.org/10.1016/j.gloplacha.2007.09.005, 2008.
Goldstein, A. H., McKay, M., Kurpius, M. R., Schade, G. W., Lee, A., Holzinger, R., and Rasmussen, R. A.: Forest thinning experiment confirms ozone deposition to forest canopy is dominated by reaction with biogenic VOCs, Geophys. Res. Lett., 31, 22123, https://doi.org/10.1029/2004GL021259, 2004.
Greenberg, J. P., Asensio, D., Turnipseed, A., Guenther, A. B., Karl, T., and Gochis, D.: Contribution of leaf and needle litter to whole ecosystem BVOC fluxes, Atmos. Environ., 59, 302–311, https://doi.org/10.1016/j.atmosenv.2012.04.038, 2012.
Guenther, A.: Biological and Chemical Diversity of Biogenic Volatile Organic Emissions into the Atmosphere, ISRN Atmospheric Sciences, 2013, 1–27, https://doi.org/10.1155/2013/786290, 2013.
Guenther, A., Hewitt, C. N., Erickson, D., Fall, R., Geron, C., Graedel, T., Harley, P., Klinger, L., Lerdau, M., Mckay, W. A., Pierce, T., Scholes, B., Steinbrecher, R., Tallamraju, R., Taylor, J., and Zimmerman, P.: A global model of natural volatile organic compound emissions, J. Geophys. Res., 100, 8873–8892, 1995.
Guenther, A. B., Jiang, X., Heald, C. L., Sakulyanontvittaya, T., Duhl, T., Emmons, L. K., and Wang, X.: The Model of Emissions of Gases and Aerosols from Nature version 2.1 (MEGAN2.1): an extended and updated framework for modeling biogenic emissions, Geosci. Model Dev., 5, 1471–1492, https://doi.org/10.5194/gmd-5-1471-2012, 2012.
Han, Z., Zhang, Y., Zhang, H., Ge, X., Gu, D., Liu, X., Bai, J., Ma, Z., Tan, Y., Zhu, F., Xia, S., Du, J., Tan, Y., Shu, X., Tang, J., and Sun, Y.: Impacts of Drought and Rehydration Cycles on Isoprene Emissions in Populus nigra Seedlings, Int. J. Env. Res. Pub. He., 19, 1–13, https://doi.org/10.3390/ijerph192114528, 2022.
Holopainen, J. K. and Gershenzon, J.: Multiple stress factors and the emission of plant VOCs, Trends Plant Sci., 15, 176–184, https://doi.org/10.1016/j.tplants.2010.01.006, 2010.
Jiang, X., Guenther, A., Potosnak, M., Geron, C., Seco, R., Karl, T., Kim, S., Gu, L., and Pallardy, S.: Isoprene Emission Response to Drought and the Impact on Global Atmospheric Chemistry, Atmos. Environ., 183, 69–83, https://doi.org/10.1016/j.atmosenv.2018.01.026, 2018.
Kesselmeier, J. and Staudt, M.: Biogenic Volatile Organic Compounds (VOC): An Overview on Emission, Physiology and Ecology, J. Atmos. Chem., 33, 23–88, 1999.
Li, Q., Gabay, M., Rubin, Y., Fredj, E., and Tas, E.: Measurement-based investigation of ozone deposition to vegetation under the effects of coastal and photochemical air pollution in the Eastern Mediterranean, Sci. Total Environ., 645, 1579–1597, https://doi.org/10.1016/j.scitotenv.2018.07.037, 2018.
Li, Q., Gabay, M., Rubin, Y., Raveh-Rubin, S., Rohatyn, S., Tatarinov, F., Rotenberg, E., Ramati, E., Dicken, U., Preisler, Y., Fredj, E., Yakir, D., and Tas, E.: Investigation of ozone deposition to vegetation under warm and dry conditions near the Eastern Mediterranean coast, Sci. Total Environ., 658, 1316–1333, https://doi.org/10.1016/j.scitotenv.2018.12.272, 2019.
Li, Q., Gabay, M., Dayan, C., Misztal, P., Guenther, A., Fredj, E., and Tas, E.: Instantaneous intraday changes in key meteorological parameters as a proxy for the mixing ratio of BVOCs over vegetation under drought conditions, EGUsphere [preprint], https://doi.org/10.5194/egusphere-2024-717, 2024.
Lionello, P.: The Climate of the Mediterranean Region: From the Past to the Future, Elsevier, ISBN 9780123984661, 2012.
Llusià, J. and Peñuelas, J.: Seasonal patterns of terpene content and emission from seven Mediterranean woody species in field conditions, Am. J. Bot., 87, 133–140, https://doi.org/10.2307/2656691, 2000.
Llusia, J., Roahtyn, S., Yakir, D., Rotenberg, E., Seco, R., Guenther, A., and Peñuelas, J.: Photosynthesis, stomatal conductance and terpene emission response to water availability in dry and mesic Mediterranean forests, Trees, 30, 749–759, https://doi.org/10.1007/s00468-015-1317-x, 2016.
Medrano, H., Escalona, J. M., Bota, J., Gulías, J., and Flexas, J.: Regulation of photosynthesis of C3 plants in response to progressive drought: Stomatal conductance as a reference parameter, Annals of Botany, 89, 895–905, https://doi.org/10.1093/aob/mcf079, 2002.
Miyashita, K., Tanakamaru, S., Maitani, T., and Kimura, K.: Recovery responses of photosynthesis, transpiration, and stomatal conductance in kidney bean following drought stress, Environ. Exp. Bot., 53, 205–214, https://doi.org/10.1016/j.envexpbot.2004.03.015, 2005.
Monson, R. K., Jaeger, C. H., Adams, W. W., Driggers, E. M., Silver, G. M., and Fall, R.: Relationships among Isoprene Emission Rate, Photosynthesis, and Isoprene Synthase Activity as Influenced by Temperature, Plant Physiol., 98, 1175–1180, 1992.
Niinemets, U. and Monson, R. K.: Biology, controls and models of tree volatile organic compound emissions, Tree Physiology, vol. 5, Springer, Dordrecht, 1568-2544, 2013.
Niinemets, U., Loreto, F., and Reichstein, M.: Physiological and physicochemical controls on foliar volatile organic compound emissions, Trends Plant Sci., 9, 180–186, https://doi.org/10.1016/j.tplants.2004.02.006, 2004.
Nobel, P. S.: Physicochemical & environmental plant physiology, 2nd edn., Academic Press, San Diego, xxiv, 474, ISBN 978-0-12-374143-1, 1999.
Núñez, L., Plaza, J., Pérez-Pastor, R., Pujadas, M., Gimeno, B. S., Bermejo, V., and Garc'ıa-Alonso, S.: High water vapour pressure deficit influence on Quercus ilex and Pinus pinea field monoterpene emission in the central Iberian Peninsula (Spain), Atmos. Environ., 36, 4441–4452, https://doi.org/10.1016/S1352-2310(02)00415-6, 2002.
Owen, S., Boissard, C., Street, R. A., Duckham, S. C., Csiky, O., and Hewitt, C. N.: Screening of 18 Mediterranean plant species for volatile organic compound emissions, Atmos. Environ., 31, 101–117, https://doi.org/10.1016/S1352-2310(97)00078-2, 1997.
Owen, S. M. and Hewitt, C. N.: Extrapolating branch enclosure measurements to estimates of regional scale biogenic VOC fluxes in the northwestern Mediterranean basin, J. Geophys. Res., 105, 11573–11583, https://doi.org/10.1029/1999JD901154, 2000.
Pegoraro, E., Rey, A. N. A., Abrell, L., van Haren, J., and Lin, G.: Drought effect on isoprene production and consumption in Biosphere 2 tropical rainforest, Glob. Change Biol., 12, 456–469, https://doi.org/10.1111/j.1365-2486.2006.01112.x, 2006.
Peñuelas, J. and Munné-Bosch, S.: Isoprenoids: An evolutionary pool for photoprotection, Trends Plant Sci., 10, 166–169, https://doi.org/10.1016/j.tplants.2005.02.005, 2005.
Peñuelas, J. and Staudt, M.: BVOCs and global change, Trends Plant Sci., 15, 133–144, https://doi.org/10.1016/j.tplants.2009.12.005, 2010.
Peñuelas, J., Rutishauser, T., and Filella, I.: Ecology. Phenology feedbacks on climate change, Science, 324, 887–888, https://doi.org/10.1126/science.1173004, 2009.
Potosnak, M. J., LeStourgeon, L., Pallardy, S. G., Hosman, K. P., Gu, L., Karl, T., Geron, C., and Guenther, A. B.: Observed and modeled ecosystem isoprene fluxes from an oak-dominated temperate forest and the influence of drought stress, Atmos. Environ., 84, 314–322, https://doi.org/10.1016/j.atmosenv.2013.11.055, 2014.
Ryan, A. C., Hewitt, C. N., Possell, M., Vickers, C. E., Purnell, A., Mullineaux, P. M., Davies, W. J., and Dodd, I. C.: Isoprene emission protects photosynthesis but reduces plant productivity during drought in transgenic tobacco (Nicotiana tabacum) plants, New Phytol., 201, 205–216, https://doi.org/10.1111/nph.12477, 2014.
Saunders, S. M., Jenkin, M. E., Derwent, R. G., and Pilling, M. J.: Protocol for the development of the Master Chemical Mechanism, MCM v3 (Part A): tropospheric degradation of non-aromatic volatile organic compounds, Atmos. Chem. Phys., 3, 161–180, https://doi.org/10.5194/acp-3-161-2003, 2003.
Saunier, A., Ormeño, E., Boissard, C., Wortham, H., Temime-Roussel, B., Lecareux, C., Armengaud, A., and Fernandez, C.: Effect of mid-term drought on Quercus pubescens BVOCs' emission seasonality and their dependency on light and/or temperature, Atmos. Chem. Phys., 17, 7555–7566, https://doi.org/10.5194/acp-17-7555-2017, 2017.
Schade, G. W., Goldstein, A. H., and Lamanna, M. S.: Are monoterpene emissions influenced by humidity?, Geophys. Res. Lett., 26, 2187–2190, 1999.
Seco, R., Karl, T., Turnipseed, A., Greenberg, J., Guenther, A., Llusia, J., Peñuelas, J., Dicken, U., Rotenberg, E., Kim, S., and Yakir, D.: Springtime ecosystem-scale monoterpene fluxes from Mediterranean pine forests across a precipitation gradient, Agr. Forest Meteorol., 237–238, 150–159, https://doi.org/10.1016/j.agrformet.2017.02.007, 2017.
Sindelarova, K., Granier, C., Bouarar, I., Guenther, A., Tilmes, S., Stavrakou, T., Müller, J.-F., Kuhn, U., Stefani, P., and Knorr, W.: Global data set of biogenic VOC emissions calculated by the MEGAN model over the last 30 years, Atmos. Chem. Phys., 14, 9317–9341, https://doi.org/10.5194/acp-14-9317-2014, 2014.
Staudt, M., Mandl, N., Joffre, R., and Rambal, S.: Intraspecific variability of monoterpene composition emitted by Quercus ilex leaves, Can. J. Forest Res., 31, 174–180, https://doi.org/10.1139/x00-153, 2001.
Street, R. A., Owen, S., Duckham, S. C., Boissard, C., and Hewitt, C. N.: Effect of habitat and age on variations in volatile organic compound (VOC) emissions from Quercus ilex and Pinus pinea, Atmos. Environ., 31, 89–100, https://doi.org/10.1016/S1352-2310(97)00077-0, 1997.
Tas, E.: BVOC Fluxes from Individual Branches in the Mixed Mediterranean Shrubbery of Ramat Hanadiv, Zenodo [data set], https://doi.org/10.5281/zenodo.13283380, 2024.
Tingey, D., Turner, D., and Weber, J.: Factors Controlling the Emissions of Monoterpenes and Other Volatile Organic Compounds, U. S. Environmental Protection Agency, Washington, D. C., EPA/600/D-90/195 (NTIS PB91136622), 1990.
Vilagrosa, A., Bellot, J., Vallejo, V. R., and Gil-Pelegrin, E.: Cavitation, stomatal conductance, and leaf dieback in seedlings of two co-occurring Mediterranean shrubs during an intense drought, J. Exp. Bot., 54, 2015–2024, https://doi.org/10.1093/jxb/erg221, 2003.