the Creative Commons Attribution 4.0 License.
the Creative Commons Attribution 4.0 License.
 | 26 Sep 2024
Assessing the tropical Atlantic biogeochemical processes in the Norwegian Earth System Model
Lander R. Crespo
Jerry Tjiputra
Filippa Fransner
Noel S. Keenlyside
David Rivas
State-of-the-art Earth system models exhibit large biases in their representation of the tropical Atlantic hydrography, with potential large impacts on both climate and ocean biogeochemistry projections. This study investigates how biases in model physics influence marine biogeochemical processes in the tropical Atlantic using the Norwegian Earth System Model (NorESM). We assess four different configurations of NorESM: NorESM1 is taken as benchmark (NorESM1-CTL) that we compare against the simulations with (1) a physical bias correction and against (2 and 3) two configurations of the latest version of NorESM with improved physical and biogeochemical parameterizations with low and intermediate atmospheric resolutions, respectively. With respect to NorESM1-CTL, the annual-mean sea surface temperature (SST) bias is reduced largely in the first simulation and comparably in the third simulation in the equatorial and southeastern Atlantic. In addition, the SST seasonal cycle is improved in all three simulations, resulting in more realistic development of the Atlantic Cold Tongue in terms of location and timing. Corresponding to the cold tongue seasonal cycle, the marine primary production in the equatorial Atlantic is also improved, and the Atlantic summer bloom is particularly well represented during June to September in all three simulations. The more realistic summer bloom can be related to the well-represented shallow thermocline and associated nitrate supply from the subsurface ocean at the Equator. The climatological intense outgassing of air–sea CO2 flux in the western basin is also improved in all three simulations. Improvements in the climatology mean state also lead to better representation of primary production and air–sea CO2 interannual variability associated with the Atlantic Niño and Niña events. We stress that the physical process and its improvement are responsible for modelling the marine biogeochemical process because the first simulations, where only climatological surface ocean dynamics are corrected, provide more improvements in terms of marine biogeochemical processes.
- Article
(9384 KB) - Full-text XML
-
Supplement
(4056 KB) - BibTeX
- EndNote


The tropical Atlantic Ocean is a region with intense biogeochemical cycling and productive ecosystems, resulting in a hotspot for large fisheries (Gregg et al., 2003; Menard et al., 2000). In particular, the characteristics of the marine ecosystems in the tropical Atlantic are manifested by the high marine biological production along the western African coast associated with the Canary and the Benguela upwelling systems (Hutchings et al., 2009; Santos et al., 2007; Shannon et al., 2004; Vazquez et al., 2022). Another key driver of the marine ecosystem in the tropical Atlantic is riverine flux from the great rivers like the Congo and Amazon rivers (Araujo et al., 2014; Bouillon et al., 2012; Demaster and Pope, 1996; Moreira-Turcq et al., 2003; Vieira et al., 2020). The coastal upwelling and riverine fluxes are important sources of nutrients such as nitrate (), phosphate (), and silicate (SiO2) for phytoplankton growth (Gao et al., 2023). Apart from the coastal areas, high marine production is also observed in the central and eastern basins of the equatorial Atlantic, where the Atlantic Cold Tongue (ACT, Crespo et al., 2019; Hummels et al., 2013; Okumura and Xie, 2006; Tokinaga and Xie, 2011), associated with cold sea surface temperature (SST), develops during boreal summer (June–July–August). Here, a seasonal high production is fuelled by the equatorial upwelling that supplies nutrient-rich seawater from the subsurface ocean (Chenillat et al., 2021; Kawase and Sarmiento, 1985; Perez et al., 2005). In addition to this predominant seasonal variation, the primary production in the equatorial Atlantic has a strong interannual variability associated with the Atlantic Niño and Niña (Crespo et al., 2022; Keenlyside and Latif, 2007; Prigent et al., 2020) that has its peak during boreal summer (Chenillat et al., 2021). The Atlantic Niño and Niña are, in general, induced by modifications in the equatorial upwelling and thermocline zonal gradient via the Bjerknes feedback (Bjerknes, 1969; Crespo et al., 2022; Keenlyside and Latif, 2007; Prigent et al., 2020), and other possible mechanisms are also discussed, such as thermodynamical drivers and warm-water advection from the subtropics (Nnamchi et al., 2021, 2015; Richter et al., 2013). Chenillat et al. (2021) showed that the upwelling changes associated with such an Atlantic dynamical variability mode is predominantly responsible for the interannual variability in the equatorial Atlantic production during summer.
In addition to the high productivity, the tropical Atlantic Ocean plays an important role in the global carbon cycle (Takahashi et al., 2002). Model projections indicate that the tropical Atlantic is a key convergence zone for anthropogenic carbon in the future (Tjiputra et al., 2010), with rapid and long-term climate change imprints, such as warming, ocean acidification, and oxygen changes in the future (Bertini and Tjiputra, 2022; Tjiputra et al., 2023). The air–sea carbon dioxide (CO2) flux in the tropical Atlantic Ocean is predominantly outgassing, making it the second-largest CO2 outgassing system in the global ocean (Sarmiento and Gruber, 2006). This large CO2 outgassing is mainly attributed to rich dissolved inorganic carbon that is supplied from subsurface ocean by the equatorial upwelling (Koseki et al., 2023) and enhances the surface partial pressure of CO2 (pCO2). In addition to dissolved inorganic carbon, pCO2 is a function of several oceanic physical–chemical properties like SST, sea surface salinity (SSS), and total alkalinity (Sarmiento and Gruber, 2006). Lefevre et al. (2013) suggested that SST and SSS positive anomalies in the northern tropical Atlantic enhance the outgassing of CO2 flux during February to May. More recently, Koseki et al. (2023) showed a unique pattern and mechanism of CO2 flux anomalies associated with the Atlantic Niño and Niña, which is distinct from that in the tropical Pacific (Vaittinada Ayar et al., 2022).
With the rapid development of computational technologies and resources, marine biogeochemical models are now standard components of Earth system models (ESMs), which have become key tools to investigate the global carbon cycle and marine physical–biogeochemical interactions and their feedbacks on the global and regional climate (Doney, 1999; Ilyina et al., 2013; Kriest and Oschlies, 2015; Sein et al., 2015; Seferian et al., 2020). They are also widely used to produce near-term predictions of the interannual to decadal evolution of marine biogeochemistry (Fransner et al., 2020; Seferian et al., 2018, 2019). These prediction models have added important evidence that ocean physics plays a major role in shaping marine biogeochemical processes. For example, Ramirez-Romero et al. (2020), using four different coupled physical–biogeochemical model configurations, suggested that the intensity, timing, and vertical location of the deep chlorophyll maximum are very sensitive to the ocean stratification period and intensity. Fransner et al. (2020) showed that physical processes play a crucial role in controlling the nutrients, primary production variability, and predictability of key biogeochemical processes such as CO2 fluxes. It had been demonstrated that biases in physical dynamics can bring about large uncertainty in future projections of ocean carbon sink (Bourgeois et al., 2022; Goris et al., 2023, 2018). Therefore, to increase the fidelity of future projections of the ocean carbon cycle at regional scales, it is very important to understand the underlying physical–biogeochemical interactions and verify how well they are simulated by the ESMs.
As a long-standing common issue, most of the advanced ESMs exhibit non-negligible systematic physical biases in the representation of climate variables in the tropical Atlantic such as SST, precipitation, and other relevant atmospheric and oceanic fields (De La Vara et al., 2020; Koseki et al., 2018; Mohino et al., 2019; Voldoire et al., 2019), which can degrade predictability of climate variability (Counillon et al., 2021). The origins of such systematic biases are diverse among the ESMs: imperfect parameterization of ocean mixed-layer processes (Deppenmeier et al., 2020), coarse resolution of atmospheric and oceanic components (De La Vara et al., 2020; Harlass et al., 2018), intrinsic atmospheric bias of surface wind (Koseki et al., 2018; Xu et al., 2014), or poor representation of subtropical atmospheric surface circulation (Cabos et al., 2017). The tropical Atlantic SST biases also exacerbate climate variability and predictability (e.g. Counillon et al., 2021; Dippe et al., 2018; Prodhomme et al., 2019). While these physical and dynamical biases of the ESMs have been widely discussed in the past decade, there are limited studies that further our understanding of their impacts on the simulated marine biogeochemical processes in the tropical Atlantic.
Here, we assess the impact of physical and dynamical biases on the representation of biogeochemistry in the tropical Atlantic in one Coupled Model Intercomparison Project (CMIP)-class ESM, the Norwegian Earth System Model (NorESM). We evaluate three simulations with (1) physical bias correction, (2) better parameterizations of atmosphere and ocean physical and marine biogeochemical processes, and (3) refinement of atmospheric model spatial resolution, respectively. Focusing on physical properties like SST and the thermocline, we investigate to what extent the biogeochemical processes are improved in terms of climatology, seasonality, and interannual variability. This paper is structured as follows. Section 2 describes the details of NorESM, its experimental settings, and the observational data used for verification. In Sect. 3, we show and discuss the results of NorESM simulations. Finally, this paper is summarized in Sect. 4.
2.1 Model description
The first-generation Norwegian Earth System Model (NorESM1; Bentsen et al., 2013), which contributes to the fifth phase of the CMIP exercise (Taylor et al., 2012), consists of the Community Atmospheric Model version 4 (CAM4; Neale et al., 2010), the Miami Isopycnic Coordinate Model (MICOM; Bleck et al., 1992), the Community Sea Ice Model (CICE4), the Community Land Surface Model (CLM4), and the Hamburg Ocean Carbon Cycle model (HAMOCC; Tjiputra et al., 2013). NorESM2 is the latest generation of NorESM with updates and tunings of physical and biogeochemical parameterization (Seland et al., 2020; Tjiputra et al., 2020) and contributed to CMIP6 (Eyring et al., 2016). The atmospheric component is updated to CAM6-Nor with axial angular momentum conservation (Toniazzo et al., 2020), and a parameterization for atmosphere aerosol radiation is employed. The ocean component of NorESM2 is replaced with the Bergen Layered Ocean Model (BLOM) that implements the updated parameterization of second-order closure scheme (Ilicak et al., 2008), while HAMOCC is updated to iHAMOCC (Tjiputra et al., 2020). More details of NorESM2 description and broad-scale evaluation of its physics and ocean biogeochemistry are available in Seland et al. (2020) and Tjiputra et al. (2020).
2.2 Model configurations
With NorESM1 we performed a standard historical simulation. As a benchmark simulation, referred to as NorESM1-CTL, NorESM1 was initialized at 15 January 1980 from a historical spin-up starting at 1 January 1850 following Counillon et al. (2021). The initial conditions of HAMOCC were obtained from a historical run of Tjiputra et al. (2013). NorESM1-CTL was integrated until the end of 2019. In the second model configuration, an anomaly coupling technique (Toniazzo and Koseki, 2018) was implemented into NorESM1 to reduce physical biases. In this methodology, the model's monthly climatologies of SST and surface wind were replaced by the observed ones during the model integration at every coupling step, while the frequency of air–sea coupling was kept identical to NorESM1-CTL. The observed SST and surface wind were obtained from HadISST and ERA-Interim (Dee et al., 2011), respectively, for 1980–2000. In this framework, the ocean component sees the climatologically corrected surface winds and the atmospheric component feels the climatologically corrected SST through air–sea fluxes while the transient components are still interactive. This run is referred to as NorESM1-AC, and ocean carbon cycle is included as in NorESM1-CTL. Other details of NorESM1-CTL and NorESM1-AC (for example, spin-up duration, model performance) can be found in Counillon et al. (2021). Due to the initial physical adjustments to the biogeochemistry, we considered the first 10 years of NorESM1-CTL and NorESM1-AC as an adjustment period and did not analyse it in our study.
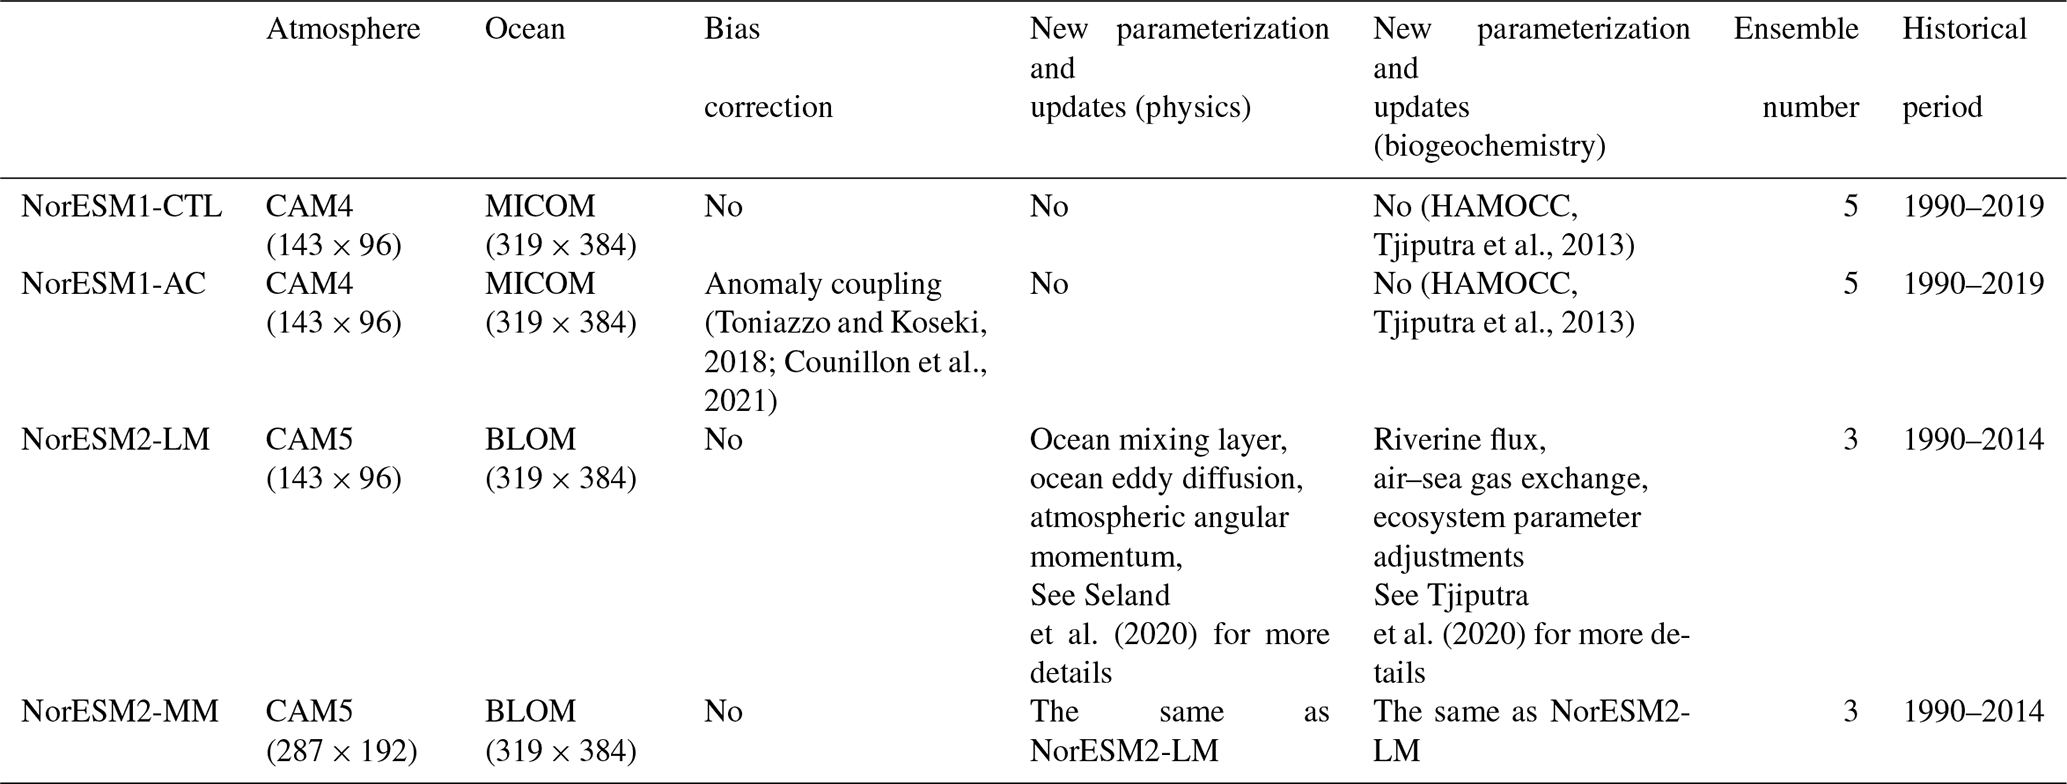
Two historical runs of NorESM2 (NorESM2-LM and NorESM2-MM) following the standard CMIP6 protocol were integrated from 1850 until 2014, and the data from 1990 to 2014 period are analysed in this study. NorESM2-LM and NorESM2-MM differ in the spatial resolutions of the atmospheric model CAM6-Nor, with a coarse resolution of 2.5°×1.9° and an intermediate resolution of 1.5°×0.9°, respectively. The resolution of the ocean component is similar in all simulations of NorESM1 and NorESM2. On the other hand, the resolution of atmospheric components is equal for NorESM1 and NorESM2-LM. The simulations of NorESM1 and NorESM2 have five and three ensemble members, respectively. These experimental settings are given in Fig. S1 in the Supplement. To summarize, NorESM1-AC is a reference for physical bias correction, while NorESM2-LM and NorESM2-MM are for improved physical and biogeochemical parameterizations in comparison with the benchmark simulation of NorESM1-CTL. We also aim to qualitatively assess the impacts of model refinement on simulation performance by comparing NorESM1-CTL with NorESM2-LM and NorESM2-MM. Table 1 summarizes the four different configurations of NorESM simulations analysed in this study.
Table 1List of four different configurations of NorESM simulations in this study.
2.3 Observational data
We evaluate the NorESM simulations using observational datasets. The SST data are from the Optimum Interpolated SST (OISST, Reynolds et al., 2007) record from 1990 to 2019. Three-dimensional ocean data of temperature, nitrate, and phosphate were taken from World Ocean Atlas 18 (WOA18, Locarnini et al., 2018; Garcia et al., 2018) climatological data. Monthly marine primary production was taken from MODIS (Moderate Resolution Imaging Spectroradiometer) satellite data from 2003 to 2019. The ocean surface CO2 flux, the Max Planck Institute Self-Organizing Map Feed Forward Neural Network (MPI-SOM FFM, https://www.ncei.noaa.gov/access/ocean-carbon-acidification-data-system/oceans/SPCO2_1982_present_ETH_SOM_FFN.html, last access: 30 April 2021), is from the global observation-based gridded data of Landschützer et al. (2016, 2020) from 1990 to 2015. Additionally, we also use the observed chlorophyll a data from ESA Ocean Colour Climate Change Initiative version 5.0 (https://climate.esa.int/en/projects/ocean-colour/#_data-tab, last access: 22 February 2021) from 2003 to 2019.
3.1 Climatology
First, we assess the SST bias in our four experiments (Fig. 1). NorESM1-CTL has a warm bias along the western African coast (Fig. 1a), which is a common bias in ESMs (Richter, 2015). In contrast, cold SST biases are detected in the subtropics. The causes of the SST bias in NorESM1 are predominantly erroneous wind stress and air–sea heat flux (Koseki et al., 2018). By implementing the anomaly coupling technique (NorESM1-AC), the tropical Atlantic SST biases are substantially alleviated (Fig. 1b and e). In particular, the warm bias of the Angola–Benguela Frontal Zone (ABFZ, 15 to 17° S along the western African coast; e.g. Koseki et al., 2019) is reduced by up to 5 °C. NorESM2-LM also exhibits a considerably warm bias in the eastern tropical Atlantic, while the subtropical cold biases are reduced in the south and even suppressed in the north (Fig. 1c). The improvement of the subtropical Atlantic is comparable with that of NorESM1-AC (Fig. 1e and f). The summer (June–July–August) SST bias is comparably alleviated between NorESM1-AC and NorESM2-LM (Fig. S2 in the Supplement). In NorESM2-MM, the SST bias is reduced more than NorESM2-LM (Fig. 1d). The ABFZ warm bias in NorESM2-MM is improved by 3 °C, and the equatorial Atlantic bias is improved by 2 °C (Figs. 1g and S2). Comparison between NorESM2-LM and NorESM2-MM suggests that a horizontal refinement of the atmospheric model improves the climatic state of the surface ocean, which is consistent with Harlass et al. (2018).
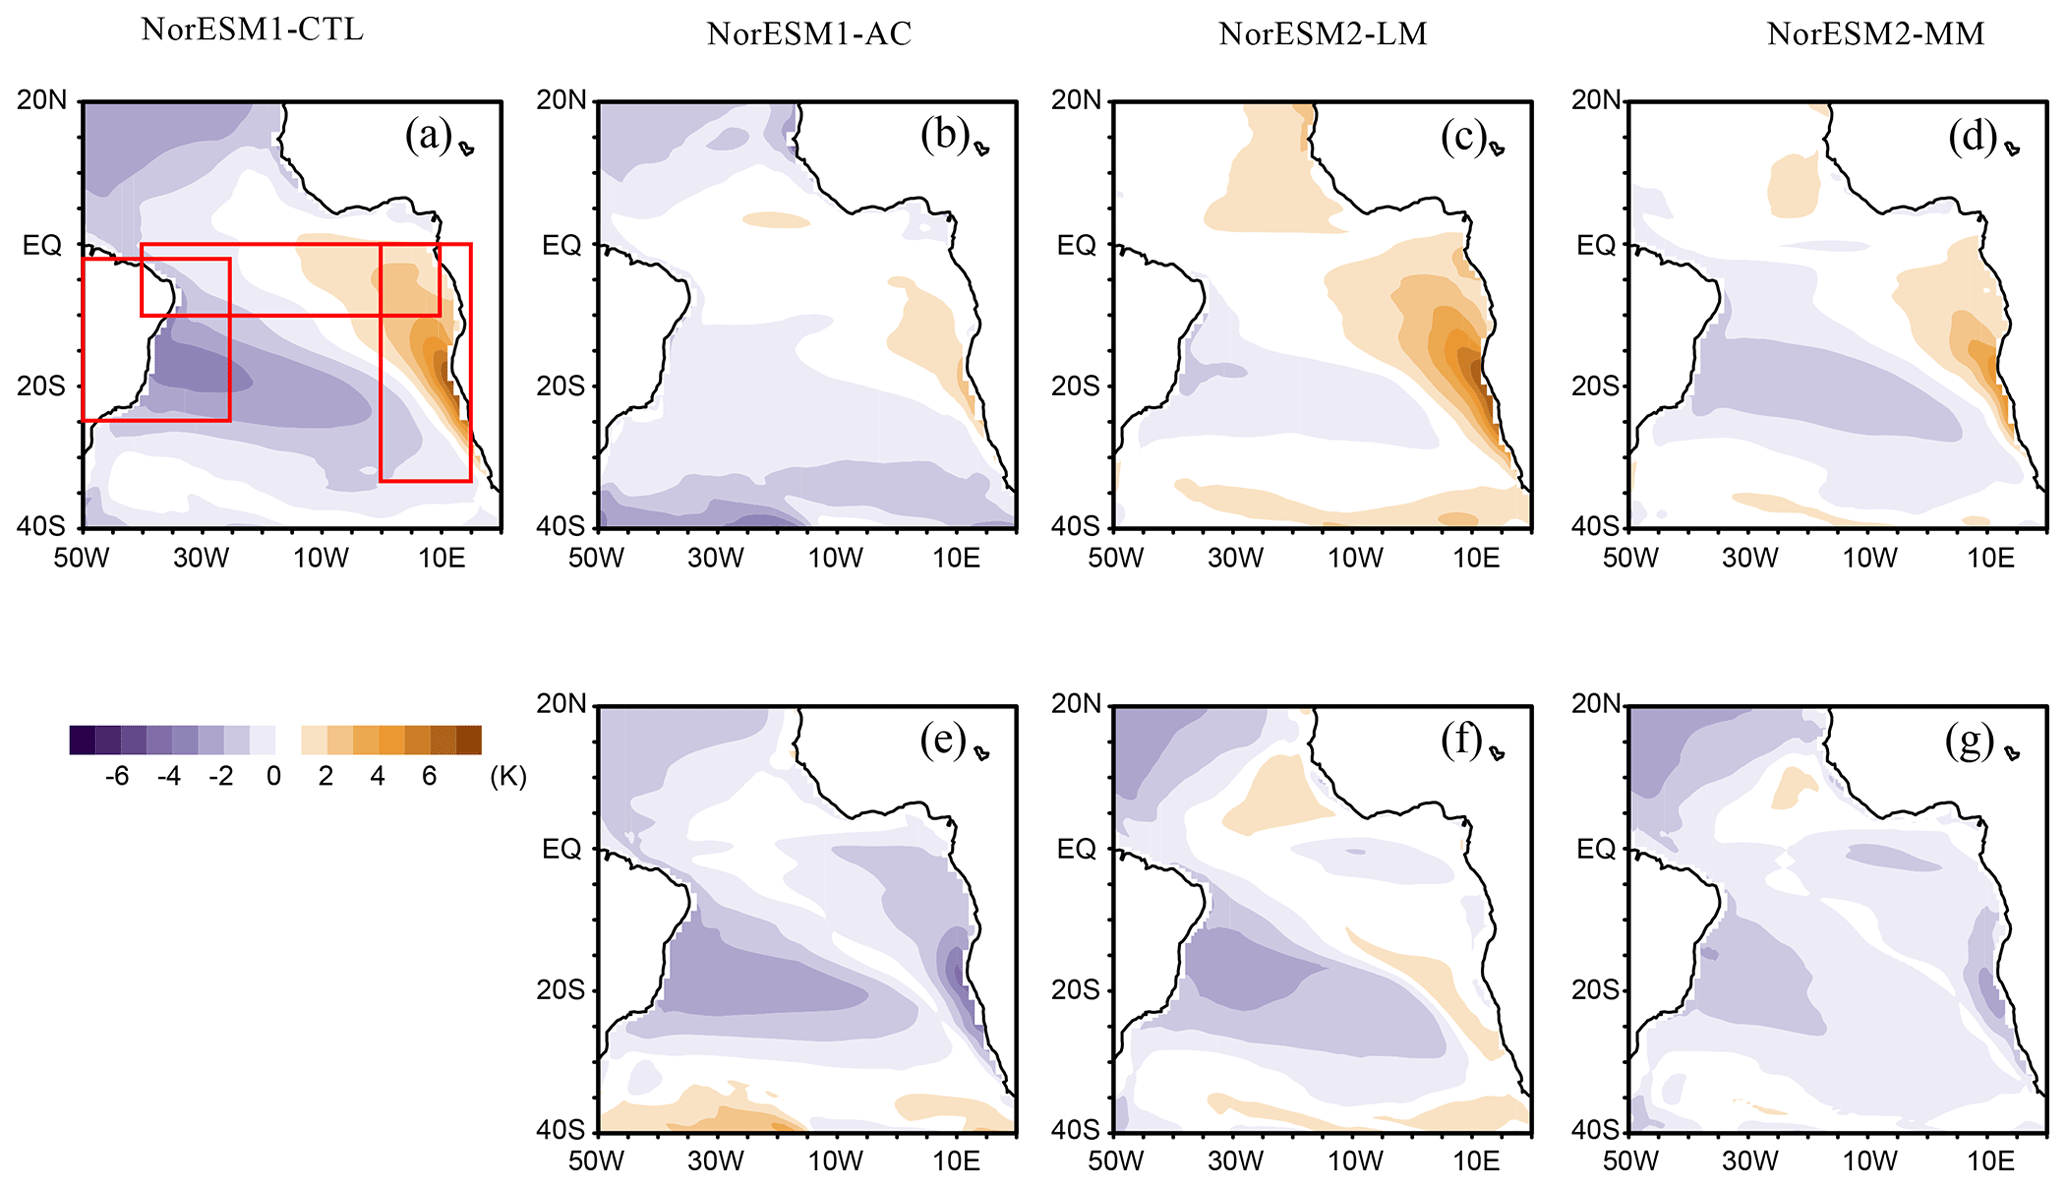
Figure 1(a–d) Annual-mean climatological bias of sea surface temperature (SST) with respect to OISST data and (e–g) bias improvements of each simulation compared to NorESM1-CTL. In panels (e)–(g), the negative (positive) values indicate improvement (exacerbation) compared to NorESM1-CTL. The red boxes denote the area for averaging in Fig. 2.
Figure 2 provides vertical sections of the observed and simulated ocean temperature around the southern pan-tropical Atlantic Ocean. In the observation, a thick warm layer forms around the northeastern Brazilian coast and western equatorial Atlantic, whereas a thin warm layer penetrates from the eastern equatorial Atlantic to the ABFZ, resulting in the east–west-tilting thermocline depth along the Equator (Fig. 2a). NorESM1-CTL fails to reproduce the steep east–west gradient of thermocline along the Equator and the observed warm pool in the western Atlantic and along the northeastern Brazilian coast (Fig. 2b). The thick warm layer is homogeneously formed along this pan-tropical Atlantic sector and the ABFZ is pushed further southward. By applying the physical bias reduction (NorESM1-AC), the equatorial thermocline zonal-gradient bias is alleviated and the thick warm pool is generated more realistically than in NorESM1-CTL (Fig. 2c). The erroneous southward penetration of warm water along the African coast is suppressed, resulting in reduction in the warm SST bias in NorESM1-AC (Fig. 1b). While the zonal tilting of the equatorial thermocline is well represented in NorESM2-LM, the warm pool is shallower than NorESM1-AC in the western Atlantic, and the ABFZ is pushed further southward compared to NorESM1-CTL (Fig. 2d). In NorESM2-MM, the tilting thermocline is similarly well represented along the Equator, and the location of the ABFZ is more realistic than NorESM2-LM. Compared to the observations and NorESM1, NorESM2 tends to have a warmer subsurface ocean (Fig. 2d and e).
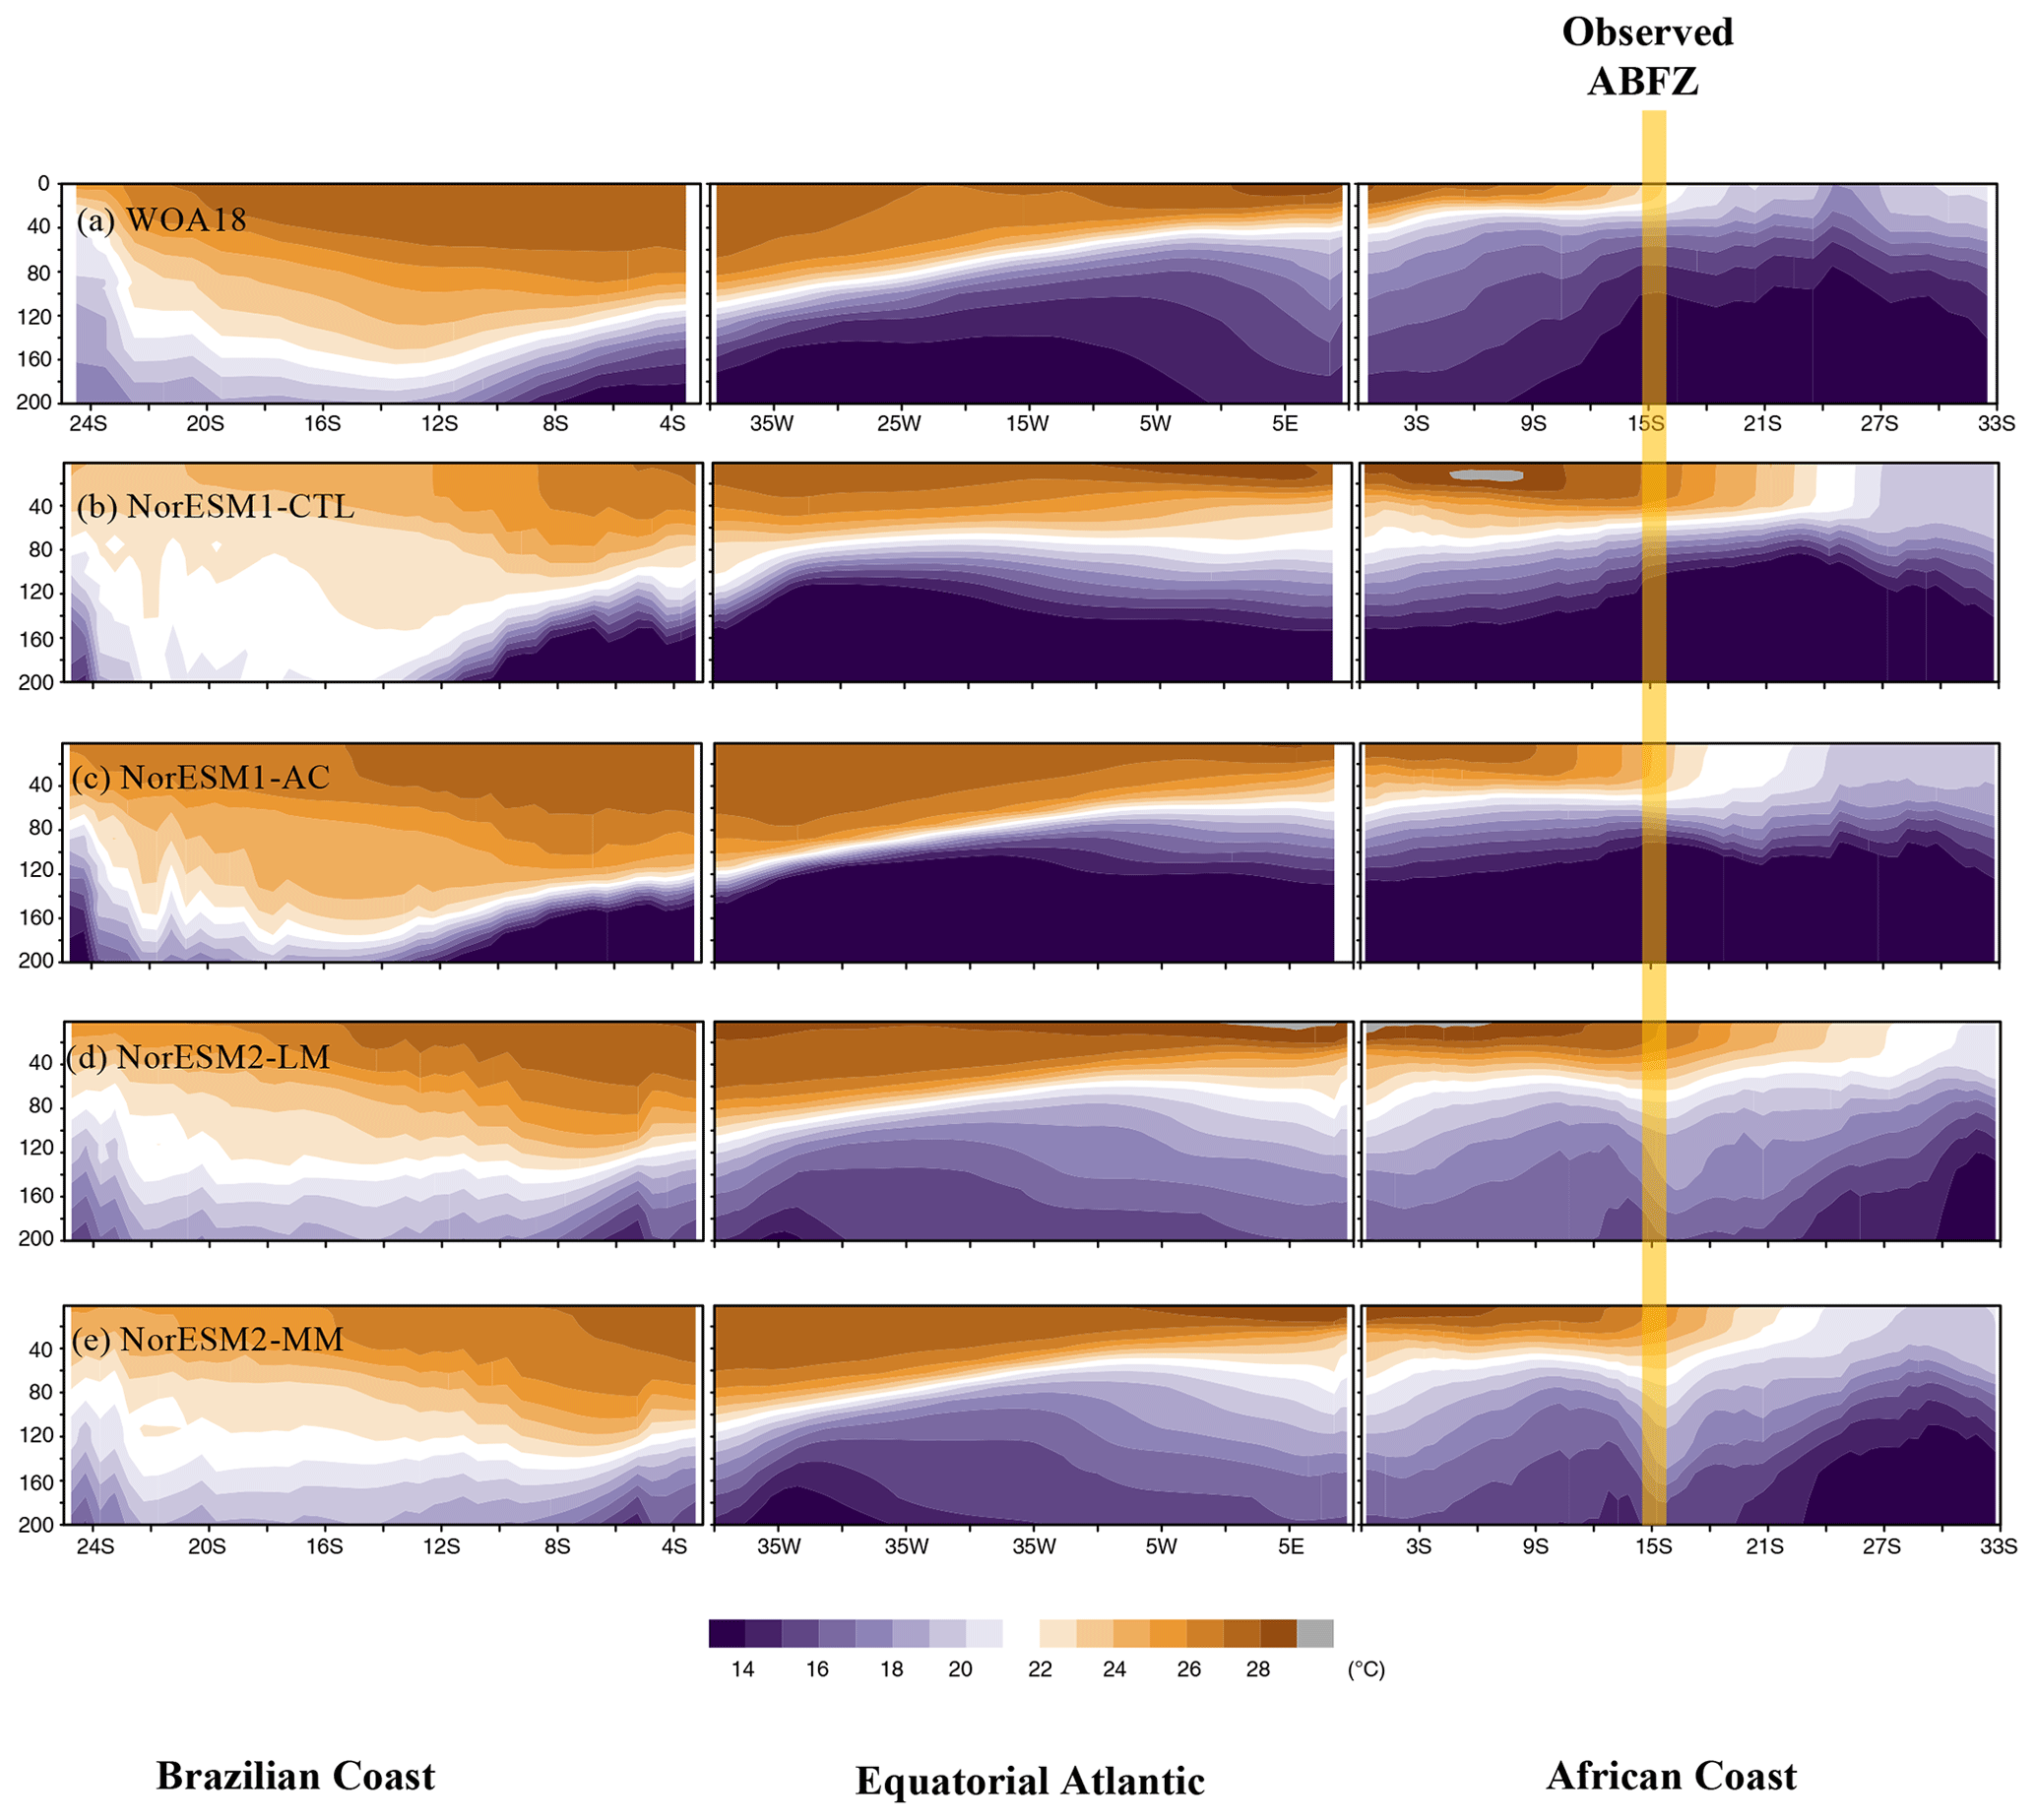
Figure 2Depth sector of annual-mean climatology of ocean temperature along Brazilian coast, equatorial Atlantic, and African coast for the observations and each NorESM simulation averaged over the three boxes shown in Fig. 1a. The yellow line denotes the location of the Angola–Benguela Frontal Zone (ABFZ) in the observation.
3.2 Seasonality
Figure 3a–e illustrates temporal longitude Hovmöller plots of SST in the equatorial Atlantic for the observations and each model simulation. In the observations, the SST shows a clear seasonal cycle (Crespo et al., 2019; Ding et al., 2009), with the ACT developing in the boreal summer. NorESM1-CTL roughly reproduces the seasonal cycle of SST, but it fails to simulate the location and timing of the ACT: the ACT peak occurs more westward at the Equator (30° W), and its peak is slightly later than in the observation (Fig. 3b). This discrepancy is consistent with the thick and zonally uniform warm layer along the entire equatorial Atlantic (Fig. 2b). Employment of the climatological bias correction leads to a more realistic development of the ACT; the location of the ACT is particularly well represented (Fig. 3c; Toniazzo and Koseki, 2018). Note that the anomaly coupling directly corrects the climatological surface wind forcing in the ocean model. In NorESM2 simulations, the SST seasonal cycle is also improved, and NorESM2-MM has a stronger ACT with better timing during summer than NorESM2-LM (Fig. 3d and e). However, NorESM2 tends to simulate warmer SST in the western basin from January to June. The SST seasonal cycle is strongly linked with the seasonal cycle of sea surface height (SSH; see Fig. S3 in the Supplement and Ding et al., 2009). In NorESM1-CTL, the summer shoaling in the eastern basin is delayed by 1 to 2 months, inducing the poor development of summer ACT (Fig. S2). The physical bias correction improves the SSH seasonal cycle and summer shoaling. In NorESM2, the seasonal cycle still seems biased (in particular NorESM1-LM), but the shoaling maximum occurs in the 0 to 10° E range, which is more realistic than NorESM1-CTL (the shoaling occurs mainly at 10° W–0°). This can result in a better thermocline zonal gradient (Fig. 2) and indicate that NorESM2 simulations have better ocean physics than NorESM1, such as upwelling Kelvin wave propagation and wind forcing.
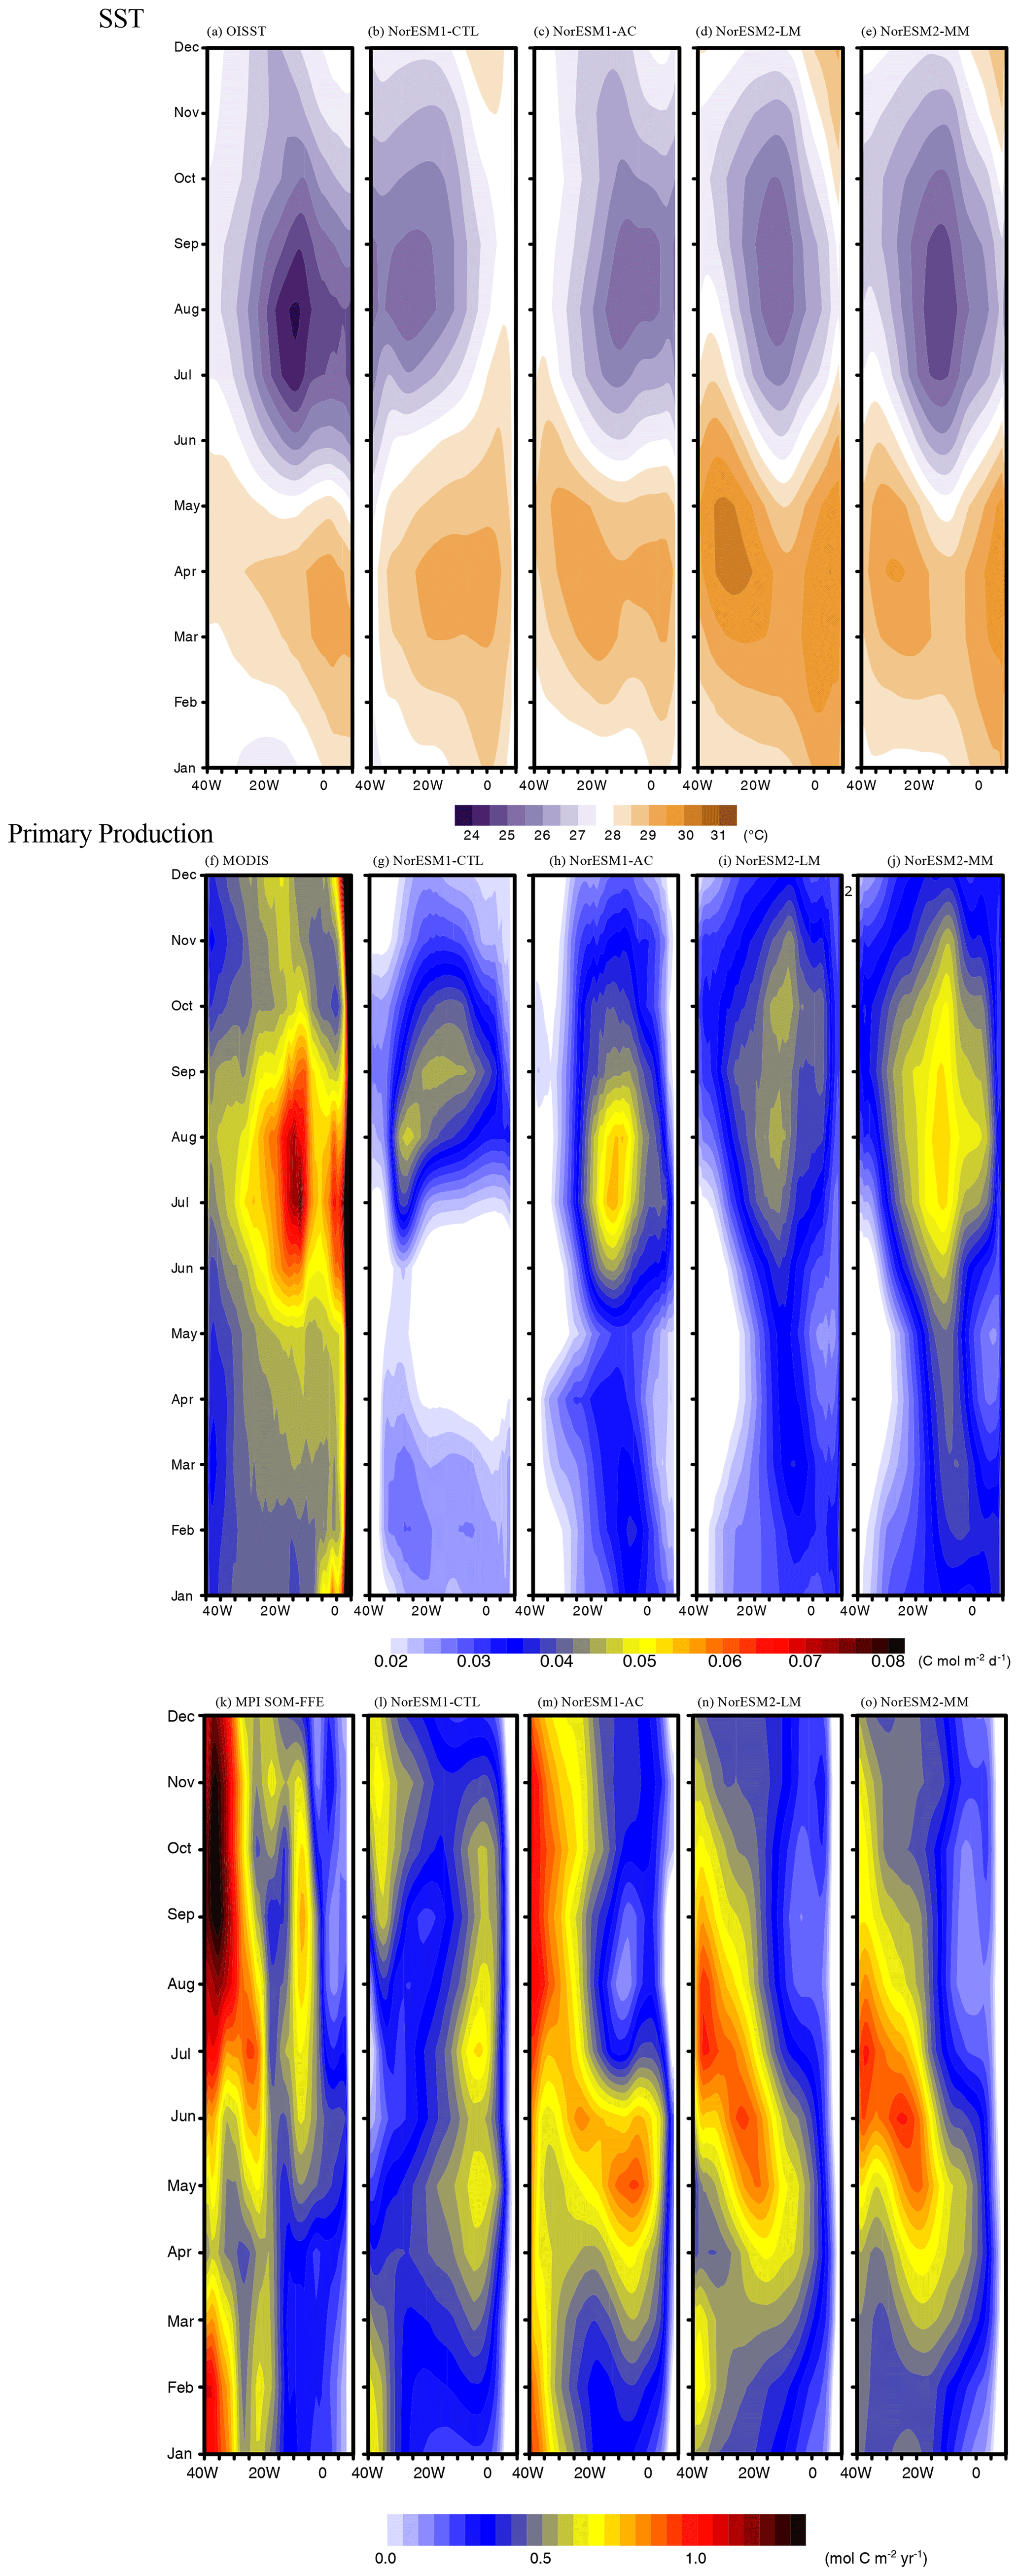
Figure 3Continued. Climatological seasonal cycle of air–sea CO2 flux. Positive value denotes upward.
Next, we investigate the simulation of surface biogeochemistry, which is tightly linked to physical dynamics and SST (e.g. Chenillat et al., 2021). Figure 3f–j shows the temporal longitude Hovmöller plot of climatological primary production for the observations and each simulation. In the observations, the primary production has a clear seasonal cycle with a peak between 20° W and 0° in JJA (0.075 ), which is consistent with the spatiotemporal development of the ACT (Fig. 3a and f). There is another less pronounced high-productivity season during November to January in the equatorial Atlantic (Fig. 3f). NorESM1-CTL simulates the summer bloom very poorly (Fig. 3g).
The peak of the summer bloom is weaker, is located more westward (30° W), and occurs later (in August and September) than in the observations. Apart from the summer bloom, there is another peak in February in the western basin and nearly no production in April to May. Interestingly, the climatological bias-corrected simulation NorESM1-AC is able to reproduce the observed timing and location of the summer bloom (Fig. 3h). The intensity of the summer bloom also increases (up to 0.055 ) even though it is 27 % lower than the observations. In the two NorESM2 simulations, the summer bloom tends to be better represented than in NorESM1-CTL (Fig. 3i and j). However, the summer bloom in NorESM2-LM is weak (approximately 0.043 ), and there is a double-core peak in August and October. On the other hand, NorESM2-MM has a stronger summer bloom with a more realistic timing that is similar to NorESM1-AC. These differences in primary production in the NorESM2 simulations can be attributed to the differences in the ACT development (Fig. 3d and e). All of the NorESM simulations fail to reproduce the very high coastal production in the east, which will be discussed in the last paragraph of this subsection.
The Hovmöller plot of air–sea CO2 flux along the Equator is given in Fig. 3k–o. In the observations, the CO2 flux has a clear seasonal cycle: specifically, maximum CO2 flux outgassing occurs during July to October in the western (40–30° W) and eastern (10° W–0°) basins, while the outgassing is modest in the central (20° W) basin (Fig. 3k). The late summer peak of the CO2 flux in the central eastern basin could be associated with the development of ACT that supplies the anomalously high dissolved inorganic carbon (DIC) water mass from the subsurface (Koseki et al., 2023). Contrastingly, in the western basin where such upwelling is weaker, the outgassing may be related to the solubility of CO2 gas. As Lefevre et al. (2013) and Koseki et al. (2023) suggest, the solubility of CO2 gas (a function of temperature and salinity) is responsible for the interannual variability in pCO2 and consequently air–sea CO2 flux in the tropical Atlantic. In the western basin, the CO2 outgassing is moderate in April when the precipitation is strongest (not shown) along the western equatorial Atlantic, and in contrast the timing of intense outgassing (August to October) is consistent with the period when the inter-tropical convergence zone (ITCZ) sits further northward from the Equator.
NorESM1-CTL poorly reproduces the seasonal march of CO2 distribution (Fig. 3l): the eastern outgassing shifts more eastward and occurs 1 or 2 months earlier. In the western basin, the observed vigorous outgassing is not simulated well, except for some weak outgassing from September to March. In NorESM1-AC, the observed outgassing in the western basin is particularly well simulated from July to November, although its magnitude is relatively modest (Fig. 3m). In the central and eastern basins, the early occurrence of intense outgassing remains. Similar to the primary production, improvement in the two NorESM2 simulations (Fig. 3n and o) relative to NorESM1-CTL is also evident for the CO2 flux. Nevertheless, the timing of the seasonal cycle in the eastern basin shifts considerably.
Compared to NorESM1-CTL, all other NorESM simulations statistically improve the SST, primary production, and air–sea CO2 flux seasonal cycle in a statistical way (Fig. 4). In particular, NorESM1-AC performs the best, followed by NorESM2-MM, in reproducing the observed seasonal variations in the SST, air–sea CO2 flux, and primary production (Fig. 4a). While NorESM2-LM also improves the seasonal cycle of SST and primary production (PP), these improvements are smaller than those in NorESM2-MM, indicating that the refinement of atmospheric component is beneficial to improve the ocean physics (e.g. Harlass et al., 2018) and thus biogeochemistry in the model. The well-pronounced improvements in NorESM1-AC compared to NorESM1-CTL indicate that the atmospheric circulation is crucially responsible for representation of SST, PP, and CO2 flux in the tropical Atlantic. Indeed, the SST in this region is highly influenced by wind-induced upwelling (e.g. Voldoire et al., 2019), which also supplies nutrients to the surface ocean that fuels PP. For the air–sea CO2 flux there are some improvements, but the difference among NorESM1-AC, NorESM2-LM, and NorESM2-MM is not as large as for SST and PP. This suggests that correction in surface properties (wind-stress and SST) is insufficient to correct the air–sea CO2 flux in the model. Previous studies highlighted in the importance of the interior mean state of DIC and alkalinity and riverine fluxes for CO2 flux variability in this region (Koseki et al., 2023; Pérez et al., 2024). A scatter plot between SST and biogeochemical correlations clearly shows that the better simulation of the SST seasonal cycle is important for simulating the seasonal cycle of biogeochemical processes (Fig. 4b).
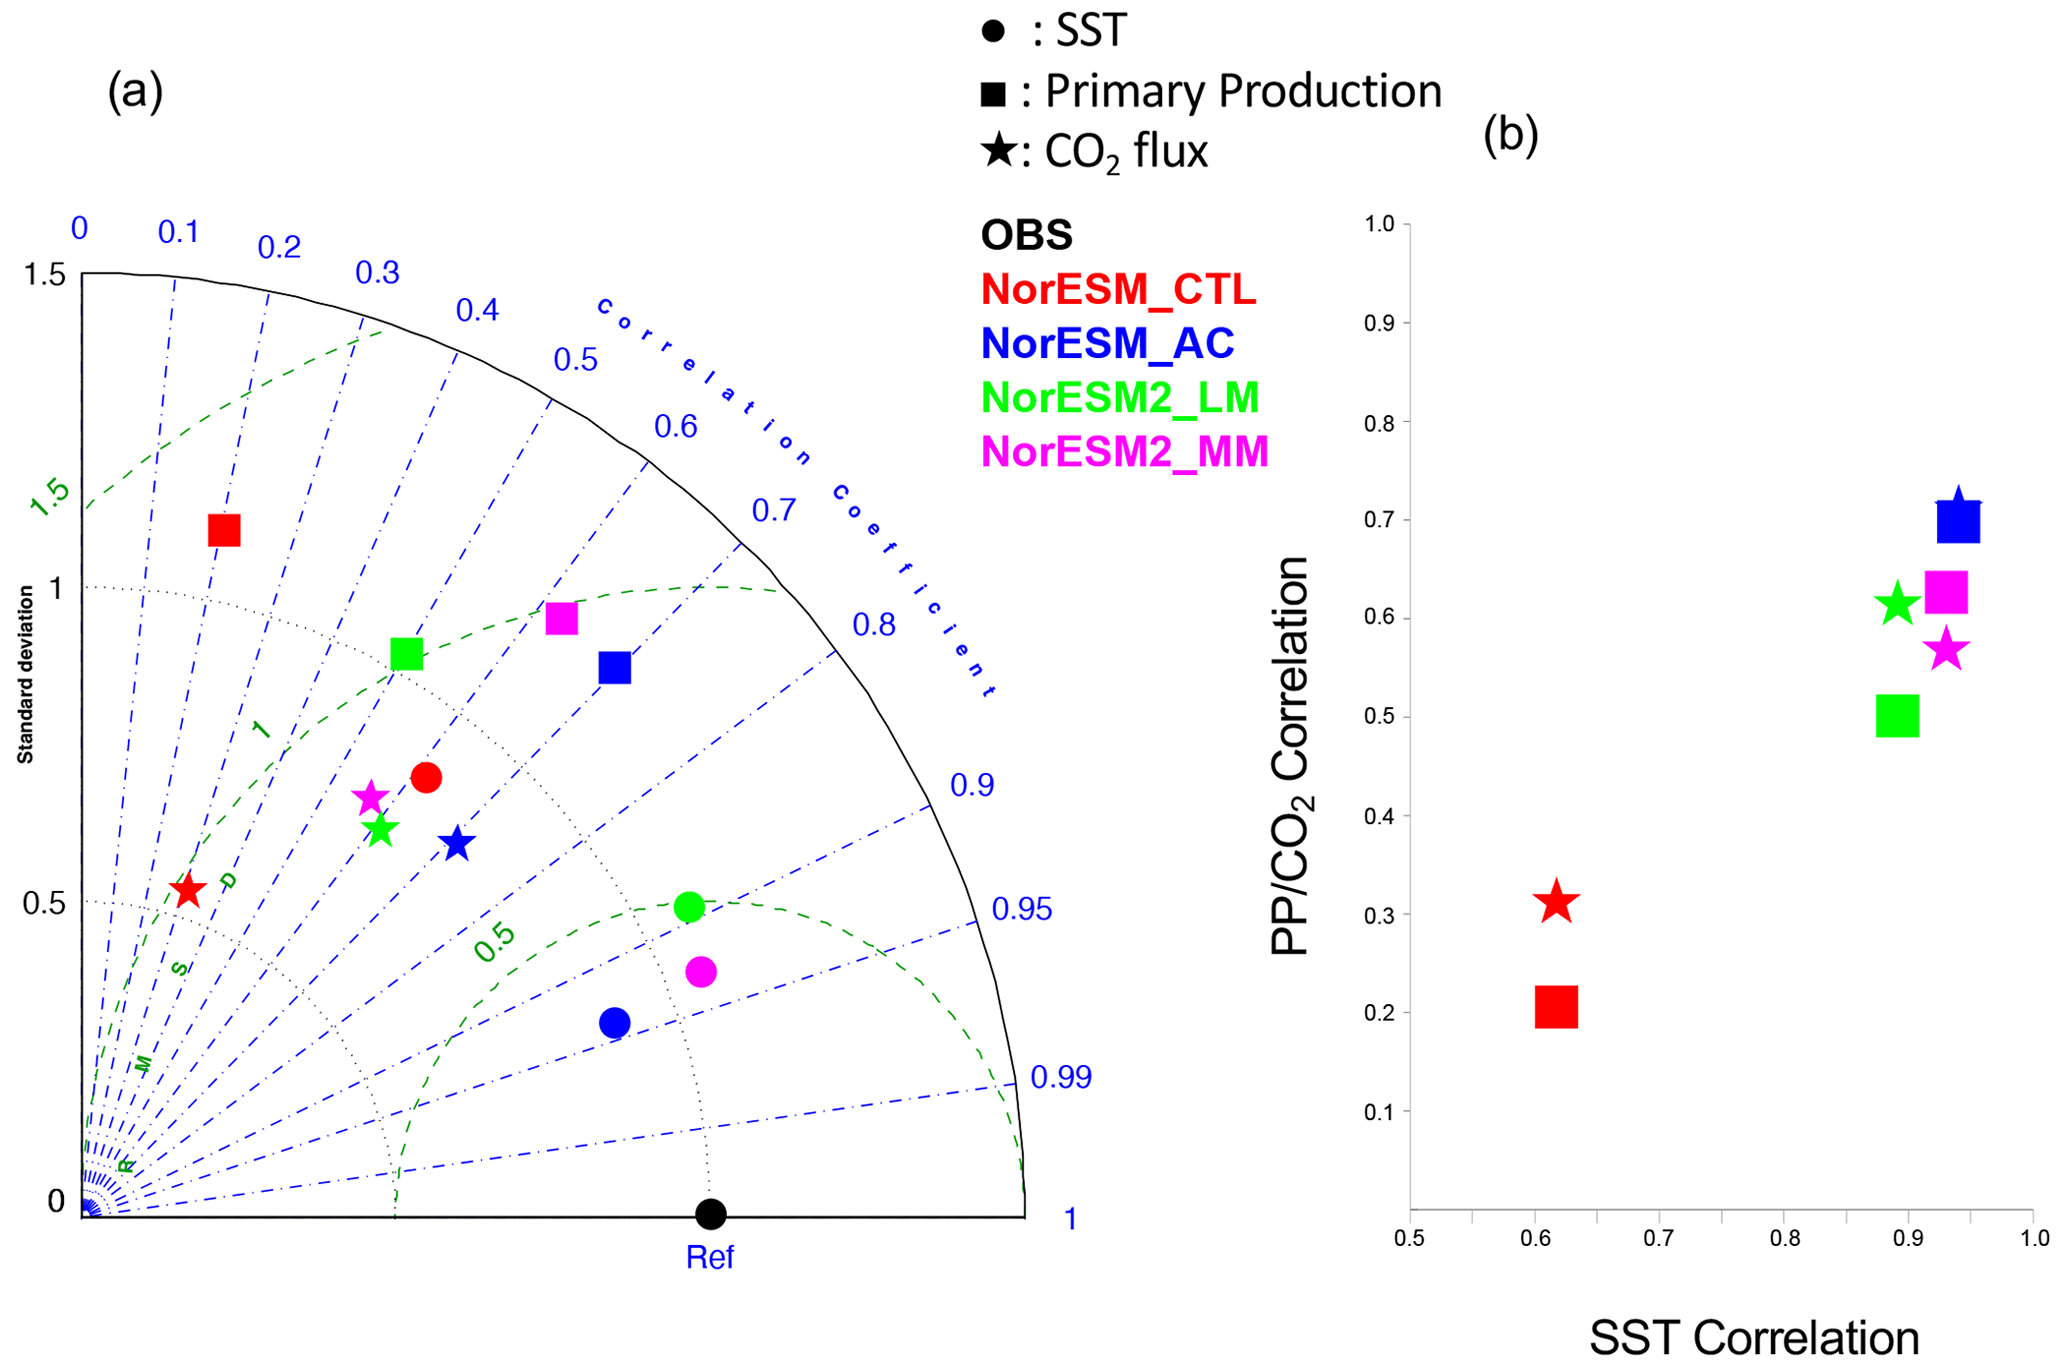
Figure 4(a) Taylor diagram of the climatological seasonal cycle of SST (closed circle), primary production (closed square), and air–sea CO2 flux (star) with respect to observations of OISST, MODIS, and MPI SOM-FFN, respectively. Each NorESM simulation is distinguished using a different colour (NorESM1-CTL: red; NorESM1-AC: blue; NorESM2-LM: green; NorESM2-MM: magenta). (b) Scatter plot between the SST correlation coefficient and PP or CO2 flux. The meanings of the colours are the same as in (a). Note that the standard deviation is normalized by that of the observations and that the calculations of the correlation and standard deviation do not include the data along the African coast.
Because the summer bloom in the tropical Atlantic is closely connected to the availability of nutrients (e.g. Radenac et al., 2020), here we assess the subsurface nutrient concentrations during JJA (Fig. 5). In the observations, nitrate () and phosphate () have clear east–west-tilting slopes associated with the thermocline during JJA (Fig. 5a, f, and k). According to Radenac et al. (2020), this nutrient supply to the euphotic zone is mainly driven by vertical advection associated with upwelling, while vertical diffusion and meridional advection contribute to shape and spread the Atlantic summer bloom. As shown in Figs. 2b and 5b, NorESM1-CTL fails to simulate the observed equatorial thermocline gradient. Corresponding to the flat thermocline, the upwelling of nitrate and phosphate is suppressed in the central and eastern basins (Fig. 5g and l). In addition, the amount of nutrients is overestimated in the west (35–30° W) between 60 and 100 m depths. The westward-shifting and weaker summer bloom of production might be attributable to this nutrient supply bias in NorESM1-CTL. The alleviation of the thermocline bias by the climatological physical bias correction leads to a better representation of the pumping of subsurface nutrients from the central and eastern basins (Fig. 5h and m). Similar improvement can be detected in NorESM2 simulations (Fig. 5i, j, n, and o), resulting in a better seasonal cycle of the primary production, especially regarding the Atlantic summer bloom (Fig. 3i and j). In the two NorESM1 versions, the ocean subsurface is cooler and more abundant in nutrients than in NorESM2 models, which could be associated with the difference in the ecosystem parameters in addition to the ocean circulation, i.e. a stronger Atlantic overturning circulation (Tjiputra et al., 2020). The same analysis of chlorophyll a is examined as in Fig. S4 in the Supplement. Chlorophyll a in the model is estimated from the simulated phytoplankton in each simulation. Although NorESM2 simulations tend to overestimate the observed chlorophyll a in the western basin throughout most part of the year (likely due to the uncertainty in the riverine nutrient flux), the seasonal cycle of chlorophyll a is improved in NorESM1-AC, NorESM2-LM, and NorESM2-MM to a similar extent (especially in 50 m depth mean value; see Fig. S4g) to that of PP (Fig. 4b).
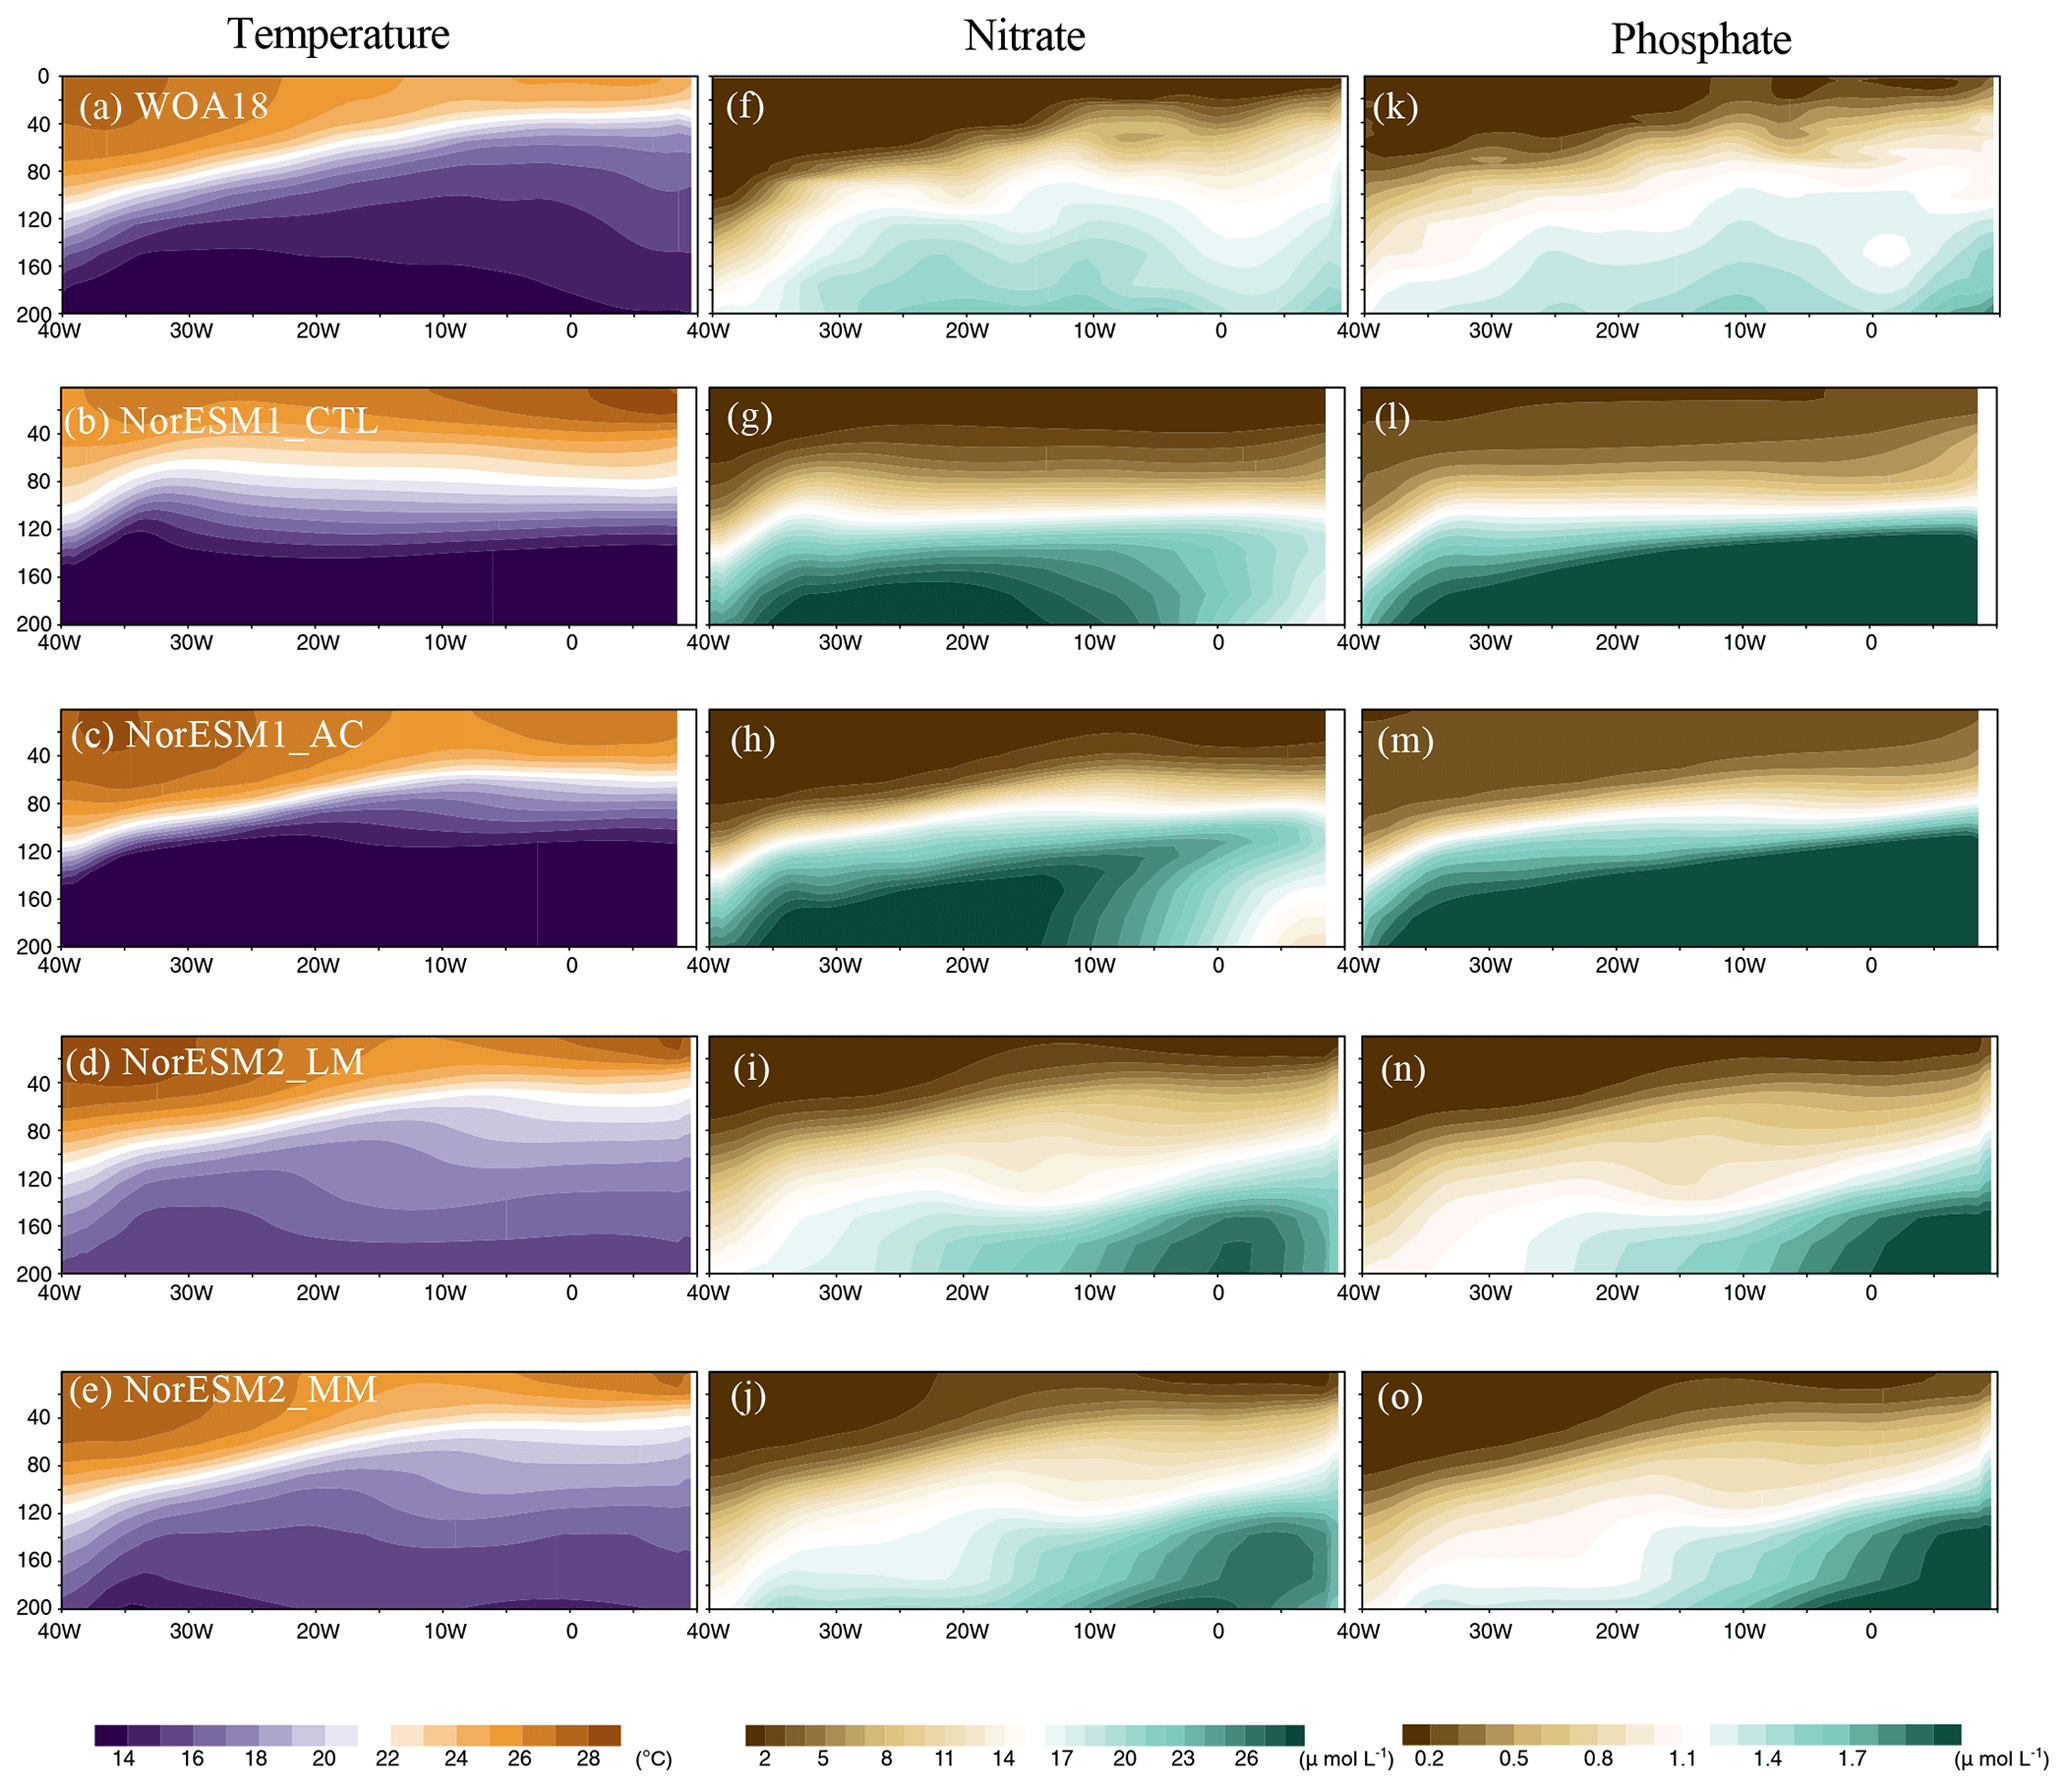
Figure 5Depth longitudinal section of (a–e) temperature, (f–j) nitrate, and (k–o) phosphate in JJA climatology for the observations and each NorESM simulation averaged over 3° S and 3° N.
Similar to the equatorial Atlantic, the climatological physical bias correction is beneficial for the coastal upwelling and nutrient supplies in the South Atlantic and western African coastal region where the marine biogeochemical cycle and ecosystem are very intense (Figs. S5 and S6 in the Supplement; e.g. Cury and Shannon, 2004; Shannon et al., 2004). NorESM2-MM simulates better coastal upwelling and nutrients than NorESM2-LM, indicating that the horizontal refinement of the atmospheric component is also beneficial for the coastal upwelling. While the improved nutrient supply can be effective for the primary production in the Benguela upwelling region (between 15 and 35° S) in NorESM1-AC (Fig. S6), the primary production in the Benguela upwelling region in the two NorESM2 simulations is greatly reduced compared to NorESM1-CTL. This might be caused by the parameter tuning in biological dynamics processes that suppress the anomalous excess primary production here and in other oceanic regions (Tjiputra et al., 2020). In contrast, NorESM2 has slightly more primary production in the equatorial coastal region (between 5 and 10° S) than NorESM1 (Fig. S6). This can be attributed to the riverine-originated nutrient input from the Congo River implemented in NorESM2 (Gao et al., 2023; Tjiputra et al., 2020).
3.3 Interannual variability
One of the most pronounced climate variability patterns in the tropical Atlantic is the Atlantic Zonal Mode (AZM; e.g. Keenlyside and Latif, 2007), referred to as Atlantic Niño variability. Most of state-of-the-art models still have difficulty in reproducing the observed Atlantic Niño variability with respect to seasonality, location, and strength (e.g. Richter and Tokinaga, 2020). However, as previous studies suggest (e.g. Counillon et al., 2021; Dippe et al., 2018), the climatological biases adversely affect the simulation of SST variability in the tropical Atlantic. Recent studies showed that the Atlantic Niño influences the marine biogeochemical processes in the tropical Atlantic (e.g. Chenillat et al., 2021; Koseki et al., 2023). Therefore, here -*-the Atlantic Niño variability and its impacts on the marine biogeochemical processes are assessed.
Figure 6a–e illustrates the seasonality of SST interannual variability along the equatorial Atlantic. In the observations, the peak in variability associated with the Atlantic Niño and Niña events is found from June to July at around 20° W (e.g. Dippe et al., 2018; Nnamchi et al., 2015). In addition to the peak in the summer, there is a secondary peak during November to December (e.g. Okumura and Xie, 2006). NorESM1-CTL is to some extent able to reproduce the observed seasonality of SST variability; however, its summer peak is delayed by 1 month, while its winter peak appears 1 month earlier in November (Fig. 6b). During the autumn, the variability is unrealistically strong compared to the observations. In contrast, NorESM1-AC is successful in simulating the summer and winter peaks with the right timing, although the amplitude is weaker (Fig. 6c). Another study suggests that this improvement in variability is attributed to the improvement of the Bjerknes feedback (e.g. Ding et al., 2015). While NorESM2-LM also reproduces the summer and winter peaks, this realization tends to overestimate the interannual variability, particularly in summer (Fig. 6d). NorESM2-MM is also able to improve the SST variability as it has an overestimated summer peak amplitude (but more moderate than NorESM2-LM) (Fig. 6e). It is noteworthy that the strong summer variability can also be seen at the eastern coast of the equatorial Atlantic in NorESM2-MM, which is observed but not simulated in other NorESM runs (Fig. 6a–d). The performance in simulating the seasonal cycle of the variability is summarized in a Taylor diagram in Fig. 6f. The physical bias correction and updated version of NorESM improve the SST variability with respect to the reference NorESM1-CTL in terms of seasonality (better correlation). While NorESM2 is better than NorESM1-AC in terms of correlation, NorESM2-LM has a higher RMSE due to the amplitude of the summer peak being too strong.
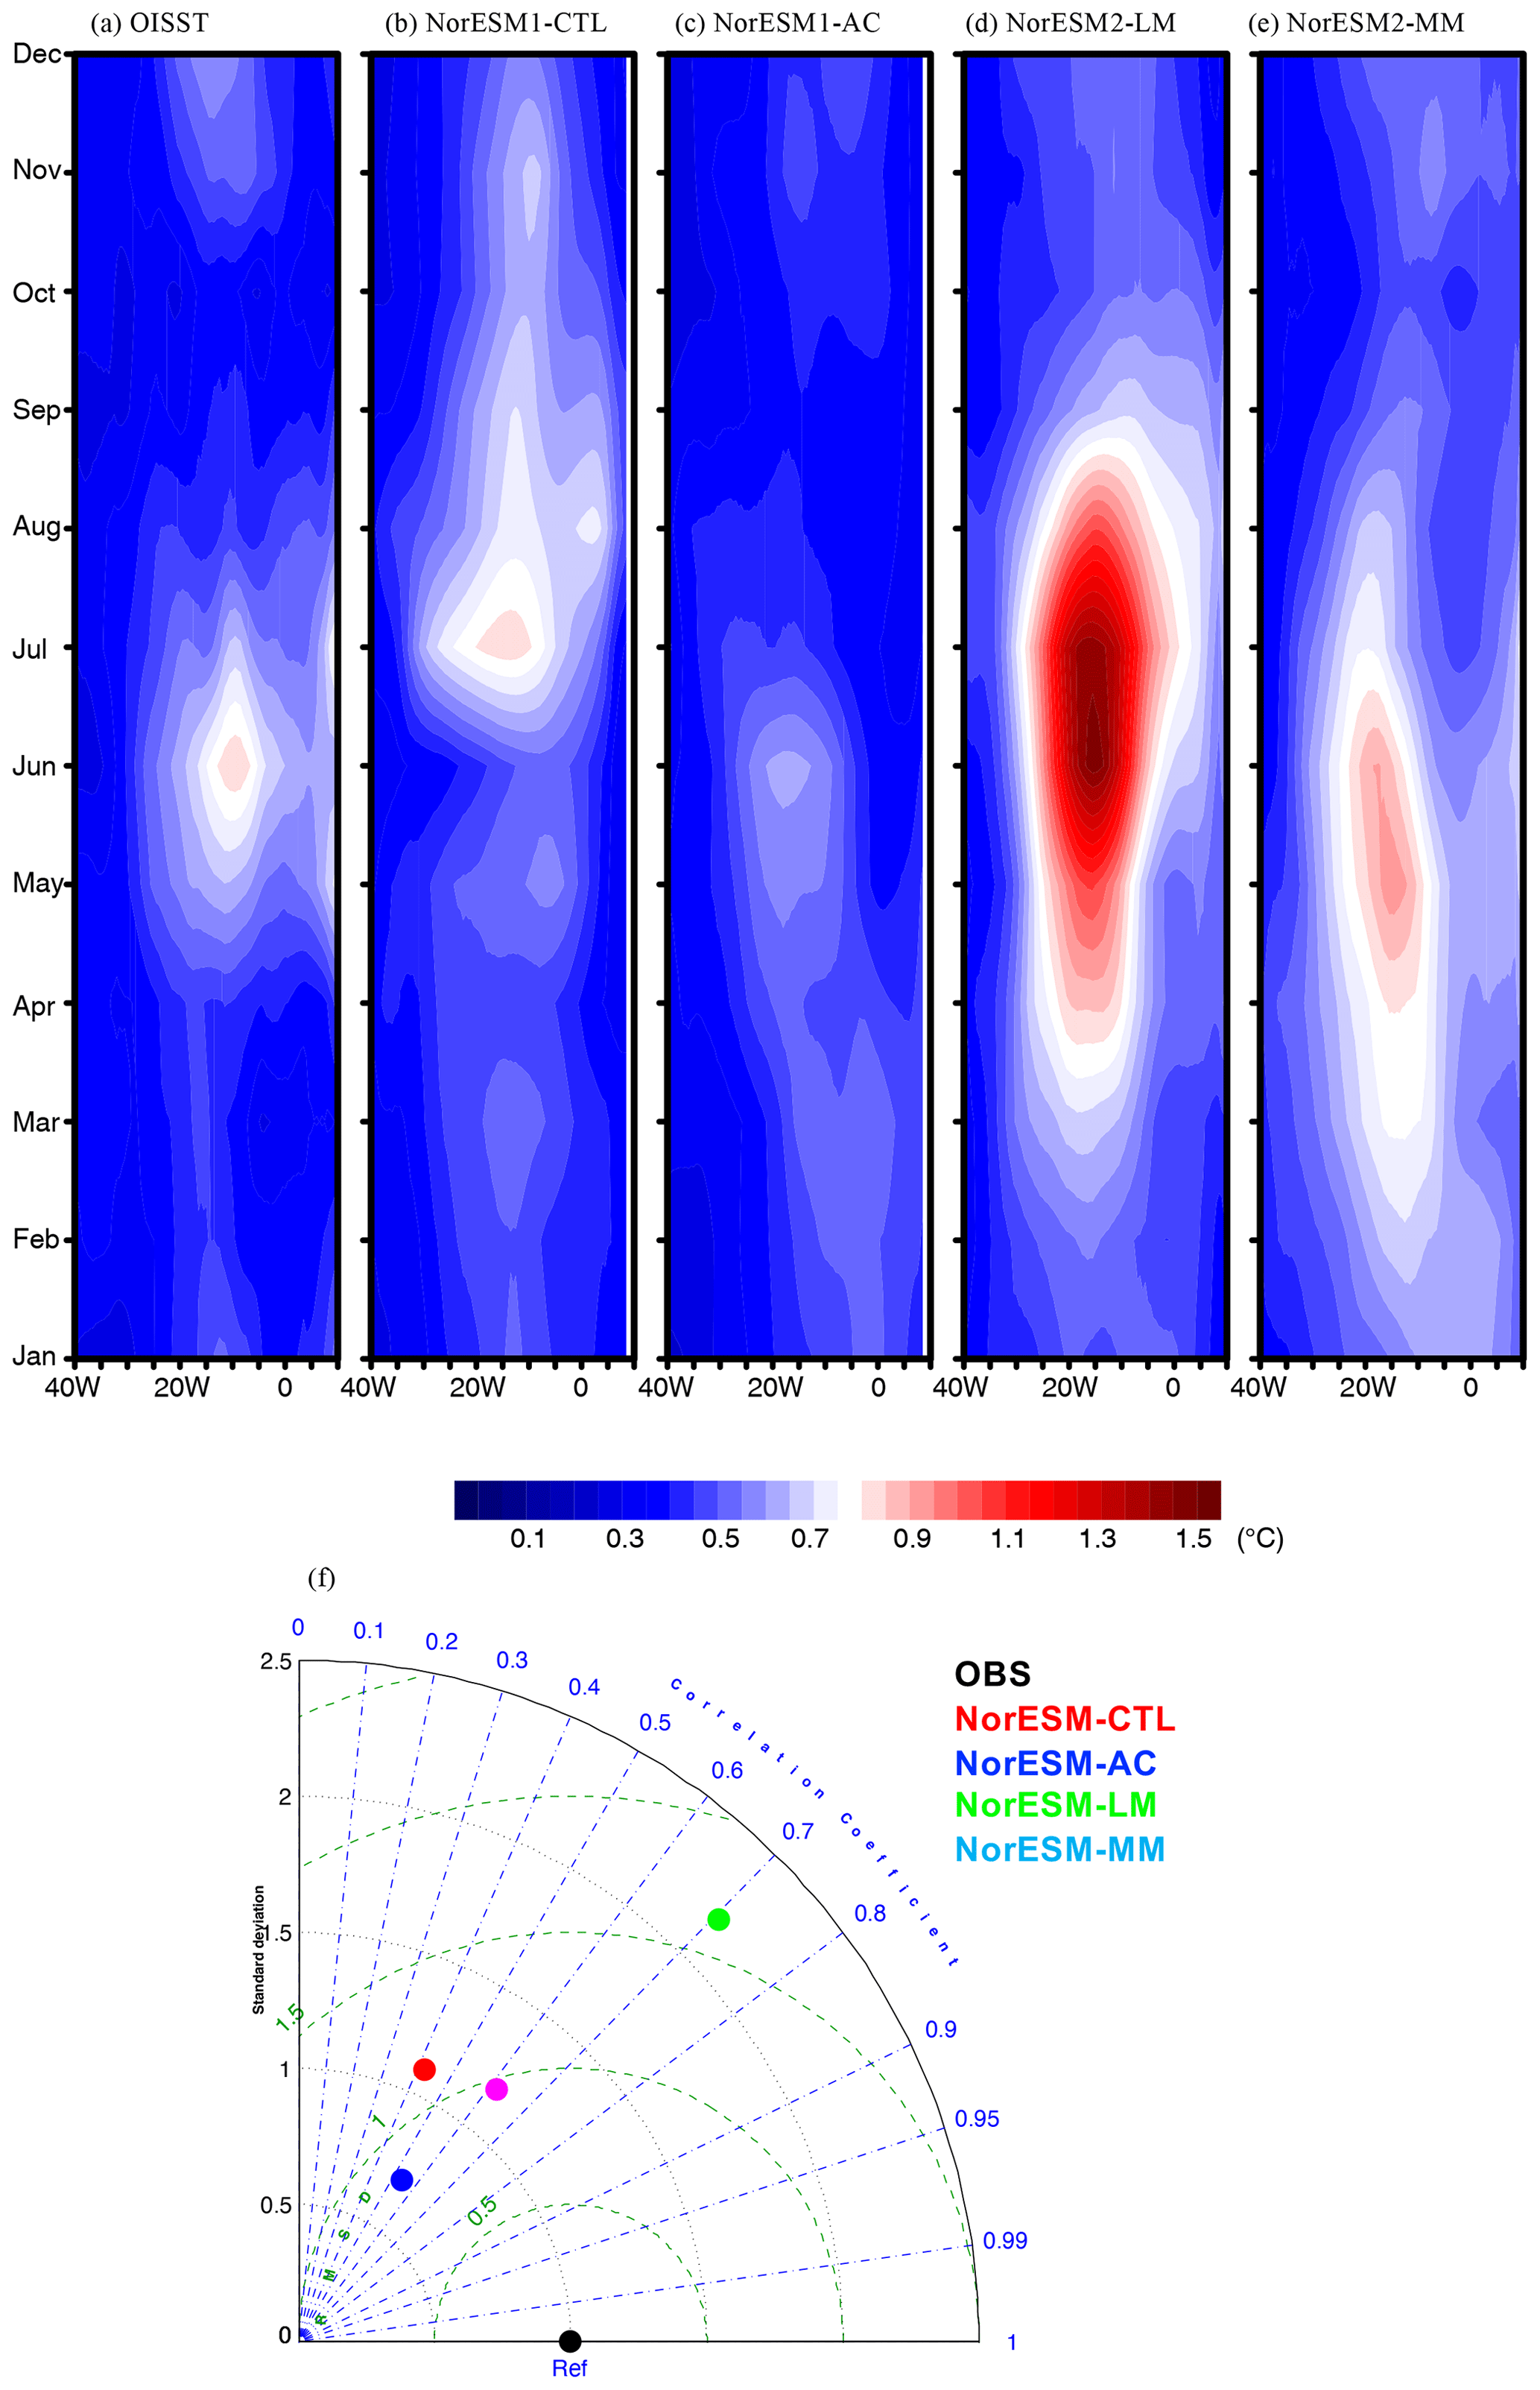
Figure 6(a–e) The same as Fig. 3 but for SST interannual standard deviation along the Equator. (f) The same as Fig. 4 but for the SST standard deviation.
To investigate the marine biogeochemical response to the AZM, the Atlantic Niño and Niña events are estimated by detrending the Atlantic 3 Index (det-ATL3), defined as June–July SST anomalies averaged over 20° W–0° and 3° S–3° N. From det-ATL3, the Atlantic Niño and Niña are defined as values of det-ATL3 that are larger and smaller than ± 1 standard deviation, respectively. Note that 0.75 × standard deviation is used as the threshold for the observations. Since the monthly primary production data are only available from 2000 to 2019 and the Atlantic Niño and Niña tends to be weaker during this decade (e.g. Prigent et al., 2020), the lower threshold yields more Atlantic Niño and Niña events. The events in NorESM simulations are defined by the individual ensemble member's climatology and standard deviation. To emphasize the anomalies due to the Atlantic Niño, the difference in composite between Atlantic Niño and Niña are shown, and the values of composite anomalies are scaled by the ATL3 index in the observations and simulations.
In the observed climatology in June and July, the high productivity extends from the African coast to the equatorial Atlantic (Fig. 7a; see also Fig. 3f). The primary production is suppressed during the Atlantic Niño around 15 to 10° W at the Equator (Fig. 7f), while around the African coast there are stronger but less significant anomalies. These observed climatological and anomaly patterns of primary production are similar to those for chlorophyll a shown by Chenillat et al. (2021), who suggested that chlorophyll a variability is driven mainly by the upwelling of subsurface nitrate associated with the Atlantic Niño and the corresponding nitrate supply from the ocean subsurface. NorESM1-CTL fails to reproduce the observed climatological Atlantic summer bloom and the maximum of primary production located closely to the northeastern Brazilian coast with a smaller magnitude (Fig. 7b). The strong suppression of the primary production during Atlantic Niño is located erroneously around 20° W, which is too far west when compared to the observations (Fig. 7f and g). As shown in Fig. S7 in the Supplement, the simulated primary production anomaly during the Atlantic Niño is in less agreement with the observations than those during the Atlantic Niña. With the physical bias correction (NorESM1-AC), the core of the Atlantic summer bloom is located in the central equatorial Atlantic (Fig. 7c), while the reduced primary production anomaly has a peak around 10° W, which is more realistic (Fig. 7h). Compared to NorESM1-CTL, the climatology and ATL3-scaled response of primary production is larger in NorESM1-AC, which is more in line with the observations (Fig. 7g and h). NorESM2 configurations also simulate the summer bloom at the more realistic location elongating from the eastern to central basin, although the magnitude of the bloom is underestimated (Fig. 7d and e). In addition, there is some productivity (much smaller than the observation) along the western African coast (5 to 10° S) that NorESM1s fail to reproduce. This could be associated with the riverine flux implemented in NorESM2 models (Tjiputra et al., 2020). The suppression of primary production associated with the Atlantic Niño is well captured in the central basin (20–10° W) at the Equator, but its amplitude in NorESM2-LM is relatively small compared to NorESM1-AC (Fig. 7i). In NorESM2-MM, the climatological primary production is better reproduced and has a larger amplitude than that of NorESM2-LM (Fig. 7d and e). The suppression of primary production is captured in the central basin at the Equator during the Atlantic Niño (Fig. 7j).
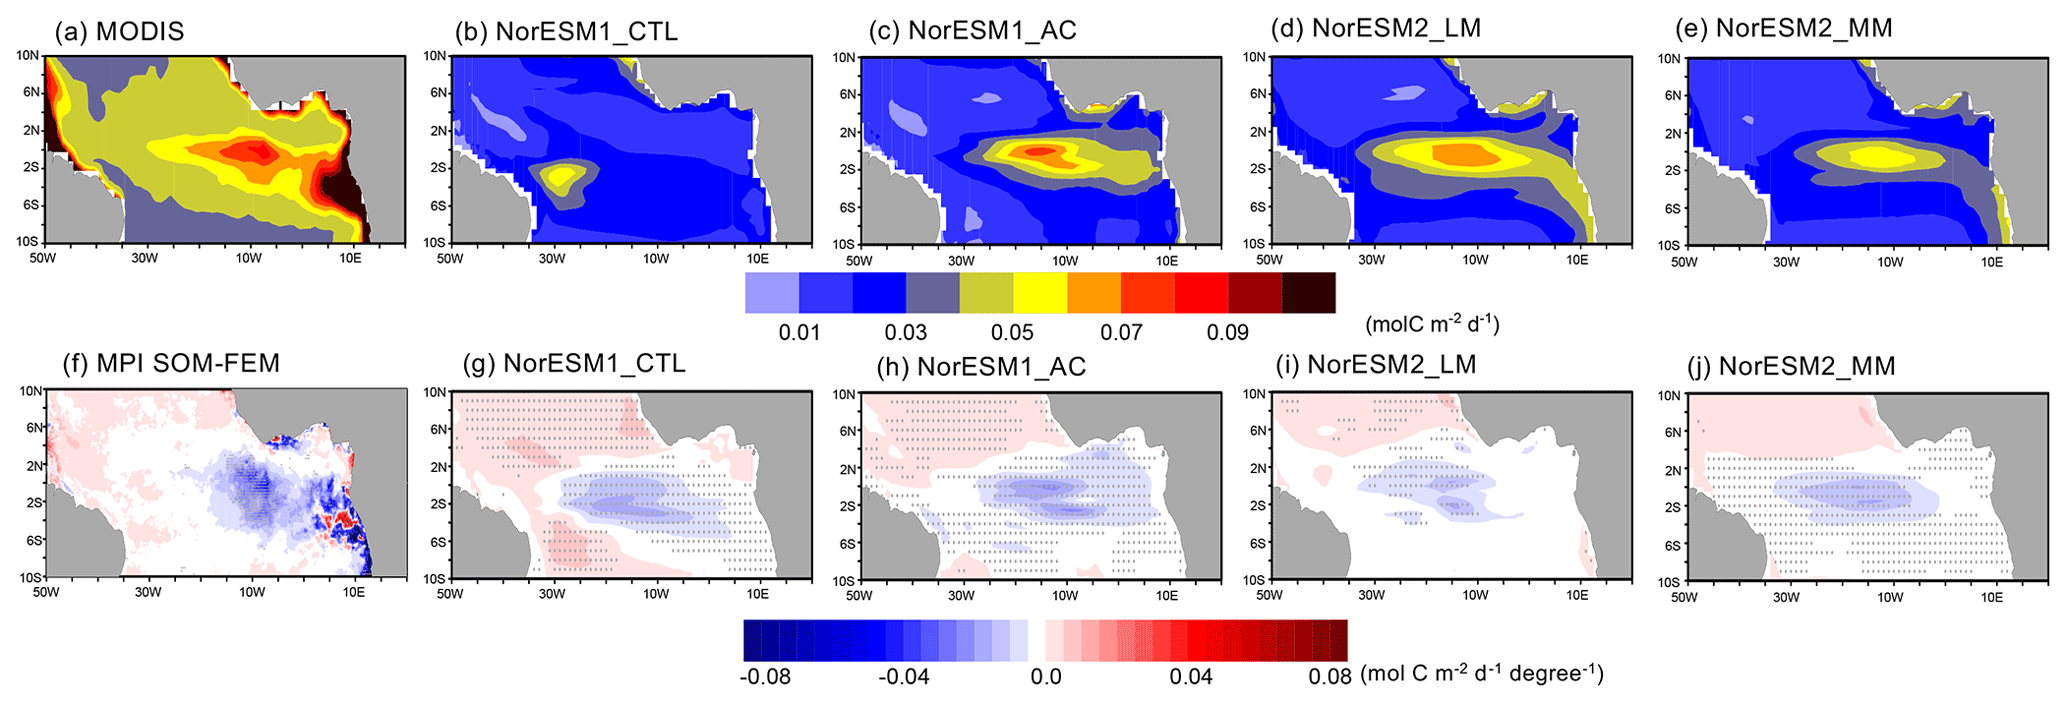
Figure 7June–July mean primary production for (a–e) climatology and (f–j) composite anomalies between Atlantic Niño and Niña for the observations and each NorESM simulation. The composite anomalies are scaled by ATL3 index anomalies between Atlantic Niño and Niña conditions. Grey dots denote a significance level of 90 % as estimated by Student's t test.
As Chenillat et al. (2021) showed, the primary production during the summer fluctuates predominantly due to anomalous upwelling associated with the Atlantic Niño and Niña events, which modulate the nutrient supply from the subsurface. In NorESM1-CTL, the supply of nitrate is reduced during the Atlantic Niño consistent with the suppressed primary production, and the anomaly minimum is centred at around 100 m depth and 20° W (Fig. 8a). These upwelling-induced nitrate anomalies largely drive the simulated primary production anomalies. Compared to NorESM1-CTL, the nitrate anomalies shift shallower and more eastward in NorESM1-AC (Fig. 8b). The negative anomalies crop up just below the ocean surface (∼40 to 20 m) in the central and eastern basins (20° W to 10° E), which is vaguely seen in NorESM1-CTL. This eastward shift and shoaling of nitrate anomalies appear to be important to produce more comparable primary production anomalies with the observations in NorESM1-AC than in NorESM1-CTL (Fig. 7g and h; e.g. the primary production in the model occurs in the euphotic zone fixed to the top 100 m depth). Similarly, the shallower nitrate anomalies in NorESM2 models are located in the central and eastern basins in Fig. 8c and d. Outcropping of the nitrate anomalies to near the surface is also detected, and consequently the primary production anomalies are comparable with the observations, especially in terms of location (Fig. 7i and j).
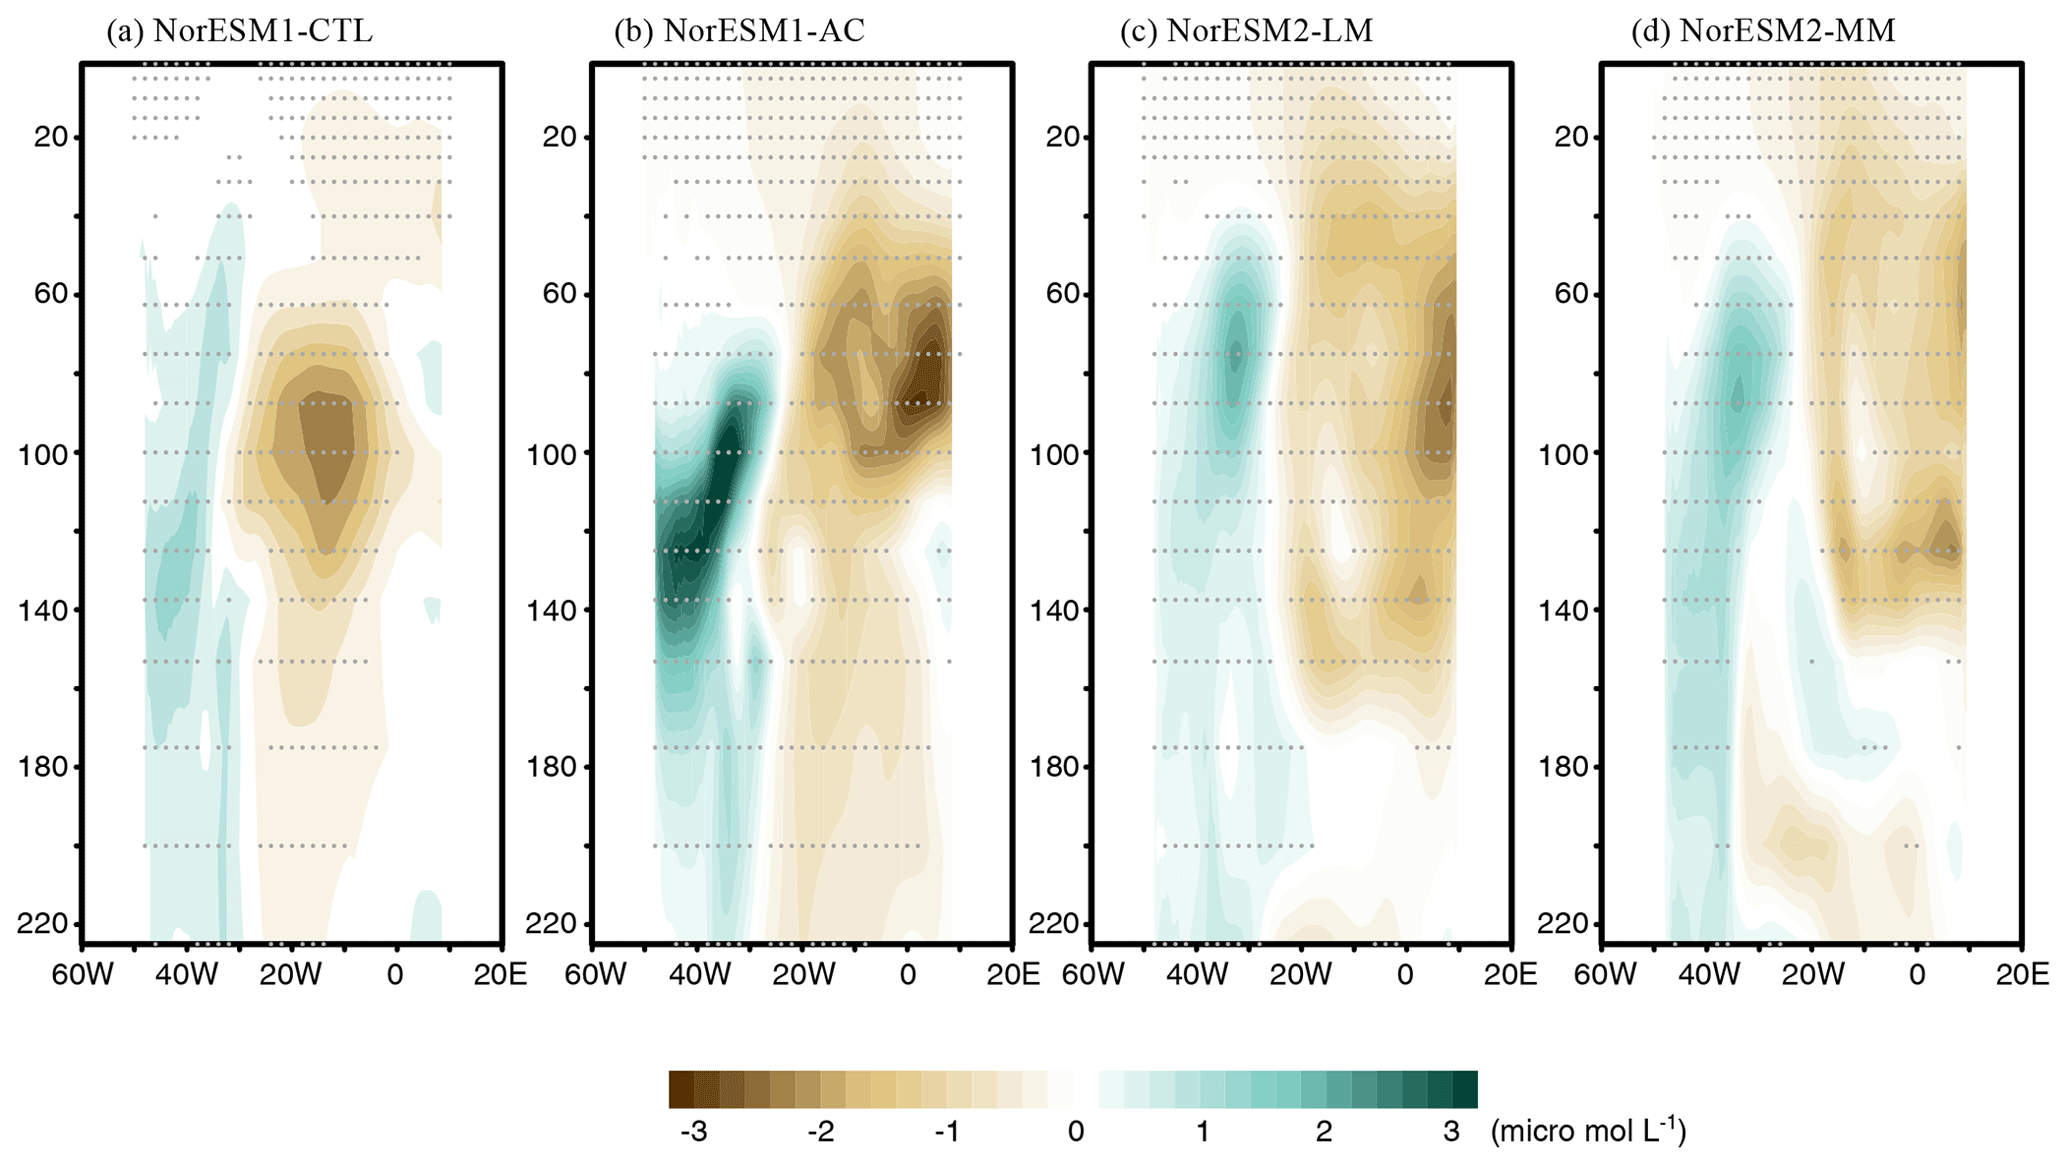
Figure 8Depth longitudinal sector (averaged between 3° S and 3° N) of June–July mean composite anomalies of nitrate concentration between Atlantic Niño and Atlantic Niña in each NorESM simulation. Grey dots denote a significance level of 90 % using Student's t test.
The observation shows that the climatological outgassing (ocean to atmosphere) CO2 maximum is located in the western basin of the equatorial Atlantic, and another moderate peak is detected in the central basin (Fig. 9a). As shown by Koseki et al. (2023), the CO2 flux responds to the Atlantic Niño with a dipole structure in the equatorial Atlantic (Fig. 9f). The CO2 outgassing is reduced during the Atlantic Niño around the northeastern Brazilian coast (50–30° W) away from the core of SST anomalies (Fig. 6a and Koseki et al., 2023). In contrast, the CO2 outgassing is enhanced in the central and eastern basins during the Atlantic Niño. According to Koseki et al. (2023), this dipole structure of anomalies is induced mainly by freshwater (western basin) and SST anomalies (central and eastern basins), which change the surface partial pressure of CO2. The spatial CO2 flux pattern in NorESM1-CTL is largely biased, as shown in Fig. 9b. The climatological flux has its outgassing peak more southward in the central basin, and there is a weak CO2 uptake around the northeastern coast of Brazil (Fig. 9b). An ingassing bias is simulated along the African coast between 10 and 6° S. NorESM1-CTL also fails to reproduce the spatial pattern of flux anomalies associated with the Atlantic Niño (Fig. 9g). The observed dipole structure of CO2 flux anomalies during the Atlantic Niño is incorrectly simulated off the Equator between 35° W and 0° at 6° S (Fig. 9f).
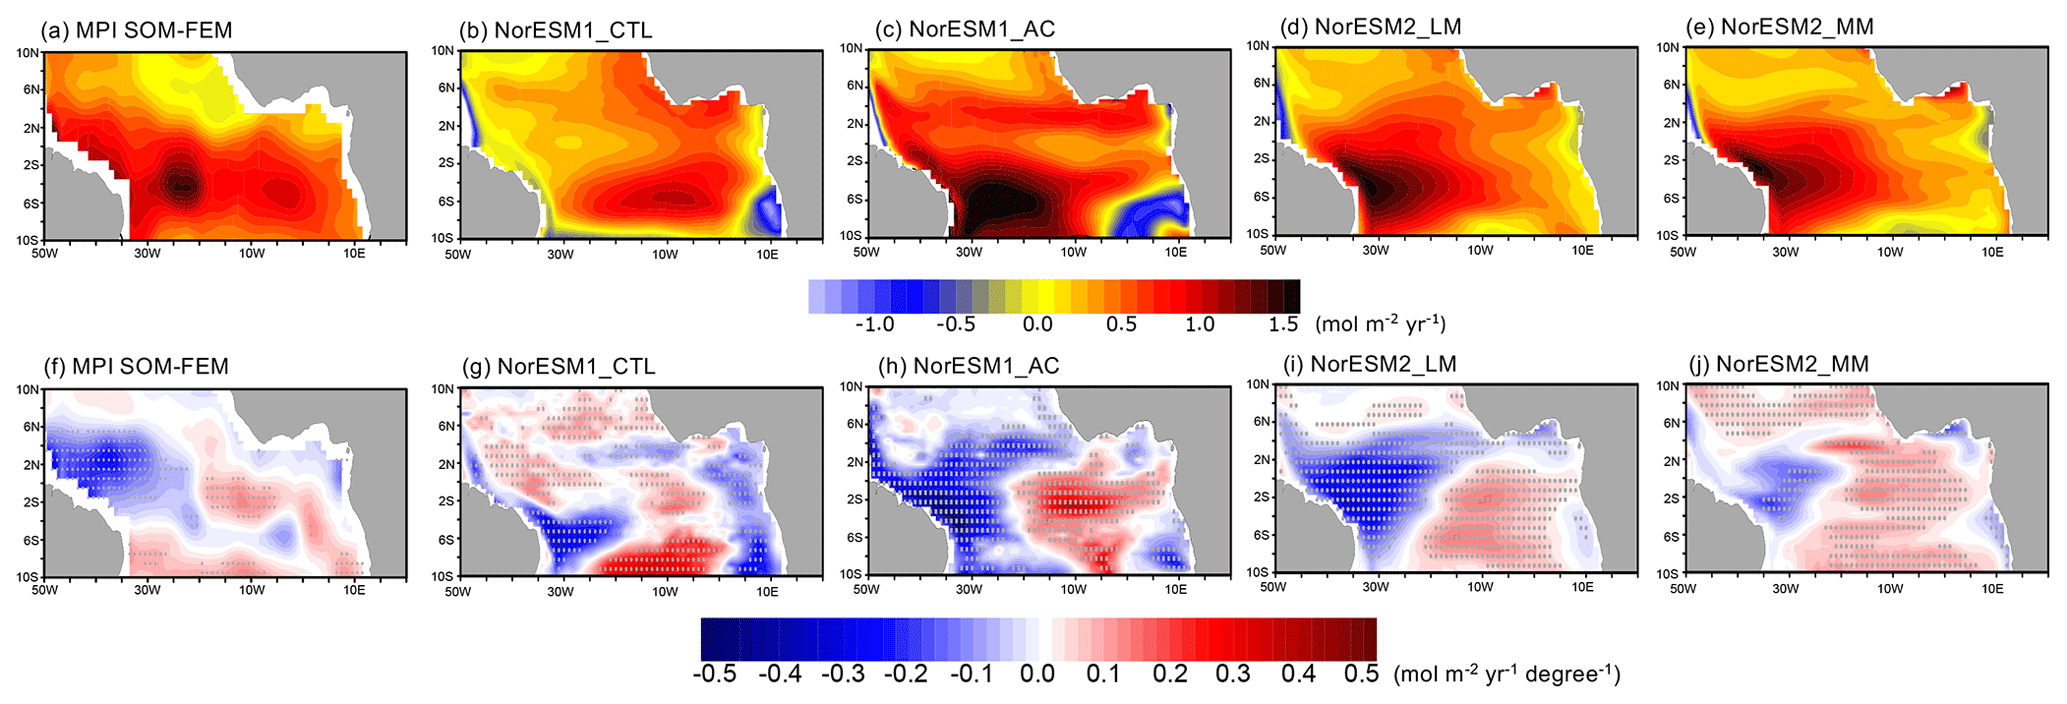
Figure 9June–July-mean surface CO2 flux for (a–e) climatology and (f–j) composite anomalies between Atlantic Niño and Atlantic Niña for the observations and each NorESM simulation. Outgassing is shown by positive values. The composite anomalies are scaled by ATL3 index anomalies between Atlantic Niño and Niña. Grey dots denote a significance level of 90 % estimated by Student's t test.
The climatological physical bias correction approach implemented in NorESM1-AC is somewhat successful in improving the climatological summer air–sea CO2 flux in Fig. 9c. Although it is overestimated and the maximum of outgassing shifts southward compared to the observations, the strong upward CO2 flux occurs more realistically in the western basin (Fig. 9c). The uptake bias remains along the western African coast, indicating that the CO2 flux variability here is not predominantly driven by SST but rather by the bias in the biogeochemical properties or by the lack of riverine flux. The CO2 flux anomalies induced by the Atlantic Niño are generated more realistic along the Equator and have dipole structures and comparable amplitudes with the observations despite their locations still being slightly southward (Fig. 9h). The two versions of NorESM2 are also successful in simulating the climatological summer CO2 flux in the tropical Atlantic (Fig. 9d and e): the maximum outgassing CO2 flux is located between 6° S and 0°, which is almost identical to the observations (Fig. 9a), and its amplitude is also more realistic (∼1.5 ) than NorESM1-AC (Fig. 9c). The NorESM2 configurations can also alleviate the ingassing bias along the African coast. The ingassing bias in NorESM1 is located close to the mouth of the Congo River (Fig. 9b and c). As Awo et al. (2022) showed, low-salinity water along the coast is associated with the Congo River plume and its meridional advection. Therefore, the bias in sea surface salinity and freshwater input could induce the air–sea CO2 flux bias in NorESM1. More detailed analysis with higher-resolution models in the future would be desirable. The dipole pattern of CO2 flux anomalies is also broadly represented along the Equator in NorESM2 models (Fig. 9i and j).
Surface ocean pCO2 is one of the main drivers of the air–sea CO2 flux (e.g. Sarmiento, 2006). In NorESM1-CTL, the SSS negative anomaly is found in the central and eastern basins during Atlantic Niño covering the ACT, whereas the positive anomaly occurs in the northern tropical Atlantic (Fig. 10a). This SSS anomaly pattern reflects the displacement of the ITCZ associated with the warm event at the Equator. The CO2 flux anomaly pattern appears to be roughly consistent with these SSS anomalies: in the western basin, less (more) CO2 outgassing corresponds with negative (positive) SSS at 8–6° S (2–4° N). A part of the negative SSS anomalies covering the ACT co-locates with the lower CO2 outgassing (Fig. 9g).
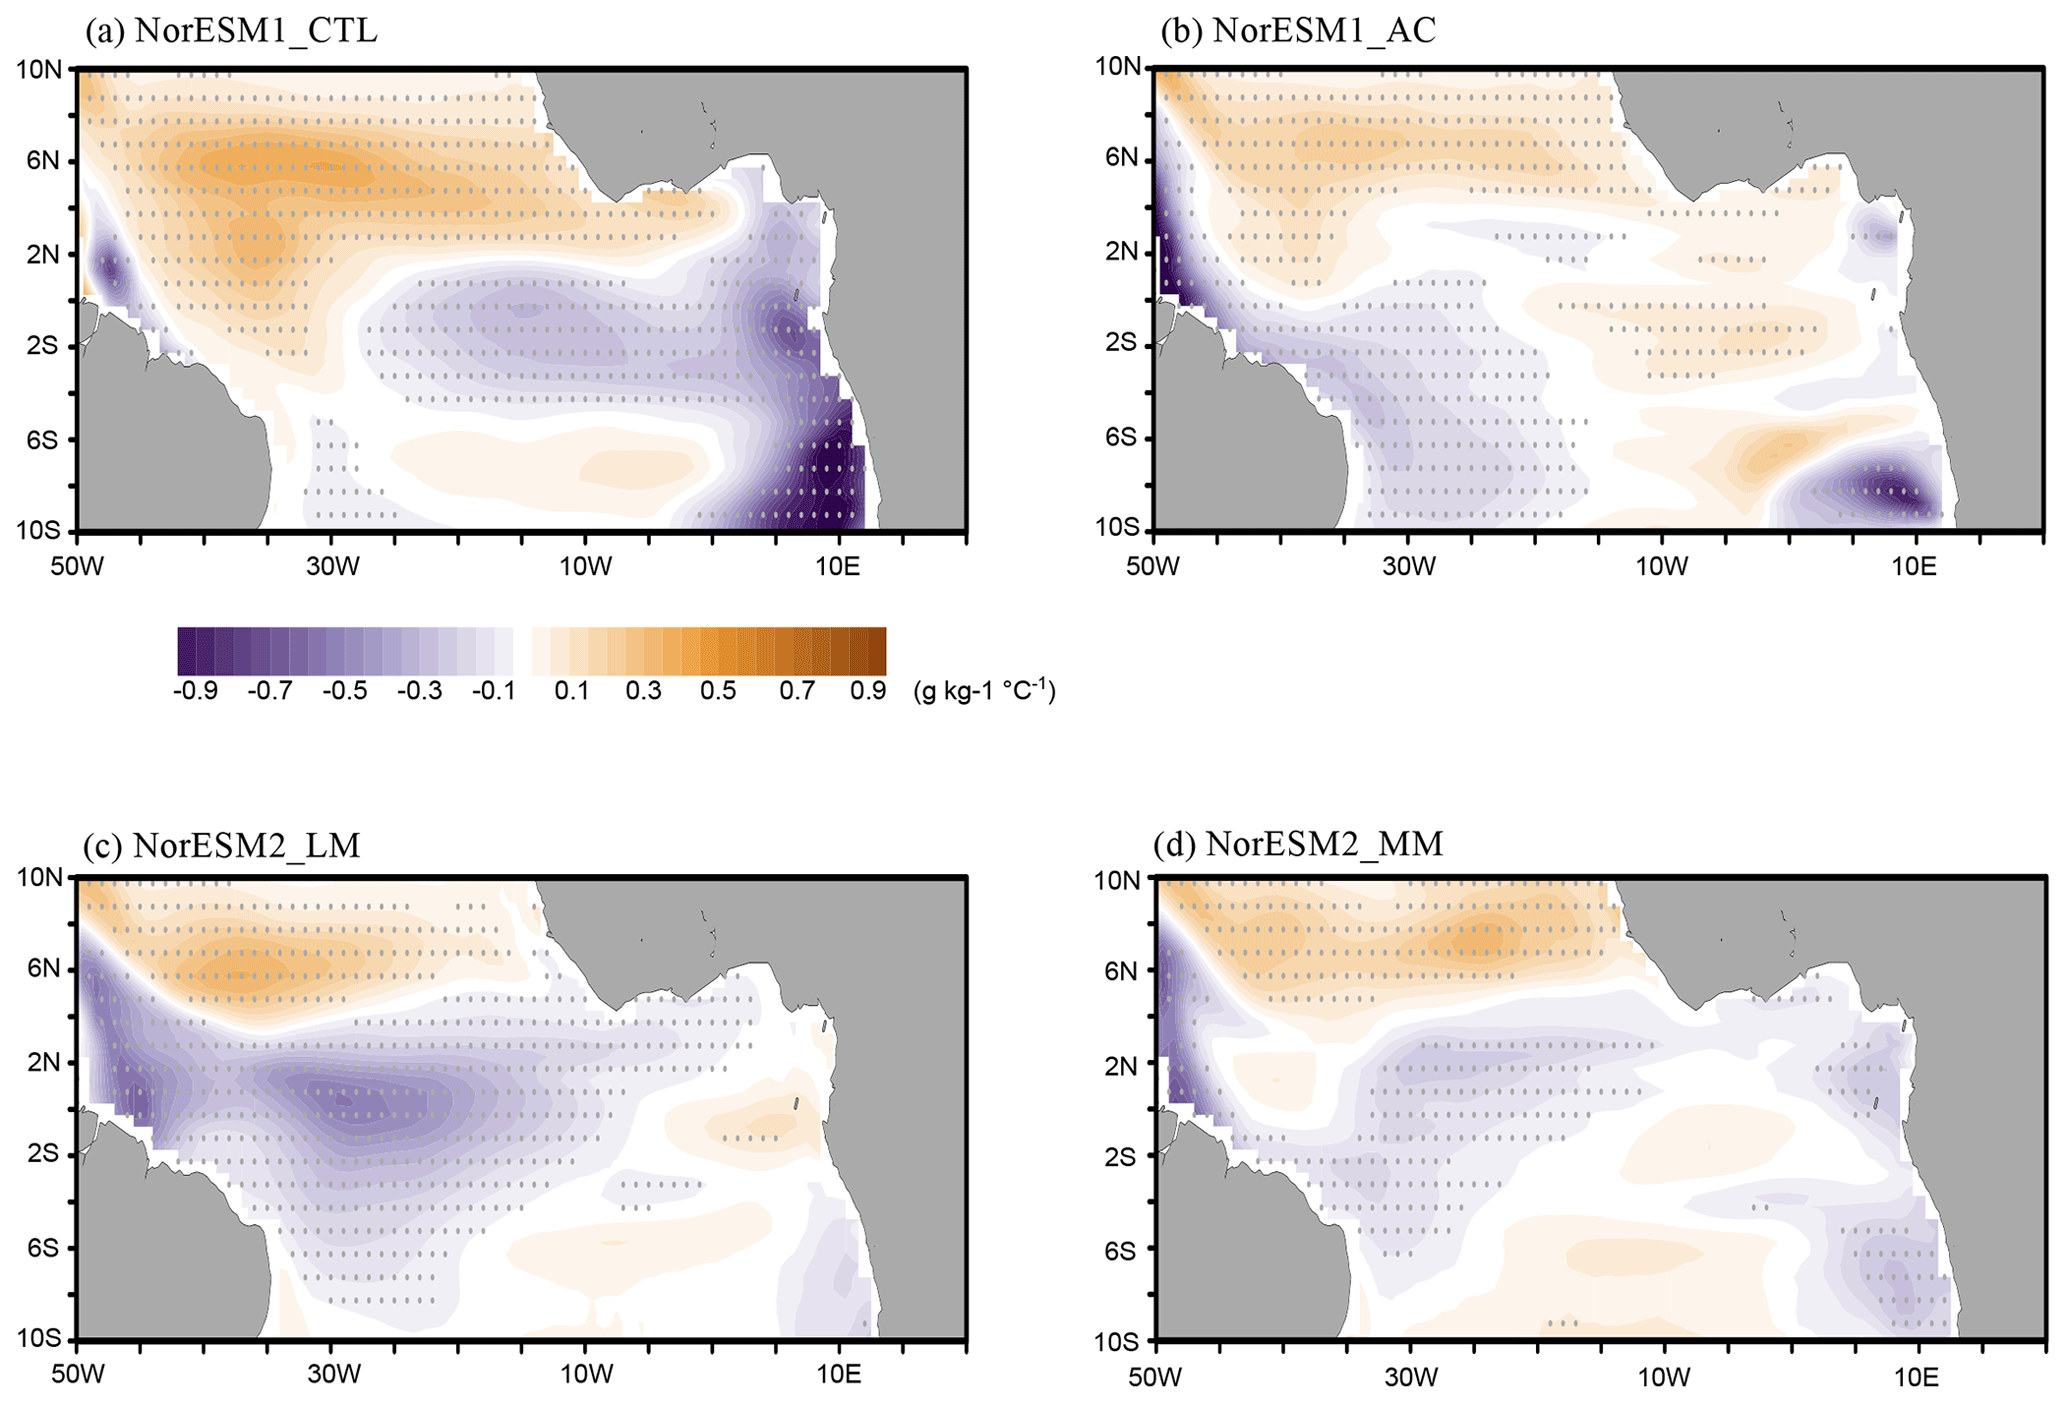
Figure 10June–July mean composite anomalies of sea surface salinity for each NorESM simulation. The composite anomalies are scaled by ATL3 index anomalies between Atlantic Niño and Niña. Grey dots denote a significance level of 90 % using Student's t test.
In NorESM1-AC, the negative SSS anomaly is found mainly in the western basin along the northeastern Brazilian coast, while the positive SSS anomaly occurs northward of the negative SSS anomaly (Fig. 10b). As in NorESM1-CTL, this SSS anomaly pattern is associated with the ITCZ southward displacement, but the SSS anomalies are more dominant in the western basin in NorESM1-AC, resulting in fewer outgassing anomalies in the CO2 flux in the western basin, which is more realistic (Fig. 9f and h). This difference in the ITCZ displacement and corresponding SST anomalies occurs from the realistic development of the ACT during summer between NorESM1-CTL and NorESM1-AC (Fig. S2). In NorESM1-CTL, the ACT hardly develops, while the climatological ITCZ is anchored more southward than the observations (e.g. Koseki et al., 2018). Consequently, the ITCZ is perturbed by the Atlantic Niño around the Equator. In the two NorESM2 versions, the SSS negative anomalies are also dominated in the western basin (Fig. 10c and d), while the CO2 flux is correspondingly reduced in the western basin at the Equator (Fig. 9i and j). Both NorESM2 simulations also reproduce the summer ACT development more realistically than NorESM1-CTL (Fig. S2c and d), and the freshwater anomalous inputs associated with the ITCZ displacement can be captured well, resulting in the reduction in the CO2 flux in the western basin.
This study evaluated implications of physical bias in simulated marine biogeochemical processes in the tropical Atlantic Ocean for four different configurations of NorESM. A physical bias correction (NorESM1-AC) and better dynamical representations in the new generation of NorESM improve the tropical Atlantic physical and biogeochemical biases during boreal summer, which are common in other ESMs (e.g. Voldoire et al., 2019). The seasonal development of the Atlantic Cold Tongue (ACT) is simulated more realistically during the boreal summer in NorESM1-AC and NorESM2s than in the benchmark simulation of NorESM1-CTL. Associated with the better ACT development, the observed zonally tilting thermocline is also well reproduced. NorESM2 models can reproduce the shoaling in the eastern basin without any bias correction. This improvement of the thermocline gradient leads to a better representation of the observed nutrient supply from the subsurface in the eastern basin. Consequently, NorESM-AC and NorESM2 models can simulate the observed timing (July to September) and location (centred at 10° W along the Equator) of the Atlantic summer bloom. While NorESM2 models include updates and tunings of physical and biogeochemical parameters relative to NorESM1s (e.g. Ilicak et al., 2008; Tjiputra et al., 2020; Toniazzo et al., 2020), NorESM1-AC only implements physical bias correction of surface wind and SST, which also resulted in remarkable improvements in its mean state and variability of biogeochemical processes. Our results emphasize that atmosphere and ocean dynamics and physics are crucially important to accurately simulate regional marine biogeochemical processes and their interactions in the tropical Atlantic (e.g. Berline et al., 2007; Fransner et al., 2020). However, NorESM2 still exhibits warm bias in the tropical Atlantic, and it would be valuable to implement the physical bias correction into the NorESM2 system and assess the corresponding improvements in the future.
The benefit of physical bias correction can especially be seen along the Benguela upwelling region, where the highest biological production is observed in the tropical–subtropical Atlantic (e.g. Shannon et al., 2004). With the physical bias correction, the high-production area is confined along the Angola–Benguela coast, alleviating the initially underestimated biological production (Fig. S6). This is attributed to the better upwelling and nutrient supply (Fig. S5) associated with the corrected coastal low-level jet and wind stress curl that are essential drivers of coastal upwelling (e.g. Koseki et al., 2018; Lima et al., 2019). Contrastingly, NorESM2 models tend to degrade the coastal production in the southeastern Atlantic. This might be due to the tuning of biological parameters to reduce the overestimated production in other ocean areas (Tjiputra et al., 2020). However, due to the newly implemented riverine flux (Gao et al., 2023), the primary production is to some extent enhanced around the mouth of the Congo River (around 5° S) as compared to the NorESM1 (Fig. S6), which does not include riverine flux. Between NorESM2-LM and NorESM2-MM, the SST bias and nutrient upwelling biases are alleviated in NorESM2-MM, wherein the atmospheric component resolution is finer than that in NorESM2-LM. The atmospheric refinement is beneficial to improve the model performance in terms of reproducing the observed tropical Atlantic climate (Harlass et al., 2018).
With better representation of the physical processes, the interannual variability of biogeochemical processes is also improved. As Chenillat et al. (2021) showed, the Atlantic Niño is one of the essential drivers for variability in the primary production in the equatorial Atlantic. NorESM-AC and NorESM2 models can reproduce the reduction in the summer bloom in the central basin, while NorESM-CTL simulates the summer bloom anomaly in the wrong location. Because the primary production anomaly is mainly induced by the upwelling modulation associated with the Atlantic Niño (e.g. Chenillat et al., 2021), a more realistic thermocline structure in NorESM-AC and NorESM2 models is able to capture the observed summer bloom variations. The air–sea CO2 flux anomalies associated with the Atlantic Niño are also more realistically reproduced in NorESM2-AC and NorESM2 models than NorESM1-CTL. The CO2 flux anomalies in the western basin are mainly driven by the SSS anomalies associated with the ITCZ displacement (Koseki et al., 2023), and this study suggests that the realistic representation of the ACT and ITCZ is responsible for simulating the observed CO2 flux anomalies due to the Atlantic Niño. We also note that in addition to proper physical representation, accurate representation of subsurface biogeochemical state is also crucial in reproducing the observed variability in an upwelling system such as the tropical Atlantic (e.g. Vaittinada Ayar et al., 2022; Koseki et al., 2023).
The physical bias is one of the main reasons why the climate predictions and projections are uncertain (e.g. Bethke et al., 2021; Counillon et al., 2021; Crespo et al., 2022). As we showed in this study, the physical bias reduction allows us to reproduce more realistic marine biogeochemical processes by improving interaction between physics and biogeochemistry. As Counillon et al. (2021) showed, the physical bias correction can enhance the prediction skill of the equatorial Atlantic SST. However, seasonal prediction initialized in May still has a difficulty improving the skill, and therefore prediction of marine biogeochemical processes to the Atlantic Niño and Niña can be far from satisfactory. In addition, future improvements in biogeochemical processes and parameterization (Singh et al., 2022; Tjiputra et al., 2007) should also take into consideration biases in physical processes to avoid overfitting or correctly simulating biogeochemical processes but for wrong reason. Our study also highlights the importance of evaluating the performance of Earth system models at regional scales and at timescale where natural climatic variability dominates over external forcing. Improvements at these spatial and temporal scales are particularly valuable due to their more direct and significant impacts on the society. Future model evaluation should go beyond capturing the large-scale mean state features and focus more on regional dynamics across seasonal-to-decadal timescales.
All code and data are available upon request. The observational data of SST and the CO2 flux are available to download at https://www.ncei.noaa.gov/products/optimum-interpolation-sst (last access: 31 March 2020) and https://www.ncei.noaa.gov/access/ocean-carbon-data-system/oceans/MPI-ULB-SOM_FFN_clim.html (last access: 30 April 2021), respectively.
The supplement related to this article is available online at https://doi.org/10.5194/bg-21-4149-2024-supplement.
SK and LRC conducted NorESM1 simulations and conducted the analysis of the experiments. All of the authors had discussions about the results and provided their interpretations. All of the authors contributed to writing the manuscript and improving upon it.
The contact author has declared that none of the authors has any competing interests.
Views and opinions expressed are however those of the author(s) only and do not necessarily reflect those of the European Union or European Research Executive Agency. Neither the European Union nor the granting authority can be held responsible for them.
Publisher's note: Copernicus Publications remains neutral with regard to jurisdictional claims made in the text, published maps, institutional affiliations, or any other geographical representation in this paper. While Copernicus Publications makes every effort to include appropriate place names, the final responsibility lies with the authors.
This study is supported by the H2020 TRIATLAS project (grant no. 817578). The computational resources of the NorESM simulation and its data archive are supported by UNINETT Sigma2 AS (grant nos. NN9039K and NS9560K). Jerry Tjiputra acknowledges support from the EU-funded project OceanICU (grant no. 101083922).
This research has been supported by the European Union's Horizon 2020 (grant no. 817578), the European Union under grant agreement no. 101083922 (OceanICU) and UK Research and Innovation (UKRI) under the UK government’s Horizon Europe funding guarantee (grant numbers 10054454, 10063673, 10064020, 10059241, 10079684, 10059012, 10048179).
This paper was edited by Peter Landschützer and reviewed by two anonymous referees.
Araujo, M., Noriega, C., and Lefevre, N.: Nutrients and carbon fluxes in the estuaries of major rivers flowing into the tropical Atlantic, Front. Mar. Sci., 1, 10, https://doi.org/10.3389/fmars.2014.00010, 2014.
Awo, F. M., Rouault, M., Ostrowski, M., Tomety, F. S., Da-Allada, C. Y., and Jouanno, J.: Seasonal Cycle of Sea Surface Salinity in the Angola Upwelling System, J. Geophys. Res.-Oceans, 127, e2022JC018518, https://doi.org/10.1029/2022JC018518, 2022.
Bentsen, M., Bethke, I., Debernard, J. B., Iversen, T., Kirkevåg, A., Seland, Ø., Drange, H., Roelandt, C., Seierstad, I. A., Hoose, C., and Kristjánsson, J. E.: The Norwegian Earth System Model, NorESM1-M – Part 1: Description and basic evaluation of the physical climate, Geosci. Model Dev., 6, 687–720, https://doi.org/10.5194/gmd-6-687-2013, 2013.
Berline, L., Brankart, J. M., Brasseur, P., Ourmieres, Y., and Verron, J.: Improving the physics of a coupled physical-biogeochemical model of the North Atlantic through data assimilation: Impact on the ecosystem, J. Marine Syst., 64, 153–172, https://doi.org/10.1016/j.jmarsys.2006.03.007, 2007.
Bertini, L. and Tjiputra, J.: Biogeochemical Timescales of Climate Change Onset and Recovery in the North Atlantic Interior Under Rapid Atmospheric CO2 Forcing, J. Geophys. Res.-Oceans, 127, e2021JC017929, https://doi.org/10.1029/2021JC017929, 2022.
Bethke, I., Wang, Y., Counillon, F., Keenlyside, N., Kimmritz, M., Fransner, F., Samuelsen, A., Langehaug, H., Svendsen, L., Chiu, P.-G., Passos, L., Bentsen, M., Guo, C., Gupta, A., Tjiputra, J., Kirkevåg, A., Olivié, D., Seland, Ø., Solsvik Vågane, J., Fan, Y., and Eldevik, T.: NorCPM1 and its contribution to CMIP6 DCPP, Geosci. Model Dev., 14, 7073–7116, https://doi.org/10.5194/gmd-14-7073-2021, 2021.
Bjerknes, J.: Atmospheric Teleconnections from Equatorial Pacific, Mon. Weather Rev., 97, 163, https://doi.org/10.1175/1520-0493(1969)097<0163:Atftep>2.3.Co;2, 1969.
Bleck, R., Rooth, C., Hu, D. M., and Smith, L. T.: Salinity-Driven Thermocline Transients in a Wind-Forced and Thermohaline-Forced Isopycnic Coordinate Model of the North-Atlantic, J. Phys. Oceanogr., 22, 1486–1505, https://doi.org/10.1175/1520-0485(1992)022<1486:Sdttia>2.0.Co;2, 1992.
Bouillon, S., Yambélé, A., Spencer, R. G. M., Gillikin, D. P., Hernes, P. J., Six, J., Merckx, R., and Borges, A. V.: Organic matter sources, fluxes and greenhouse gas exchange in the Oubangui River (Congo River basin), Biogeosciences, 9, 2045–2062, https://doi.org/10.5194/bg-9-2045-2012, 2012.
Bourgeois, T., Goris, N., Schwinger, J., and Tjiputra, J. F.: Stratification constrains future heat and carbon uptake in the Southern Ocean between 30 degrees S and 55 degrees S, Nat. Commun., 13, 340, https://doi.org/10.1038/s41467-022-27979-5, 2022.
Cabos, W., Sein, D. V., Pinto, J. G., Fink, A. H., Koldunov, N. V., Alvarez, F., Izquierdo, A., Keenlyside, N., and Jacob, D.: The South Atlantic Anticyclone as a key player for the representation of the tropical Atlantic climate in coupled climate models, Clim. Dynam., 48, 4051–4069, https://doi.org/10.1007/s00382-016-3319-9, 2017.
Chenillat, F., Illig, S., Jouanno, J., Awo, F. M., Alory, G., and Brehmer, P.: How do Climate Modes Shape the Chlorophyll-a Interannual Variability in the Tropical Atlantic?, Geophys. Res. Lett., 48, e2021GL093769, https://doi.org/10.1029/2021GL093769, 2021.
Counillon, F., Keenlyside, N., Toniazzo, T., Koseki, S., Demissie, T., Bethke, I., and Wang, Y. G.: Relating model bias and prediction skill in the equatorial Atlantic, Clim. Dynam., 56, 2617–2630, https://doi.org/10.1007/s00382-020-05605-8, 2021.
Crespo, L. R., Keenlyside, N., and Koseki, S.: The role of sea surface temperature in the atmospheric seasonal cycle of the equatorial Atlantic, Clim. Dynam., 52, 5927–5946, https://doi.org/10.1007/s00382-018-4489-4, 2019.
Crespo, L. R., Prigent, A., Keenlyside, N., Koseki, S., Svendsen, L., Richter, I., and Sánchez-Gómez, E.: Weakening of the Atlantic Niño variability under global warming, Nat. Clim. Change 12, 822–827,https://doi.org/10.1038/s41558-022-01453-y, 2022.
Cury, P. and Shannon, L.: Regime shifts in upwelling ecosystems: observed changes and possible mechanisms in the northern and southern Benguela, Prog. Oceanogr., 60, 223–243, https://doi.org/10.1016/j.pocean.2004.02.007, 2004.
de la Vara, A., Cabos, W., Sein, D. V., Sidorenko, D., Koldunov, N. I. V., Koseki, S., Soares, P. M. M., and Danilov, S.: On the impact of atmospheric vs. oceanic resolutions on the representation of the sea surface temperature in the South Eastern Tropical Atlantic, Clim. Dynam., 54, 4733–4757, https://doi.org/10.1007/s00382-020-05256-9, 2020.
Dee, D. P., Uppala, S. M., Simmons, A. J., Berrisford, P., Poli, P., Kobayashi, S., Andrae, U., Balmaseda, M. A., Balsamo, G., Bauer, P., Bechtold, P., Beljaars, A. C. M., van de Berg, L., Bidlot, J., Bormann, N., Delsol, C., Dragani, R., Fuentes, M., Geer, A. J., Haimberger, L., Healy, S. B., Hersbach, H., Holm, E. V., Isaksen, L., Kallberg, P., Kohler, M., Matricardi, M., McNally, A. P., Monge-Sanz, B. M., Morcrette, J. J., Park, B. K., Peubey, C., de Rosnay, P., Tavolato, C., Thepaut, J. N., and Vitart, F.: The ERA-Interim reanalysis: configuration and performance of the data assimilation system, Q. J. Roy. Meteor. Soc., 137, 553–597, https://doi.org/10.1002/qj.828, 2011.
Demaster, D. J. and Pope, R. H.: Nutrient dynamics in Amazon shelf waters: Results from AMASSEDS, Cont. Shelf Res., 16, 263–289, https://doi.org/10.1016/0278-4343(95)00008-O, 1996.
Deppenmeier, A. L., Haarsma, R. J., LeSager, P., and Hazeleger, W.: The effect of vertical ocean mixing on the tropical Atlantic in a coupled global climate model, Clim. Dynam., 54, 5089–5109, https://doi.org/10.1007/s00382-020-05270-x, 2020.
Ding, H., Keenlyside, N. S., and Latif, M.: Seasonal cycle in the upper equatorial Atlantic Ocean, J. Geophys. Res.-Oceans, 114, C09016, https://doi.org/10.1029/2009jc005418, 2009.
Ding, H., Keenlyside, N., Latif, M., Park, W., and Wahl, S.: The impact of mean state errors on equatorial Atlantic interannual variability in a climate model, J. Geophys. Res.-Oceans, 120, 1133–1151, https://doi.org/10.1002/2014jc010384, 2015.
Dippe, T., Greatbatch, R. J., and Ding, H.: On the relationship between Atlantic Nio variability and ocean dynamics, Clim. Dynam., 51, 597–612, https://doi.org/10.1007/s00382-017-3943-z, 2018.
Doney, S. C.: Major challenges confronting marine biogeochemical modeling, Global Biogeochem. Cy., 13, 705–714, https://doi.org/10.1029/1999gb900039, 1999.
Eyring, V., Bony, S., Meehl, G. A., Senior, C. A., Stevens, B., Stouffer, R. J., and Taylor, K. E.: Overview of the Coupled Model Intercomparison Project Phase 6 (CMIP6) experimental design and organization, Geosci. Model Dev., 9, 1937–1958, https://doi.org/10.5194/gmd-9-1937-2016, 2016.
Fransner, F., Counillon, F., Bethke, I., Tjiputra, J., Samuelsen, A., Nummelin, A., and Olsen, A.: Ocean Biogeochemical Predictions-Initialization and Limits of Predictability, Front. Mar. Sci., 7, 386, https://doi.org/10.3389/fmars.2020.00386, 2020.
Gao, S., Schwinger, J., Tjiputra, J., Bethke, I., Hartmann, J., Mayorga, E., and Heinze, C.: Riverine impact on future projections of marine primary production and carbon uptake, Biogeosciences, 20, 93–119, https://doi.org/10.5194/bg-20-93-2023, 2023.
Garcia, H. E., Weathers, K., Paver, C. R., Smolyar, I., Boyer, T. P., Locarnini, R. A., Zweng, M. M., Mishonov, A. V., Baranova, O. K., Seidov, D., and Reagan, J. R.: World Ocean Atlas 2018, Vol. 3: Dissolved Inorganic Nutrients (phosphate, nitrate, and nitrate+nitrite, silicate), Technical Ed., in: NOAA Atlas NESDIS 84, edited by: Mishonov, A., 35 pp., 2018.
Goris, N., Tjiputra, J. F., Olsen, A., Schwinger, J., Lauvset, S. K., and Jeansson, E.: Constraining Projection-Based Estimates of the Future North Atlantic Carbon Uptake, J. Climate, 31, 3959–3978, https://doi.org/10.1175/Jcli-D-17-0564.1, 2018.
Goris, N., Johannsen, K., and Tjiputra, J.: The emergence of the Gulf Stream and interior western boundary as key regions to constrain the future North Atlantic carbon uptake, Geosci. Model Dev., 16, 2095–2117, https://doi.org/10.5194/gmd-16-2095-2023, 2023.
Gregg, W. W., Conkright, M. E., Ginoux, P., O'Reilly, J. E., and Casey, N. W.: Ocean primary production and climate: Global decadal changes, Geophys. Res. Lett., 30, 1809, https://doi.org/10.1029/2003gl016889, 2003.
Harlass, J., Latif, M., and Park, W.: Alleviating tropical Atlantic sector biases in the Kiel climate model by enhancing horizontal and vertical atmosphere model resolution: climatology and interannual variability, Clim. Dynam., 50, 2605–2635, https://doi.org/10.1007/s00382-017-3760-4, 2018.
Hummels, R., Dengler, M., and Bourles, B.: Seasonal and regional variability of upper ocean diapycnal heat flux in the Atlantic cold tongue, Prog. Oceanogr., 111, 52–74, https://doi.org/10.1016/j.pocean.2012.11.001, 2013.
Hutchings, L., van der Lingen, C. D., Shannon, L. J., Crawford, R. J. M., Verheye, H. M. S., Bartholomae, C. H., van der Plas, A. K., Louw, D., Kreiner, A., Ostrowski, M., Fidel, Q., Barlow, R. G., Lamont, T., Coetzee, J., Shillington, F., Veitch, J., Currie, J. C., and Monteiro, P. M. S.: The Benguela Current: An ecosystem of four components, Prog. Oceanogr., 83, 15–32, https://doi.org/10.1016/j.pocean.2009.07.046, 2009.
Ilicak, M., Ozgokmen, T. M., Peters, H., Baumert, H. Z., and Iskandarani, M.: Performance of two-equation turbulence closures in three-dimensional simulations of the Red Sea overflow, Ocean Model., 24, 122–139, https://doi.org/10.1016/j.ocemod.2008.06.001, 2008.
Ilyina, T., Six, K. D., Segschneider, J., Maier-Reimer, E., Li, H. M., and Nunez-Riboni, I.: Global ocean biogeochemistry model HAMOCC: Model architecture and performance as component of the MPI-Earth system model in different CMIP5 experimental realizations, J. Adv. Model. Earth Sy., 5, 287–315, https://doi.org/10.1029/2012ms000178, 2013.
Kawase, M. and Sarmiento, J. L.: Nutrients in the Atlantic Thermocline, J. Geophys. Res.-Oceans, 90, 8961–8979, https://doi.org/10.1029/JC090iC05p08961, 1985.
Keenlyside, N. S. and Latif, M.: Understanding equatorial Atlantic interannual variability, J. Climate, 20, 131–142, https://doi.org/10.1175/jcli3992.1, 2007.
Koseki, S., Keenlyside, N., Demissie, T., Toniazzo, T., Counillon, F., Bethke, I., Ilicak, M., and Shen, M. L.: Causes of the large warm bias in the Angola-Benguela Frontal Zone in the Norwegian Earth System Model, Clim. Dynam., 50, 4651–4670, https://doi.org/10.1007/s00382-017-3896-2, 2018.
Koseki, S., Giordani, H., and Goubanova, K.: Frontogenesis of the Angola–Benguela Frontal Zone, Ocean Sci., 15, 83–96, https://doi.org/10.5194/os-15-83-2019, 2019.
Koseki, S., Tjiputra, J., Fransner, F., Crespo, L. R., and Keenlyside, N. S.: Disentangling the impact of Atlantic Ni(n)over-tildeo on sea-air CO2 flux, Nat. Commun., 14, 3649, https://doi.org/10.1038/s41467-023-38718-9, 2023.
Kriest, I. and Oschlies, A.: MOPS-1.0: towards a model for the regulation of the global oceanic nitrogen budget by marine biogeochemical processes, Geosci. Model Dev., 8, 2929–2957, https://doi.org/10.5194/gmd-8-2929-2015, 2015.
Landschützer, P., Gruber, N., and Bakker, D. C. E.: Decadal variations and trends of the global ocean carbon sink, Global Biogeochem. Cy., 30, 1396–1417, https://doi.org/10.1002/2015gb005359, 2016.
Landschützer, P., Laruelle, G. G., Roobaert, A., and Regnier, P.: A uniform pCO2 climatology combining open and coastal oceans, Earth Syst. Sci. Data, 12, 2537–2553, https://doi.org/10.5194/essd-12-2537-2020, 2020.
Lefevre, N., Caniaux, G., Janicot, S., and Gueye, A. K.: Increased CO2 outgassing in February–May 2010 in the tropical Atlantic following the 2009 Pacific El Nino, J. Geophys. Res.-Oceans, 118, 1645–1657, https://doi.org/10.1002/jgrc.20107, 2013.
Lima, D. C. A., Soares, P. M. M., Semedo, A., Cardoso, R. M., Cabos, W., and Sein, D. V.: A Climatological Analysis of the Benguela Coastal Low-Level Jet, J. Geophys. Res.-Atmos., 124, 3960–3978, https://doi.org/10.1029/2018jd028944, 2019.
Locarnini, R. A., Mishonov, A. V., Baranova, O. K., Boyer, T. P., Zweng, M. M., Garcia, H. E., Reagan, J. R., Seidov, D., Weathers, K., Paver, C. R., and Smolyar, I.: World Ocean Atlas, Vol. 1: Temperature, Technical Ed., in: NOAA Atlas NESDIS 81, edited by: Mishonov, A., 52 pp., 2018.
Menard, F., Fonteneau, A., Gaertner, D., Nordstrom, V., Stequert, B., and Marchal, E.: Exploitation of small tunas by a purse-seine fishery with fish aggregating devices and their feeding ecology in an eastern tropical Atlantic ecosystem, ICES J. Mar. Sci., 57, 525–530, https://doi.org/10.1006/jmsc.2000.0717, 2000.
Mohino, E., Rodriguez-Fonseca, B., Mechoso, C. R., Losada, T., and Polo, I.: Relationships among Intermodel Spread and Biases in Tropical Atlantic Sea Surface Temperatures, J. Climate, 32, 3615–3635, https://doi.org/10.1175/Jcli-D-18-0846.1, 2019.
Moreira-Turcq, P., Seyler, P., Guyot, J. L., and Etcheber, H.: Exportation of organic carbon from the Amazon River and its main tributaries, Hydrol. Process., 17, 1329–1344, https://doi.org/10.1002/hyp.1287, 2003.
Neale, R. B., Richter, J. H., Conley, A. J., Park, S., Lauritzen, P. H., Gettleman, A., Williamson, D. L., Rasch, P. J., Vavrus, S. J., Taylor, M. A., Collins, W. D., Zhang, M., and Lin, S.-J.: Description of the NCAR Community Atmosphere Model (CAM 4.09), Tech. Rep., NCAR/TN-485+STR, 2010.
Nnamchi, H. C., Li, J. P., Kucharski, F., Kang, I. S., Keenlyside, N. S., Chang, P., and Farneti, R.: Thermodynamic controls of the Atlantic Nino, Nat. Commun., 6, 8895, https://doi.org/10.1038/ncomms9895, 2015.
Nnamchi, H. C., Latif, M., Keenlyside, N. S., Kjellsson, J., and Richter, I.: Diabatic heating governs the seasonality of the Atlantic Nino, Nat. Commun., 12, 376, https://doi.org/10.1038/s41467-020-20452-1, 2021.
Okumura, Y. and Xie, S. P.: Some overlooked features of tropical Atlantic climate leading to a new Nino-like phenomenon, J. Climate, 19, 5859–5874, https://doi.org/10.1175/Jcli3928.1, 2006.
Pérez, F. F., Becker, M., Goris, N., Gehlen, M., López-Mozos, M., Tjiputra, J., Olsen, A., Müller, J. D., Huertas, I. E., Chau, T. T. T., Cainzos, V., Velo, A., Benard, G., Hauck, J., Gruber, N., and Wanninkhof, R.: An Assessment of CO Storage and Sea-Air Fluxes for the Atlantic Ocean and Mediterranean Sea Between 1985 and 2018, Global Biogeochem. Cy., 38, e2023GB007862, https://doi.org/10.1029/2023GB007862, 2024.
Perez, V., Fernandez, E., Maranon, E., Serret, P., and Garcia-Soto, C.: Seasonal and interannual variability of chlorophyll a and primary production in the Equatorial Atlantic: in situ and remote sensing observations, J. Plankton Res., 27, 189–197, https://doi.org/10.1093/plankt/fbh159, 2005.
Prigent, A., Lubbecke, J. F., Bayr, T., Latif, M., and Wengel, C.: Weakened SST variability in the tropical Atlantic Ocean since 2000, Clim. Dynam., 54, 2731–2744, https://doi.org/10.1007/s00382-020-05138-0, 2020.
Prodhomme, C., Voldoire, A., Exarchou, E., Deppenmeier, A. L., Garcia-Serrano, J., and Guemas, V.: How Does the Seasonal Cycle Control Equatorial Atlantic Interannual Variability?, Geophys. Res. Lett., 46, 916–922, https://doi.org/10.1029/2018gl080837, 2019.
Radenac, M.-H., Jouanno, J., Tchamabi, C. C., Awo, M., Bourlès, B., Arnault, S., and Aumont, O.: Physical drivers of the nitrate seasonal variability in the Atlantic cold tongue, Biogeosciences, 17, 529–545, https://doi.org/10.5194/bg-17-529-2020, 2020.
Ramirez-Romero, E., Jorda, G., Amores, A., Kay, S., Segura-Noguera, M., Macias, D. M., Maynou, F., Sabates, A., and Catalan, I. A.: Assessment of the Skill of Coupled Physical-Biogeochemical Models in the NW Mediterranean, Front. Mar. Sci., 7, 497, https://doi.org/10.3389/fmars.2020.00497, 2020.
Reynolds, R. W., Smith, T. M., Liu, C., Chelton, D. B., Casey, K. S., and Schlax, M. G.: Daily high-resolution-blended analyses for sea surface temperature, J. Climate, 20, 5473–5496, https://doi.org/10.1175/2007jcli1824.1, 2007.
Richter, I.: Climate model biases in the eastern tropical oceans: causes, impacts and ways forward, WIRes Clim. Change, 6, 345–358, https://doi.org/10.1002/wcc.338, 2015.
Richter, I. and Tokinaga, H.: An overview of the performance of CMIP6 models in the tropical Atlantic: mean state, variability, and remote impacts, Clim. Dynam., 55, 2579–2601, https://doi.org/10.1007/s00382-020-05409-w, 2020.
Richter, I., Behera, S. K., Masumoto, Y., Taguchi, B., Sasaki, H., and Yamagata, T.: Multiple causes of interannual sea surface temperature variability in the equatorial Atlantic Ocean, Nat. Geosci., 6, 43–47, https://doi.org/10.1038/Ngeo1660, 2013.
Santos, A. M. P., Chicharo, A., Dos Santos, A., Moita, T., Oliveira, P. B., Peliz, A., and Re, P.: Physical-biological interactions in the life history of small pelagic fish in the Western Iberia Upwelling Ecosystem, Prog. Oceanogr., 74, 192–209, https://doi.org/10.1016/j.pocean.2007.04.008, 2007.
Sarmiento, J. L. and Gruber, N.: Ocean Biogeochemical Dynamics, Princeton University Press, Princeton, Oxford, https://doi.org/10.1515/9781400849079, 2006.
Seferian, R., Berthet, S., and Chevallier, M.: Assessing the Decadal Predictability of Land and Ocean Carbon Uptake, Geophys. Res. Lett., 45, 2455–2466, https://doi.org/10.1002/2017gl076092, 2018.
Seferian, R., Nabat, P., Michou, M., Saint-Martin, D., Voldoire, A., Colin, J., Decharme, B., Delire, C., Berthet, S., Chevallier, M., Senesi, S., Franchisteguy, L., Vial, J., Mallet, M., Joetzjer, E., Geoffroy, O., Gueremy, J. F., Moine, M. P., Msadek, R., Ribes, A., Rocher, M., Roehrig, R., Salas-y-Melia, D., Sanchez, E., Terray, L., Valcke, S., Waldman, R., Aumont, O., Bopp, L., Deshayes, J., Ethe, C., and Madec, G.: Evaluation of CNRM Earth System Model, CNRM-ESM2-1: Role of Earth System Processes in Present-Day and Future Climate, J. Adv. Model. Earth Sy., 11, 4182–4227, https://doi.org/10.1029/2019ms001791, 2019.
Seferian, R., Berthet, S., Yool, A., Palmieri, J., Bopp, L., Tagliabue, A., Kwiatkowski, L., Aumont, O., Christian, J., Dunne, J., Gehlen, M., Ilyina, T., John, J. G., Li, H. M., Long, M. C., Luo, J. Y., Nakano, H., Romanou, A., Schwinger, J., Stock, C., Santana-Falcon, Y., Takano, Y., Tjiputra, J., Tsujino, H., Watanabe, M., Wu, T. W., Wu, F. H., and Yamamoto, A.: Tracking Improvement in Simulated Marine Biogeochemistry Between CMIP5 and CMIP6, Curr. Clim. Change Rep., 6, 95–119, https://doi.org/10.1007/s40641-020-00160-0, 2020.
Sein, D. V., Mikolajewicz, U., Groger, M., Fast, I., Cabos, W., Pinto, J. G., Hagemann, S., Semmler, T., Izquierdo, A., and Jacob, D.: Regionally coupled atmosphere-ocean-sea ice-marine biogeochemistry model ROM: 1. Description and validation, J. Adv. Model. Earth Sy., 7, 268–304, https://doi.org/10.1002/2014ms000357, 2015.
Seland, Ø., Bentsen, M., Olivié, D., Toniazzo, T., Gjermundsen, A., Graff, L. S., Debernard, J. B., Gupta, A. K., He, Y.-C., Kirkevåg, A., Schwinger, J., Tjiputra, J., Aas, K. S., Bethke, I., Fan, Y., Griesfeller, J., Grini, A., Guo, C., Ilicak, M., Karset, I. H. H., Landgren, O., Liakka, J., Moseid, K. O., Nummelin, A., Spensberger, C., Tang, H., Zhang, Z., Heinze, C., Iversen, T., and Schulz, M.: Overview of the Norwegian Earth System Model (NorESM2) and key climate response of CMIP6 DECK, historical, and scenario simulations, Geosci. Model Dev., 13, 6165–6200, https://doi.org/10.5194/gmd-13-6165-2020, 2020.
Shannon, L. J., Christensen, V., and Walters, C. J.: Modelling stock dynamics in the southern Benguela ecosystem for the period 1978–2002, Afr. J. Mar. Sci., 26, 179–196, https://doi.org/10.2989/18142320409504056, 2004.
Singh, T., Counillon, F., Tjiputra, J., Wang, Y. G., and Gharamti, M. E.: Estimation of Ocean Biogeochemical Parameters in an Earth System Model Using the Dual One Step Ahead Smoother: A Twin Experiment, Front. Mar. Sci., 9, 775394, https://doi.org/10.3389/fmars.2022.775394, 2022.
Takahashi, T., Sutherland, S. C., Sweeney, C., Poisson, A., Metzl, N., Tilbrook, B., Bates, N., Wanninkhof, R., Feely, R. A., Sabine, C., Olafsson, J., and Nojiri, Y.: Global sea-air CO2 flux based on climatological surface ocean pCO2, and seasonal biological and temperature effects, Deep-Sea Res Pt. II, 49, 1601–1622, https://doi.org/10.1016/S0967-0645(02)00003-6, 2002.
Taylor, K. E., Stouffer, R. J., and Meehl, G. A.: An Overview of Cmip5 and the Experiment Design, B. Am. Meteorol. Soc., 93, 485–498, https://doi.org/10.1175/Bams-D-11-00094.1, 2012.
Tjiputra, J., Negrel, J., and Olsen, A.: Early detection of anthropogenic climate change signals in the ocean interior, Sci. Rep.-UK, 13, 3006, https://doi.org/10.1038/s41598-023-30159-0, 2023.
Tjiputra, J. F., Polzin, D., and Winguth, A. M. E.: Assimilation of seasonal chlorophyll and nutrient data into an adjoint three-dimensional ocean carbon cycle model: Sensitivity analysis and ecosystem parameter optimization, Global Biogeochem. Cy., 21, Gb1001, https://doi.org/10.1029/2006gb002745, 2007.
Tjiputra, J. F., Assmann, K., Bentsen, M., Bethke, I., Otterå, O. H., Sturm, C., and Heinze, C.: Bergen Earth system model (BCM-C): model description and regional climate-carbon cycle feedbacks assessment, Geosci. Model Dev., 3, 123–141, https://doi.org/10.5194/gmd-3-123-2010, 2010.
Tjiputra, J. F., Roelandt, C., Bentsen, M., Lawrence, D. M., Lorentzen, T., Schwinger, J., Seland, Ø., and Heinze, C.: Evaluation of the carbon cycle components in the Norwegian Earth System Model (NorESM), Geosci. Model Dev., 6, 301–325, https://doi.org/10.5194/gmd-6-301-2013, 2013.
Tjiputra, J. F., Schwinger, J., Bentsen, M., Morée, A. L., Gao, S., Bethke, I., Heinze, C., Goris, N., Gupta, A., He, Y.-C., Olivié, D., Seland, Ø., and Schulz, M.: Ocean biogeochemistry in the Norwegian Earth System Model version 2 (NorESM2), Geosci. Model Dev., 13, 2393–2431, https://doi.org/10.5194/gmd-13-2393-2020, 2020.
Tokinaga, H. and Xie, S. P.: Weakening of the equatorial Atlantic cold tongue over the past six decades, Nat. Geosci., 4, 222–226, https://doi.org/10.1038/Ngeo1078, 2011.
Toniazzo, T. and Koseki, S.: A Methodology for Anomaly Coupling in Climate Simulation, J. Adv. Model. Earth Sy., 10, 2061–2079, https://doi.org/10.1029/2018ms001288, 2018.
Toniazzo, T., Bentsen, M., Craig, C., Eaton, B. E., Edwards, J., Goldhaber, S., Jablonowski, C., and Lauritzen, P. H.: Enforcing conservation of axial angular momentum in the atmospheric general circulation model CAM6, Geosci. Model Dev., 13, 685–705, https://doi.org/10.5194/gmd-13-685-2020, 2020.
Vaittinada Ayar, P., Bopp, L., Christian, J. R., Ilyina, T., Krasting, J. P., Séférian, R., Tsujino, H., Watanabe, M., Yool, A., and Tjiputra, J.: Contrasting projections of the ENSO-driven CO2 flux variability in the equatorial Pacific under high-warming scenario, Earth Syst. Dynam., 13, 1097–1118, https://doi.org/10.5194/esd-13-1097-2022, 2022.
Vazquez, R., Parras-Berrocal, I., Cabos, W., Sein, D. V., Mananes, R., and Izquierdo, A.: Assessment of the Canary current upwelling system in a regionally coupled climate model, Clim. Dynam., 58, 69–85, https://doi.org/10.1007/s00382-021-05890-x, 2022.
Vieira, L. H., Krisch, S., Hopwood, M. J., Beck, A. J., Scholten, J., Liebetrau, V., and Achterberg, E. P.: Unprecedented Fe delivery from the Congo River margin to the South Atlantic Gyre, Nat. Commun., 11, 556, https://doi.org/10.1038/s41467-019-14255-2, 2020.
Voldoire, A., Exarchou, E., Sanchez-Gomez, E., Demissie, T., Deppenmeier, A. L., Frauen, C., Goubanova, K., Hazeleger, W., Keenlyside, N., Koseki, S., Prodhomme, C., Shonk, J., Toniazzo, T., and Traore, A. K.: Role of wind stress in driving SST biases in the Tropical Atlantic, Clim. Dynam., 53, 3481–3504, https://doi.org/10.1007/s00382-019-04717-0, 2019.
Xu, Z., Chang, P., Richter, I., Kim, W., and Tang, G. L.: Diagnosing southeast tropical Atlantic SST and ocean circulation biases in the CMIP5 ensemble, Clim. Dynam., 43, 3123–3145, https://doi.org/10.1007/s00382-014-2247-9, 2014.