the Creative Commons Attribution 4.0 License.
the Creative Commons Attribution 4.0 License.
 | 30 Sep 2024
Elemental stoichiometry of particulate organic matter across the Atlantic Ocean
Adam J. Fagan
Tatsuro Tanioka
Alyse A. Larkin
Jenna A. Lee
Nathan S. Garcia
Recent studies show that stoichiometric elemental ratios of marine ecosystems are not static at Redfield proportions but vary systematically between biomes. However, the wider Atlantic Ocean is undersampled for particulate organic matter (POM) elemental composition, especially when it comes to phosphorus (i.e., POP). Thus, it is uncertain how environmental variation in this region translates into shifts in the ratio. To address this, we analyzed hydrography, genomics, and POM concentrations from 877 stations on the meridional transects AMT28 and C13.5, spanning the Atlantic Ocean. We observed nutrient-replete, high-latitude ecosystem to be significantly lower than that in the oligotrophic gyres. Latitudinal and zonal differences in elemental stoichiometry were linked to overall nutrient supply as well as N vs. P stress. C:P and N:P were generally higher in the P-stressed northern region compared to Southern Hemisphere regions. We also detected a zonal difference linked to a westward deepening nutricline and a shift from N to P stress. We also evaluated possible seasonal changes in across the basin and predicted these to be limited. Overall, this study confirms latitudinal shifts in surface ocean POM ratios but reveals previously unrecognized hemisphere and zonal gradients. This work demonstrates the importance of understanding how regional shifts in hydrography and type of nutrient stress shape the coupling between Atlantic Ocean nutrient and carbon cycles.
- Article
(5261 KB) - Full-text XML
-
Supplement
(1429 KB) - BibTeX
- EndNote


-
There was systematic regional variation in POM concentrations and ratios across the Atlantic Ocean.
-
Latitudinal variability in is linked to the nutrient supply rate and N vs. P stress.
-
Westward deepening isopycnals and nutricline and a shift from N to P stress correspond to zonal variability in .
The efficiency of the biological pump is anticipated to be affected by climate change through alteration in phytoplankton nutrient allocation and the ratio (Galbraith and Martiny, 2015). Nevertheless, the influence of ocean warming on this efficiency is still uncertain, carrying potential repercussions for the ecosystems and global carbon cycle (Kwon et al., 2022). Over the past few decades, studies have observed variability in marine plankton elemental composition and ecosystem elemental composition (Weber and Deutsch, 2010; Martiny et al., 2013a, b). Specifically, regions with nutrient-rich conditions have lower ratios (equatorial, coastal, and temperate regions), and nutrient-poor conditions (subtropical gyre regions) have higher ratios (Martiny et al., 2013a, b). However, data compilations include variations in both sampling and analytical methodologies (Martiny et al., 2014) as well as have limited spatial coverage. Therefore, large-scale sampling efforts like the Bio Global Oceans Ship-Based Hydrographic Investigations Program (Bio-GO-SHIP) are quantifying ecosystem particulate organic matter (POM) concentrations and their elemental ratios, utilizing consistent methodologies on a global scale (Tanioka et al., 2022; Clayton et al., 2022).
Studies focused on POM stoichiometry across ocean basins have been primarily limited to Bio-GO-SHIP cruises within the Indian Ocean (Garcia et al., 2018) and the Pacific Ocean (Lee et al., 2021). Both studies have observed high POM concentrations at higher latitudes and low concentrations within the gyres, with intermediate levels toward the Equator. The stoichiometry had higher values in the gyres and lower values at high latitudes (Garcia et al., 2018; Lee et al., 2021). There have been two basin-wide transects across the Atlantic Ocean that have been used in a global synthesis (Tanioka et al., 2022) but have not been used in a study focused solely on the Atlantic. Along with the strong relationship with latitude, there is also strong correlation with nutricline depth, used as a proxy for nutrient flux, in the global synthesis. Localized studies at the Bermuda Atlantic Time Series (BATS) site or short transects along the western North Atlantic Ocean show an N:P ratio between 40 and 50 and C:N near Redfield proportions (∼ 6.6; Michaels et al., 1994; Michaels and Knap, 1996; Steinberg et al., 2001; Babiker et al., 2004; Cavender-Bares et al., 2001). In contrast, POM dynamics and especially N:P and C:P ratios are less understood within the NE Atlantic and South Atlantic oceans as a whole.
The Atlantic Ocean has a unique dynamic, being singularly/co-limited by nitrogen and phosphorus, respectively, to the north of the Equator and predominantly nitrogen limited south of the Equator (Cotner et al., 1997; Mather et al., 2008; Browning and Moore, 2023). In phosphorus co-limited regions, N:P and C:P are often elevated from frugal phosphorus use, supported by the well-sampled NW Atlantic Ocean (Galbraith and Martiny, 2015; Lomas et al., 2010, 2022). As a response to the nutrient limitation, phytoplankton can express specific genes that will allow for greater uptake of a nutrient. Gene expression and preferential uptake could influence cellular within phytoplankton. Nitrogen limitation is more widespread in the South Atlantic Ocean, but no study has quantified ecosystem here (Mather et al., 2008; Ustick et al., 2021). Temperature has been known to influence the concentration of cellular phosphorus in phytoplankton, with an increase in C:P with warmer temperatures; however C:N remains unchanged (Yvon-Durocher et al., 2015). The underlying mechanism for this relationship is not fully understood but is hypothesized to be from an increase in carbon uptake over phosphorus, an increase in nutrient use efficiency, or from translation compensation theory (few P-rich ribosomes are required for protein synthesis; Tanioka and Matsumoto, 2020). The availability of nutrients generally follows inverse patterns of , with increasing nutrients leading to a decrease in C:N and C:P and vice versa (Galbraith and Martiny, 2015; Tanioka and Matsumoto, 2017). However, such environmental variation in the Atlantic Ocean elemental stoichiometry remains largely unknown. Therefore, the broad environmental gradients in the Atlantic Ocean could result in significant regional ecosystem shifts.
Here, we quantified suspended particulate organic carbon, nitrogen, and phosphorus concentrations along two Bio-GO-SHIP meridional transects: AMT28 and C13.5 (Fig. 1), covering large parts of the Atlantic Ocean. We addressed two questions. (1) What are meridional, hemispheric, and zonal differences in POM concentrations and stoichiometry? (2) What is the relationship between environmental factors and ? We hypothesize that differences in total nutrient supply and temperature are primarily responsible for the latitudinal gradient in . In contrast, the type of nutrient stress will be important for hemispheric and longitudinal shifts.
2.1 Cruise transects
AMT28 started in Harwich, UK (49°38′ N, 5°30′ W), and ended in Mare Harbour, Falkland Islands (48°12′ S, 52°42′ W), departing 25 September 2018 and ending 27 October 2018. C13.5 started in Cape Town, South Africa (34°22′ S, 17°18′ W), and ended in Norfolk, VA (36°5′ N, 74°34′ W; Fig. 1), departing 21 March 2020 and ending 16 April 2020. C13.5 was set to go 45° S and collect samples along the eastern boundary of the South Atlantic Ocean. Due to COVID-19 quarantine restrictions, it was redirected to a port in Virginia. Fortuitously, this redirect allowed sample collection across the eastern South Atlantic Ocean and the western North Atlantic Ocean.
2.2 Sample collection
Seawater for the POM was collected from the underway flow-through system for both cruises at a depth of approximately 5 m. This method involved initially passing water through a 30 µm nylon mesh to remove the stochastic presence of large particles from the samples (Lee et al., 2021). We then collected 3 to 8 L of filtered water in 8.5 L plastic polycarbonate carboys (Thermo Fisher Scientific, Waltham, MA). The carboys were placed at a 45° angle to prevent particles from settling below the nozzle. Next, particulate organic carbon (POC), nitrogen (PON), and phosphorus (POP) samples were filtered onto 25 mm pre-combusted GF/F (POC/PON are on the same filter). Prior to the cruise, GF/Fs were combusted at 500 °C for 5 h, with a nominal pore size of 0.7 µm (Whatman, Florham Park, NJ) . POP filters were rinsed with 5 mL of 0.17 M Na2SO4 to remove traces of dissolved phosphorous from the filter. Finally, we stored all filters in pre-combusted aluminum packets and placed them in a −80 °C freezer during the cruise, a −20 °C cooler for shipping, and back into a −80 °C freezer until analysis. Between sample collections, the carboys and tubing were rinsed with 30 µm filtered sample water just prior to collection.
We collected single samples of POC/PON and POP hourly for AMT28. For the C13.5 transect, POC/PON and POP samples were collected in triplicate every 4 to 6 h. Water collection for C13.5 was done at the peak and trough of the diel cycle, ∼ 06:00 and ∼ 20:00 LT, respectively, and with one to two collections in between those times.
2.3 Particulate organic matter determination
2.3.1 Particulate organic phosphorus (POP) assay
POP was analyzed using a modified ash-hydrolysis protocol (Lomas et al., 2010). Filters were placed into acid-washed/pre-combusted glass vials with 2 mL of 0.017 M MgSO4 and covered with pre-combusted aluminum foil. The vials were placed in an incubator for 24 h at 80 to 90 °C and then combusted for 2 h at 500 °C. After cooling, 5 mL of 0.2 M HCl was added and incubated at 80 to 90 °C for 30 min. The supernatant was collected, and the vials were rinsed with 5 mL of Milli-Q water. The rinse water was collected and added to the supernatant. Next, 1 mL of mixed reagent with parts ammonium molybdate tetrahydrate (24.3 mM), sulfuric acid (5 N), potassium antimonyl tartrate (4.1 mM), and ascorbic acid (0.3 M) were added to the supernatant and left in the dark for 30 min. Samples were analyzed on a spectrophotometer at a wavelength of 885 nm using a potassium monobasic phosphate standard (1.0 mM-P). The detection limit for POP measurements was ∼ 0.3 µg.
2.3.2 Particulate organic carbon/nitrogen (POC/PON) assay
POC/PON are measured using the same filter. The POC/PON samples were processed in the lab at the University of California, Irvine (UCI), using a Joint Global Ocean Flux Study (JGOFS) protocol (Ducklow and Dickson, 1994). POC/PON samples were dried in an incubator at 55 °C for 24 h. They were then moved to a desiccator with concentrated HCl fumes for 24 h to remove inorganic carbon. The samples were then re-dried at 55 °C for 24 h before being packaged into pre-combusted tin capsules (CE Elantech, Lakewood, NJ). The packaged filters were analyzed on a CN FlashEA 1112 Elemental Analyzer (Thermo Scientific, Waltham, MA) with atropine and acetanilide standards. POC and PON measurements had a detection limit of ∼ 2.4 and ∼ 3.0 µg. Settings for the FlashEA had an oxidative reactor temperature of 900 °C, a reduction reactor temperature of 680 °C, and an oven temperature of 50 °C. Oxygen introduced to the oxidative reactor lasted 7 s, allowing temperatures to reach 1800 °C for sample combustion. A leak test needed to fall below 5 mL min−1 before samples were analyzed to minimize sample loss.
2.4 Nutrient availability, biogeography, and biological properties
2.4.1 Nutricline depth
The nutricline depth was determined as the 1 µM nitrate depth horizon (Garcia et al., 2018; Cermeño et al., 2008). Nutricline depth was regarded as a proxy for nutrient supply to the surface, with a shallow nutricline representing a high flux of nutrients and vice versa for a deep nutricline. The nutricline depth with respect to the µM phosphate depth horizon was also investigated but was found to be nearly identical to that of nitrate. For AMT28, nitrate concentrations were quantified as previously described from conductivity, temperature, and depth (CTD) casts along the transect (Swift, 2019). Nitrate concentrations were then interpolated using data-interpolating variational analysis (DIVA) implemented in Ocean Data View (v5.5.2) (Schlitzer, 2019). For C13.5, we used the seasonal average nitrate depth profiles from the 2018 World Ocean Atlas at a 1 ° spatial resolution to determine nutricline depths. This approach was necessary as the logistical issues related to COVID-19 quarantine restrictions prevented us from collecting onboard CTD measurements. Linear interpolation for each profile within the 1 ° was performed to estimate the nutricline depth.
2.4.2 Delineation of regions
The regions under consideration for this study are the eastern Temperate North Atlantic (ETNA; lat 49.6–43.2° N) western North Atlantic Gyre (WNAG; lat 34.5–19.8° N), eastern North Atlantic Gyre (ENAG; lat 43.0–18.1° N), western equatorial (WEQ; lat 17.9° N–5.9° S), eastern equatorial (EEQ; lat 17.8° N–5.9° S), western South Atlantic Gyre (WSAG; lat 6.0–34.0° S), eastern South Atlantic Gyre (ESAG; lat 6.2–33.0° S), western Temperate South Atlantic (WTSA; lat 34.1–48.2° S), and eastern Temperate South Atlantic (ETSA; lat 33.9–41.5° S; Fig. 1). These boundaries are determined using inflection points along the nutricline depth and the temperature profile.
2.4.3 Cell size
Cell size was determined by the conversion of cell count, collected during CTD casts (AMT28) at the top 200 m of the water column. Flow cytometry samples (63 stations, 755 samples) were co-collected with the POM samples used in this study. Cell count was determined using two methodologies. The first method was to collect without a filter and utilize an inverted microscope to estimate cell abundance and phytoplankton species composition (Utermöhl, 1958). This allowed for the estimates of diatoms, dinoflagellates, and coccolithophores. The second method measured cells using a Becton Dickinson FACSort flow cytometer to measure Prochlorococcus, Synechococcus, and picoeukaryotes. Combining these two methods of collection allowed for a complete survey of phytoplankton groups.
Conversion of cell count to biomass (fg C cell−1) was done following the methodology from Moreno et al. (2022). Photoautotrophs were categorized into Prochlorococcus, Synechococcus, pico-eukaryotes, nanoeukaryotes, coccolithophores, and cryptophytes. Each cell type had a specific conversion factor in determining its biomass. Using a Monte Carlo approach, the 95 % confidence interval around cell size was determined using a normal distribution based on the mean and standard deviation. Then, a randomly chosen conversion factor was applied to each type. Allowing for 1000 runs, we estimate a 95 % confidence interval (Moreno et al., 2022).
2.4.4 Metagenomics-informed nutrient stress
Metagenomically informed nutrient stress utilizes a subset of data from Ustick et al. (2021), utilizing the genome content of Prochlorococcus from the Atlantic Ocean. These metagenomic samples (276) were co-collected across both transects with the POM samples used in this study. Based on variation in Prochlorococcus population gene content, this study identified genes associated with nitrogen and phosphorus nutrient stress types. The severity of nutrient stress was quantified by calculating the frequency of nutrient acquisition genes within Prochlorococcus single-copy core genes and attributes the frequency to the genetic adaptation for overcoming nutrient stress type and severity. Moving forward, the use of the nitrogen/phosphorus gene index will refer to this calculation of nutrient stress. Although based on Prochlorococcus, there is a significant overlap between this genetic index of nutrient stress and both Earth System Models and whole community nutrient addition assays (Ustick et al., 2021).
Ustick et al. (2021) associated Prochlorococcus gene occurrences with different environmental nutrient stress conditions. They separated the genes by nutrient type (nitrogen, phosphorus, and iron) and nutrient stress severity (low, medium, and high). Our study utilizes the high-stress severity for nitrogen and phosphorus. Iron has a more indirect influence on the , than nitrogen and phosphorus, which is why it will be omitted from this study. The stress severity associated with medium or low stress either followed the same pattern as the high nutrient stress or had no pattern at all, respectively, which is why this is also omitted. The function of the genes associated with the high gene index are focA, moaA-E, moeA, napA, narB, and nirA (for nitrogen) and phoA and phoX (for phosphorus). The functions of these genes are for the assimilation and uptake of nitrite and nitrate and production of alkaline phosphatase.
2.4.5 N* derivation
The derivation from Redfield nutrient concentration (N*) at a depth of 200 m was calculated as
A negative/declining value would be indicative of nitrogen stress, while a positive/increasing value would indicate phosphorus stress.
2.5 Data analysis
Data analysis was conducted using Matlab R2021b (MathWorks). An ANOVA analysis with a post hoc Tukey test was used to determine the relationship between the selected regions for environmental conditions and POM. The ratios underwent a log transformation to achieve a normal distribution before the ANOVA analysis (Isles, 2020). Using R version 4.1.2 (R Core Team, 2019), we used generalized additive models (GAM) with the package mgcv (v1.8; Wood, 2017) to explain the strength of four variables in determining (temperature, nutricline depth, nitrogen gene index, and phosphorus gene index).
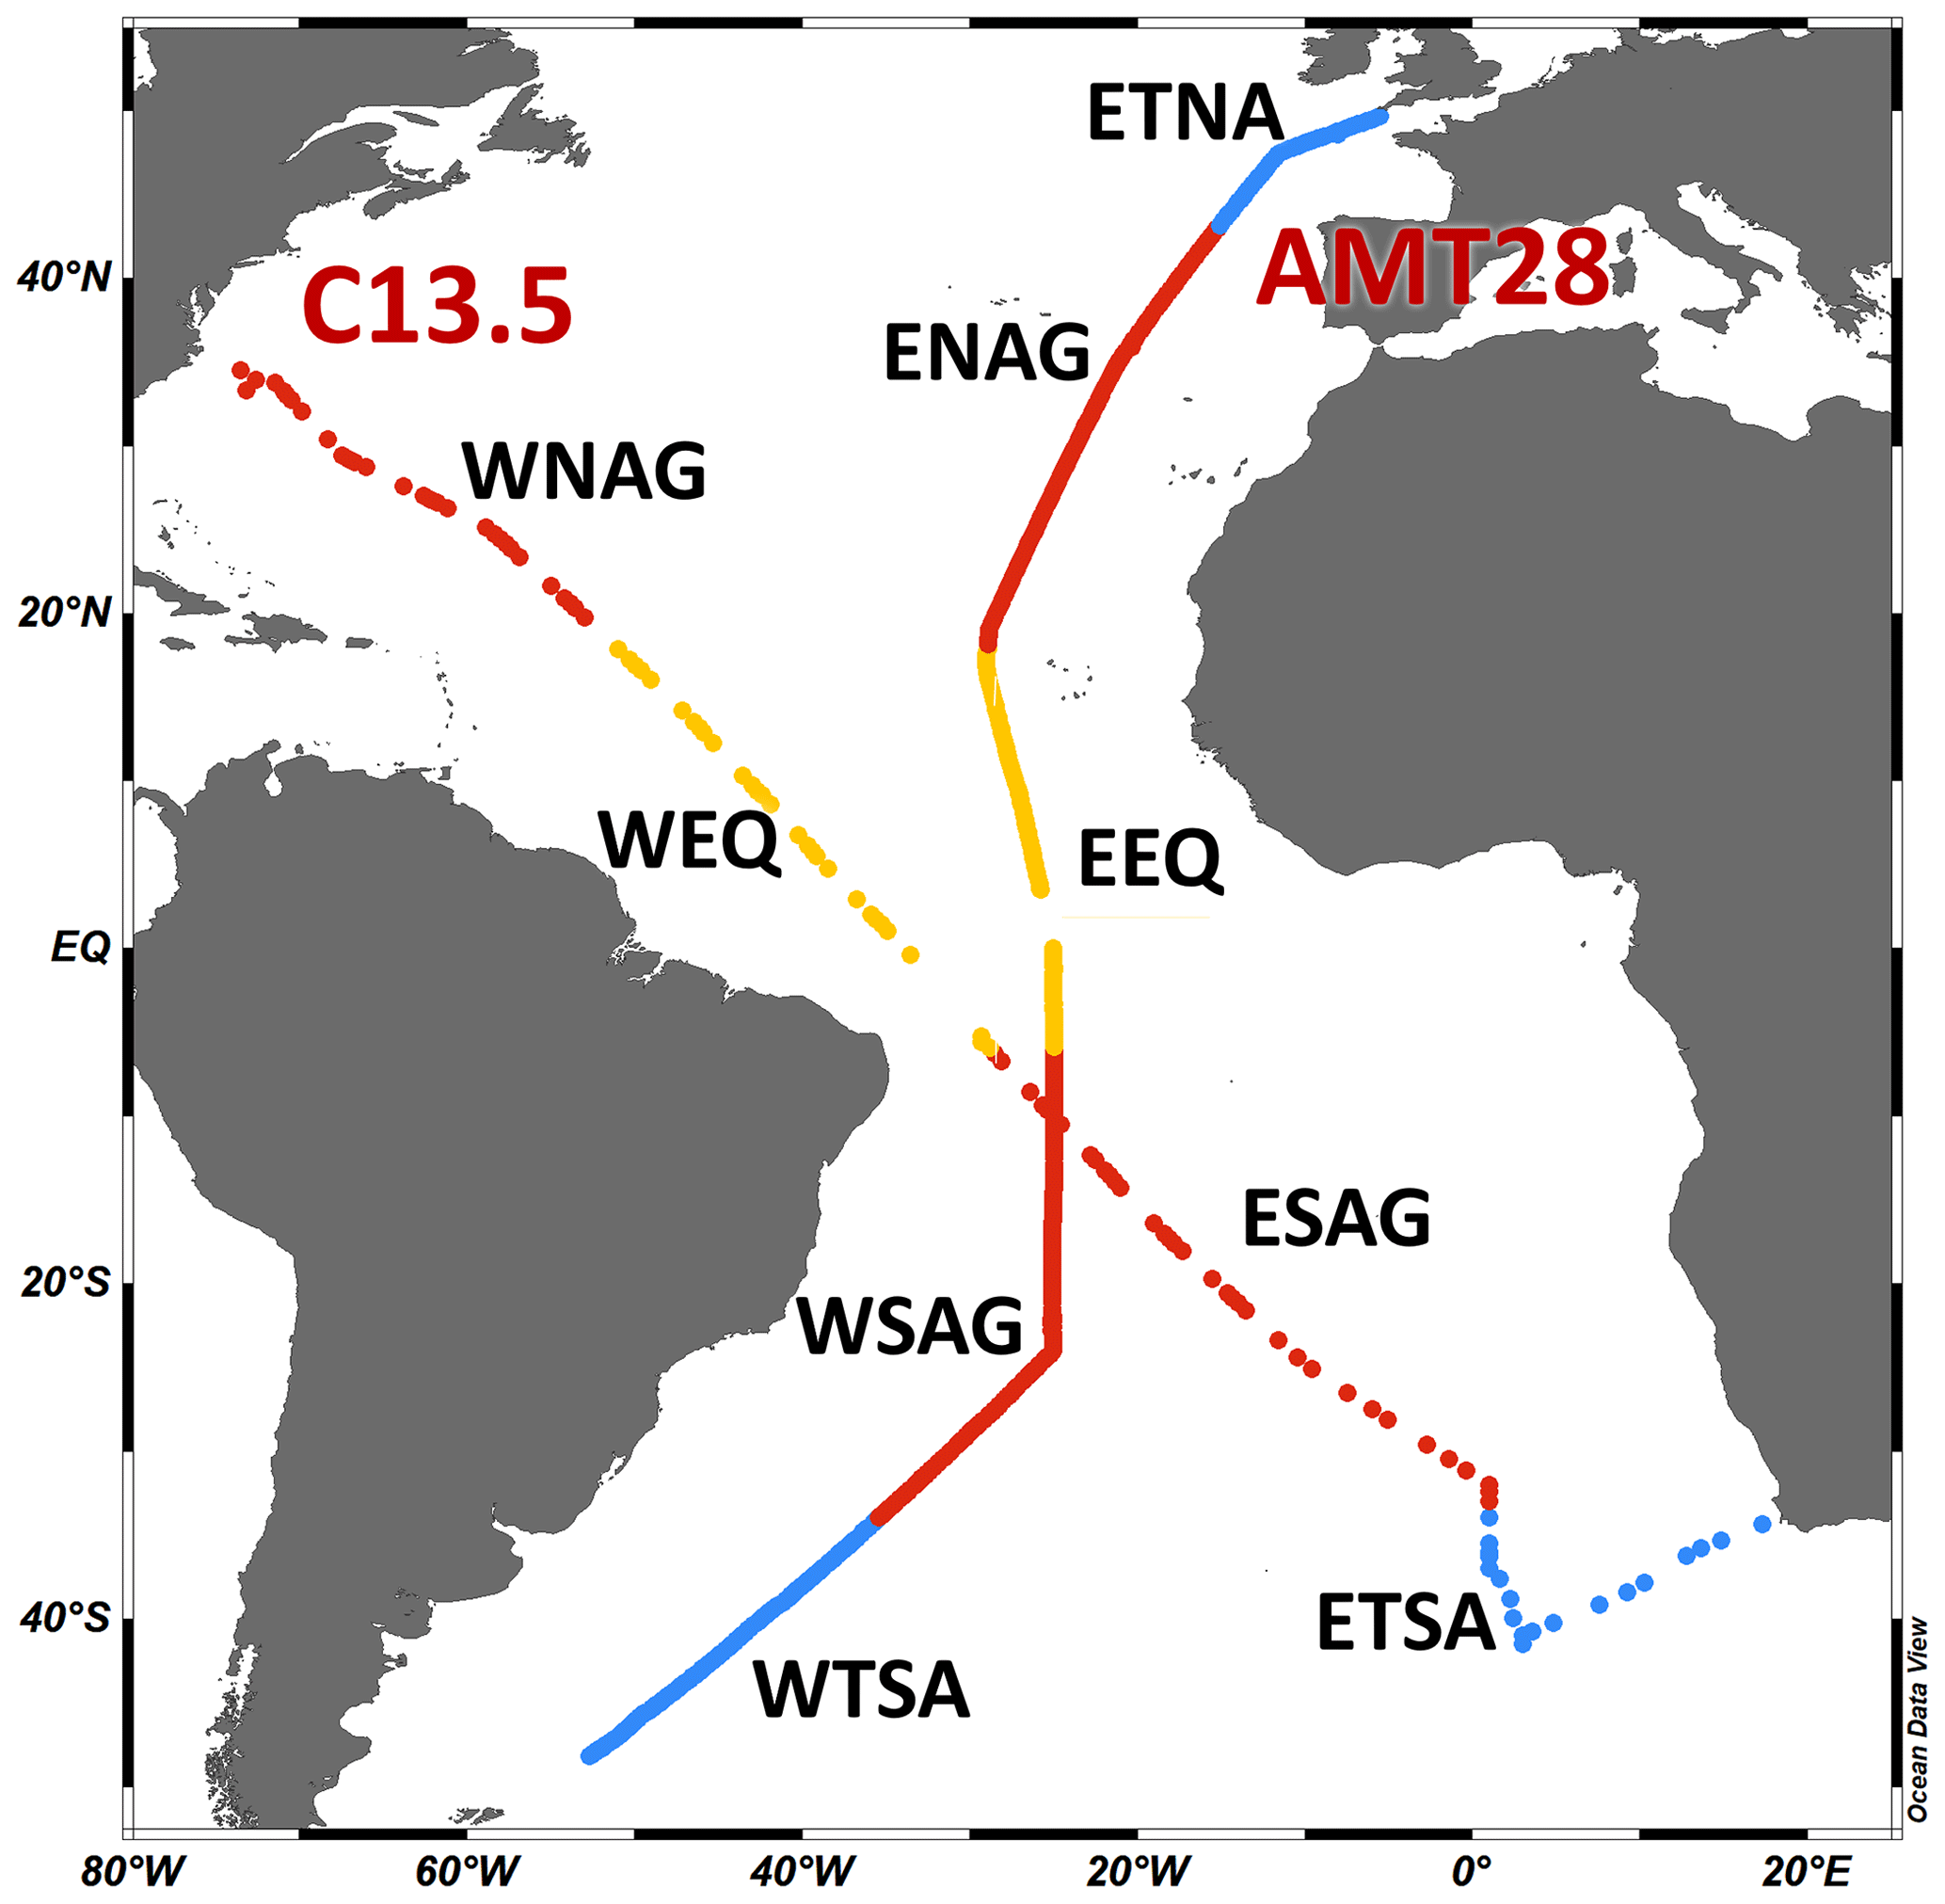
Figure 1Map of oceanographic cruise transects AMT28 (25 September to 27 October 2018, n=765) and C13.5 (21 March to 16 April 2020, n=112). Different oceanographic regions are separated using nutricline and temperature profiles: WTSA is western Temperate South Atlantic, ETSA is eastern Temperate South Atlantic, WSAG is western South Atlantic Gyre, ESAG is eastern South Atlantic Gyre, WEQ is western equatorial, EEQ is eastern equatorial, WNAG is western North Atlantic Gyre, ENAG is eastern North Atlantic Gyre, and ETNA is eastern Temperate North Atlantic. Colors delineate temperate (blue), subtropical (red), and equatorial upwelling regions (yellow) (Schlitzer, 2019).
POM concentrations, temperature, and nutricline profiles exhibited characteristics unique to each oceanographic region. Between the two transects, POC, PON, and POP concentrations were strongly correlated (r = 0.68, 0.71, and 0.70, respectively; p<0.001; Figs. 2a and S1). All POM pools had peak concentrations at high latitudes, troughs in the subtropical gyres, and intermediate concentrations at the Equator. In high-latitude temperate regions (WTSA, ETSA, and ETNA), POC (and overall POM) was significantly elevated (4.6 to 5.3 µM; p<0.05) compared to all other regions (equatorial: 2.8 µM, Gyre: 1.6 to 2.1 µM; Figs. 2a, S2). POM concentrations also showed a zonal difference. There were higher concentrations of POM in the western regions compared to the eastern region of the Temperate South Atlantic, whereas the opposite was seen in the subtropical gyres (Figs. 2a and S2). At ∼ 10° S, C13.5 and AMT28 cross paths; we used a 1° cell centered on the intersection (using 9 samples) to find the differences between the POC, PON, and POP of the two cruises, which were 0.2 %, 5.7 %, and 10.6 % respectively, indicating that seasonal variability between them had the greatest impact on POP. However, one sample is the cause of most of the error within PON and POP, when removing the sample, the differences become 2.9 %, and 2.1 %, respectively. Temperature peaked equatorially (∼ 28 °C) for both transects and declined with increasing latitudes (Fig. 2b). We observed minor variation in the meridional temperature profile linked to the difference in the seasonal timing for each cruise, leading to a slight southward shift in peak temperature during C13.5. Nutricline profiles for both transects were similar, with the deepest nutricline in the gyres and shallowest at high latitudes and the Equator (Fig. 2c). Zonal variability in the nutricline depth was apparent, with the deepest values in the western side (135 to 150 m) compared to the eastern side of the gyres (114 to 116 m; Fig. S2). Thus, we observed a robust meridional gradient in POM concentrations and environmental conditions but also a zonal gradient in nutricline depth in the oligotrophic subtropical gyres.
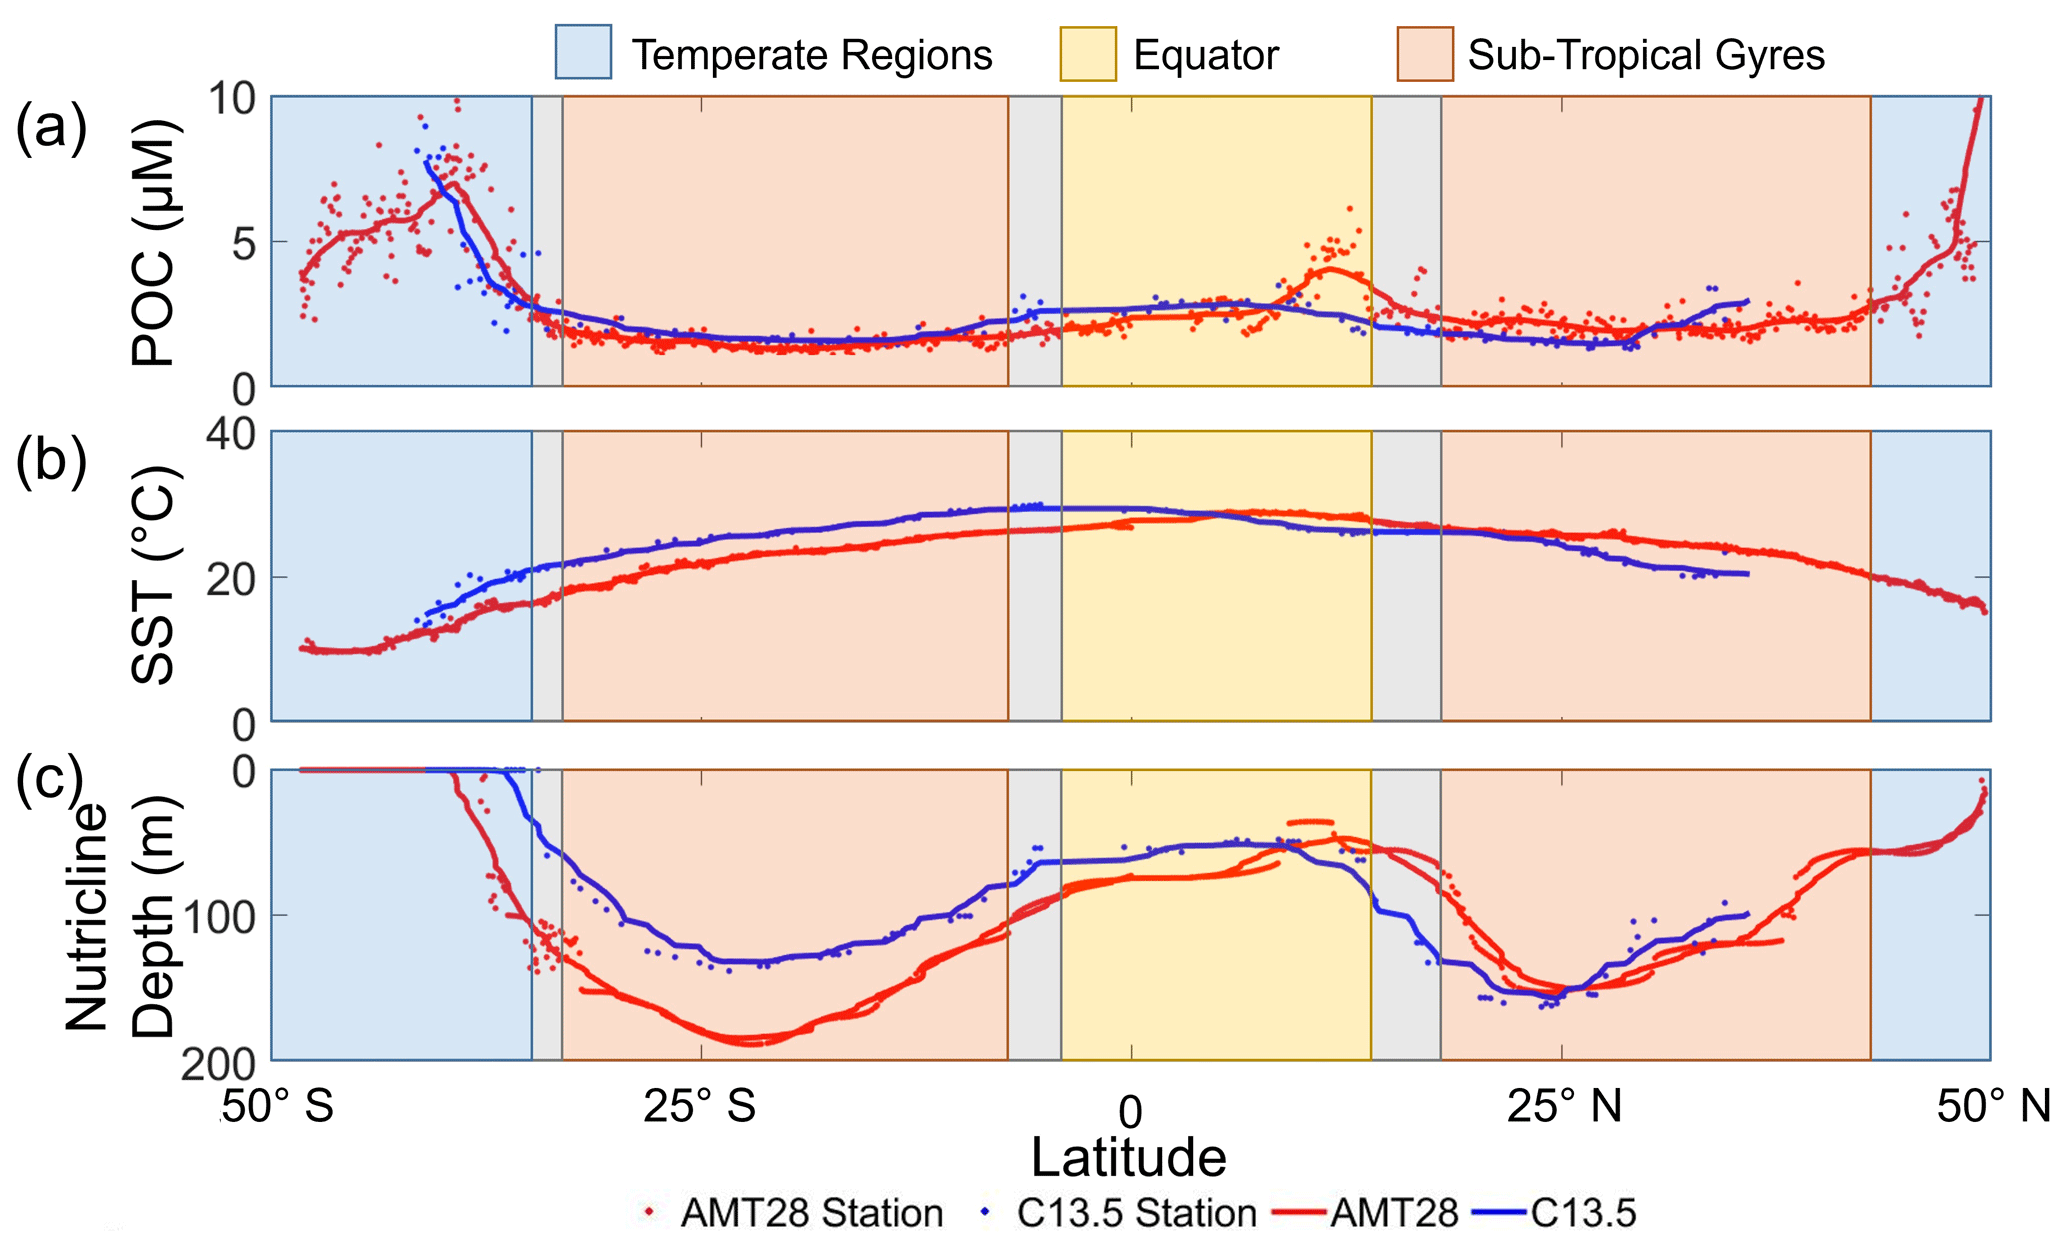
Figure 2Meridional variability in POC concentrations and environmental conditions for AMT28 (boreal fall) and C13.5 (boreal spring). (a) Averaged surface POC concentrations, (b) surface temperature, and (c) nutricline depth presented as Znitrate>1 µM. The trend lines represent the moving average of samples for the AMT28 (red, n=50) and C13.5 (blue, n=20) transects. Background colors indicate broad oceanographic regions separated by latitude (blue are temperate, red are subtropical, and yellow are equatorial upwelling regions). Grey spaces between regions represent the differences in boundaries between the two transects.
We observed distinct latitudinal, zonal, and hemispheric variability (Fig. 3). First, we detected peak ratios in the subtropical gyres, troughs in the high latitudes, and intermediate values at the Equator for C:N, C:P, and N:P, matching patterns seen globally (Martiny et al., 2013b). In the subtropical gyres, averaged C:N values were noticeably elevated (7.0 to 7.6) compared to the other regions (temperate: 6.0 to 7.2, EQ: 6.6 to 6.8) (Fig. 3a). C:P followed the same trend as C:N, with subtropical gyre regions being higher (148 to 208) than the other regions (temperate: 122 to 158, EQ: 136 to 161; Fig. 3b). N:P showed parallel changes to C:P, except the South Atlantic Gyre that showed a N:P range encompassing those of all other regions (20.1 to 29.2; Fig. 3c). Second, a zonal gradient was detected, whereby C:N was higher in the eastern side of the South Atlantic Ocean compared to the western side (Fig. 3d). However, this zonal gradient was not observed in other regions. C:P also showed an opposite zonal trend with higher values on the western side, albeit only significantly different in the Northern Hemisphere (Fig. 3e). N:P showed the highest zonal variation. This ratio was significantly higher on the western (21.4) compared to the eastern side (17.1) of the South Atlantic Subtropical Gyre (Fig. 3f), converging at ∼ 10° S and again elevated on the western side (29.2) compared to the eastern side (24.8) of the North Atlantic Subtropical Gyre (Fig. 3f). Again, using the 1° cell centered on this intersection, we determined that C:N, C:P, and N:P had differences of 5.8 %, 12.1 %, and 5.9 %, respectively, between the two cruises. One sample is the cause of a majority of the error, with its removal the difference becomes 2.6 % for C:N and 1 % for the rest. Third, there was also a hemisphere bias, whereby C:P and N:P were elevated in the Northern Hemisphere, and C:N was somewhat higher in the Southern Hemisphere. In summary, we saw clear latitudinal, zonal, and hemisphere gradients in across the Atlantic Ocean.
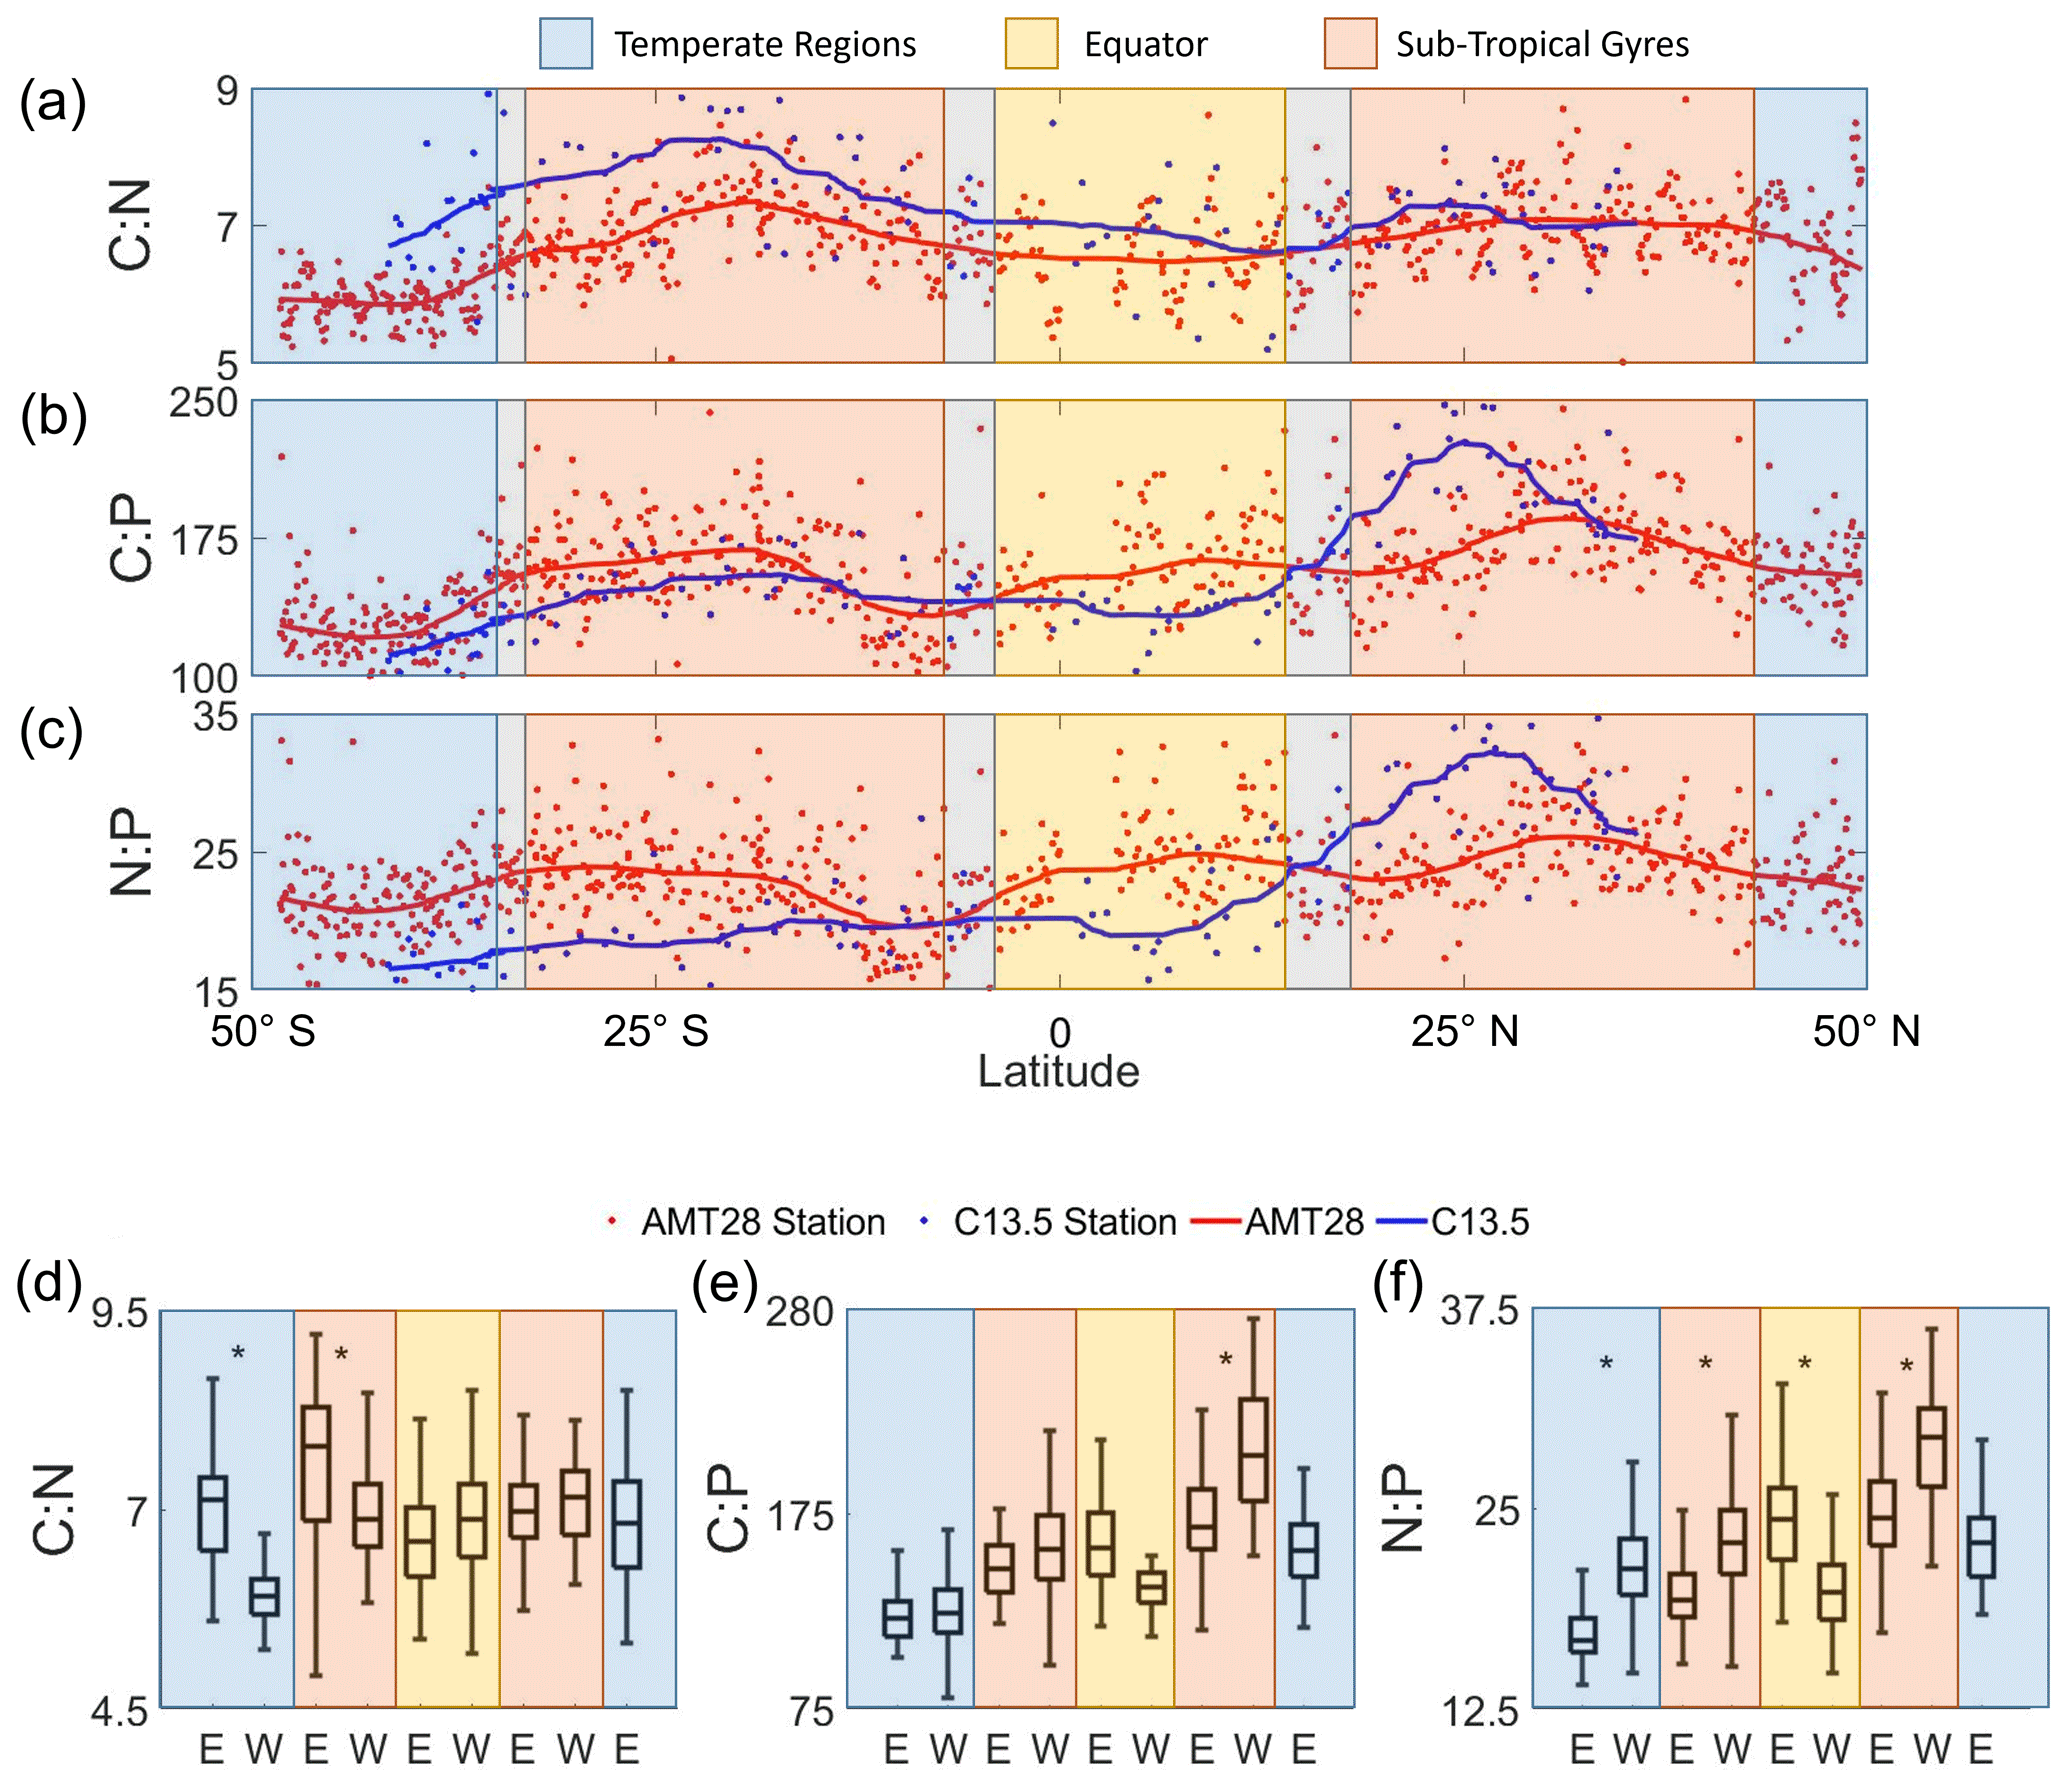
Figure 3Latitudinal and regional shifts in POM stoichiometry. (a–c) Averaged observed surface C:N, C:P, and N:P. The trend lines represent the moving average of samples for the AMT28 (red) and C13.5 (blue) transects. (d–f) Regional C:N, C:P, and N:P represented by boxplots, where data were separated by latitude and longitude (E is east; W is west). Significant zonal (east–west) differences are denoted by stars (*) above the plots based on the Tukey post hoc significant difference test (p=0.05). For all boxplots, the central black bar of the box represents the median value. The whiskers signify the range (min, max) of values excluding outliers.
The variability in across regions can be partially explained when investigating N* at 200 m for AMT28. Across the transect, N* has a positive value from 10 to 50° N, with the remaining regions having a negative value (Fig. S3). As N* decreases from north to south, the environment becomes more nitrogen-stressed. When comparing N* and N:P directly, there is only a weak correlation (r = 0.48, p<0.001). Beyond the general increasing value of both N* and N:P from the south to the north, the features of the two plots do not line up directly. Rather it would appear that the peaks in N* more closely align with the troughs in N:P and vice versa.
Using flow cytometry cell counts, we were able to determine the concentration and total biomass of separate species of photoautotrophs at each station for AMT28. From this, Prochlorococcus was determined to make up > 93 % of the community in the subtropical gyres and Equator and over 50 % of the total biomass. In the northern temperate region, 67 % of the northern temperate region community consisted of Prochlorococcus, but it only accounted for 10 % of the biomass, and the South Temperate Atlantic Ocean was the only region without Prochlorococcus being the most abundant, at 12 % of the community and 1 % of the biomass (Fig. S4). With the fractional biomass of the six phytoplankton size groups, we used a linear regression model to link to C:P along the transect. The regression model was able to describe the general characteristics of the in situ samples but failed to capture the detailed transitions (R2=0.23 p<0.05; Fig. S5). While only being able to capture the general characteristics of the in situ samples and the dominant biomass of Prochlorococcus across the Atlantic, we found the use of gene-specific nutrient stress of Prochloroccus to be an acceptable driver of the variability in within the GAM.
The influence of phytoplankton composition, temperature, nutricline depth, and metagenomically assessed nitrogen and phosphorus stress (gene index) were tested as drivers of stoichiometry using a general additive model (GAM) (Fig. 4). Using GAM, we determined that temperature and the nutrient gene indices captured 67 % and 56 % of the total deviance for C:P and N:P, respectively. For C:P, nutricline depth and phosphorus gene index accounted for 52.5 % of the total (31.3 % and 21.2 %, respectively). For N:P, nutricline depth and phosphorus gene index accounted for 45 % of the total (24.6 % and 20.7 %, respectively). We could only explain 30 % of the total deviance for C:N, with the temperature being the most significant contributor (13 % and 11 %, p<0.001 and p<0.01 respectively). For , nutricline depth was the dominant contributor to the latitudinal variability in two of the three ratios and was the second-most dominant in the third when investigating the entire basin (Fig. 4). When dividing the Atlantic Ocean into eastern and western boundaries, the four drivers tested were able to explain the variability in C:P and N:P more accurately in the western side (81 % and 63 %, respectively) and C:P in the eastern side (38 %; Figs. S7 and S8, Table S2). From this division, the dominant drivers remained nutricline depth and temperature for C:P and N:P and became the dominant driver of C:N. While the drivers for C and N individually have a maximum of 7 % difference between each other on either side of the Atlantic Ocean, the regional focus is able to interpret changes in drivers that an ocean-wide analysis would determine to be different.
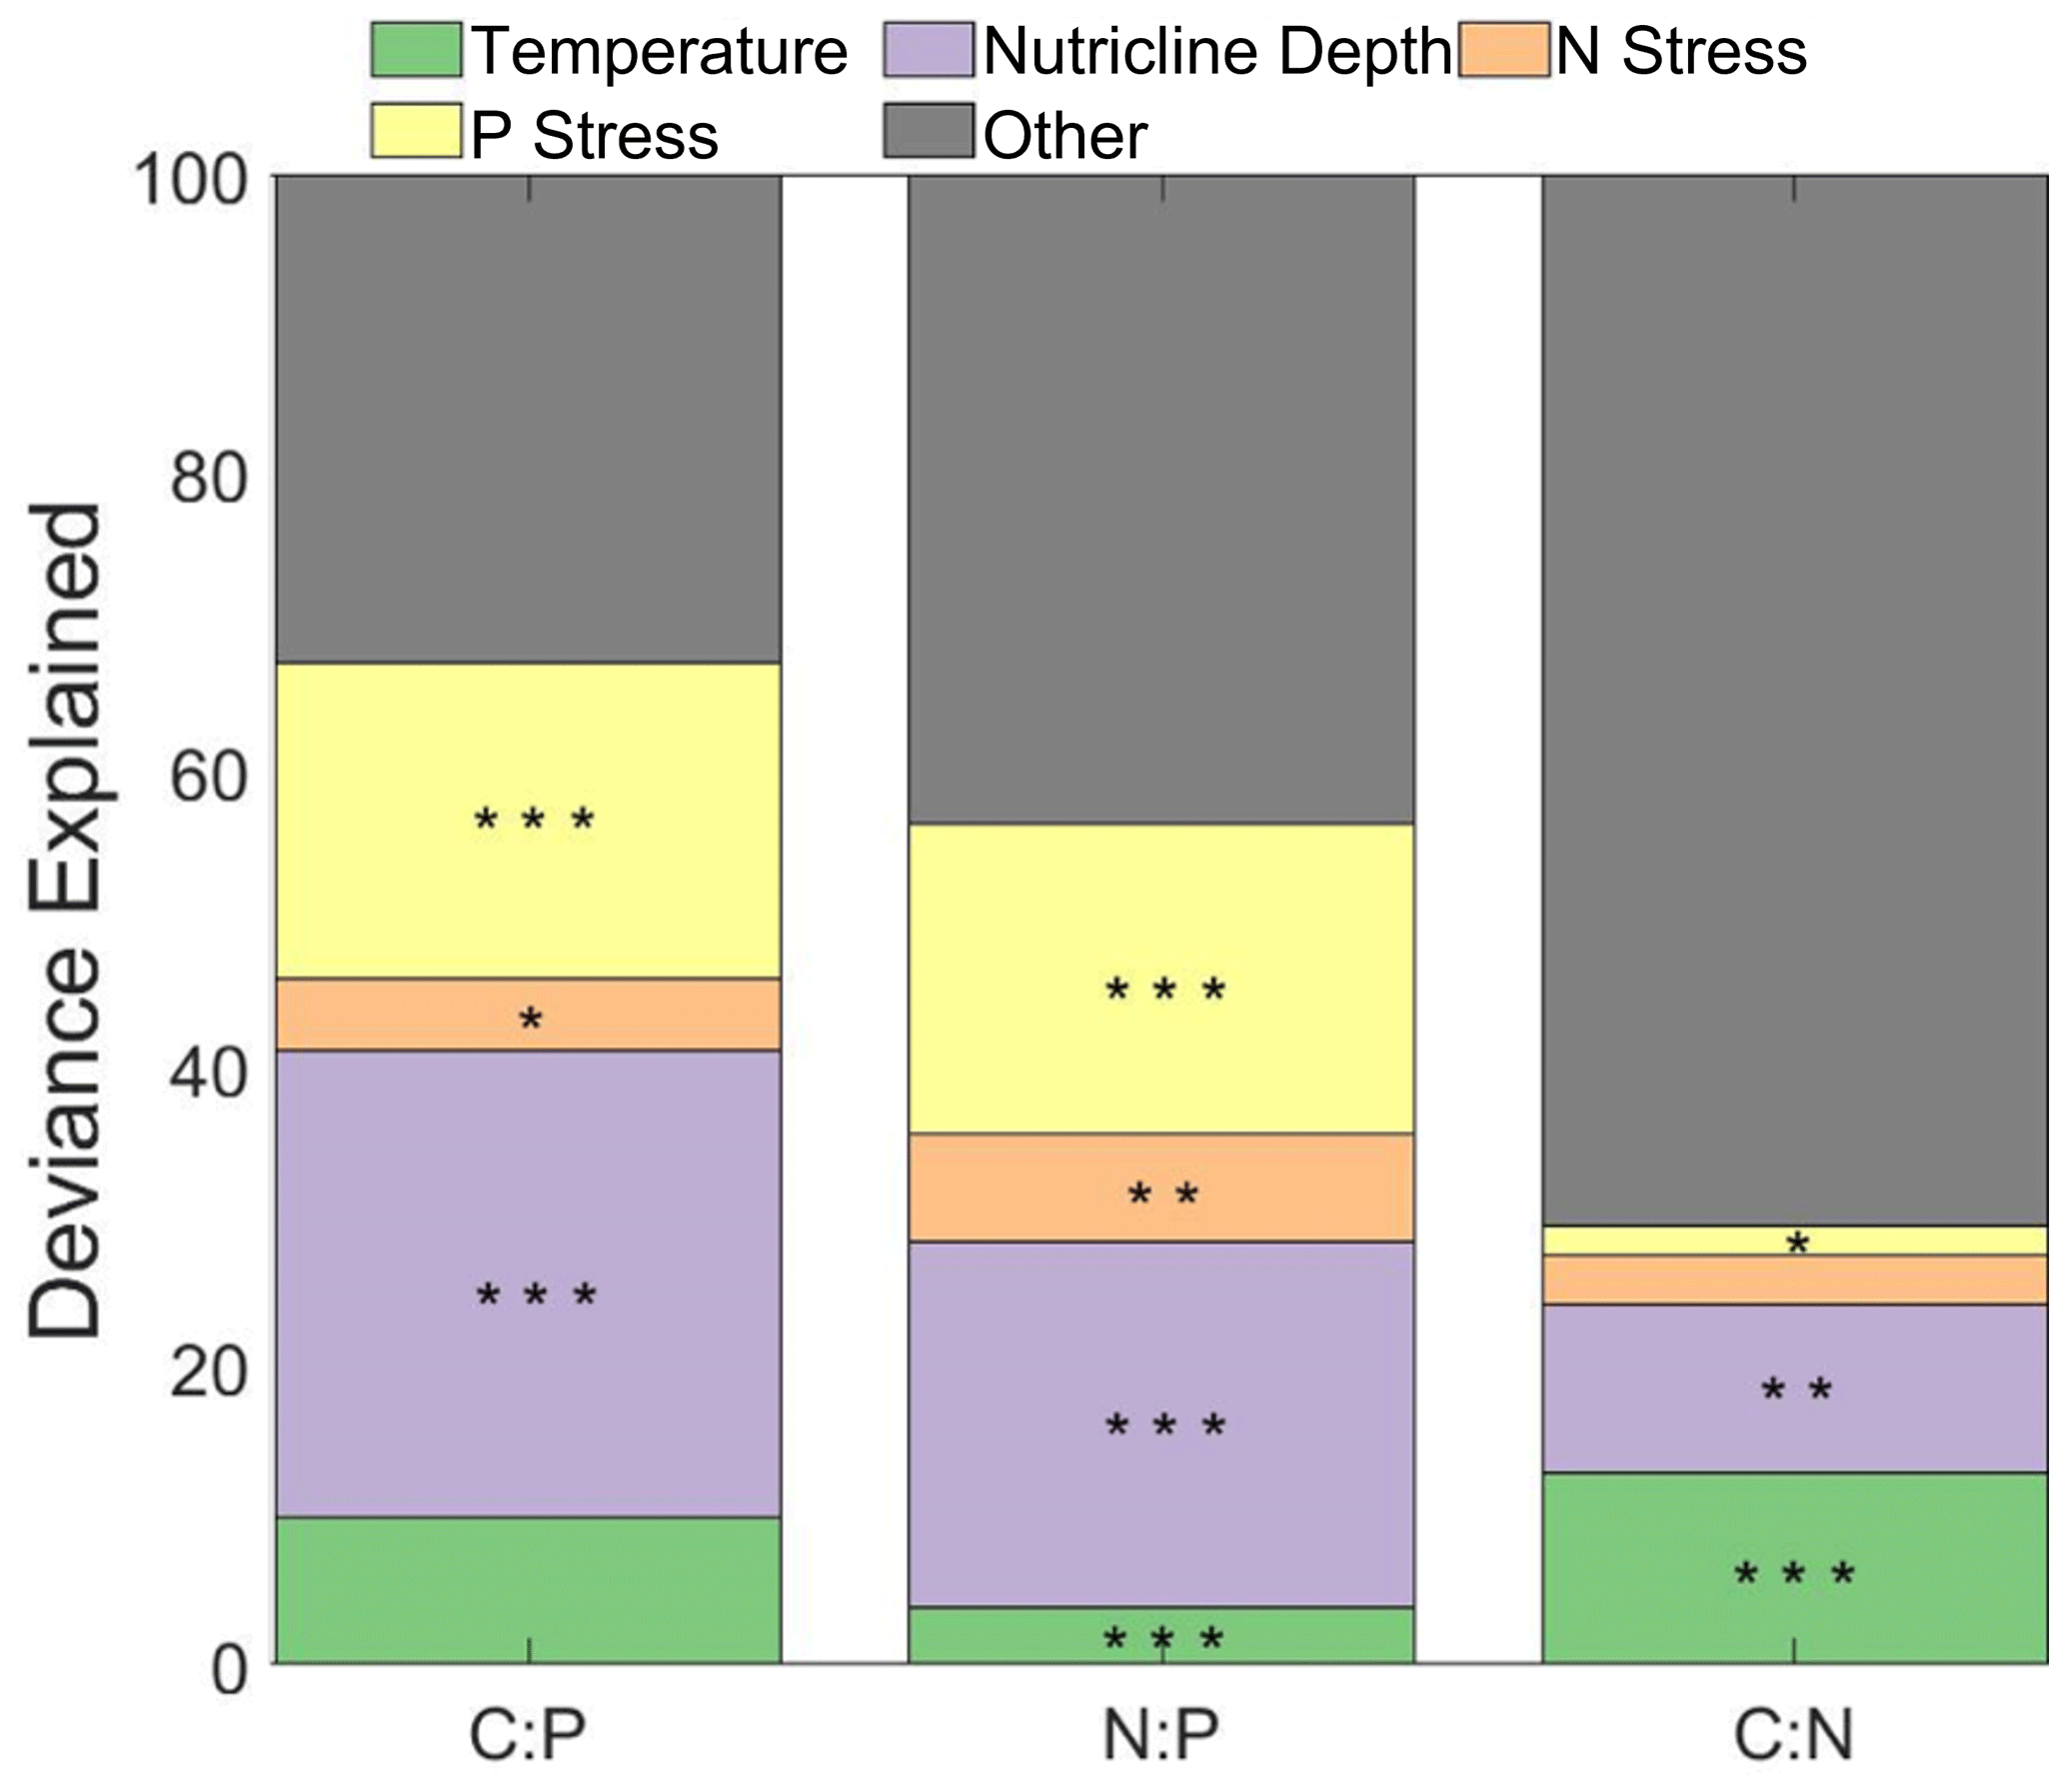
Figure 4Influence of environmental factors on stoichiometry. Stars indicate the significance of smooth terms used for generalized additive models (GAMs). indicate p<0.001, indicate p<0.01, and * indicates p<0.05. Green represents the influence of temperature, purple represents the influence of nutricline depth, orange represents the nitrogen stress, yellow represents the phosphorus stress, and grey represents the remaining factors of influence on the variability in . N and P stress are reflective of the nutrient gene index, which is quantified by calculating the frequency of the nutrient acquisition genes within Prochlorococcus single-copy core genes. The frequency is attributed to the genetic adaptation for overcoming nutrient stress type and severity.
A zonal gradient in nutricline depth and metagenomically assessed nitrogen and phosphorus stress matched shifts (Fig. 3d–f). Nutricline depth was significantly deeper (p<0.05) in the western part of the subtropical gyres in both hemispheres (Fig. S2). Furthermore, there was a westward shift from nitrogen towards phosphorus stress (Fig. S6). This zonal shift in nutrient availability corresponds to a similar increase in C:P from 174 to 207 and N:P from 24.8 to 29.2 towards the western side of the oligotrophic gyres (Fig. 3e, f). In parallel, C:N showed the opposite trend, declining from 7.6 on the eastern to 7.0 on the western side, matching a shift from nitrogen to phosphorus stress (Fig. 3d). GAM analyses conducted separately for the western and eastern basins corroborated these observations, highlighting the relative importance of shifting nutrient stress (Fig. S7–9). In summary, zonal variability in nutrient stress, described by a westward deepening nutricline and increased phosphorus gene index, may regulate a zonal change in .
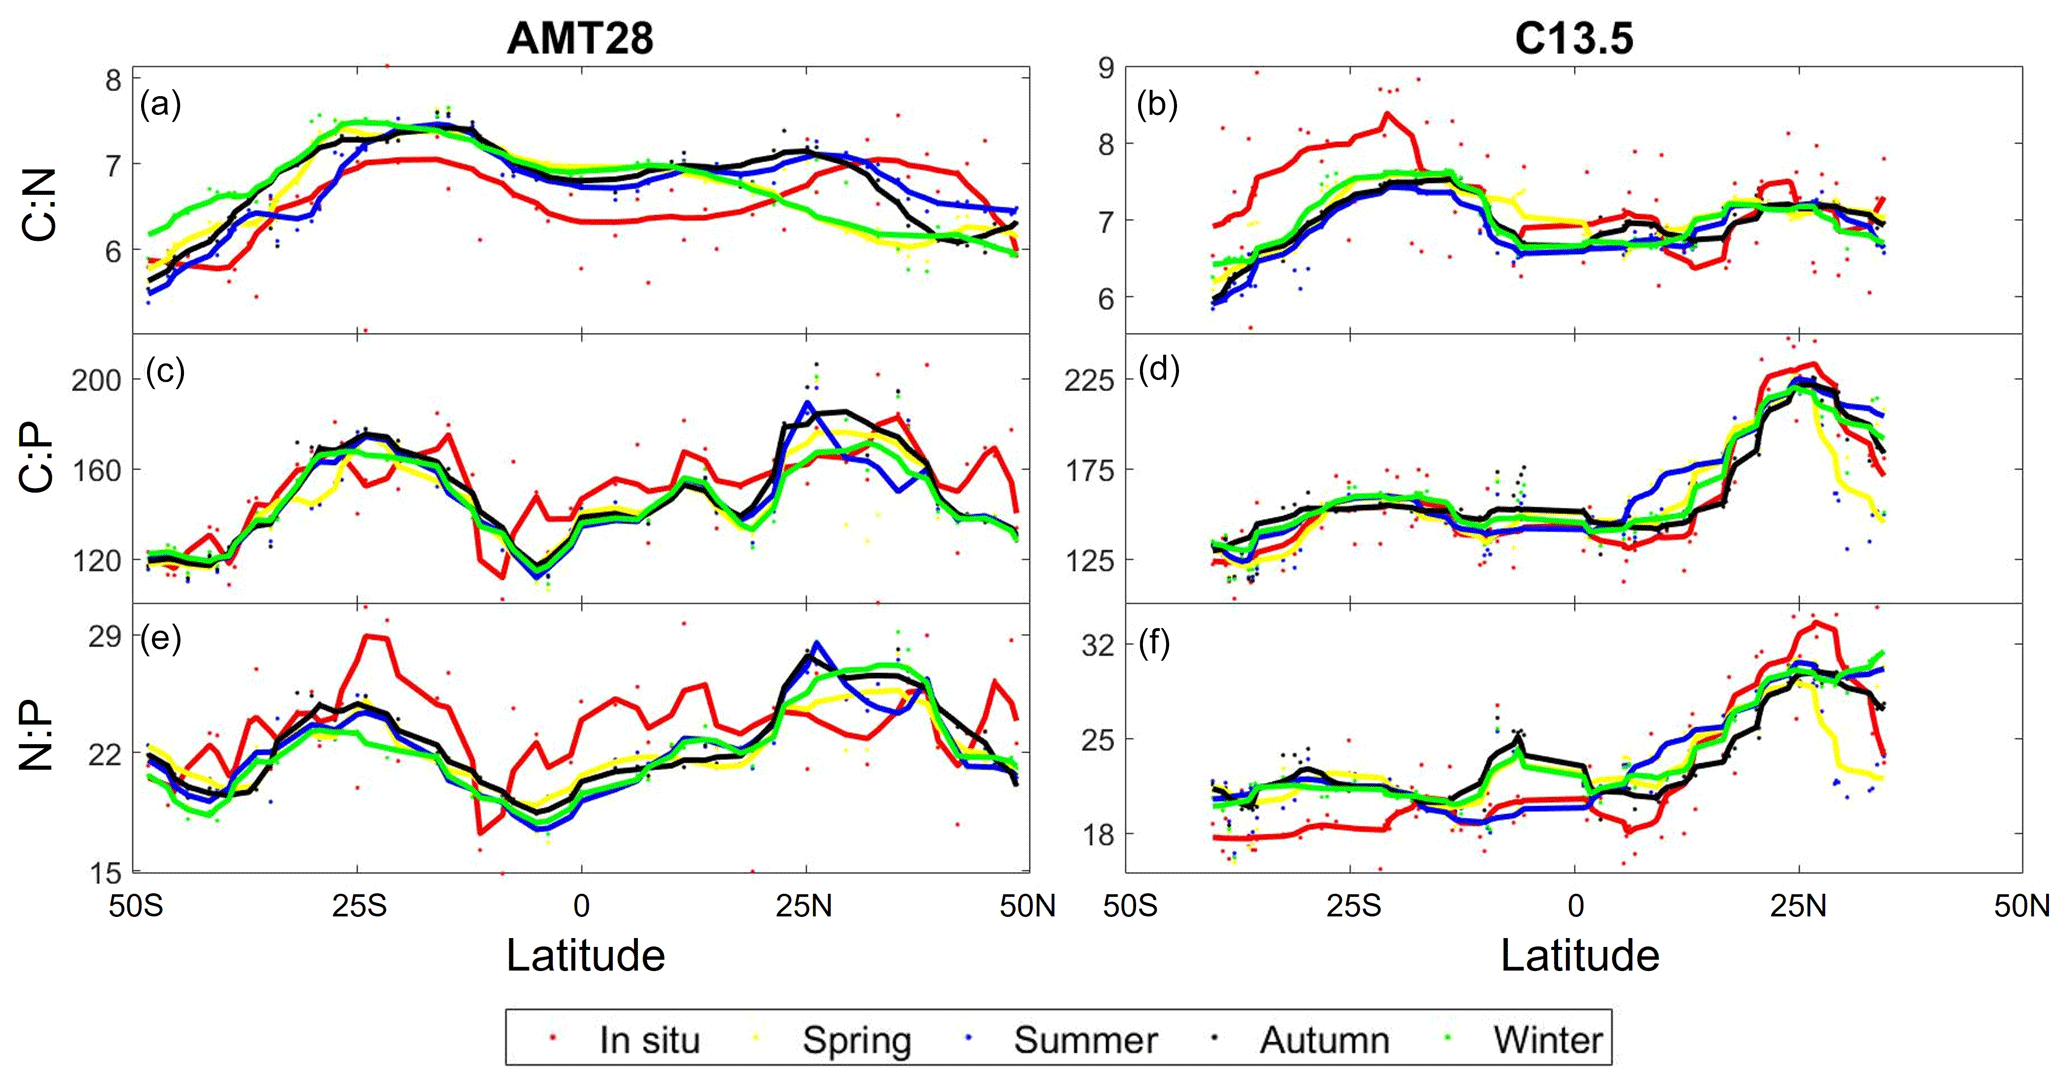
Figure 5Predicted seasonal variability in stoichiometry across the Atlantic Ocean. Observed compared to predicted seasonal C:N for AMT28 (a) and C13.5 (b). Observed compared to predicted seasonal C:P for AMT28 (c) and C13.5 (d). Observed compared to predicted seasonal N:P for AMT28 (e) and C13.5 (f). Dots are discrete samples, and the lines are moving averages over 10 samples. AMT28 occurred during fall 2018 and C13.5 during spring 2020. In situ samples are red, predicted spring is yellow, predicted summer is blue, predicted autumn is black, and predicted winter is green.
We assessed the potential impact of seasonal environmental changes for across the Atlantic Ocean. Seasonal environmental changes were characterized as shifts in nutricline depth and temperature, while assuming a stable biogeography of nitrogen vs. phosphorus stress (Fig. 5). This assumption is the result of only having gene stress information from the season samples were collected in. As a control, we saw a significant correlation between the observed and predicted for the season matching the cruise occurrence (Table S3). However, the statistical model did not predict high C:N in the eastern South Atlantic Ocean and overestimated N:P in the equatorial and western South Atlantic Ocean. ratios were predicted to be mostly stable across seasons. However, we detected shifts in C:N near the north subtropical convergence zone (∼ 18 °C) reflecting an expansion and contraction of oligotrophic conditions (Fig. 5a). The introduction of more dynamic biogeography of nutrient stress will be necessary to predict a more accurate seasonal variability in across the Atlantic Ocean. However, from the data available, our statistical model predicted a mostly stable seasonal ratio across the Atlantic Ocean.
3.1 Discussion
There was clear latitudinal variability in POM concentrations and stoichiometry across the Atlantic Ocean. We detected a high POM concentration and low at higher latitudes, low POM concentrations and high ratios in the subtropical gyres, and intermediate values near the Equator. This meridional gradient in POM concentrations and ratios corresponded to parallel changes in nutricline depth and thus is likely linked to the overall nutrient supply. Similar gradients in concentrations and ratios have been detected in the Indian Ocean (Garcia et al., 2018), the Pacific Ocean (Lee et al., 2021), and in a global synthesis (Martiny et al., 2013b). Thus, our observations add further support to systematic biome shifts in across major ocean basins. Despite having similar gradients, the North Atlantic Ocean appears to be relatively unique, with higher C:P and N:P ratios in the Northern Hemisphere compared to the Southern. Both the North Atlantic and the Indian Ocean's Bay of Bengal have comparable aeolian iron inputs; however, the North Atlantic Ocean has an increase in N2 fixation, which increases the N:P nutrient supply ratio, leading to widespread phosphorus stress (Capone, 2014; Schlosser et al., 2014; Ussher et al., 2013). The Bay of Bengal does not have significant N2 fixation or a significant change in C:P or N:P ratios (Garcia et al., 2018; Löscher et al., 2020). This lack of N2 fixation is possibly the result of stress from another micronutrient for N2 fixers.
Focusing on the influence of P stress, there is an increase in phytoplankton elemental C:P and, to a lesser extent, N:P throughout much of the North Atlantic Ocean. POP has a minimum concentration in the western North Atlantic Ocean (Fig. S1), suggesting that the parallel changes in N:P and C:P are caused by lower POP concentrations. Iron inputs decrease across the North Atlantic Ocean from east to west, with a majority of the POP concentrations following the same trend (Mahowald et al., 2005). While there is an increase in POP concentrations for C13.5, part of this is attributed to coastal upwelling. Had C13.5 continued north, it is possible that the POP concentrations observed in the lower half of the North Atlantic gyre would have continued. Proposed explanations of this zonal difference result from a combination of vertical iron supply and lateral circulation across the Atlantic Ocean (Martiny et al., 2019). In the South Atlantic Ocean, aeolian iron inputs are significantly lower, as most dust is washed out at the Intertropical Convergence Zone (Capone, 2014). N2 fixation is hence suppressed (Wang et al., 2019), allowing most of the Southern Hemisphere to display elevated N stress. This rise in nitrogen stress likely causes the depressed PON concentrations (Fig. S1) and elevated C:N but causes depressed N:P in much of the South Atlantic Ocean. Thus, the hemisphere deviation in is hypothesized to be driven by a causal link between iron inputs, N2 fixation, and shifts between the nitrogen and phosphorus gene index (Martiny et al., 2019).
An additional zonal gradient in may be linked to the westward deepening of the nutricline and a parallel shift from primarily nitrogen stress towards an increase in phosphorus stress. Phosphorus stress is detected throughout the central North Atlantic Ocean based on both the gene index and N* (Ustick et al., 2021); however, both C:P and N:P are significantly higher on the western side. Using the nutricline depth as a proxy for nutrient supply, the nutrient supply appeared greater on the eastern side; in addition, aeolian nutrient inputs could relieve nutrient stress towards the east, suppressing C:P and N:P ratios (Kremling and Streu, 1993; Mills et al., 2004; Garcia et al., 2018; Neuer et al., 2004). The South Atlantic Ocean also has the east–west variability for , with C:N having the largest gradient. From the nutrient gene index and N*, the South Atlantic Ocean is predominantly nitrogen stressed. Zonal shifts in can be explained by shallower nutricline depth, a higher nitrogen gene index in the eastern part, and a higher phosphorus gene index in the western part of the South Atlantic Ocean (Ustick et al., 2021; Martiny et al., 2019). Thus, we observe zonal variability in POM concentrations and their stoichiometric ratios, superimposed on the larger meridional and hemisphere gradients.
Nitrogen and phosphorus stress are assessed based on genomic changes and adaptation in Prochlorococcus populations (Ustick et al., 2021). With Prochlorococcus being the most abundant phytoplankton, forming most of the phytoplankton biomass in the gyres and equatorial regions and in the northern temperate population, it is likely closely linked to the bulk phytoplankton community physiological status (Fig. S4; Marañón et al., 2000; Zwirglmaier et al., 2007). Additionally, Prochlorococcus and Synechococcus express nearly identical responses across a transect with regions of different nutrient stress; i.e., when Prochlorococcus had a high phosphorus gene index, Synechococcus had a high phosphorus gene index as well (Garcia et al., 2020). Within the South Atlantic Ocean, the use of bioassays and deficiency calculations agree with Prochlorococcus gene stress, being primarily nitrogen stressed, yet disagree within the North Atlantic Ocean (Browning and Moore, 2023). While previous bottle experiments of nutrient stress in the North Atlantic Ocean describe it as being dominantly or co-stressed by nitrogen and phosphorus, respectively, the gene index describes the North Atlantic as dominantly phosphorus stressed. This suggests that there is a significant difference between the different assays in determining the nutrient stresses phytoplankton experience. This study focused on factors that had a direct influence on ; we then chose to forgo using co-stressors of nutrients or the use of iron stress. Along with direct influence, these samples match one-to-one with the POM samples collected on the cruises.
It was determined through the use of GAM that nutricline depth, phosphorus stress, and temperature were the main drivers in the variability in . These findings are similar to those of a global synthesis that determined that nutricline and gene index were the dominant drivers of variability within the tropical and subtropical regions (Tanioka et al., 2022). While their polewards assessment determined that temperature was the dominant driver, the samples used in this study fall primarily within tropical/subtropical bounds (49 of 877 samples are outside of this range). C:P and N:P generally agreed with this global model assessment, but C:N temperature had a smaller influence globally than for the Atlantic Ocean. With the relatively small amount of variance determined for C:N, it is possible that the northernmost samples had a major impact on the determination of temperature's influence, as seen by Tanioka et al. (2022), in which temperature was determined to be the most significant driver for the variance of C:N. With respect to the other section of the GAM analysis, the factors with a more indirect relationship to could have a significant role, especially with C:N (i.e., the influence of iron stress or light availability).
The predicted restricted changes in seasonal values of fell in the middle to lower range of the observed seasonal averages of those observed at BATS, representing the fall and winter seasons better than spring and summer (Singh et al., 2015). It is worth noting that while the values were able to capture the lower range, the ratios measured during C13.5, closest to BATS, were lower than the measured monthly averages. Since C13.5 was unable to take CTD measurements, the nutricline depth from the World Ocean Atlas (WOA) might not accurately represent the actual nutricline depth during the transect, leading to potential changes in the predictive seasonal values. The intersection point of the two transects (∼ 10° S) also indicates minimal seasonal influence, with minimal response to POM and stoichiometric values, despite collection occurring in opposite site seasons. Using the values predicted by GAM for the same parameters, there was less than a 2 % difference in between fall and spring, indicating that some of the assumptions made with the predictors weakened the sensitivity of the model. Without this sensitivity, the predictive model suggests that the observed biogeography of is stable in most of the central Atlantic Ocean. In summary, we detect clear meridional, hemisphere, and zonal gradients in elemental stoichiometry that correspond to changes in nutrient supply and stress type, but additional factors may also provide a significant influence on regional shifts in across the Atlantic Ocean.
Our observations from the Atlantic Ocean have implications for predicting future changes to the ocean carbon cycle. Recent models have suggested that variability can buffer the effects of stratification and reduced nutrient supply on primary productivity and carbon sequestration (Kwon et al., 2022; Tanioka and Matsumoto, 2017). Such models of variability have so far been tied to surface phosphate concentrations (Galbraith and Martiny, 2015). However, our observations from the Atlantic Ocean indicate that subtle shifts between nitrogen and phosphorus stress can have additional impacts on the elemental stoichiometry. N2 fixation in the North Atlantic Ocean is likely responsible for part of the shift in nutrient stress type. The hemispheric variability in nutrient stress suggests an additional role of the iron supply in regulating . Thus, climate change may alter future patterns of as the perturbation of air–sea dynamics can modulate the strengths of boundary currents, the slope of a westward nutricline (Kelly et al., 2010), or the aeolian deposition of iron (Krishnamurthy et al., 2010). Such shifts in could, in turn, have large impacts on global nitrogen fixation, primary production, or carbon sequestration.
The AMT data set presented here is publicly hosted by the British Oceanographic Data Centre (https://doi.org/10.5285/b5900384-89f0-3a38-e053-6c86abc0409d, Larkin et al., 2020). Hydrographic data from the AMT28 transect are available at https://cchdo.ucsd.edu/cruise/74JC20180923 (British Oceanographic Data Centre, 2019). The particulate organic matter data from the C13.5 transect are available at https://www.bco-dmo.org/dataset/868908 (Martiny et al., 2020). Hydrographic data from C13.5 data are available at https://cchdo.ucsd.edu/cruise/33RO20200321 (British Oceanographic Data Centre, 2020). Nutricline depth for C13.5 is calculated from gridded annual mean nitrate data from the World Ocean Atlas 2018, available at https://www.ncei.noaa.gov/data/oceans/woa/WOA18/DATA/ (Garcia et al., 2019).
The supplement related to this article is available online at: https://doi.org/10.5194/bg-21-4239-2024-supplement.
AAL, NSG, and ACM planned the cruise studies; AAL, JAL, and NSG performed field measurements; AJF and TT analyzed the data; AJF wrote the manuscript draft; and TT and ACM reviewed and edited the paper.
The contact author has declared that none of the authors has any competing interests.
Publisher's note: Copernicus Publications remains neutral with regard to jurisdictional claims made in the text, published maps, institutional affiliations, or any other geographical representation in this paper. While Copernicus Publications makes every effort to include appropriate place names, the final responsibility lies with the authors.
We thank the Global Oceans Ship-Based Hydrographic Investigations Program (GO-SHIP) and the Atlantic Meridional Transect Programme for facilitating this project. We extend a special thanks to Andrew Rees, Glen Tarren, and the crew of the RSS James Clark and to Leticia Barbero and the crew of the R/V Roger Revelle. This study contributes to the international IMBeR project and is AMT contribution number 412.
This research has been supported by the National Science Foundation (grant nos. OCE-1848576 and 1948842), the Goddard Space Flight Center (grant no. 80NSSC21K1654), the National Oceanic and Atmospheric Administration (grant no. NA19NES4320002), the Simons Foundation (grant no. 724483), and the UK Research and Innovation (grant no. NE/R015953/1).
This paper was edited by Koji Suzuki and reviewed by two anonymous referees.
Babiker, I. S., Mohamed, M. A. A., Komaki, K., Ohta, K., and Kato, K.: Temporal Variations in the Dissolved Nutrient Stocks in the Surface Water of the Western North Atlantic Ocean, J. Oceanogr., 60, 553–562, https://doi.org/10.1023/B:JOCE.0000038348.66907.db, 2004.
British Oceanographic Data Centre: Hydrographic Cruise: 74JC20180923, CLIVAR and Carbon Hydrographic Data Office (CCHDO) [data set], https://doi.org/10.7942/C2D08M, 2019.
British Oceanographic Data Centre: Hydrographic Cruise: 33R020200321, CLIVAR and Carbon Hydrographic Data Office (CCHDO) [data set], https://doi.org/10.7942/C2894Z, 2020.
Browning, T. J. and Moore, C. M.: Global analysis of ocean phytoplankton nutrient limitation reveals high prevalence of co-limitation, Nat. Commun., 14, 5014, https://doi.org/10.1038/s41467-023-40774-0, 2023.
Capone, D. G.: An iron curtain in the Atlantic Ocean forms a biogeochemical divide, P. Natl. Acad. Sci. USA, 111, 1231–1232, https://doi.org/10.1073/pnas.1322568111, 2014.
Cavender-Bares, K. K., Karl, D. M., and Chisholm, S. W.: Nutrient gradients in the western North Atlantic Ocean: Relationship to microbial community structure and comparison to patterns in the Pacific Ocean, Deep-Sea Res. Pt. I, 48, 2373–2395, https://doi.org/10.1016/S0967-0637(01)00027-9, 2001.
Cermeño, P., Dutkiewicz, S., Harris, R. P., Follows, M., Schofield, O., and Falkowski, P. G.: The role of nutricline depth in regulating the ocean carbon cycle, P. Natl. Acad. Sci. USA, 105, 20344–20349, https://doi.org/10.1073/pnas.0811302106, 2008.
Clayton, S., Alexander, H., Graff, J. R., Poulton, N. J., Thompson, L. R., Benway, H., Boss, E., and Martiny, A.: Bio-GO-SHIP: The Time Is Right to Establish Global Repeat Sections of Ocean Biology, Front. Mar. Sci., 8, 67443, https://doi.org/10.3389/fmars.2021.767443, 2022.
Cotner, J., Ammerman, J., Peele, E., and Bentzen, E.: Phosphorus-limited bacterioplankton growth in the Sargasso Sea, Aquat. Microb. Ecol., 13, 141–149, https://doi.org/10.3354/ame013141, 1997.
Ducklow, H. and Dickson, A.: Shipboard sampling procedures, JGOFS, 1–210, 1994.
Galbraith, E. D. and Martiny, A. C.: A simple nutrient-dependence mechanism for predicting the stoichiometry of marine ecosystems, P. Natl. Acad. Sci. USA, 112, 8199–8204, https://doi.org/10.1073/pnas.1423917112, 2015.
Garcia, C. A., Baer, S. E., Garcia, N. S., Rauschenberg, S., Twining, B. S., Lomas, M. W., and Martiny, A. C.: Nutrient supply controls particulate elemental concentrations and ratios in the low latitude eastern Indian Ocean, Nat. Commun., 9, 4868, https://doi.org/10.1038/s41467-018-06892-w, 2018.
Garcia, H. E., Boyer, T. P., Baranova, O. K., Locarnini, R. A., Mishonov, A. V., Grodsky, A., Paver, C. R., Weathers, K. W., Smolyar, I. V., Reagan, J. R., Seidov, D., and Zweng, M. M.: WOA 2018, National Centers for Environmental Information [data set], https://www.ncei.noaa.gov/data/oceans/woa/WOA 18/DATA/ (last access: 3 September 2020), 2019.
Garcia, C. A., Hagstrom, G. I., Larkin, A. A., Ustick, L. J., Levin, S. A., Lomas, M. W., and Martiny, A. C.: Linking regional shifts in microbial genome adaptation with surface ocean biogeochemistry, Philos. T. R. Soc. B, 375, 20190254, https://doi.org/10.1098/rstb.2019.0254, 2020.
Isles, P. D. F.: The misuse of ratios in ecological stoichiometry, Ecology, 101, e03153, https://doi.org/10.1002/ecy.3153, 2020.
Kelly, K. A., Small, R. J., Samelson, R. M., Qiu, B., Joyce, T. M., Kwon, Y. O., and Cronin, M. F.: Western boundary currents and frontal air-sea interaction: Gulf stream and Kuroshio Extension, J. Clim., 23, 5644–5667, https://doi.org/10.1175/2010JCLI3346.1, 2010.
Kremling, K. and Streu, P.: Saharan dust influenced trace element fluxes in deep North Atlantic subtropical waters, Deep-Sea Res. Pt. I, 40, 1155–1168, https://doi.org/10.1016/0967-0637(93)90131-L, 1993.
Krishnamurthy, A., Moore, J. K., Mahowald, N., Luo, C., and Zender, C. S.: Impacts of atmospheric nutrient inputs on marine biogeochemistry, J. Geophys. Res., 115, G01006, https://doi.org/10.1029/2009JG001115, 2010.
Kwon, E. Y., Sreeush, M. G., Timmermann, A., Karl, D. M., Church, M. J., Lee, S.-S., and Yamaguchi, R.: Nutrient uptake plasticity in phytoplankton sustains future ocean net primary production, Sci. Adv., 8, eadd2475, https://doi.org/10.1126/sciadv.add2475, 2022.
Larkin, A., Lee, J. A., and Martiny, A.: Surface ocean particulate organic matter (POC, PON, and POP) from underway-collected samples along a north-south transect in the Atlantic Ocean on cruise AMT28/JR18001, British Oceanographic Data Centre, National Oceanography Centre [data set], NERC, UK, https://doi.org/10.5285/b5900384-89f0-3a38-e053-6c86abc0409d, 2020.
Lee, J. A., Garcia, C. A., Larkin, A. A., Carter, B. R., and Martiny, A. C.: Linking a Latitudinal Gradient in Ocean Hydrography and Elemental Stoichiometry in the Eastern Pacific Ocean, Global Biogeochem. Cy., 35, e2020GB006622, https://doi.org/10.1029/2020GB006622, 2021.
Lomas, M. W., Burke, A. L., Lomas, D. A., Bell, D. W., Shen, C., Dyhrman, S. T., and Ammerman, J. W.: Sargasso Sea phosphorus biogeochemistry: An important role for dissolved organic phosphorus (DOP), Biogeosciences, 7, 695–710, https://doi.org/10.5194/bg-7-695-2010, 2010.
Lomas, M. W., Bates, N. R., Johnson, R. J., Steinberg, D. K., and Tanioka, T.: Adaptive carbon export response to warming in the Sargasso Sea, Nat. Commun., 13, 1211, https://doi.org/10.1038/s41467-022-28842-3, 2022.
Löscher, C. R., Mohr, W., Bange, H. W., and Canfield, D. E.: No nitrogen fixation in the Bay of Bengal?, Biogeosciences, 17, 851–864, https://doi.org/10.5194/bg-17-851-2020, 2020.
Mahowald, N. M., Baker, A. R., Bergametti, G., Brooks, N., Duce, R. A., Jickells, T. D., Kubilay, N., Prospero, J. M., and Tegen, I.: Atmospheric global dust cycle and iron inputs to the ocean, Global Biogeochem. Cy., 19, GB4025, https://doi.org/10.1029/2004GB002402, 2005.
Marañón, E., Holligan, P. M., Varela, M., Mouriño, B., and Bale, A. J.: Basin-scale variability of phytoplankton biomass, production and growth in the Atlantic Ocean, Deep-Sea Res. Pt. I, 47, 825–857, https://doi.org/10.1016/S0967-0637(99)00087-4, 2000.
Martiny, A. C., Vrugt, J. A., Primeau, F. W., and Lomas, M. W.: Regional variation in the particulate organic carbon to nitrogen ratio in the surface ocean, Global Biogeochem. Cy., 27, 723–731, https://doi.org/10.1002/gbc.20061, 2013a.
Martiny, A. C., Pham, C. T. A., Primeau, F. W., Vrugt, J. A., Moore, J. K., Levin, S. A., and Lomas, M. W.: Strong latitudinal patterns in the elemental ratios of marine plankton and organic matter, Nat. Geosci., 6, 279–283, https://doi.org/10.1038/ngeo1757, 2013b.
Martiny, A. C., Vrugt, J. A., and Lomas, M. W.: Concentrations and ratios of particulate organic carbon, nitrogen, and phosphorus in the global ocean, Sci. Data, 1, 140048, https://doi.org/10.1038/sdata.2014.48, 2014.
Martiny, A. C., Lomas, M. W., Fu, W., Boyd, P. W., Chen, Y. L., Cutter, G. A., Ellwood, M. J., Furuya, K., Hashihama, F., Kanda, J., Karl, D. M., Kodama, T., Li, Q. P., Ma, J., Moutin, T., Woodward, E. M. S., and Moore, J. K.: Biogeochemical controls of surface ocean phosphate, Sci. Adv., 5, eaax0341, https://doi.org/10.1126/sciadv.aax0341, 2019.
Martiny, A., Garcia, N. S., Tanioka, T., and Fagan, A. J.: POM concentrations for carbon, nitrogen, and phosphorus from GO-SHIP Line C13.5/A13.5 in 2020, Biological and Chemical Oceanography Data Management Office (BCO-DMO) [data set], https://doi.org/10.26008/1912/bco-dmo.868908.1, 2020.
Mather, R. L., Reynolds, S. E., Wolff, G. A., Williams, R. G., Torres-Valdes, S., Woodward, E. M. S., Landolfi, A., Pan, X., Sanders, R., and Achterberg, E. P.: Phosphorus cycling in the North and South Atlantic Ocean subtropical gyres, Nat. Geosci., 1, 439–443, https://doi.org/10.1038/ngeo232, 2008.
Michaels, A. F. and Knap, A. H.: Overview of the U.S. JGOFS Bermuda Atlantic Time-series Study and the Hydrostation S program, Deep-Sea Res. Pt. II, 43, 157–198, https://doi.org/10.1016/0967-0645(96)00004-5, 1996.
Michaels, A. F., Knap, A. H., Dow, R. L., Gundersen, K., Johnson, R. J., Sorensen, J., Close, A., Knauer, G. A., Lohrenz, S. E., Asper, V. A., Tuel, M., and Bidigare, R.: Seasonal patterns of ocean biogeochemistry at the U.S. JGOFS Bermuda Atlantic time-series study site, Deep-Sea Res. Pt. I, 41, 1013–1038, https://doi.org/10.1016/0967-0637(94)90016-7, 1994.
Mills, M. M., Ridame, C., Davey, M., La Roche, J., and Geider, R. J.: Iron and phosphorus co-limit nitrogen fixation in the eastern tropical North Atlantic, Nature, 429, 292–294, https://doi.org/10.1038/nature02550, 2004.
Moreno, A. R., Larkin, A. A., Lee, J. A., Gerace, S. D., Tarran, G. A., and Martiny, A. C.: Regulation of the Respiration Quotient Across Ocean Basins, AGU Adv., 3, e2022AV000679, https://doi.org/10.1029/2022AV000679, 2022.
Neuer, S., Torres-Padrón, M. E., Gelado-Caballero, M. D., Rueda, M. J., Hernández-Brito, J., Davenport, R., and Wefer, G.: Dust deposition pulses to the eastern subtropical North Atlantic gyre: Does ocean's biogeochemistry respond?, Global Biogeochem. Cy., 18, GB4020, https://doi.org/10.1029/2004GB002228, 2004.
R Core Team: R: A Language Environment for Statistical Computing, R Foundation for Statistical Computing [code], https://www.R-project.org/ (last access: 25 January 2022), 2019.
Schlitzer, R.: Ocean Data View, Ocean Data View [code], https://odv.awi.de (last access: 8 March 2021), 2019.
Schlosser, C., Klar, J. K., Wake, B. D., Snow, J. T., Honey, D. J., Woodward, E. M. S., Lohan, M. C., Achterberg, E. P., and Mark Moore, C.: Seasonal ITCZ migration dynamically controls the location of the (sub)tropical Atlantic biogeochemical divide, P. Natl. Acad. Sci. USA, 111, 1438–1442, https://doi.org/10.1073/pnas.1318670111, 2014.
Singh, A., Baer, S. E., Riebesell, U., Martiny, A. C., and Lomas, M. W.: stoichiometry at the Bermuda Atlantic Time-series Study station in the North Atlantic Ocean, Biogeosciences, 12, 6389–6403, https://doi.org/10.5194/bg-12-6389-2015, 2015.
Steinberg, D. K., Carlson, C. A., Bates, N. R., Johnson, R. J., Michaels, A. F., and Knap, A. H.: Overview of the US JGOFS Bermuda Atlantic Time-series Study (BATS): a decade-scale look at ocean biology and biogeochemistry, Deep-Sea Res. Pt. II, 48, 1405–1447, https://doi.org/10.1016/S0967-0645(00)00148-X, 2001.
Swift, J.: CTD data from Cruise 74JC20180923 [data set], https://doi.org/10.7942/C2D08M, 2019.
Tanioka, T. and Matsumoto, K.: Buffering of Ocean Export Production by Flexible Elemental Stoichiometry of Particulate Organic Matter, Global Biogeochem. Cy., 31, 1528–1542, https://doi.org/10.1002/2017GB005670, 2017.
Tanioka, T. and Matsumoto, K.: A meta-analysis on environmental drivers of marine phytoplankton, Biogeosciences, 17, 2939–2954, https://doi.org/10.5194/bg-17-2939-2020, 2020.
Tanioka, T., Garcia, C. A., Larkin, A. A., Garcia, N. S., Fagan, A. J., and Martiny, A. C.: Global patterns and predictors of in marine ecosystems, Commun. Earth Environ., 3, 1–9, https://doi.org/10.1038/s43247-022-00603-6, 2022.
Ussher, S. J., Achterberg, E. P., Powell, C., Baker, A. R., Jickells, T. D., Torres, R., and Worsfold, P. J.: Impact of atmospheric deposition on the contrasting iron biogeochemistry of the North and South Atlantic Ocean, Global Biogeochem. Cy., 27, 1096–1107, https://doi.org/10.1002/gbc.20056, 2013.
Ustick, L. J., Larkin, A. A., Garcia, C. A., Garcia, N. S., Brock, M. L., Lee, J. A., Wiseman, N. A., Moore, J. K., and Martiny, A. C.: Metagenomic analysis reveals global-scale patterns of ocean nutrient limitation, Science, 372, 287–291, https://doi.org/10.1126/science.abe6301, 2021.
Utermöhl, H.: Zur Vervollkommnung der quantitativen Phytoplankton-Methodik, Int. Ver. The., 9, 1–38, https://doi.org/10.1080/05384680.1958.11904091, 1958.
Wang, W.-L., Moore, J. K., Martiny, A. C., and Primeau, F. W.: Convergent estimates of marine nitrogen fixation, Nature, 566, 205–211, https://doi.org/10.1038/s41586-019-0911-2, 2019.
Weber, T. S. and Deutsch, C.: Ocean nutrient ratios governed by plankton biogeography, Nature, 467, 550–554, https://doi.org/10.1038/nature09403, 2010.
Wood, S. N.: Generalized Additive Models, Chapman and Hall/CRC [code], https://doi.org/10.1201/9781315370279, 2017.
Yvon-Durocher, G., Dossena, M., Trimmer, M., Woodward, G., and Allen, A. P.: Temperature and the biogeography of algal stoichiometry, Global Ecol. Biogeogr., 24, 562–570, https://doi.org/10.1111/geb.12280, 2015.
Zwirglmaier, K., Heywood, J. L., Chamberlain, K., Woodward, E. M. S., Zubkov, M. V., and Scanlan, D. J.: Basin-scale distribution patterns of picocyanobacterial lineages in the Atlantic Ocean, Environ. Microbiol., 9, 1278–1290, https://doi.org/10.1111/j.1462-2920.2007.01246.x, 2007.