the Creative Commons Attribution 4.0 License.
the Creative Commons Attribution 4.0 License.
 | 02 Oct 2024
Tracing rate and extent of human-induced hypoxia during the last 200 years in the mesotrophic lake, Tiefer See (NE Germany)
Rik Tjallingii
Sylvia Pinkerneil
Birgit Schroeder
Marlen Albert
Rebecca Kearney
Oliver Heiri
Simona Breu
Achim Brauer
The global spread of lake hypoxia, [O2] < 2 mg L−1, during the last 2 centuries has had a severe impact on ecological systems and sedimentation processes. While the occurrence of hypoxia was observed in many lakes, a detailed quantification of hypoxia spread at centennial timescales remained largely unquantified. We track the evolution of hypoxia and its controls during the past 200 years in a lake, Tiefer See (TSK; NE Germany), using 17 gravity cores recovered from between 10 and 62 m water depth in combination with lake monitoring data. Lake hypoxia was associated with the onset of varve preservation in the TSK and has been dated by varve counting to 1918 ± 1 at 62 m water depth and reached a lake floor depth of 16 m in 1997 ± 1. This indicates that oxygen concentration fell below the threshold for varve preservation at the lake floor (> 16 m). Sediment cores at 10–12 m depth do not contain varves indicating good oxygenation of the upper-water column. Monitoring data show that the threshold for hypoxia, and the intensity and duration of hypoxia which are sufficient for varve preservation, is a period of 5 months of [O2] < 5 mg L−1 and 2 months of [O2] < 2 mg L−1. Detailed total organic carbon (TOC), , and X-ray fluorescence (XRF) core scanning analyses of the short cores indicate that the decline in dissolved oxygen (DO) started several decades prior to the varve preservation. This proves a change in the depositional conditions in the lake, following a transition phase of several decades during which varves were not preserved. Furthermore, varve preservation does occur at seasonal stratification and does not necessarily require permanent stratification.
- Article
(13915 KB) - Full-text XML
-
Supplement
(963 KB) - BibTeX
- EndNote


The vertical distribution of dissolved oxygen (DO) in lakes and shallow-marine environments is among the most important factors regulating the ecology, biogenic and chemical conditions, primary sedimentation and diagenesis of sediments in such environments (Tyson and Pearson, 1991; Shatkay et al., 1993; Diaz and Rosenberg, 1995; Dräger et al., 2017; O'Reilly et al., 2015; Wetzel, 2001; Nürnberg, 2004). The development of hypoxic conditions in lakes, [O2] < 2 mg L−1 (Tyson and Pearson, 1991; Nürnberg, 2004; Vaquer-Sunyer and Duarte, 2008), during the last ∼ 200 years is a threat for ecological and sedimentary systems. It is driven by both natural and anthropogenic pressure (Diaz and Rosenberg, 2008; Jenny et al., 2016b), such as climate warming (Jankowski et al., 2006; Njiru et al., 2012; Meire et al., 2013; Jane et al., 2021), enhanced water column stratification, and decreased lake circulation (Straile et al., 2003; Jankowski et al., 2006) nutrient input increasing the primary productivity and decomposition of organic matter (Kienel et al., 2013; Dräger et al., 2017), and water–sediment interactions (Steinsberger et al., 2017). Hypoxic conditions in lakes support the burial and preservation of organic matter (OM) in lacustrine records over 102–103-year timescales (Arthur and Dean, 1998; Dräger et al., 2017). The burial of OM in lacustrine sediments contributes to the global carbon fixation, and it is estimated to reach half the carbon fixation in the oceans (Mulholland and Elwood, 1982; Dean and Gorham, 1998; Tranvik et al., 2009; Kastowski et al., 2011; Mendonça et al., 2017), due to the high OM productivity in lakes (Tyson and Pearson, 1991) and the high burial efficiency under hypoxic conditions (Sobek et al., 2009). To improve the evaluation of organic carbon fixation in lake sediments and how the efficiency of organic carbon fixation in lakes changes between oxygenated and hypoxic intervals, an accurate and high-resolution quantification of the rate and intensity of hypoxia spread in lakes and a good evaluation of OM productivity, accumulation, and preservation in lake sediments are required.
Over the years, attempts to reconstruct past oxygen level (paleoredox conditions) in lakes used diverse sedimentological, geochemical and biological proxies (Anderson and Dean, 1988; Ojala et al., 2000; Friedrich et al., 2014; Dräger et al., 2017; Buatois et al., 2020; Dräger et al., 2019; Teranes and Bernasconi, 2005; Jenny et al., 2013; Makri et al., 2021; Ursenbacher et al., 2020; Sorrel et al., 2021). Laminae preservation along lacustrine successions indicates the absence of bioturbating organisms, while non-laminated intervals reflect a DO level sufficient for the existence of bioturbation organisms in cases where the homogenous texture does not originate from mass transport deposits (Kelts and Hsü, 1978; Tyson and Pearson, 1991; Schaffner et al., 1992; Diaz and Rosenberg, 1995; Ojala et al., 2000; Tylmann et al., 2012; Kienel et al., 2013; Jenny et al., 2013; Friedrich et al., 2014; Zolitschka et al., 2015). Low-oxygen conditions in the sediment–water interface during laminated sediment intervals are further supported by high bulk sediment total organic carbon (TOC) concentrations within these sediments due to the reduced organic matter (OM) decomposition (Diaz and Rosenberg, 1995; Arthur and Dean, 1998; Dräger et al., 2017). As a result, a more negative composition is measured on laminated intervals with higher TOC content because OM degradation selectively degrades organic compounds with a more negative δ13C composition; thus, the value of the remaining OM fraction becomes less negative in non-laminated intervals (Mollenhauer and Eglinton, 2007; Dräger et al., 2017; Benner et al., 1987; Lehmann et al., 2002; Spiker and Hatcher, 1987). Therefore, analyses allow us to determine whether high TOC concentrations increased production or preservation. An additional method for reconstructing the oxygen level in lakes is by analyzing the abundance of redox-sensitive elements in the sediments through X-ray fluorescence (XRF) scans of sediment cores (Evans et al., 2019; Sanchini et al., 2020; Zander et al., 2021; Sorrel et al., 2021; Makri et al., 2021). The element data allow a continuous and high-resolution reconstruction of paleoredox conditions rather than the binary laminated non-laminated perspective. Specifically, the ratio between Fe and Mn is often used for paleoredox reconstructions because of the differential re-mobilization of Fe and Mn under redox conditions (Loizeau et al., 2001; Żarczyński et al., 2019; Makri et al., 2021; He et al., 2023; Naeher et al., 2013), although the ratio remains a proxy for relative changes in the sediment redox state. The abundance of oxygen-sensitive bioturbating organisms in lakes was used for the DO level reconstruction (e.g., Ursenbacher et al., 2020). In temperate regions, chironomid species during their larval stage serve as one of the main bioturbating organisms in lakes. Remains of these larvae preserve well in the sediments, and their analysis therefore potentially allows reconstructions of past DO concentrations as well and enables us to link the spread of hypoxic conditions to laminated intervals (Davies, 1976; Heinis and Davids, 1993; Brodersen et al., 2004; Ursenbacher et al., 2020). However, the abovementioned methods were commonly applied on a single-sediment core from the deepest part of the lake basin so that the rate of the spatiotemporal spread of hypoxia remained unknown. In this study, we apply a multi-proxy approach on multiple sediment cores from the entire lake basin at different water depths.
Annually laminated or varved lake sediments are unique high-resolution archives to reconstruct the intensity of hypoxia and evaluate the rate at which hypoxic conditions spread (Dräger et al., 2019). Reconstructing the rate and extent of hypoxia in lakes provide a valuable basis for sustainable development, biological conservation, and evaluating anthropogenic pressure on the environment (Njiru et al., 2012; Jenny et al., 2016b). This study addresses open questions on the spatiotemporal evolution of hypoxia within a lake and critical conditions for initiating the preservation of varved sediments. The main objective of this study is to reconstruct the spatiotemporal spread of hypoxia in Tiefer See during the last 2 centuries in detail and to decipher the response of the sedimentary system to depleted DO levels. Moreover, we wish to identify thresholds for hypoxia spread in the lake using present-day monitoring data. Finally, we want to test the common approach of using varve preservation as proxy for a hypoxic lake regime. Our approach combines the microfacies and geochemical analyses of 17 gravity sediment cores from different water depths and locations within the lake basin with lake-water-monitoring data. The results are supported by paleoecological analyses (subfossil chironomids) from selected samples of two of the cores to support the interpretation of changing DO levels at these sites.
Tiefer See (TSK; 53°35.50′ N, 12°31.80′ E; 62 m a.s.l.) is located in the northeastern German lowlands (Fig. 1a), is part of the Klocksin lake chain, and was formed within a subglacial channel system at the end of the last glaciation. It has an elongated axis oriented north–south, with steep slopes in the east–west directions (Fig. 1b), and has a surface area of 0.75 km2. The modern lake has a maximum depth of 62 m and is an ideal site to link environmental conditions to the preservation of laminated sediments (Roeser et al., 2021). The lake has relatively wide and shallow margins (Fig. 1), and the deepest part of the lake (31–62 m) includes only small part of the lake's area (∼ 16 %) and water volume (∼ 10 %). Only negligible inflow enters the lake directly from another lake, Flacher See, and the small catchment area (∼ 5.2 km2) is dominated by glacial till of the terminal moraine. This area is presently used as arable land, whereas the lake shorelines are covered by a narrow band of large alder, ash, and oak trees (Kienel et al., 2013).
The TSK is a mesotrophic–monomictic lake with a stratified water column from March to October, while the water column is well mixed from November to February (Roeser et al., 2021). This limnologic mode has a significant impact on lake's circulation, oxygenation of the water column, and endogenic mineral formation. Present-day annually laminated sedimentation comprises an early spring diatom sub-layer, a late spring–early summer endogenic calcite sub-layer (Roeser et al., 2021; Kienel et al., 2017), and an autumn–winter mixed layer of organic matter and littoral calcite sub-layer (Roeser et al., 2021). The three layers closely follow the annual stratification and oxygenation of the lake, with thermal stratification strengthening during spring and summer and a well-mixed water column during autumn and winter. Allogenic sedimentation, such as dust influx and sediment transport by surface runoff is negligible. In the last 2 centuries, the lake surroundings experienced an increased anthropogenic pressure that led to an increased nutrient flux into the lake from anthropogenic fertilizers and manure (Kienel et al., 2013). As a result, the lake experienced eutrophication with an increased OM flux and seasonal diatom blooms (Kienel et al., 2017). Following the increasing OM flux to the lake floor, the consumption of oxygen at the lake floor increased substantially, leading to prevailing hypoxic conditions.
The TSK Holocene sediment record is characterized by frequent alternations between varved and homogeneous non-varved intervals (Dräger et al., 2017, 2019). Varved intervals are associated with A high TOC content of ∼ 15 % and more negative (−32 ‰), while sediments of non-varved intervals are characterized by a lower TOC content of ∼ 5 % and a less negative (−28 ‰) (Dräger et al., 2019). The preservation of a varved interval is attributed to the prevailing hypoxic conditions (Dräger et al., 2017) and indicates that the TSK is sensitive to various processes that regulate oxygen levels along the water column.
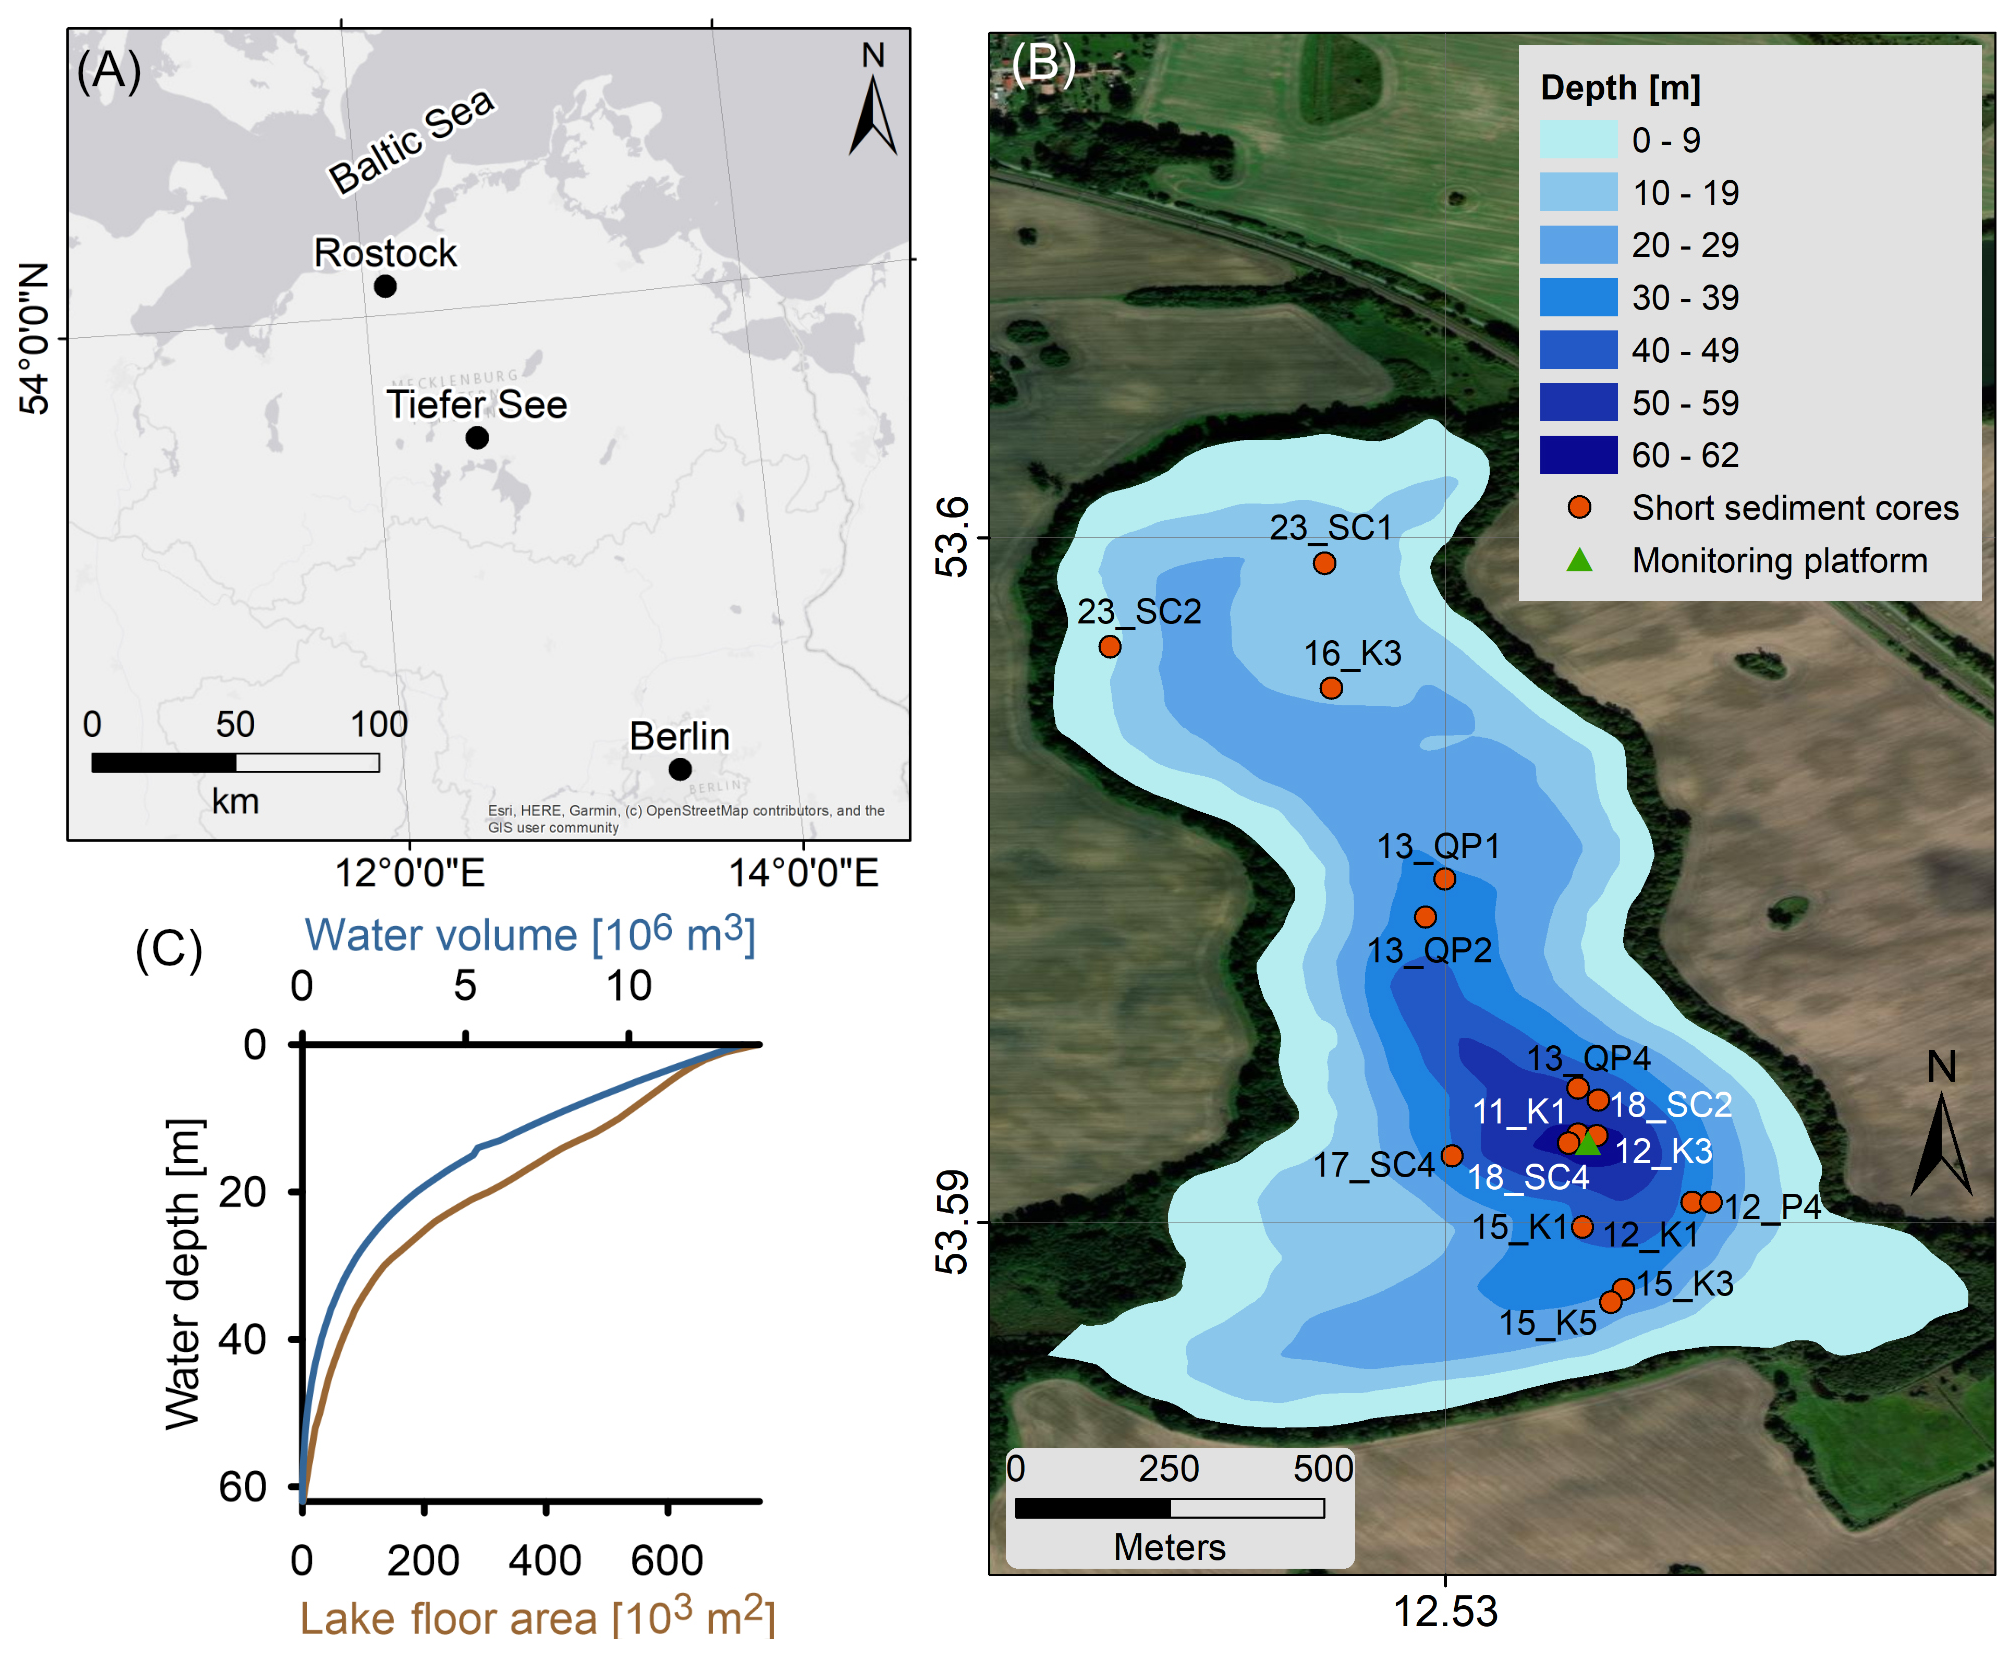
Figure 1Location map of the TSK. (a) The lake is located in the southern Baltic region, occupying a subglacial channel system. (b) TSK bathymetry, short cores, and monitoring system locations. (c) The hypsometric curve of the lake. Photo sources: Esri, Earthstar Geographics, and the GIS user community.
In this study, we apply a novel combination of three independent high-resolution proxies for hypoxia: (i) varve preservation and counting based on microfacies analyses that provide a robust time constrain, (ii) high-resolution geochemical depth profiles that allow us to quantify the spread of hypoxia in the lake, and (iii) faunal remains that are an indication of potential burrowing organisms. This combination is applied for sediment cores from different water depths and locations within the lake basin (Fig. 1). For selected cores and intervals, we also analyzed the remains of chironomid larvae in the sediments; this is one of the main bioturbating organism groups in TSK that is expected to change in its abundance and species composition with changing DO. In order to quantify present-day seasonal variations in hypoxia, we use lake water monitoring data. All analyses were conducted at the GeoForschungsZentrum (GFZ) in Potsdam, Germany, except for the chironomid analysis that was carried out at the geoecology group at the University of Basel.
3.1 Sediment cores
In total, 17 short cores were taken with a 90 mm UWITEC gravity corer (Dräger et al., 2019), during the period from 2011–2023 at different locations and water depths, between 10–62 m (Fig. 1) and covered the recent varved interval in the lake. Each one of the cores is documented by the location, water depth [m], core length [cm], and thin section length [cm]. After recovery, the cores were left to settle in a cold room in a vertical position at a temperature of 4 °C for 2 weeks before core opening and sampling (Roeser et al., 2021).
3.2 Microfacies analyses
From 16 of the cores, 46 overlapping thin sections (100×25 mm) were prepared, following the standard procedure for soft sediments based on the freeze-drying technique and impregnation with epoxy resin (Brauer and Casanova, 2001). The thin sections were used for varve counting based on the microscopic identification of seasonal layers to achieve a robust chronology of the upper varved unit. For an overview, thin sections were first scanned on a standard flatbed scanner with 1200 dpi resolution. Varve counting was carried out using two different types of microscopes, namely a Zeiss Axio Zoom V16 and an Olympus DP72 with non-polarized, semi-polarized, and polarized light. For each core, a composite profile of a series of overlapping thin sections was established by microscopic correlation. Varve counting was carried out on these continuous thin section profiles for each gravity core.
3.3 Chronology
The chronology of the cores is based on three methods: (i) varve counting, (ii) core correlation by marker layers, and (iii) tephrochronology. Varve counting and core correlation were applied to acquire the chronology of the laminated interval, and tephrochronology was used to acquire an age anchor in the non-laminated sediments.
3.3.1 Varve counting, marker layers identification, and core correlation
We adopt the varve facies model from Roeser et al. (2021) for varve counting in large-scale (10 cm long) thin sections using a petrographic microscope. Varve counting along the Holocene record of the TSK was proven reliable and was validated by radiocarbon dating and tephrochronology (Brauer et al., 2019); thus, we adopt this technique. Marker layers (MLs) are distinct layers or sequences of laminae that can be identified in thin sections (only few are also macroscopically visible) and serve for core correlation. MLs are considered isochrons, and their age is determined by varve counting. MLs were initially defined in core TSK11-K1, due to its excellent recovery and its location in the deepest part of the lake (Fig. 1), with a single ML that was identified in core TSK18-SC4; this core allows us to complete the varve-counting process until 2018, thus covering the entire recent hypoxic period. The age uncertainty is estimated by the uncertainty in the number of varves counted in core TSK11-K1 between two consecutive MLs. Due to the very good preservation of the varves, the dating uncertainty is below 1 %.
3.3.2 Tephrochronology
Tephrochronology was applied for three cores from intermediate water depths (TSK12-K1 water depth 35.1 m; TSK13-QP1 water depth 30.3 m; TSK15-K5 water depth 27.3 m) to identify the Askja (Iceland) eruption from 1875 CE as an independent isochrone. Previous work by Wulf et al. (2016) has identified the Askja 1875 as a cryptotephra layer in the core TSK11-K1. From each of the cores in this study, five continuous 1 cm interval samples were analyzed from the age–depth interval, which is expected to include the Askja 1875 tephra. The extraction of these microscopic glass shards from the sediment samples used the adapted methods outlined in Blockley et al. (2005). The volcanic glass shards were then identified via microscopy before being physically extracted, using the method outlined in Lane et al. (2014). The major and minor elemental composition of the individual shards was measured using the electron probe microanalysis (EPMA) conducted by the JEOL JXA 8230 instrument at GFZ Potsdam. The operating conditions were a beam size of 5–10 µm with 15 kV voltage and a 10 nA beam current. The count times were 20 s for Fe, Ti, Mg, Mn, Cl, and P and 10 s for Si, Al, K, Ca, and Na. The machine was calibrated using the glass standards of MPI-DING glasses ATHO-G, StHs-6-80, and GOR-132-G (Jochum et al., 2006), as well as Lipari obsidian (Hunt and Hill, 1996), with measurements taken on these glasses during the run to ensure precision and accuracy.
3.4 Geochemical sediment characterization
3.4.1 XRF scanning
Element maps were acquired on impregnated sediment blocks, which are the residual counter parts of the thin sections, using a Bruker M4 Tornado micro-XRF scanner. The XRF element maps allow a direct comparison of the geochemical composition and thin-section observations of individual layers. Elemental XRF mapping analyses were performed in a vacuum chamber at 50 µm resolution with a Bruker M4 Tornado micro-XRF scanner. This micro-XRF scanner is equipped with an Rh X-ray source that is operated at 50 kV and 0.60 mA. The polycapillary X-ray optics produce a high-intensity irradiation spot of about 20 µm that allows fast measurement times of 50 ms.
Continuous element records were acquired every 0.2 mm, directly at the split core surface, using an ITRAX XRF core scanner. These non-destructive analyses were performed with an Rh X-ray source (30 kV and 60 mA) for 4 s after careful cleaning and covering the core surface with XRF-transparent foil to prevent the desiccation of the core during the measurements. In addition to the continuous XRF measurements, two to three selected intervals of ca. 2 cm long were selected to obtain replicate measurements.
Generally, XRF core scanning measurements cover the elements from aluminum (Al) through zircon (Zr), but only the elements Si, S, K, Ca, Ti, Mn, Fe, and Sr were selected, based on the relative standard deviations (< 25 %) calculated from 3-fold replicate measurements. Element intensity records – in counts per second (cps) – contain information on the relative element concentration but are also influenced by changes in the physical sediment properties and matrix absorption and enhancement effects (Tjallingii et al., 2007). However, log ratios of element intensities are linear functions of log ratios of concentrations and also allow consistent statistical analysis of compositional data (Weltje et al., 2015). Therefore, statistical analyses were performed after a center-log-ratio transformation (Bertrand et al., 2024) of the selected element intensities using the Xelerate software package (Weltje et al., 2015). Element correlations were explored using the a–d PCA (principal component analysis) biplot, and Ward's hierarchical clustering was used for the geochemical characterization of sediment cores. The statistical analyses were performed on the XRF data of all the selected cores to reveal the similarities and differences for all sediments within the lake system.
3.4.2 TOC, δ13Corg, and CaCO3 determination
Five short cores (TSK11-K1, TSK12-K1, TSK13-QP1, TSK15-K5, and TSK23-SC2) were sampled for the purpose of determining TOC, , and CaCO3 profiles for contiguous 1 cm3 samples.
Total carbon (TC), total organic carbon (TOC), and δ13Corg were determined using an elemental analyzer (FlashEA 1112) connected with a ConFlo IV interface on a DELTA V Advantage IRMS (isotope ratio mass spectrometer; Thermo Fisher Scientific) at the GFZ, Sect. 4.3, in Potsdam, Germany. For TC, up to 2 mg sample material was loaded into tin capsules and combusted in the elemental analyzer. The calibration was performed using urea and checked with a soil reference sample (Boden3; HEKAtech). The TOC contents and δ13Corg values were determined on in situ decalcified samples. Around 3 mg of the sample material were weighted into Ag capsules, dropped first with 3 % and second with 20 % HCl, heated for 3 h at 75 °C, and finally wrapped and measured as described above. The calibration was performed using elemental (urea) and certified isotope standards (IAEA-CH-7) and checked with an internal reference sample. The isotopic composition is given in delta notation relative to a standard is δ (‰) = , and the reproducibility for replicate analyses is 0.2 % for TOC and 0.2 ‰ for δ13Corg. Calcite contents were calculated by obtaining the total inorganic carbon content (TIC = TC − TOC) and multiplying it by 8.33, which is the fraction of molar mass of the inorganic carbon from the CaCO3.
3.5 Chironomid analysis
The abundance and taxonomic composition of chironomid remains were analyzed for selected subsamples from varved and non-varved sediment sections in two sediment cores, namely the shallow TSK15-K5 (27.3 m) and the deep TSK18-SC4 (61.1 m). Six sediment samples were analyzed in each core, with 2 cm3 of sediment processed for all samples, except the deepest sample in core TSK-K5, where only 1 cm3 was analyzed. Three samples were taken from the top varved unit and three from the non-varved unit below. Sediments were washed through a 100 µm sieve, and the sieve residue was then examined under a stereomicroscope (Leica DM2500) at 20–40× magnification using a Bogorov counting tray. Chironomid remains were sorted from other remains, mounted in Euparal mounting medium, and identified at 100–400× magnification under a compound microscope. The remains were identified to morphotypes according to Brooks et al. (2007). Larval remains were classified into taxa that can colonize deepwater (profundal) environments in lakes and taxa restricted to shallow water (littoral environments), based on Brooks et al. (2007), Wiederholm (1983), and Saether (1979). Concentrations were calculated by dividing chironomid counts by the analyzed sediment volume, and influx values were calculated by multiplying the concentrations with estimated sediment accumulation rates in centimeters per year. Interpretations focus on the overall concentrations, percentage abundances, and influx values of the sum of the profundal chironomids and selected profundal chironomid taxa.
3.6 Monitoring data
An observational setup, based on a research platform at the deepest part of the lake that has been used for high-resolution limnological–sedimentological monitoring since 2012, provides the data used in this study (Roeser et al., 2021). Temperature and oxygen profiles of the water column were measured every 12 h with an automatic water probe (YSI 6600 V2; Yellow Springs, OH, USA). These data are used to trace the evolution of the summer thermal stratification over time. CaCO3 and TOC contents and of modern sediments were measured on sediment samples collected bi-weekly by a sediment trap at a water depth of 50 m. The sediment sampling was conducted at intervals of 15 d with an automated sequential trap (Technicap PPS 3/3; active area 0.125 m2) equipped with 12 sample bottles.
4.1 stratigraphy
A total of 15 cores retrieved from a water depth > 12 m contain the uppermost varved interval (Fig. 2). Two cores retrieved from <12 m water depth (TSK23-SC1/SC2) do not contain a varved unit. Except for the two cores without a varved unit, all cores depict a similar sediment sequence consisting of three units. The basal unit B, composed of homogeneous dark brown sediments, is overlain by unit G of homogenous grayish sediments, followed by the varved unit V on top. The thickness of unit V ranges between 4.5 cm in the shallowest core (TSK16-K3) from 16 m water depth and 40 cm in the deepest core (TSK11-K1) from 62 m water depth. In contrast, unit G is thicker in the shallow-water cores (13–15 cm) than in the depocentral cores (2 cm).
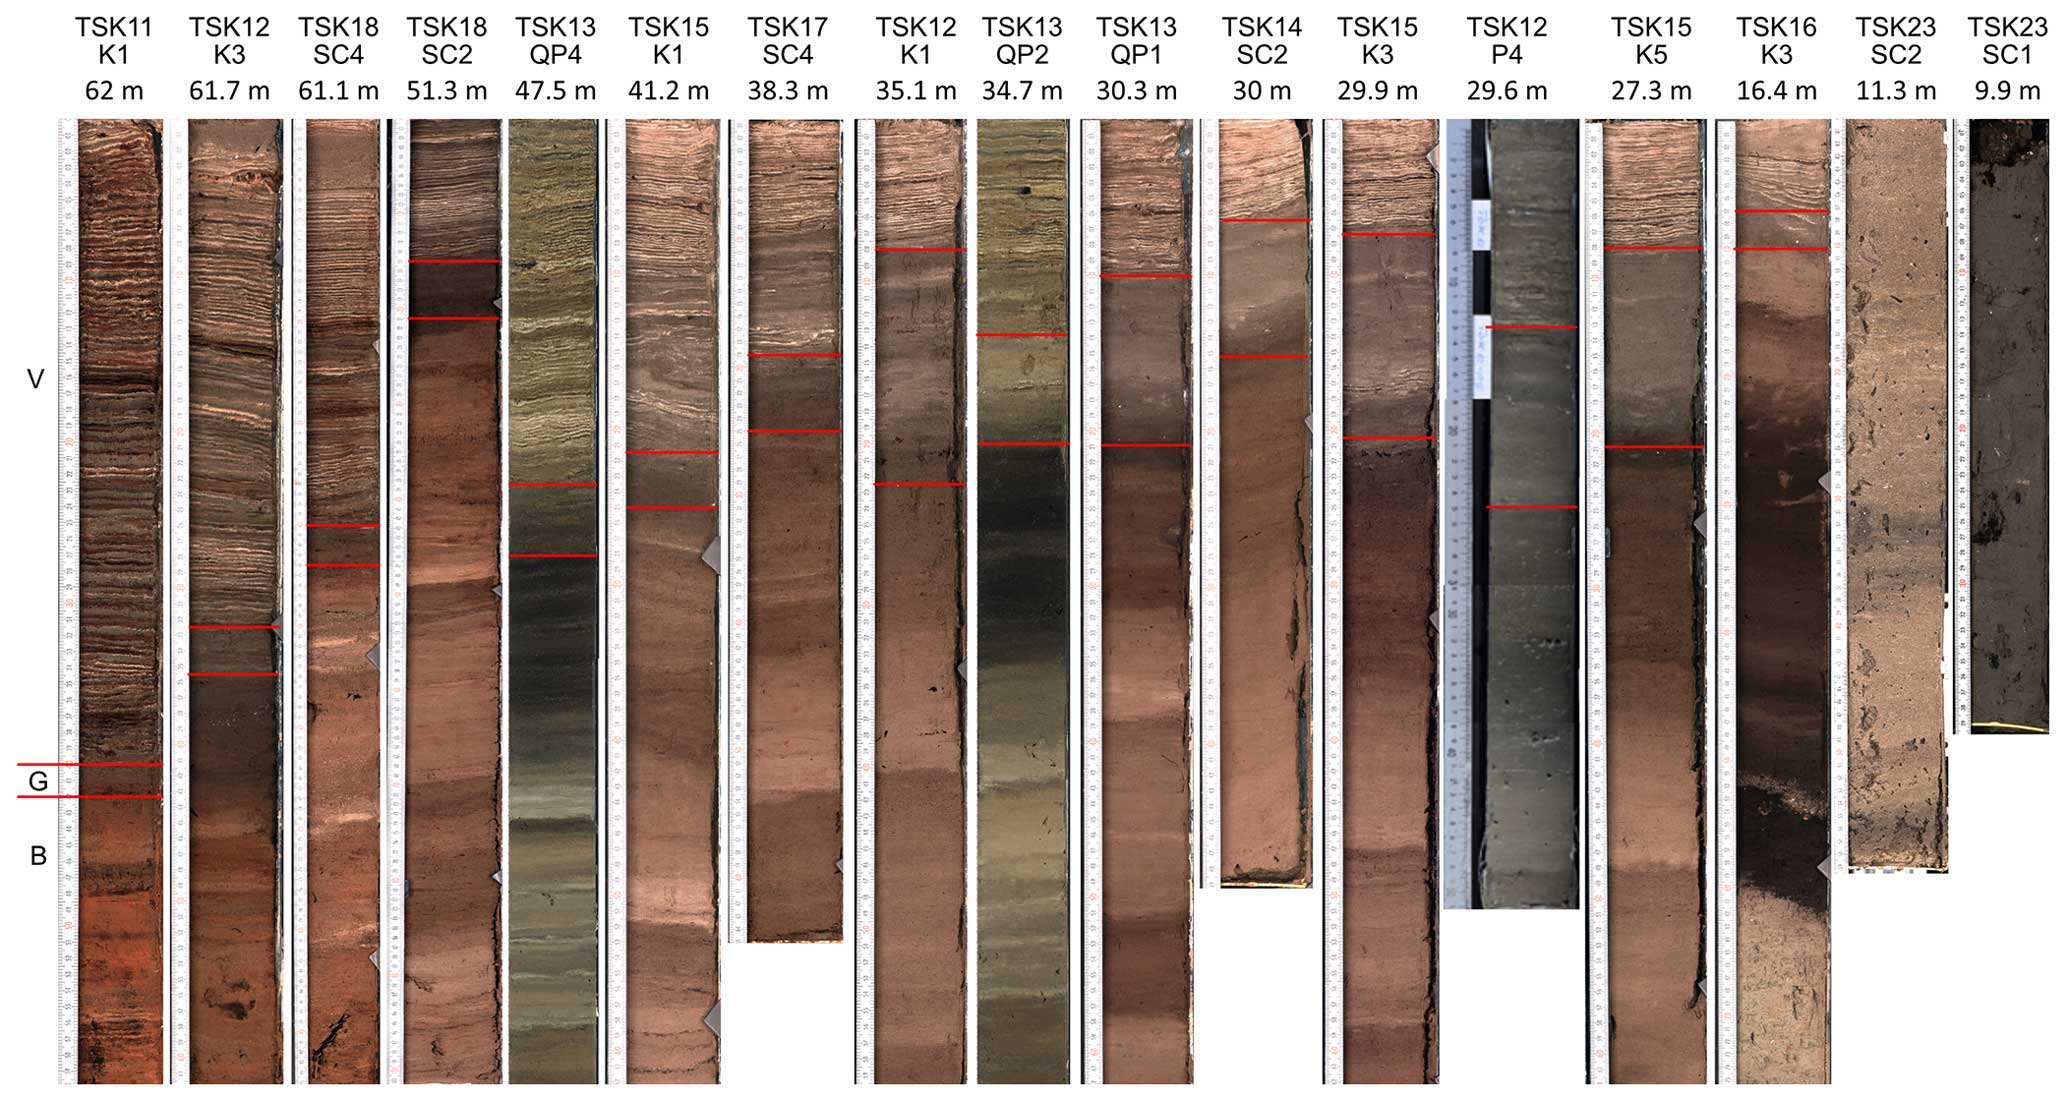
Figure 2Core images of all short cores used in this study arranged from deep to shallow. V – varved unit at the top of each core; G – gray unit; B – brown unit.
4.2 Varve composition
The upper laminated unit is mainly composed of biogenic–calcareous varves, as defined in the lake by Roeser et al. (2021), as a trifecta of diatom-rich, calcite-rich, and resuspension sub-layers (Fig. 3). Micro-XRF maps display the abundance of Ca and Si as an indication of the calcite and diatom layers. They show that these elements concentrate along distinct laminae, emphasizing the seasonal deposition of calcite and diatoms. While the diatom and calcite sub-layers are very distinct in the micro-XRF scans due to the high abundance of Ca and Si, the mixed layer is rich in organic materials, with only minor calcite crystals and diatom frustules, and thus less distinct. The biogenic–calcareous varve type is deposited and preserved at both the deep and the shallow regions of the lake floor (Fig. 3).
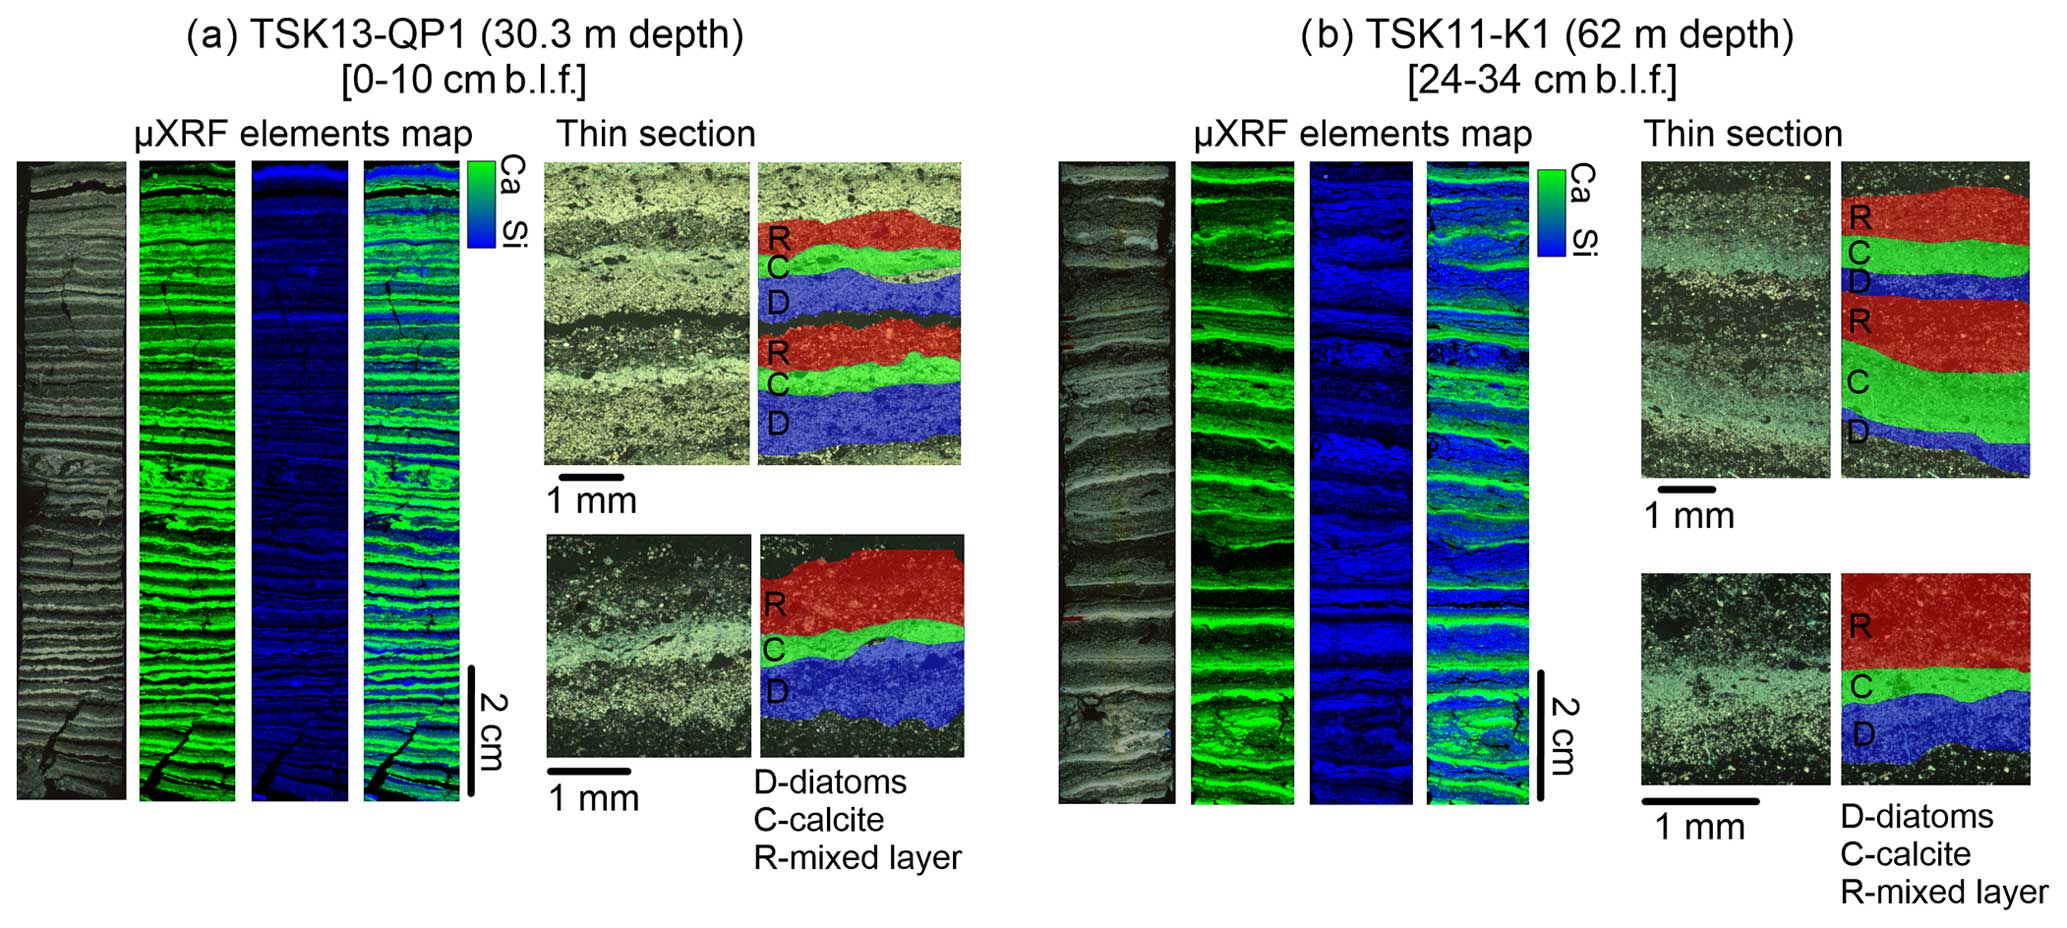
Figure 3Typical varves in TSK displayed by the thin-section images and micro-XRF mapping results of Ca and Si as deposited at the (a) shallow-water depth and (b) a deeper part of the lake.
4.3 Core chronology
The cores were dated by the following three methods: (i) varve counting, (ii) core correlation by marker layers, and (iii) tephrochronology. Varve counting and core correlation were applied on 14 cores to determine the age of the onset of varve preservation. The age of the boundary between units B and G has been obtained for four cores (TSK11-K1 (62 m), TSK12-K1 (35.1 m), TSK13-QP1 (30.3 m), and TSK15-K5 (27.3 m)) by tephrochronology.
4.3.1 Chronology of the varved sediments (unit V)
Varve counting and marker layers – TSK11-K1 master core
Core TSK11-K1 (obtained in 2011) has been selected as a master core, where 10 marker layers (ML1–ML10) were defined and varve-dated (Fig. 4; see Table S1 in the Supplement). In addition, ML0, formed in 2011, was identified in core TSK18-SC4, which was obtained in 2018. ML0 is the anchor point of the varve chronology, with varves between 2011 and 2018 counted in core TSK18-SC4 (61.1 m) and older varves in core TSK11-K1 (62 m). Varve counting in core TSK11-K1 yields a total of 93 ± 1 varves; thus, this dates the onset of varve preservation to 1918 CE ± 1 year.
Stratigraphic correlation
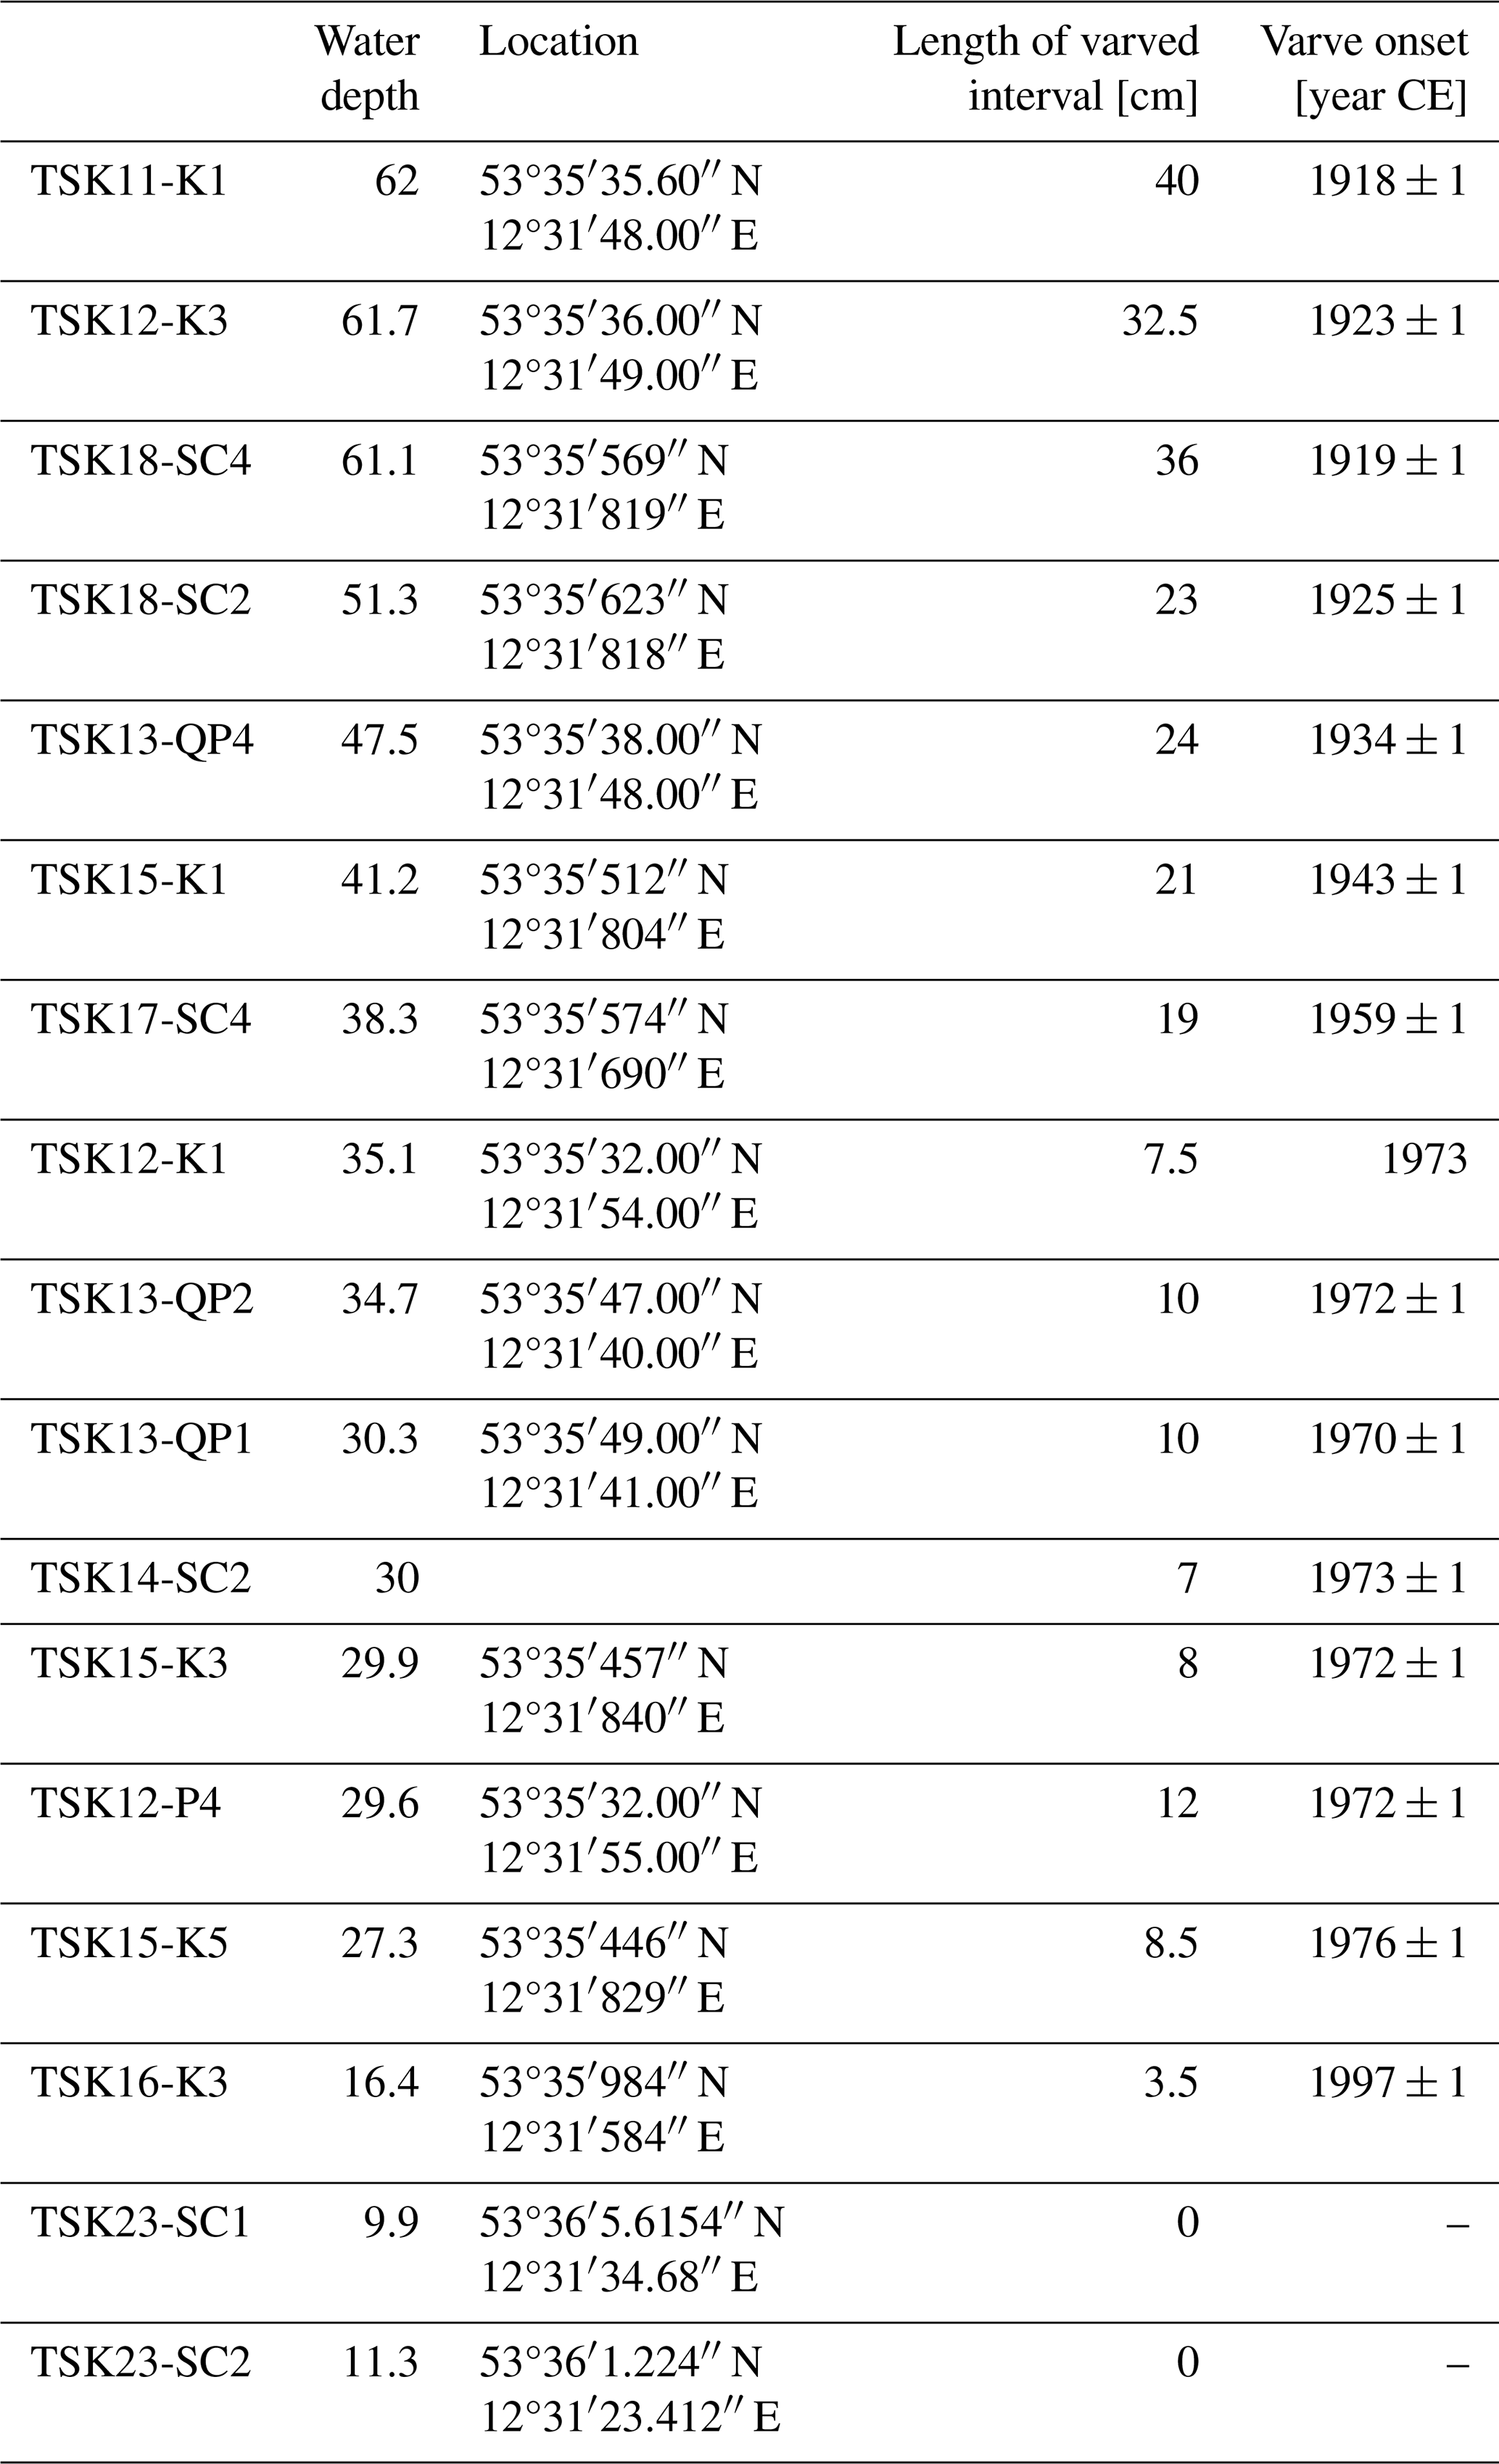
The onset of varve preservation was independently established in all cores and confirmed by the marker layers (Fig. 5; Fig. S1). In addition to the master core, two cores, TSK12-K3 and TSK18-SC4, are also located in the deepest part of the lake at water depths of 61–62 m. A local event layer, triggered by a thunderstorm in 2011 and occurring in core TSK18-SC4, serves as an additional marker layer (ML0) with a known age. The onset of varve preservation in the deepest part of the lake in these cores is independently obtained by microscopic varve counting at 1923 CE ± 1 (TSK12-K3) and 1919 CE ± 1 (TSK18-SC4); thus, the results are within the uncertainty in the onset of varve preservation in TSK11-K1 (1918 CE ± 1) and an earlier published age of 1924 (Dräger et al., 2019). From the deepest part of the lake towards shallower depths, the onset of varve preservation becomes progressively younger (Fig. 6 and Table 1). The onset of varve preservation at TSK18-SC2 (51.3 m depth) was dated to 1925 CE ± 1; at TSK15-K1 (41.2 m depth) to 1943 CE ± 1; at TSK14-SC2 (30 m depth) to 1973 CE ± 1; and at the shallowest core site, TSK16-K3 (16.4 m depth), the onset of varve preservation was dated to 1997 CE ± 1. No varves were identified in the top sediments of the shallowest two cores, TSK23-SC1 and TSK23-SC2, from water depths of 10–12 m.
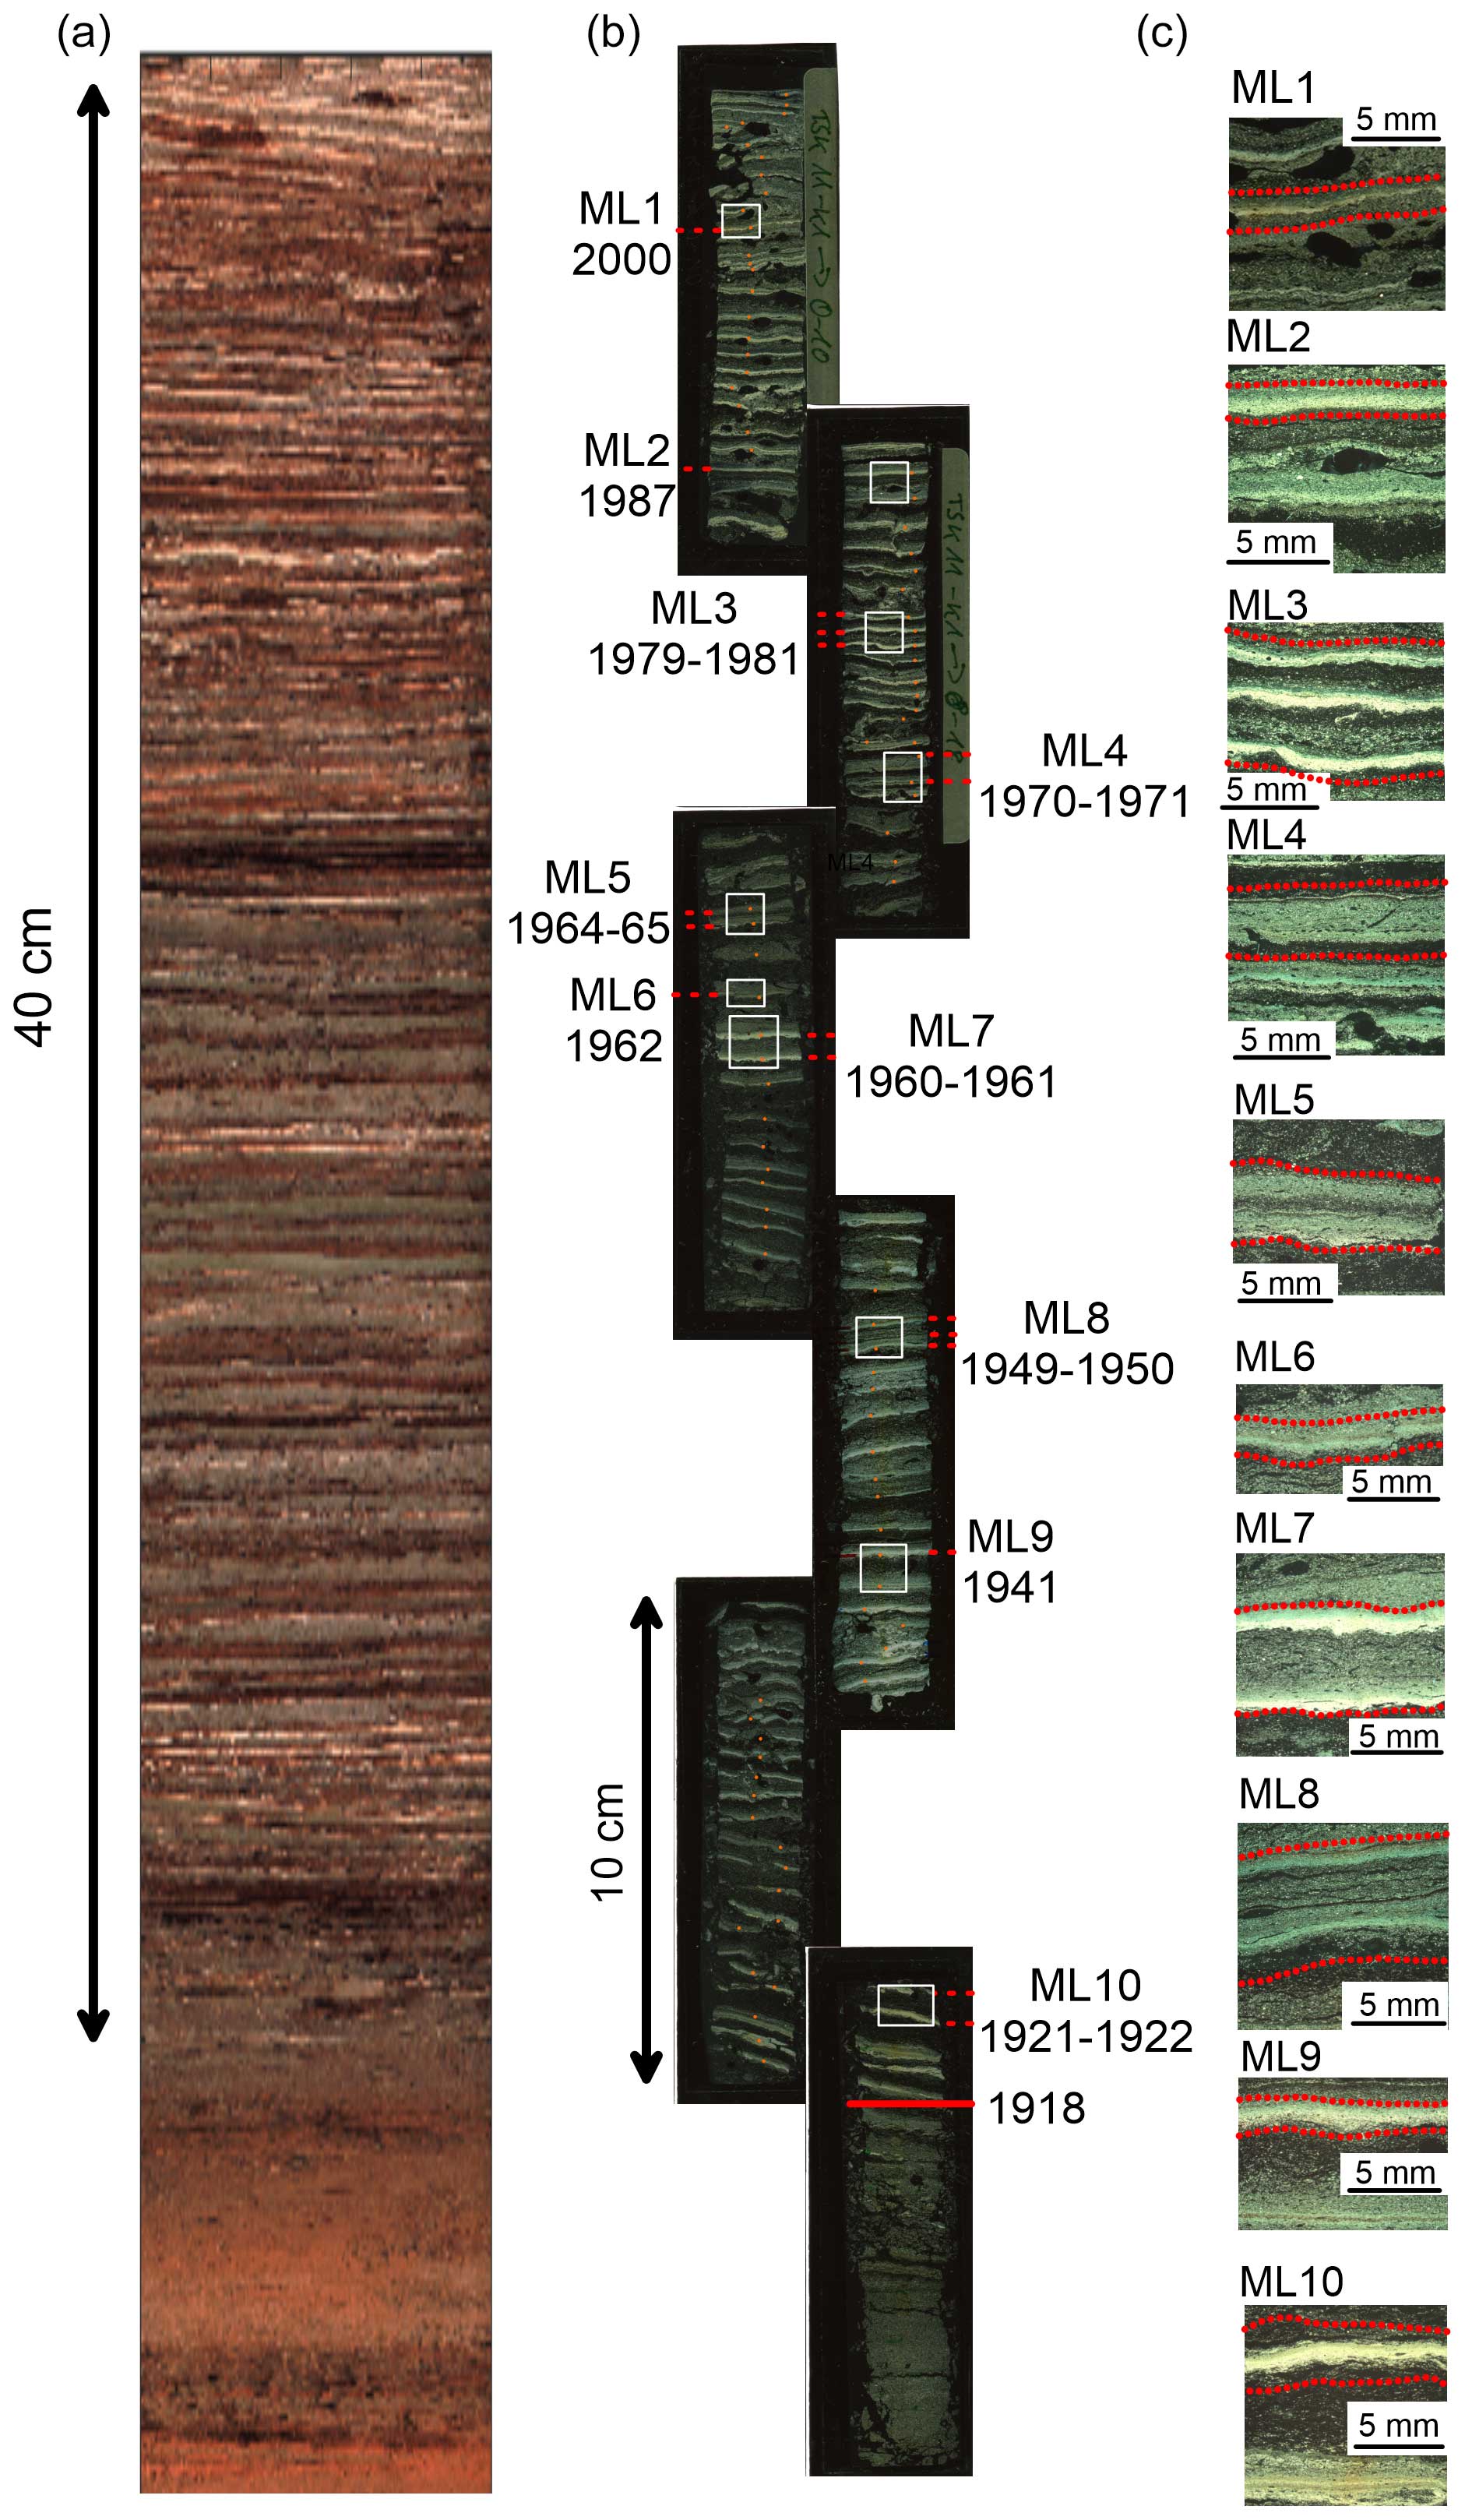
Figure 4TSK11-K1 master core. (a) Image of the core. (b) Thin sections of the core. (c) Marker layers (MLs).
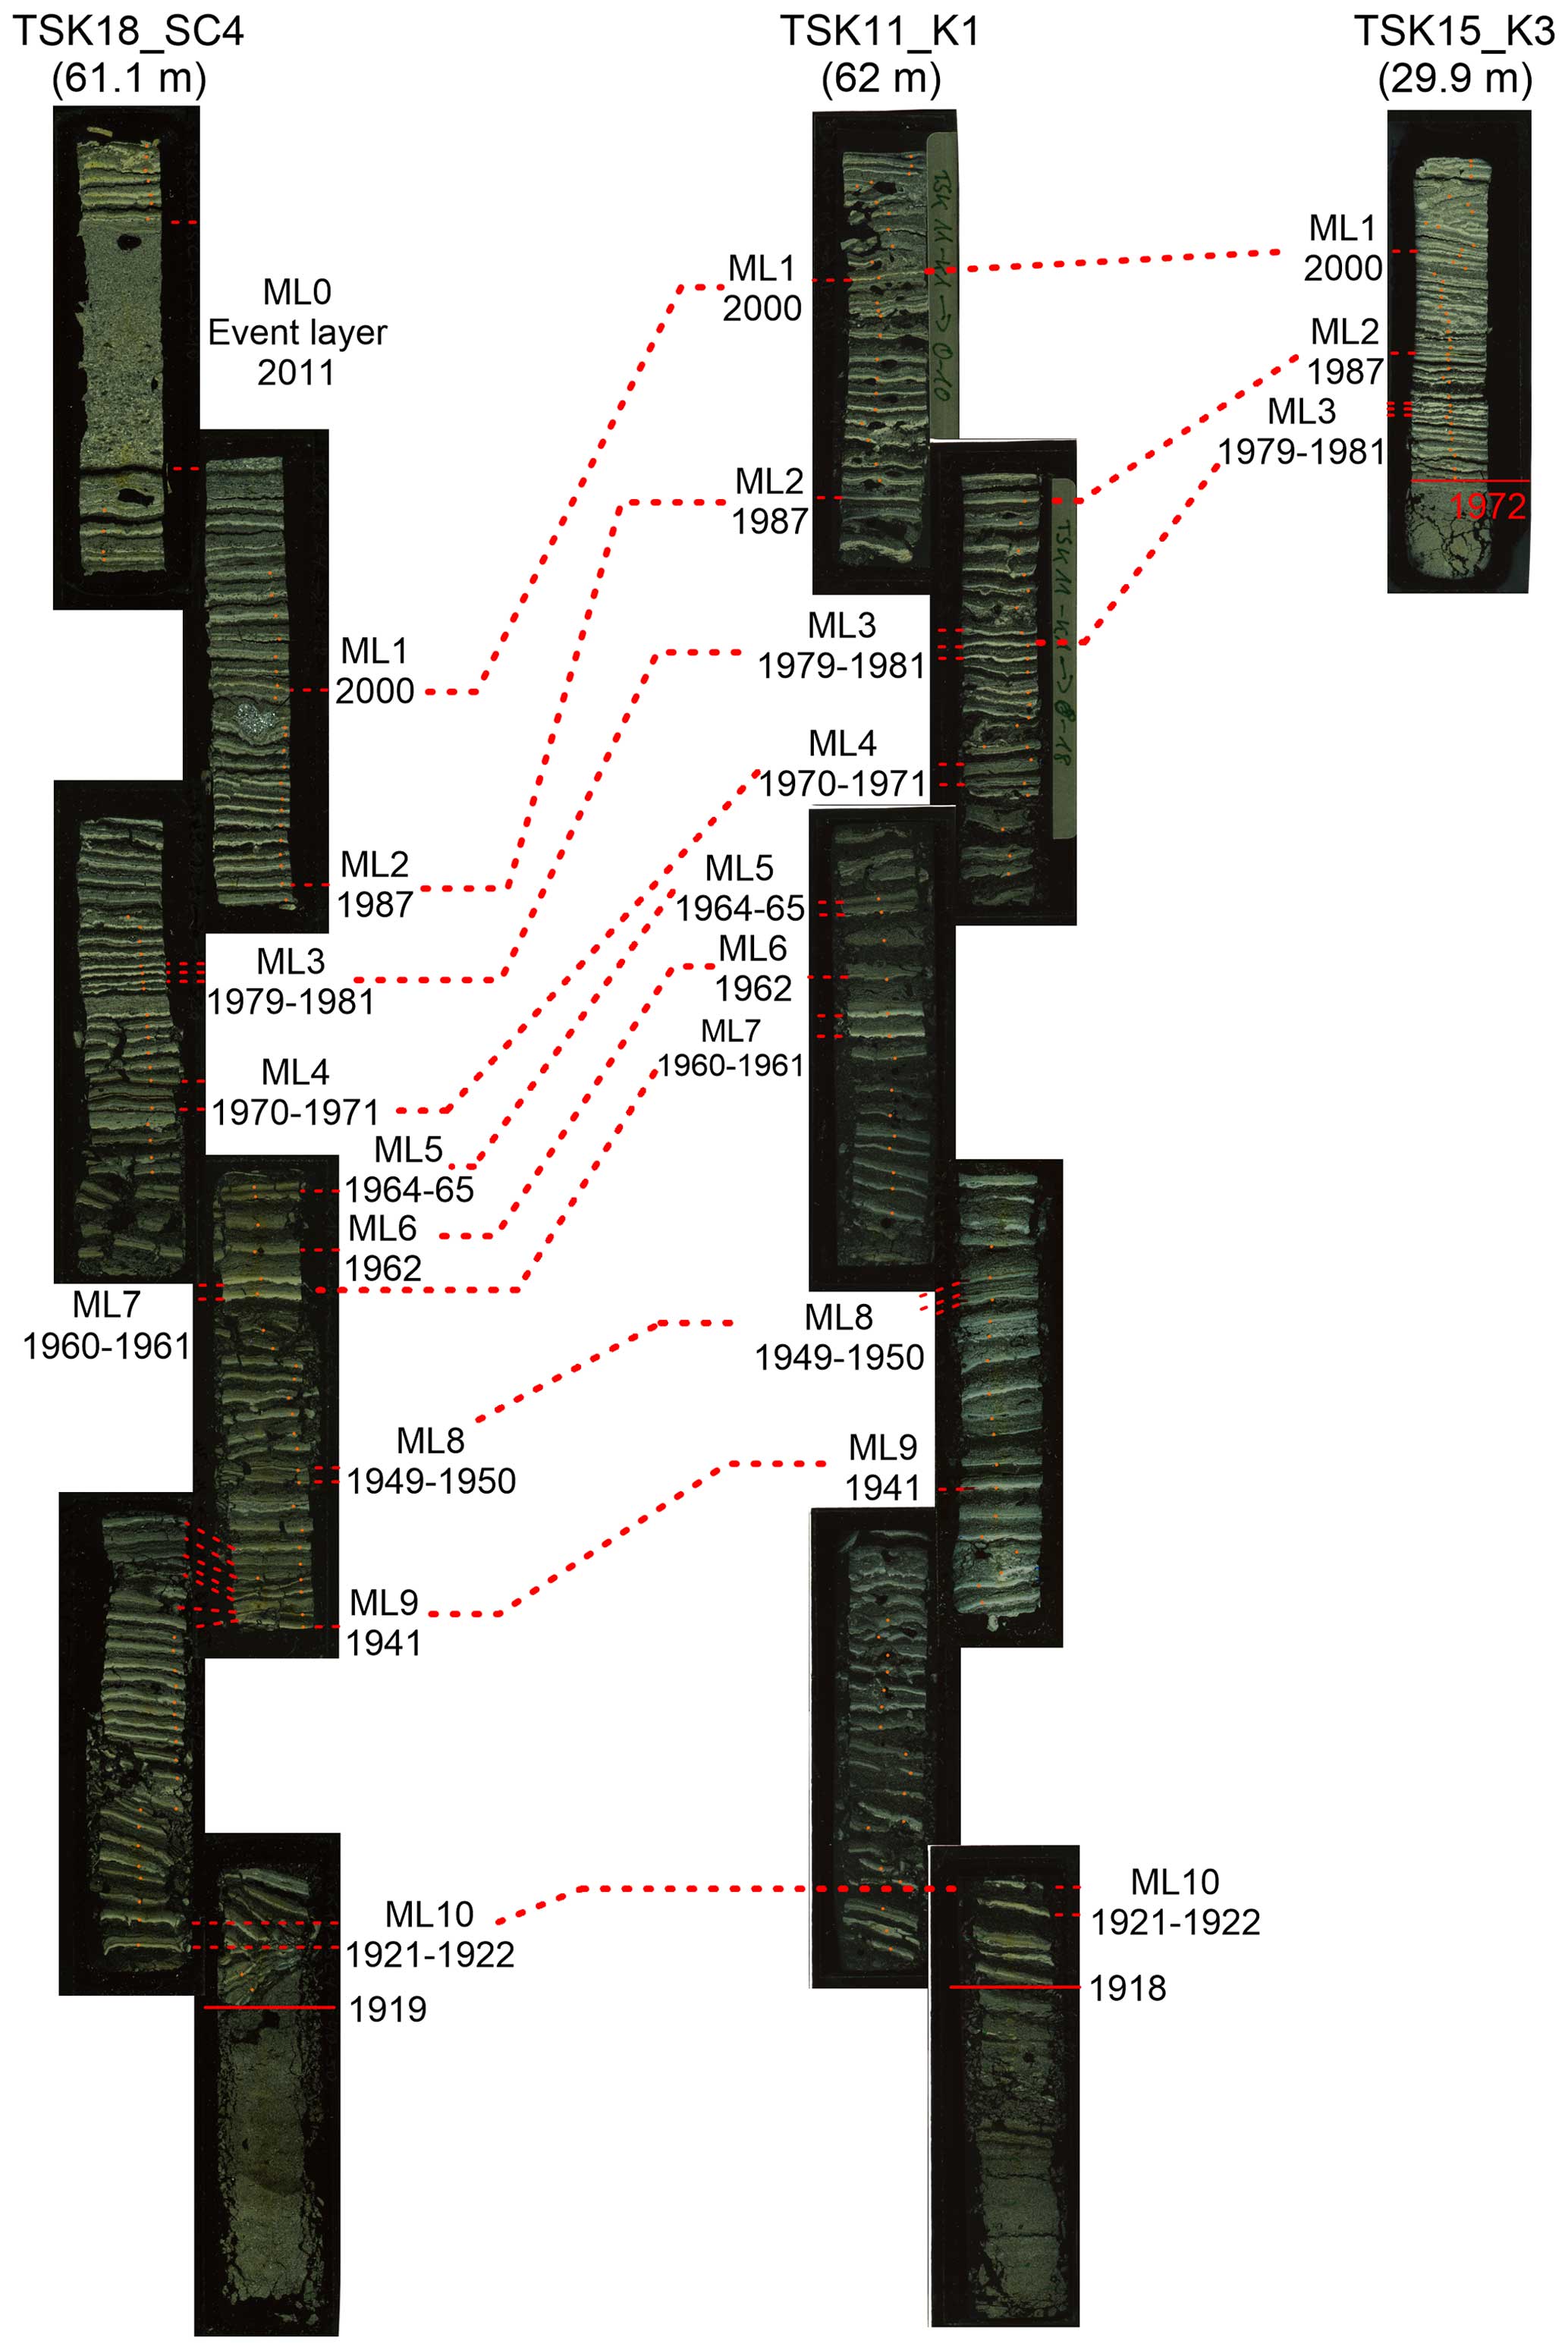
Figure 5Chronostratigraphic correlations between cores TSK18-SC4 and TSK15-K3 and the master core (TSK11-K1).
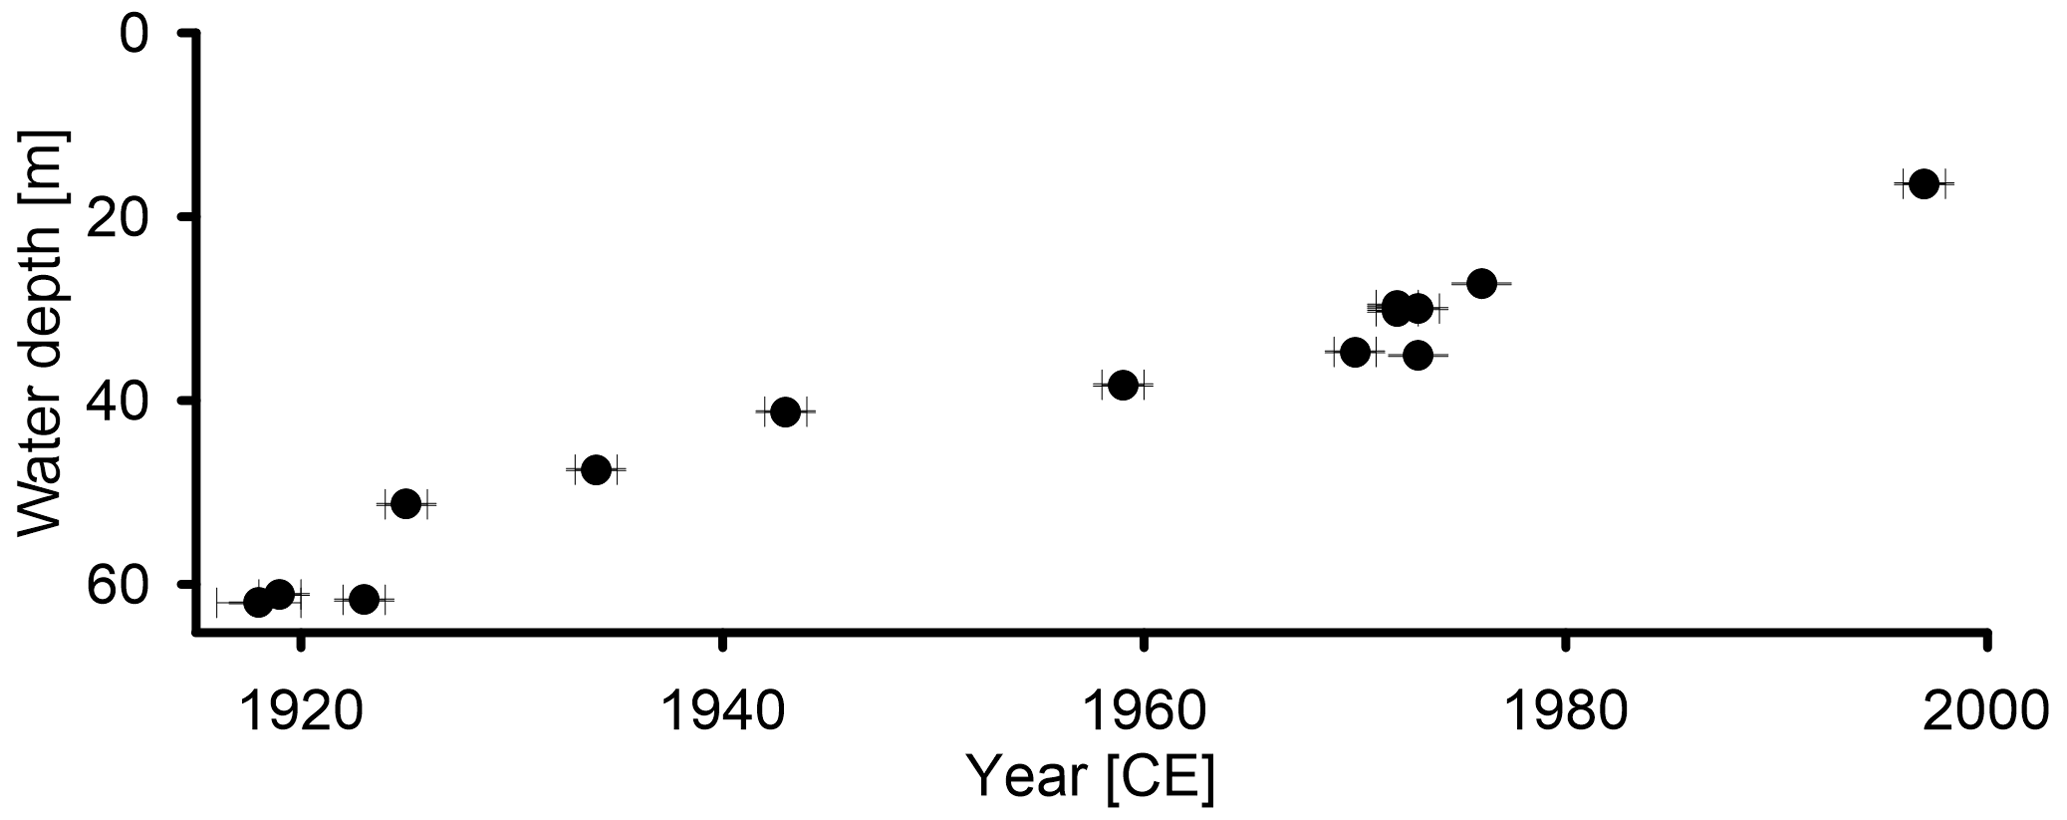
Figure 6Spatiotemporal spread of hypoxia in TSK, as shown by the onset of varve preservation and recovery depth.
Table 1List of all cores that were used in the study and the age of the base of the recent varved interval.
4.3.2 Chronology of non-varved sediments (units B and G)
The chronology of the non-varved sediments (units B and G) was established by tephrochronology in four cores (TSK12-K1 (35.3 m), TSK13-QP1 (30.3 m), and TSK15-K5 (27.3 m); an additional age was taken for core TSK11-K1 (62 m) from Wulf et al. (2016)). In each core, a peak in shard concentration was recognized and determined to be an isochron. Geochemical compositions show that these volcanic shards originated from the Askja 1875 CE eruption (Fig. S2 and Tables S2 and S3). The volcanic glass shards were found in cores TSK13-QP1 (30.3 m) and TSK15-K5 (27.3 m) at the boundary between units B and G; thus, the age of this boundary is 1875. In core TSK12-K1 (35.3 m), the shards were found 3 cm below this boundary, and in core TSK11-K1 (62 m) they were found 6 cm below the unit B and unit G boundary; thus, the age was estimated according to the average deposition rate of the sediments between the base of the varved unit and the identified tephra. As the cryptotephra samples were undertaken at 1 cm intervals that represent a certain time frame, depending on the deposition rate at each core, a chronological error was added to the analysis.
4.4 Geochemical characterization
4.4.1 XRF cluster analysis
Statistical analyses were performed on the elements Si, S, K, Ca, Ti, Mn, Fe, and Sr using Xelerate software (Weltje et al., 2015), which performs a center-log-ratio transformation of the element intensity records prior to the statistical operations. Element correlations were explored using a PCA biplot, and a geochemical characterization of the sediments was performed using Ward's hierarchical clustering for all 13 sediment cores (Fig. 7).
The first principal component (PC1) explains 48.3 % of the variance and reveals positive loadings for the element Ca and negative loadings for K, Ti, and Fe, which reflects the variation in the calcite and detrital sediments, respectively. The second principal component (PC2) explains 41.7 % of the variance, with positive loadings for Mn and Fe and negative loadings for K, Ti, and Ca, which reflects the relative variation in the redox-sensitive elements. Less pronounced is the loading of the element Si, which is probably related to the occurrence of this element in diatom frustules and siliciclastic detritus. Based on these element correlations, we selected the element ratios of , , and as proxies for the relative variations in the carbonate and detrital sediments, the diatom and detrital sediments, and the intensity of the redox processes. These proxies are indicted as log ratios (Fig. 9), including 95 % confidence intervals, as calculated from the 3-fold replicate measurements.
Geochemical characterization using Ward's hierarchical clustering was performed to obtain the minimum number of statistical clusters that match the observed sedimentological units defined (V, B, and G), which are five groups in this case. These statical clusters are calculated based on the Euclidian distance of the data points to one of the five evenly distributed centroids in the data set without stratigraphical constrains.
Element correlations show a clear distinction between detrital sediments (Ti, K, Fe, and Si), endogenic components (Ca and Si), and redox-sensitive elements (Fe, Mn), whereas cluster analysis shows the difference between homogenous oxidized sediments (1–3) and varved reduced sediments (4–5). Cluster 2 represents the base of the shallow cores that are composed of oxidized sediments containing a higher detrital fraction; thus, it lacks Mn and is enriched in the Ti, K, and Fe of detritic origin. Cluster 3 represents the base of the shallow cores that are composed of oxidized sediments with higher amounts of detrital components. Cluster 4 represents the top of the section in the deepwater cores that is composed of Ca-rich reduced sediments. Cluster 5 represents the top of the section in the shallow-water cores that is composed of Ca-rich reduced sediments. Cluster 1 is glacial till (non-lacustrine) that appears at the base of one core (TSK16-K3). At the site of this core, the Holocene lacustrine section is relatively thin; thus, a short-sediment core includes the late glacial till (Theuerkauf et al., 2022; see Fig. S3).
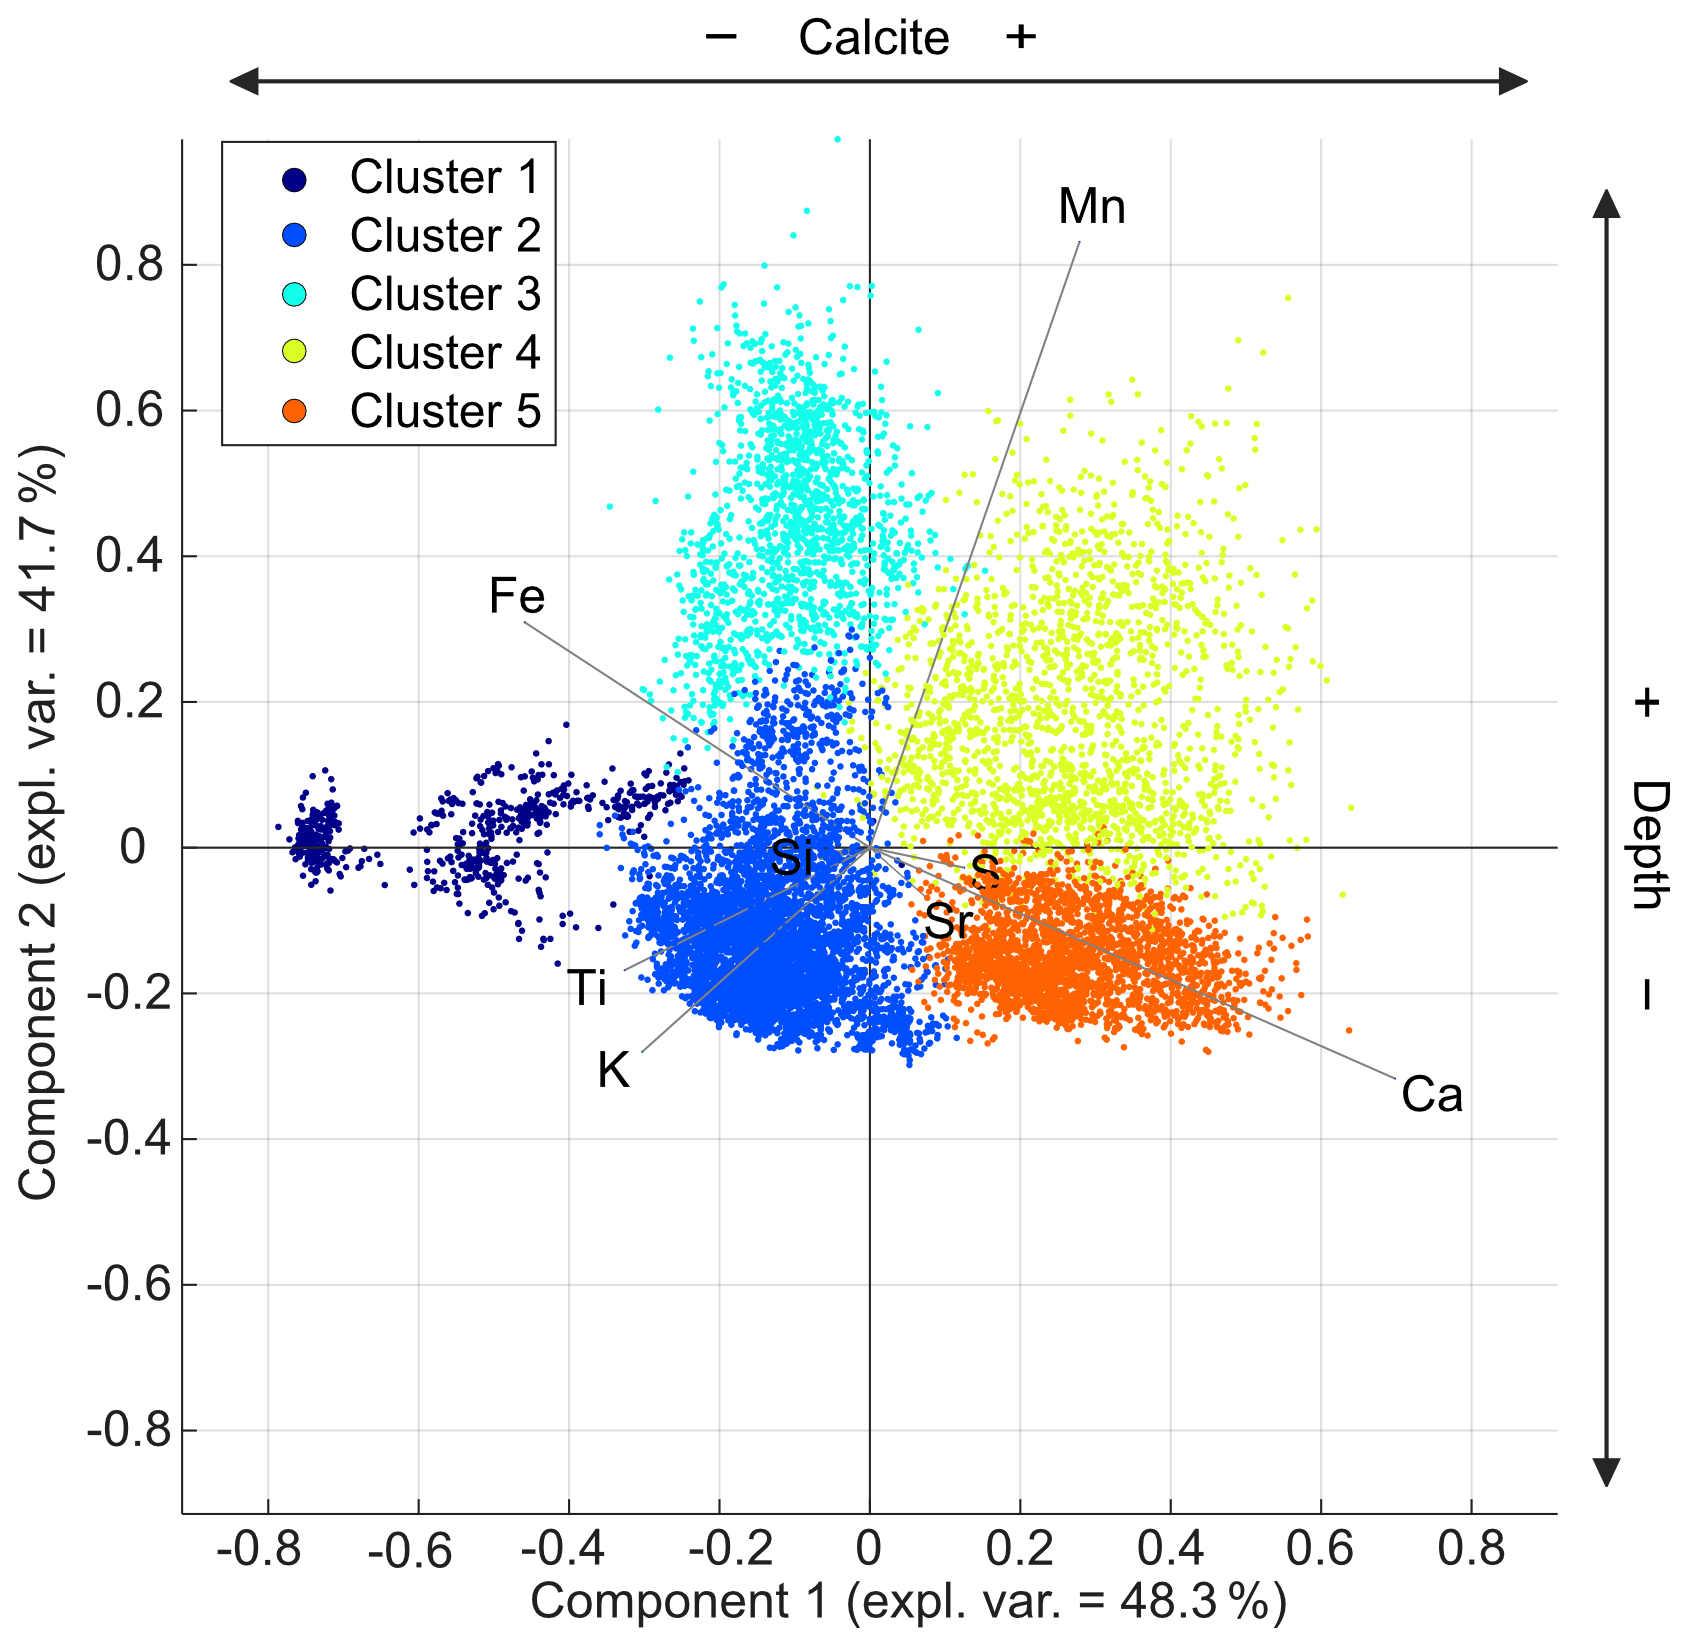
Figure 7PCA biplot of PC1 and PC2 showing all of the XRF data points and correlations of the elements measured. Geochemical characterization of the sediments by the five statistical clusters is indicated by the distribution of the clusters in the biplot reflecting the different sediment compositions.
Down-core cluster representations of the data points can be used for geochemical characterization of the different sediment types and reveal a clear change from the oxic sediments of unit B to the hypoxic sediments of units G and V (Fig. 8). Besides, the clustering results divide between cores from shallow locations of 11–41 m water depth and cores from the depocenter at 51–62 m water depth. For the deeper cores, unit B is classified as cluster 3 (Fe–Mn-rich oxidized detrital sediments), while the upper units G and V are classified as cluster 4 (Ca-rich reduced sediments). For more shallow cores, unit B is classified as cluster 2 (Fe–Ti-rich oxidized detrital sediments), while the upper units G and V are classified as cluster 5 (Ca-rich reduced sediments). However, for all cores, the change from unit B to the upper units G and V is mainly related to the increasing dominance of Ca (Fig. 8). In all of the cores, except TSK23-SC2 (11.3 m), the transition from unit B to unit G is correlated with a substantial change in the geochemistry of the sediments marked by a transition between cluster 2 (oxidized sediments with higher detrital components) and cluster 5 (calcite-rich reduced sediments) in the shallow cores or between cluster 3 (oxidized sediments with higher detrital components) to cluster 4 (calcite-rich reduced sediments) (deep cores).
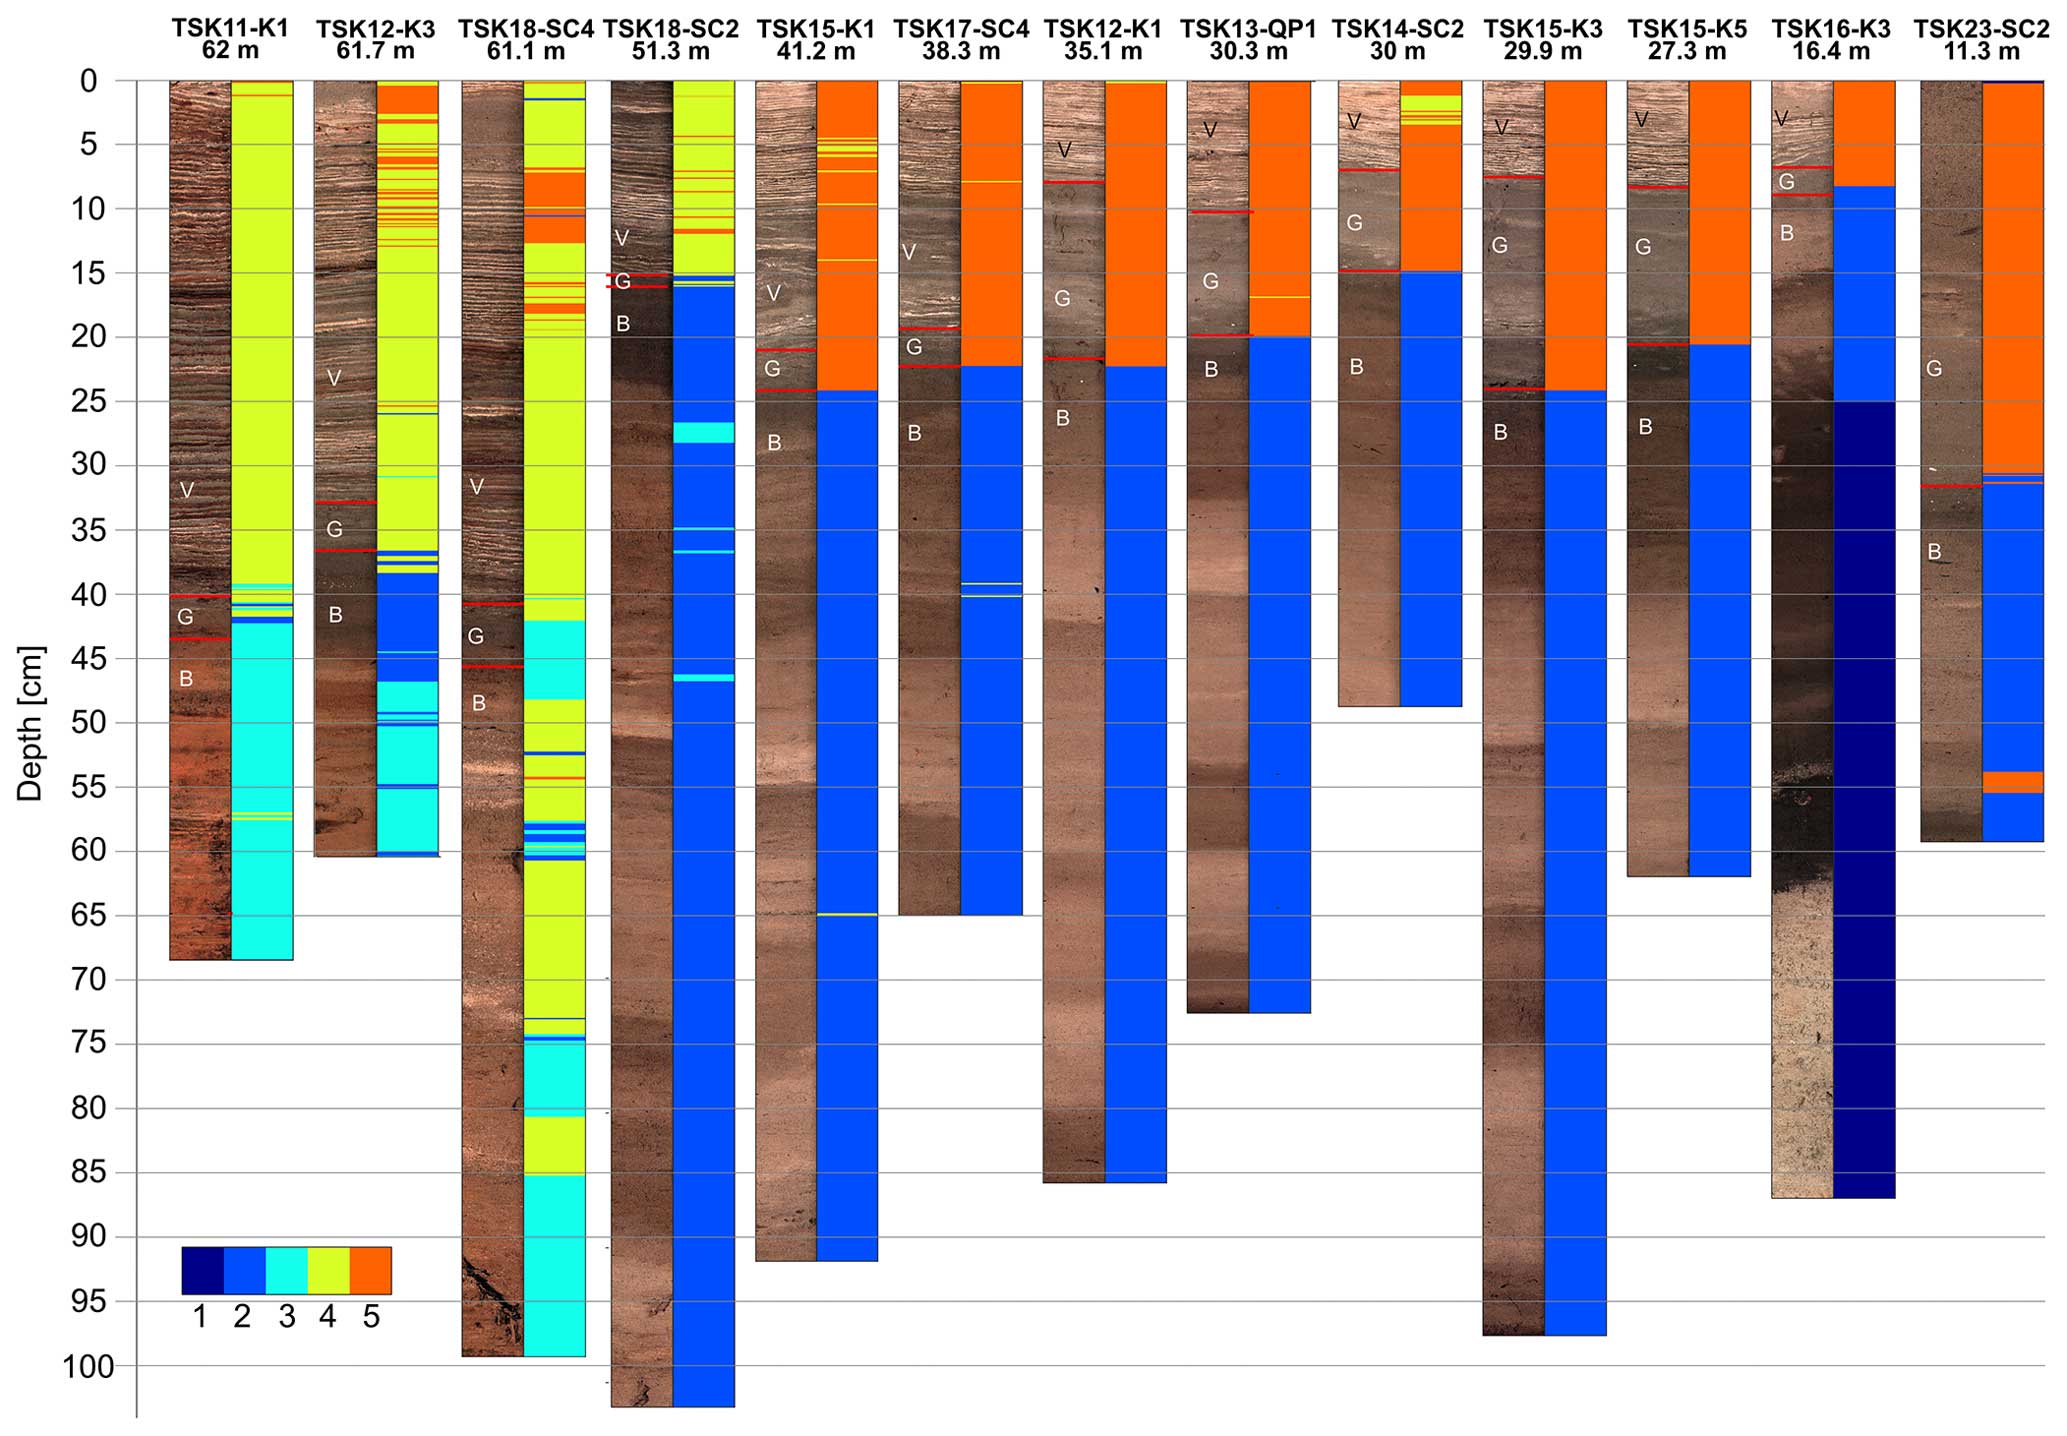
Figure 8XRF stratigraphy of the cores. The colors of the clusters represent the geochemical classification of the sediments based on the cluster analysis presented in Fig. 7. B – brown unit; G – gray unit; V – varved unit.
4.4.2 Geochemical sediment core profiles
Three cores from different water depths (TSK11-K1 from 62 m, TSK15-K5 from 27.3 m, and TSK23-SC2 from 11.3 m) were selected for detailed TOC, , and CaCO3 analyses and are presented here with XRF , , and ratios (Fig. 9). In core TSK11-K1 (62 m) (Fig. 9a), CaCO3 content along unit B ranges between 17 %–41 %, with an average of 28 %, and it increases along the thin unit G and the varved unit to 25 %–62 %, with an average of 44 %. The TOC content moderately increases from ∼ 3 % at the bottom of the core to 11 % at its top, with no abrupt changes at the transition from unit B to unit G and at the transition to the varved unit V. values decrease from ∼ −28 ‰ at the bottom of the core to ∼ 3 ‰–1 ‰ at the top of the core. While the change in the TOC content upcore is moderate, a stepwise increase and a stepwise decrease is observed in the CaCO3 content and the values, respectively. Both roughly coincide with the transition from unit B to units G and V. The abrupt changes in CaCO3 content and the composition coincide with the changes in the XRF elemental ratios. and ratios are both low along unit B, and they are substantially higher in the varved unit. The ratio displays a stepwise decrease at the transition from unit B to units G and V.
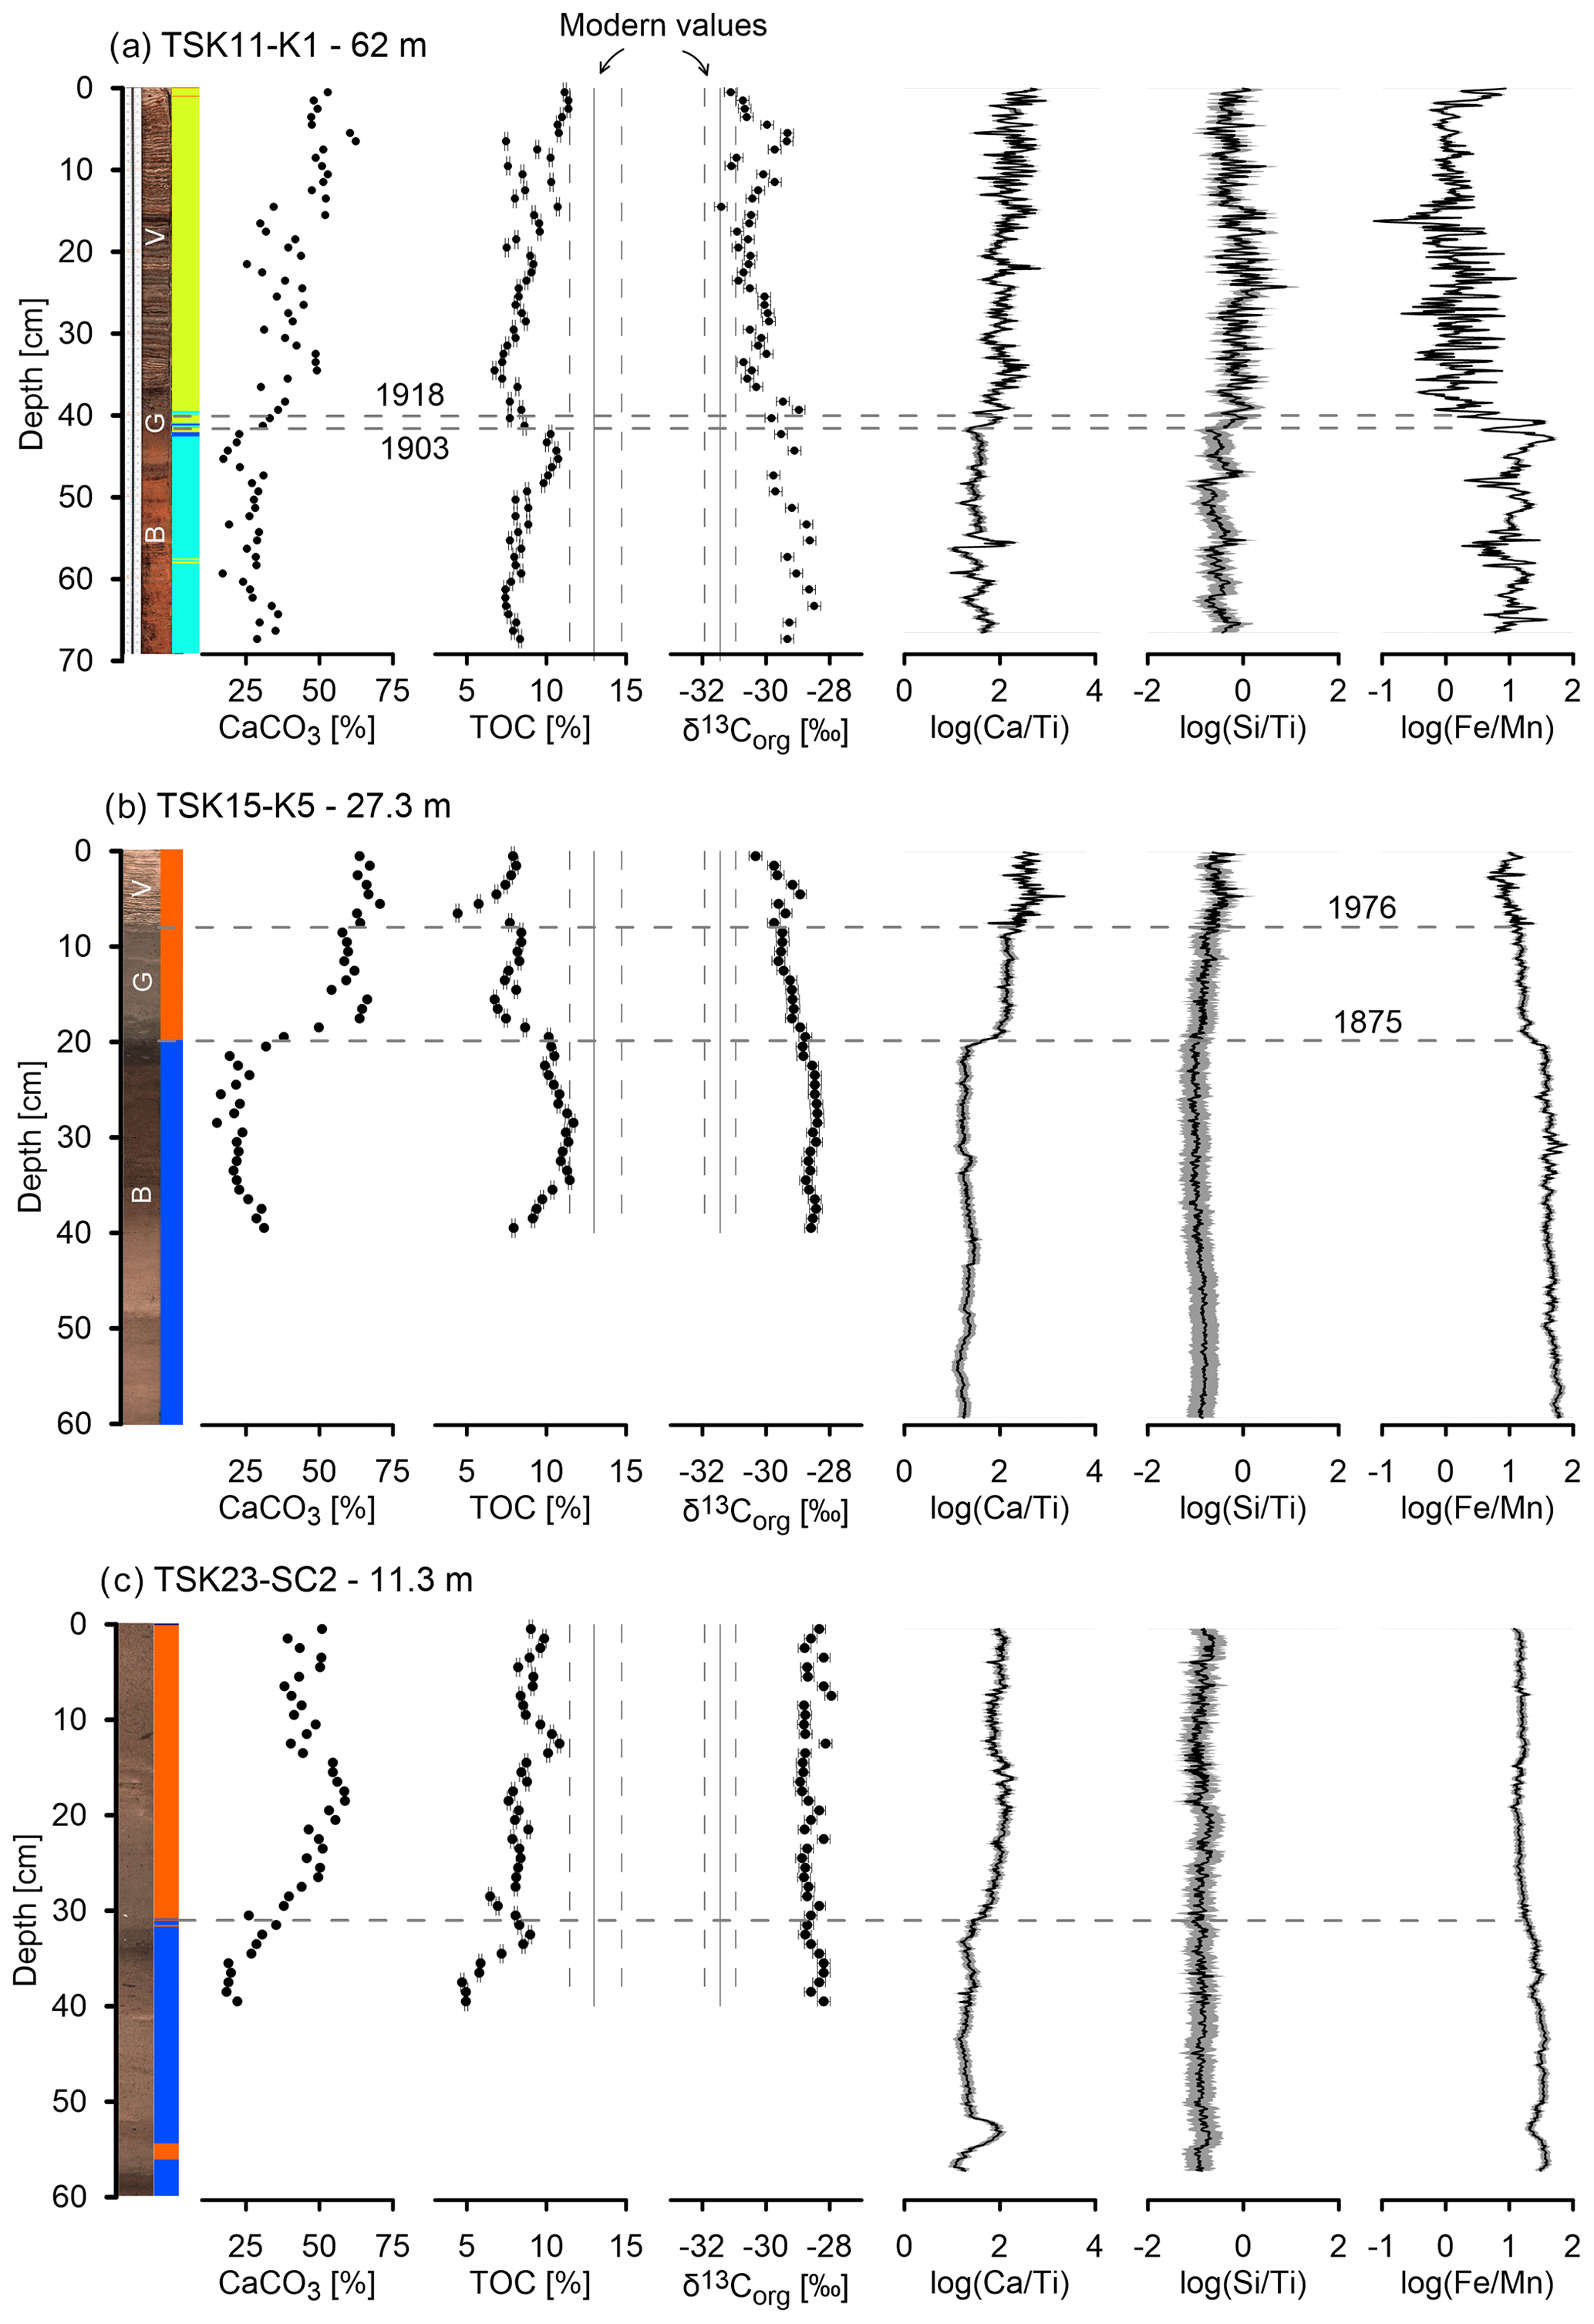
Figure 9Core image, XRF stratigraphy, CaCO3, TOC, , , , and profiles of three cores from different water depths. (a) TSK11-K1 at 62 m depth, (b) TSK15-K5 at 27.3 m depth, and (c) TSK23-SC2 from 11.3 m depth. All profiles use the same scale on the x axis to allow for comparison between different cores.
In core TSK15-K5 (27.3 m) (Fig. 9b), CaCO3 content ranges from ∼ 20 % along unit B to ∼ 60 % in the units G and V. This abrupt increase appears at the transition from cluster 2 to cluster 5. The TOC content decreases from ∼ 10 % at unit B to ∼ 6 % along units G and V. values decrease from ∼ −28 ‰ at the bottom of the core to ∼ −30 ‰ at the top of the core. Both display a moderate change upcore, which is in contrast to the abrupt change in CaCO3 content. and ratios are both low along unit B, and they are substantially higher along units G and V. The ratio displays a stepwise increase, which is correlated with the transition between units, while the ratio is moderately increasing upward from that point. The ratio decreases sharply from the transition between unit B to units G and V upcore.
In core TSK23-SC2 (11.3 m) (Fig. 9c), the changes in all proxies are less distinct. CaCO3 content ranges from ∼ 20 % at the base of the core to ∼ 50 % at its upper part. This increase is roughly correlated with the transition between cluster 2 and cluster 5. The TOC content increases from ∼ 5 % in cluster 2 to ∼ 10 % along cluster 5. values remain constant along the core, within a narrow range of −28 ‰ to −28.8 ‰, and do not show a depletion trend like the other two cores. The ratio is low at the base, and it is moderately increasing from the transition between the cluster 2 to cluster 5. The ratio does not show a clear trend upcore. The ratio is constant along the core with little variance. In contrast to the other two deeper cores, the transition between the clusters (and sediment units) is not associated with a substantial change in the ratio.
4.4.3 Chironomid abundance
Remains of chironomid larvae were present at low abundances in the analyzed cores, with the exception of the lowest sample in the intermediate-water core (TSK15-K5; 27.3 m) (Fig. 10; full data set in Table S4). The assemblages were characterized by a high percentage of littoral (shallow-water) taxa remains, whereas profundal (deepwater) chironomids were only present at relatively low percentages. At ∼ 27 m water depth (TSK15-K5), the abundance, concentration, and influx of the remains of chironomid larvae are gradually reduced from unit B to unit G and drop down to almost zero in unit V (Fig. 10a). In unit B, a high abundance of chironomids from profundal environments is observed, including high abundances of the Micropsectra-radialis-type, while in unit G, a lower abundance of chironomids and M.-radialis-type is observed. In unit V, only negligible amounts of chironomids are observed. In the deepwater core (TSK18-SC4, 61.1 m), the overall abundance of chironomids and the abundance of profundal chironomids is very low throughout the core (Fig. 10b), in line with the low-oxygen concentration and low amounts of bioturbation. However, among the most abundant deepwater chironomid taxa, a shift is apparent at ca. 37–30 cm depth, where M.-radialis-type and Tanytarsus-lugens- and Tanytarsus-mendax-type decline and Chironomus increases in percentages.
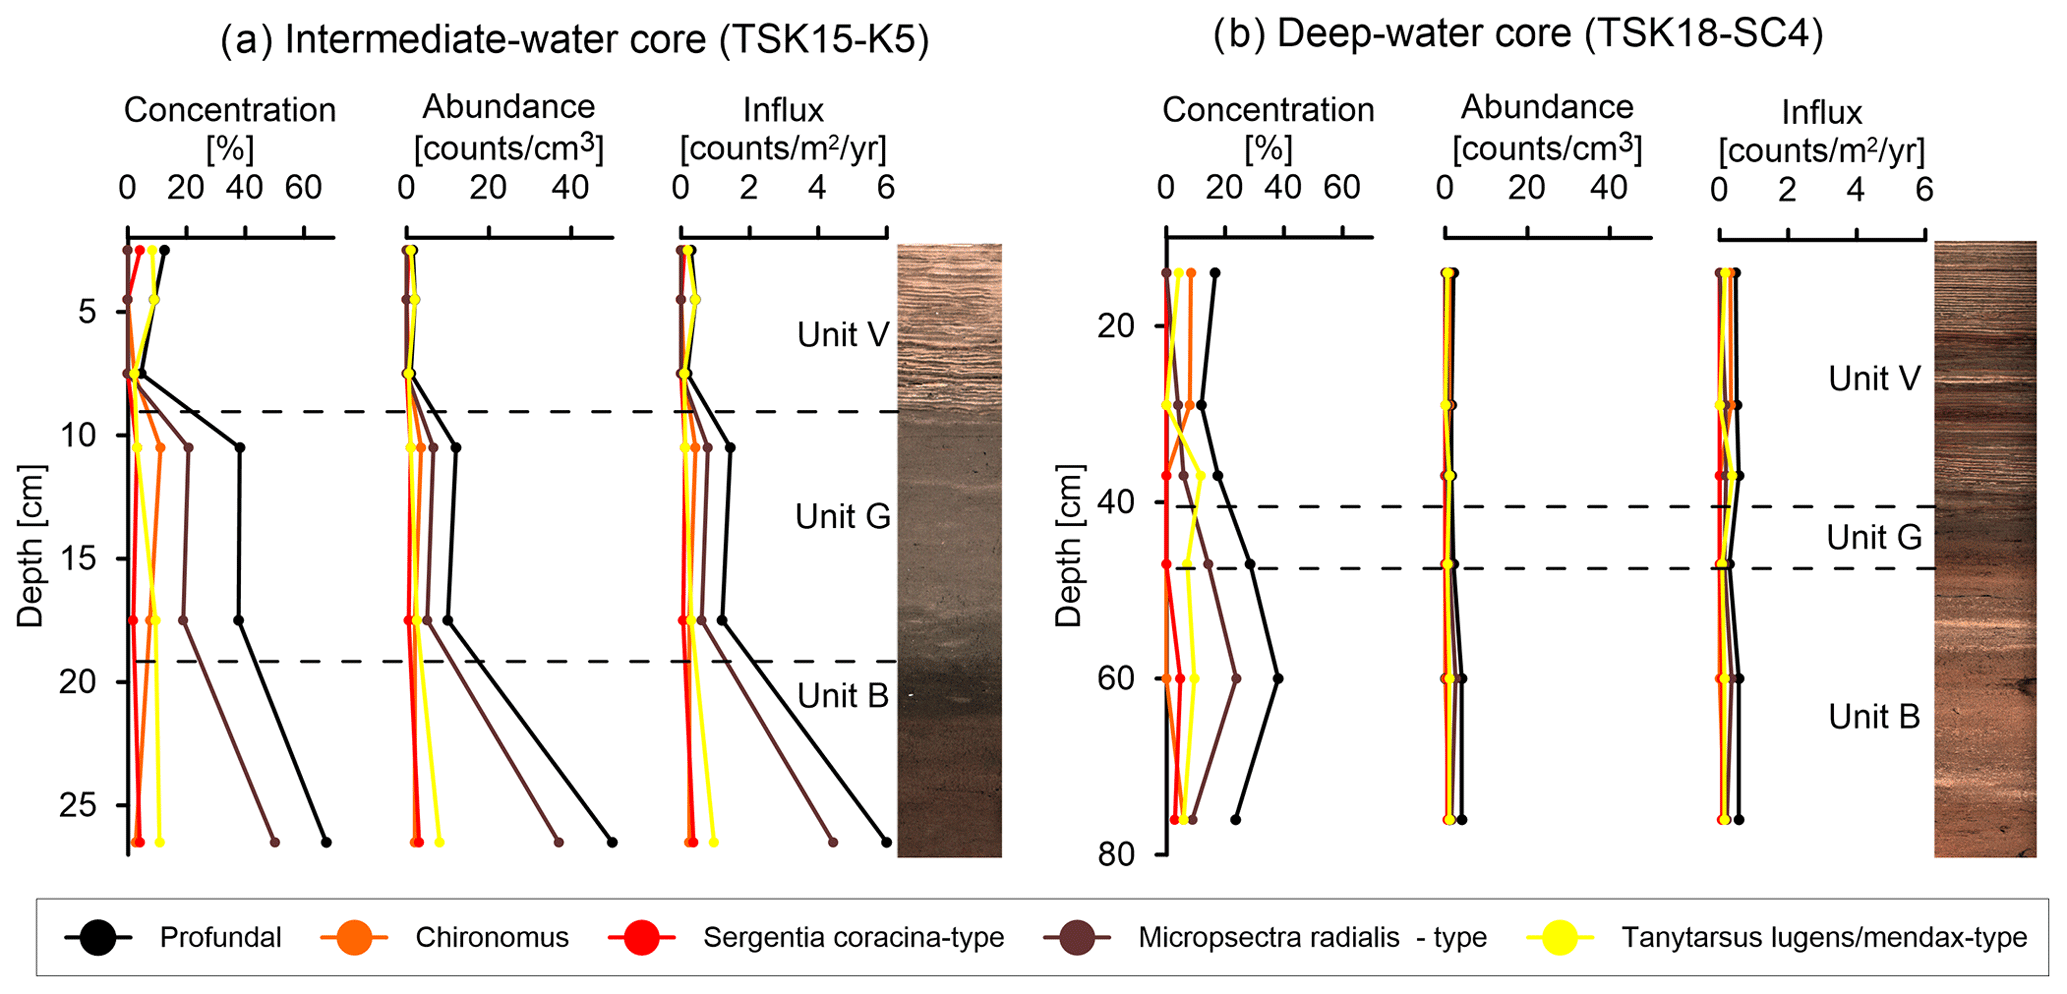
Figure 10Abundances of chironomids, profundal chironomids, and selected profundal chironomid groups in core TSK15-K5 (a) and in core TSK18-SC4 (b).
4.5 Limnological monitoring
The present-day DO dynamics are shown in lake monitoring data between April 2019 and February 2021 (Fig. 11b). The dynamics of DO along the water column at the deepest part of the lake show clear seasonal fluctuations in which DO at the upper ∼ 12 m ranges from ∼ 8 mg L−1 during the early spring to ∼ 14 mg L−1 during the winter, while near the lake floor, DO ranges from ∼ 1 mg L−1 in early winter to ∼ 11 mg L−1 during the spring. The depletion in DO at the hypolimnion first occurs at the water–sediment interface and progrades upward during the summer–autumn to a water depth of ∼ 12 m (Fig. 11a), which represents the oxycline. Thermal stratification prevails from April to November, with an average thermocline depth of ∼ 10 m (Fig. 11b). The epilimnion temperature ranges from ∼ 3 °C in winter to ∼ 22 °C in summer, while the hypolimnion temperature ranges from 3 °C in winter to 5 °C in summer. An interesting observation is the time shift between the changes in the vertical oxygen distribution and the temperature dynamics. While the maximal temperature difference between the epi- and hypolimnion is achieved in August (Fig. 11b), the maximal DO difference between the layers appears in November (Fig. 11b).
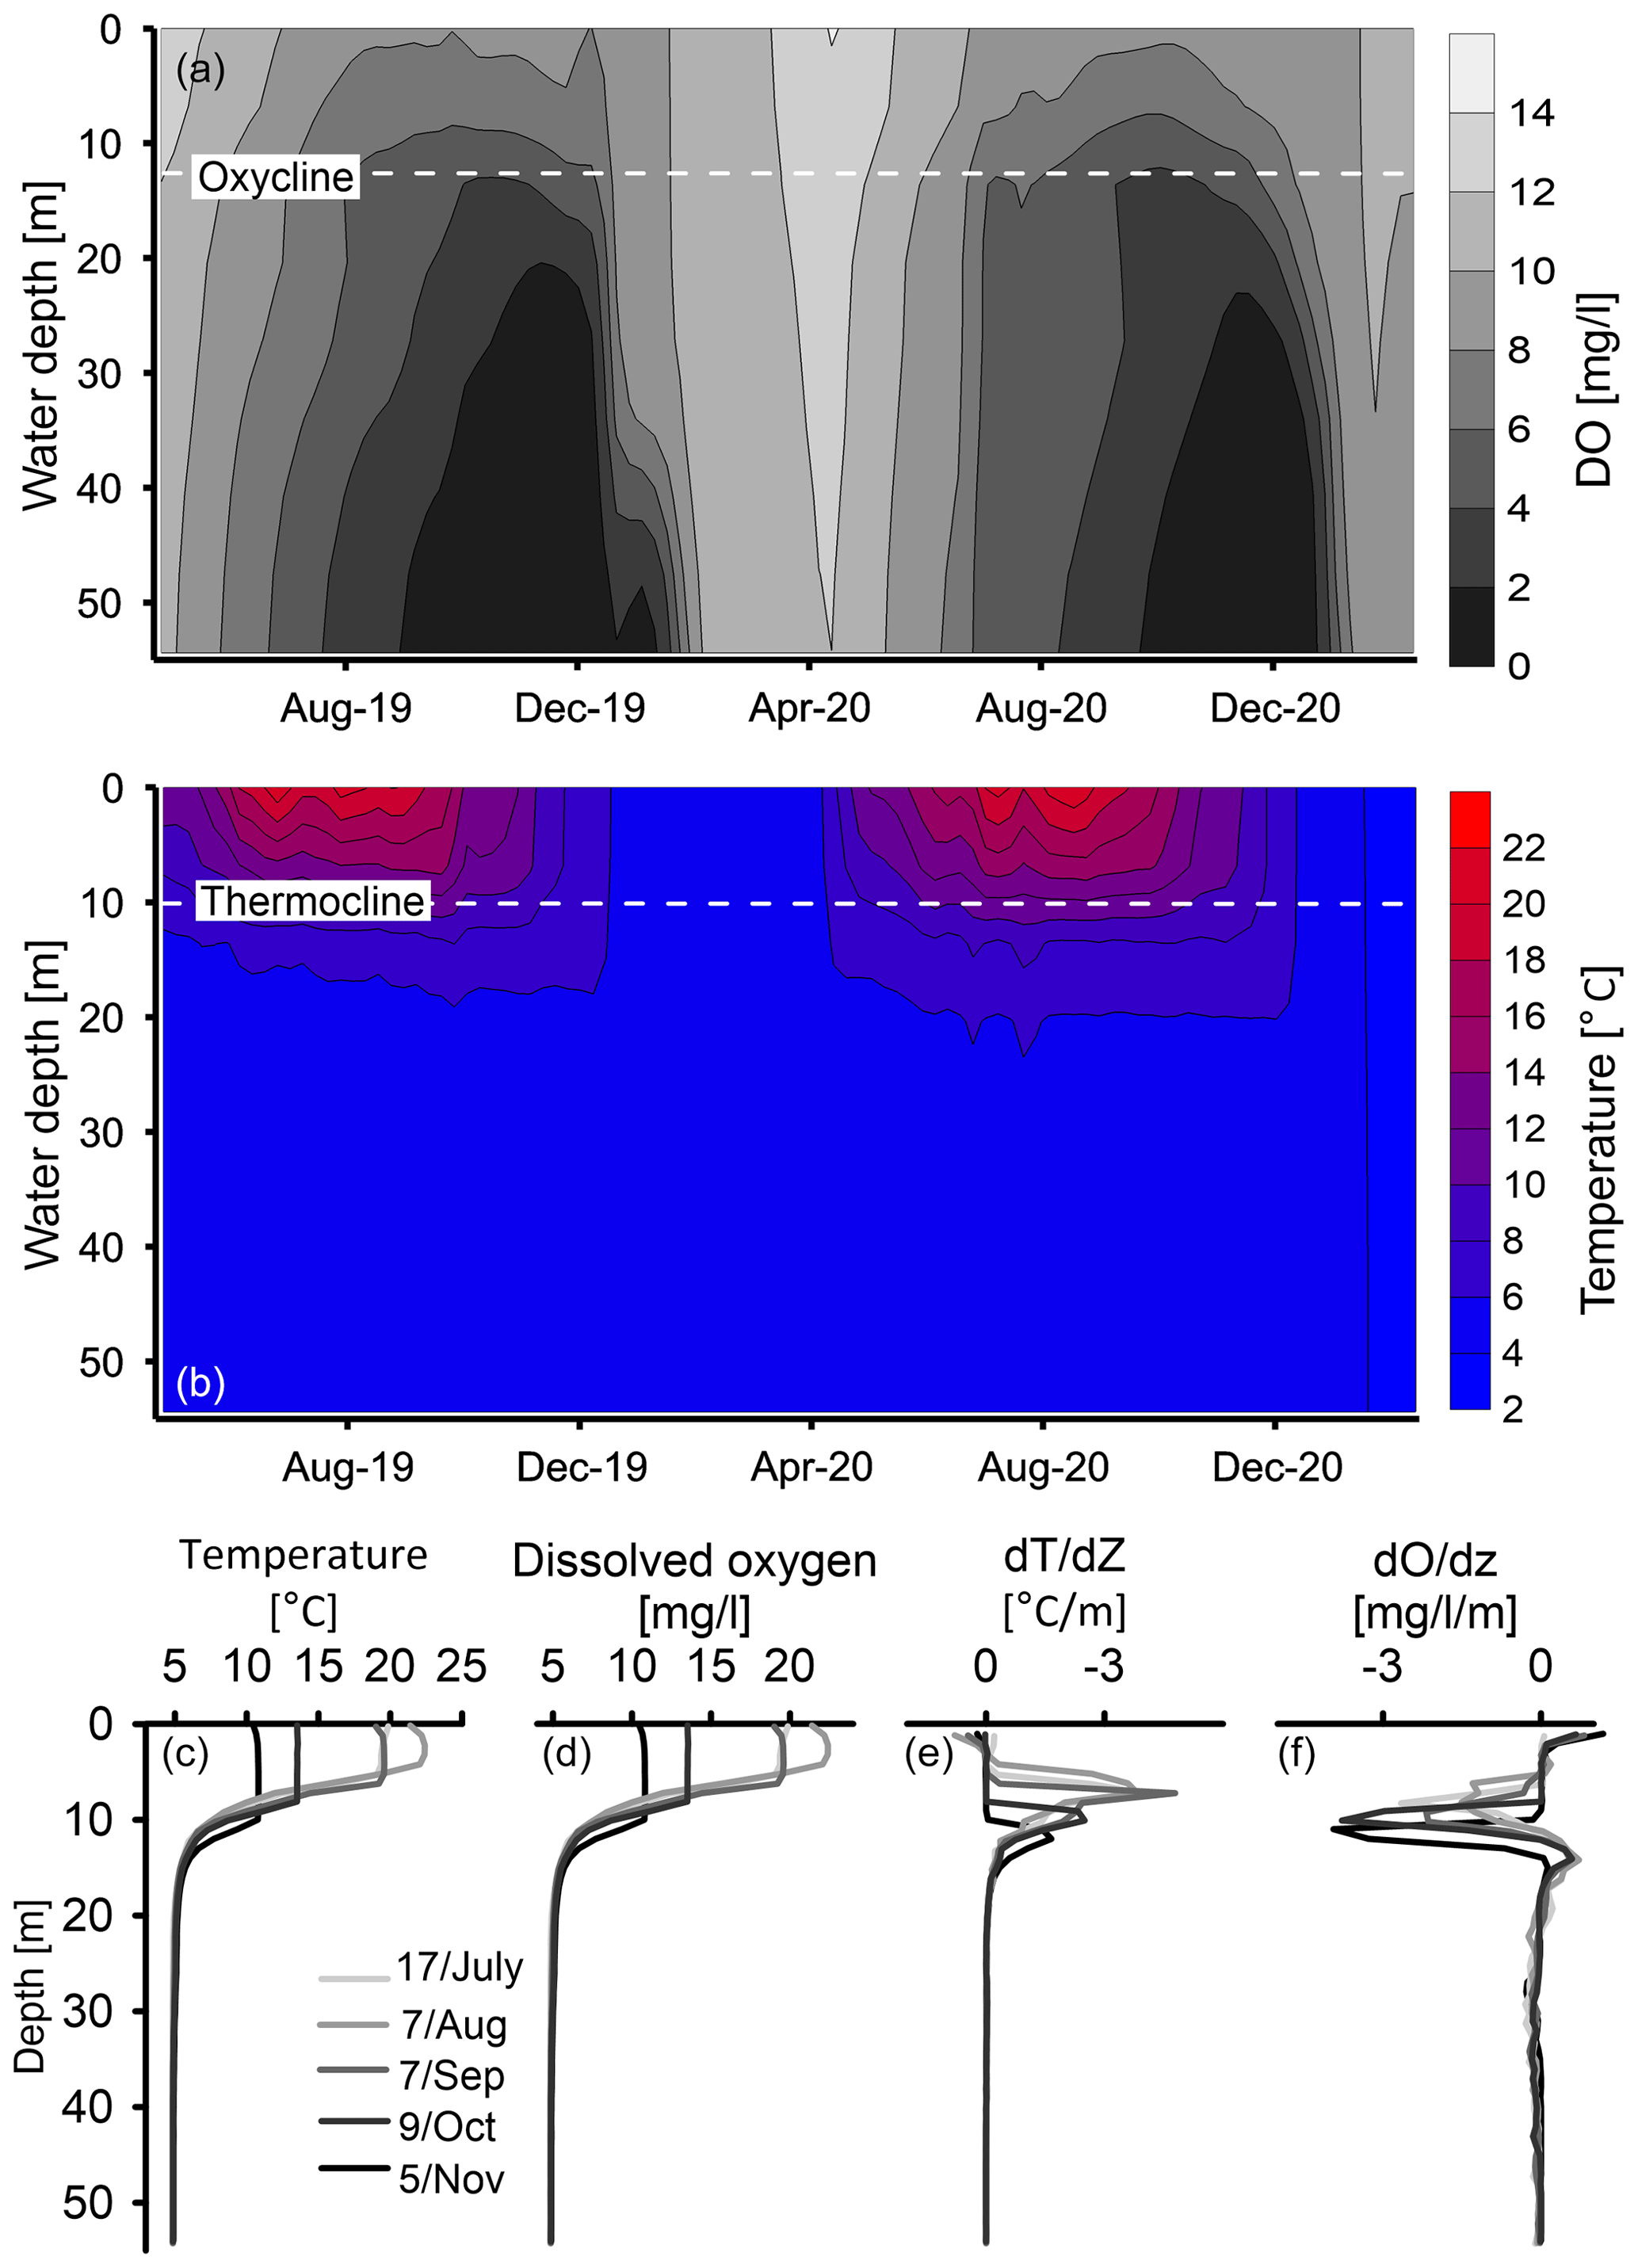
Figure 11Physical properties of the water column. Spatiotemporal characterization of dissolved oxygen (DO) (a) and temperature (b) in the lake. The diminishing of the temperature (c) and DO (d) stratification along the water column. The maximal depth gradient of temperature (e) and DO (f) along the water column show the evolution of the thermocline and oxycline depth.
5.1 Present-day oxygen dynamics
The seasonal water column stratification and the associated lake circulation play a main role in the bottom-water oxygenation in TSK. Present-day seasonal dynamics of DO concentrations in the lake show that hypoxia is extending upward in the water column during summer–autumn and is limited by the thermocline around 10 m depth (Fig. 11b). The vertical variations in the DO along the water column at the deepest part of the lake allow us to quantify the required intensity, duration, and vertical development of hypoxia, which is required for varve preservation. The general definition for hypoxia is [O2] < 2 mg L−1 (Tyson and Pearson, 1991; Diaz and Rosenberg, 1995; Jenny et al., 2014), although for freshwater lakes value of [O2] < 5 mg L−1 has been used to define hypoxic conditions (Njiru et al., 2012). By adopting these numbers, we can define the hypoxic threshold for varve preservation at TSK below 12 m water depth by [O2] < 5 mg L−1 for 5 months (August–December) and [O2] < 2 mg L−1 for 2 months (November–December; Fig. 11a). Our results show that in spite of the winter oxygenation of the water column, varves can be preserved in monomictic lakes, as long as the duration and magnitude of the seasonal hypoxia is sufficient. This was previously observed in Lake Czechowskie in northern Poland (Roeser et al., 2021) and in Diss Mere, England (Boyall et al., 2023). Only at the shallow lake floor (< 12 m) do oxic conditions prevail during the entire year. The position of the transition layer at ∼ 12 m depth is dictated by the transfer of heat down the water column from the surface water and reflects the thickness of the upper convective layer which forms the epilimnion. Because the spread of hypoxia starts from the sediment–water interface and spreads upward, it is bounded by the depth of the transition layer. The time delay between the vertical oxygen distribution and temperature dynamics likely reflects the timing and duration of OM decomposition during the period of stratification at the deepest part of the lake basin and the circulation of lake water that starts from the bottom and the time required to transport oxygen into the bottom waters.
5.2 The transition from oxygenated to hypoxic conditions
The identification of the onset of varve preservation in the sedimentary record is a common tool to date the onset of hypoxic conditions in lakes because it indicates the absence of bioturbating organisms (e.g., Diaz and Rosenberg, 1995). However, varve preservation is a binary proxy that is only indicating a depletion of the DO level to below a certain threshold. To trace possible depletion in DO level prior to varve preservation, more sensitive geochemical proxies are applied. Geochemical sediment characterization by clustering of XRF data shows that the varved unit V and the underlying unit G are geochemically similar and reflect similar sediment composition (Fig. 8). This is also supported by the relative variations in endogenic calcite and detrital matter () and the relative variations in biogenic silica and detrital matter () (Fig. 9). The increase in the CaCO3 concentrations and ratio at the transition from unit B to G reflects an enhanced calcite formation (Fig. 9). The increase in the records at the transition to unit G indicates a relative increase in the diatom accumulation that continues into the varved unit V, but this is less clear in the shallow core TSK23-SC2 located at a water depth of less than 12 m. Intervals of increasing calcite and diatom deposition are characterized by cluster 5 in shallow-water cores and cluster 4 in deepwater cores. Together, the rising deposition of calcite and diatom frustules indicate changes in sedimentation prior to the onset of varve preservation, while the DO levels were still sufficient for the existence of bioturbating organisms.
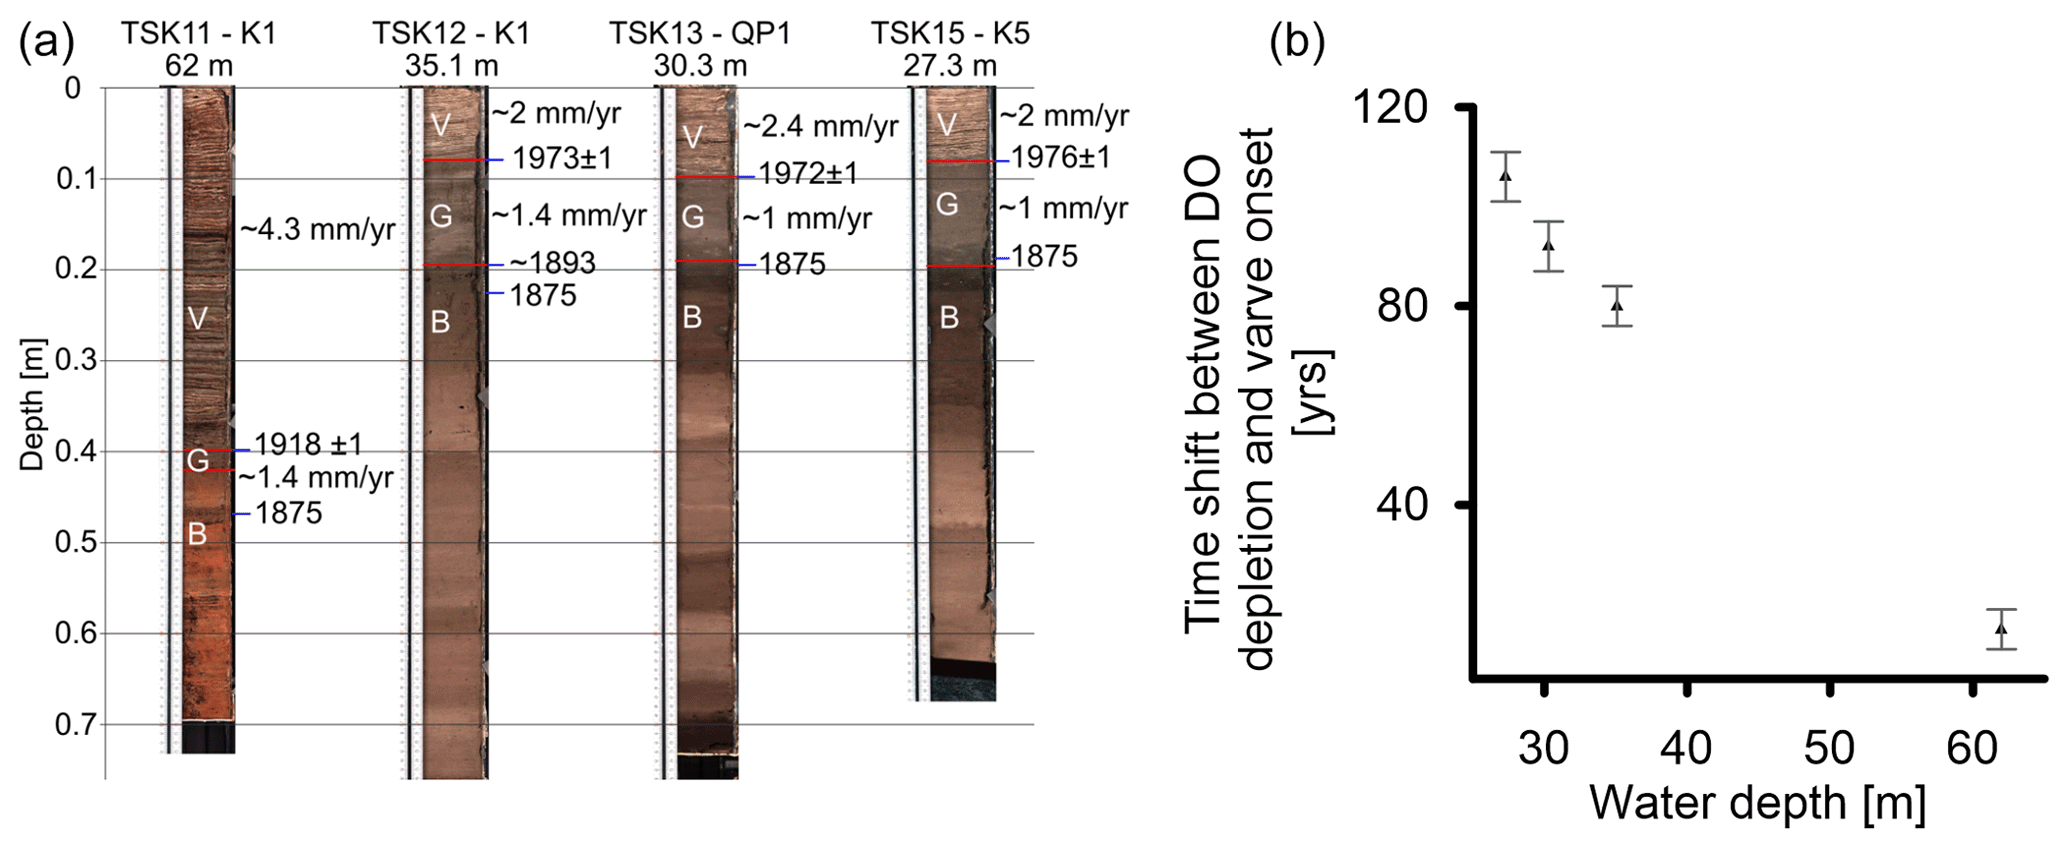
Figure 12(a) Images of the selected cores and their chronologic anchors. (b) The time interval between the onset of DO depletion (base of unit G) and the onset of varve preservation (base of unit V).
Variations in ratios are another sensitive proxy because the oxidation of organic matter at the sediment–water interface and upper sediment is coupled with the reduction in Mn or Fe oxides. Decreasing ratios at the transition from units B to G observed in all cores below 12 m water depth show that redox processes are initiated at this depositional boundary (Fig. 9). This suggests that the redox conditions at the sediment–water interface had already changed prior to the onset of varve preservation. The bacterial oxidation of organic matter and the reduction in Mn and Fe at the sediment–water interface are associated with changes in the DO level (Melton et al., 2014; Thamdrup, 2000; Liu et al., 2022). Relative constant ratios in core TSK23-SC2 located above the oxycline (< 12 m) do not show a decrease as in the cores from locations with currently low DO levels and thus confirm the sensitivity of this proxy to oxygen conditions at the sediment–water interface. This is also supported by the upcore reduction in oxygen-sensitive chironomid abundance and the decrease in profundal chironomids already at the transition between units B and G in core TSK15-K5. The profile of three cores (TSK11-K1, 62 m; TSK15-K5, 27.3 m; TSK23-SC2, 11.3 m) supports the DO depletion in the deep part of the lake, while the shallower lake floor remained oxygenated. in the deep and intermediate cores shows more negative values upcore, approaching values of recent organic materials from sediment traps which experienced minor degradation (Fig. S4). Because TSK has no riverine input, it is unlikely that changes in the sources of external OM will significantly impact the values. This is also validated by a ratio of ∼ 10 along the Holocene section, which is typical of lacustrine primary productivity rather than terrestrial OM (Drager et al., 2019). Moreover, variations in along the Holocene section are linked to changes between varved and non-varved intervals. values of around −32 ‰ characterized all laminated intervals and around −28 ‰ characterized the non-laminated intervals. The fact that this is a constant range during the Holocene likely indicates the homogeneous source of OM in the lake over time with a constant value of the primary OM. Thus, we argue that those more negative values are explained by less selective degradation and point to increasing organic matter preservation at the deep and intermediate lake floor (Spiker and Hatcher, 1987; Meyers, 1997; Wynn, 2007). This indicates the onset of depletion in the DO level prior to the onset of varve preservation at the deep lake floor at the boundary between units B and G. values in the shallowest core are less negative and constant along the core (Fig. 9), reflecting oxygenating conditions for the last 2 centuries. This agrees with the observation of DO dynamics in the lake, which show that the upper part of the water column, the top ∼ 12 m, is oxygenated during the whole year (Fig. 11a).
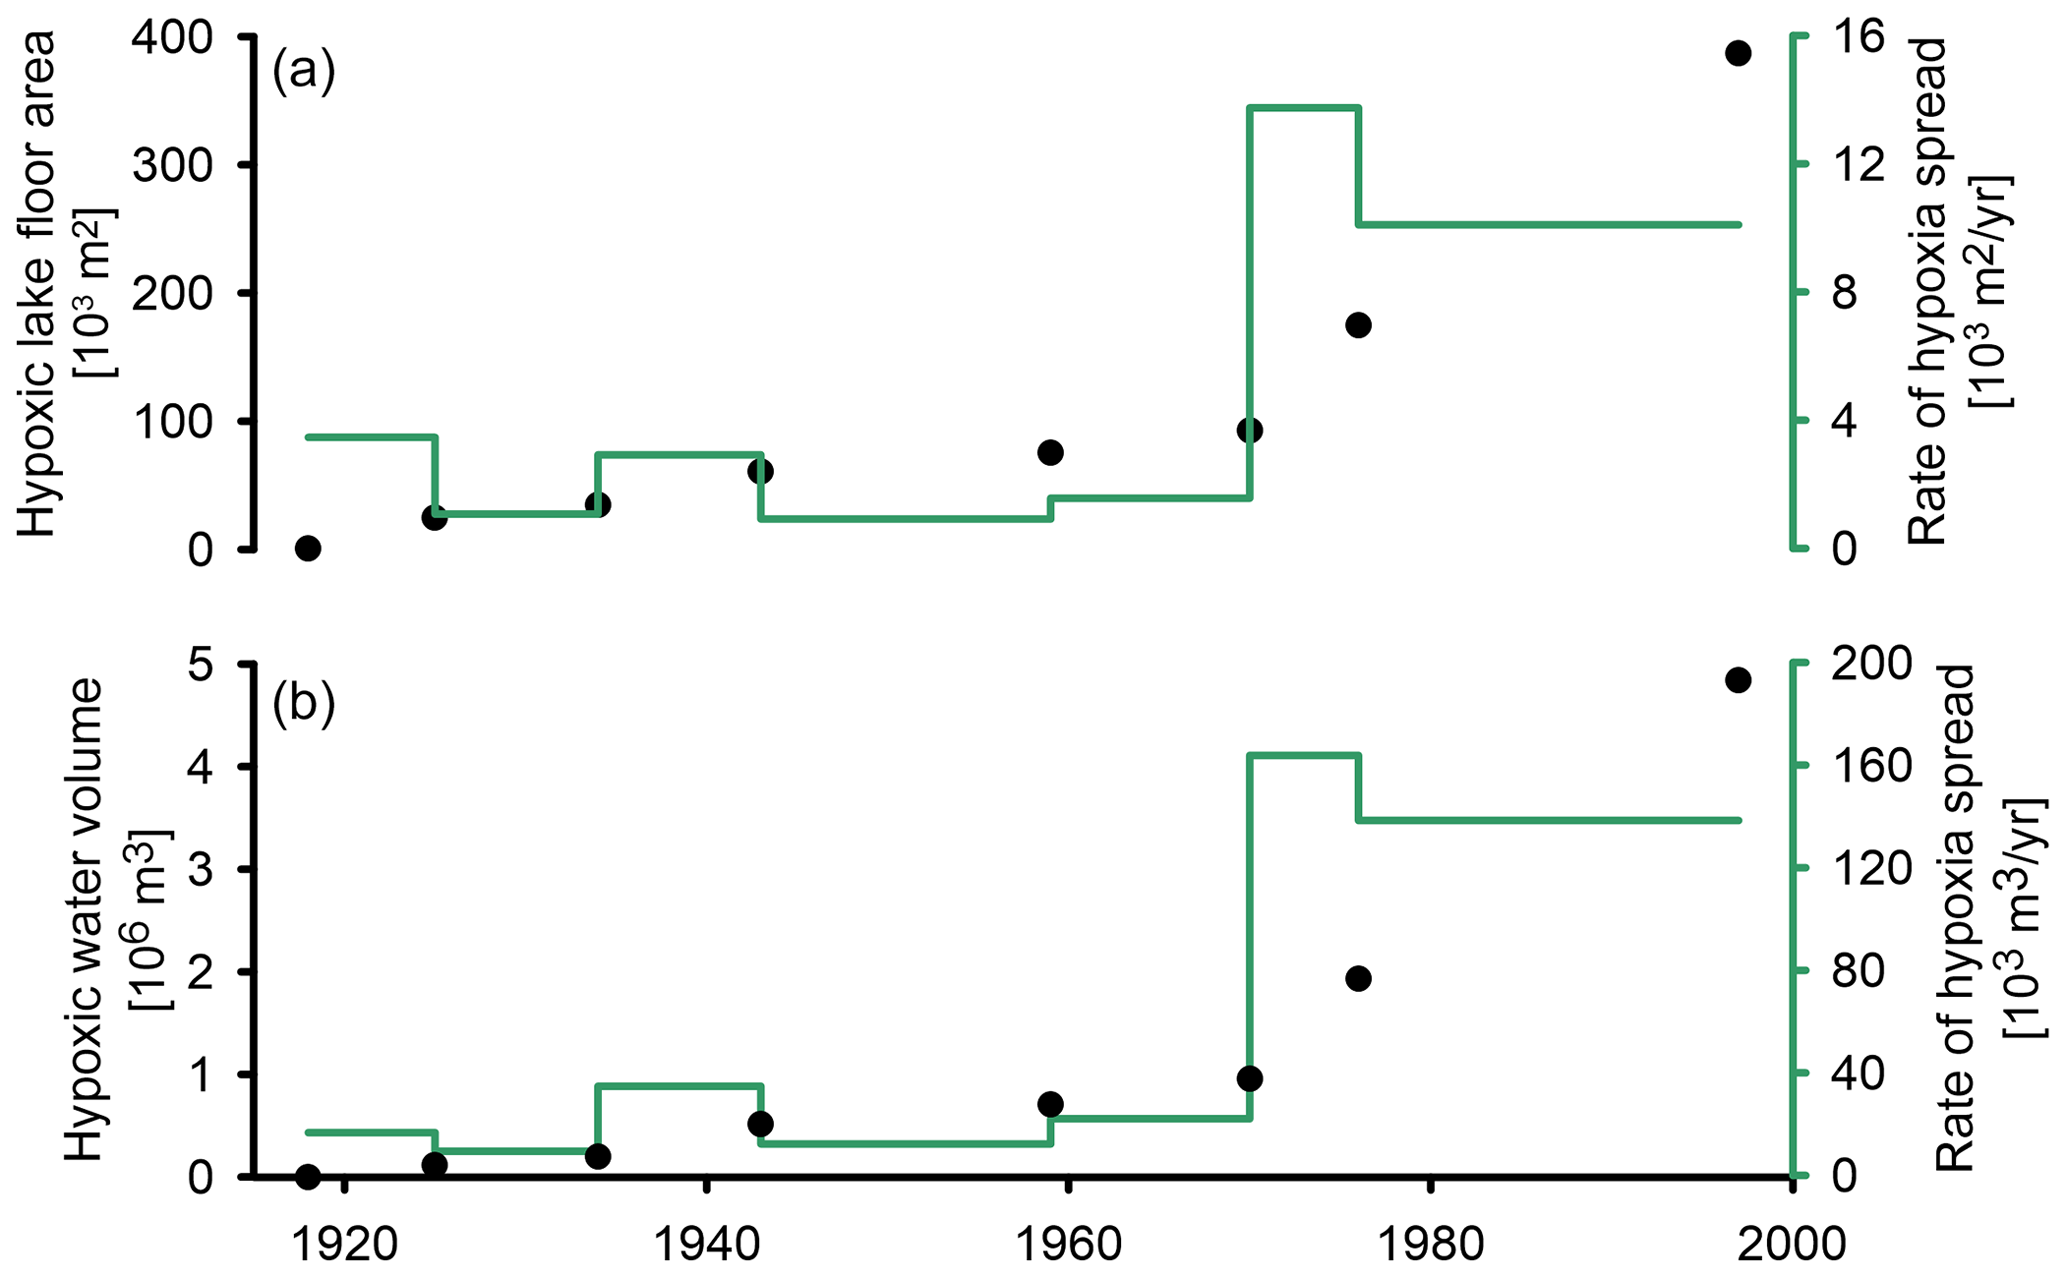
Figure 13The spread of hypoxia in the lake (black) and its rate (green) over time. (a) The rate at which the lake floor becomes hypoxic. (b) The rate at which the lake's water volume becomes hypoxic. (c) Percentage of hypoxic water volume (blue dots) and lake floor area (brown dots) from the total. The dashed lines indicate the maximal extent of hypoxia under present-day conditions when the seasonal oxycline is at ∼ 12 m depth.
The transition into hypoxic conditions is driven by the eutrophication of the lake, as previously suggested by Kienel et al. (2013) and Dräger et al. (2019). The spread of hypoxia in lakes during the last 3 centuries was shown to be a combination of changing climate conditions (Jenny et al., 2014; Jane et al., 2021) and human-induced eutrophication (Jenny et al., 2016a) in many temperate lakes. The TSK region has been an agricultural landscape in the last few centuries, which explains an increased nutrient input into the lake from industrial fertilizers and sewage. As a consequence, the internal productivity of the lake increased, as reflected by the TOC increase and the onset of diatom blooms during the deposition of the varved unit. A similar timing with respect to human-induced hypoxia was reported from other lakes in southern Baltic lowlands (Poraj-Górska et al., 2021). The contribution of climate warming, which enhances water column stratification and reduces lake circulation, might be an additional driver for hypoxia spread, as suggested globally (Jane et al., 2021). Sediment focusing was suggested to bias the primary signal, challenging the use of as a proxy for oxygen conditions (Naeher et al., 2013). In the case of the TSK record, the top varved unit is characterized by frequent fluctuations in the ratio, corresponding to the number of years, based on the varve counting. This indicates that the seasonal hypoxia controlled by the lake circulation is well recorded in the sedimentary record of the deep lake floor (Fig. 9). Thus, we conclude that the influence of sediment focusing is negligible, with no substantial impact on changes in the measured proxies that reflect the depletion of the DO in the lake.
The abundance of the remains of chironomid larvae in two cores from the deep and shallow parts of the lake basin supports our hypothesis regarding DO depletion over time. Chironomids are oxygen-sensitive organisms (Heinis and Davids, 1993; Brodersen et al., 2004; Ursenbacher et al., 2020; Perret-Gentil et al., 2024) that can live in lacustrine deepwater environments. Of the deepwater chironomid groups identified in the sediments of TSK, the M.-radialis-type is typically considered the most sensitive to eutrophication and the associated oxygen decrease. Habitats with pronounced hypoxia over extended periods of time are usually characterized by an absence of deepwater chironomid larvae, low concentrations of chironomid remains, and low absolute abundances and percentages of profundal chironomid groups in subfossil chironomid assemblages (Van Hardenbroek et al., 2011; Ursenbacher et al., 2020; Brodersen and Quinlan, 2006). Chironomid remains in core TSK15-K5 from intermediate water depth support the two-step DO depletion in the lake, as high concentrations and influx values of the total and profundal chironomids were observed in unit B, with lower abundances in unit G and negligible abundance in unit V (Fig. 10). This decrease in DO is also confirmed by the distinct reduction in the M. radialis type, which is the dominant deepwater taxon in the core (Fig. 10). The overall low concentrations, influx values, and percentages of profundal chironomids in the deepwater core TSK18-SC4 may indicate that during the entire studied interval the deepwater core was characterized by lower DO levels compared to the intermediate core. This indicates that relatively low DO levels in the depocenter of the lake prevailed even during the deposition of unit B, which is considered to reflect the most oxygenated conditions. However, the DO level at the time was insufficient for varve preservation, and only a further decrease in the DO resulted in the preservation of varves in the depocenter from the base of unit V onwards.
In summary, the transition from units B to G marks a change in the geochemical composition of the sediments driven by initial DO depletion at the lake floor prior to the onset of varve preservation. Therefore, the onset of varve preservation reflects a threshold in DO level and the duration of hypoxia required for varve preservation. The time difference between the onset of the DO depletion and the onset of varve preservation provides an estimate of the sensitivity of the lake system to environmental change.
5.3 Time shift between the onset of oxygen depletion and varve preservation
The time of the onset of geochemical changes (B–G boundary) and the onset of varve preservation (G–V boundary) is determined through the Askja 1875 cryptotephra at the transition between units B and G and the varve-dated onset of annual laminations at the different locations and ranges from ∼ 15 years in the depocenter (62 m) to ∼ 80–100 years at intermediate water depths (27–35 m) (Fig. 12). This difference implies that the cessation of bioturbation is more rapid in the depocenter compared to intermediate water depths. The faster sediment response at the depocenter to depleting DO levels can be explained by the following mechanism: (i) the depocenter experienced higher TOC flux due to sediment focusing, and thus an enhanced OM decomposition, and that drives DO depletion. (ii) At intermediate water depths, DO levels sufficiently low enough to allow varve preservation were reached later because water column mixing and circulation have more influence on DO levels than on the deep lake floor. Because seasonal hypoxia starts at the lake floor and spreads upward, at intermediate water depths the duration of hypoxia is shorter and thus also less severe.
5.4 Basin-scale spread of hypoxia
To discuss the basin-wide spread of hypoxia, we use the onset of varve preservation as a proxy for hypoxia because this is best seen in the core and comparable with other studies based on this indicator (e.g., Jenny et al., 2016b), keeping in mind, however, that DO depletion started a few decades earlier. It took ∼ 80 years from crossing the DO threshold at 62 m water depth (1918 CE ± 1) until it reached 16 m water depth in 1997 CE ± 1, which is the shallowest lake floor depth from which a core with a varved top was taken (Fig. 6). A similar rate of hypoxia spread across two phases is observed in two morphometric variables: (i) the lake floor area and (ii) the water volume (Fig. 13). In the first phase, from 1918 and 1972, the rate in which the lake floor becomes hypoxic was 1–3.5×10³ m2 yr−1, and the rate of water volume that becomes hypoxic was 10–35×103 m2 yr−1. In the second phase between 1972 and 1997, these rates increased substantially, reaching a rate of 10–14×103 m2 yr−1 for the spread of hypoxia on the lake floor and 138–164×10 m2 yr−1 of water volume that became hypoxic. Moreover, between 1918 and 1997, the proportion of the lake floor area that experienced hypoxic conditions increased to 52 % of the total lake floor (Fig. 13c; brown dots), while the water volume that became hypoxic increased only to 36 % of the total water volume (Fig. 13c; blue dots). This yields an increasing difference between the percentage of hypoxic lake floor area and water volume hypoxia over time as, at any water depth, the proportion of the lake floor that is hypoxic is larger than the proportion of the water volume. The acceleration in the rate of hypoxia spread in TSK around 1972 CE is controlled by the shape of the basin and occurred when the level of hypoxia reached a water depth of ∼ 30 m, equal to the slope break (Fig. 1). At that point, the rate at which the lake floor and the water volume became hypoxic increased by almost an order of magnitude.
The depletion of DO in the TSK during the past 2 centuries is recorded by lithological changes and geochemical and biological proxies, allowing us to identify the presence of several threshold processes.
-
The preservation of varves marks a depletion of the DO level to below a threshold of [O2] < 5 mg L−1 for 5 months and [O2] < 2 mg L−1 for 2 months under seasonal hypoxic conditions. This provides evidence that the presence of varves does not necessarily require meromictic conditions (permanent stratification).
-
According to changes in sediment geochemistry, oxygen levels initially decreased around 1875 CE and continued for another 3 to 5 decades until a threshold in oxygen depletion was crossed at the depocenter of the lake, thus allowing varve to be preserved.
-
Hypoxic conditions sufficient to allow varve preservation spread upwards in the lake basin during ∼ 80 years from the deepest part of the lake up to a water depth of 16 m. The upper limit of hypoxic conditions is defined by the oxycline, roughly reflecting the thermocline, above which permanent oxygenated conditions prevail, and no varves are present.
-
The basin morphology controls the spread of hypoxia which occurred in two phases. An acceleration occurred during the 1970s when the level of hypoxia reached the slope break at ∼ 30 m.
-
The biogeochemical cycles in the lake reflected in the calcite, diatom production, and TOC deposition intensified with the development of hypoxic conditions.
All raw data can be found at the GFZ data archive https://doi.org/10.5880/GFZ.4.3.2024.002 (Sirota et al., 2024).
The supplement related to this article is available online at: https://doi.org/10.5194/bg-21-4317-2024-supplement.
IS – conceptualization, data curation, investigation, funding acquisition, visualization, and writing (original draft). RT – data curation, formal analysis, visualization, software, and writing (review and editing). SP – data curation and writing (review and editing). BS – data curation and writing (review and editing). MA – data curation. RK – data curation. OH – data curation, visualization, and writing (review and editing). SB – data curation, visualization, and writing (review and editing). AB – conceptualization, investigation, funding acquisition, project administration, and writing (review and editing).
The contact author has declared that none of the authors has any competing interests.
Publisher's note: Copernicus Publications remains neutral with regard to jurisdictional claims made in the text, published maps, institutional affiliations, or any other geographical representation in this paper. While Copernicus Publications makes every effort to include appropriate place names, the final responsibility lies with the authors.
Brian Brademann and Karla Wurz are thanked for their assistance in the field- and lab work. The authors thank two anonymous referees for their careful review. Ido Sirota has been supported by a post-doctoral fellowship from the Alexander von Humboldt Foundation. The monitoring equipment used in this study was funded by the TERrestrial ENvironmental Observatories (TERENO) infrastructure initiative of the Helmholtz Association (NE Germany). It is furthermore a contribution to the Helmholtz climate initiative REKLIM (Regional Climate Change and Humans) with respect to “Research Theme 3: Extreme events across temporal and spatial scales”.
This research has been supported by the Alexander von Humboldt-Stiftung and the Helmholtz Association.
The article processing charges for this open-access publication were covered by the Helmholtz Centre Potsdam – GFZ German Research Centre for Geosciences.
This paper was edited by Sebastian Naeher and reviewed by two anonymous referees.
Anderson, R. Y. and Dean, W. E.: Lacustrine varve formation through time, Palaeogeogr. Palaeocl., 62, 215–235, 1988.
Arthur, M. A. and Dean, W. E.: Organic-matter production and preservation and evolution of anoxia in the Holocene Black Sea, Paleoceanography, 13, 395–411, 1998.
Benner, R., Fogel, M. L., Sprague, E. K., and Hodson, R. E.: Depletion of 13C in lignin and its implications for stable carbon isotope studies, Nature, 329, 708–710, 1987.
Bertrand, S., Tjallingii, R., Kylander, M. E., Wilhelm, B., Roberts, S. J., Arnaud, F., Brown, E., and Bindler, R.: Inorganic geochemistry of lake sediments: A review of analytical techniques and guidelines for data interpretation, Earth Sci. Rev., 249, 104639, https://doi.org/10.1016/j.earscirev.2023.104639, 2024.
Blockley, S. P., Pyne-O'Donnell, S. D., Lowe, J. J., Matthews, I. P., Stone, A., Pollard, A. M., Turney, C. S. M., and Molyneux, E. G.: A new and less destructive laboratory procedure for the physical separation of distal glass tephra shards from sediments, Quaternary Sci. Rev. 24, 1952–1960, 2005.
Boyall, L., Valcárcel, J. I., Harding, P., Hernández, A., and Martin-Puertas, C.: Disentangling the environmental signals recorded in Holocene calcite varves based on modern lake observations and annual sedimentary processes in Diss Mere, England, J. Paleolimnol., 70, 39–56, https://doi.org/10.1007/s10933-023-00282-z, 2023.
Brauer, A. and Casanova, J.: Chronology and depositional processes of the laminated sediment record from Lac d'Annecy, French Alps, J. Paleolimnol., 25, 163–177, 2001.
Brauer, A., Schwab, M. J., Brademann, B., Pinkerneil, S., and Theuerkauf, M.: Tiefer See – a key site for lake sediment research in NE Germany, DEUQUA Spec. Pub., 2, 89–93, https://doi.org/10.5194/deuquasp-2-89-2019, 2019.
Brodersen, K. P. and Quinlan, R.: Midges as palaeoindicators of lake productivity, eutrophication and hypolimnetic oxygen, Quaternary Sci. Rev., 25, 1995–2012, 2006.
Brodersen, K. P., Pedersen, O., Lindegaard, C., and Hamburger, K.: Chironomids (Diptera) and oxy-regulatory capacity: an experimental approach to paleolimnological interpretation, Limnol. Oceanogr., 49, 1549–1559, 2004.
Brooks, S. J., Langdon, P. G., and Heiri, O.: The identification and use of Palaearctic Chironomidae larvae in palaeoecology, Quat. Res. Assoc. Techn. Guide, 10, 1–276, https://edoc.unibas.ch/67001/ (last access: 21 September 2024), 2007.
Buatois, L. A., Renaut, R. W., Owen, R. B., Behrensmeyer, A. K., and Scott, J. J.: Animal bioturbation preserved in Pleistocene magadiite at Lake Magadi, Kenya Rift Valley, and its implications for the depositional environment of bedded magadiite, Sci. Rep., 10, 6794, https://doi.org/10.1038/s41598-020-63505-7, 2020.
Davies, B. R.: The dispersal of Chironomidae larvae: a review, J. Entomol. Soc. South. Afr., 39, 39–62, 1976.
Dean, W. E. and Gorham, E.: Magnitude and significance of carbon burial in lakes, reservoirs, and peatlands, Geology, 26, 535–538, 1998.
Diaz, R. J. and Rosenberg, R.: Marine benthic hypoxia: A review of its ecological effects and the behavioural response of benthic macrofauna, Oceanogr. Mar. Biol., 33, 245–303, 1995.
Diaz, R. J. and Rosenberg, R.: Spreading dead zones and consequences for marine ecosystems, Science, 321, 926–929, 2008.
Dräger, N., Plessen, B., Kienel, U., Słowinski, M., Ramisch, A., Tjallingii, R., Pinkerneil, S., and Brauer, A.: Hypolimnetic oxygen conditions influence varve preservation and δ13C of sediment organic matter in Lake Tiefer See, NE Germany, J. Paleolimnol., 62, 181–194, 2019.
Dräger, N., Theuerkauf, M., Szeroczyńska, K., Wulf, S., Tjallingii, R., Plessen, B., Kienel, U., and Brauer, A.: Varve microfacies and varve preservation record of climate change and human impact for the last 6000 years at Lake Tiefer See (NE Germany), Holocene, 27, 450–464, https://doi.org/10.1177/0959683616660173, 2017.
Evans, G., Augustinus, P., Gadd, P., Zawadzki, A., and Ditchfield, A.: A multi-proxy μ-XRF inferred lake sediment record of environmental change spanning the last ca. 2230 years from Lake Kanono, Northland, New Zealand, Quaternary Sci. Rev., 225, 106000, https://doi.org/10.1016/j.quascirev.2019.106000, 2019.
Friedrich, J., Janssen, F., Aleynik, D., Bange, H. W., Boltacheva, N., Çagatay, M. N., Dale, A. W., Etiope, G., Erdem, Z., Geraga, M., Gilli, A., Gomoiu, M. T., Hall, P. O. J., Hansson, D., He, Y., Holtappels, M., Kirf, M. K., Kononets, M., Konovalov, S., Lichtschlag, A., Livingstone, D. M., Marinaro, G., Mazlumyan, S., Naeher, S., North, R. P., Papatheodorou, G., Pfannkuche, O., Prien, R., Rehder, G., Schubert, C. J., Soltwedel, T., Sommer, S., Stahl, H., Stanev, E. V., Teaca, A., Tengberg, A., Waldmann, C., Wehrli, B., and Wenzhöfer, F.: Investigating hypoxia in aquatic environments: diverse approaches to addressing a complex phenomenon, Biogeosciences, 11, 1215–1259, https://doi.org/10.5194/bg-11-1215-2014, 2014.
Sirota, I., Tjallingii, R., Pinkerneil, S., Schroeder, B., Albert, M., Kearney, R., Heiri, O., Breu, S., Brauer, A.: Sedimentological, geochemical and biological data of sediment cores from lake Tiefer (NE Germany), GFZ Data Services [data set], https://doi.org/10.5880/GFZ.4.3.2024.002, 2024.
He, W., You, L., Chen, M., Tuo, Y., Liao, N., Wang, H., and Li, J.: Varied sediment archive of Fe and Mn contents under changing reservoir mixing patterns, oxygenation regimes, and runoff inputs, Ecol. Indic., 147, 109967, https://doi.org/10.1016/j.ecolind.2023.109967, 2023.
Heinis, F. and Davids, C.: Factors governing the spatial and temporal distribution of chironomid larvae in the Maarsseveen lakes with special emphasis on the role of oxygen conditions, Neth. J. Aquat. Ecol., 27, 21–34, 1993.
Hunt, J. B. and Hill, P. G.: An inter-laboratory comparison of the electron probe microanalysis of glass geochemistry, Quaternary Int., 34, 229–241, 1996.
Jane, S. F., Hansen, G. J., Kraemer, B. M., Leavitt, P. R., Mincer, J. L., North, R. L., and Rose, K. C.: Widespread deoxygenation of temperate lakes, Nature, 594, 66–70, 2021.
Jankowski, T., Livingstone, D. M., Bührer, H., Forster, R., and Niederhauser, P.: Consequences of the 2003 European heat wave for lake temperature profiles, thermal stability, and hypolimnetic oxygen depletion: Implications for a warmer world, Limnol. Oceanogr., 51, 815–819, 2006.
Jenny, J. P., Arnaud, F., Dorioz, J. M., Giguet Covex, C., Frossard, V., Sabatier, P., Millet, L., Reyss, J. L., Tachikawa, K., Bard, E., Pignol, C., Soufi, F., Romeyer, O., and Perga, M. E.: A spatiotemporal investigation of varved sediments highlights the dynamics of hypolimnetic hypoxia in a large hard-water lake over the last 150 years, Limnol. Oceanogr., 58, 1395–1408, https://doi.org/10.4319/lo.2013.58.4.1395, 2013.
Jenny, J. P., Arnaud, F., Alric, B., Dorioz, J. M., Sabatier, P., Meybeck, M., and Perga, M. E.: Inherited hypoxia: A new challenge for reoligotrophicated lakes under global warming, Global Biogeochem. Cy., 28, 1413–1423, https://doi.org/10.1002/2014GB004932, 2014.
Jenny, J.-P., Normandeau, A., Francus, P., Ecaterina, Z., Taranue, I., Eavese, G., Lapointea, F., Jautzy, J., Ojala, A., E. K., Dorioz, J.-M., Schimmelmannk, A., and Zolitschkal, B.: Urban point sources of nutrients were the leading cause for the historical spread of hypoxia across European lakes, P. Natl. Acad. Sci. USA, 13, 12655–12660, 2016a.
Jenny, J. P., Francus, P., Normandeau, A., Lapointe, F., Perga, M. E., Ojala, A., Schimmelmann, A., and Zolitschka, B.: Global spread of hypoxia in freshwater ecosystems during the last three centuries is caused by rising local human pressure, Glob. Change Biol., 22, 1481–1489, https://doi.org/10.1111/gcb.13193, 2016b.
Jochum, K. P., Stoll, B., Herwig, K., Willbold, M., Hofmann, A. W., Amini, M., Aarburg, S., Abouchami, W., Hellebrand, E., Mocek, B., Raczek, I., Stracke, A., Alard, O., Bouman, C., Becker, S., Dücking, M., Brätz, H., Klemd, R., Bruin, D., Canil, D., Cornell, D., Hoog, C., Dalpé, C., Danyushevsky, L., Eisenhauer, A., Gao, Y., Snow, J. E., Groschopf, N., Günther, D., Latkoczy, C., Guillong, M., Hauri, E. H., Höfer, H. E., Lahaye, Y., Horz, K., Jacob, D. E., Kasemann, S. A., Kent, A. J. R., Ludwig, T., Zack, T., Mason, P. R. D., Meixner, A., Rosner, M., Misawa, K., Nash, B. P., Pfänder, J., Premo, W. R., Sun, W. D., Tiepolo, M., Vannucci, R., Vennemann, T., Wayne, D., and Woodhead, J. D.: MPI-DING reference glasses for in situ microanalysis: New reference values for element concentrations and isotope ratios, Geochem. Geophy. Geosy., 7, Q02008, https://doi.org/10.1029/2005GC001060, 2006.
Kastowski, M., Hinderer, M., and Vecsei, A.: Long-term carbon burial in European lakes: Analysis and estimate, Global Biogeochem. Cy., 25, GB3019, https://doi.org/10.1029/2010GB003874, 2011.
Kelts, K. and Hsü, K. J.: Freshwater Carbonate Sedimentation, in: Freshwater carbonate sedimentation. In Lakes: chemistry, geology, physics, edited by: Lerman, A., Springer New York, New York, NY, Chap. 9, 295–323, https://doi.org/10.1007/978-1-4757-1152-3_9, 1978.
Kienel, U., Dulski, P., Ott, F., Lorenz, S., and Brauer, A.: Recently induced anoxia leading to the preservation of seasonal laminae in two NE-German lakes, J. Paleolimnol., 50, 535–544, https://doi.org/10.1007/s10933-013-9745-3, 2013.
Kienel, U., Kirillin, G., Brademann, B., Plessen, B., Lampe, R., and Brauer, A.: Effects of spring warming and mixing duration on diatom deposition in deep Tiefer See, NE Germany, J. Paleolimnol., 57, 37–49, https://doi.org/10.1007/s10933-016-9925-z, 2017.
Lane, C. S., Cullen, V. L., White, D., Bramham-Law, C. W. F., and Smith, V. C.: Cryptotephra as a dating and correlation tool in archaeology, J. Archaeol. Sci., 42, 42–50, 2014.
Lehmann, M. F., Bernasconi, S. M., Barbieri, A., and McKenzie, J. A.: Preservation of organic matter and alteration of its carbon and nitrogen isotope composition during simulated and in situ early sedimentary diagenesis, Geochim. Cosmochim. Ac., 66, 3573–3584, 2002.
Liu, J., Chen, Q., Yang, Y., Wei, H., Laipan, M., Zhu, R., He, H., and Hochella Jr, M. F.: Coupled redox cycling of Fe and Mn in the environment: The complex interplay of solution species with Fe-and Mn-(oxyhydr) oxide crystallization and transformation, Earth-Sci. Rev., 232, 104105, https://doi.org/10.1016/j.earscirev.2022.104105, 2022.
Loizeau, J. L., Span, D., Coppee, V., and Dominik, J.: Evolution of the trophic state of Lake Annecy (eastern France) since the last glaciation as indicated by iron, manganese and phosphorus speciation, J. Paleolimnol., 25, 205–214, 2001.
Makri, S., Wienhues, G., Bigalke, M., Gilli, A., Rey, F., Tinner, W., and Grosjean, M.: Variations of sedimentary Fe and Mn fractions under changing lake mixing regimes, oxygenation and land surface processes during Late-glacial and Holocene times, Sci. Total Environ., 755, 143418, https://doi.org/10.1016/j.scitotenv.2020.143418, 2021.
Meire, L., Soetaert, K. E. R., and Meysman, F. J. R.: Impact of global change on coastal oxygen dynamics and risk of hypoxia, Biogeosciences, 10, 2633–2653, https://doi.org/10.5194/bg-10-2633-2013, 2013.
Melton, E. D., Swanner, E. D., Behrens, S., Schmidt, C., and Kappler, A.: The interplay of microbially mediated and abiotic reactions in the biogeochemical Fe cycle, Nat. Rev. Microbiol., 12, 797–808, 2014.
Mendonça, R., Müller, R. A., Clow, D., Verpoorter, C., Raymond, P., Tranvik, L. J., and Sobek, S.: Organic carbon burial in global lakes and reservoirs, Nat. Commun., 8, 1694, https://doi.org/10.1038/s41467-017-01789-6, 2017.
Meyers, P. A.: Organic geochemical proxies of paleoceanographic, paleolimnologic, and paleoclimatic processes, Org. Geochem., 27, 213–250, 1997.
Mollenhauer, G. and Eglinton, T. I.: Diagenetic and sedimentological controls on the composition of organic matter preserved in California Borderland Basin sediments, Limnol. Oceanogr., 52, 558–576, 2007.
Mulholland, P. J. and Elwood, J. W.: The role of lake and reservoir sediments as sinks in the perturbed global carbon cycle, Tellus, 34, 490–499, 1982.
Naeher, S., Gilli, A., North, R. P., Hamann, Y., and Schubert, C. J.: Tracing bottom water oxygenation with sedimentary ratios in Lake Zurich, Switzerland, Chem. Geol., 352, 125–133, 2013.
Njiru, M., Nyamweya, C., Gichuki, J., Mugidde, R., Mkumbo, O., and Witte, F.: Increase in anoxia in Lake Victoria and its effects on the fishery, in: Anoxia, edited by: Padilla, P., 99–128, https://doi.org/10.5772/27461, 2012.
Nürnberg, G. K.: Quantified Hypoxia and Anoxia in Lakes and Reservoirs, Sci. World J., 4, 42–54, https://doi.org/10.1100/tsw.2004.5, 2004.
Ojala, A. E., Saarinen, T., and Salonen, V. P.: Preconditions for the formation of annually laminated lake sediments in southern and central Finland, Boreal Environ. Res., 5, 243–255, 2000.
O'Reilly, C. M., Sharma, S., Gray, D. K., Hampton, S. E., Read, J. S., Rowley, R. J., Schneider, P., Lenters, J. D., McIntyre, P. B., Kraemer, B. M., Weyhenmeyer, G. A., Straile, D., Dong, B., Adrian, R., Allan, M. G., Anneville, O., Arvola, L., Austin, J., Bailey, J. L., Baron, J. S., Brookes, J. D., De Eyto, E., Dokulil, M. T., Hamilton, D. P., Havens, K., Hetherington, A. L., Higgins, S. N., Hook, S., Izmest'Eva, L. R., Joehnk, K. D., Kangur, K., Kasprzak, P., Kumagai, M., Kuusisto, E., Leshkevich, G., Livingstone, D. M., MacIntyre, S., May, L., Melack, J. M., Mueller-Navarra, D. C., Naumenko, M., Noges, P., Noges, T., North, R. P., Plisnier, P. D., Rigosi, A., Rimmer, A., Rogora, M., Rudstam, L. G., Rusak, J. A., Salmaso, N., Samal, N. R., Schindler, D. E., Schladow, S. G., Schmid, M., Schmidt, S. R., Silow, E., Soylu, M. E., Teubner, K., Verburg, P., Voutilainen, A., Watkinson, A., Williamson, C. E., and Zhang, G.: Rapid and highly variable warming of lake surface waters around the globe, Geophys. Res. Lett., 42, 10773-10781, https://doi.org/10.1002/2015GL066235, 2015.
Perret-Gentil, N., Rey, F., Gobet, E., Tinner, W., and Heiri, O.: Human impact leads to unexpected oligotrophication and deepwater oxygen increase in a Swiss mountain lake, Holocene, 34, 189–201, 2024.
Poraj-Górska, A. I., Bonk, A., Żarczyński, M., Kinder, M., and Tylmann, W.: Varved lake sediments as indicators of recent cultural eutrophication and hypolimnetic hypoxia in lakes, Anthropocene, 36, 100311, https://doi.org/10.1016/j.ancene.2021.100311, 2021.
Roeser, P., Drager, N., Dariusz, B., Ott, F., Pinkerneil, S., Gierszewski, P., Lindemann, C., Plessen, B., Brademann, B., Kaszubski, M., Schwab, M. J., Slowinski, M., Blaszkiewicz, W., and Brower, A.: Advances in understanding calcite varve formation: new insights from a dual lake monitoring approach in the southern Baltic lowlands, Boreas, 50, 419–440, https://doi.org/10.1111/bor.12506, 2021.
Saether, O. A.: Chironomid communities as water quality indicators, Ecography, 2, 65–74, 1979.
Sanchini, A., Szidat, S., Tylmann, W., Vogel, H., Wacnik, A., and Grosjean, M.: A Holocene high-resolution record of aquatic productivity, seasonal anoxia and meromixis from varved sediments of Lake Łazduny, North-Eastern Poland: insight from a novel multi-proxy approach, J. Quaternary Sci., 35, 1070–1080, 2020.
Schaffner, L. C., Jonsson, P., Diaz, R. J., Rosenberg, R., and Gapcynski, P.: Benthic communities and bioturbation history of estuarine and coastal systems: effects of hypoxia and anoxia, Mar. Coast. Eutrophicat., 1992, 1001–1016, https://doi.org/10.1016/B978-0-444-89990-3.50087-0, 1992.
Shatkay, M., Anati, D. A., and Gat, J. R.: Dissolved oxygen in the Dead Sea – seasonal changes during the holomictic stage, Int. J. Salt Lake Res., 2, 93–110, 1993.
Sobek, S., Durisch-Kaiser, E., Zurbrügg, R., Wongfun, N., Wessels, M., Pasche, N., and Wehrli, B.: Organic carbon burial efficiency in lake sediments controlled by oxygen exposure time and sediment source, Limnol. Oceanogr., 54, 2243–2254, 2009.
Sorrel, P., Jacq, K., Van Exem, A., Escarguel, G., Dietre, B., Debret, M., and Oberhänsli, H.: Evidence for centennial-scale Mid-Holocene episodes of hypolimnetic anoxia in a high-altitude lake system from central Tian Shan (Kyrgyzstan), Quaternary Sci. Rev., 252, 106748, https://doi.org/10.1016/j.quascirev.2020.106748, 2021.
Spiker, E. C. and Hatcher, P. G.: The effects of early diagenesis on the chemical and stable carbon isotopic composition of wood, Geochim. Cosmochim. Ac., 51, 1385–1391, 1987.
Steinsberger, T., Schmid, M., Wüest, A., Schwefel, R., Wehrli, B., and Müller, B.: Organic carbon mass accumulation rate regulates the flux of reduced substances from the sediments of deep lakes, Biogeosciences, 14, 3275–3285, https://doi.org/10.5194/bg-14-3275-2017, 2017.
Straile, D., Jöhnk, K., and Rossknecht, H.: Complex effects of winter warming on the physicochemical characteristics of a deep lake, Limnol. Oceanogr., 48, 1432–1438, https://doi.org/10.4319/lo.2003.48.4.1432, 2003.
Teranes, J. L. and Bernasconi, S. M.: Factors controlling δ13C values of sedimentary carbon in hypertrophic Baldeggersee, Switzerland, and implications for interpreting isotope excursions in lake sedimentary records, Limnol. Oceanogr., 50, 914–922, 2005.
Thamdrup, B.: Bacterial manganese and iron reduction in aquatic sediments, in: Advances in microbial ecology, Springer, Boston, 41–84, https://doi.org/10.1007/978-1-4615-4187-5_2, 2000.
Theuerkauf, M., Blume, T., Brauer, A., Dräger, N., Feldens, P., Kaiser, K., and Schult, M.: Holocene lake-level evolution of Lake Tiefer See, NE Germany, caused by climate and land cover changes, Boreas, 51, 299–316, 2022.
Tjallingii, R., Röhl, U., Kölling, M., and Bickert, T.: Influence of the water content on X-ray fluorescence core-scanning measurements in soft marine sediments, Geochem. Geophy. Geosy., 8, Q02004, https://doi.org/10.1029/2006GC001393, 2007.
Tranvik, L. J., Downing, J. A., Cotner, J. B., Loiselle, S. A., Striegl, R. G., Ballatore, T. J., and Weyhenmeyer, G. A.: Lakes and reservoirs as regulators of carbon cycling and climate, Limnol. Oceanogr., 54, 2298–2314, 2009.
Tylmann, W., Szpakowska, K., Ohlendorf, C., Woszczyk, M., and Zolitschka, B.: Conditions for deposition of annually laminated sediments in small meromictic lakes: A case study of Lake Suminko (Northern Poland), J. Paleolimnol., 47, 55–70, https://doi.org/10.1007/s10933-011-9548-3, 2012.
Tyson, R. V. and Pearson, T. H.: Modern and ancient continental shelf anoxia: an overview, Geological Society, London, Special Publications, 58, 1–24, https://doi.org/10.1144/GSL.SP.1991.058.01.01, 1991.
Ursenbacher, S., Stötter, T., and Heiri, O.: Chitinous aquatic invertebrate assemblages in Quaternary lake sediments as indicators of past deepwater oxygen concentration, Quaternary Sci. Rev., 231, 106203, https://doi.org/10.1016/j.quascirev.2020.106203, 2020.
Van Hardenbroek, M., Heiri, O., Wilhelm, M. F., and Lotter, A. F.: How representative are subfossil assemblages of Chironomidae and common benthic invertebrates for the living fauna of Lake De Waay, the Netherlands?, Aquat. Sci., 73, 247–259, 2011.
Vaquer-Sunyer, R. and Duarte, C. M.: Thresholds of hypoxia for marine biodiversity, P. Natl. Acad. Sci. USA, 105, 15452–15457, 2008.
Weltje, G. J., Bloemsma, M. R., Tjallingii, R., Heslop, D., Röhl, U., and Croudace, I. W.: Prediction of Geochemical Composition from XRF Core Scanner Data: A New Multivariate Approach Including Automatic Selection of Calibration Samples and Quantification of Uncertainties, in: Micro-XRF Studies of Sediment Cores, edited by: Croudace, I. and Rothwell, R., Developments in Paleoenvironmental Research, Vol. 17. Springer, Dordrecht, https://doi.org/10.1007/978-94-017-9849-5_21, 2015.
Wetzel, R. G.: Limnology: lake and river ecosystemsþ, 3rd Edn., Vol. 1, Elsevier, Academic press, San Diego, 2001.
Wiederholm, T.: Chironomidae of the holarctic region, Keys and diagnoses, Part 1: larva, Vol. 19, 1–457, 1983.
Wulf, S., Dräger, N., Ott, F., Serb, J., Appelt, O., Guðmundsdóttir, E., Van den Bogaard, C., Slowinski, M., Blaszkiewicz, M., and Brauer, A.: Holocene tephrostratigraphy of varved sediment records from Lakes Tiefer See (NE Germany) and Czechowskie (N Poland), Quaternary Sci. Rev., 132, 1–14, 2016.
Wynn, J. G.: Carbon isotope fractionation during decomposition of organic matter in soils and paleosols: Implications for paleoecological interpretations of paleosols, Palaeogeogr. Palaeocl., 251, 437–448, 2007.
Zander, P. D., Żarczyński, M., Vogel, H., Tylmann, W., Wacnik, A., Sanchini, A., and Grosjean, M.: A high-resolution record of Holocene primary productivity and water-column mixing from the varved sediments of Lake Żabińskie, Poland, Sci. Total Environ., 755, 143713, https://doi.org/10.1016/j.scitotenv.2020.143713, 2021.
Żarczyński, M., Wacnik, A., and Tylmann, W.: Tracing lake mixing and oxygenation regime using the ratio in varved sediments: 2000 year-long record of human-induced changes from Lake Żabińskie (NE Poland), Sci. Total Environ., 657, 585–596, 2019.
Zolitschka, B., Francus, P., Ojala, A. E. K., and Schimmelmann, A.: Varves in lake sediments – a review, Quaternary Sci. Rev., 117, 1–41, https://doi.org/10.1016/j.quascirev.2015.03.019, 2015.