the Creative Commons Attribution 4.0 License.
the Creative Commons Attribution 4.0 License.
 | 14 Oct 2024
Riverine nutrient impact on global ocean nitrogen cycle feedbacks and marine primary production in an Earth system model
Miriam Tivig
David P. Keller
Andreas Oschlies
Riverine nutrient export is an important process in marine coastal biogeochemistry and also impacts global marine biology. The nitrogen cycle is a key player here. Internal feedbacks are shown to regulate not only nitrogen distribution, but also primary production and thereby oxygen concentrations. Phosphorus is another essential nutrient and interacts with the nitrogen cycle via different feedback mechanisms. After a previous study of the marine nitrogen cycle response to riverine nitrogen supply, here we include phosphorus from river export with different phosphorus burial scenarios and study the impact of phosphorus alone and in combination with nitrogen in a global 3D ocean biogeochemistry model. Again, we analyse the effects on near-coastal and open-ocean biogeochemistry. We find that riverine export of bioavailable phosphorus alone or in conjunction with nitrogen affects marine biology on millennial timescales more than riverine nitrogen alone. Biogeochemical feedbacks in the marine nitrogen cycle are strongly influenced by additional phosphorus. Where bioavailable phosphorus increases with river input, nitrogen concentration increases as well, except for in regions with diminishing oxygen concentrations. High phosphorus burial rates decrease biological production significantly. Globally, the addition of riverine phosphorus in the modelled ocean leads to elevated primary production rates in the coastal and open oceans.
- Article
(18272 KB) - Full-text XML
- BibTeX
- EndNote


Nitrogen and phosphorus are both considered limiting nutrients in the global ocean. “Limiting” refers here to the concept of Liebig's law of the minimum, i.e. the growth rate being determined by the availability of the most limiting substrate (Liebig, 1840). It states that growth is dictated not by total resources available but by the scarcest resource (limiting factor). Nitrogen can be considered the “proximate limiting” and phosphorus as the “ultimate limiting” nutrient, according to the definition by Tyrrell (1999). Changes in the availability of oceanic fixed nitrogen (N) are known to have driven marine productivity changes, thereby regulating the strength of the biological carbon pump. Because of this, the availability of N also influences the carbon cycle in the atmosphere and in the ocean (Falkowski, 1997). Phosphorus (P) limits marine productivity on geological and global scales and plays an important role in regulating oceanic oxygen inventories (Monteiro et al., 2012; Palastanga et al., 2011).
Oceanic fixed-nitrogen concentrations are mainly controlled by the balance between nitrogen fixation and denitrification, but atmospheric deposition and riverine input also contribute to the global N budget (Somes et al., 2013; Deutsch et al., 2007; Gruber, 2004; Ruttenberg, 2003). Although several studies question the stability of the marine N inventory (Zehr and Capone, 2020; Codispoti et al., 2001; Gruber and Sarmiento, 1997; Codispoti, 1995), the pre-industrial global nitrogen cycle is often assumed to reflect a steady state (Deutsch et al., 2007; Altabet, 2006; Gruber, 2004; Tyrrell, 1999; Redfield et al., 1963).
This balance is assured by negative N-cycle feedbacks that stabilize the marine N inventory: where fixed N is sparse, diazotrophs can fix atmospheric N2 instead of depending on dissolved inorganic nitrogen (DIN), such as ammonia or nitrate. But as the process of atmospheric N fixation is slow and requires more energy, mostly to keep oxygen away from the oxygen-sensitive enzyme nitrogenase, diazotrophs are rapidly outcompeted by other phytoplankton that do not have this energetic cost if sufficient DIN is available. Growth of diazotrophs is also limited by the availability of phosphate, light, and iron.
On the other hand, the global marine N budget is regulated by loss of fixed N, predominantly via denitrification. This process describes anaerobic respiration of organic matter via bacterial reduction of nitrate to N2 and occurs in the water column as well as in sediments if the oxygen concentration is low (Gruber, 2004; Deutsch et al., 2001). Denitrification limits itself, as the consumption of nitrate leads to a reduction in the production of organic matter and hence to less oxygen consumption.
Generally the processes of N2 fixation and denitrification take place in different regions of the world ocean. Still, feedbacks link these processes globally and are generally assumed to restore the balance in the global marine N budget. In some regions, however, N2 fixation and denitrification occur in geographical proximity and may produce a “vicious cycle” with a local runaway loss of fixed N (Landolfi et al., 2013). Estimates of the mean residence time of fixed nitrogen in the global ocean amount to a few thousand years (Gruber, 2004). Due to the complexity of internal feedbacks and the dynamic role of nitrogen in the marine biological production it is difficult to assess how sensitive the global N concentration is to perturbations in the marine biogeochemistry.
In a previous study (Tivig et al., 2021), we used the University of Victoria Earth System Climate Model (UVic ESCM, also referred to in this paper simply as UVic) of intermediate complexity, version 2.9 (Eby et al., 2009; Weaver et al., 2001), to study N-cycle feedbacks in the modelled ocean in response to the addition of riverine dissolved inorganic nitrogen. We found that, although in hot spots near the river mouths marine primary production increased due to the additional N, globally, biogeochemical feedbacks stabilized N concentrations and primary production and could even lead to a local decline in N and productivity in proximity to low-oxygen regions. In those idealized simulations, N was the only nutrient supplied via rivers.
With this work, we confirmed an early study by Tyrrell (1999), who used a box model and found that “an increase in the river delivery of nitrate has no long-term effect on productivity”. But Tyrrell (1999) also concluded that “an increase in the river delivery of phosphate, on the other hand, causes a sustained and proportionate increase in productivity”. The interaction between fixed N and P is of particular interest for marine primary production. The availability of P is one of the limiting factors for N2 fixation (Wang et al., 2019; Landolfi et al., 2015).
In Tivig et al. (2021) we also found that, locally, marine productivity was increased by riverine N supply. Riverine supply of P is predicted to regulate total ocean productivity globally (Tyrrell, 1999). Nevertheless, locally, in coastal oceans and in regions with low oxygen concentrations, the sensitivity of marine biogeochemistry to perturbations of the nutrient cycle can differ from global averages.
The total P inventory in the global ocean is mainly controlled by riverine input and burial at the seafloor (Wallmann, 2010; Ruttenberg, 2003; Baturin, 2003; Delaney, 1998). The residence time of P in the global ocean is approximately 1 order of magnitude longer than that of fixed N (Delaney, 1998). Processes of (bio)chemical weathering on continents represent the main source of riverine bioavailable P (Filipelli, 2008; Föllmi, 1995). Changes in the marine P inventory are mostly a consequence of changes in terrestrial weathering and therefore have generally occurred on geological timescales.
Nevertheless, climate change and direct anthropogenic interventions in the P cycle have started to alter P fluxes during the last century. Due to the widespread use of fertilizers, to deforestation, and to sewage sources, the riverine load of phosphorus has increased globally (Seitzinger et al., 2010; Filipelli, 2008). In addition, river flows have been dramatically altered by land use change and the damming of rivers (Cappellen and Maavara, 2016). In order to predict future changes in marine biogeochemistry, it is therefore relevant to understand how P fluxes impact the marine N cycle, N-cycle feedbacks, and marine productivity globally and regionally.
As global observations and measurements of ocean nutrients and fluxes are difficult and observations still relatively sparse, models are often used to investigate large-scale marine biogeochemistry over long timescales. However, only recently have there been more global modelling studies with riverine nutrient input. In one of the first studies, Giraud et al. (2008) analysed coastal fluxes of P, silicate, and dissolved iron in a global ocean model and found that including nutrients in the coastal ocean impacts biological activity not only locally but also in the open ocean. They also found that excess nutrients in the coastal ocean can impact the open-ocean biogeochemistry depending on which nutrient is advected from the coastal region. Nutrient availability and its consumption in the coastal domain control this transport. Additional P does affect coastal oceans, especially if they are P-limited and if they are not limited by other nutrients like iron. In this case, Giraud et al. (2008) found that increased primary production in the coastal oceans can lead to a depletion of nutrients in the open ocean, reducing biological activity there. This “seesaw effect” was detected by Giraud et al. (2008) on a local and global scale. If P is not consumed in the coastal oceans, it may be advected offshore, eventually increasing primary production there. N was not simulated explicitly in that study but coupled to P via the Redfield ratio. The simulation performed by Giraud et al. (2008) was only run for 10 years and hence not long enough for N-cycle feedbacks to fully materialize.
In a more recent study, Lacroix et al. (2020) implemented estimated riverine nutrient loads of P, N, iron, carbon (C), and silica in a global ocean model and compared the results with those of a reference simulation, where the same nutrients were added directly and homogeneously to the open-ocean surface. They found that even if the ocean circulation remains the main driver for biogeochemical distributions in the open ocean, it appeared necessary to include riverine inputs for the representation of heterogeneous features in the coastal ocean. They identified the catchments of the tropical Atlantic, the Arctic Ocean, Southeast Asia, and Indo-Pacific islands as regions of dominant contributions of riverine supplies to the ocean, leading to a strong primary production increase in the tropical west Atlantic, the Bay of Bengal, and the East China Sea. Nevertheless, the focus in the study of Lacroix et al. (2020) was mainly on C export, and N feedbacks were not considered.
As P concentrations have been increasing in many waterbodies across the world, rivers have been transporting more P to the coastal oceans. Beusen and Bouwman (2022) showed that human-dominated river supply of N and P not only has increased in the past but also will increase in the future due to legacies of past nutrient management, even if efforts are made to reduce these nutrient loads. Regarding P, not only is the addition of nutrient per se relevant to ocean marine biogeochemistry, but also the stoichiometric ratio of N and P is essential (Garnier et al., 2010; Redfield et al., 1963; Beusen and Bouwman, 2022). In the present study, we have extended our experiment from Tivig et al. (2021) and include riverine supply of P in addition to N. We again aim to study the feedbacks in the N cycle but this time assess the combined input of both limiting nutrients.
Specifically, we address the following questions:
-
How does riverine N and P input together, rather than riverine N input alone, affect the representation of ocean biogeochemistry including marine primary production in our model?
-
How does the addition of riverine P input affect specifically the N cycle and N-cycle feedbacks?
-
What effect does the inclusion of riverine P fluxes have specifically on marine oxygen concentrations?
To address these questions, an Earth system model of intermediate complexity (Claussen et al., 2002) that resolves the relevant biogeochemical feedbacks is employed. It allows for the integration of a large number of processes at reduced computational costs due to a coarser resolution and simplified assumptions, in the case of UVic with respect to atmospheric dynamics. This type of model makes it possible to run simulations on millennial scales with different assumptions, allowing the analysis of processes and feedbacks operating in the climate system on such timescales (Weaver et al., 2001). Compared to the study of Tyrrell (1999), where a simple box model was used to study the relative influences of nitrogen and phosphorus on oceanic primary production, the current study is based on a global 3D Earth system model, where the global and regional distribution of N and P can be analysed in more detail. This is a prerequisite for the inclusion of river exports to the ocean, with different quantities of nutrients depending on the individual rivers. Hence, regional feedbacks in the N cycle and their effects on marine primary production as well as localized biogeochemical responses, for example near oxygen minimum zones, can be assessed.
2.1 Earth system model UVic
The University of Victoria Earth System Climate Model (UVic ESCM), version 2.9 (Eby et al., 2009; Weaver et al., 2001), consists of a three-dimensional (1.8° × 3.6°, 19 levels) general circulation model of the ocean; a two-dimensional, single-layer energy–moisture balance atmospheric model; a dynamic–thermodynamic sea ice model; and a terrestrial vegetation model.
The atmospheric energy–moisture balance model (Fanning and Weaver, 1996) dynamically calculates heat and water fluxes between the atmosphere and the ocean, land, and sea ice and is forced by monthly climatological winds prescribed by NCEP/NCAR. The 19 vertical levels of the oceanic component, Modular Ocean Model 2 (MOM2), are 50 m thick near the surface and up to 500 m thick in the deep ocean. The oceanic physical settings are the same as in Keller et al. (2012). The ocean model includes a marine ecosystem module based on Keller et al. (2012) with updates as noted in Partanen et al. (2016). The ocean ecosystem and biogeochemical model is an improved NPZD (nutrient, phytoplankton, zooplankton, detritus) ecosystem model based on Schmittner et al. (2008) and includes seven prognostic variables: two phytoplankton classes (nitrogen-fixing diazotrophs PD and other phytoplankton PO), zooplankton (Z), sinking particulate detritus (D), nitrate (NO3), phosphate (PO4), and oxygen (O2) (Fig. 1). NO3 and PO4 are linked through exchanges with the biological variables by constant (Redfield) stoichiometry (Schmittner et al., 2008). Since diazotrophs can fix nitrogen gas dissolved in seawater, they are not limited by NO3, while the growth of other phytoplankton is limited by NO3 and PO4. All phytoplankton are additionally limited by iron, light, and temperature. For the current study of nitrogen cycle feedbacks, it is a clear advantage that UVic explicitly calculates diazotrophs and N2 fixation. Keller et al. (2012) found that patterns and global amounts of modelled N2 fixation were mostly consistent with the relatively sparse available observations (Sohm et al., 2011). The main differences are discussed within the framework of our results. See Keller et al. (2012) for a full description and evaluation of simulated marine biogeochemistry.

Figure 1Ecosystem model schematics for the NPZD (nutrient, phytoplankton, zooplankton, detritus) model with the prognostic variables (in square boxes) and the fluxes of matter between them, indicated by arrows. See details in the text. Figure updated from Keller et al. (2012) and Tivig et al. (2021).
As in our previous study (Tivig et al., 2021), we use empirical transfer functions derived from benthic flux measurements to calculate benthic denitrification following Bohlen et al. (2012), combined with a subgrid bathymetry scheme for shallow continental shelves and other topographical features that are too fine to be resolved on the coarse UVic grid (see details in Somes et al., 2010).
2.2 Including riverine nitrogen and phosphorus
2.2.1 Global Nutrient Export from WaterSheds 2 (NEWS 2)
The basic UVic model and ecosystem module do not account for riverine nutrient input. The only source of N in the ocean model consists of N2 fixation. In Tivig et al. (2021) we included riverine N as calculated by a global, spatially explicit model of nutrient exports by rivers, NEWS 2 (Mayorga et al., 2010). This second version of a system of submodels estimates the present-day annual export yield at the river mouth for each of the 6081 river catchment areas included and for dissolved and particulate forms of organic and inorganic N and P, as well as dissolved organic and particulate carbon. In our model study, the parameterization of riverine N flows is identical to that of Tivig et al. (2021). Since nitrate is the only nitrogen nutrient explicitly resolved in the UVic version used, all bioavailable N has been included in the nitrate compartment of the model. See Mayorga et al. (2010) for more details on the model configuration and Dumont et al. (2005) for more details on the validation of NEWS dissolved inorganic nitrogen (DIN).
2.2.2 Riverine reactive phosphorus
Earlier applications of the UVic ESCM assumed a fixed marine P inventory (Keller et al., 2012; Oschlies et al., 2019; Schmittner et al., 2005). In addition to DIN, we also include P from river discharge here. We focus on the total amount of reactive P, i.e. P that exchanges with the dissolved oceanic P reservoir and thus is available for biological uptake (Filipelli, 2008; Ruttenberg, 2003). Estimates of the globally integrated pre-industrial riverine supply of bioavailable P range from 0.1 to 0.3 Tmol P yr−1 (Kemena et al., 2019; Ruttenberg, 2003; Filipelli, 2008; Compton et al., 2000; Colman and Holland, 2000). Taking into account only dissolved inorganic P from rivers would underestimate the amount of bioavailable P from river discharge, as most studies estimate DIP export from rivers to be significantly lower, between 0.01 and 0.05 Tmol P yr−1 (Mayorga et al., 2010; Filipelli, 2008; Harrison et al., 2005). Following the results of Colman and Holland (2000) and Ruttenberg (2003), we decided to include dissolved organic and inorganic P (DOP, DIP), as well as 45 % of total particulate P (TPP). This represents the upper range of the fraction of the riverine TPP flux estimated as reactive P (Ruttenberg, 2003; Colman and Holland, 2000). The numbers for DIP, DOP, and TPP export at the river mouths have been taken from the NEWS 2 data set. DIP and DOP were taken as they were, and TPP was multiplied by 0.45 to obtain the desired fraction of total particulate P. Consistently with Tivig et al. (2021), the nutrients from NEWS 2 were interpolated onto the coarser UVic grid. We assumed a periodic seasonal cycle in runoff and that concentrations in the discharged river water are constant throughout the seasonal cycle. The annual P load is thus distributed over the months using the fractions of monthly freshwater discharge as respective weights. The global amount of P that we added to the UVic ocean was 0.17 Tmol P yr−1 (5.4 Tg P yr−1), which lies in the range estimated by previous studies (Kemena et al., 2019; Ruttenberg, 2003; Benitez-Nelson, 2000). Since phosphate is the only phosphorus nutrient explicitly resolved in the UVic version used, we decided, like for N, to put all bioavailable P into the phosphate compartment of the model.
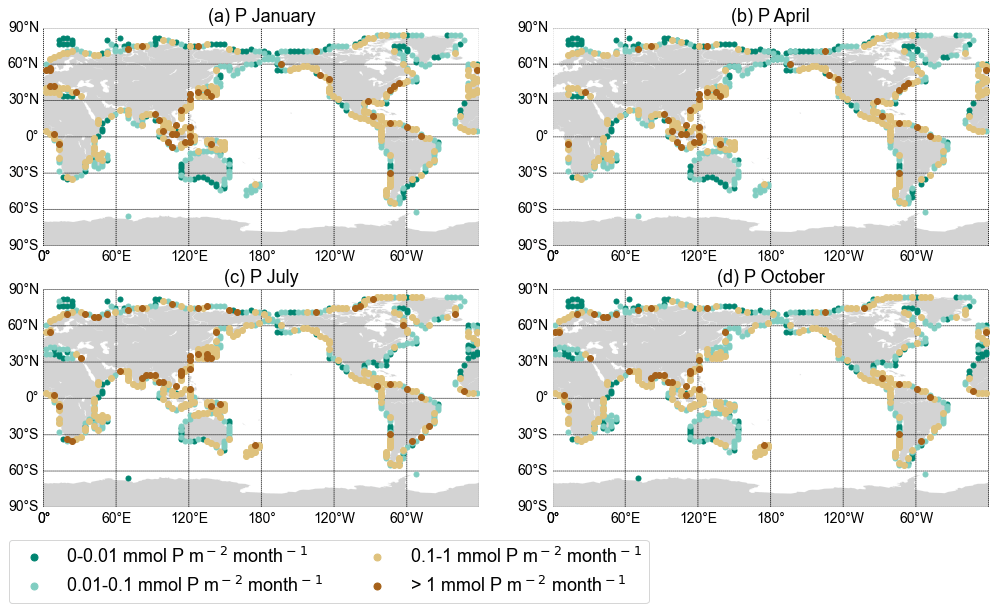
Figure 2Export yield of total reactive phosphorus for each discharge point in mmol P per square metre per month from the NEWS 2 data set interpolated on the UVic grid for January (a), April (b), July (c), and October (d).
2.2.3 Burial of nitrogen and phosphorus
In the global ocean, N input via N2 fixation and rivers is balanced by denitrification (here implicitly including anammox). In particular, denitrification in the benthic zone is considered the main sink for fixed N (Voss et al., 2013; Galloway et al., 2004). As in Tivig et al. (2021), we include empirical transfer functions derived from benthic flux measurements (Bohlen et al., 2012) to simulate benthic denitrification. These functions are based on dynamic vertically integrated sediment models and estimate denitrification from the rain rate of particulate organic carbon to the seafloor, bottom-water O2, and NO3 concentrations. We use a subgrid bathymetry scheme for shallow continental shelves to better resolve particulate organic matter sinking and remineralization at the seafloor (Somes and Oschlies, 2015; Somes et al., 2013).
UVic does not contain a prognostic and vertically resolved sediment model. Therefore, the input of reactive P to the ocean has to be counterbalanced by a parameterized sink. For this purpose, we include burial functions based on Flögel et al. (2011) and Wallmann (2010), which have been tested in previous studies with UVic by Kemena et al. (2019) and Niemeyer et al. (2017). With these functions, the burial of P in the sediment (BURp) is calculated in every ocean grid box column from the difference between the simulated detritus P rain rate to the sediment (RRp) and the benthic release flux of phosphate from the sediment (BENp):
Following Flögel et al. (2011), the burial of P is evaluated separately for each grid box column on the shelf and in the deep sea. The deep sea is defined as ocean grid box columns where the ocean is deeper than 1000 m.
Benthic P release (BENp) is calculated locally as
BENc represents the benthic fluxes of carbon and is computed from the difference between the carbon rain rate to the sediment (RRc) and a virtual burial flux of organic carbon (BURc):
Depending on the ocean depth of the grid box considered, BURc is computed from the modelled detritus export in terms of carbon on the shelf and in the continental margin (Kemena et al., 2019),
and in the deep sea,
RRc is calculated by the model in mmol C m−2 yr−1. The ratio depends on bottom-water oxygen concentration and is calculated following Kemena et al. (2019) and Wallmann (2010):
with O2 in mmol m−3 and the coefficients , , and mmol m−3. Variations in the coefficients determine the strength of the burial. Because there are large uncertainties in these numbers, different experiments have been performed to evaluate the model response to variations in burial.
2.3 Experimental design
To analyse the effect of riverine nutrient supply in the UVic model, six experiments were performed (Table 1). In each experiment the model was run for 10 000 years, starting from an already-spun-up steady state with the standard model version without riverine nutrients, with pre-industrial conditions for insolation and a fixed atmospheric CO2 concentration of 283 ppm (Keller et al., 2012), i.e. a stable climate. Note that the spin-up did not include benthic denitrification and subgrid bathymetry. These two features have been included at the start of each simulation, including the control simulation (CTR). Hence, at the start of each simulation and for approximately 2000 years, there is a drift in the fixed N inventory.
Like in our previous study (Tivig et al., 2021), a control simulation (CTR) was performed without riverine nutrients. The simulation NEWS-N is identical to the main experiment analysed in Tivig et al. (2021), where only DIN from river discharge was added to the coastal ocean. In a follow-up experiment, rivers exported only P to the modelled ocean (NEWS-P) but without any burial to balance the P budget. NEWS-N+P tested the impacts on marine biology and biochemistry with regard to additional N and P (without P burial). Finally, two P burial variation experiments have been performed, where riverine N and P supply from the NEWS 2 model was applied. In a low-burial configuration (N+P-BURLOW), we used the coefficients tested by Kemena et al. (2019) in their simulation low-bur. The second burial experiment (N+P-BURHIGH) includes the original burial functions of Flögel et al. (2011) with the coefficients for YF, A, and r described there as well as in the reference burial experiment in Kemena et al. (2019) (Table 1).
Note that previous studies using these burial functions balanced the modelled P budget by an equivalent weathering flux that provided P to the ocean via river discharge in the same amount as P was buried in the marine sediments (Kemena et al., 2019; Niemeyer et al., 2017). In the current study, there is no direct link between the two fluxes: riverine P is calculated from the NEWS 2 model (Mayorga et al., 2010), while P burial is calculated independently, using only detritus export and bottom-water oxygen concentration (see Table 1 for an overview of the fluxes). In all simulations where riverine P is included, the global P budget is therefore not exactly balanced (Fig. 3b). While P concentrations only slowly increase in the scenario with a low burial rate, the increase is stronger in the two scenarios without P burial (NEWS-P and NEWS-N+P). In the scenario with high burial rates, P concentrations decrease and the total P flux is negative. In the time series (Fig. 3c), it is also visible that this flux slowly increases over the simulation and hence the P inventory follows an asymptotic evolution.
These different simulations permit us to analyse the sensitivity of the N-cycle feedbacks under different conditions of P supply and do not pretend to reproduce the exact reality. So far, the phosphorus balance of the (pre-anthropogenic) ocean has been poorly defined, and the input and output fluxes are only rudimentarily constrained (Wallmann, 2010; Föllmi, 1995).
(Kemena et al., 2019)(Flögel et al., 2011)
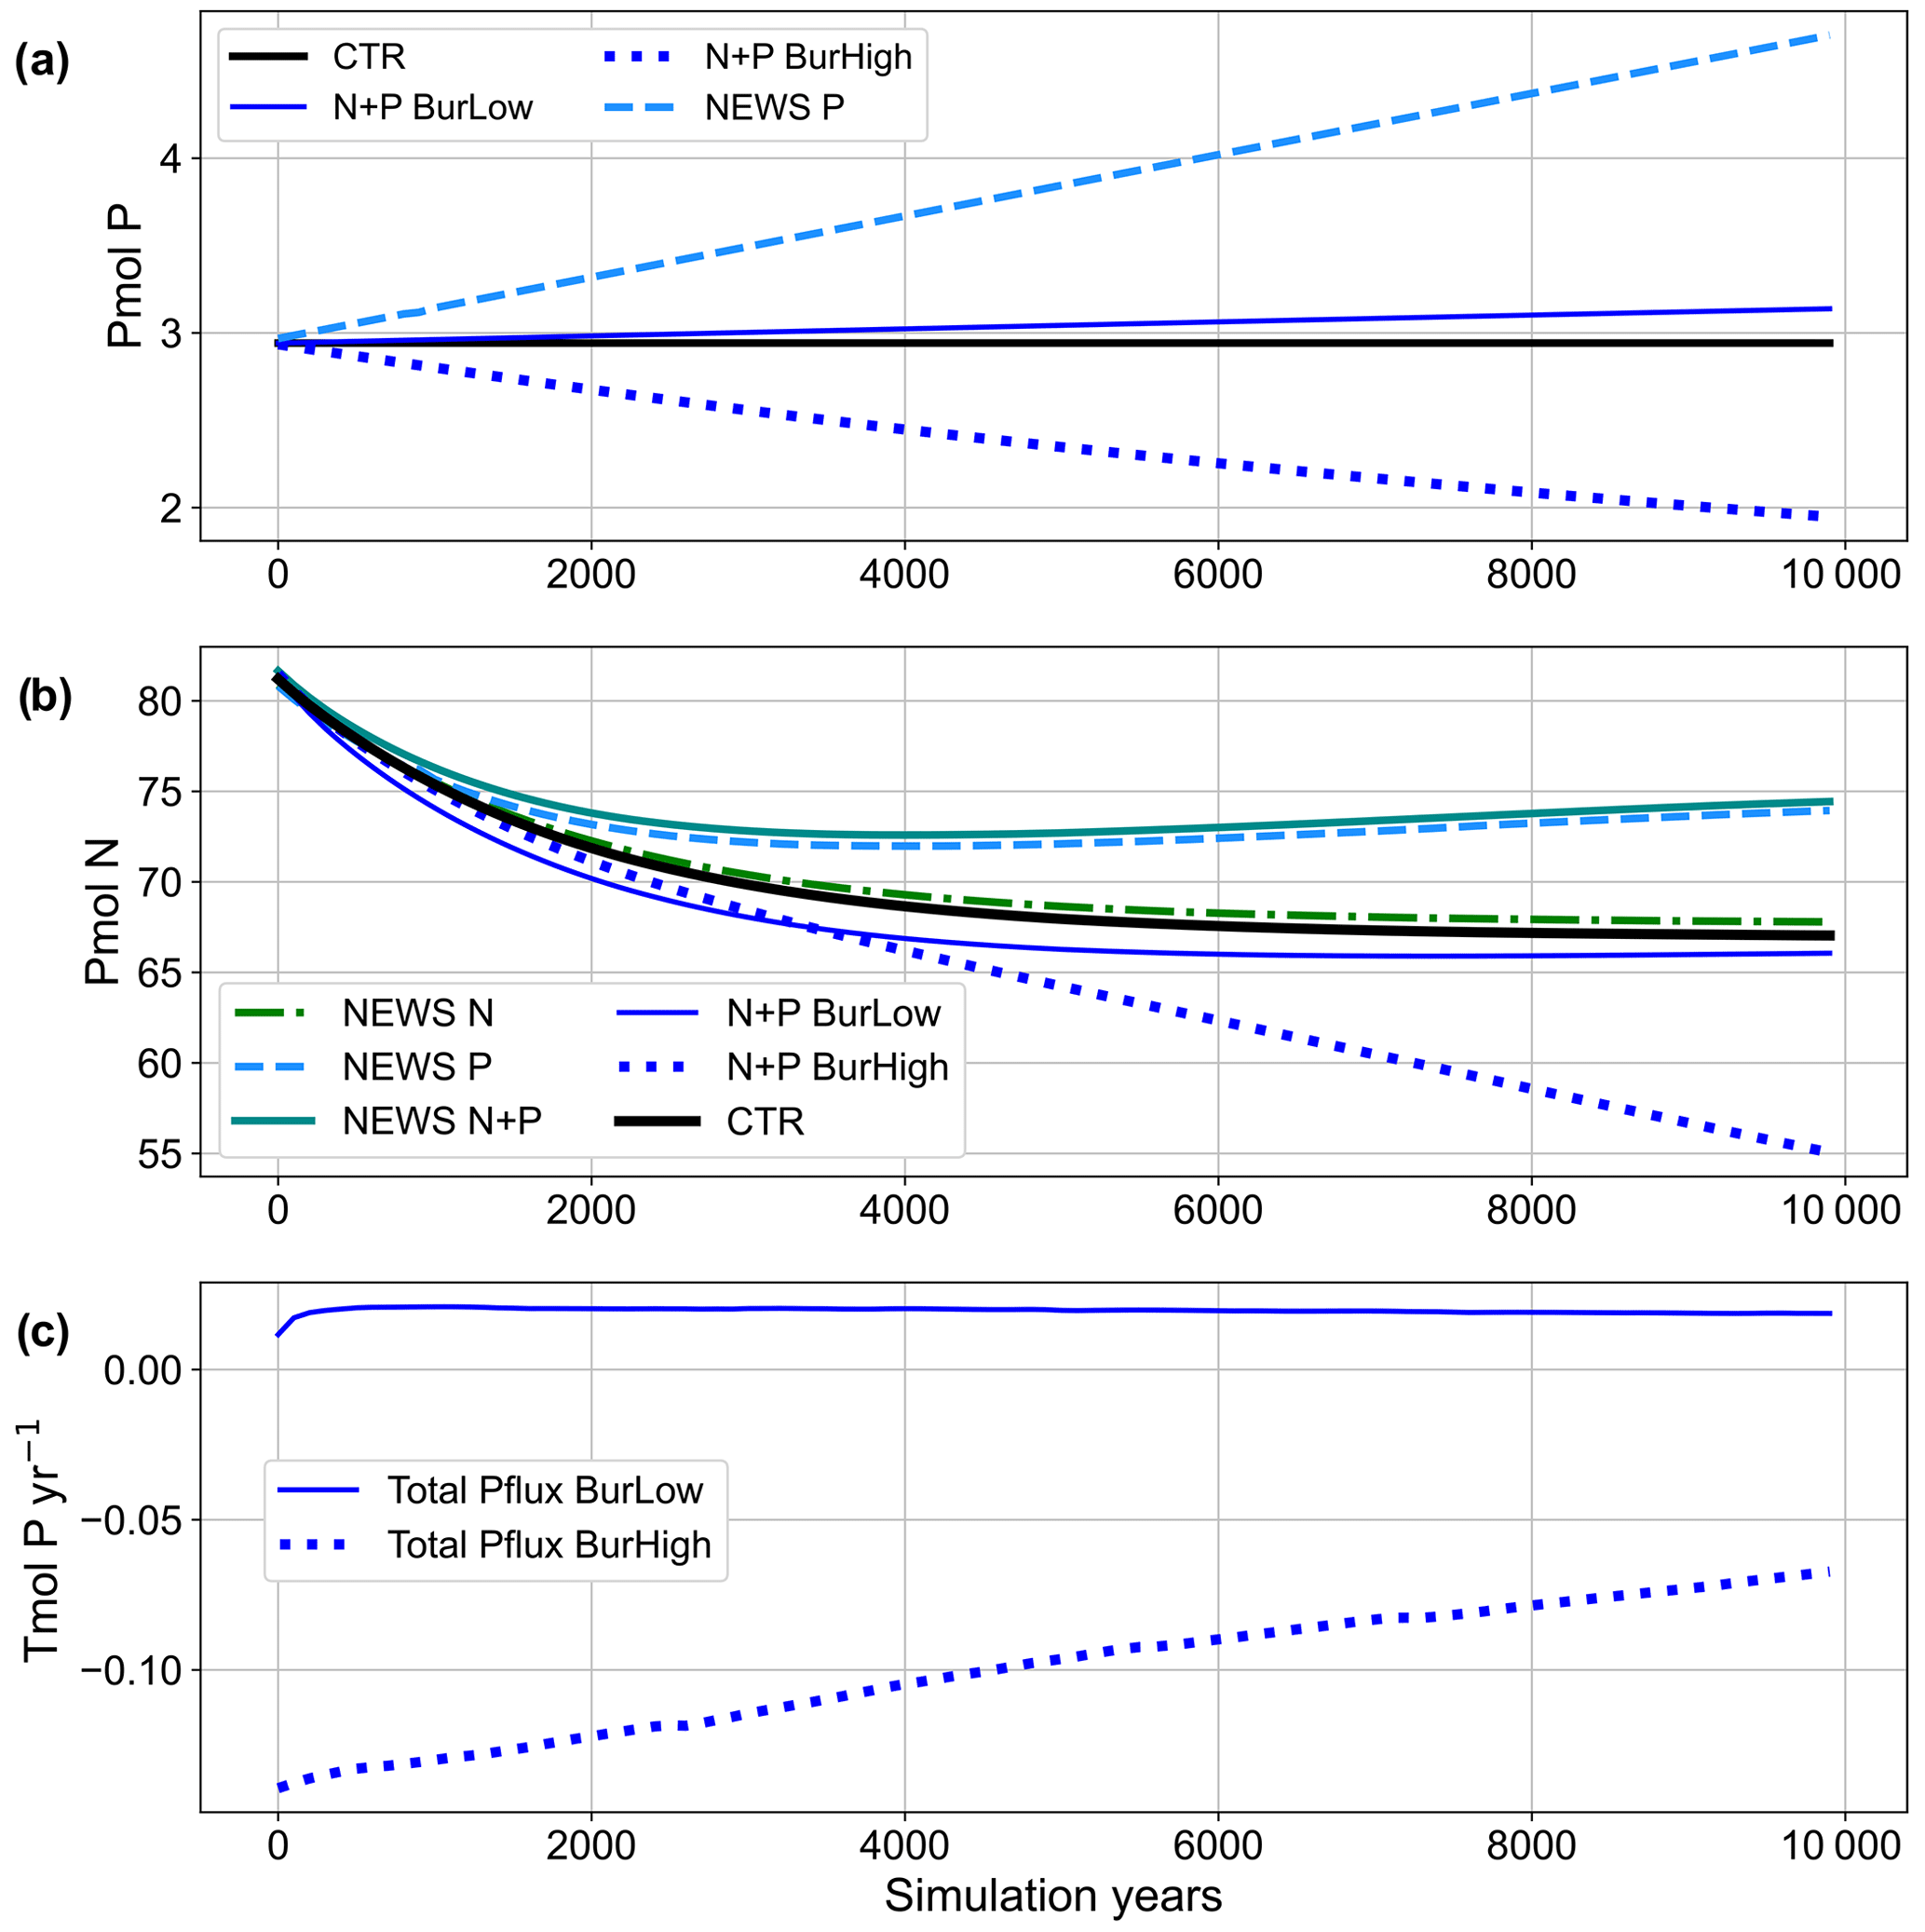
Figure 3(a) Time series of global phosphorus in all simulations over the 10 000 simulation years in petamoles of P. (b) Time series of global nitrogen in all simulations over the 10 000 simulation years in petamoles of N. (c) Time series of total phosphorus fluxes (sum of riverine input and burial flux) in Tmol P yr−1 for the simulations with low and high burial. Simulation descriptions can be found in Table 1.
3.1 Phosphorus dynamics
In the four simulations with riverine P input, 0.17 Tmol P yr−1 (5.4 Tg P yr−1) is added globally to the coastal oceans as reactive P (Fig. 2). This is close to the amount estimated by Föllmi (1995) and within the range of other literature values for global fluvial fluxes of bioavailable P (Kemena et al., 2019; Ruttenberg, 2003; Benitez-Nelson, 2000; Compton et al., 2000). In NEWS-P and NEWS-N+P, no sink of P was implemented, and these simulations are characterized by continually increasing P inventory (Fig. 3a). Benthic burial fluxes of P amount to 0.16 Tmol yr−1 in N+P-BURLOW and 0.24 Tmol yr−1 in N+P-BURHIGH, leading to an imbalance of +0.01 and −0.07 Tmol yr−1, respectively.
These results range within the estimates for burial rates from observations, which globally vary around 0.2 Tmol P yr−1: 0.11–0.34 Tmol P yr−1 in Benitez-Nelson (2000), 0.17–0.24 Tmol P yr−1 in Ruttenberg (2003), and 0.21 Tmol P yr−1 in Filipelli (2008).
The highest simulated P burial fluxes can be found in coastal regions, especially in the western Pacific and Atlantic oceans (Fig. A2 in Appendix A). Simulated burial hot spots are situated in proximity to the coasts of China, eastern Russia, and Alaska; next to the eastern coast of North America and South America; and in the North Sea. There are no global observational data sets of P burial. Nevertheless, the distribution of the benthic fluxes is similar to other model studies that have used a similar algorithm (e.g. Bohlen et al., 2012).
The inclusion of riverine P has a significant impact on global P concentrations. In simulation CTR without riverine nutrient supply, surface phosphate concentrations range from 0 mmol P m−3 in most of the western tropical and subtropical ocean basins to more than 2 mmol P m−3 in the Southern Ocean (Fig. 4). The addition of riverine N (in NEWS-N) leads only to small changes in the surface P concentrations; in particular P declines, reflecting enhanced biological processes (P uptake) in the coastal oceans (not explicitly shown here). The regions with a decrease in P can be found on the shelf and in coastal oceans, corresponding to the regions where N concentrations increase in Tivig et al. (2021). Nevertheless, the magnitude of P changes is small compared to the spatial variance of surface phosphate concentrations of 0.64 mmol P m−3 in CTR and 0.85 mmol P m−3 after 10 000 years of riverine N supply in NEWS-N (0.65 mmol P m−3 at the start of the simulation). For simulations with inclusion of riverine P but without benthic burial of P, surface P concentrations after 10 000 years of riverine P supply are much higher than in the control simulation (Fig. 4c, d), independent of the additional riverine N supply. Additional P is distributed over the global oceans except for the tropical Atlantic and the northwestern tropical Pacific Ocean. These regions correspond to the northern subtropical gyres and are known to be oligotrophic and limited by phosphate (Mather et al., 2008; Martiny et al., 2019). The other extreme is the simulation N+P-BURHIGH, where the modelled ocean is losing P in all those regions where the surface P concentration is different from 0 in CTR (Fig. 4f). Only moderate changes and a spatial variance of 0.69 mmol P m−3 are the result of the simulation with riverine N and P and low-burial functions (N+P-BURLOW, Fig. 4e).
After 10 000 years of simulation, of all experiments including riverine phosphate, the global-average P concentration in N+P-BURLOW is nearest to observed present-day oceanic conditions (observations with data from the World Ocean Atlas – Garcia et al., 2019b – are shown in Fig. A3). Nevertheless, each scenario provides a different insight into marine biogeochemical feedbacks.
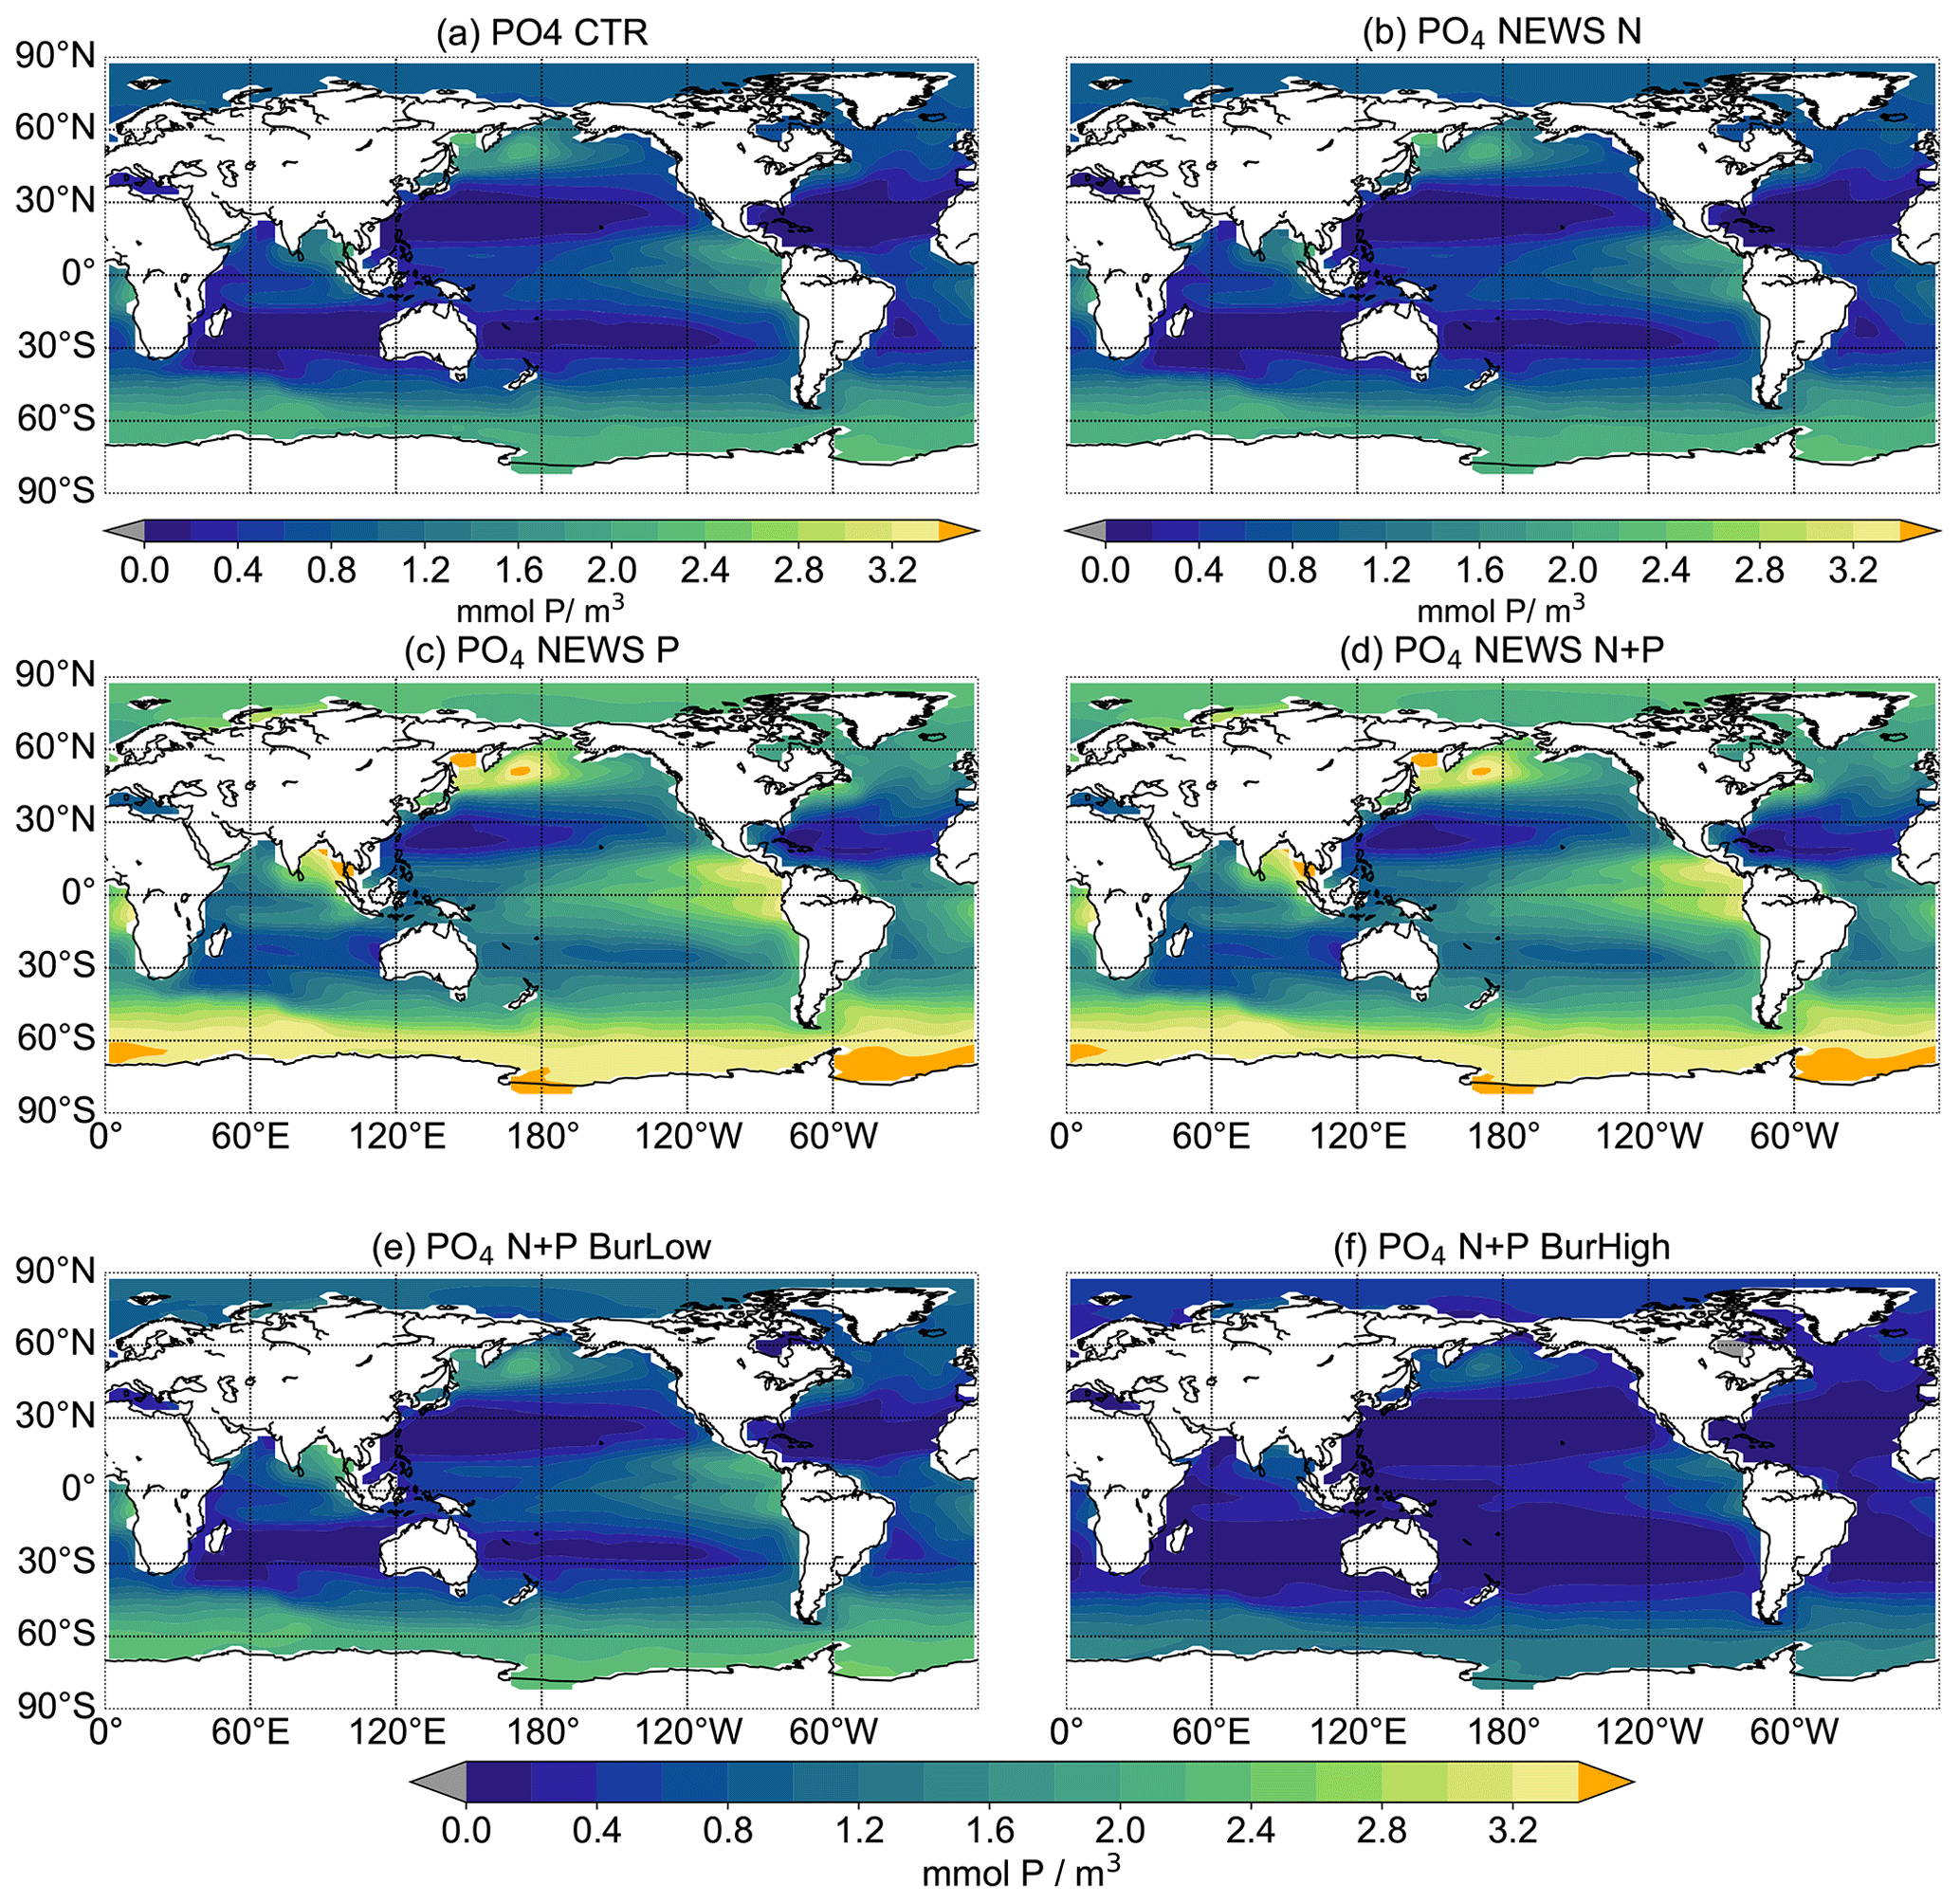
Figure 4Global distribution of PO4 concentrations in mmol P m−3 averaged over the upper 180 m at the end of the respective simulations over 10 000 years. Global distribution of PO4 concentrations in CTR (a), NEWS-N (b), NEWS-P (c), NEWS N+P (d), N+P-BURLOW (e), and N+P-BURHIGH (f). The orange colour indicates regions where the PO4 concentrations exceed 3.4 mmol P m−3.
3.2 P influence on the oceanic N inventory and N-cycle feedbacks
The addition of riverine P to the modelled ocean has a considerable impact on the distribution of simulated NO3. At the end of CTR, NEWS-N, and N+P-BURLOW, the N sink by denitrification and the N sources by N2 fixation and riverine input are balanced (Figs. 3, 5). This is not the case for NEWS-P and NEWS-N+P, where the oceanic N inventory slightly increases even at the end of the simulations, and is very different from N+P-BURHIGH, where N concentrations decrease continuously. This evolution is also different from the P inventory, with its asymptotic shape (Fig. 3). In NEWS-P, where only P is added via river runoff, global oceanic N is only slightly lower than in NEWS-N+P and considerably higher (by around 6 Pmol N) than in NEWS-N. This is mainly the result of the increase in N2 fixation triggered by the additional P flux (Fig. 5). Comparing NEWS-N, NEWS-P, and N+P-BURLOW shows that while global benthic denitrification stays nearly constant during the simulations, water column denitrification and N2 fixation develop differently depending on the experimental design (Fig. 5): additional P leads to an increase in global denitrification and N2 fixation. Including low-burial functions stabilizes both fluxes over time but at higher levels than in NEWS-N. In N+P-BURHIGH, N2 fixation and water column denitrification decrease significantly over the simulations but seem to stabilize at the end of the 10 000 years. However, the flux of benthic denitrification decreases more slowly and has not stabilized at the end of the experiment, causing the continuous decrease in N in this simulation. To see a stabilized budget here, the simulations should have been much longer.
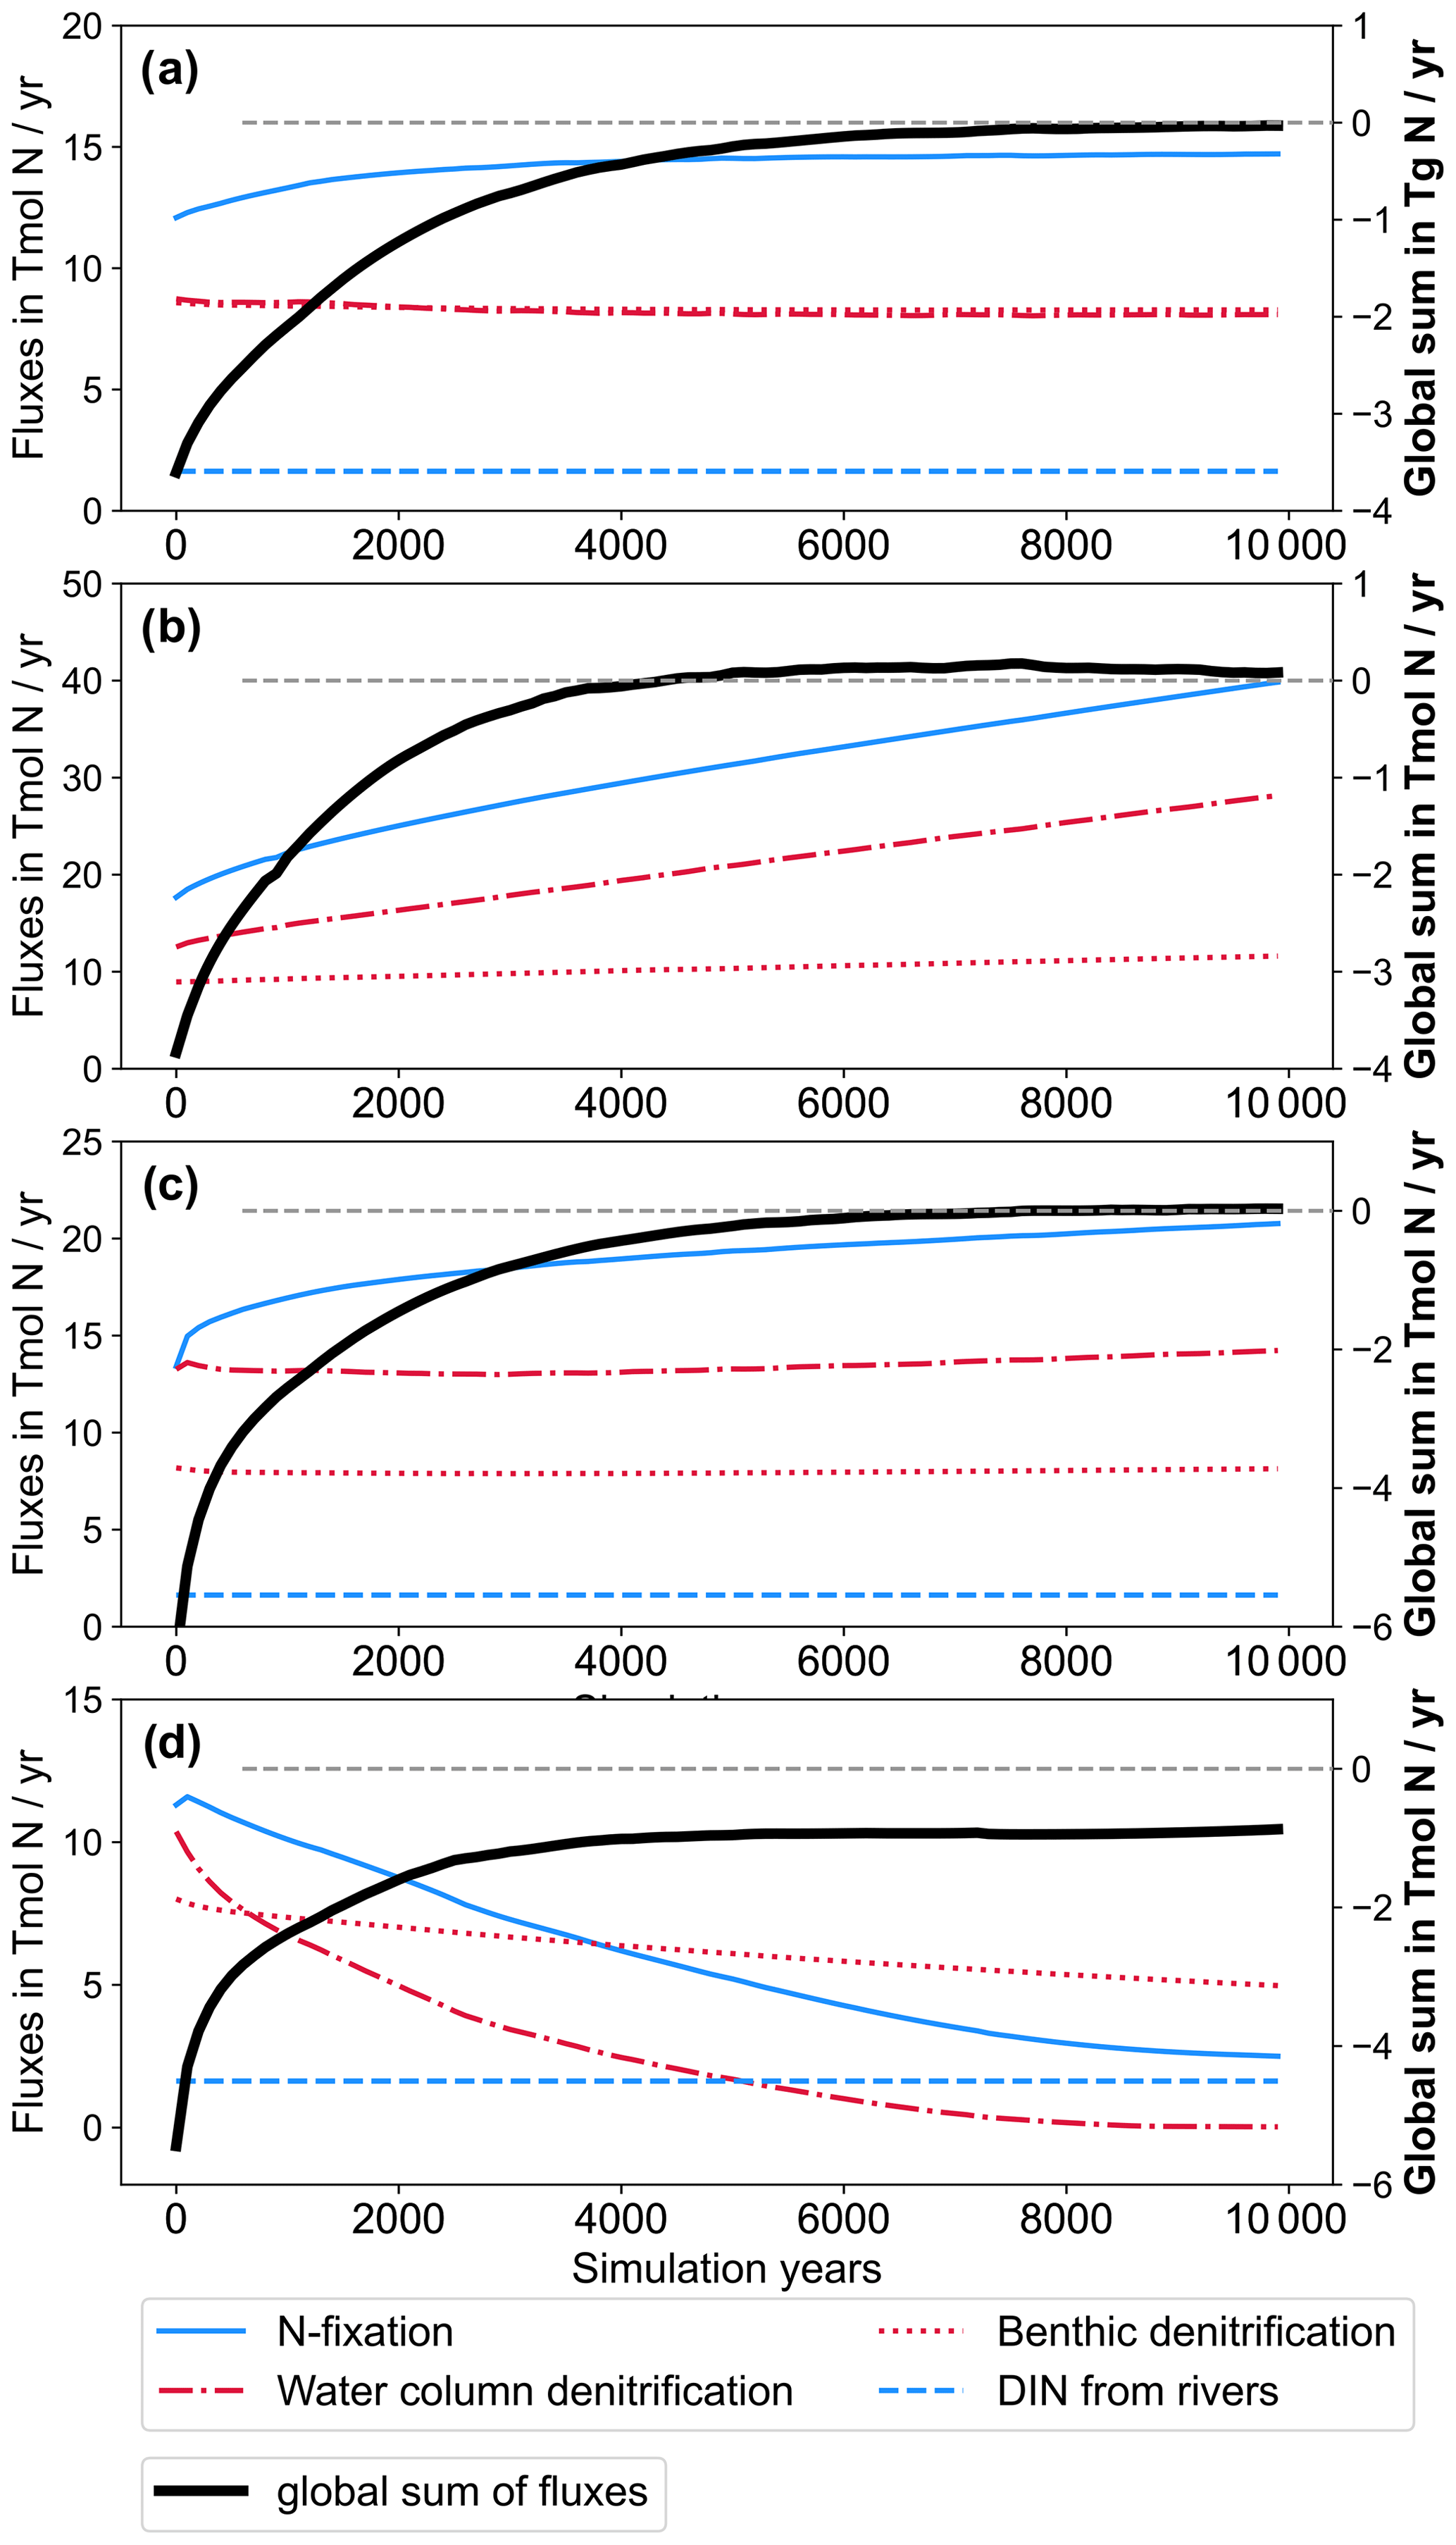
Figure 5Time series of global nitrogen fluxes from NEWS-N (a), NEWS-P (b), N+P-BURLOW (c), and N+P-BURHIGH (d) over the 10 000 simulation years in Tmol N yr−1. Nitrogen fixation (solid blue line) and riverine N input (dashed blue line) are balanced by water column denitrification and benthic denitrification (dash-dotted red and dotted red line, respectively). The global sum of all N fluxes is shown as a bold black line. Fluxes are given in absolute values. Note the different scales of the y axis in the different panels. The dashed line in grey is the zero line of the global sum of N fluxes.

Figure 6Global distribution of NO3 concentrations averaged over the upper 180 m in mmol N m−3. Panel (a) shows NO3 concentrations in CTR. Panels (b)–(f) show N concentrations in the simulations NEWS-N, NEWS-P, NEWS-N+P, N+P-BURLOW, and N+P-BURHIGH as their differences from CTR.

Figure 7Difference in zonal mean concentrations of NO3 in the main ocean basins (Atlantic: left; Pacific: middle; Indian Ocean: right) in mmol N m−3 as the difference between the simulations NEWS-N, NEWS-P, NEWS-N+P, N+P-BURLOW, and N+P-BURHIGH and CTR.
In the upper oceans, NO3 concentrations increase with supplemental P, except near the main oxygen minimum zones (OMZs) of the Gulf of Guinea, the northern Indian Ocean, and the tropical eastern Pacific. Without the burial of P, N increases especially in the tropical Pacific, the North Atlantic, and higher latitudes but decreases in the tropical eastern Pacific. Including P burial leads to a smaller increase in N and even a high decrease in N in the simulation with high P burial (Fig. 6). Including riverine P has more impact than including riverine N supply alone. If more P is buried, N concentrations decrease globally. The above pattern of N shows increasing concentrations almost everywhere in experiments NEWS-P and NEWS-N+P compared to CTR but is almost reversed for experiment N+P-BURHIGH, with N concentrations increasing only near the OMZ in the Bay of Bengal and off the Pacific coast of Central America (Fig. 6).

Figure 8Vertical integration of N2 fixation in mmol N m−2 yr−1. (a) N2 fixation in CTR. (b–f) Difference in N2 fixation between the simulations NEWS-N, NEWS-P, NEWS-N+P, N+P-BURLOW, and N+P-BURHIGH and CTR. The cyan colour indicates regions with very low N2-fixation rates compared to CTR. The orange colour indicates regions with very high N2-fixation rates compared to CTR.
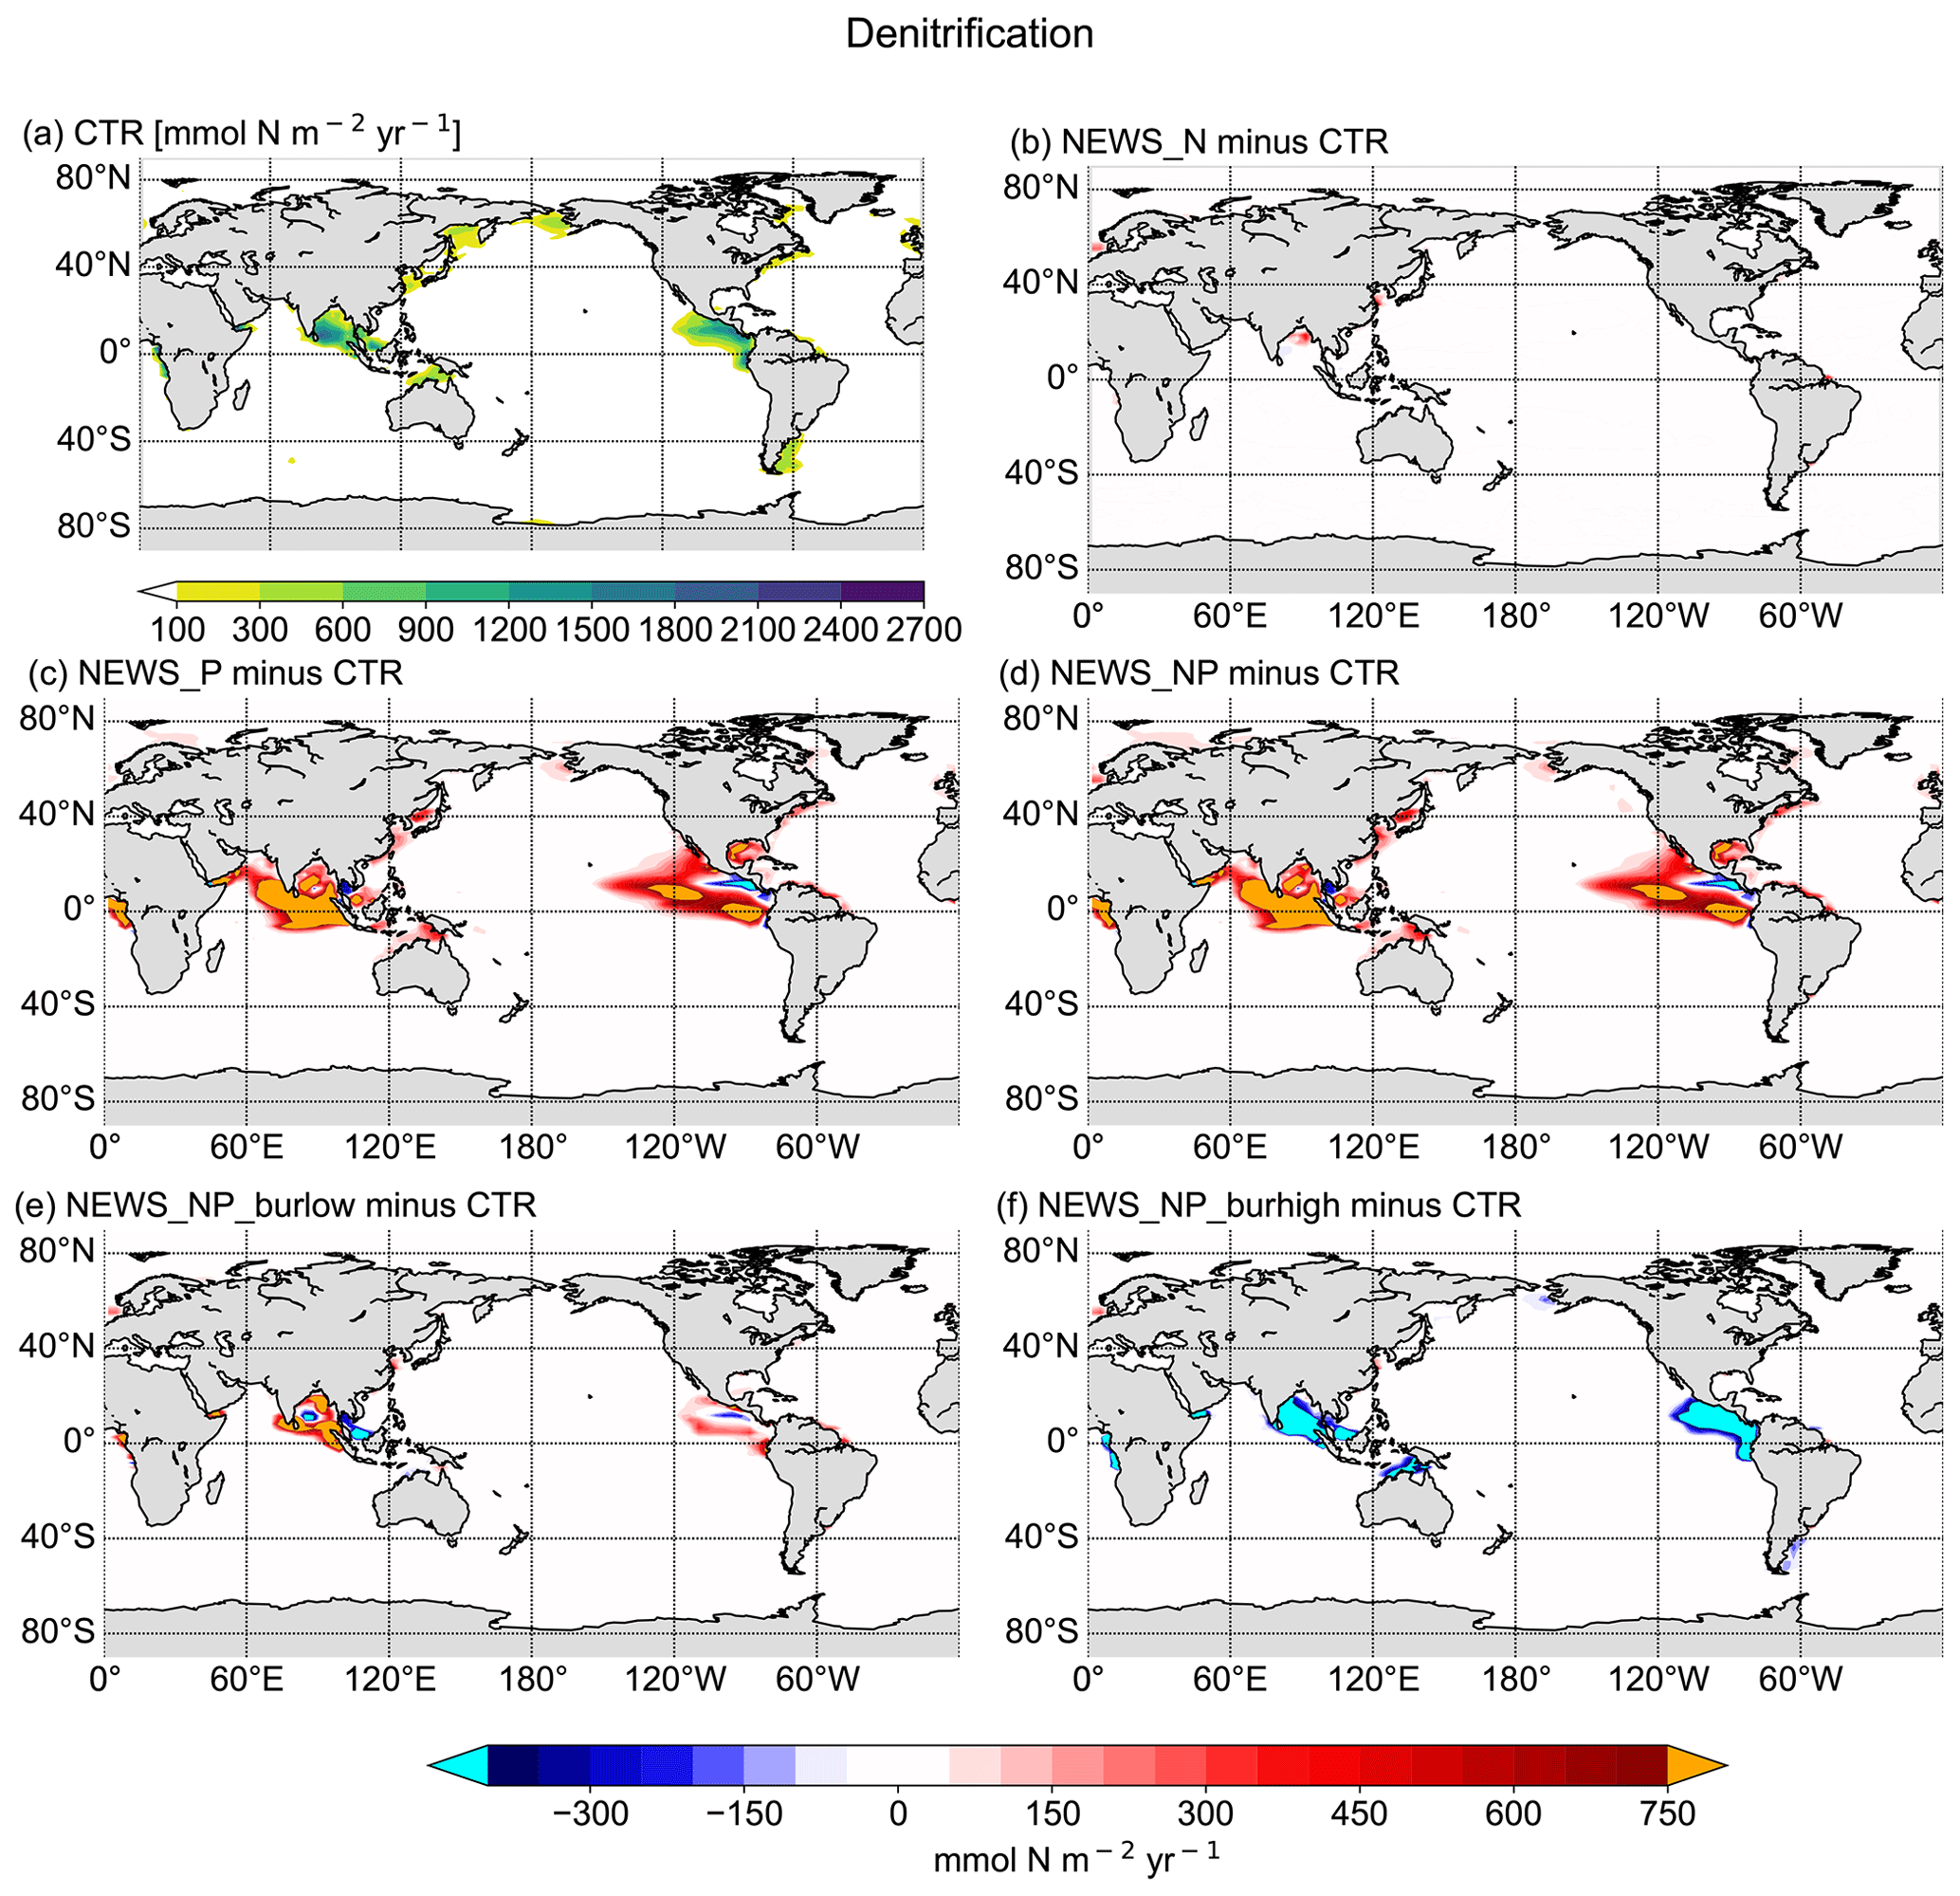
Figure 9Vertical integration of denitrification in mmol N m−2 yr−1. (a) Denitrification rates in CTR. (b–f) Difference in denitrification rates between the simulations NEWS-N, NEWS-P, NEWS-N+P, N+P-BURLOW, and N+P-BURHIGH and CTR. The cyan colour indicates regions with very low denitrification rates compared to CTR. The orange colour indicates regions with very high denitrification rates compared to CTR.
These changes in NO3 concentrations are the result of P fluxes impacting the two main processes of the N feedback cycle, denitrification (Fig. 9) and N2 fixation (Fig. 8). It is widely assumed that the surface NO3-to-PO4 ratio is a dominant controlling factor of these feedback mechanisms (Gruber, 2008). Diazotrophs are limited by P, especially in regions where light, temperature, and iron availability are not limiting. The regions where N2 fixation is enhanced in the simulations with riverine P (NEWS-P, NEWS-N+P, and N+P-BURLOW) correspond well to regions of general P limitation (compare with Kemena et al., 2019, their Fig. 8). N2 fixation is stimulated here by the addition of P to the ocean and is generally sensitive to changes in P supply. In the experiment with high burial rates, these same regions are characterized by decreasing N2-fixation rates (Fig. 8f).
Denitrification is the other feedback mechanism controlling the global ocean N budget. In the simulations where N concentrations increase due to higher N2-fixation rates, denitrification is also enhanced. However, in the simulation with high burial rates of P, denitrification rates are much lower than in the control simulations in the Gulf of Guinea, the Bay of Bengal, and the eastern tropical Pacific (Fig. 9f), which also leads to higher concentrations of N in these regions (Fig. 6). Both processes, N2 fixation and denitrification, are increased in the simulation with additional riverine P. Where they take place in separated regions of the tropical and subtropical oceans, these processes lead to an increase in N in the global surface ocean (N2 fixation) and a loss of N in the water columns near the main OMZ of the ocean (denitrification). This is not the case when N2 fixation and denitrification are co-located, for example in the Bay of Bengal.
In our previous study with the addition of only riverine N, the vicious cycle defined by Landolfi et al. (2013) was suspected to be the reason for a significant decrease in N concentration in the Bay of Bengal, even though rivers exported additional N to the sea (Tivig et al., 2021). The addition of riverine P improves this process here so that the ocean is losing N not only in the Bay of Bengal, but also in the upper tropical Atlantic Ocean basin (Fig. 7d, g, j, m) near the Gulf of Guinea and in the upper tropical Pacific Ocean (Fig. 7e, h, k, n).
The main driver of this vigorous vicious cycle in these simulations is the supply of P from rivers and the interplay of different feedback loops in marine biogeochemistry (Fig. 10). Considering N on the one hand, additional N from rivers or atmospheric fixation enhances marine biological production, which contributes to higher export rates and leads to remineralization and oxygen consumption. In regions where oxygen is scarce, denitrification will occur and consume N. N2 fixation is limited by P. Therefore, adding more P, for example, from rivers, can enhance this process and thereby the vicious cycle. On the other hand, increasing P can also lead to lower oxygen concentrations and therefore more denitrification.
Note that iron availability also plays an important role. It is a limiting factor of diazotroph growth and hence N2 fixation (Landolfi et al., 2013). Iron availability can lead to a shift in the growth of N fixers to regions with higher iron availability and therefore can also spatially decouple denitrification and N2 fixation, breaking the vicious cycle (Landolfi et al., 2013; Moore et al., 2009). Our UVic model represents iron including a static concentration mask. Therefore, no interactive response to perturbations of ocean biogeochemistry is possible, and iron availability and limitation will not change during the simulations.

Figure 10Feedbacks in the marine N and P cycle due to riverine nutrient supply to the global oceans. Yellow-coloured boxes refer to processes concerning the marine N inventory. Blue refers to the marine P inventory. Green boxes show riverine nutrient input. The black arrows symbolize positive effects or feedbacks. The arrows with hatching symbolize negative effects or feedbacks. Red-bordered arrows symbolize processes involved in the vicious cycle (Landolfi et al., 2013).
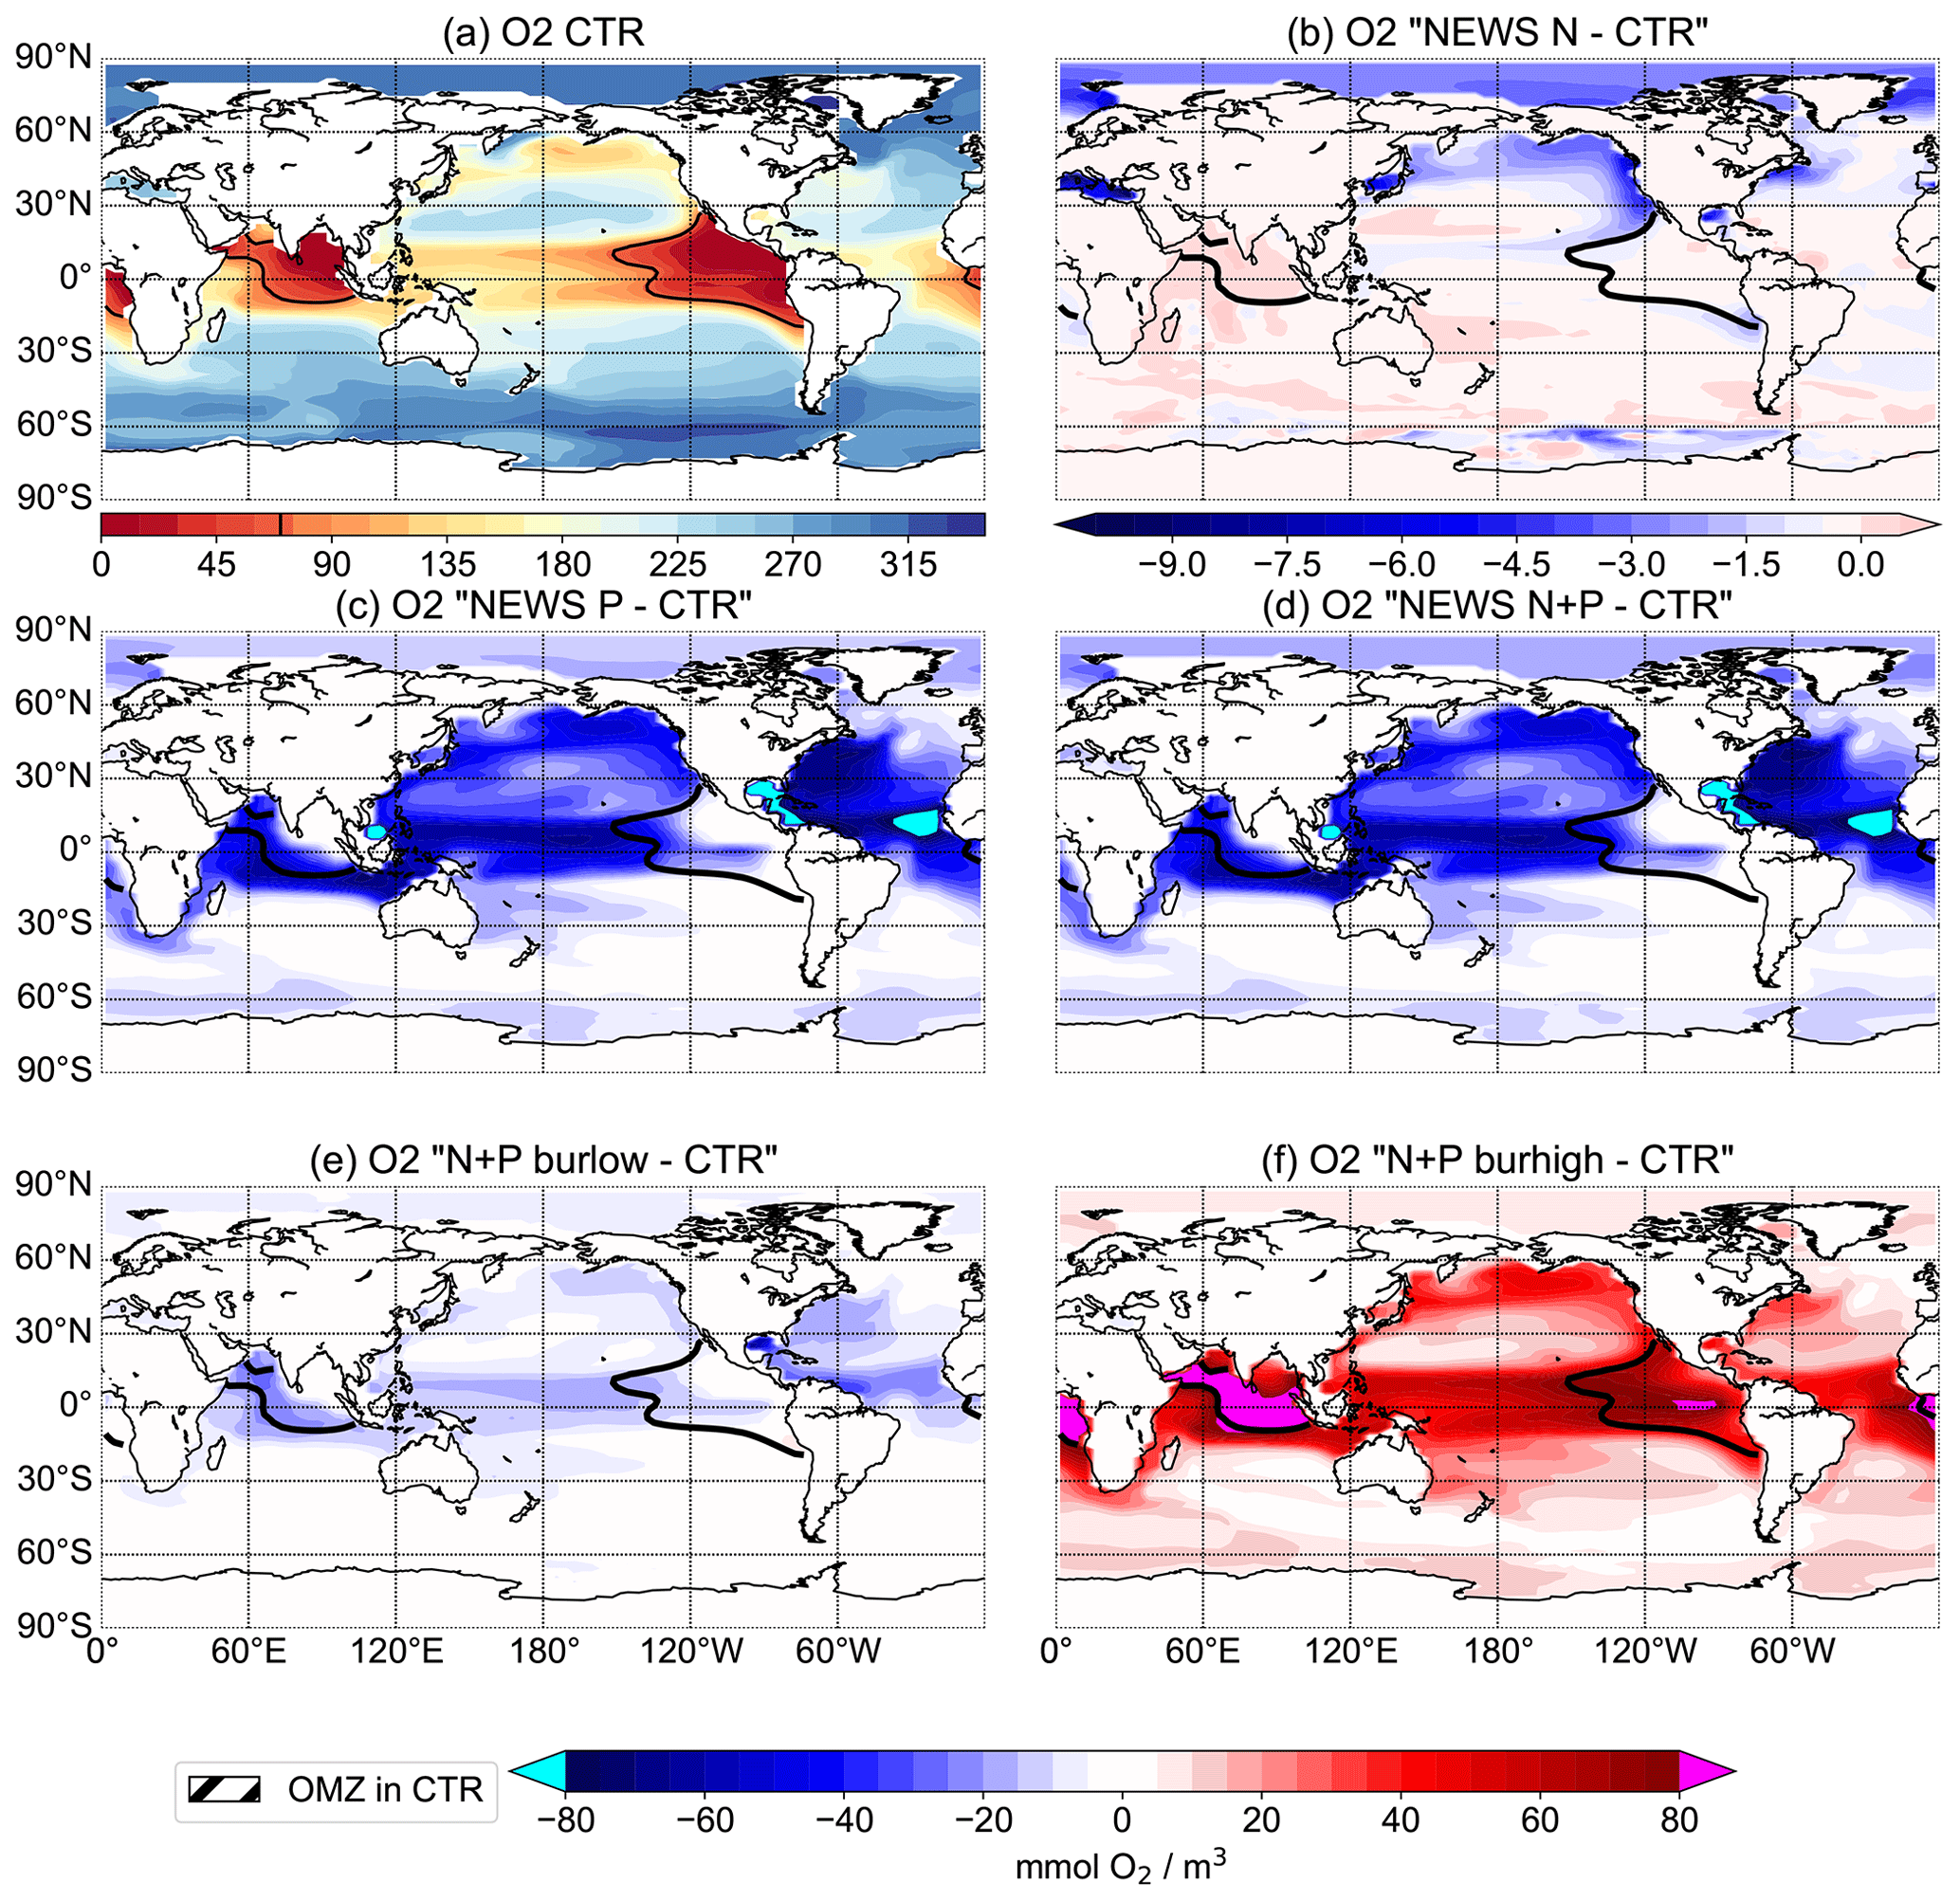
Figure 11Oxygen concentrations at 300 m depth in mmol O2 m−3. (a) Distribution of oxygen concentrations in the control simulation. (b–f) Difference in oxygen concentrations between the simulations NEWS (b), NEWS-P (c), NEWS-N+P (d), N+P-BURLOW (e), and N+P-BURHIGH (f) and CTR. The bold black line shows the limits of the oxygen minimum zone at 302 m depth in the control simulation.
3.3 Phosphorus cycling and oxygen minimum zones
Low ventilation of the water column and/or high rates of remineralization of organic matter can cause oxygen-depleted waters. Niemeyer et al. (2017) found that an increase in the marine phosphorus inventory under assumed business-as-usual global warming conditions could lead to a 4- to 5-fold expansion of the suboxic water volume over millennial timescales. Several studies also suggest that O2 depletion in coastal regions caused by eutrophication may enhance the release of P from sediments, thus providing additional P (Flögel et al., 2011; Wallmann, 2010; Ingall and Jahnke, 1994). These two processes together form a positive feedback loop, enhancing oxygen depletion and expansion of the oxygen minimum zones (Oschlies et al., 2018) (Fig. 10). The processes relevant to this feedback are all included in the burial experiments.
Three regions, the Gulf of Guinea, the Bay of Bengal, and the eastern tropical Pacific Ocean, are characterized by low to very low oxygen concentrations (Fig. 11a).
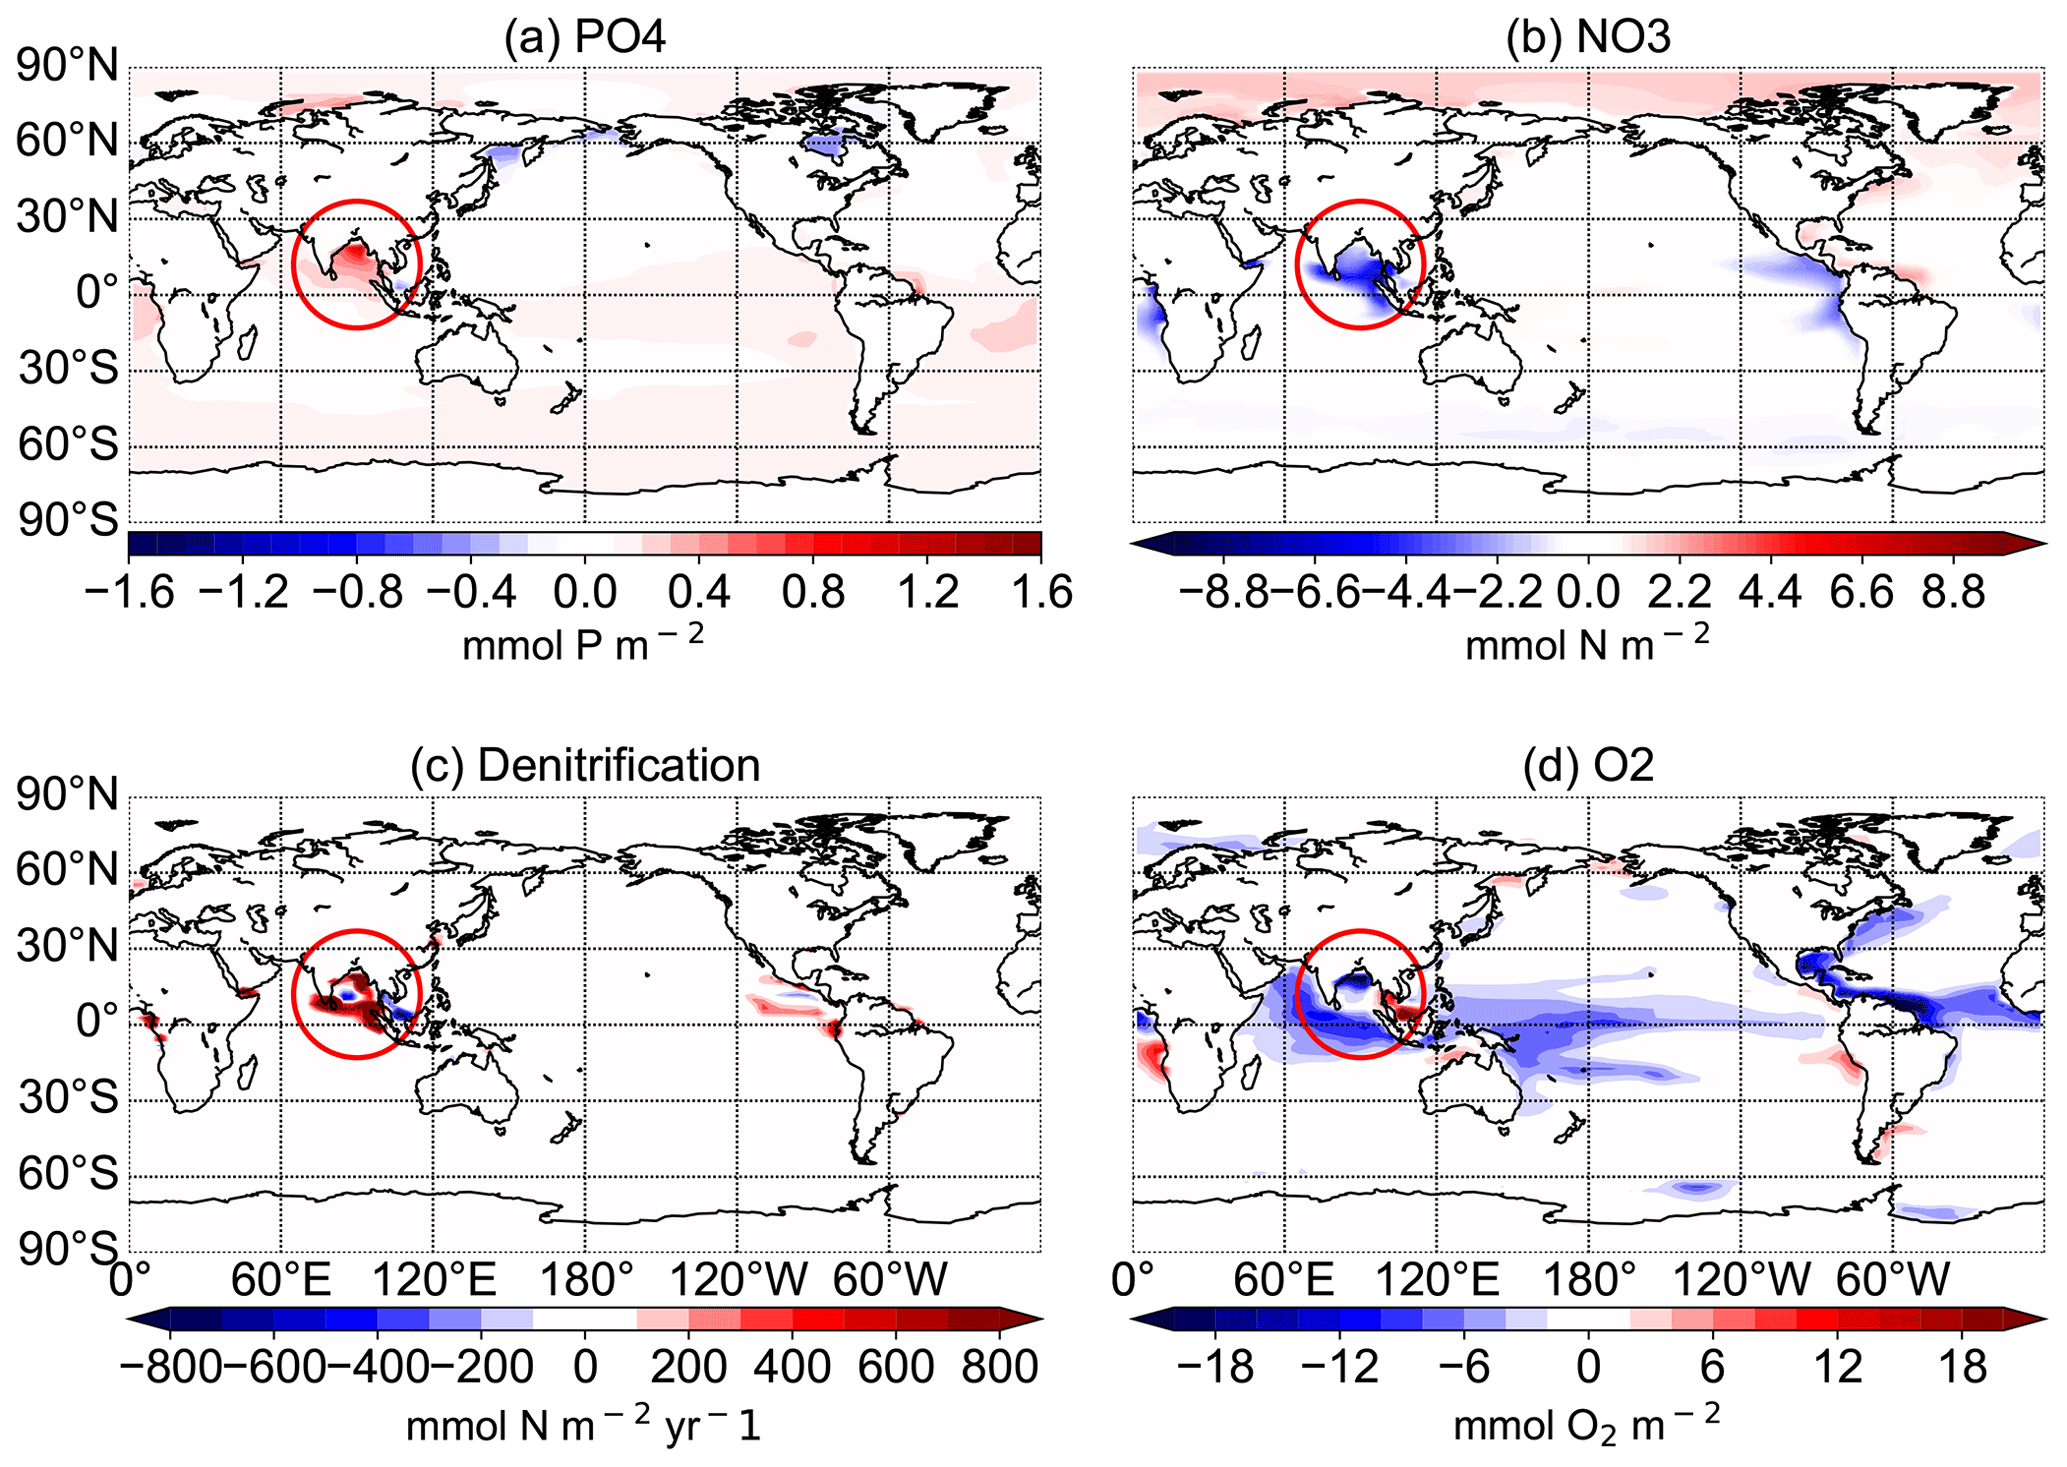
Figure 12Difference between the N+P-BURLOW and CTR simulations for the average of the upper 300 m for PO4 concentrations in mmol P m−3 (a), NO3 concentrations in mmol N m−3 (b), and O2 concentrations in mmol O2 m−3 (d) and for the vertical integration of denitrification in mmol N m−2 yr−1 (c) at the end of the respective simulations over 10 000 years. The red circle shows the region of the Bay of Bengal.

Figure 13Difference between the N+P-BURHIGH and CTR simulations for the average of the upper 300 m for PO4 concentrations in mmol P m−3 (a), NO3 concentrations in mmol N m−3 (b), and O2 concentrations in mmol O2 m−3 (d) and for the vertical integration of denitrification in mmol N m−2 yr−1 (c) at the end of the respective simulations over 10 000 years. The red circle shows the region of the Bay of Bengal.
The black contour lines in Fig. 11 indicate the extent of the oxygen minimum zones at 300 m depth, averaged over the last 100 years of the simulations. The oxygen minimum zone is defined here by O2 concentrations lower than 70 mmol m−3. The main regions with low oxygen concentrations are known to be situated in subsurface waters of the Arabian Sea and in the areas of the eastern boundary upwelling regions in the tropical oceans off California, Peru, and Namibia (e.g. Oschlies et al., 2018). The model results (Fig. 11a) show that UVic misplaces the oxygen minimum zone in the Indian Ocean from the Arabian Sea in the Bay of Bengal. This is similar to other biogeochemical ocean models (Séférian et al., 2020). In reality, the Bay of Bengal is a region with strong seasonality driven by the Asian monsoon system (Löscher et al., 2020). Therefore, highly variable oxygen concentrations inhibit denitrification, while high water column denitrification has been observed in the Arabian Sea (Johnson et al., 2019; Bange et al., 2005).
In the simulations with increased P from rivers, oxygen concentrations decrease significantly in all tropical oceans as well as in the eastern boundary regions. P burial damps the oxygen depletion and can even lead to an increase in oxygen concentrations, especially in the tropical oceans and in the OMZs (Fig. 11). Changes in oxygen concentrations are not limited to oxygen minimum zones, and regions with changing oxygen concentration do not exactly correlate with regions of changed denitrification rates (Fig. 9).
Observational estimates of today's suboxic water area and volume equal 30.4 ± 3×10⁶ km2 and km3, respectively, for oxygen concentrations of less than 20 mmol m−3 (Paulmier and Ruiz-Pino, 2009). In CTR, OMZs defined as regions with oxygen concentrations of less than 20 mmol m−3 (less than 70 mmol m−3) cover 13.1×10⁶ km3 (52×106 km3). The addition of riverine N alone leads only to small changes in oxygen concentrations with a volume of OMZs of 13.2 (54) ×106 km3. Adding P leads to a strong increase in the OMZ area with up to a 68 (192) ×106 km3 expansion in NEWS-N+P. With decreased P concentrations, O2 concentrations increase globally and the global volume of suboxic waters is reduced to less than 1 (5) ×106 km3. The switch for water column denitrification is mainly controlled by the oxygen concentration (Gruber, 2008). While adding riverine N does not impact ocean denitrification significantly, the addition of P leads to an increase in denitrification in the three main regions with oxygen-deficient waters (Fig. 12). Consequently this also leads to reduced N concentrations in these same regions. In contrast, high P burial rates worldwide and hence lower P concentrations lead to significantly higher O2 concentrations, decreased rates of denitrification, and therefore higher N concentrations. This is especially the case in regions where the N-cycle feedbacks had previously limited higher N concentrations (Fig. 13f). Including riverine N supply only slightly impacts the O2 distribution but can start a negative feedback loop near oxygen minimum zones. In our first experiment, this phenomenon also impacted primary production in these regions, damping a global increase in marine production compared to the control simulation. Adding P from riverine export to the modelled ocean has a higher impact on N and oxygen concentrations. As O2 plays an important role in the N feedback cycles, the impact is more significant and not only limited to the OMZ (refer also to Fig. 10).
3.4 Primary production
In Tivig et al. (2021), we showed that including riverine N had only limited impact on marine productivity, due at least partially to feedback reactions in the marine N cycle. Additional P significantly changes this result (Fig. 14): comparing the simulation with riverine N only with the simulation with riverine P only shows that, at least in our model and on a millennial timescale, P is more limiting for primary production than N alone. Primary production amounts to 67 Pg C yr−1 globally in NEWS-P compared to only 55 Pg C yr−1 in NEWS-N. Even in the low-burial simulation, marine biology is more productive than in the simulation without riverine P addition (59 Tg C yr−1). In N+P-BURHIGH, on the other hand, where the ocean is deprived of P at the end of the simulation, the production rates decrease in the global tropical oceans to reach a global amount of 33 Pg C yr−1. Only near the river mouths, where burial has not yet been effective, are net primary production (NPP) rates higher than in the control simulation. In summary, NPP rates are sensitive to the addition of P in our model. In the simulations with N and P addition from rivers, the feedbacks are still active, but NPP rates are nevertheless higher than in our simulation with riverine N alone.

Figure 14Vertically integrated production in g C m−2 yr−1.
In this study, we compare simulations with different biogeochemical settings for N and P in the same ocean circulation. We find that the addition of riverine phosphorus to coastal oceans in our model has a greater impact on the nitrogen cycle and its internal feedbacks than the addition of N alone (Fig. 10). First, additional P directly impacts the N budget by fostering N fixation, especially in P-limited regions. Secondly, it fuels marine primary production, which leads to an increase in the export of detritus, and hence remineralization, which in turn reduces oxygen levels. Lower oxygen concentrations increase denitrification and work towards balancing the nitrogen budget globally. We have also shown that there are regional patterns and that locally, especially in proximity to regions with low oxygen concentrations, the addition of riverine P can lead to depletion of N as a consequence of a positive feedback loop.
Nevertheless, our experimental settings have some limitations that need to be accounted for. First, sedimentary N loss is simulated according to an empirical transfer function based on organic carbon sinking flux to the sediments and bottom-water dissolved oxygen and nitrate. We apply the empirical function of Bohlen et al. (2012). Since our coarse-resolution model does not fully resolve narrow continental shelves and coastal dynamics, a subgrid-scale bathymetry parameterization is included (Somes and Oschlies, 2015). However, UVic still underestimates the sedimentary loss of N in continental shelves (see also Somes et al., 2017).
Although the coastal ocean only accounts for a small part of the total oceanic area, it plays an important role in biogeochemical cycles and its contribution to biogeochemical fluxes is disproportionately large (Naqvi and Unnikrishnan, 2009). The coarse resolution of coastal regions in UVic, with no explicit simulation of the coastal processes, might therefore lead to an underestimation of these processes. In another modelling experiment, Rabouille et al. (2001) found, for example, that enhanced riverine nutrient export leads to a substantial increase in primary production in the coastal ocean and hence accumulation of biomass in all compartments of the coastal ocean system, while denitrification did not increase proportionally in their experiment. These results suggest that the coastal ocean cannot generally self-regulate the effects of perturbations on nutrient cycles (Rabouille et al., 2001). In our experiment, additional N and P from river export could therefore lead to regional shifts in the patterns of primary production and denitrification compared to a model with higher resolution of the coastal oceans. If denitrification rates are too high in our model setup, the vicious cycle might also be overestimated. Furthermore, because nutrient retention on the coastal shelf is not included in our model setup, the buffer effects of the coasts cannot be fully taken into account. Riverine nutrient export to the open ocean might therefore be overestimated in our experiments. These processes could be parameterized as in Sharples et al. (2017) or Izett and Fennel (2018) in a future experiment.
Additionally, submarine groundwater discharge to the oceans is not simulated but might be another significant component of biogeochemical budgets (Santos et al., 2021; Slomp and Capellen, 2004).
The current study does not incorporate all feedbacks that can potentially impact the N cycle. For instance, changes in nutrient availability have been found to affect the C : N : P ratio of primary producers, through both physiological acclimation and shifts in species composition (Grosse et al., 2017). This has, in return, an effect on nutrient cycling and hence primary production. It would be interesting to repeat (some of) the simulations with the optimality-based flexible stoichiometry model that has recently been coupled to the UVic model (Chien et al., 2023) and that has revealed that the same feedback processes as those reported here also operate for a large range of physiological and climatic boundary conditions but that there is a tendency for quantitatively weaker responses compared to the tight coupling found in fixed-stoichiometry models such as the one used here.
Because coastal waters are generally iron replete, we do not expect substantial near-field impacts of iron cycle feedbacks in coastal regions. Further offshore, particularly in currently iron-limited regions such as the Southern Ocean and the subpolar North Pacific, the feedbacks studied here could be modified by changes in atmospheric iron supply, as investigated by earlier studies (Krishnamurthy et al., 2009; Jickells and Moore, 2015; Giraud et al., 2008).
In addition, the spatial patterns of NPP and N2 fixation differ from observations. In the Indian Ocean, the model simulates too much N2 fixation in the Bay of Bengal and not enough in the Arabian Sea, a common problem of more coarsely resolved models, as already stated earlier (Séférian et al., 2020; Moore and Doney, 2007). Of the three major quasi-permanent sites of water column denitrification (the Arabian Sea, the eastern tropical North Pacific, and the eastern tropical South Pacific off the coast of Chile; Codispoti, 2007), the model is only able to reasonably simulate the eastern tropical North Pacific one. In the eastern tropical South Pacific, modelled denitrification is too close to the Equator and does not occur off the coast of Chile where it should (Keller et al., 2012).
Nevertheless, the UVic model has been tested and used for several previous studies of marine biogeochemistry. Keller et al. (2012) found that surface nitrate and phosphate concentrations are similar to observational data (Garcia et al., 2019a). The model rates of N2 fixation are within the wide range (∼ 7–15 Tmol N yr−1) of global N2-fixation estimates (Codispoti, 2007; Deutsch et al., 2007; Gruber and Sarmiento, 1997; Karl et al., 2002). Despite the model limitations mentioned before, the University of Victoria Earth System Climate Model of intermediate complexity has been proven useful in investigating long-term changes in marine biogeochemistry (e.g. Mengis et al., 2020; Somes et al., 2017; Keller et al., 2012).
For the riverine nutrient input, we used the results of the NEWS 2 model. Mayorga et al. (2010) and Dumont et al. (2005) evaluated the individual models for the river export and found that despite uncertainties associated with model inputs, nutrient yield and export were close to observations and the global export estimates were similar to the results of previous analyses.
Although the riverine nutrient export from NEWS 2 includes the anthropogenic component, based on the year 2000, we did not focus on the anthropogenic component in our experiment, and the millennial-scale simulations do not provide much insight into short-term variability. Nevertheless, the question of the influence of human activities on the marine N cycle is most central. Human activities have markedly altered the Earth's cycles of the nutrients nitrogen and phosphorus. Beusen and Bouwman (2022) have shown that rivers with a nutrient load of more than 50 % and at the same time elevated N : P ratios (>25) contributed 36 % of the total global N export to coastal waters. They also found that from 1970 to 2015, global N and P delivery to surface waters increased from 44 to 71 Tg N yr−1 for N (3.1 to 5.1 Tmol N yr−1) and from 7.1 to 9.7 Tg P yr−1 (0.23 to 0.31 Tmol P yr−1) for P, although the export decreased in industrialized countries. Changes affect not only the absolute quantity of nutrients, but also the N : P ratios. Understanding the interplay between these two nutrients is therefore important in order to predict changes in coastal and global oceans (Beusen and Bouwman, 2022).
In a previous study, Tivig et al. (2021) added a new component to the global UVic ESCM to simulate the effects of N supply from river discharge. They found that internal feedbacks in the nitrogen cycle mostly compensated for the imposed yearly addition of 1.6 to 3.3 Tmol of riverine nitrogen and limited the impact on global marine productivity to <2 %. In the current study, riverine phosphorus has been included separately and in addition to N. After 10 000 years, only a simulation with low P burial rates reached a steady state. After 10 000 years of simulations, the global amount of P in the ocean increased significantly in the simulations where riverine P was not balanced by burial sinks and continued to increase. In the simulation with low burial rates, global P increased only slightly, while the simulation with high burial rates led to a continual loss in global P. The simulations showed that, on millennial timescales, including riverine P in the model had a greater impact on the modelled marine biogeochemistry and biology than the inclusion of N alone. Therefore, we can answer the questions raised at the start:
-
Additional P from river runoff affects marine biology not only near the river mouths but also in regions far off the coasts and in the deep oceans.
-
Because the additional P (as well as the loss of P via burial) affects the two processes of denitrification and N2 fixation, the N cycle is also affected and N concentrations increase or decrease locally and globally. In simulations where P is added without burial, N concentrations also increase globally, except in regions where denitrification is dominant, which are in proximity to regions with low to very low oxygen concentrations. Balancing the addition of P by P burial leads to a decrease in the global marine N concentration. The global amount of N at the end of the 10 000 years is lower in the burial simulations than in the simulations without P compensation. This can be attributed to internal feedbacks in the N cycle: additional P increases not only N2 fixation but also denitrification. Knowing that denitrification consumes 7 mol of NO3 for every mole of organic N provided by N2 fixation in regions with low oxygen concentration, a vicious cycle leads to a runaway loss of N. In the simulations where P is not limiting, the N loss can be globally compensated for by N2 fixation in other regions. Where P is reduced because of sediment burial, even if only low, N2 fixation is not effective enough to compensate for the loss in N due to denitrification.
-
Adding P in the coastal oceans has a significant impact on marine oxygen concentrations. Simulated oxygen concentrations decrease globally, but they do so the most in the tropical and Nordic oceans if P is added without an additional sink. In the simulation where P is lost due to sediment burial, however, O2 concentrations increase globally. In Tivig et al. (2021), we found that O2 concentrations are only slightly impacted by the addition of riverine N alone.
Finally, our study showed that additional P from riverine input strongly influences marine productivity not only in the coastal oceans, but also in the open oceans worldwide. Our model simulations suggest that, on millennial timescales, the impact of riverine P on ocean biogeochemistry is more important than the one of riverine N. While this result is linked to our spatially resolved model configuration with all its limitations described before, it confirms the conclusion of Tyrrell (1999) derived for a box model. In our experiments, we also showed that internal feedbacks in the N and P cycle play a crucial role in marine biogeochemistry and can highly impact regional biology, especially in the coastal oceans.
The main sources of P as the ultimate limiting nutrient are rivers transporting P provided by weathering and human activities (Giraud et al., 2008; Föllmi, 1995). While weathering processes are active on millennial timescales and therefore only slowly change the amount of P advected by rivers, human activities have influenced these nutrient transports more rapidly during the last few centuries (Beusen et al., 2016). Furthermore, changes in atmospheric carbon dioxide concentrations and resulting climate changes have already impacted riverine export as well as ocean biogeochemistry and will do even more so in the future (Gao et al., 2023). Although the uncertainties in the real and the modelled nutrient fluxes are still large, our simulations suggest that global ocean biogeochemistry can be substantially affected by the supply of nutrients from rivers and that the global representation of biological activity may be improved by considering riverine export and coastal processes. For this purpose and also in order to analyse variability on shorter timescales, a better spatial resolution of the coastal oceans as well as a more realistic representation of coastal N- and P-cycling processes could be helpful.

Figure A1DIN export yield for each discharge point in mmol N per square metre per month from the NEWS 2 data set interpolated onto the UVic grid for January (a), April (b), July (c), and October (d).
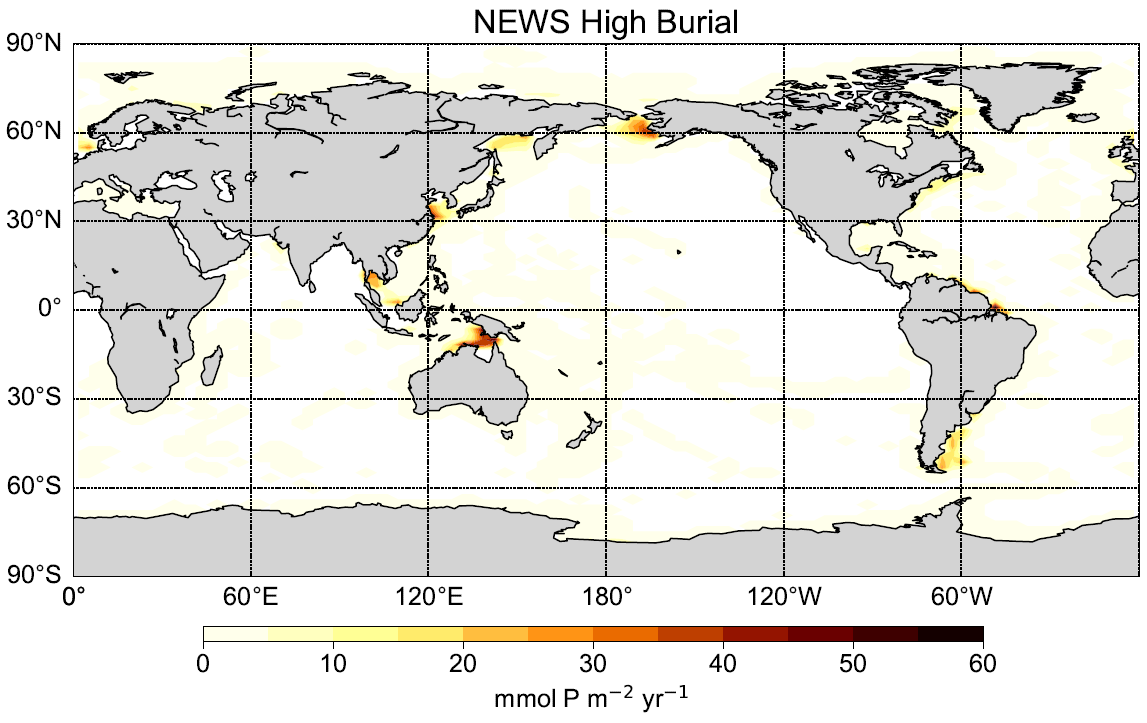
Figure A2Burial flux of P in the N+P-BURHIGH simulation in mmol P yr−1.
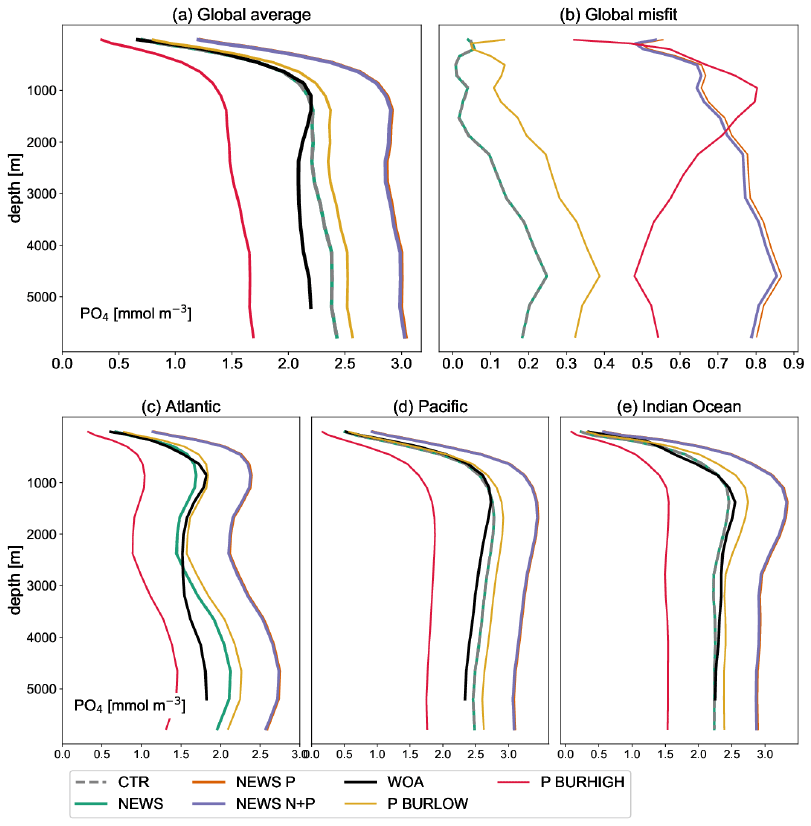
Figure A3Global profile of PO4 in mmol m−3 in the simulations NEWS, CTR, NEWS-P, NEWS-N+P, NEWS-BURLOW, and NEWS-BURHIGH and from the World Ocean Atlas (WOA). (a) Global average of PO4. (b) Global profiles of the misfit between each simulation and the WOA data set. (c) Global-average profiles of PO4 in the Atlantic Ocean. (d) Global-average profiles of PO4 in the Pacific Ocean. (e) Global-average profiles of PO4 in the Indian Ocean.

Figure A4Global profile of NO3 in mmol m−3 in the simulations NEWS, CTR, NEWS-P, NEWS-N+P, NEWS-BURLOW, and NEWS-BURHIGH and from the World Ocean Atlas (WOA). (a) Global average of NO3. (b) Global profiles of the misfit between each simulation and the WOA data set. (c) Global-average profiles of NO3 in the Atlantic Ocean. (d) Global-average profiles of NO3 in the Pacific Ocean. (e) Global-average profiles of NO3 in the Indian Ocean.
The data and material that support the findings of this study are available through GEOMAR at https://hdl.handle.net/20.500.12085/85adfcd5-bc86-440c-a205-496749a9025f (Tivig et al., 2024).
MT developed the research concept in discussion with AO and DPK. DPK provided the initial model code, which was further developed, run, and analysed by MT. MT analysed the model output and visualized the results. MT wrote the manuscript with contributions from all co-authors.
The contact author has declared that none of the authors has any competing interests.
The work reflects only the authors' view; the European Commission and their executive agency are not responsible for any use that may be made of the information the work contains.
Publisher’s note: Copernicus Publications remains neutral with regard to jurisdictional claims made in the text, published maps, institutional affiliations, or any other geographical representation in this paper. While Copernicus Publications makes every effort to include appropriate place names, the final responsibility lies with the authors.
We gratefully acknowledge Emilio Mayorga, Sybil P. Seitzinger, and their co-authors for making their database of Global Nutrient Export from WaterSheds 2 (NEWS 2) available for our study. Andreas Oschlies and David P. Keller acknowledge funding from the European Union's Horizon 2020 research and innovation programme under grant 820989 (project COMFORT, “Our common future ocean in the Earth system – quantifying coupled cycles of carbon, oxygen, and nutrients for determining and achieving safe operating spaces with respect to tipping points”) and OceanNETs (grant no. 869357). We would also like to thank GEOMAR's Biogeochemical Modelling group for many fruitful discussions.
Finally we also acknowledge the constructive comments and suggestions received from Nabir Mamnun and the anonymous referee.
This research has been supported by EU Horizon 2020 (grant nos. 820989 (COMFORT) and 869357 (OceanNETs)).
The article processing charges for this open-access publication were covered by the GEOMAR Helmholtz Centre for Ocean Research Kiel.
This paper was edited by Perran Cook and reviewed by Nabir Mamnun and one anonymous referee.
Altabet, M. A.: Constraints on oceanic N balance/imbalance from sedimentary 15N records, Biogeosciences, 4, 75–86, https://doi.org/10.5194/bg-4-75-2007, 2007. a
Bange, H., Naqvi, S., and Codispoti, L.: The nitrogen cycle in the Arabian Sea, Prog. Oceanogr., 65, 145–158, https://doi.org/10.1016/j.pocean.2005.03.002, 2005. a
Baturin, G. N.: Phosphorus Cycle in the Ocean, Lithol. Miner. Resour., 38, 101–119, 2003. a
Benitez-Nelson, C. R.: The biogeochemical cycling of phosphorus in marine systems, Earth-Sci. Rev., 51, 109–135, https://doi.org/10.1016/S0012-8252(00)00018-0, 2000. a, b, c
Beusen, A. H. W. and Bouwman, A. F.: Future projections of river nutrient export to the global coastal ocean show persisting nitrogen and phosphorus distortion, Frontiers:Water, 4, 893585, https://doi.org/10.3389/frwa.2022.893585, 2022. a, b, c, d
Beusen, A. H. W., Bouwman, A. F., Van Beek, L. P. H., Mogollón, J. M., and Middelburg, J. J.: Global riverine N and P transport to ocean increased during the 20th century despite increased retention along the aquatic continuum, Biogeosciences, 13, 2441–2451, https://doi.org/10.5194/bg-13-2441-2016, 2016. a
Bohlen, L., Dale, A. W., and Wallmann, K.: Simple transfer functions for calculating benthic fixed nitrogen losses and C : N : P regeneration ratios in global biogeochemical models, Global Biogeochem. Cy., 26, GB3029, https://doi.org/10.1029/2011GB004198, 2012. a, b, c, d
Cappellen, P. V. and Maavara, T.: Rivers in the Anthropocene: Global scale modifications of riverine nutrient fluxes by damming, Ecohydrology & Hydrobiology, 16, 106–111, 2016. a
Chien, C.-T., Pahlow, M., Schartau, M., Li, N., and Oschlies, A.: Effects of phytoplankton physiology on global ocean biogeochemistry and climate, Sci. Adv., 9, eadg1725, https://doi.org/10.1126/sciadv.adg1725, 2023. a
Claussen, M., Mysak, L. A., Weaver, A. J., Crucifix, M., Fichefet, T., Loutre, M.-F., Weber, S., Alcamo, J., Alexeev, V., Berger, A., Calov, R., Ganopolski, A., Goosse, H., Lohmann, G., Lunkeit, F., Mokhov, I., Petoukhov, V., Stone, P., and Wang, Z.: Earth System Models of Intermediate Complexity: Closing the Gap in the Spectrum of Climate System Models, Clim. Dynam., 18, 579–586, https://doi.org/10.1007/s00382-001-0200-1, 2002. a
Codispoti, L. A.: Is the ocean losing nitrate?, Nature, 376, 724, https://doi.org/10.1038/376724a0, 1995. a
Codispoti, L. A.: An oceanic fixed nitrogen sink exceeding 400 Tg N a−1 vs the concept of homeostasis in the fixed-nitrogen inventory, Biogeosciences, 4, 233–253, https://doi.org/10.5194/bg-4-233-2007, 2007. a, b
Codispoti, L. A., Brandes, J. A., Christensen, J. P., Devol, A. H., Naqvi, S. A., Paerl, H. W., and Yoshinari, T.: The oceanic fixed nitrogen and nitrous oxide budgets: Moving targets as we enter the anthropocene?, Sci. Mar., 65, 85–105, 2001. a
Colman, A. S. and Holland, H. D.: The Global Diagenetic Flux of Phosphorus from Marine Sediments to the Oceans: Redox Sensitivity and the Control of Atmospheric Oxygen Levels, in: Marine Authigenesis: From Global to Microbial, Vol. 66, 53–75, SEPM Society for Sedimentary Geology, ISBN 9781565761889, https://doi.org/10.2110/pec.00.66.0053, 2000. a, b, c
Compton, J., Mallinson, D., Glenn, C. R., Filippelli, G., Föllmi, K., Shields, G., and Zanin, Y.: Variations in the global phosphorus cycle, in: Marine Authigenesis: From Global to Microbial, Vol. 66, 21–33, SEPM Society for Sedimentary Geology, ISBN 1-56576-064-6, https://doi.org/10.2110/pec.00.66.0021, 2000. a, b
Delaney, M. L.: Phosphorus accumulation in marine sediments and the oceanic phosphorus cycle, Global Biogeochem. Cy., 12, 563–572, 1998. a, b
Deutsch, C., Gruber, N., Key, R. M., and Sarmiento, J. L.: Denitrification and N2 fixation in the Pacific Ocean, Global Biogeochem. Cy., 15, 483–506, 2001. a
Deutsch, C., Sarmiento, J. L., Sigman, D. M., Gruber, N., and Dunne, J. P.: Spatial coupling of nitrogen inputs and losses in the ocean, Nature, 445, 163–167, 2007. a, b, c
Dumont, E., Harrison, J. A., Kroeze, C., Bakker, E. J., and Seitzinger, S. P.: Impacts of Atmospheric Anthropogenic Nitrogen on the Open Ocean, Global Biogeochem. Cy., 19, GB4S02, https://doi.org/10.1029/2005GB002488, 2005. a, b
Eby, M., Zickfeld, K., Montenegro, A., Archer, D., Meissner, K. J., and Weaver, A. J.: Lifetime of Anthropogenic Climate Change: Millennial Time Scales of Potential CO2 and Surface Temperature Perturbations, J. Climate, 22, 2501–2511, https://doi.org/10.1175/2008JCLI2554.1, 2009. a, b
Falkowski, P. G.: Evolution of the nitrogen cycle and its influence on the biological sequestration of CO2 in the ocean, Nature, 387, 272–275, https://doi.org/10.1038/387272a0, 1997. a
Fanning, A. F. and Weaver, A. J.: An atmospheric energy-moisture balance model: Climatology, interpentadal climate change, and coupling to an ocean general circulation model, J. Geophys. Res., 101, 15111–15128, https://doi.org/10.1029/96JD01017, 1996. a
Filipelli, G. M.: The Global Phosphorus Cycle: Past, Present, and Future, Elements, 4, 89–95, https://doi.org/10.2113/GSELEMENTS.4.2.89, 2008. a, b, c, d, e, f
Flögel, S., Wallmann, K., Poulson, C. J., Zhou, J., Oschlies, A., Voigt, S., and Kuhnt, W.: Simulating the biogeochemical effects of volcanic CO2 degassing on the oxygen-state of the deep ocean during the Cenomanian/Turonian Anoxic Event (OAE2), Earth Planet Scientific Letters, 305, 371–384, https://doi.org/10.1016/j.epsl.2011.03.018, 2011. a, b, c, d, e
Föllmi, K. B.: The Phosphorus Cycle, phosphogenesis and marine phosphate-rich deposits, Earth-Sci. Rev., 40, 55–124, https://doi.org/10.1016/0012-8252(95)00049-6, 1995. a, b, c, d
Galloway, J. N., Dentener, F., Capone, D., Boyer, E., Howarth, R., Seitzinger, S., Asner, G., Cleveland, C., Green, P., Holland, E., Karl, D., Michaels, A., Porter, J., Townsend, A., and Vörösmarty, C.: Nitrogen cycles: past, present, and future, Biogeochemistry, 70, 153–226, https://doi.org/10.1007/s10533-004-0370-0, 2004. a
Gao, S., Schwinger, J., Tjiputra, J., Bethke, I., Hartmann, J., Mayorga, E., and Heinze, C.: Riverine impact on future projections of marine primary production and carbon uptake, Biogeosciences, 20, 93–119, https://doi.org/10.5194/bg-20-93-2023, 2023. a
Garcia, H. E., Weathers, K., Paver, C. R., Smolyar, I., Boyer, T. P., Locarnini, R. A., Zweng, M. M., Mishonov, A. V., Baranova, O. K., Seidov, D., and Reagan, J. R.: Volume 3: Dissolved Oxygen, Apparent Oxygen Utilization, and Oxygen Saturation, in: World Ocean Atlas 2018, Volume 3, 38 pp., NOAA Atlas NESDIS 83, https://www.nodc.noaa.gov/OC5/woa18/pubwoa18.html (last access: 2 October 2024), 2019a. a
Garcia, H. E., Weathers, K., Paver, C. R., Smolyar, I., Boyer, T. P., Locarnini, R. A., Zweng, M. M., Mishonov, A. V., Baranova, O. K., Seidov, D., and Reagan, J. R.: Volume 4: Dissolved Inorganic Nutrients (phosphate, nitrate and nitrate+nitrite, silicate), in: World Ocean Atlas 2018, 35 pp., NOAA Atlas NESDIS 84, https://www.ncei.noaa.gov/sites/default/files/2020-04/woa18_vol4.pdf (last access: 2 October 2024), 2019b. a
Garnier, J., Beusen, A., Thieu, V., Billen, G., and Bouwman, L.: N : P : Si nutrient export ratios and ecological consequences in coastal seas evaluated by the ICEP approach, Global Biogeochem. Cy., 24, GB0A05, https://doi.org/10.1029/2009GB003583, 2010. a
Giraud, X., Quéré, C. L., and da Cunha, L. C.: Importance of coastal nutrient supply for global ocean biogeochemistry, Global Biogeochem. Cy., 22, GB2025, https://doi.org/10.1029/2006GB002717, 2008. a, b, c, d, e, f
Grosse, J., Burson, A., Stomp, M., Huisman, J., and Boschker, H. T. S.: From Ecological Stoichiometry to Biochemical Composition: Variation in N and P Supply Alters Key Biosynthetic Rates in Marine Phytoplankton, Front. Microbiol., 8, 1299, https://doi.org/10.3389/fmicb.2017.01299, 2017. a
Gruber, N.: The Dynamics of the Marine Nitrogen Cycle and its Influence on Atmospheric CO2 Variations, in: The Ocean Carbon Cycle and Climate, edited by: Follows, M. and Oguz, T., 97–148, Springer Netherlands, Dordrecht, https://doi.org/10.1007/978-1-4020-2087-2_4, 2004. a, b, c, d
Gruber, N.: The marine nitrogen cycle: Overview and challenges, in: Nitrogen in the Marine Environment, edited by: Capone, D. G., Bronk, D. A., Mulholland, M. R., and Carpenter, E. J., 2nd Edn., chap. 1, 1–50, Academic Press, San Diego, California, https://doi.org/10.1016/B978-0-12-372522-6.00001-3, 2008. a, b
Gruber, N. and Sarmiento, J. L.: Global patterns of marine nitrogen fixation and denitrification, Global Biogeochem. Cy., 11, 235–266, https://doi.org/10.1029/97GB00077, 1997. a, b
Harrison, J. A., Seitzinger, S. P., Bouwman, A. F., Caraco, N. F., Beusen, A. H. W., and Vörösmarty, C. J.: Dissolved inorganic phosphorus export to the coastal zone: Results from a spatially explicit, global model, Global Biogeochem. Cy., 19, GB4S03, https://doi.org/10.1029/2004GB002357, 2005. a
Ingall, E. and Jahnke, R.: Evidence for enhanced phosphorus regeneration from marine sediments overlain by oxygen depleted waters, Geochim. Cosmochim. Ac., 58, 2571–2575, 1994. a
Izett, J. G. and Fennel, K.: Estimating the Cross-Shelf Export of Riverine Materials: Part 1. General Relationships From an Idealized Numerical Model, Global Biogeochem. Cy., 32, 160–175, https://doi.org/10.1002/2017GB005667, 2018. a
Jickells, T. and Moore, C. M.: The Importance of Atmospheric Deposition for Ocean Productivity, Annu. Rev. Ecol. Syst., 46, 481–501, https://doi.org/10.1146/annurev-ecolsys-112414-054118, 2015. a
Johnson, K. S., Riser, S. C., and Ravichandran, M.: Oxygen Variability Controls Denitrification in the Bay of Bengal Oxygen Minimum Zone, Geophys. Res. Lett., 46, 804–811, https://doi.org/10.1029/2018GL079881, 2019. a
Karl, D., Micheals, A., B.Bergman, Capone, D., Carpenter, E., Letelier, R., Lipschultz, F., Paerl, H., Sigman, D., and Stal, L.: Dinitrogen fixation in the world's oceans, Biogeochemistry, 57/58, 47–98, 2002. a
Keller, D. P., Oschlies, A., and Eby, M.: A new marine ecosystem model for the University of Victoria Earth System Climate Model, Geosci. Model Dev., 5, 1195–1220, https://doi.org/10.5194/gmd-5-1195-2012, 2012. a, b, c, d, e, f, g, h, i, j
Kemena, T. P., Landolfi, A., Oschlies, A., Wallmann, K., and Dale, A. W.: Ocean phosphorus inventory: large uncertainties in future projections on millennial timescales and their consequences for ocean deoxygenation, Earth Syst. Dynam., 10, 539–553, https://doi.org/10.5194/esd-10-539-2019, 2019. a, b, c, d, e, f, g, h, i, j, k
Krishnamurthy, A., Moore, J. K., Mahowald, N., Luo, C., Doney, S. C., Lindsay, K., and Zender, C. S.: Impacts of increasing anthropogenic soluble iron and nitrogen deposition on ocean biogeochemistry, Global Biogeochem. Cy., 23, GB3016, https://doi.org/10.1029/2008GB003440, 2009. a
Lacroix, F., Ilyina, T., and Hartmann, J.: Oceanic CO2 outgassing and biological production hotspots induced by pre-industrial river loads of nutrients and carbon in a global modeling approach, Biogeosciences, 17, 55–88, https://doi.org/10.5194/bg-17-55-2020, 2020. a, b
Landolfi, A., Dietze, H., Koeve, W., and Oschlies, A.: Overlooked runaway feedback in the marine nitrogen cycle: the vicious cycle, Biogeosciences, 10, 1351–1363, https://doi.org/10.5194/bg-10-1351-2013, 2013. a, b, c, d, e
Landolfi, A., Koeve, W., Dietze, H., Kähler, P., and Oschlies, A.: A new perspective on environmental controls of marine nitrogen fixation, Geophys. Res. Lett., 42, 4482–4489, https://doi.org/10.1002/2015GL063756, 2015. a
Liebig, J. v.: Die organische Chemie in ihrer Anwendung auf Agricultur und Physiologie (Organic chemistry in its applications to agriculture and physiology), Friedrich Vieweg und Sohn Publishing Company, Braunschweig, Germany, 1840. a
Löscher, C. R., Mohr, W., Bange, H. W., and Canfield, D. E.: No nitrogen fixation in the Bay of Bengal?, Biogeosciences, 17, 851–864, https://doi.org/10.5194/bg-17-851-2020, 2020. a
Martiny, A. C., Lomas, M. W., Fu, W., Boyd, P. W., Chen, Y.-I. L., Cutter, G., Ellwood, M. J., Furuya, K., Hashihama, F., Kanda, J., Karl, D. M., Kodama, T., Li, Q. P., Ma, J., Moutin, T., Woodward, E. M. S., and Moore, J. K.: Biogeochemical controls of surface ocean phosphate, Sci. Adv., 5, eaax0341, https://doi.org/10.1126/sciadv.aax0341, 2019. a
Mather, R. L., Reynolds, S. E., Wolff, G. A., Williams, R. G., Torres-Valdes, S., Woodward, E. M. S., Landolfi, A., Pan, X., Sanders, R., and Achterberg, E. P.: Phosphorus cycling in the North and South Atlantic Ocean subtropical gyres, Nat. Geosci., 1, 439–443, https://doi.org/10.1038/ngeo232, 2008. a
Mayorga, E., Seitzinger, S. P., Harrison, J. A., Dumont, E., Beusen, A. H. W., Bouwman, A., Fekete, B. M., Kroeze, C., and van Drecht, G.: Global Nutrient Export fromWaterSheds 2 (NEWS 2): Model development and implementation, Environ. Modell. Softw., 25, 837–853, https://doi.org/10.1016/j.envsoft.2010.01.007, 2010. a, b, c, d, e
Mengis, N., Keller, D. P., MacDougall, A. H., Eby, M., Wright, N., Meissner, K. J., Oschlies, A., Schmittner, A., MacIsaac, A. J., Matthews, H. D., and Zickfeld, K.: Evaluation of the University of Victoria Earth System Climate Model version 2.10 (UVic ESCM 2.10), Geosci. Model Dev., 13, 4183–4204, https://doi.org/10.5194/gmd-13-4183-2020, 2020. a
Monteiro, F. M., Pancost, R. D., Ridgwell, A., and Donnadieu, Y.: Nutrients as the dominant control on the spread of anoxia and euxinia across the Cenomanian-Turonian oceanic anoxic event (OAE2): Model-data comparison, Paleoceanography, 27, PA4209, https://doi.org/10.1029/2012PA002351, 2012. a
Moore, C. M., Mills, M. M., Achterberg, E. P., Geider, R. J., LaRoche, J., Lucas, M. I., McDonagh, E. L., Pan, X., Poulton, A. J., Rijkenberg, M. J. A., Suggett, D. J., Ussher, S. J., and Woodward, E. M. S.: Large-scale distribution of Atlantic nitrogen fixation controlled by iron availability, Nat. Geosci. Lett., 2, 867–871, https://doi.org/10.1038/NGEO667, 2009. a
Moore, J. K. and Doney, S. C.: Iron availability limits the ocean nitrogen inventory stabilizing feedbacks between marine denitrification and nitrogen fixation, Global Biogeochem. Cy., 21, GB2001, https://doi.org/10.1029/2006GB002762, 2007. a
Naqvi, S. W. A. and Unnikrishnan, A. S.: Hydrography and biogeochemistry of the coastal ocean, Surface Ocean–Lower Atmosphere Processes, 187, 233–250, 2009. a
Niemeyer, D., Kemena, T. P., Meissner, K. J., and Oschlies, A.: A model study of warming-induced phosphorus–oxygen feedbacks in open-ocean oxygen minimum zones on millennial timescales, Earth Syst. Dynam., 8, 357–367, https://doi.org/10.5194/esd-8-357-2017, 2017. a, b, c
Oschlies, A., Brandt, P., Stramma, L., and Schmidtko, S.: Drivers and mechanisms of ocean deoxygenation, Nat. Geosci., 11, 467–473, https://doi.org/10.1038/s41561-018-0152-2, 2018. a, b
Oschlies, A., Koeve, W., Landolfi, A., and Kähler, P.: Loss of fixed nitrogen causes net oxygen gain in a warmer future ocean, Nat. Commun., 10, 2805, https://doi.org/10.1038/s41467-019-10813-w, 2019. a
Palastanga, V., Slomp, C. P., and Heinze, C.: Long‐term controls on ocean phosphorus and oxygen in a global biogeochemical model, Global Biogeochem. Cy., 25, GB3024, https://doi.org/10.1029/2010GB003827, 2011. a
Partanen, A.-I., Keller, D. P., Korhonen, H., and Matthews, H. D.: Impacts of sea spray geoengineering on ocean biogeochemistry, Geophys. Res. Lett., 43, 7600–7608, https://doi.org/10.1002/2016GL070111, 2016. a
Paulmier, A. and Ruiz-Pino, D.: Oxygen minimum zones (OMZs) in the modern ocean, Global Biogeochem. Cy., 25, GB3024, https://doi.org/10.1016/j.pocean.2008.08.001, 2009. a
Rabouille, C., Mackenzie, F. T., and Ver, L. M.: Influence of the human perturbation on carbon, nitrogen, and oxygen biogeochemical cycles in the global coastal ocean, Geochim. Cosmochim. Ac., 65, 3615–3641, 2001. a, b
Redfield, A. C., Ketchum, B. H., and Richards, F. A.: The Influence of Organisms on the Composition of Sea-Water, in: The Sea Vol. 2, edited by: Hill, M. N., 26–27, Interscience, New York, 1963. a, b
Ruttenberg, K. C.: The Global Phosphorus Cycle, in: Treatise on Geochemistry, edited by: Schlesinger, W., Elsevier, https://doi.org/10.1016/B0-08-043751-6/08153-6, 2003. a, b, c, d, e, f, g, h, i
Santos, I. R., Chen, X., Lecher, A. L., Sawyer, A. H., Moosdorf, N., Rodellas, V., Tamborski, J., Cho, H.-M., Dimova, N., Sugimoto, R., Bonaglia, S., Li, H., Hajati, M.-C., and Li, L.: Submarine groundwater discharge impacts on coastal nutrient biogeochemistry, Nat. Rev. Earth Environ., 2, 307–323, https://doi.org/10.1038/s43017-021-00152-0, 2021. a
Schmittner, A., Oschlies, A., Giraud, X., Eby, M., and Simmons, H. L.: A global model of the marine ecosystem for long-term simulations: Sensitivity to ocean mixing buoyancy forcing, particle sinking, and dissolved organic matter cycling, Global Biogeochem. Cy., 19, GB3004, https://doi.org/10.1029/2004GB002283, 2005. a
Schmittner, A., Oschlies, A., Matthews, H. D., and Galbraith, E. D.: Future changes in climate, ocean circulation, ecosystems, and biogeochemical cycling simulated for a business-as-usual CO2 emission scenario until year 4000 AD, Global Biogeochem. Cy., 22, GB1013, https://doi.org/10.1029/2007GB002953, 2008. a, b
Séférian, R., Berthet, S., Yool, A., Palmiéri, J., Bopp, L., Tagliabue, A., Kwiatkowski, L., Aumont, O., Christian, J., Dunne, J., Gehlen, M., Ilyina, T., John, J. G., Li, H., Long, M. C., Luo, J. Y., Nakano, H., Romanou, A., Schwinger, J., Stock, C., Santana-Falcón, Y., Takano, Y., Tjiputra, J., Tsujino, H., Watanabe, M., Wu, T., Wu, F., and Yamamoto, A.: Tracking Improvement in Simulated Marine Biogeochemistry Between CMIP5 and CMIP6, Current Climate Change Reports, 6, 95–119, https://doi.org/10.1007/s40641-020-00160-0, 2020. a, b
Seitzinger, S. P., Mayorga, E., Bouwman, A. F., Kroeze, C., Beusen, A. H. W., Billen, G., Drecht, G. V., Dumont, E., Fekete, B. M., Garnier, J., and Harrison, J. A.: Global river nutrient export: A scenario analysis of past and future trends, Global Biogeochem. Cy., 24, GB0A08, https://doi.org/10.1029/2009GB003587, 2010. a
Sharples, J., Middelburg, J. J., Fennel, K., and Jickells, T. D.: What proportion of riverine nutrients reaches the open ocean?, Global Biogeochem. Cy., 31, 39–58, https://doi.org/10.1002/2016GB005483, 2017. a
Slomp, C. P. and Capellen, P. V.: Nutrient inputs to the coastal ocean through submarine groundwater discharge: controls and potential impact, J. Hydrol., 295, 64–86, https://doi.org/10.1016/j.jhydrol.2004.02.018, 2004. a
Sohm, J. A., Webb, E. A., and Capone, D. G.: Emerging patterns of marine nitrogen fixation, Nat. Rev. Microbiol., 9, 499–508, https://doi.org/10.1038/nrmicro2594, 2011. a
Somes, C. J. and Oschlies, A.: On the influence of “non-Redfield” dissolved organic nutrient dynamics on the spatial distribution of N2 fixation and the size of the marine fixed nitrogen inventory, Global Biogeochem. Cy., 29, 973–993, https://doi.org/10.1002/2014GB005050, 2015. a, b
Somes, C. J., Schmittner, A., Galbraith, E. D., Lehmann, M. F., Altabet, M. A., Montoya, J. P., Letelier, R. M., Mix, A. C., Bourbonnais, A., and Eby, M.: Simulating the global distribution of nitrogen isotopes in the ocean, Global Biogeochem. Cy., 24, GB4019, https://doi.org/10.1029/2009GB003767, 2010. a
Somes, C. J., Oschlies, A., and Schmittner, A.: Isotopic constraints on the pre-industrial oceanic nitrogen budget, Biogeosciences, 10, 5889–5910, https://doi.org/10.5194/bg-10-5889-2013, 2013. a, b
Somes, C. J., Schmittner, A., Muglia, J., and Oschlies, A.: SA Three-Dimensional Model of theMarine Nitrogen Cycle during the Last Glacial Maximum Constrained by Sedimentary Isotopes, Front. Mar. Sci., 4, 108, https://doi.org/10.3389/fmars.2017.00108, 2017. a, b
Tivig, M., Keller, D. P., and Oschlies, A.: Riverine nitrogen supply to the global ocean and its limited impact on global marine primary production: a feedback study using an Earth system model, Biogeosciences, 18, 5327–5350, https://doi.org/10.5194/bg-18-5327-2021, 2021. a, b, c, d, e, f, g, h, i, j, k, l, m, n, o, p
Tivig, M., Keller, D. P., and Oschlies, A.: UVic simulation with riverine nutrient export from NEWS2 dataset, GEOMAR Helmholtz Centre for Ocean Research Kiel [data set, code], http://hdl.handle.net/20.500.12085/85adfcd5-bc86-440c-a205-496749a9025f, 2024. a
Tyrrell, T.: The relative influences of nitrogen and phosphorus on oceanic primary production, Nature, 400, 525–531, 1999. a, b, c, d, e, f, g
Voss, M., Bange, H. W., Dippner, J. W., Middelburg, J. J., Montoya, J. P., and Ward, B.: The marine nitrogen cycle: recent discoveries, uncertainties and the potential relevance of climate change, Philos. T. Roy. Soc. B, 368, 20130121, https://doi.org/10.1098/rstb.2013.0121, 2013. a
Wallmann, K.: Phosphorus imbalance in the global ocean?, Global Biogeochem. Cy., 24, GB4030, https://doi.org/10.1029/2009GB003643, 2010. a, b, c, d, e
Wang, W.-L., Moore, J. K., Martiny, A. C., and Primeau, F. W.: Convergent estimates of marine nitrogen fixation, Nature, 566, 205–211, https://doi.org/10.1038/s41586-019-0911-2, 2019. a
Weaver, A. J., Eby, M., Wiebe, E. C., Bitz, C., Duffy, P. B., Ewen, T. L., Fanning, A. F., Holland, M. M., MacFadyen, A., Matthews, H. D., Meissner, K. J., Saenko, O., Schmittner, A., Wang, H., and Yoshimori, M.: The UVic Earth System Climate Model: Model Description, Climatology, and Applications to Past, Present and Future Climates, Atmosphere-Ocean, 39, 361–428, https://doi.org/10.1080/07055900.2001.9649686, 2001. a, b, c
Zehr, J. P. and Capone, G.: Changing perspectives in marine nitrogen fixation, Science, 368, eaay9514, https://doi.org/10.1126/science.aay9514, 2020. a