the Creative Commons Attribution 4.0 License.
the Creative Commons Attribution 4.0 License.
 | 24 Jan 2024
Tropical dry forest response to nutrient fertilization: a model validation and sensitivity analysis
Shuyue Li
Bonnie Waring
Jennifer Powers
Soil nutrients, especially nitrogen (N) and phosphorus (P), regulate plant growth and hence influence carbon fluxes between the land surface and atmosphere. However, how forests adjust biomass partitioning to leaves, wood, and fine roots in response to N and/or P fertilization remains puzzling. Recent work in tropical forests suggests that trees increase fine root production under P fertilization, but it is unclear whether mechanistic models can reproduce this dynamic. In order to better understand mechanisms governing nutrient effects on plant allocation and improve models, we used the nutrient-enabled ED2 model to simulate a fertilization experiment being conducted in a secondary tropical dry forest in Costa Rica. We evaluated how different allocation parameterizations affected model performance. These parameterizations prescribed a linear relationship between relative allocation to fine roots and soil P concentrations. The slope of the linear relationship was allowed to be positive, negative, or zero. Some parameterizations realistically simulated leaf, wood, and fine root production, and these parameterizations all assumed a positive relationship between relative allocation to fine roots and soil P concentration. Model simulations of a 30-year timeframe indicated strong sensitivity to parameterization and fertilization treatment. Without P fertilization, the simulated aboveground biomass (AGB) accumulation was insensitive to the parameterization. With P fertilization, the model was highly sensitive to the parameterization and the greatest AGB accumulation occurred when relative allocation to fine roots was independent of soil P. Our study demonstrates the need for simultaneous measurements of leaf, wood, and fine root production in nutrient fertilization experiments and for longer-term experiments. Models that do not accurately represent allocation to fine roots may be highly biased in their simulations of AGB, especially on multi-decadal timescales.
- Article
(1892 KB) - Full-text XML
-
Supplement
(357 KB) - BibTeX
- EndNote


Primary production in many terrestrial ecosystems is likely to be limited by nitrogen (N), phosphorus (P), or both (LeBauer and Treseder, 2008; Hou et al., 2020). Because nutrient availability modulates plant growth and death, it can determine terrestrial carbon storage (Oren et al., 2001), affect tree mortality and recovery after disturbance events (Gessler et al., 2017), and even alter the sign and magnitude of land carbon sink in response to climate change (Wieder et al., 2015). However, in nutrient-enabled Earth system models, there is significant variation across model predictions (Arora et al., 2020; Kou-Giesbrecht et al., 2023), suggesting the need for increased process-level understanding. A fundamental aspect of these models is the allocation of total production to production of leaves, wood, and fine roots. If the effects of nutrient limitation on allocation are not correctly simulated by models, simulation of total production and its sensitivity to climate change may be biased.
Nutrient fertilization field experiments can be used to assess the effects of nutrient limitation on terrestrial ecosystems and to improve model simulations of production and allocation. Global meta-analysis has shown that both aboveground (Hou et al., 2020) and belowground production (Yuan and Chen, 2012) increases with P addition. Further, Li et al. (2016) also reported that aboveground production increased more than belowground production with P addition. The increase in aboveground production relative to belowground production is consistent with resource limitation theory (Bloom et al., 1985; Chapin et al., 1987). Resource limitation theory stipulates that trees should grow the tissue type (leaves, wood, fine roots) that would increase uptake rates of the most limiting resource to achieve optimal partitioning. Thus, if fine root biomass is the limiting factor for nutrient acquisition, then resource limitation theory would predict fine root production to decrease as soil nutrients increased.
However, there is also evidence that the story in tropical forests may be more complex. These global meta-analyses have pointed out large variation across sites and as well as dependence on the amount of fertilizer applied (Li et al., 2016; Hou et al., 2020). Furthermore, concerns have been raised by Wright (2019) about the tropical forest plot selection in Li et al. (2016). In a meta-analysis focusing on tropical forests, Wright (2019) concluded that P addition increased fine litter and wood production. No effect was found on fine root biomass, but it was cautioned that the number of studies was small and also that fine root production was not analyzed due to lack of data. More recently, fertilization experiments in central Amazonia indicated increased fine root production with P fertilization (Lugli et al., 2021; Cunha et al., 2022). Intriguingly, Cunha et al. (2022) also reported increases in fine root production relative to aboveground production, in contrast to Li et al. (2016). Relative fine root production was not reported in Lugli et al. (2021).
Compared to tropical moist forests, fewer fertilization experiments have been done in tropical dry forests (Wright, 2019). In a Mexico, P fertilization led to strongly increased basal area increments (Campo and Vázquez Yanes, 2004). However, after 3 years of fertilization in a Costa Rican forest, aboveground production was unchanged following either N or P fertilization (Waring et al., 2019a). Instead, Waring et al. (2019a) found that fine root production increased in response to P fertilization, but not following N fertilization. This increase in relative allocation to fine roots under P fertilization is consistent with the response observed by Cunha et al. (2022) in the Amazon. These observed increases in relative allocation to fine roots with P fertilization are also consistent with several studies that have shown that roots proliferate in nutrient-rich patches (Pregitzer et al., 1993; Robinson, 1994; Zhang and Forde, 1998; Robinson et al., 1999; Fransen et al., 1999; Hodge et al., 1999; Jing et al., 2010; Li et al., 2012). This proliferation may be related to enhanced root morphological plasticity with increasing soil P, which increases nutrient uptake per unit construction cost (Fitter, 1994; Eissenstat and Yanai, 2002; Zhang et al., 2016). It may also be physiologically adaptive if it allows for faster uptake of nutrients from the soil (Jackson et al., 1990; Hodge, 2004).
Given that several of the most recent tropical forest fertilization experiments show increases in absolute (and even relative) fine root production in response to P fertilization, models should be tested as to whether they simulate this dynamic. If simulated allocation were biased, the simulated carbon sink would likely also be biased because wood residence time is much longer than that of leaves or fine roots. Moreover, as most soil carbon is derived from roots rather than aboveground tissues (Jackson et al., 2017), the soil carbon pool is also likely sensitive to plant biomass allocation. Finally, incorrect allocation would also likely lead to biases in simulations of ecosystem functioning. Despite the number of P-enabled models that now exist (e.g., CASACNP, Wang et al., 2010; JSBACH, Goll et al., 2012; CLM-CNP, Yang et al., 2014; ORCHIDEE-CNP, Goll et al., 2017; QUINCY, Thum et al., 2019; ED2, Medvigy et al., 2019; ELM-CNP, Zhu et al., 2019; DLEM-CNP, Wang et al., 2020; JULES-CNP, Nakhavali et al., 2022; FUN-CNP, Braghiere et al., 2022) and inter-model comparison on representation of P-cycling processes (Menge et al., 2023), the simulated effects of P availability on relative allocation to leaves, wood, and fine roots have not been analyzed. Such analysis is needed, especially because different models use different schemes to determine allocation.
An additional useful application of models is sensitivity analysis, which can be used to generate new hypotheses and suggest new experiments. While most field fertilization experiments have only lasted a few years (Wright, 2019), forest responses to fertilization on that timescale may differ from forest responses to longer timescales. For example, forests of different ages would be expected to have different composition, structure, and demographic rates, and tropical forest composition has been shown to affect the response of production to fertilization (Báez and Homeier, 2018). Responses in secondary forests, as in Waring et al. (2019a), could be particularly sensitive to timescales. In these forests, nutrient demand can change rapidly over the course of a few decades (Batterman et al., 2013; Waring et al., 2015), and changing nutrient demand may lead to changes in allocation strategies. Thus, results from multi-decadal sensitivity analyses can then be used to pinpoint potentially important processes and to suggest hypotheses for future field experiments.
The objective of this study was to use both a model and an experiment to better understand how relative allocation varies with nutrient availability; specifically, we investigated the consequences of three related premises: (a) plants increase relative fine root production with P fertilization (Waring et al., 2019a; Cunha et al., 2022), (b) plants decrease relative fine root production with increasing soil P (Li et al., 2016), and (c) plant fine root production is independent of soil P. This last type of response would be expected if relative allocation to fine roots depended more on water or N than on P. Our model was the ED2 vegetation demographic model that now includes N and P cycling (Medvigy et al., 2019). The experiment involved N and P fertilization in a secondary tropical dry forest in Guanacaste, Costa Rica, at Estación Experimental Forestal Horizontes (https://www.acguanacaste.ac.cr, last access: 1 December 2022) (Waring et al., 2019a). We implemented a new allocation scheme in which root production was made dependent on soil P concentration. We carried out model validation with respect to leaf, wood, and fine root production. We also carried out a sensitivity analysis to determine how allocation parameterization affected simulations on timescales ranging from 3 to 30 years.
2.1 Field site and observations
A nutrient fertilization experiment has been ongoing since 2015 at Estación Experimental Forestal Horizontes (10.712∘ N, 85.594∘ W) in Guanacaste, Costa Rica. The experimental design is fully described in Waring et al. (2019a) and is summarized here. The site is embedded within an approximately 30-year-old regenerating tropical dry forest, where mean annual temperature is about 25 ∘C and mean annual precipitation is about 1700 mm. Precipitation has strong seasonality with most rain falling between May and November, and seasonal variability of precipitation does influence plant phenology: new leaves are produced in April and May and shed between January and March; stems do not grow during the dry season. Precipitation also has high interannual variability typically associated the with El Niño–Southern Oscillation (ENSO). Soils are mainly Andic and Typic Haplustepts (Alfaro et al., 2001), with a high percentage of clay (38±1 %) and a total N:P of 8.3±0.4. The majority of trees in Horizontes are deciduous and arbuscular mycorrhizal (Hayward and Horton, 2014), and the distribution of plant functional groups is analogous to nearby regenerating forests (Powers and Tiffin, 2010). Although it is a secondary forest, this region has notable biodiversity (60 tree species from 23 families within a 1 ha area in the experimental plots), including many nitrogen-fixing legumes (average of 17 ± 4 % stand basal area and range of 1 %–53 %).
The experiment consists of 16 25 m × 25 m plots, each containing approximately 70 stems ≥5 cm diameter at breast height (DBH). Plots were randomly assigned to one of four treatments: control, nitrogen addition (150 kg N ha−1 yr−1, urea solution), phosphorus addition (45 kg P ha−1 yr−1, phosphoric acid solution), or addition of N and P together. The fertilization was conducted only during the wet season. Nutrient addition started in June 2015 and was carried out by spraying the solutions three times per year (early, middle, and late wet season). Leaf production was measured monthly using litter traps and summed up from April to March of the following year. Wood production was measured using tree diameter measurements and allometric equations. Fine root production was measured using root in-growth cores in June, August, and November of each year. Root mycorrhizal colonization was quantified subsequently. Other measurements included soil NO3 and NH4, soil PO4, and tree mortality.
Results from this study, covering the years 2015–2017, have been reported in Waring et al. (2019a). This period experienced large interannual variability in rainfall, with rainfall being 628 mm in 2015, 1754 mm in 2016, and 2050 mm in 2017. In brief, leaf production did not vary by treatment or by year. Wood production varied by year but not by treatment. Fine root production varied by both treatment and year and was about 40 % larger in the +P and +NP treatments than in the control or +N treatment. Despite the large variation in rainfall, the ratio of fine root production to leaf production did not exhibit a clear correlation with rainfall. Averaged over all 16 plots, this ratio was 0.37 in 2015, 0.44 in 2016, and 0.24 in 2017. When broken down by treatment, this production ratio was always intermediate in 2015, greatest in 2016, and smallest in 2017. Root colonization by mycorrhizal fungi did not vary among nutrient treatments or across years.
2.2 Model description
Our model simulations were conducted using the ED2 model (Medvigy et al., 2009, 2019; Longo et al., 2019a). ED2 is a vegetation demographic model that simulates the dynamics of plant cohorts (Fisher et al., 2018). The model has recently been validated in both tropical dry forests (Xu et al., 2016; Medvigy et al., 2019; Schwartz et al., 2022) and tropical moist forests (Levy-Varon et al., 2019; Longo et al., 2019b; Xu et al., 2021). The source code is publicly available on GitHub (https://github.com/EDmodel/ED2, last access: 1 December 2022).
Each cohort is specified by its plant functional type (PFT), physical dimensions (height and DBH), and stem number density. The model included eight PFTs. Species are assigned to a PFT on the basis of three traits: wood density, specific leaf area, and legume or non-legume status. The binning of species into PFTs is discussed in Xu et al. (2016) and Medvigy et al. (2019). Each cohort's PFT designation is constant, but physical dimensions and stem number density vary over time. The three fundamental demographic processes simulated by the model are growth (increases in physical dimensions), mortality (decreases in stem density), and recruitment (creation of new cohorts). Cohort biomass compartments include leaf, wood, fine root, and non-structural biomass. New photosynthate gets added to the non-structural pool, and respiratory costs are also debited from this pool. The non-structural pools do not have any fixed stoichiometry. Growth occurs when C, N, and P move from their respective non-structural pools to the leaf, wood, and fine root pools; all of these pools have fixed C:N and C:P ratios. Wood biomass and maximum leaf biomass are related via an allometric relationship (Longo et al., 2019a). The target leaf biomass is the product of the maximum leaf biomass and a phenology scaling factor, and drought deciduousness is triggered when leaf water potentials are persistently below the turgor loss point (Xu et al., 2016). In previously published versions of the model, the target fine root biomass was assumed to be directly proportional to the target leaf biomass (Longo et al., 2019a), but here we explore various alternatives, as described below (Sect. 2.3).
Simulated growth can be constrained by C, N, or P (Medvigy et al., 2019). When C, N, and P are initially acquired, they accumulate in their respective non-structural pool. Allocation to leaves and fine roots is done simultaneously on a daily time step. This allocation consists of the transfer of C, N, and P from the non-structural pools to the leaf and fine root biomass pools until either (i) one of the non-structural pools is exhausted or (ii) the leaf and fine root biomass pools reach their target values. Allocation to wood and reproduction is done on a monthly time step. Whatever remains in the non-structural pools at the end of each month is used to simultaneously generate new wood and reproductive tissues; this process is only limited by the sizes of the non-structural pools (Medvigy et al., 2019; Longo et al., 2019a). Some PFTs are capable of symbiotic N fixation (Levy-Varon et al., 2019; Medvigy et al., 2019). The model's approach to soil biogeochemistry explicitly includes the dynamics of physically defined soil organic matter pools in microbial-enzyme-mediated decomposition based on the Michaelis–Menten kinetics (Wang et al., 2013). Nutrient competition between plant and microbes (for N) and between plants, microbes, and mineral surfaces (for P) is calculated using an equilibrium chemistry approximation (Zhu et al., 2016).
The model implements mortality by reducing cohort stem density (Longo et al., 2019a). Each PFT has a baseline mortality rate that is applied to all corresponding cohorts. In addition, cohort-level mortality rates increase rapidly if respiration persistently exceeds photosynthesis. Finally, recruitment consists of the creation of a new cohort at minimum height (typically set to 1–2 m). Recruitment is driven both by external seed rain and the reproduction investment of local cohorts.
2.3 Model modifications
We defined a parameter, r2l, which specified the target ratio of fine root biomass to leaf biomass. In previously published versions of the model, r2l is a constant. Because several fertilization studies found that relative fine root production increased with soil P (Waring et al., 2019a; Cunha et al., 2022), we modified the code so that r2l would be related to soil-soluble P (Psol, unit: gP kg−1 soil) following
where b could be positive, negative, or zero. Thus, this formulation is flexible enough to also accommodate the situation in which relative fine root production decreases with soil-soluble P (Li et al., 2016). It can also include the previously used ED2 parameterization for tropical dry forests which had a=0.3 (unit: (kgC fine root)(kgC leaf)) and b=0 (unit: (kgC fine root)(kgC leaf) × (kg soil)(gP)) (Xu et al., 2016; Medvigy et al., 2019; Schwartz et al., 2022). We did not consider varying r2l with N or with soil water because the observed leaf to fine root production ratio was insensitive to N fertilization and uncorrelated with precipitation in Waring et al. (2019a).
2.4 Simulations
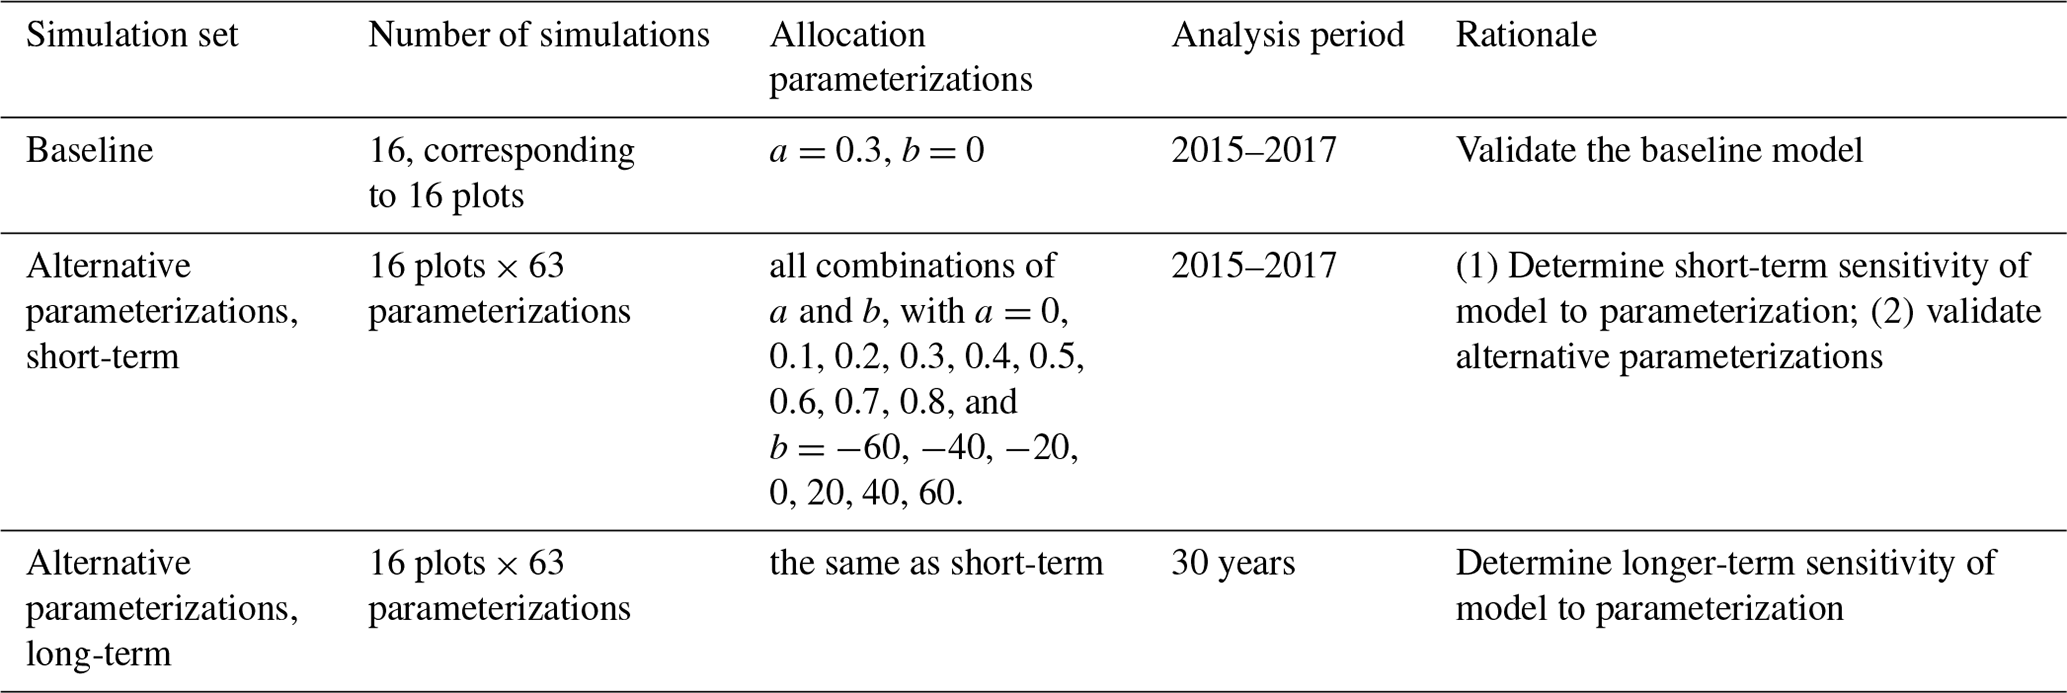
The purposes of our simulations were model validation and sensitivity analysis (Table 1). Validation required that we focus on the 3 years (2015–2017) of previously published observations (Waring et al., 2019a). We validated the previously published baseline (Medvigy et al., 2019) model parameterization, as well as alternative parameterizations. We carried out sensitivity analysis on both 3-year and 30-year timescales. The 3-year timescale was chosen to correspond to the field experiment. The 30-year timescale was chosen to see how model sensitivity varied over the course of forest development. A 30-year simulation would approximately double the age of the forests and would be 1 order of magnitude longer than the existing experiment.
2.4.1 Baseline simulations and validation
We simulated each of the 16 experimental plots using the model's baseline parameterization. Each plot received nutrient inputs in accord with what was done during the fertilization experiment; i.e., there were four control plots, four +N plots, four +P plots, and four +NP plots. We also applied a natural deposition rate of 0.13 kgN ha−1 yr−1 and 0.019 kgP ha−1 yr−1 in all 16 plots. In each plot, the vegetation cohorts were initialized with in situ measurement of DBH and height data for each individual tree. Soil properties of each site were initialized with in situ soil state observations following the procedure of Medvigy et al. (2019). All the simulations were driven by meteorological variables from the ERA5-Land hourly reanalysis datasets (Copernicus Climate Change Service, 2022; Muñoz Sabater, 2019). Simulations ran from January 2013 until April 2018, and we analyzed the same time period as the field measurements, 2015–2017. Since the actual forest is not in equilibrium and we used the observed stand structure and composition as well as observed soil nutrient status to initialize the model, only soil water needed to be initialized by spin-up. To this end, we discarded the first 2 years (Xu et al., 2016).
Simulations and observations were compared both qualitatively and quantitatively. For qualitative validation, we emphasized variation in production across treatments and years. For quantitative validation, we were mainly concerned with variation across treatments, so we first averaged all production measures over the 3 years of measurements. We then used Student's t tests to assess whether the simulations and the observations had the same means, and we applied p<0.05 as the threshold for statistical significance. Prior to applying t tests, we confirmed normality with the Shapiro–Wilk test (p<0.05). We also assessed equality of variances with Welch's test.
2.4.2 Alternative parameterizations, validation, and sensitivity analysis
We analyzed the sensitivity of production (leaf, wood, and fine root) to allocation parameterization. In Eq. (1), larger absolute values of b indicate greater sensitivity of allocation to Psol. For a, we considered nine values: 0, 0.1, 0.2, 0.3, 0.4, 0.5, 0.6, 0.7, and 0.8 (kgC fine root) (kgC leaf). For b, we considered seven values: −60, −40, −20, 0, 20, 40, and 60 (kgC fine root)(kgC leaf) × (kg soil)(gP). Altogether, we tested a total of 63 a–b pairs (Table 1). Given a and b, as well as the dynamically varying Psol, the model computes r2l using Eq. (1). To avoid having negative or otherwise unrealistic r2l, we also required it to fall between 0.2 and 1.8.
Parameter sensitivity analysis was carried out on 3-year and 30-year timescales. For the 3-year simulations, we averaged across years but considered each treatment separately. For each treatment, we calculated the coefficients of variation of leaf, wood, and fine root production with respect to the 63 parameter sets. For the 30-year simulations, we had to prescribe meteorological forcing and fertilization rates for years beyond 2018. For these years, the meteorological forcing was obtained by recycling the 2009–2018 observations. N and P fertilization rates were maintained as they were in all other simulations; thus, these simulations constituted virtual 30-year fertilization experiments.
3.1 Baseline simulation validation
We first qualitatively evaluated the baseline model simulation (a=0.3, b=0). Variation across treatments and years is shown in Fig. 1. The magnitude of leaf production was similar in simulations and observations, though the simulations had a larger range of values (Fig. 1a). The simulations and observations agreed that wood production was smallest in the strong ENSO year of 2015, but they disagreed as to whether it was largest in 2016 or 2017 (Fig. 1b). Overall, the model somewhat overestimated wood production. Fine root production had a much larger bias than leaf or wood production, especially in 2015–2016 (Fig. 1c). The baseline simulations did not appear to capture the observed treatment effect (higher fine root production in +P and +NP than in the control and +N).
We also compared other simulated values to observations. The simulated stem mortality was close to observations in each of the 3 years, including 2015, when stem mortality was relatively large (Table 2). Over the 3 years, simulated stem mortality in +NP plots was about 1.5 times larger than the other treatments, consistent with observations. Simulated (and temporally sparse) observations of plant available nutrients are shown in Fig. 2. The observed soluble P, NH4, and NO3 fell within the range of what was simulated. Both the simulations and the observations show a strong effect of P fertilization on soluble P. In the simulations, most of the peaks associated with the pulse inputs of P are clearly visible. By contrast, similar peaks are much less apparent in NH4 and NO3.
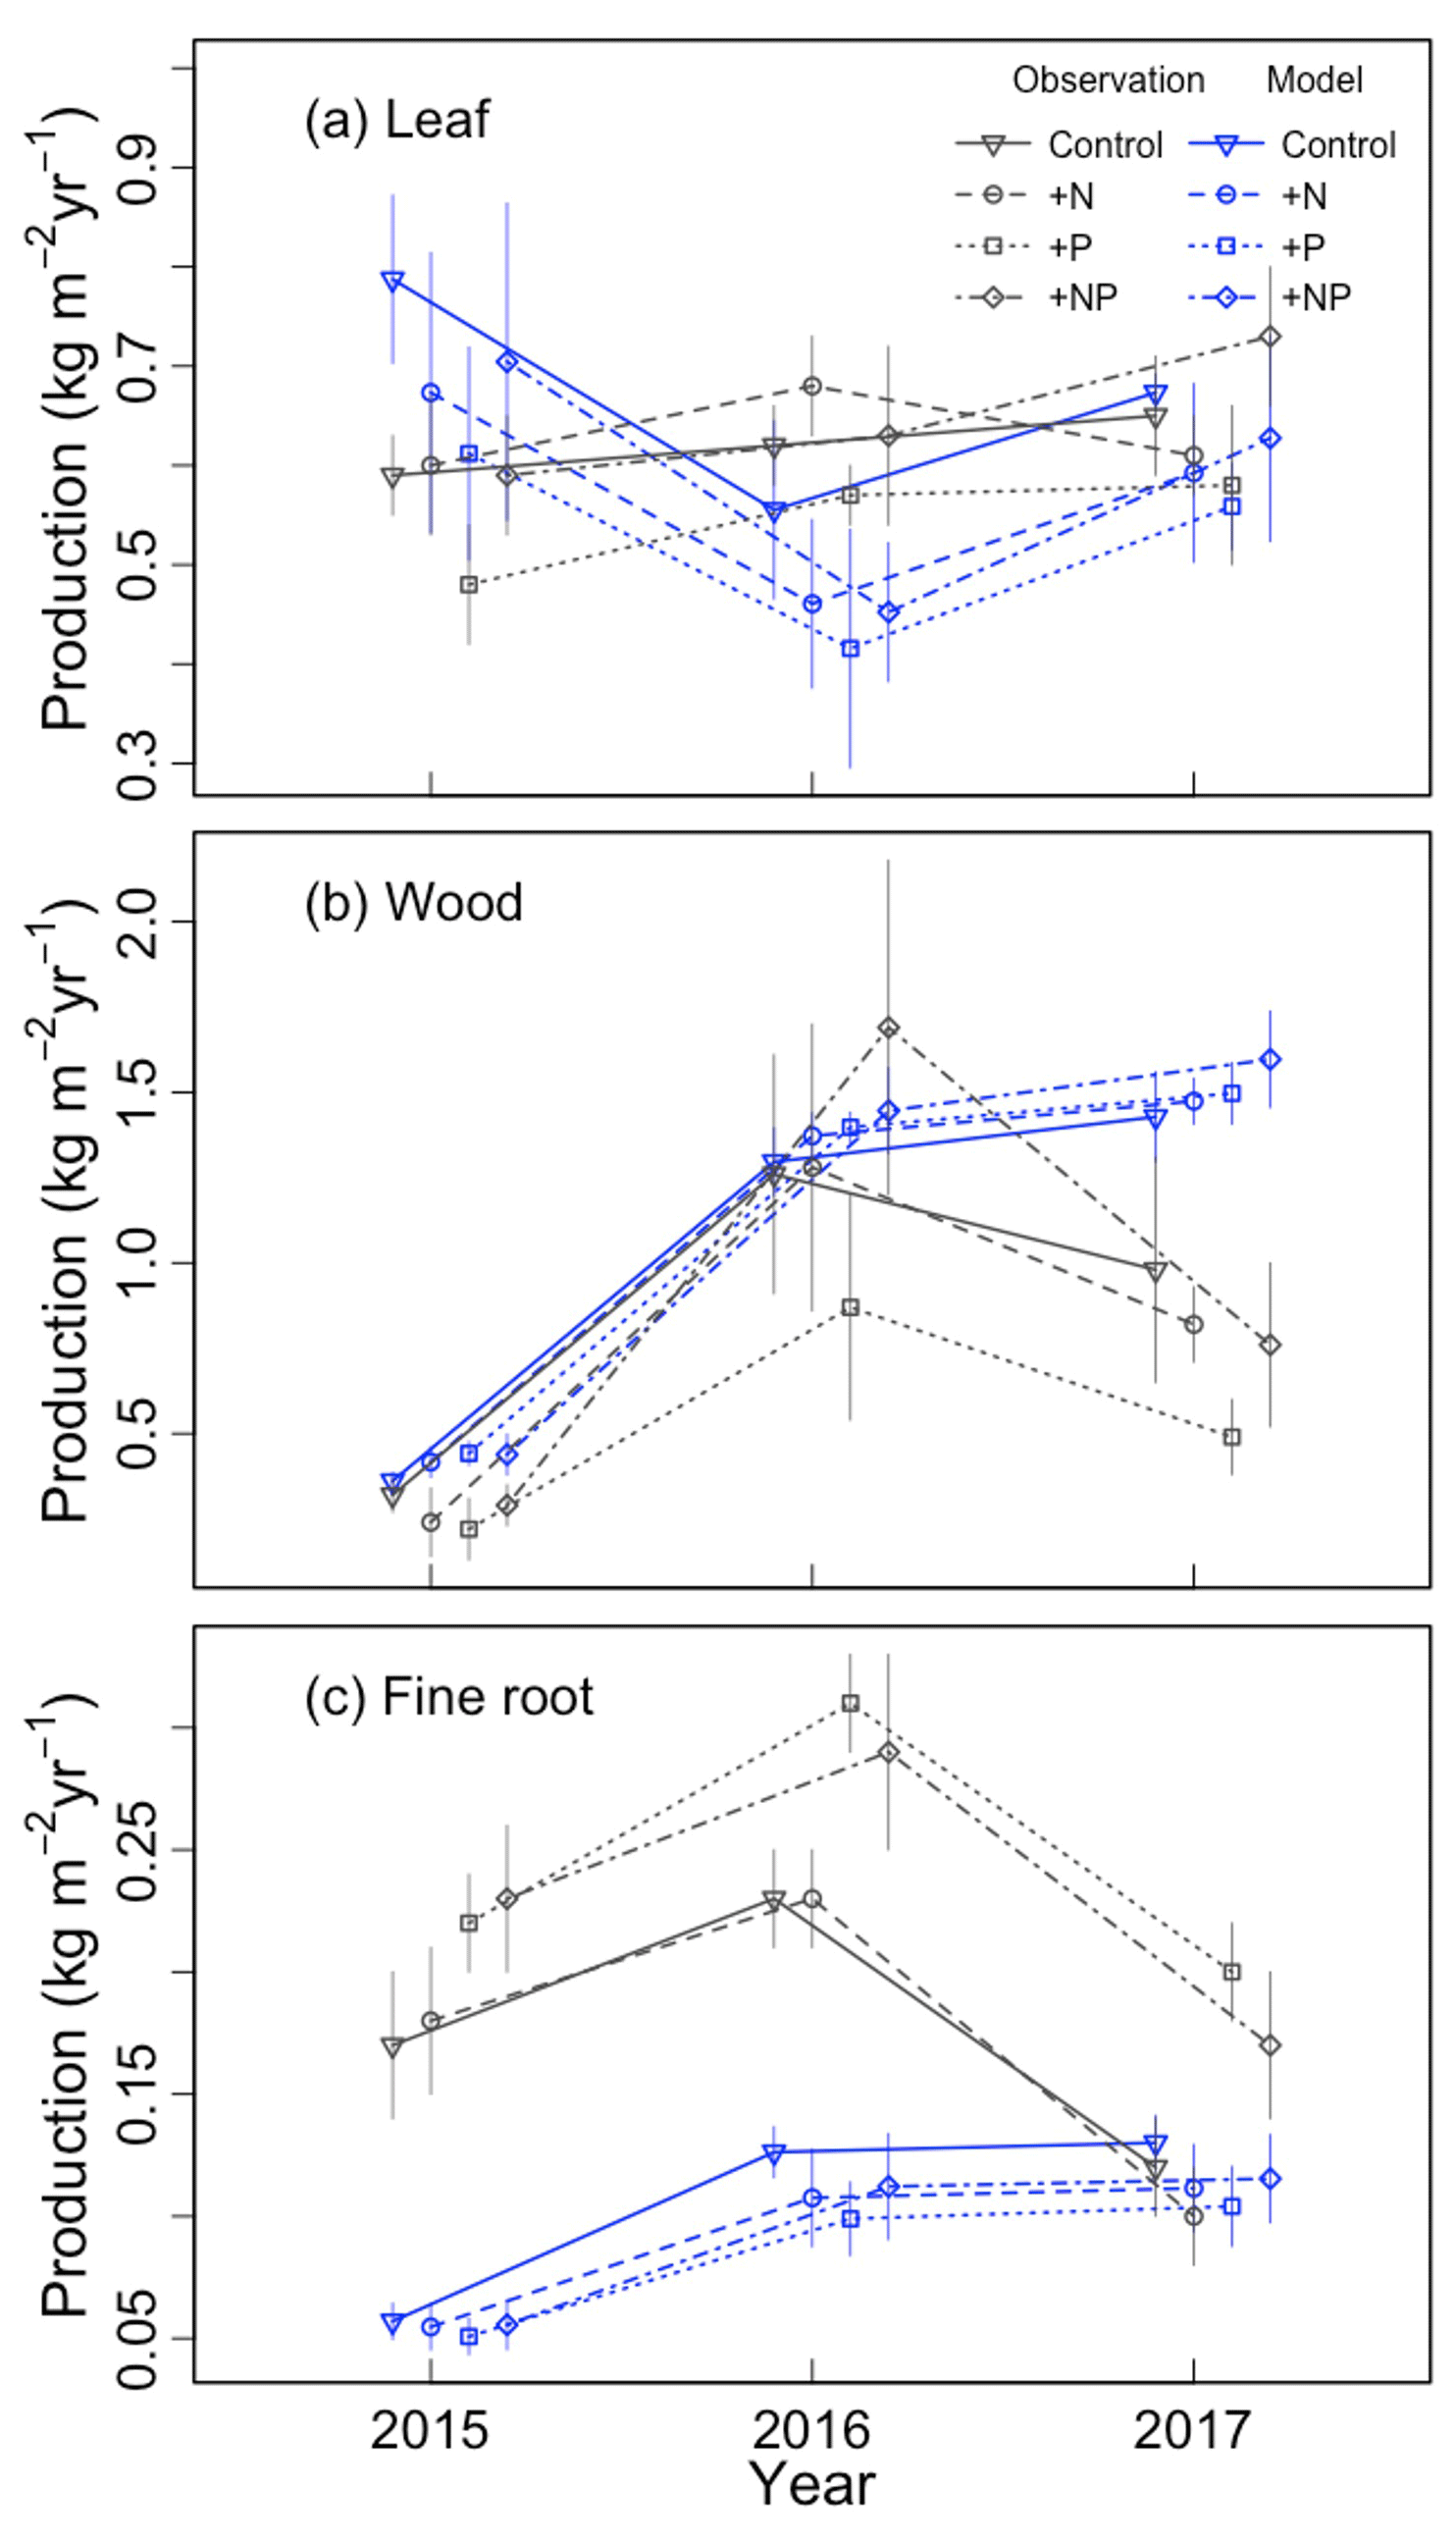
Figure 1Comparison of simulated and observed (a) leaf, (b) wood, and (c) fine root production for each year–treatment combination.
Table 2Comparison of simulated and observed annual stem mortality. The notation “+NP/others” indicates the ratio of the result from the +NP treatments to the average result from the control, +N, and +P treatments.
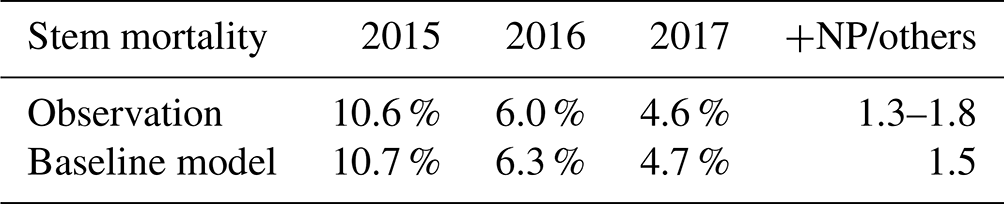
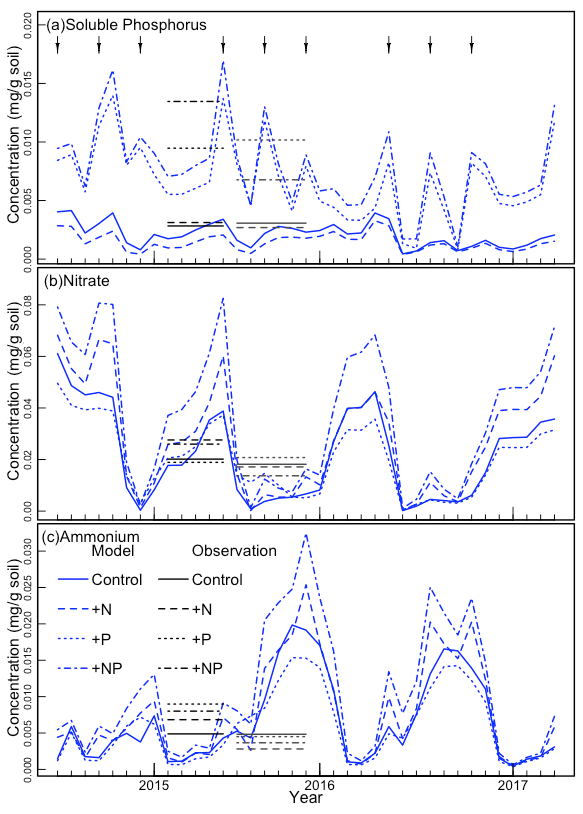
Figure 2The continuous curves show the model-simulated (a) soil-soluble phosphorus, (b) nitrate, and (c) ammonium concentrations. The black horizontal line segments indicate the observed averages from the wet and dry seasons in 2016; observations were not available for other periods. The arrows at the top indicate the approximate times of fertilization.
3.2 Alternative parameterizations: 3-year sensitivity analysis
We then analyzed the sensitivity of the simulations to parameterization (Fig. 3). Different treatments were analyzed separately, but leaf, wood, and fine root production had similar variation. In the control and +N treatments, leaf, wood, and fine root production was relatively insensitive to parameterization. By contrast, in the +P and +NP treatments, the production of all components was more sensitive to parameterization. Fine root production had a larger coefficient of variation than wood production, and wood production had a larger coefficient of variation than leaf production.
Given the temporal variation in soluble P (Fig. 2a), we investigated the temporal variation in r2l. High-frequency oscillations in this parameter could indicate inefficient allocation and the need for some smoothing. We found that the variability of r2l depended on treatment and parameterization (Fig. 4). Without P fertilization, there is some seasonal variability in r2l, but it is relatively small. The variability is largest under P fertilization with parameterizations having b>0, where r2l ranges mostly from 0.4 to 1.0. Despite this variability, the b>0 parameterizations consistently lead to larger r2l under P fertilization than the b=0 or b<0 parameterizations.
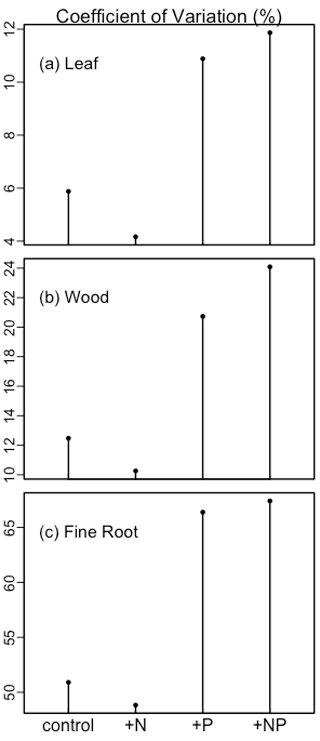
Figure 3The coefficient of variation of simulated leaf, wood, and fine root biomass production among treatments under different parameterizations.
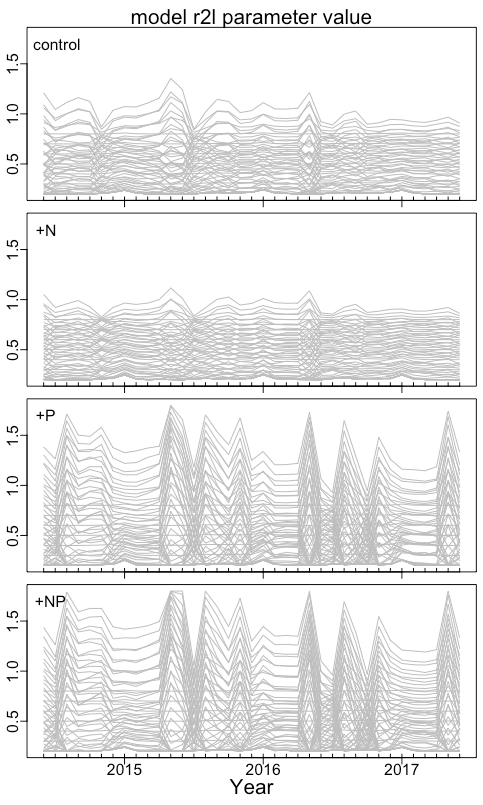
Figure 4Time series of the r2l parameter for each of the 63 parameterizations. Results are shown separately for the control plots (labeled “control”), the N-fertilized plots (labeled +N), the P-fertilized plots (labeled +P), and plots fertilized with both N and P (labeled +NP).
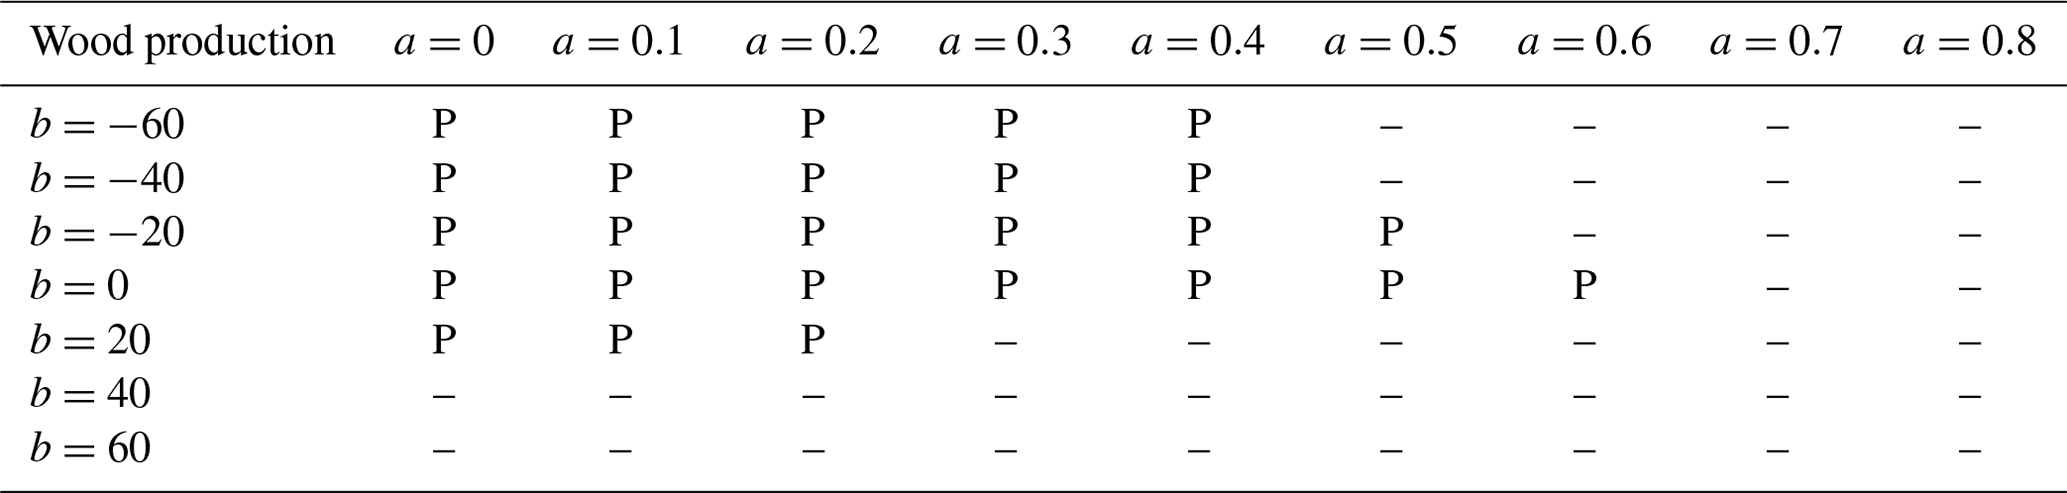
3.3 Alternative parameterizations: 3-year model validation
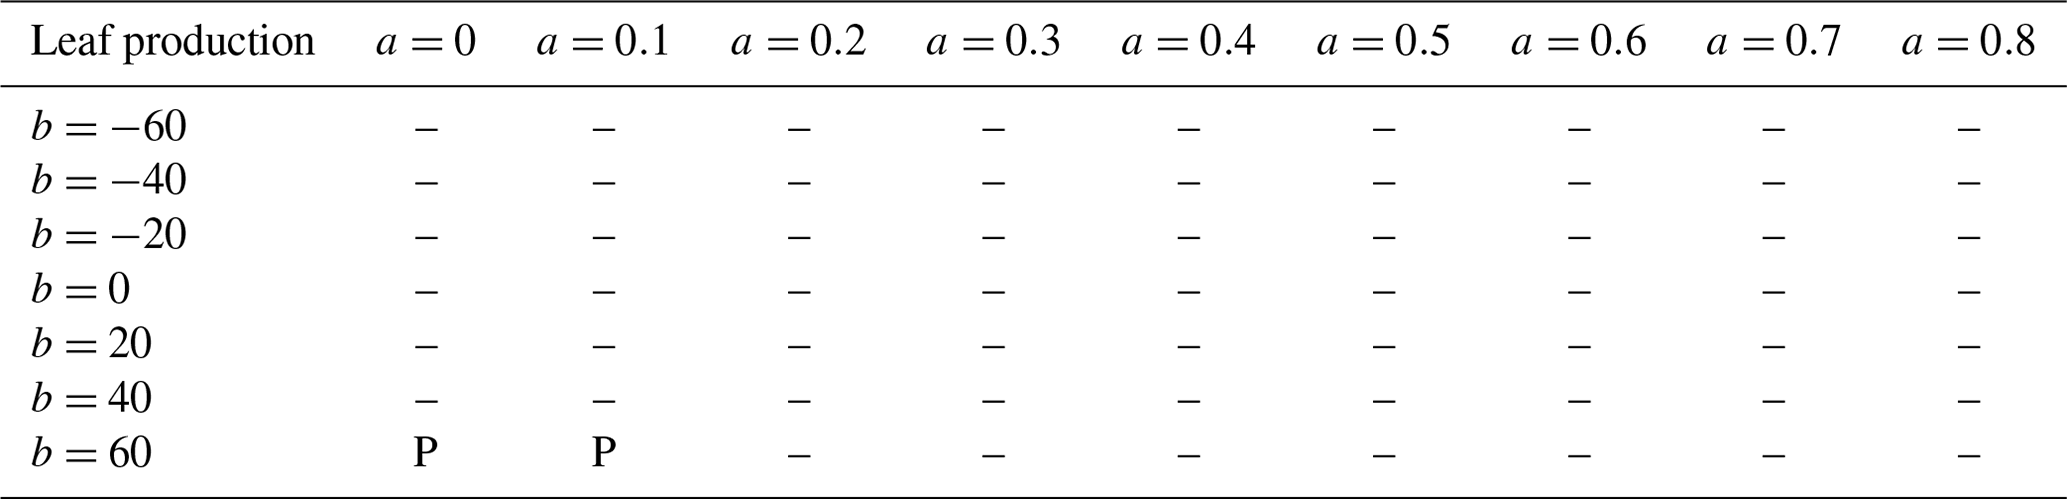
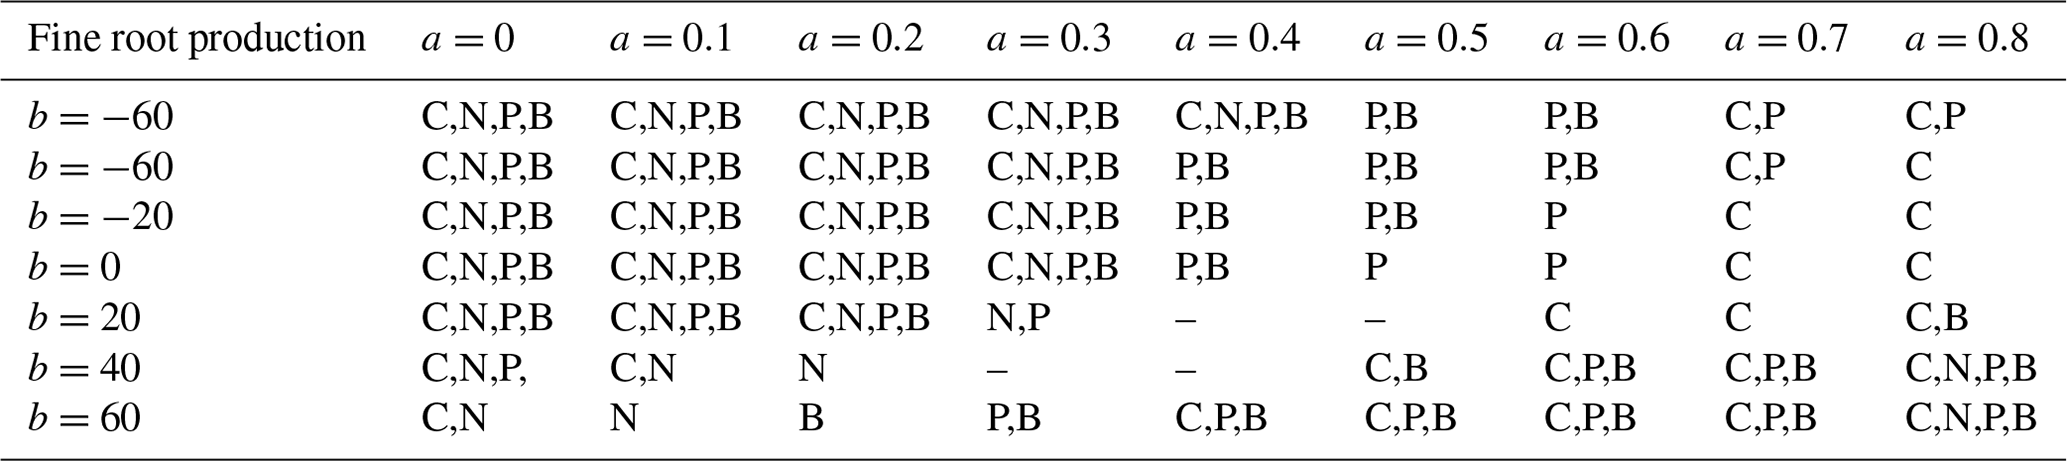
We carried out t tests to determine whether there were significant differences between simulations and observations. For leaf production (Table 3), almost all model parameterizations were consistent with observations. For wood production (Table 4), many parameterizations, especially with b<0, b=0, or relatively small a, did not predict wood production in the +P treatment. Parameterizations with b>0 were mostly successful in all treatments. For fine root production (Table 5), only four parameterizations, all with b=20 or b=40, successfully predicted the observations in all treatments. These four parameterizations also successfully predicted leaf and wood production in all treatments. A drawback of this approach is the small sample size: each t test was done with only four replicates. As an additional test, we tried aggregating control and +N, then comparing that to the aggregation of +P and +NP. This procedure doubled the number of replicates and gave very similar results (Supplement Tables S1–S3).
Table 3Validation of simulated leaf production for 63 parameter settings. Validation was done separately for each treatment. An entry of “C” indicates statistically significant (p <0.05) differences in the means of the control plots, “N” means the +N plots were significantly different, “P” means the +P plots were significantly different, and “B” indicates that the +NP plots were significantly different. The notation “-” indicates that no significant differences were found for any treatment.
3.4 Alternative parameterizations: 30-year sensitivity analysis
Allocation parameters had a large impact on simulated aboveground biomass (AGB) accumulation, as seen in our 30-year simulations (Fig. 5a). On a 30-year timescale, the largest AGB occurred when both a and b were relatively small. These parameterizations also led to low fine root biomass (Fig. 5b), high leaf area index (Fig. 5c), and a low ratio of fine root biomass to leaf biomass (Fig. 5d). The overall pattern of AGB was closely related to leaf area index, suggesting that capture of aboveground resources ultimately limited production on the 30-year timescale.
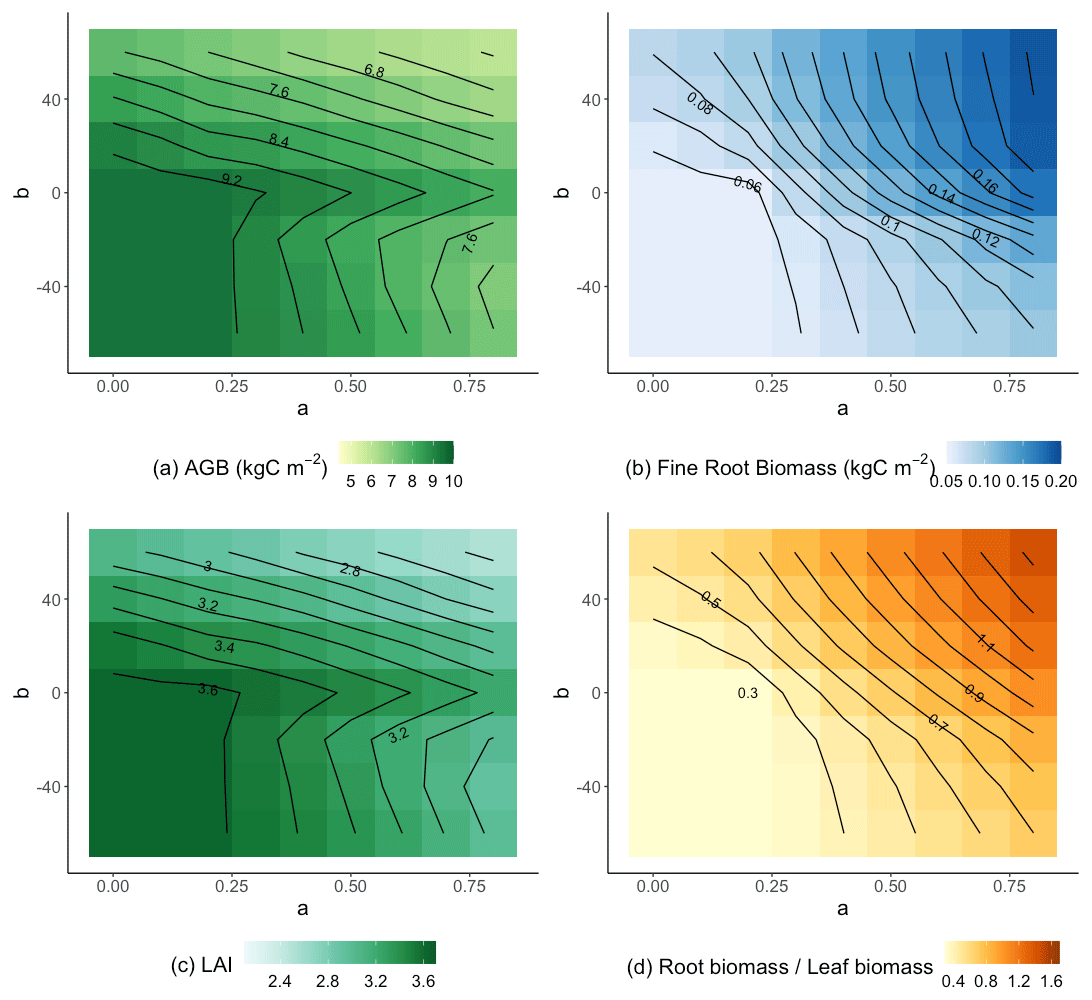
Figure 5Parameter sensitivity of AGB (a), fine root biomass (b), leaf area index (c), and the ratio of fine root to leaf biomass (d). Results are averaged over the 30 years of simulation and across treatments.
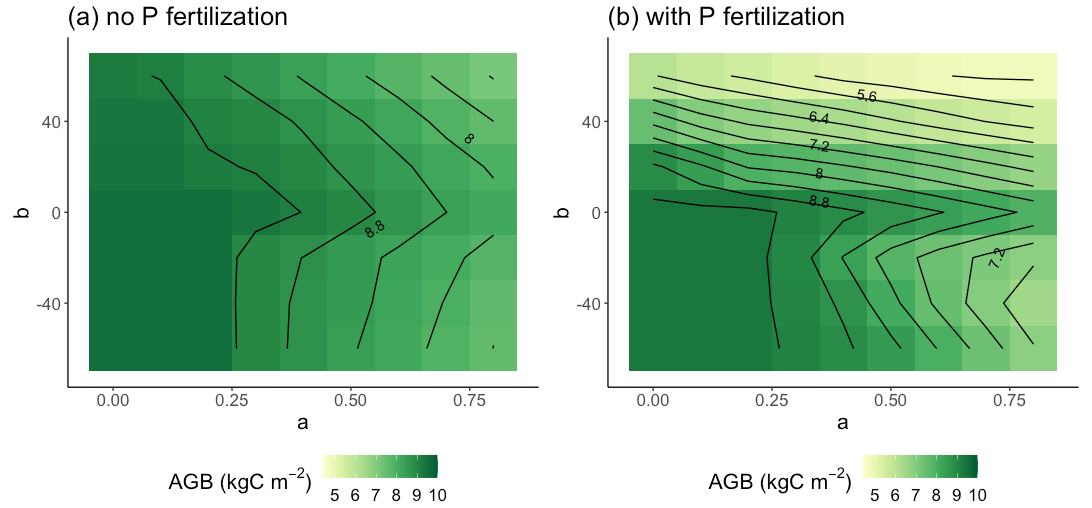
Figure 6Parameter sensitivity of AGB in the control and +N plots (a) and in the +N and +NP plots (b). Results are averaged over the 30 years of simulation.
The sensitivity of AGB to a and b depended on the sign of b. When b≥0, the AGB contours (Fig. 5a) had a negative slope. We can understand this result in light of Eq. (1) and assuming that AGB was a continuous function of r2l: when a was increased, decreasing b could maintain same value of r2l and thus AGB. Although the same effect would be expected for b<0, there are two further complications. First, there is a minimum imposed value of r2l of 0.2. The minimum is never reached when b≥0 because r2l was an increasing function of Psol but was often reached when b<0. In fact, all the simulations with small a and negative b were almost identical because r2l was almost always set to its minimum value. To the extent that r2l is equal to its minimum value, the contours when b<0 would be vertical lines. This constraint on r2l explains why the contours when b<0 are more vertical than the contours when b>0. A second effect likely contributes to the bend in the contours between b=0 and . We saw that Psol was reduced at the beginning of the growing season (Fig. 2), likely because trees required relatively large amounts of phosphorus to build new leaves. When b<0, this reduction in Psol would lead to an increase in r2l. But this relative increase in fine roots would not lead to enhanced productivity because the growing season is wet and has ample moisture supply, and the construction of wood requires relatively little nutrient input (compared to leaves). These factors collectively result in the bend in the contours immediately below b=0.
These effects were also apparent when we separated the control and +N plots from the +P and +NP plots. For the control and +N plots (Fig. 6a), the b≥0 AGB contours were more vertical than in the +P and +NP plots (Fig. 6b) or the all-plot average (Fig. 5a). This result occurred because the average Psol (and thus r2l) values were smaller in the control and +N plots than in the all-plot average or in the +P and +NP plots. As in Fig. 5a, we also see in Fig. 6a–b that the AGB contours have a more vertical orientation when b<0 than when b≥0. The largest AGB values generally occurred when a was small in the control and +N plots (Fig. 6a) and when both a and b were small in the +P and +NP plots (Fig. 6b). The smallest values of AGB occurred when both a and b were large in the +P and +NP plots (Fig. 6b). This pattern of AGB probably does not result from variation in P limitation. We computed the ratio of non-structural C to the non-structural P (C:Pns) in both the control and +N plots (Fig. 7a) and in the +P and +NP plots (Fig. 7b). We interpreted larger values of C:Pns to indicate greater P limitation. However, the largest values of C:Pns occurred when a was relatively small (Fig. 7), similar to where AGB attained its largest values (Fig. 6). The smallest values of C:Pns occurred when both a and b were relatively large (Fig. 7), where AGB attained its smallest values (Fig. 6).
Soil nutrients can regulate plant biomass production in terrestrial ecosystems (LeBauer and Treseder, 2008; Hou et al., 2020). The control that nutrients exert on carbon partitioning among different types of plant tissues is drawing increasing attention because it can strongly affect long-term ecosystem carbon accumulation and loss (Gessler et al., 2017). This study focused on the effect of soil-soluble P on carbon partitioning. We evaluated different parameterizations within the ED2 model and compared model results to observed carbon partitioning at a fertilization experiment site in Costa Rican tropical dry forest (Waring et al., 2019a). We did not set out to identify a single “best” parameter set but were rather interested in determining the range of parameter values for which the simulation was consistent with observations. The results presented here demonstrate the importance of allocation parameterization for biomass production. In particular, we found that the model simulated the most realistic overall partitioning of biomass production when relative allocation to fine roots was positively correlated with soil-soluble P, at least on a 3-year timescale. Analysis of multi-decadal simulations suggests that parameterizations having relative allocation to fine roots independent of soil P (thereafter “const” parameterizations), positive correlation with soil P (thereafter “pos” parameterizations), or negative correlation with soil P (thereafter “neg” parameterizations) can all lead to comparable aboveground carbon accumulation, at least in unfertilized scenarios. However, especially in scenarios with P fertilization, multi-decadal simulation results also raise issues (for example, over-allocation to fine roots) that could not have easily been foreseen by merely looking at model–data comparisons over 3 years.
4.1 Model validation
ED2 has long included N dynamics as an option (Moorcroft et al., 2001), but published simulations rarely had this option activated. Recently, Medvigy et al. (2019) introduced a new representation of N and P dynamics into ED2 based on the microbial model of Wang et al. (2013) and the nutrient competition model of Zhu et al. (2016). In the Medvigy et al. (2019) parameterization, relative allocation to fine roots was unaffected by nutrients (i.e., the model employed a “const” parameterization). Here, we found that this version of the model simulated reasonable leaf and wood biomass production, especially when averaged over a 3-year timeframe (Fig. 1). These successful predictions of leaf and wood production are consistent with previous ED2 simulations of tropical forests (Xu et al., 2016, 2021; Levy-Varon et al., 2019; Longo et al., 2019a, b). An important feature of our analysis is that we additionally validated the model's simulation of fine root production, which had not been done previously. We found that the baseline parameterization resulted in an underestimate of fine root production and that “const” parameterizations in general could not simulate the observed stimulation of fine root production by P fertilization (Fig. 1c). At this point, we cannot say whether ED2 would generate similar biases in fine root production at other tropical forest sites. More observations of biomass partitioning (including fine root production) under P fertilization would be helpful for testing the model, and such observations are becoming increasingly available (Waring et al., 2019a; Lugli et al., 2021; Cunha et al., 2022). Thus, model validation at additional sites, coupled with validation along soil fertility gradients, would be useful ways of further increasing our understanding.
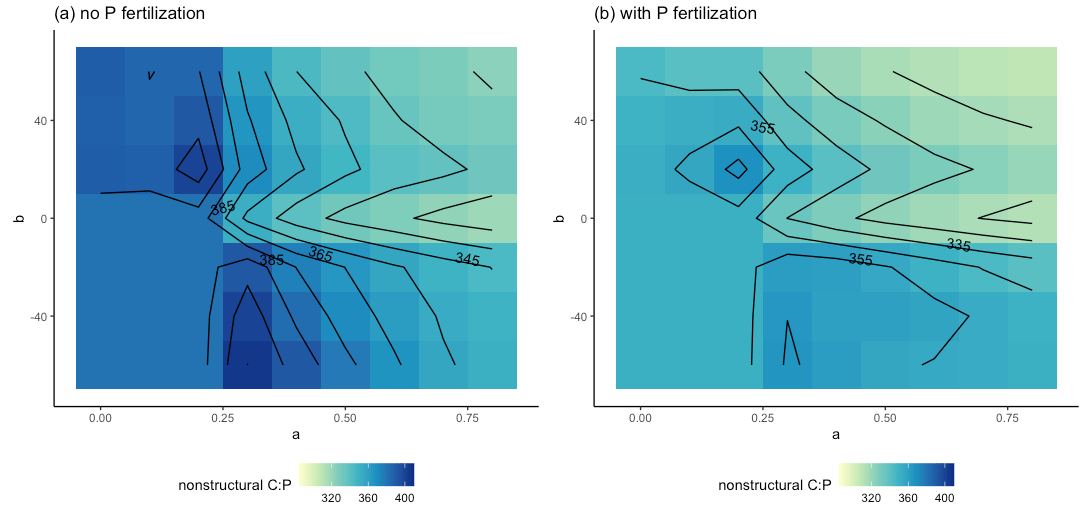
Figure 7Parameter sensitivity of the ratio of non-structural C to non-structural P in the control and +N plots (a) and in the +N and +NP plots (b). Results are averaged over the 30 years of simulation.
Besides our baseline parameterization, we evaluated other “const” parameterizations as well as “pos” and “neg” parameterizations. Most parameterizations simulated leaf production consistent with observations and about half simulated wood production consistent with observations (Tables 3, 4). However, most parameterizations failed to simulate root production that was consistent with the observations (Table 5). As a result, only 4 of the 63 parameterizations, all “pos” parameterizations, were able to simultaneously simulate leaf, wood, and fine production consistent with the observations. For future work, it will be interesting to see how these “pos” parameterizations scale in space and time. For example, they can be applied to simulations of the Amazon and compared to the results of Cunha et al. (2022). Also, the fertilization experiment first reported by Waring et al. (2019a) is ongoing and the data subsequent to 2017 are currently being analyzed. Comparison of this longer-term dataset to “pos” scheme simulations will be informative. Because our 30-year simulations with “pos” parameterizations and P fertilization yielded much less AGB than simulations with “const” parameterizations (Fig. 6b), there is a possibility that some acclimation of the longer-term r2l response to increased soil P might avoid over-allocation to fine roots. Modeling of such acclimation remains for future work. Analysis of fine root production from sites arrayed across a strong natural fertility gradient could also help test this point because individuals growing on naturally high-P sites should have had sufficient time to acclimate to their local environment if acclimation did exist.
But what might explain even the short-term success of the “pos” parameterizations? Considering multiple limitation theory, we might have expected that when acquisition of P is the most limiting factor for plants, any increases in soil P would have resulted in decreased allocation to fine roots, contrary to the “pos” parameterizations. Here we offer several potential explanations. First, it could be that soil P supply, not fine root biomass, limited P uptake in the unfertilized plots. In an extreme case, in the complete absence of soil P, P acquisition would be zero regardless of fine root biomass. The optimal amount of fine root biomass (with respect to P acquisition) would be zero in order to avoid construction and maintenance costs. As soil P increases above zero, the optimal amount of fine root biomass would also increase. An analogy would be “rain roots” that are produced by some species, which occur as lateral branches on established roots after rain events and die during droughts (Nobel et al., 1990). Second, the deciduousness of this forest may be significant. At the beginning of the rainy seasons, trees experience a large P demand to build their P-rich leaves. It may be adaptive for plants to construct these leaves as quickly as possible, and having large fine root production may facilitate that (Jackson et al., 1990; Hodge, 2004). Finally, plants may over-allocate to fine roots in order to maximize their ability to compete with neighbors (Gersani et al., 2001; Zea-Cabrera et al., 2006; Farrior et al., 2013).
Other processes, not simulated here, may also be relevant to understanding and simulating the observed response of production to fertilization. These include phosphatase synthesis (Liu et al., 2015; Kong et al., 2016; Lugli et al., 2020) and symbioses with arbuscular mycorrhizae (Hodge, 2004; Comas et al., 2014; Eissenstat et al., 2015; Liu et al., 2015; Kong et al., 2016; Ma et al., 2018). Root phosphatases hydrolyze organic P-containing compounds and releasing inorganic P that is absorbable by roots, while mycorrhizal associations can be even more effective by enlarging the root absorbing surface per unit cost. Both mechanisms provide additional P sources. Plants adaptively adjust their traits or metabolic processes in terms of effective P acquisition (Raven et al., 2018; Han et al., 2021; Aoyagi et al., 2022), and diverse P acquisition strategies are being evaluated from observations (Reichert et al., 2022). However, estimates of plant allocation of carbohydrates to mycorrhizae are rare and difficult to obtain and were not made by Waring et al. (2019a); meanwhile, mycorrhizae symbioses were not explicitly represented in the model. It is possible that, in the Waring et al. (2019a) experiment, P fertilization led to reduced allocation to mycorrhizae and increases in both the number and average diameter of roots, while reducing overall belowground (mycorrhizal plus roots) allocation, despite there being no measured change in the percentage of colonized root length.
Because this study is focused largely on model validation and sensitivity, we took the observational data at face value. However, the observational data can also have biases that would impact our interpretations. In particular, fine root production, stock, and loss are difficult to measure accurately in forests (Clark et al., 2001), largely due to highly uncertain spatial and temporal variability in fine root biomass (Finér et al., 2011) and rooting depth (Paz et al., 2015). In tropical forests, maximum root length is often longer than the depth of in-growth cores in Waring et al. (2019a) (Canadell et al., 1996), implying that field measurements underestimate root production. Further, addition of P to the soil surface could have caused roots to proliferate at the surface at the expense of deeper roots. Further field experiments are necessary to understand potential changes in root vertical distributions.
4.2 3-year sensitivity analysis
We focused on the sensitivity of several output variables (leaf, wood, and fine root production) simultaneously against the two input parameters that determined the fine root to leaf ratio. By contrast, other studies using ED2 have focused on one output variable (LeBauer et al., 2013; Levy-Varon et al., 2019; Medvigy et al., 2019). Our sensitivity analysis of leaf, wood, fine root, and total production showed distinct responses for the different production measures (Fig. 3). Of these, fine root production had the largest CV because its average magnitude was smallest. This suggests that just because one measure of productivity is sensitive to a particular parameter does not mean that the model is generally sensitive to that parameter. Our results also varied considerably depending on whether P fertilization was applied, underscoring the importance of environmental context for sensitivity analysis. Furthermore, we note that the sensitivity on one timescale (3 years) can be different from the sensitivity on another timescale (30 years), as discussed in the next section.
4.3 30-year sensitivity analysis
In our 30-year simulations, we found that the effects of fine root allocation parameterization on AGB differed across fertilization treatment. In the control and +N plots, the well-validated “pos” schemes led to 30-year AGB that was comparable to AGB from the other parameterizations. This result is satisfying because it suggests that what is validated in the short term is adaptive in the long term. But in the +P and +NP plots, the well-validated “pos” schemes led to 30-year AGB that was markedly less than some other parameterizations, including the baseline. Evidently, these schemes over-allocated to fine roots on this timescale. It is possible that the low biomass accumulation in these schemes is related to other model parameters. For example, the maximum non-structural P pool size was set equal to the amount of P required to reconstruct all leaves and fine roots. This maximum pool size would limit the advantage of having more roots to acquire more P under high P conditions.
Based on our sensitivity analysis, we are able to offer new hypotheses that may be testable with longer-term fertilization experiments. First, it may be that the “pos” simulations, which were validated in the short term, may also be valid on longer timescales. P fertilization over 30 years would expose trees to soil P concentrations that are well outside the natural range. In such a novel environment, the response may be maladaptive. Second, some acclimation might occur on decadal to multi-decadal timescales so that the “pos” scheme would be valid in the short term but not the long term. Third, the response of r2l to soil P may be saturating rather than linear. A saturating parameterization would help to prevent over-allocation to fine roots under the very high soil P concentrations associated with P fertilization (but would be a bit more complicated than our parameterization because it would require an additional parameter). Finally, forest demand for P may change as a function of forest age or as species turn over. If the PFT composition changes and different PFTs have different a and b values, the community-level r2l would also be affected. Observations across a soil P gradient would also be useful for testing several of these points.
4.4 Towards more sophisticated models
Going forward, it would be interesting to validate the ability of other models to simulate biomass partitioning at tropical forest fertilization sites. Existing models use a variety of allocation schemes, but we are not aware of other models using a scheme analogous to our “pos” parameterizations. For example, CLM-CNP (Yang et al., 2014) and JULES-CNP (Nakhavali et al., 2022) use parameterizations similar to our “const” parameterization to control new growth allocation. Other models use dynamic allocation schemes. ORCHIDEE-CNP (Goll et al., 2017) and QUINCY (Thum et al., 2019) applied a pipe theory to partition leaf and root mass, modulated by the most limiting soil-available nutrient (and water for QUINCY). ELM-CNP (Zhu et al., 2019) and DLEM-CNP (Wang et al., 2020) apply a method that make allocation co-limited by both N and P (Friedlingstein et al., 1999). Braghiere et al. (2022) integrated the most recent version of FUN3.0 with ELM, modulating plant nutrient uptake from multiple pathways by optimizing carbon cost, but did not illustrate how this strategy might affect new-growth allocation. Whether any of these approaches would lead to increases in relative allocation to fine roots under P fertilization should be investigated.
The effect of nutrients on biomass partitioning also depends on stoichiometry. That is, nutrient limitation might lead to changes in tissue stoichiometry rather than tissue production. Some models account for stoichiometric flexibility by prescribing ranges for each pool based on empirical studies (e.g., CASACNP, Wang et al., 2010; ORCHIDEE-CNP, Goll et al., 2017; QUINCY, Thum et al., 2019). ED2 has fixed stoichiometries in structural pools but non-fixed stoichiometries in non-structural pools.
When comparing the influence of different allocation schemes, we made some simplifications to make our analyses more straightforward. For example, we did not account for the effect of N limitation on carbon partitioning. However, such an effect was not observed at our study site (Waring et al., 2019a). Nor did we account for the effect of water limitation on carbon partitioning. Carbon partitioning may also depend on community composition (Dybzinski et al., 2011) and it may be temporally variable (Farrior et al., 2013). We did not account for either of these effects except for the impact of water limitation on tree phenology (Xu et al., 2016). More sophisticated parameterizations that account for these effects should be investigated in future studies.
The partitioning of the new growth in a forest ecosystem between leaf, wood, and fine root pools is a critical aspect of ecosystem functioning and can strongly affect forest carbon budgets (Litton et al., 2007). We applied the nutrient-enabled ED2 model in simulating a fully factorial N and P fertilization experiment conducted in a secondary tropical dry forest in Costa Rica over 3 years. Some model parameterizations were able to accurately simulate leaf, wood, and fine root production, as well as mortality. Surprisingly, these parameterizations all assumed a positive relationship between relative allocation to fine roots and soil P. This result might be expected at relatively low levels of soil P, when increased root growth would lead to larger construction and maintenance costs but only modest increases in P uptake. Further experimentation is needed to test whether this relationship would hold on longer timescales and at other sites. Indeed, our sensitivity analysis suggested that this parameterization would over-allocate to fine roots in P-fertilized plots on multi-decadal timescales. Our findings also suggested the need for more model–data intercomparison, especially with respect to simultaneous measurements of leaf, wood, and fine root production. Such analyses will enable us to develop improved model parameterizations and ultimately better simulations of forest carbon balances.
The most up-to-date source code, post-processing R scripts, and an open discussion forum are available on GitHub at https://github.com/EDmodel/ED2 (The ED-2 model development team, 2024, last access: 1 October 2023). Field data are available from the Dryad Digital Repository: https://doi.org/10.5061/dryad.mq62g78 (Waring et al., 2019b, last access: 1 December 2023).
The supplement related to this article is available online at: https://doi.org/10.5194/bg-21-455-2024-supplement.
SL ran the simulations, carried out the analysis, and wrote the first draft of the paper. JP and BW provided the field data. DM designed the study. All authors contributed to paper revisions.
At least one of the (co-)authors is a member of the editorial board of Biogeosciences. The peer-review process was guided by an independent editor, and the authors also have no other competing interests to declare.
Publisher's note: Copernicus Publications remains neutral with regard to jurisdictional claims made in the text, published maps, institutional affiliations, or any other geographical representation in this paper. While Copernicus Publications makes every effort to include appropriate place names, the final responsibility lies with the authors. Neither the European Commission nor ECMWF is responsible for any use that may be made of the Copernicus information or data it contains.
This article is part of the special issue “Ecosystem experiments as a window to future carbon, water, and nutrient cycling in terrestrial ecosystems”. It is not associated with a conference.
The study by Muñoz Sabater (2019) was downloaded from the Copernicus Climate Change Service (C3S) Climate Data Store (2022). The results contain modified Copernicus Climate Change Service information for 2020.
This research has been supported by the U.S. Department of Energy, Office of Science, Biological and Environmental Research (grant no. DE-SC0014363) and the Directorate for Biological Sciences (grant no. DEB-1053237).
This paper was edited by Sönke Zaehle and reviewed by two anonymous referees.
Alfaro, E. A., Alvarado, A., and Chaverri, A.: Cambios edáficos asociados a tres etapas sucesionales tropical seco en Guanacaste, Costa Rica, Agronom. Cost., 25, 7–19, 2001.
Aoyagi, R., Kitayama, K., and Turner, B. L.: How do tropical tree species maintain high growth rates on low-phosphorus soils?, Plant Soil, 480, 1–26, https://doi.org/10.1007/s11104-022-05602-2, 2022.
Arora, V. K., Katavouta, A., Williams, R. G., Jones, C. D., Brovkin, V., Friedlingstein, P., Schwinger, J., Bopp, L., Boucher, O., Cadule, P., Chamberlain, M. A., Christian, J. R., Delire, C., Fisher, R. A., Hajima, T., Ilyina, T., Joetzjer, E., Kawamiya, M., Koven, C. D., Krasting, J. P., Law, R. M., Lawrence, D. M., Lenton, A., Lindsay, K., Pongratz, J., Raddatz, T., Séférian, R., Tachiiri, K., Tjiputra, J. F., Wiltshire, A., Wu, T., and Ziehn, T.: Carbon–concentration and carbon–climate feedbacks in CMIP6 models and their comparison to CMIP5 models, Biogeosciences, 17, 4173–4222, https://doi.org/10.5194/bg-17-4173-2020, 2020.
Báez, S. and Homeier, J.: Functional traits determine tree growth and ecosystem productivity of a tropical montane forest: Insights from a long-term nutrient manipulation experiment, Global Change Biol., 24, 399–409, https://doi.org/10.1111/gcb.13905, 2018.
Batterman, S. A., Hedin, L. O., Van Breugel, M., Ransijn, J., Craven, D. J., and Hall, J. S.: Key role of symbiotic dinitrogen fixation in tropical forest secondary succession, Nature, 502, 224–227, https://doi.org/10.1038/nature12525, 2013.
Bloom, A. J., Chapin, F. S., and Mooney, H. A.: Resource limitation in plants–an economic analogy, Annu. Rev. Ecol. Syst., 16, 363–392, 1985.
Braghiere, R. K., Fisher, J. B., Allen, K., Brzostek, E., Shi, M., Yang, X., Ricciuto, D. M., Fisher, R. A., Zhu, Q., and Phillips, R. P.: Modeling global carbon costs of plant nitrogen and phosphorus acquisition, J. Adv. Model. Earth Sy., 14, e2022MS003204, https://doi.org/10.1029/2022MS003204, 2022.
Campo, J. and Vázquez-Yanes, C.: Effects of nutrient limitation on aboveground carbon dynamics during tropical dry forest regeneration in Yucatán, Mexico, Ecosystems, 7, 311–319, https://doi.org/10.1007/s10021-003-0249-2, 2004.
Canadell, J., Jackson, R. B., Ehleringer, J. B., Mooney, H. A., Sala, O. E., and Schulze, E.: Maximum rooting depth of vegetation types at the global scale, Oecologia, 108, 583–595, https://doi.org/10.1007/BF00329030, 1996.
Canadell, J. G., Monteiro, P. M. S., Costa, M. H., Cotrim da Cunha, L., Cox, P. M., Eliseev, A. V., Henson, S., Ishii, M., Jaccard, S., Koven, C., Lohila, A., Patra, P. K., Piao, S., Rogelj, J., Syampungani, S., Zaehle, S. and Zickfeld, K.: Global Carbon and other Biogeochemical Cycles and Feedbacks, in: Climate Change 2021: The Physical Science Basis, Contribution of Working Group I to the Sixth Assessment Report of the Intergovernmental Panel on Climate Change, edited by: Masson-Delmotte, V., Zhai, P., Pirani, A., Connors, S. L., Péan, C., Berger, S., Caud, N., Chen, Y., Goldfarb, L., Gomis, M. I., Huang, M., Leitzell, K., Lonnoy, E., Matthews, J. B. R., Maycock, T. K., Waterfield, T., Yelekçi, O., Yu, R., and Zhou, B., Cambridge University Press, Cambridge, United Kingdom and New York, NY, USA, 673–816, 2021.
Chapin, F. S., Bloom, A. J., Field, C. B., and Waring, R. H.: Plant responses to multiple environmental factors, Bioscience, 37, 49–57, https://doi.org/10.2307/1310177, 1987.
Clark, D. A., Brown, S., Kicklighter, D. W., Chambers, J. Q., Thomlinson, J. R., and Ni, J.: Measuring net primary production in forests: concepts and field methods, Ecol. Appl., 11, 356–370, https://doi.org/10.1890/1051-0761(2001)011[0356:MNPPIF]2.0.CO;2, 2001.
Comas, L. H., Callahan, H. S., and Midford, P. E.: Patterns in root traits of woody species hosting arbuscular and ectomycorrhizas: implications for the evolution of belowground strategies, Ecol. Evol., 4, 2979–2990, https://doi.org/10.1002/ece3.1147, 2014.
Cunha, H. F. V., Andersen, K. M., Lugli, L. F., Santana, F. D., Aleixo, I. F., Moraes, A. M., Garcia, S., Di Ponzio, R., Mendoza, E. O., and Brum, B.: Direct evidence for phosphorus limitation on Amazon forest productivity, Nature, 608, 558–562, https://doi.org/10.1038/s41586-022-05085-2, 2022.
Dybzinski, R., Farrior, C., Wolf, A., Reich, P. B., and Pacala, S. W.: Evolutionarily stable strategy carbon allocation to foliage, wood, and fine roots in trees competing for light and nitrogen: an analytically tractable, individual-based model and quantitative comparisons to data, Am. Nat., 177, 153–166, https://doi.org/10.1086/657992, 2011.
Eissenstat, D. M. and Yanai, R. D.: Root life span, efficiency, and turnover, in: Plant Roots, CRC Press, 367–394, https://doi.org/10.1201/9780203909423.CH13, 2002.
Eissenstat, D. M., Kucharski, J. M., Zadworny, M., Adams, T. S., and Koide, R. T.: Linking root traits to nutrient foraging in arbuscular mycorrhizal trees in a temperate forest, New Phytol., 208, 114–124, https://doi.org/10.1111/nph.13451, 2015.
Farrior, C. E., Dybzinski, R., Levin, S. A., and Pacala, S. W.: Competition for water and light in closed-canopy forests: a tractable model of carbon allocation with implications for carbon sinks, Am. Nat., 181, 314–330, https://doi.org/10.1086/669153, 2013.
Finér, L., Ohashi, M., Noguchi, K., and Hirano, Y.: Factors causing variation in fine root biomass in forest ecosystems, For. Ecol. Manage., 261, 265–277, https://doi.org/10.1016/j.foreco.2010.10.016, 2011.
Fisher, R. A., Koven, C. D., Anderegg, W. R., Christoffersen, B. O., Dietze, M. C., Farrior, C. E., Holm, J. A., Hurtt, G. C., Knox, R. G., and Lawrence, P. J.: Vegetation demographics in Earth System Models: A review of progress and priorities, Global Change Biol., 24, 35–54, https://doi.org/10.1111/gcb.13910, 2018.
Fitter, A. H.: Architecture and biomass allocation as components of the plastic response of root systems to soil heterogeneity, Exploitation of Environmental Heterogeneity by Plants, editedt by: Caldwell, M. M. and Pearcy, R. W., Academic Press, 305–324, ISBN 0-12-155070-2, 1994.
Fransen, B., Blijjenberg, J., and de Kroon, H.: Root morphological and physiological plasticity of perennial grass species and the exploitation of spatial and temporal heterogeneous nutrient patches, Plant Soil, 211, 179–189, https://doi.org/10.1023/A:1004684701993, 1999.
Friedlingstein, P., Joel, G., Field, C. B., and Fung, I. Y.: Toward an allocation scheme for global terrestrial carbon models, Global Change Biol., 5, 755–770, https://doi.org/10.1046/j.1365-2486.1999.00269.x, 1999.
George, E. and Seith, B.: Long-term effects of a high nitrogen supply to soil on the growth and nutritional status of young Norway spruce trees, Environmental Pollution, 102, 301–306, https://doi.org/10.1016/S0269-7491(98)00050-5, 1998.
Gersani, M., Brown, J., O'Brien, E. E., Maina, G. M., and Abramsky, Z.: Tragedy of the Commons as a Result of Root Competition, J. Ecol., 89, 660–669, 2001.
Gessler, A., Schaub, M., and McDowell, N. G.: The role of nutrients in drought-induced tree mortality and recovery, New Phytol., 214, 513–520, https://doi.org/10.1111/nph.14340, 2017.
Goll, D. S., Brovkin, V., Parida, B. R., Reick, C. H., Kattge, J., Reich, P. B., van Bodegom, P. M., and Niinemets, Ü.: Nutrient limitation reduces land carbon uptake in simulations with a model of combined carbon, nitrogen and phosphorus cycling, Biogeosciences, 9, 3547–3569, https://doi.org/10.5194/bg-9-3547-2012, 2012.
Goll, D. S., Vuichard, N., Maignan, F., Jornet-Puig, A., Sardans, J., Violette, A., Peng, S., Sun, Y., Kvakic, M., Guimberteau, M., Guenet, B., Zaehle, S., Penuelas, J., Janssens, I., and Ciais, P.: A representation of the phosphorus cycle for ORCHIDEE (revision 4520), Geosci. Model Dev., 10, 3745–3770, https://doi.org/10.5194/gmd-10-3745-2017, 2017.
Güsewell, S.: N:P ratios in terrestrial plants: variation and functional significance, New Phytol., 164, 243–266, https://doi.org/10.1111/j.1469-8137.2004.01192.x, 2004.
Han, M., Chen, Y., Li, R., Yu, M., Fu, L., Li, S., Su, J., and Zhu, B.: Root phosphatase activity aligns with the collaboration gradient of the root economics space, New Phytol., 234, 837–849, https://doi.org/10.1111/nph.17906, 2022.
Hayward, J. and Horton, T. R.: Phylogenetic trait conservation in the partner choice of a group of ectomycorrhizal trees, Mol. Ecol., 23, 4886–4898, https://doi.org/10.1111/mec.12903, 2014.
Hodge, A.: The plastic plant: root responses to heterogeneous supplies of nutrients, New Phytol., 162, 9–24, https://doi.org/10.1111/j.1469-8137.2004.01015.x, 2004.
Hodge, A., Robinson, D., Griffiths, B. S., and Fitter, A. H.: Why plants bother: root proliferation results in increased nitrogen capture from an organic patch when two grasses compete, Plant, Cell Environ., 22, 811–820, https://doi.org/10.1046/j.1365-3040.1999.00454.x, 1999.
Hou, E., Luo, Y., Kuang, Y., Chen, C., Lu, X., Jiang, L., Luo, X., and Wen, D.: Global meta-analysis shows pervasive phosphorus limitation of aboveground plant production in natural terrestrial ecosystems, Nat. Commun., 11, 637, https://doi.org/10.1038/s41467-020-14492-w, 2020.
Jackson, R. B., Manwaring, J. H., and Caldwell, M. M.: Rapid physiological adjustment of roots to localized soil enrichment, Nature, 344, 58–60, https://doi.org/10.1038/344058a0, 1990.
Jackson, R. B., Lajtha, K., Crow, S. E., Hugelius, G., Kramer, M. G., and Piñeiro, G.: The ecology of soil carbon: pools, vulnerabilities, and biotic and abiotic controls, Annu. Rev. Ecol. Evol. Syst., 48, 419–445, https://doi.org/10.1146/annurev-ecolsys-112414-054234, 2017.
Jing, J., Rui, Y., Zhang, F., Rengel, Z., and Shen, J.: Localized application of phosphorus and ammonium improves growth of maize seedlings by stimulating root proliferation and rhizosphere acidification, Field Crops Res., 119, 355–364, https://doi.org/10.1007/s11104-011-0909-5, 2010.
Kong, D. L., Wang, J. J., Kardol, P., Wu, H. F., Zeng, H., Deng, X. B., and Deng, Y.: Economic strategies of plant absorptive roots vary with root diameter, Biogeosciences, 13, 415–424, https://doi.org/10.5194/bg-13-415-2016, 2016.
Kou-Giesbrecht, S., Arora, V. K., Seiler, C., Arneth, A., Falk, S., Jain, A. K., Joos, F., Kennedy, D., Knauer, J., Sitch, S., O'Sullivan, M., Pan, N., Sun, Q., Tian, H., Vuichard, N., and Zaehle, S.: Evaluating nitrogen cycling in terrestrial biosphere models: a disconnect between the carbon and nitrogen cycles, Earth Syst. Dynam., 14, 767–795, https://doi.org/10.5194/esd-14-767-2023, 2023.
LeBauer, D. S. and Treseder, K. K.: Nitrogen Limitation of Net Primary Productivity in Terrestrial Ecosystems Is Globally Distributed, Ecology, 89, 371–379, https://doi.org/10.1890/06-2057.1, 2008.
LeBauer, D. S., Wang, D., Richter, K. T., Davidson, C. C., and Dietze, M. C.: Facilitating feedbacks between field measurements and ecosystem models, Ecol. Monogr., 83, 133–154, https://doi.org/10.1890/12-0137.1, 2013.
Levy-Varon, J. H., Batterman, S. A., Medvigy, D., Xu, X., Hall, J. S., van Breugel, M., and Hedin, L. O.: Tropical carbon sink accelerated by symbiotic dinitrogen fixation, Nat. Commun., 10, 1–8, https://doi.org/10.1038/s41467-019-13656-7, 2019.
Li, H. B., Zhang, F. S., and Shen, J. B.: Contribution of root proliferation in nutrient-rich soil patches to nutrient uptake and growth of maize, Pedosphere, 22, 776–784, https://doi.org/10.1016/S1002-0160(12)60063-0, 2012.
Li, Y., Niu, S., and Yu, G.: Aggravated phosphorus limitation on biomass production under increasing nitrogen loading: a meta-analysis, Global Change Biol., 22, 934–943, https://doi.org/10.1111/gcb.13125, 2016.
Litton, C. M., Raich, J. W., and Ryan, M. G.: Carbon allocation in forest ecosystems, Global Change Biol., 13, 2089–2109, https://doi.org/10.1111/j.1365-2486.2007.01420.x, 2007.
Liu, B., Li, H., Zhu, B., Koide, R. T., Eissenstat, D. M., and Guo, D.: Complementarity in nutrient foraging strategies of absorptive fine roots and arbuscular mycorrhizal fungi across 14 coexisting subtropical tree species, New Phytol., 208, 125–136, https://doi.org/10.1111/nph.13434, 2015.
Longo, M., Knox, R. G., Medvigy, D. M., Levine, N. M., Dietze, M. C., Kim, Y., Swann, A. L. S., Zhang, K., Rollinson, C. R., Bras, R. L., Wofsy, S. C., and Moorcroft, P. R.: The biophysics, ecology, and biogeochemistry of functionally diverse, vertically and horizontally heterogeneous ecosystems: the Ecosystem Demography model, version 2.2 – Part 1: Model description, Geosci. Model Dev., 12, 4309–4346, https://doi.org/10.5194/gmd-12-4309-2019, 2019a.
Longo, M., Knox, R. G., Levine, N. M., Swann, A. L. S., Medvigy, D. M., Dietze, M. C., Kim, Y., Zhang, K., Bonal, D., Burban, B., Camargo, P. B., Hayek, M. N., Saleska, S. R., da Silva, R., Bras, R. L., Wofsy, S. C., and Moorcroft, P. R.: The biophysics, ecology, and biogeochemistry of functionally diverse, vertically and horizontally heterogeneous ecosystems: the Ecosystem Demography model, version 2.2 – Part 2: Model evaluation for tropical South America, Geosci. Model Dev., 12, 4347–4374, https://doi.org/10.5194/gmd-12-4347-2019, 2019b.
Lu, M. and Hedin, L. O.: Global plant–symbiont organization and emergence of biogeochemical cycles resolved by evolution-based trait modelling, Nat. Ecol. Evol., 3, 239–250, https://doi.org/10.1038/s41559-018-0759-0, 2019.
Lugli, L. F., Andersen, K. M., Aragão, L. E., Cordeiro, A. L., Cunha, H. F., Fuchslueger, L., Meir, P., Mercado, L. M., Oblitas, E., Quesada, C. A., and Rosa, J. S.: Multiple phosphorus acquisition strategies adopted by fine roots in low-fertility soils in Central Amazonia, Plant Soil, 450, 49–63, https://doi.org/10.1007/s11104-019-03963-9, 2020.
Lugli, L. F., Rosa, J. S., Andersen, K. M., Di Ponzio, R., Almeida, R. V., Pires, M., Cordeiro, A. L., Cunha, H. F., Martins, N. P., and Assis, R. L.: Rapid responses of root traits and productivity to phosphorus and cation additions in a tropical lowland forest in Amazonia, New Phytol., 230, 116–128, https://doi.org/10.1111/nph.17154, 2021.
Ma, Z., Guo, D., Xu, X., Lu, M., Bardgett, R. D., Eissenstat, D. M., McCormack, M. L., and Hedin, L. O.: Evolutionary history resolves global organization of root functional traits. Nature, 555, 94–97, https://doi.org/10.1038/nature25783, 2018.
Malhi, Y., Baker, T. R., Phillips, O. L., Almeida, S., Alvarez, E., Arroyo, L., Chave, J., Czimczik, C. I., Fiore, A. D., and Higuchi, N.: The above-ground coarse wood productivity of 104 Neotropical forest plots, Global Change Biol., 10, 563–591, https://doi.org/10.1111/j.1529-8817.2003.00778.x, 2004.
Malhi, Y., Doughty, C. E., Goldsmith, G. R., Metcalfe, D. B., Girardin, C. A., Marthews, T. R., del Aguila-Pasquel, J., Aragão, L. E., Araujo-Murakami, A., and Brando, P.: The linkages between photosynthesis, productivity, growth and biomass in lowland Amazonian forests, Global Change Biol., 21, 2283–2295, https://doi.org/10.1111/gcb.12859, 2015.
Medvigy, D., Wofsy, S.C., Munger, J.W., Hollinger, D.Y., and Moorcroft, P.R.: Mechanistic scaling of ecosystem function and dynamics in space and time: Ecosystem Demography model version 2, J. Geophys. Res., 114, G01002, https://doi.org/10.1029/2008JG000812, 2009.
Medvigy, D., Wang, G., Zhu, Q., Riley, W. J., Trierweiler, A. M., Waring, B. G., Xu, X., and Powers, J. S.: Observed variation in soil properties can drive large variation in modelled forest functioning and composition during tropical forest secondary succession, New Phytol., 223, 1820–1833, https://doi.org/10.1111/nph.15848, 2019.
Menge, D. N., Kou-Giesbrecht, S., Taylor, B. N., Akana, P. R., Butler, A., Carreras Pereira, K. A., Cooley, S. S., Lau, V. M., and Lauterbach, E. L.: Terrestrial Phosphorus Cycling: Responses to Climatic Change, Annu. Rev. Ecol. Evol. Syst., 54, 429–449, https://doi.org/10.1146/annurev-ecolsys-110421-102458, 2023.
Moorcroft, P. R., Hurtt, G. C., and Pacala, S. W.: A method for scaling vegetation dynamics: the ecosystem demography model (ED), Ecol. Monogr., 71, 557–586, https://doi.org/10.1890/0012-9615(2001)071[0557:AMFSVD]2.0.CO;2, 2001.
Muñoz Sabater, J.: ERA5-Land hourly data from 1981 to present, Copernicus Climate Change Service (C3S) Climate Data Store (CDS), https://doi.org/10.24381/cds.e2161bac, 2019.
Nakhavali, M. A., Mercado, L. M., Hartley, I. P., Sitch, S., Cunha, F. V., di Ponzio, R., Lugli, L. F., Quesada, C. A., Andersen, K. M., Chadburn, S. E., Wiltshire, A. J., Clark, D. B., Ribeiro, G., Siebert, L., Moraes, A. C. M., Schmeisk Rosa, J., Assis, R., and Camargo, J. L.: Representation of the phosphorus cycle in the Joint UK Land Environment Simulator (vn5.5_JULES-CNP), Geosci. Model Dev., 15, 5241–5269, https://doi.org/10.5194/gmd-15-5241-2022, 2022.
Nobel, P. S., Schulte, P. J., and North, G. B.: Water influx characteristics and hydraulic conductivity for roots of Agave deserti Engelm, J. Exp. Bot., 41, 409–415, https://doi.org/10.1093/jxb/41.4.409, 1990.
Oren, R., Ellsworth, D. S., Katul, G. G., Johnsen, K. H., Phillips, N., Ewers, B. E., Maier, C., Schäfer, K. V. R., McCarthy, H., Hendrey, G., and McNulty, S. G.: Soil fertility limits carbon sequestration by forest ecosystems in a CO2-enriched atmosphere, Nature, 411, 469–472, https://doi.org/10.1038/35078064, 2001.
Paz, H., Pineda-García, F., and Pinzón-Pérez, L. F.: Root depth and morphology in response to soil drought: comparing ecological groups along the secondary succession in a tropical dry forest, Oecologia, 179, 551–561, https://doi.org/10.1007/s00442-015-3359-6, 2015.
Powers, J. S. and Tiffin, P.: Plant functional type classifications in tropical dry forests in Costa Rica: leaf habit versus taxonomic approaches, Funct. Ecol., 24, 927–936, https://doi.org/10.1111/j.1365-2435.2010.01701.x, 2010.
Pregitzer, K. S., Hendrick, R. L., and Fogel, R.: The demography of fine roots in response to patches of water and nitrogen, New Phytol., 125, 575–580, https://doi.org/10.1111/j.1469-8137.1993.tb03905.x, 1993.
Raven, J. A., Lambers, H., Smith, S. E., and Westoby, M.: Costs of acquiring phosphorus by vascular land plants: patterns and implications for plant coexistence, New Phytol., 217, 1420–1427, https://doi.org/10.1111/nph.14967, 2018.
Reichert, T., Rammig, A., Fuchslueger, L., Lugli, L. F., Quesada, C. A., and Fleischer, K.: Plant phosphorus-use and-acquisition strategies in Amazonia, New Phytol., 234, 1126–1143, https://doi.org/10.1111/nph.17985, 2022.
Robinson, D.: The responses of plants to non-uniform supplies of nutrients, New Phytol., 127, 635–674, https://doi.org/10.1111/j.1469-8137.1994.tb02969.x, 1994.
Robinson, D., Hodge, A., Griffiths, B. S., and Fitter, A. H.: Plant root proliferation in nitrogen–rich patches confers competitive advantage. P. Roy. Soc. London, 266, 431–435, https://doi.org/10.1098/rspb.1999.0656, 1999.
Schwartz, N. B., Medvigy, D., Tijerin, J., Pérez-Aviles, D., Rivera-Polanco, D., Pereira, D., Werden, L., Du, D., Arnold, L., and Powers, J. S.: Intra-annual variation in microclimatic conditions in relation to vegetation type and structure in two tropical dry forests undergoing secondary succession, For. Ecol. Manage., 511, 120132, https://doi.org/10.1016/j.foreco.2022.120132, 2022.
The ED-2 model development team: Ecosystem Demography model (ED-2) code repository [code], available at: https://github.com/EDmodel/ED2 (last access: 1 October 2023), 2014.
Thum, T., Caldararu, S., Engel, J., Kern, M., Pallandt, M., Schnur, R., Yu, L., and Zaehle, S.: A new model of the coupled carbon, nitrogen, and phosphorus cycles in the terrestrial biosphere (QUINCY v1.0; revision 1996), Geosci. Model Dev., 12, 4781–4802, https://doi.org/10.5194/gmd-12-4781-2019, 2019.
Wang, G., Post, W. M., and Mayes, M. A.: Development of microbial-enzyme-mediated decomposition model parameters through steady-state and dynamic analyses, Ecol. Appl., 23, 255–272, https://doi.org/10.1890/12-0681.1, 2013.
Wang, G., Liu, F., and Xue, S.: Nitrogen addition enhanced water uptake by affecting fine root morphology and coarse root anatomy of Chinese pine seedlings, Plant Soil, 418, 177–189, https://doi.org/10.1007/s11104-017-3283-0, 2017.
Wang, Y. P., Law, R. M., and Pak, B.: A global model of carbon, nitrogen and phosphorus cycles for the terrestrial biosphere, Biogeosciences, 7, 2261–2282, https://doi.org/10.5194/bg-7-2261-2010, 2010.
Wang, Z., Tian, H., Yang, J., Shi, H., Pan, S., Yao, Y., Banger, K., and Yang, Q.: Coupling of phosphorus processes with carbon and nitrogen cycles in the dynamic land ecosystem model: Model structure, parameterization, and evaluation in tropical forests, J. Adv. Model. Earth Sy., 12, e2020MS002123, https://doi.org/10.1029/2020MS002123, 2020.
Waring, B. G., Becknell, J. M., and Powers, J. S.: Nitrogen, phosphorus, and cation use efficiency in stands of regenerating tropical dry forest, Oecologia, 178, 887–897, https://doi.org/10.1007/s00442-015-3283-9, 2015.
Waring, B. G., Pérez-Aviles, D., Murray, J. G., and Powers, J. S.: Plant community responses to stand-level nutrient fertilization in a secondary tropical dry forest, Ecology, 100, e02691, https://doi.org/10.1002/ecy.2691, 2019a.
Waring, B. G., Aviles, D. P., Murray, J. G., Powers, J. S.: Data from: Plant community responses to stand-level nutrient fertilization in a secondary tropical dry forest [data set], Dryad, https://doi.org/10.5061/dryad.mq62g78 (last access: 1 December 2023), 2019b.
Wieder, W. R., Cleveland, C. C., Smith, W. K., and Todd-Brown, K.: Future productivity and carbon storage limited by terrestrial nutrient availability, Nat. Geosci., 8, 441–444, https://doi.org/10.1038/ngeo2413, 2015.
Wright, S. J.: Plant responses to nutrient addition experiments conducted in tropical forests, Ecol. Monogr., 89, e01382, https://doi.org/10.1002/ecm.1382, 2019.
Wright, S. J., Turner, B. L., Yavitt, J. B., Harms, K. E., Kaspari, M., Tanner, E. V., Bujan, J., Griffin, E. A., Mayor, J. R., and Pasquini, S. C.: Plant responses to fertilization experiments in lowland, species-rich, tropical forests, Ecology, 99, 1129–1138, https://doi.org/10.1002/ecy.2193, 2018.
Wright, S. J., Yavitt, J. B., Wurzburger, N., Turner, B. L., Tanner, E. V., Sayer, E. J., Santiago, L. S., Kaspari, M., Hedin, L. O., and Harms, K. E.: Potassium, phosphorus, or nitrogen limit root allocation, tree growth, or litter production in a lowland tropical forest, Ecology, 92, 1616–1625, https://doi.org/10.1890/10-1558.1, 2011.
Xu, X., Konings, A. G., Longo, M., Feldman, A., Xu, L., Saatchi, S., Wu, D., Wu, J., and Moorcroft, P.: Leaf surface water, not plant water stress, drives diurnal variation in tropical forest canopy water content, New Phytol., 231, 122–136, https://doi.org/10.1111/nph.17254, 2021.
Xu, X., Medvigy, D., Powers, J. S., Becknell, J. M., and Guan, K.: Diversity in plant hydraulic traits explains seasonal and inter-annual variations of vegetation dynamics in seasonally dry tropical forests, New Phytol., 212, 80–95, https://doi.org/10.1111/nph.14009, 2016.
Yang, X., Thornton, P. E., Ricciuto, D. M., and Post, W. M.: The role of phosphorus dynamics in tropical forests – a modeling study using CLM-CNP, Biogeosciences, 11, 1667–1681, https://doi.org/10.5194/bg-11-1667-2014, 2014.
Yuan, Z. Y. and Chen, H. Y.: A global analysis of fine root production as affected by soil nitrogen and phosphorus, P. Roy. Soc. B-Bio., 279, 3796–3802, https://doi.org/10.1098/rspb.2012.0955, 2012.
Zea-Cabrera, E., Iwasa, Y., Levin, S., and Rodríguez-Iturbe, I.: Tragedy of the commons in plant water use, Water Resour. Res., 42, 1–12, 2006.
Zhang, H. and Forde, B. G.: An Arabidopsis MADS box gene that controls nutrient-induced changes in root architecture, Science, 279, 407–409, https://doi.org/10.1126/science.279.5349.40, 1998.
Zhang, D., Zhang, C., Tang, X., Li, H., Zhang, F., Rengel, Z., Whalley, W. R., Davies, W. J., and Shen, J.: Increased soil phosphorus availability induced by faba bean root exudation stimulates root growth and phosphorus uptake in neighbouring maize, New Phytol., 209, 823–831, https://doi.org/10.1111/nph.13613, 2016.
Zhu, Q., Riley, W. J., Tang, J., and Koven, C. D.: Multiple soil nutrient competition between plants, microbes, and mineral surfaces: model development, parameterization, and example applications in several tropical forests, Biogeosciences, 13, 341–363, https://doi.org/10.5194/bg-13-341-2016, 2016.
Zhu, Q., Riley, W. J., Tang, J., Collier, N., Hoffman, F. M., Yang, X., and Bisht, G.: Representing nitrogen, phosphorus, and carbon interactions in the E3SM land model: Development and global benchmarking, J. Adv. Model. Earth Sy., 11, 2238–2258, https://doi.org/10.1029/2018MS001571, 2019.