the Creative Commons Attribution 4.0 License.
the Creative Commons Attribution 4.0 License.
Projected changes in forest fire season, the number of fires, and burnt area in Fennoscandia by 2100
Leif Backman
Juha Aalto
Tuula Aalto
Tiina Markkanen
Forest fire dynamics are expected to alter due to climate change. Despite the projected increase in precipitation, rising temperatures will amplify forest fire risk from the present to the end of the century. Here, we analysed changes in fire season, the number of fires, and burnt area in Fennoscandia from 1951 to 2100. Regional simulations from the JSBACH–SPITFIRE ecosystem model (where SPITFIRE stands for SPread and InTensity of FIRE) were performed under two climate change forcing scenarios (Representative Concentration Pathway (RCP) 4.5 and RCP 8.5) and three global climate driver models (CanESM2, CNRM-CM5, and MIROC5) with a 0.5° resolution. Simulations were forced by downscaled and bias-corrected EURO-CORDEX data. Generally, as a consequence of the projected longer fire season and drier fuel, the probability of fires is projected to increase. However, changes in fire season, the number of fires, and burnt area are highly dependent on climate projections and location. The fire season is estimated to increase on average from 20 ± 7 to 52 ± 12 d, starting from 10 ± 9 to 23 ± 11 d earlier and ending from 10 ± 10 to 30 ± 16 d later, compared to the reference period (1981–2010), by the end of the century (2071–2100). The results for Finland indicate a change in the number of fires, ranging from −7 ± 4 % to 98 ± 56 %, and a change in burnt area, ranging from −19 ± 24 % to 87 ± 42 %. These findings contribute to a better understanding of potential changes in the future fire seasons of northern Europe.
- Article
(11658 KB) - Full-text XML
- BibTeX
- EndNote
Forest fires are natural to boreal ecosystems. Historically, forest fires are one of the primary disturbances in Fennoscandia (Engelmark, 1999; Ramberg et al., 2018; Tolonen and Pitkänen, 2004), where the forests are dominated by Scots pine and Norway spruce. Nowadays, due to efficient fire monitoring and suppression, fire is a relatively rare event in Fennoscandia (Ramberg, 2020; Vajda et al., 2014). For example, on average, only 0.006 % (less than 2000 ha) of Swedish forests burn per year, although in the exceptionally dry summer of 2018, there was a high number of forest fires (Ramberg et al., 2018). In Finland, the annual burnt area is 500–600 ha (Aalto and Venäläinen, 2021). Nevertheless, Lehtonen et al. (2016) pointed out that the number of large forest fires (>10 ha) may even triple during the present century. Furthermore, in the Siberian Arctic, an almost exponential increase has been observed in burnt areas (Descals et al., 2022). Today, population density, landscape patterns, prescribed fires, and fire prevention policies strongly influence forest fires (Flannigan et al., 2009; Larjavaara et al., 2005a). The only natural cause of fires is lightning (Larjavaara et al., 2005b; Gromtsev, 2002), and fires are mainly ignited – about 90 % in Finland (Mäkelä, 2015; Kilpeläinen et al., 2010) – by human actions (Flannigan et al., 2009; Ramberg, 2020; Hantson et al., 2015). The population density is low in Finland, and fires are more likely to occur in the more densely populated southern part than in the northern part of the country (Vajda et al., 2014; Larjavaara et al., 2005a).
Forest fires have a multitude of impacts on the ecosystem and climate. Fires cause tree mortality, release nutrients (Kulmala et al., 2014), and create open spaces in the forest, helping vegetation to grow from seeds (Venevsky et al., 2002; Moritz et al., 2012; Ramberg, 2020). Prescribed and reoccurring fires are needed to increase structural heterogeneity within a landscape and are pivotal for maintaining high biodiversity (Kuuluvainen, 2002; Ramberg, 2020). Generally, total ecosystem recovery from severe forest fires is possible, but it takes a long time. Recovery of the forest floor mass could take several years, and for organic horizons, it could take up to 20 years (Mäkipää et al., 2023). Fire may heat the soil to high temperatures and cause carbon and nutrient losses, physical alterations of soil, changes in the stability of organic matter, and the mortality of faunal and microbial communities (Mäkipää et al., 2023). Burning may also have a negative impact on carbon storage due to losses of C and N in the ecosystem during fires (Mäkipää et al., 2023; Mäkelä, 2015). Forest fires are a source of black carbon, which is harmful to health and accelerates the melting of snow and ice in the Arctic (Aalto and Venäläinen, 2021). In addition, forest fires may release pollutants, such as mercury (Hg), into the atmosphere, which may cause health problems (Turetsky et al., 2006). Fires cause greenhouse gas emissions (e.g. carbon dioxide (CO2)) to be released into the atmosphere, which can further propagate climate change.
Forest fires are the result of interactions between climate, weather, fuel, and humans (Flannigan et al., 2009; Lasslop et al., 2018). Warmer temperatures have a 3-fold link to wildfires due to increased evapotranspiration, lightning activity, and fire season length (Flannigan et al., 2009). Climate change influences the spatial variations in and potential extreme conditions of fire weather. Fire weather is defined as the weather variables (temperature, precipitation, humidity, and wind) that influence fire behaviour, ignition, and suppression (Flannigan et al., 2009).
The expected rate of temperature increase due to climate change in Fennoscandia is 2–3 times higher than the global average (Kaplan and New, 2006; Venäläinen et al., 2020). This expected acceleration increases the risk of forest fires, although an increase in precipitation might partially have the opposite effect (Mäkelä, 2015; Aakala et al., 2018; Kilpeläinen et al., 2010; Venäläinen et al., 2020). Across the boreal region, burnt area and fire occurrences are projected to increase (Flannigan et al., 2009; de Groot et al., 2013), mainly due to temperature increase, but they are modulated by changes in precipitation, litter production, soil respiration, and population density. Understanding the factors behind changes in forest fire activity is essential to ensure the effective management of spreading fires (Jolly et al., 2015).
The main focus of previous studies has been the impact of varying meteorological conditions on fire risk (Flannigan et al., 2009; Ramberg, 2020; Mäkelä, 2015). Here, we use the land surface model JSBACH to study fire seasons, the number of fires, and burnt areas under changing climate conditions. In this study, we investigate how and why projected climate change modulates forest fire risk in Fennoscandia. We present results from an analysis of climate change impacts on fire season, the number of fires, and burnt area based on JSBACH–SPITFIRE model simulations (where SPITFIRE stands for SPread and InTensity of FIRE), which were forced by downscaled and bias-corrected EURO-CORDEX data (Jacob et al., 2014). The simulations were conducted under two climate change scenarios (Representative Concentration Pathway (RCP) 4.5 and RCP 8.5) and three global climate driver models (CNRM-CM5, MIROC5, and CanESM2) from 1951 to 2100.
2.1 Ecosystem model JSBACH
The JSBACH ecosystem model (Kaminski et al., 2013) was developed as the land surface component of the Earth system models at the Max-Planck-Institute for Meteorology (Reick et al., 2021; Mauritsen et al., 2019). SPITFIRE (SPread and InTensity of FIRE) is a mechanistic global fire model (Thonicke et al., 2010) that has been implemented in the JSBACH ecosystem model (Lasslop et al., 2014). The forest fires in the JSBACH–SPITFIRE ecosystem model are disturbances that depend on weather conditions, fuel properties, and population density.
The amount of fuel is estimated using above-ground C pools from the Yasso07 soil carbon model (Goll et al., 2015). It is simulated as a balance between litter produced by vegetation and soil carbon decomposition, including combustion and consequent dead wood input from fire events. The fuel is divided into fuel classes according to reaction time to atmospheric conditions as follows: 1, 10, 100, and 1000 h fuel. This division represents the different sizes, i.e. the different surface-area-to-volume ratios, of fuel elements such as leaves, branches, and trunks (Lasslop et al., 2014). The time required to reach the equilibrium moisture content under defined atmospheric conditions is longer for larger fuel elements due to their lower surface-area-to-volume ratio compared to that of fine fuel elements. Grass (live fuel) is included in the 1 h fuel class. After a fire, the burnt carbon is subtracted from the C pools and released into the atmosphere as CO2, while carbon from tree mortality is added to the C pools (Thonicke et al., 2010).
The moisture content of the fuel is exponentially dependent on the Nesterov index (NI), and the NI is weighted by the relative quantities of three of the fuel classes (1, 10, and 100 h). The NI describes the drying power and depends on both temperature and precipitation. The NI (Onderka and Melicherčik, 2010) is a cumulative function of daily maximum temperature and dew point temperature. The index is summed over days when the daily precipitation is less than 3 mm and the dew point temperature is above 0 °C (Thonicke et al., 2010; Running et al., 1987).
In the JSBACH–SPITFIRE model, the fire danger index (FDI) is the probability that an ignition event will cause a spreading fire. The FDI has a value of 1 for completely dry fuel and a value of zero for insufficient or wet fuel. The FDI is calculated from environmental dryness, temperature, and the availability of fuel (Reick et al., 2021) as follows:
We used the FDI to estimate the number of days with high fire risk. An FDI > 0.8 indicates very high or extremely high fire risk (Thonicke et al., 2010). The fire season is the period when the FDI is above zero and forest fires are possible. We defined the length of the fire season as the number of days between the first and last day when the FDI is greater than zero.
In the SPITFIRE model, the fire may start from lightning ignition or a human act. The total ignition rate is the sum of lightning- and human-caused ignitions. The expected number of human-caused ignition events depends on population density and the propensity of people to cause ignition events (Thonicke et al., 2010), which reflect regional and cultural differences (Lasslop and Kloster, 2017). The number of human-caused ignition events is a non-linear function of population density. The ignition events increase with population density until they start to decline due to landscape fragmentation, urbanisation, and associated infrastructural changes (Thonicke et al., 2010). When there is fuel available and the fuel is dry enough, the ignition will lead to a spreading fire. The number of fires per area is obtained by multiplying the number of total ignition events by the FDI. The burnt area is determined based on the number of fires, the fire duration, and the rate of spread (Rothermel, 1972), assuming an elliptical spread pattern (Carmody, 1992). The analysed burnt area is calculated for forested areas. Overlapping fires were not accounted for, but such occurrences are very rare within the study area.
2.2 Regional simulations
Regional simulations were performed using the JSBACH–SPITFIRE ecosystem model for the period 1951–2100. The simulations were forced by downscaled and bias-corrected data from the EURO-CORDEX initiative (Jacob et al., 2014). We used data from the EUR-44 domain (Earth System Grid Federation Data Node, 2020), which were regridded to a regular 0.5° lat–long grid using nearest-neighbour interpolation. The simulated model domain (Fig. 1a) was limited to the land area within 55–71° N and 5–34° E.
The global models were forced under two Representative Concentration Pathway (RCP) scenarios, RCP 4.5 and RCP 8.5, with the numbers indicating radiative-forcing values in W m−2 for 2100 (van Vuuren et al., 2011). The RCP 4.5 scenario represents intermediate greenhouse gas emissions, and RCP 8.5 represents high greenhouse gas emissions. While global mean surface temperature is likely to increase from 1.1 to 2.6 °C under RCP 4.5 and from 2.6 to 4.8 °C under RCP 8.5 by the end of the 21st century, relative to 1986-2005 (IPCC, 2014), in Finland the multi-model annual mean temperature increases correspond to 1.9, 3.3, and 5.6 °C for RCP 2.6, RCP 4.5, and RCP 8.5, respectively (Ruosteenoja et al., 2016). The RCPs share a common greenhouse gas (GHG) pathway up to 2005 (the historical period) and deviate from thereon (the scenario period). The regional climate model RCA4 (Samuelsson et al., 2011) was used as a downscaling model for all three global climate driver models (CNRM-CM5, MIROC5, and CanESM2), and a distribution-based bias-correction method (SMHI-DBS45-EOBS12-1981-2010) was applied to all datasets that we used (e.g. Yang et al., 2010). Daily bias-corrected data for precipitation and temperature for both RCP 4.5 and RCP 8.5 were used. In addition, daily data for relative humidity, wind speed, and longwave and shortwave radiation were used.
A spin-up of the soil carbon pools was performed before the actual simulation using driver data randomly generated from 1951–1980 and a prescribed CO2 concentration (285 ppm). The JSBACH model was run with a time step of 30 min, and values for the variables were outputted with a daily frequency. The land cover in the simulations represents the current land cover and was derived from Finnish CORINE (Coordination of Information on the Environment) and European CORINE (European Environment Agency, 2020) data. European Space Agency (ESA) land use and Climate Change Initiative (CCI) data (European Space Agency, 2019) were used for areas not covered by CORINE data. The land cover classes were translated into the 11 plant functional types that the JSBACH model uses. Land cover changes were not accounted for. Soil properties were set according to Hagemann and Stacke (2015), with the peat fraction of the land area set according to the map by Xu et al. (2017), while the parameter values of loamy sand were assumed for the remaining land area.
The human-caused ignition events were calculated using population density. The historical population density was based on data from the History Database of the Global Environment (Klein Goldewijk et al., 2017). The future scenario follows a middle-of-the-road Shared Socioeconomic Pathway (SSP2) (Jones and O'Neill, 2016). The lightning ignition rate was obtained from a climatology for northern Europe, compiled by the Finnish Meteorological Institute (Mäkelä et al., 2014), based on observations from lightning location sensors. The LIS/OTD (Lightning Imaging Sensor/Optical Transient Detector) 0.5 Degree High Resolution Monthly Climatology was used east of 32 E (Cecil, 2016). The LIS/OTD climatology reports total flashes, but only about 20 % are cloud-to-ground flashes, which was taken into account. In addition, a latitude-dependent relation between total flashes and cloud-to-ground flashes was applied to correct the latitude bias in the LIS/OTD data (Pierce, 1970; Lasslop et al., 2014).
The simulations were initially set up for the study report by Aalto and Venäläinen (2021) about the current knowledge of the occurrence, monitoring, modelling, and suppression of forest fires in Fennoscandia. Simulations were further improved for this study to better match the observed annual number of fires and burnt areas. Fire duration (Dfire) depends on population density (PD) and the fire danger index (FDI; Eq. 1) as follows (Lasslop and Kloster, 2017):
The default maximum fire duration (Eq. 2) was reduced from 720 to 138 min to better fit the reported number of fires and burnt areas in Finland (Statistics system of the Finnish rescue services' database PRONTO – Pelastustoimen resurssi- ja tilastojärjestelmä). PRONTO data were available from 2011 to 2018, and wildfires, except for those in fields, on grasslands, on roadsides, and in landfills, were selected. The observations were compared to the simulated data for the period 1991–2020. For the models, the 30-year average is more reliable than the shorter 8-year PRONTO period as the forcing data do not represent the conditions for any given year. The simulated number of fires was in line with the observed values for Finland, which has a low population density. At high population densities, i.e. in urban areas, the simulations underestimated the number of fires (Fig. A1a in Appendix A) and burnt areas (Fig. A1b) compared to observations.
2.3 Model domain and data analysis
The monthly or annual means for nine daily simulated fire variables (the FDI, the number of fires, burnt area, CO2 flux, gross primary production (GPP), litter flux, soil respiration, fuel, and fuel moisture) and three derived variables (start day, end day, and the number of days with a very high or extremely high FDI) are included in a dataset from Kinnunen et al. (2024). Distributions of fire-related variables were analysed and presented as maps. Additionally, in order to investigate the spatial differences in temporal dynamics in more detail, six example locations around the domain were chosen to be shown in a time series. The selected locations represented different vegetation zones: location I represented a northern boreal region, location II and location III represented middle boreal regions, location V represented a southern boreal region, and location IV and location VI represented hemiboreal–nemoral regions (Elmhagen et al., 2015). In the selected locations, the fractions of coniferous vegetation were at least 40 % (Fig. 1a).

Figure 1(a) The model domain, showing example locations and the corresponding fractions of coniferous vegetation. Location I is in northern Finland (67° N, 26° E; 0.728), location II is in central Sweden (62° N, 16° E; 0.832), location III is in central Finland (64° N, 25° E; 0.534), location IV is in southern Sweden (57° N, 15° E; 0.833), location V is in southern Finland (62° N, 28° E; 0.566), and location VI is in Estonia (59° N, 27° E; 0.401). (b) Average air temperature (degrees Celsius) for June, July, and August during the reference period of 1981–2010 across all climate projections. (c) Average precipitation sum (millimetres) for June, July, and August during the reference period of 1981–2010 across all climate projections.
The reference period (1981–2010) values were calculated as the average of all climate projections. This choice was made because the RCPs – and therefore the climate models – only started to deviate from 2006 onwards. In the summer months of June, July, and August (JJA), the multi-model average temperature in the domain was 10 °C, increasing from north to south and from west to east (Fig. 1b). The multi-model average precipitation sum for the summer months in the domain was 220 mm (Fig. 1c).
The data analysis and plots were generated using standard Python functions. The Mann–Kendall trend test (p≤0.05) was used to test for monotonic trends, as implemented in the “pyMannKendall” package (Hussain and Mahmud, 2019). The colour scales were selected from scientific colour maps (Crameri et al., 2020).
For each modelled grid point, multi-year averages were calculated for the summer months (JJA) for the FDI, air temperature, precipitation, fuel moisture, and the number of very high and extremely high FDI days. For ignition rates, the annual number of fires, and the burnt area, multi-year averages were calculated. Changes in the variables were presented as the differences between the averages for the period 2071–2100 and the reference period of 1981–2010. We calculated the mean of the average changes across the land grid points in the domain. The change in monthly climatologies (air temperature, precipitation, and GPP) was calculated as the difference between the periods 1981–2010 and 2071–2100 at six locations. The relative change was calculated as the ratio of the averages for each period, 2071–2100 and 1981–2010, for litter flux, soil respiration, and the amount of fuel. The relative CO2 flux change over time was calculated by comparing the 30-year moving average with the 1981–2010 mean value to smooth out annual variations and show the overall trend. Time series were created to analyse trends in the variables, such as the start and end dates of the fire season. The difference between the average start day and end day of the fire season was calculated to see whether the fire season had changed more at the beginning or the end of the season.
The largest increase in summer (JJA) temperatures (ca. 4–7 °C) is observed in the RCP 8.5 CanEMS2 scenario for the period 1981–2010 to 2071–2100 (Fig. A2). The summer temperature increase is larger in the northern study locations, e.g. location I, than in the southern area, e.g. location IV (Fig. A3). The change in summer precipitation varies regionally (Fig. A4). The highest precipitation increase (ca. 40 %) is observed in the RCP 8.5 CNRM-CM5 scenario. The change in monthly average precipitation from the period 1981–2010 to 2071–2100 varies significantly, depending on the climate projection and the location (Fig. A5). The average GPP during the summer months is greater during the 2071–2100 period than during the reference period of 1981–2010 (Fig. A6).
Litter flux and soil respiration increase, and the amount of fuel decreases for the years 2071–2100 compared to the reference period of 1981–2010 (shown for MIROC5 in Fig. A7). In many areas, projections suggest a decrease in the amount of fuel available for fires because the increase in soil respiration compensates for the increase in litter flux. Typically, relative fuel moisture (Fig. A8) is projected to decrease due to an increase in temperature (Fig. A2). This decrease in moisture leads to drier and more flammable fuel. An exception occurs under CNRM-CM5, where fuel moisture is expected to increase. Especially in the RCP 4.5 CNRM-CM5 scenario, fuel appears to be moister in the southern part of the simulated area. The CanESM2 global climate driver model has the highest temperature increase and projects the greatest decrease in relative fuel moisture.
3.1 Fire risk and season
The fire danger index (FDI) indicates fire risk (Fig. 2) and increases with decreasing fuel moisture (Fig. A8). The multi-model average FDI over the entire land area of the domain is 0.2 ± 0.08 for the period 1981–2010 (Fig. A9a). Over this period, there are, on average, 12 ± 6 d of very high or extremely high fire danger (FDI > 0.8) during the summer months (Fig. A9b). All simulations (except those driven by RCP 4.5 CNRM-CM5) forecast an increase in the probability of spreading fires in Fennoscandia during the summer months (JJA) from the period 1981–2010 to 2071–2100. The increase in the average FDI ranges from 0.05 ± 0.04 to 0.14 ± 0.03 (Fig. 2), and the increase in the number of days of very high or extremely high fire danger ranges from 4 ± 3 to 12 ± 3 d (Fig. A10), corresponding to the domain average by the end of the century.
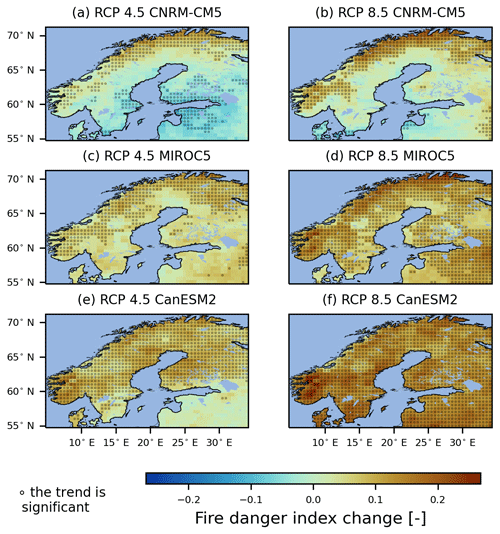
Figure 2Average changes in the fire danger index (unitless) for the summer months (JJA) from the reference period 1981–2010 to 2071–2100 under two climate change forcing scenarios and three global driver models. Red indicates an increase in the probability of spreading fires from ignition, while blue indicates a decrease. The dots indicate a significant trend according to the Mann–Kendall test (p ≤ 0.05).
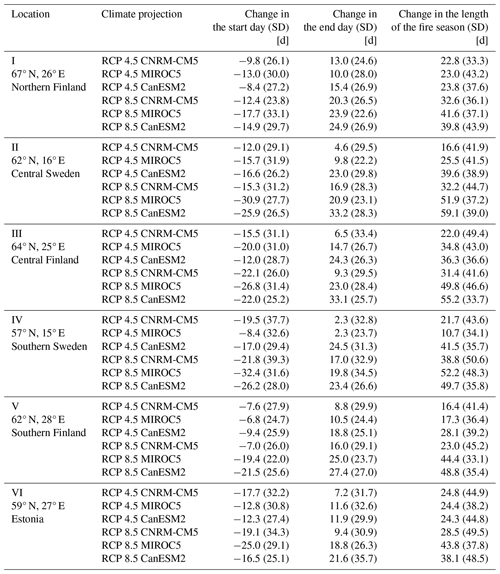
According to the study locations, the results for the average changes and their standard deviations (SDs) for the start day, the end day, and the length of the fire season (see Fig. 1a) are presented in Table B1 in Appendix B. The change in start date varies from −6.8 ± 24.7 to −32.4 ± 31.6 d, and the change in end date varies from 2.3 ± 23.7 to 33.2 ± 28.3 d. The lengthening of the fire season varies from 10.7 ± 34.1 to 59.1 ± 39.0 d. The start day of the fire season varies from day 88 to day 211 of the year, and the end day varies from day 197 to day 326 in the study locations (Fig. 3). The fire season is assumed to extend, starting at the earliest at the end of March (location IV) and ending at the latest in November (location VI). The trends in the fire season start and end dates are significant according to the Mann–Kendall trend test (p ≤ 0.05), with the exceptions of the start date under CNRM-CM5 at locations II and III and the end date at location IV. In the southern part, the fire season is longer, and its lengthening is more extensive than in the northern part.
During the reference period of 1981–2010, the length of the fire season ranges from 87 ± 36 to 92 ± 34 d when averaged over the model domain land area. The length of the fire season is projected to increase from 20 ± 7 to 52 ± 12 d on average across the entire model domain land area (Fig. A11). The fire season is estimated to extend from 10 ± 9 to 23 ± 11 d at the beginning of the fire season and from 10 ± 10 to 30 ± 16 d at the end of the fire season. When the average change in the start date of the fire season is greater than the change in the end date, the fire season length increases more at the beginning than at the end of the season. For example, in location I, the total lengthening of the fire season corresponds to 23 d in the RCP 4.5 CNRM-CM5 and RCP 4.5 MIROC5 scenarios, but the change is more considerable at the end of the season in the first case and at the beginning of the season in the second case (Table B1). The lengthening of the fire season is projected to primarily take place at the beginning of the season (affecting up to 71 % of grid points) in the CNRM-CM5 and MIROC5 global driver models and at end of the season (affecting up to 79 % of grid points) in the CanESM2 global driver model (Fig. A12).
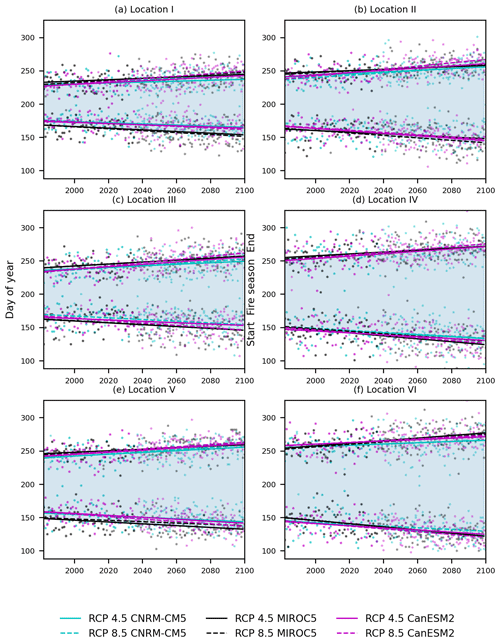
Figure 3Future change in the fire season. Yearly values are represented by dots, and the blue area between the trend lines for the start and end dates represents the fire season under two climate change forcing scenarios and three global driver models. Trends that are insignificant according to the Mann–Kendall trend test (p > 0.05) are not shown, i.e. the start of the fire season under CNRM-CM5 at locations II and III and the end at location IV. See the locations presented in Fig. 1a.
3.2 Number of fires and burnt area
The simulated human-caused-ignition rate depends on population density and exhibits spatial variation in the range of 0–0.0012 km−2 yr−1 (Fig. A13a). The lightning-caused-ignition rate has a maximum value of around 0.0002 km−2 yr−1 (Fig. A13b). The lightning-caused-ignition rate is, on average, 7 % of the total ignition rate. The average total ignition rate for 2071–2100 in the eastern part of the model domain decreases, and in the western part of the model domain, it increases compared to the reference period of 1981–2010 due to changes in the human-caused-ignition rate. The change in the total ignition rate ranges from −0.0005 to 0.0006 km−2 yr−1 and averages −0.00003 ± 0.00011 km−2 yr−1 (Fig. A13c).
The number of fires during the reference period (Fig. A9c) is 0.004 ± 0.003 km−2 yr−1, corresponding to a multi-model average over the entire domain, and increases, depending on the model, from 0.0006 ± 0.0007 to 0.003 ± 0.003 km−2 yr−1 by the end of the century. However, especially in CNRM-CM5, there are regions of significant decrease by the end of the century (Fig. 4). In Finland, the change in the number of fires ranges from −96 ± 616 to 1248 ± 632 fires per year or from −7 ± 4 % to 98 ± 56 % (Table 1). The simulated values for the average number of fires in Finland range from 1355 ± 509 to 1568 ± 556, matching the values of 1691 ± 799 observed in the PRONTO data (Table 2). The average number of fires per year is greater in the southern part than in the northern part of Finland, according to both the PRONTO data and the simulations (Fig. A14). The general pattern is the same, but the simulated values are more evenly distributed and do not increase as strongly with population density in cities.
Table 2The average number of fires in Finland during 2011–2018 (from PRONTO data) and 1991–2020 (from simulations).
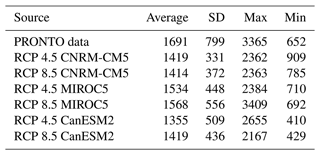
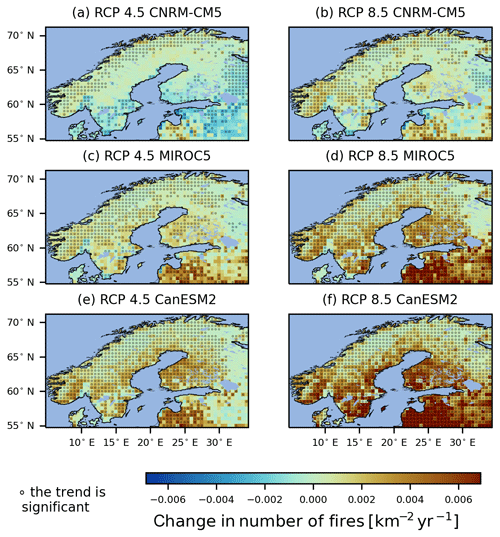
Figure 4The average change in the annual number of fires (km−2 yr−1) from the reference period 1981–2010 to 2071–2100 under two climate change forcing scenarios and three global driver models. The red colour indicates an increase in fires at the end of the century. The colour bar maximum is limited to show the most important patterns. The dots indicate a significant linear trend according to the Mann–Kendall test (p ≤ 0.05).
The multi-model average burnt area throughout the domain during the reference period is 0.02 ± 0.02 km2 yr−1 (Fig. A9d). The increase in the average burnt area by the end of the century ranges from 0.004 ± 0.005 to 0.02 ± 0.02 km2 yr−1, depending on the model (Fig. 5). Overall, the changes in the burnt area vary a lot between the model simulations and spatially, even within a single simulation. The greatest increase of up to around 0.05 km2 yr−1 takes place in the southern parts of the domain in the RCP 8.5 CanESM2 scenario, while the largest decrease of −0.02 km2 yr−1 is seen in the middle of the domain in the RCP 4.5 CNRM-CM5 scenario.
According to the simulations, the burnt area in Finland is estimated to change from −1.52 ± 4.59 to 5.66 ± 5.40 km2 or from −19 ± 24 % to 87 ± 42 % from the reference period to the end of the century (Table 3). This results in a net burnt area ranging from 6.55 ± 3.24 to 12.49 ± 5.20 km2 by the end of the century. The burnt area in the simulations ranges from 7.33 ± 3.77 to 10.73 ± 5.86 km2 in Finland. Compared to the PRONTO data (5.84 ± 3.93 km2), the simulations slightly overestimate the burnt area, but the dispersion interval covers the averages of the modelled values (Table 4).
Table 4Average burnt areas in Finland during 2011–2018 (from PRONTO data) and 1991–2020 (from simulations).
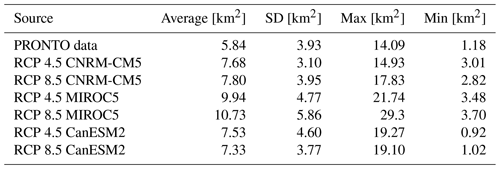
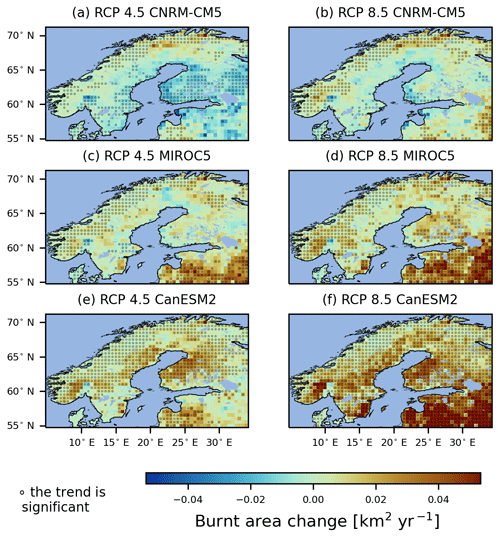
Figure 5Change in the annual average burnt area (km2 yr−1) from the reference period 1981–2010 to 2071–2100 under two climate change forcing scenarios and three global driver models. Red indicates an increase in burnt area. The colour bar maximum is limited to show the most important patterns. The dots indicate a significant linear trend according to the Mann–Kendall test (p ≤ 0.05).
The distribution of the average burnt area across 293 grid points located in Finland shows that the average annual burnt area per grid point is projected to increase from the period 1981–2010 to 2071–2100 (Fig. A15). This increase is seen in all simulations except the RCP 4.5 CNRM-CM5 scenario. The amount of emitted CO2 from fires follows the burnt area's spatial patterns (Fig. 5). The change in CO2 flux from 2010 to 2100, compared to the reference period (1981–2010), is highly non-linear, indicating either an increase or a decrease in CO2 emissions, depending on the climate driver and location (Fig. A16).
Our results indicate a lengthening of the fire season and an increase in the number of fires and the burnt area, even though the changes in magnitude and even the signs of the changes vary between different driving models and locations. In our simulations, temperature and precipitation changes are the leading causes of changes in forest fire occurrence in Fennoscandia, along with wind effects on the rate of spread. Veira et al. (2016) report that by the end of the century, there may be area-specific changes in forest fire activity due to interactions between climate conditions, population density, and land use. Land use changes were not accounted for. This does not have much impact on the results as, according to Zhou et al. (2021), forested areas have been relatively constant, showing changes in the most prominent land cover class of up to ± 5 %. Regarding the future, Hoffmann et al. (2023) report projected land cover changes of up to ± 10 % in most of Fennoscandia.
In our simulations, the slight overall decrease in the amount of fuel is a net effect of the increases in both soil respiration and litter flux. Our analyses suggest that in Fennoscandia, fuel availability is not the main limiting factor for fires. The increase in temperature reduces the moisture content of the fuel, making the fuel drier and more flammable. We observed that fuel moisture is the one of the main drivers of the increase in the simulated fire risk. According to Flannigan et al. (2009), the critical elements of fire occurrence and spread are fuel properties including type, continuity, structure, heterogeneity, moisture, and volume. The fuel load depends on the accumulation and decomposition of organic matter, both of which are affected by climate factors (Kilpeläinen et al., 2010). Moreover, the active management of fuel affects fires (North et al., 2012).
According to our study, the increase in the fire danger index generally indicates a higher probability of spreading fires by the end of the century. Nevertheless, under CNRM-CM5, we observed decreasing fire risk in the southern parts of the domain. In Finland, Lehtonen et al. (2014) project fire risk to increase by 10 %–40 % by the end of the century, depending on the climate scenario. Southern Sweden is projected to have a higher fire risk, while northern Sweden is projected to have a lower fire risk than today (Yang et al., 2015; Ramberg, 2020), which is contrary to our results, which show an increasing gradient from south to north. Our simulations indicate an increase from 4 ± 3 to 12 ± 3 d in the number of days of very high or extremely high fire danger. Mäkelä (2015) concludes that forest fire danger varies considerably from year to year, and the increase in fire danger days is projected to be 7–10 d by the end of the century in Finland. The realised change in the number of fires depends on many factors, but the potential for fires will increase due to changing climatological conditions (Mäkelä, 2015).
In our study, the projected increase in the average length of the fire season ranges from 20 ± 7 to 52 ± 12 d. This increase is in line with Veira et al. (2016), who argue that temperate and boreal fire seasons will, on average, become prolonged by 1–3 months under RCP 8.5, and with Flannigan et al. (2013), who speculate an increase of more than 20 d yr−1 in the length of the fire season at northern high latitudes. One reason for a longer fire season may be the shortened snow season, especially in southern Finland (Kilpeläinen et al., 2010). The impact of snow cover is not explicitly considered in our simulation. According to our simulations, the lengthening of the fire season is projected to occur primarily at the beginning of the season due to warmer and drier weather. In a warming world, fire seasons are expected to continue to lengthen in temperate and boreal regions (Flannigan et al., 2009).
In our simulations, the probability of lightning was prescribed with a daily climatology that does not include year-to-year variation. The number of days with thunderstorms and the average annual observed cloud-to-ground flash density do not show clear trends in Finland from 1887 to 2018 (Laurila and Mäkelä, 2019). However, Tuomi and Mäkelä (2008) observed large spatial and annual variations in flash density over the 1998–2007 period. The risk of lightning-ignited fires may vary from a 62 % decrease to a 38 % increase under RCP 6.0 in the polar regions from the 2010s to the 2090s, according to one study (Pérez-Invernón et al., 2023). Due to rising atmospheric instability, in the RCP 4.5 and RCP 8.5 scenarios, all model members predict relative changes in lightning frequency of between 5 % and 40 % for northern Europe until 2100 (Rädler et al., 2019). These variations in lightning frequency should be taken into account, even though their contribution to the total ignition rate is, on average, only 7 %. Because fires in Fennoscandia are caused mainly by humans (Mäkelä, 2015; Kilpeläinen et al., 2010) and the ignition rate in simulations is non-linearly dependent on population density, the impact of human ignition should also be further studied with respect to different population density scenarios. Our study demonstrates the potential impacts of climate change on fire season, the number of fires, and burnt area, even though JSBACH does not include all relevant aspects of human–nature interaction, such as active fire suppression, local landscape fragmentation, land use (e.g. roads), and lakes. Nevertheless, the fire duration limitation serves as a surrogate for fire suppression.
Our simulated annual number of fires in Finland is estimated to be in the range of 1355 ± 509 to 1568 ± 556 between 1991 and 2020, which is lower than the statistical value of 1691 ± 799 from the Finnish rescue services' PRONTO database. In the SPITFIRE model, the number of fires is constrained at high population density values, and the statistical value is determined based on emergency reports, encompassing all minor fires. We concluded that the yearly mean simulated burnt area in Finland ranges from 7.33 ± 3.77 to 10.73 ± 5.86 km2 for the period 1991–2020. The observed burnt area from 2011–2018 is smaller (5.84 ± 3.93 km2) due to effective fire detection, management, and extinguishing in Finland. As an average over a longer period and broader area, the values should be consistent with the statistical values, even though the simulations are based on scenario data and do not represent the weather conditions of an actual year. Lehtonen et al. (2016) point out that throughout Finland, fire risk, the number of large fires (>10 ha), and burnt area are increasing. However, due to the currently small fire area, one large fire can affect the statistics. Larger and more intense fires are expected in a future warmer world (Flannigan et al., 2013).
Previous studies show that the SPITFIRE model captures the response of burnt areas to precipitation well (Lasslop et al., 2018). There is considerable variation in fire occurrence between different times and regions due to changes in the natural and anthropogenic causes impacting the fires (Aakala et al., 2018; Flannigan et al., 2009). The calibration of the SPITFIRE model may be further improved by the use of observational datasets covering the entire domain and the subsequent tuning of model parameters. Changes in human activities and weather conditions cause uncertainty regarding fire risk prediction (Aalto and Venäläinen, 2021).
In this study, we studied projected changes in fire season, the number of fires, and burnt area across Fennoscandia from the reference period (1981–2010) to the end of the century (2071–2100) using ecosystem model simulations from 1951 to 2100.
The simulations suggest increased fire danger towards the end of the century due to drier – and thus more flammable – fuels. Increasing soil litter decomposition compensates for the increase in litter input, and less fuel may be available for fires. However, the decrease in fuel is not meaningful enough to limit the occurrence of spreading fires.
Our simulations suggest that the fire season is extended and that the lengthening of fire seasons happens primarily at the beginning of the season. Nevertheless, the spatio-temporal variations in the fire variables, depending on global climate driver models (CanESM2, MIROC5, and CNRM-CM5) and regions, imply uncertainty in the degree of change. The largest change in temperature leads to increased fire risk and causes more fires and a larger burnt area, whereas the largest increase in precipitation reduces fire risk, the number of fires, and the burnt area. Moreover, because human activity is the leading cause of fire ignition, our study pinpoints the need for the use of reliable human activity data in addition to improved climate scenario data.
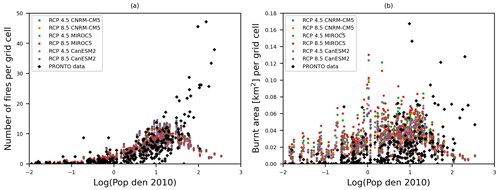
Figure A1Comparison of results from the SPITFIRE model and observations (Finnish rescue services' PRONTO database) for Finland. (a) Number of fires per grid cell and (b) burnt area (km2) per grid cell as functions of the logarithm of population density (pop den) for 2010. Annual averages are calculated for the period 1991–2020 for simulations and for 2011–2018 for PRONTO data.
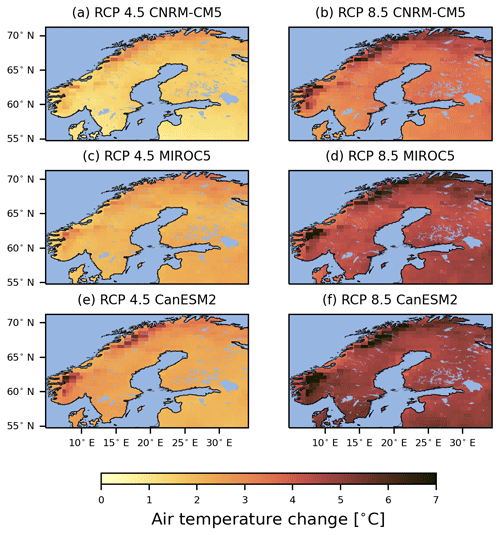
Figure A2Change in air temperature (degrees Celsius) during the summer months (JJA) from the period 1981–2010 to 2071–2100 under two climate change forcing scenarios and three climate global driver models. Yellow indicates an increase of around 1°C, and brown indicates an increase of around 6°C.
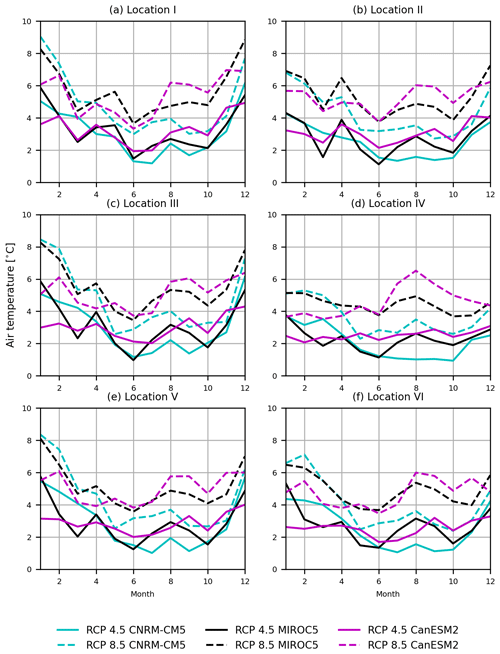
Figure A3Monthly change in average air temperature (degrees Celsius) from the period 1981–2010 to 2071–2100 at six locations (see the locations in Fig. 1). A positive value indicates an increase in temperature.
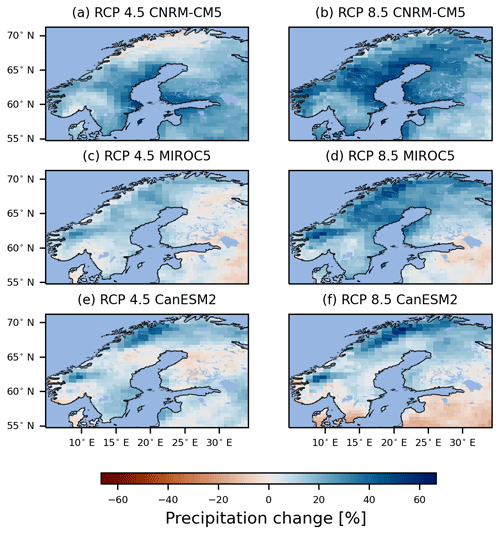
Figure A4Change in precipitation (percentage) during the summer months (JJA) from the period 1981–2010 to 2071–2100 under two climate change forcing scenarios and three global climate driver models. Blue (positive) indicates an increase, and red (negative) indicates a decrease.
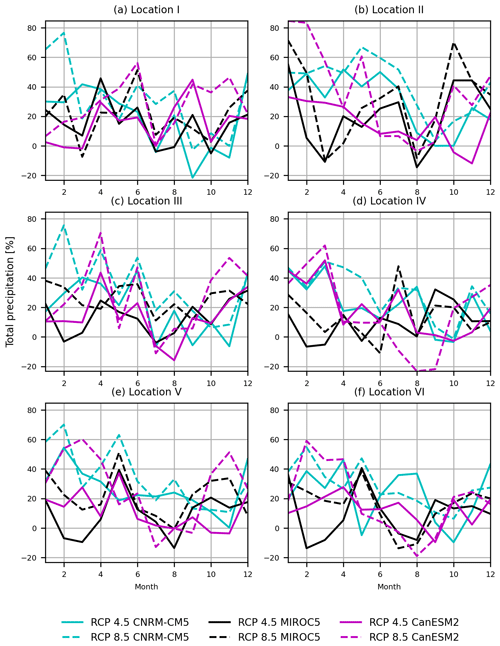
Figure A5Monthly change in average precipitation (percentage) from the reference period 1981–2010 to 2071–2100 at six locations (see Fig. 1). A positive value indicates an increase in precipitation.
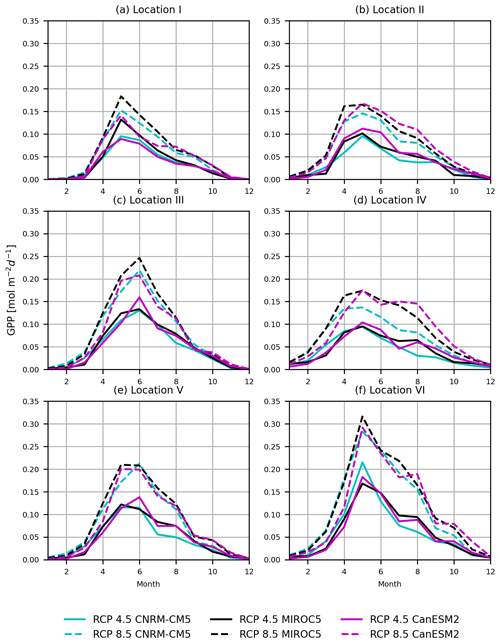
Figure A6Monthly change in average gross primary production (GPP) from the reference period 1981–2010 to 2071–2100 at six locations (see Fig. 1). GPP is summed over all plant functional types.
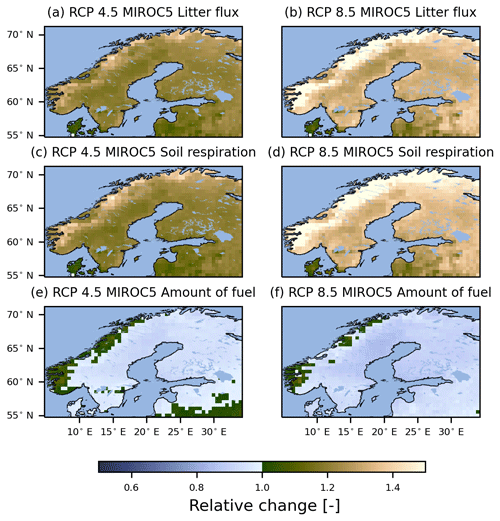
Figure A7Relative change (unitless) in litter flux (a, b), soil respiration (c, d), and amount of fuel (e, f) for the years 2071–2100 compared to the reference period of 1981–2010 under two climate change forcing scenarios and the MIROC5 global climate driver model. A value of less than 1 (blue) indicates a decrease, and a value of greater than 1 (brown) indicates an increase compared to the reference period.
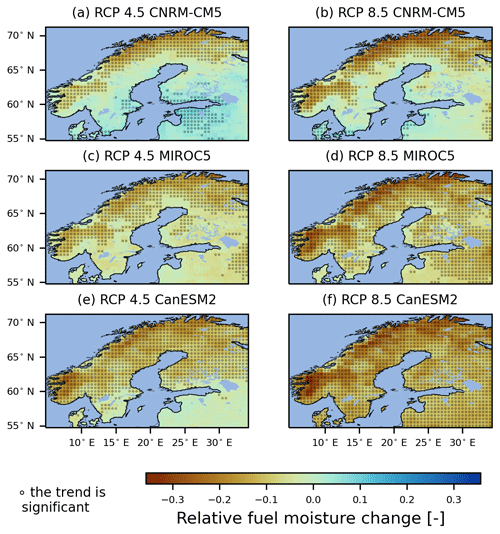
Figure A8Change in average relative fuel moisture (unitless) for the summer months (JJA) from the reference period 1981–2010 to 2071–2100 under two climate change forcing scenarios and three global climate driver models. Red indicates the presence of drier fuel in the future. The dots indicate a significant linear trend according to the Mann–Kendall test (p≤0.05).
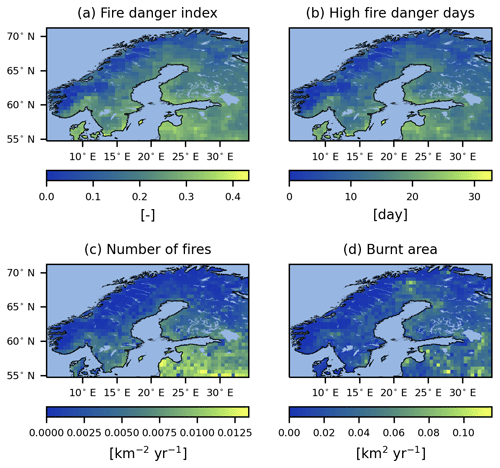
Figure A9Averages across all climate projections for the summer months with respect to (a) the fire danger index (unitless) and (b) the number of days of very high or extremely high fire danger (expressed in days) and for the annual period with respect to (c) the number of fires (km−2 yr−1) and (d) the burnt area (km2 yr−1) during the reference period of 1981–2010.
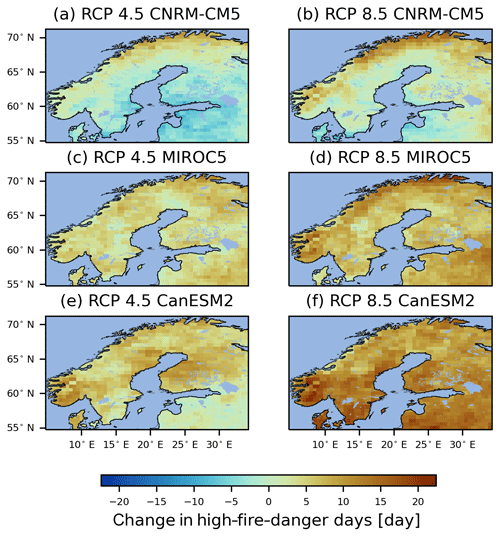
Figure A10Change in the number of days of very high and extremely high fire danger (expressed in days) from the reference period 1981–2010 to 2071–2100 during the summer months (JJA) under two climate change forcing scenarios and three global climate driver models. Brown indicates an increase in high-fire-risk days.
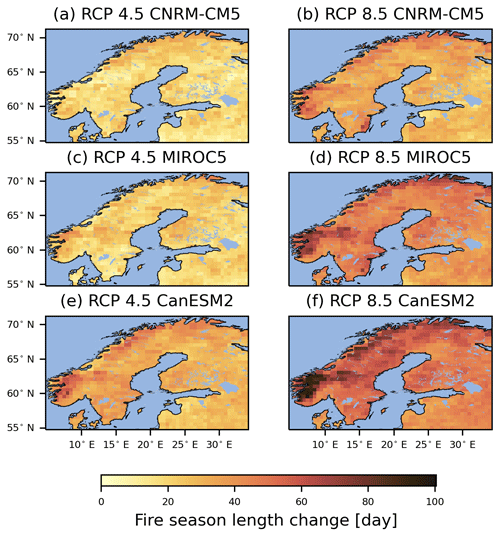
Figure A11Change in the average length of the fire season (expressed in days) from the reference period 1981–2010 to 2071–2100 under two climate change forcing scenarios and three global climate driver models.
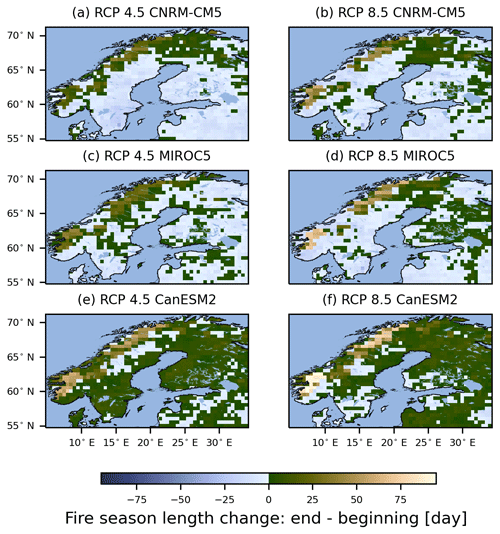
Figure A12Difference in lengthening at the beginning and end of the fire season (expressed in days) from the reference period 1981–2010 to 2071–2100 under two climate change forcing scenarios and three global climate driver models. Negative values (blue) indicate that the fire season is lengthening more at the beginning than at the end of the season.
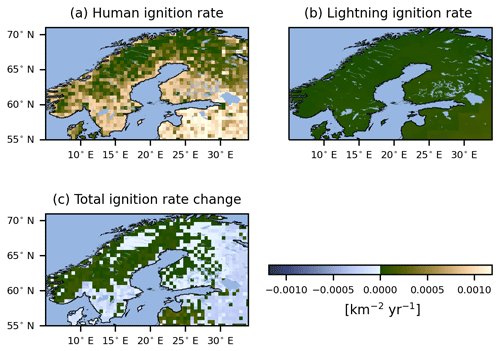
Figure A13Annual average ignition rates (km−2 yr−1) caused by (a) humans and (b) lightning during the reference period of 1981–2010. (c) Total ignition rate change from the reference period 1981–2010 to 2071–2100. Light blue indicates the presence of fewer ignitions in the future.
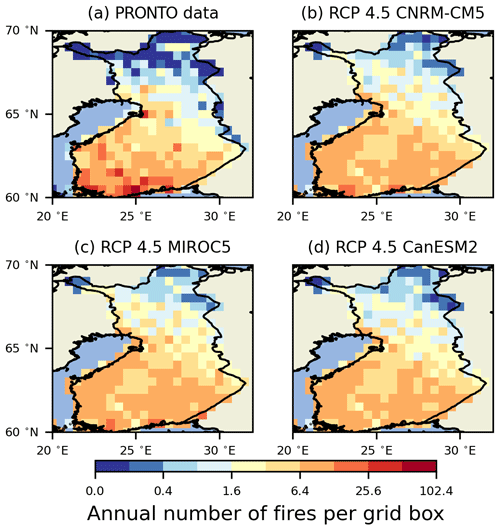
Figure A14The average number of fires per year in Finland based on PRONTO data and RCP 4.5 for CNRM-CM5, MIROC5, and CanESM2 on a non-linear scale. Yearly means were calculated for the period 2011–2018 for PRONTO data and for the period 1991–2020 for simulations.
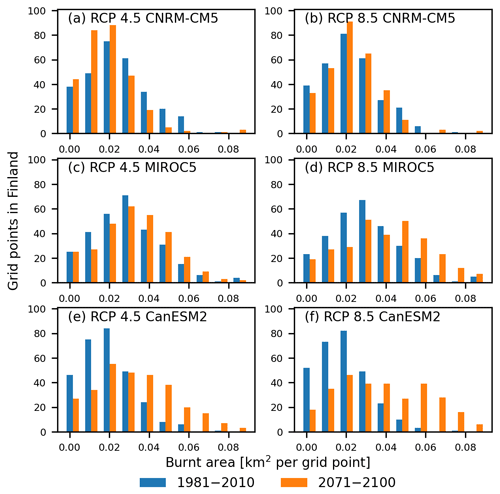
Figure A15Distributions of annual average burnt areas (km2 per grid point) during 1981–2010 (blue) and 2071–2100 (orange) for Finland under two climate change forcing scenarios and three global climate driver models.
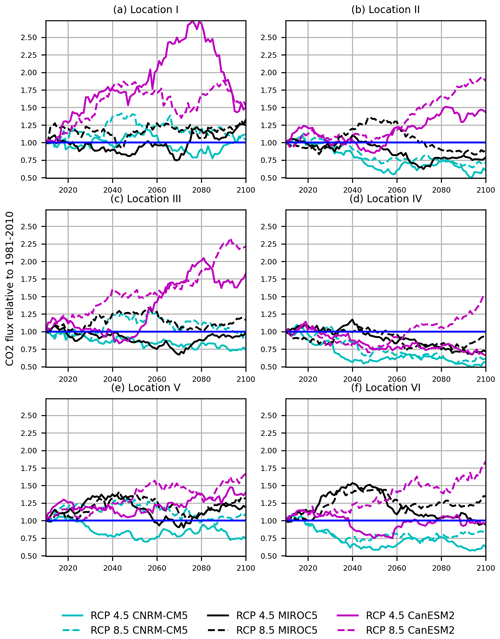
Figure A16Relative change in CO2 flux from fires (unitless) from the reference period 1981–2010 to 2071–2100. In each location (Fig. 1a), the developments under the climate change forcing scenarios RCP 4.5 (continuous line) and RCP 8.5 (dashed line) are illustrated using the global climate driver models CNRM-CM5 (cyan), MIROC5 (black), and CanESM2 (magenta). A value above 1 indicates an increase, a value below 1 indicates a decrease, and a value of 1 indicates no change compared to the reference period.
Table B1Average changes from the period 1981–2010 to 2071–2100 and their standard deviations for the start day, the end day, and the length of the fire season with respect to six locations (see Fig. 1) under two climate change forcing scenarios and three global climate driver models.
Data are available at https://doi.org/10.57707/FMI-B2SHARE.07695381224049C78BD35198D27AAA25 (Kinnunen et al., 2024).
OK prepared the paper, with contributions from all co-authors. LB is responsible for the JSBACH ecosystem model simulations. OK performed the data analysis and produced the graphics and tables, with contributions from co-authors. JA and TA contributed to the design of the study. TM coordinated the study.
The contact author has declared that none of the authors has any competing interests.
Publisher's note: Copernicus Publications remains neutral with regard to jurisdictional claims made in the text, published maps, institutional affiliations, or any other geographical representation in this paper. While Copernicus Publications makes every effort to include appropriate place names, the final responsibility lies with the authors.
We are thankful to the Finnish rescue services for helping us retrieve information from the PRONTO database.
This work is part of the ACCC Flagship programme (grant no. 337552) and is funded by the project “Forest fires in Fennoscandia under changing climate and forest cover” (LVM/IL, Luke, Pelastusopisto) as part of the Ministry for Foreign Affairs of Finland's IBA funding scheme and by the project “Evaluating integrated spatially explicit carbon-neutrality for boreal landscapes and regions” from the Research Council of Finland (grant no. 347860).
This paper was edited by David McLagan and reviewed by two anonymous referees.
Aakala, T., Pasanen, L., Helama, S., Vakkari, V., Drobyshev, I., Seppä, H., Kuuluvainen, T., Stivrins, N., Wallenius, T., Vasander, H., and Holmström, L.: Multiscale variation in drought controlled historical forest fire activity in the boreal forests of eastern Fennoscandia, Ecol. Monogr., 88, 74–91, https://doi.org/10.1002/ecm.1276, 2018. a, b
Aalto, J. and Venäläinen, A. (Eds.): Climate change and forest management affect forest fire risk in Fennoscandia, Finnish Meteorological Institute, Reports 2021:3, http://hdl.handle.net/10138/330898 (last access: 30 October 2024), 2021. a, b, c, d
Carmody, C.: Development and Structure of the Canadian Forest Fire Behaviour Predictions Systems, Forestry Canada Fire Danger Group, Scientific Sustainable Development Directory, Ottawa, Ont. Inf. Rep. ST-X-3, Ministery of Supply and Service Canada, https://ostrnrcan-dostrncan.canada.ca/handle/1845/235421 (last access: 30 October 2024), 1992. a
Cecil, D. J.: LIS/OTD 0.5 Degree High Resolution Monthly Climatology (HRMC) [2.3.2015, data set], NASA Global Hydrology Resource Center DAAC, Huntsville, Alabama, USA, https://ghrc.nsstc.nasa.gov/hydro/details/lohrmc NASA (last access: 1 December 2023), Global Hydrology Resource Center, https://doi.org/10.5067/LIS/LIS-OTD/DATA303, 2016. a
Crameri, F., Shephard, G., and Heron, P.: The misuse of colour in science communication, Nat. Commun., 11, 5444, https://doi.org/10.1038/s41467-020-19160-7, 2020. a
de Groot, W. J., Flannigan, M. D., and Cantin, A. S.: Climate change impacts on future boreal fire regimes, Forest Ecol. Manage., 294, 35–44, https://doi.org/10.1016/j.foreco.2012.09.027, 2013. a
Descals, A., Gaveau, D. L. A., Verger, A., Sheil, D., Naito, D., and Peñuelas, J.: Unprecedented fire activity above the Arctic Circle linked to rising temperatures, Science, 378, 532–537, https://doi.org/10.1126/science.abn9768, 2022. a
Earth System Grid Federation Data Node: Cordex Dataset, Earth System Grid Federation Data Node [data set], https://esgf-data.dkrz.de/search/cordex-dkrz/ (last access: 27 February 2020), 2020. a
Elmhagen, B., Kindberg, J., and Hellström, P.: A boreal invasion in response to climate change? Range shifts and community effects in the borderland between forest and tundra, AMBIO, 44, 39–50, https://doi.org/10.1007/s13280-014-0606-8, 2015. a
Engelmark, O.: Boreal forest disturbances, in: Ecosystems of disturbed ground, edited by: Walker, L. R., chap. 6, 161–186, Elsevier, 1999. a
European Environment Agency: Corine Land Cover (CLC) 2012, Version 2020_20u1, European Environment Agency [data set], https://land.copernicus.eu/pan-european/corine-land-cover/clc-2012 (last access: 12 June 2020), 2020. a
European Space Agency: Land cover classification gridded maps from 1992 to present derived from satellite observations, Copernicus Climate Data Store [data set], https://cds.climate.copernicus.eu/cdsapp#!/dataset/satellite-land-cover (last access: 30 March 2020), 2019. a
Flannigan, M., Krawchuk, M., Wotton, M., and Johnston, L.: Implications of changing climate for global wildland fire, Int. J. Wildland Fire, 18, 483–507, https://doi.org/10.1071/WF08187, 2009. a, b, c, d, e, f, g, h, i, j
Flannigan, M., Cantin, M., Groot, A., Wotton, W., Newbery, M., and Johnston, L.: Global wildland fire season severity in the 21st century, Forest Ecol. Manage., 294, 64–71, https://doi.org/10.1016/j.foreco.2012.10.022, 2013. a, b
Goll, D. S., Brovkin, V., Liski, J., Raddatz, T., Thum, T., and Todd-Brown, K. E. O.: Strong dependence of CO2 emissions from anthropogenic land cover change on initial land cover and soil carbon parametrization, Global Biogeochem. Cy., 29, 1511–1523, https://doi.org/10.1002/2014GB004988, 2015. a
Gromtsev, A.: Natural Disturbance Dynamics in the Boreal Forests of European Russia: a Review, Silva Fennica, 36, 549, https://doi.org/10.14214/sf.549, 2002. a
Hagemann, S. and Stacke, T.: Impact of the soil hydrology scheme on simulated soil moisture memory, Clim. Dynam., 44, 1731–1750, https://doi.org/10.1007/s00382-014-2221-6, 2015. a
Hantson, S., Lasslop, G., Kloster, S., and Chuvieco, E.: Anthropogenic effects on global mean fire size, Int. J. Wildland Fire, 24, 589–596, https://doi.org/10.1071/WF14208, 2015. a
Hoffmann, P., Reinhart, V., Rechid, D., de Noblet-Ducoudré, N., Davin, E. L., Asmus, C., Bechtel, B., Böhner, J., Katragkou, E., and Luyssaert, S.: High-resolution land use and land cover dataset for regional climate modelling: historical and future changes in Europe, Earth Syst. Sci. Data, 15, 3819–3852, https://doi.org/10.5194/essd-15-3819-2023, 2023. a
Hussain, M. and Mahmud, I.: pyMannKendall: a python package for non parametric Mann Kendall family of trend tests, J. Open Source Softw., 4, 1556, https://doi.org/10.21105/joss.01556, 2019. a
IPCC: Climate Change 2014: Synthesis Report, Contribution of Working Groups I, II and III to the Fifth Assessment Report of the Intergovernmental Panel on Climate Change, edited by: Core Writing Team, Pachauri, R. K., and Meyer, L. A., IPCC, Geneva, Switzerland https://www.ipcc.ch/report/ar5/syr/ (last access: 30 October 2024), 2014. a
Jacob, D., Petersen, J., Eggert, B., Alias, A., Christensen, O., Bouwer, L., Braun, A., Colette, A., Déqué, M., Georgievski, G., Georgopoulou, E., Gobiet, A., Menut, L., Nikulin, G., Haensler, A., Hempelmann, N., Jones, C., Keuler, K., Kovats, S., Kröner, N., Kotlarski, S., Kriegsmann, A., Martin, E., van Meijgaard, E., Moseley, C., Pfeifer, S., Preuschmann, S., Radermacher, C., Radtke, K., Rechid, D., Rounsevell, M., Samuelsson, P., Somot, S., Soussana, J.-F., Teichmann, C., Valentini, R., Vautard, R., Weber, B., and Yiou, P.: EURO-CORDEX: new high-resolution climate change projections for European impact research, Reg. Environ. Change, 14, 563–578, 2014. a, b
Jolly, W., Cochrane, M., and Freeborn, P.: Climate-induced variations in global wildfire danger from 1979 to 2013, Nat. Commun., 6, 7537, https://doi.org/10.1038/ncomms8537, 2015. a
Jones, B. and O'Neill, B.: Global One-Eighth Degree Population Base Year and Projection Grids Based on the Shared Socioeconomic Pathways, Revision 01, Palisades, NY, NASA Socioeconomic Data and Applications Center (SEDAC) [data set], accessed 18 May 2020, https://doi.org/10.7927/m30p-j498, 2016. a
Kaminski, T., Knorr, W., Schürmann, G., Scholze, M., Rayner, P. J., Zaehle, S., Blessing, S., Dorigo, W., Gayler, V., Giering, R., Gobron, N., Grant, J. P., Heimann, M., Hooker-Stroud, A., Houweling, S., Kato, T., Kattge, J., Kelley, D., Kemp, S., Koffi, E. N., Köstler, C., Mathieu, P.-P., Pinty, B., Reick, C. H., Rödenbeck, C., Schnur, R., Scipal, K., Sebald, C., Stacke, T., van Scheltinga, A. T., Vossbeck, M., Widmann, H., and Ziehn, T.: The BETHY/JSBACH Carbon Cycle Data Assimilation System: experiences and challenges, J. Geophys. Res.-Biogeo., 118, 1414–1426, https://doi.org/10.1002/jgrg.20118, 2013. a
Kaplan, J. and New, M.: Arctic climate change with a 2 °C global warming: Timing, climate patterns and vegetation change, Climatic Change, 79, 213–241, https://doi.org/10.1007/s10584-006-9113-7, 2006. a
Kilpeläinen, A., Kellomäki, S., Strandman, H., and Venäläinen, A.: Climate change impacts on forest fire potential in boreal conditions in Finland, Climatic Change, 103, 383–398, https://doi.org/10.1007/s10584-009-9788-7, 2010. a, b, c, d, e
Kinnunen, O., Backman, L., and Markkanen, T.: Data for manuscript “Projected changes in forest fire season, number of fires and burnt area in Fennoscandia by the 2100” by Kinnunen et al., Finnish Meteorological Institute [data set], https://doi.org/10.57707/FMI-B2SHARE.07695381224049C78BD35198D27AAA25, version 1, 2024. a, b
Klein Goldewijk, K., Beusen, A., Doelman, J., and Stehfest, E.: Anthropogenic land use estimates for the Holocene – HYDE 3.2, Earth Syst. Sci. Data, 9, 927–953, https://doi.org/10.5194/essd-9-927-2017, 2017. a
Kulmala, L., Aaltonen, H., Berninger, F., Kieloaho, A.-J., Levula, J., Bäck, J., Hari, P., Kolari, P., Korhonen, J. F., Kulmala, M., Nikinmaa, E., Pihlatie, M., Vesala, T., and Pumpanen, J.: Changes in biogeochemistry and carbon fluxes in a boreal forest after the clear-cutting and partial burning of slash, Ag. Forest Meteorol., 188, 33–44, https://doi.org/10.1016/j.agrformet.2013.12.003, 2014. a
Kuuluvainen, T.: Natural Variability of Forests as a Reference for Restoring and Managing Biological Diversity in Boreal Fennoscandia, Silva Fennica, 36, 552, https://doi.org/10.14214/sf.552, 2002. a
Larjavaara, M., Kuuluvainen, T., and Rita, H.: Spatial distribution of lightning-ignited forest fires in Finland, Forest Ecol. Manage., 208, 177–188, https://doi.org/10.1016/j.foreco.2004.12.005, 2005a. a, b
Larjavaara, M., Pennanen, J., and Tuomi, T.: Lightning that ignites forest fires in Finland, Agr. Forest Meteorol., 132, 171–180, https://doi.org/10.1016/j.agrformet.2005.07.005, 2005b. a
Lasslop, G. and Kloster, S.: Human impact on wildfires varies between regions and with vegetation productivity, Environ. Res. Lett., 12, 115011, https://doi.org/10.1088/1748-9326/aa8c82, 2017. a, b
Lasslop, G., Thonicke, K., and Kloster, S.: SPITFIRE within the MPI Earth system model: Model development and evaluation, J. Adv. Model. Earth Sy., 6, 740–755, https://doi.org/10.1002/2013MS000284, 2014. a, b, c
Lasslop, G., Moeller, T., D'Onofrio, D., Hantson, S., and Kloster, S.: Tropical climate–vegetation–fire relationships: multivariate evaluation of the land surface model JSBACH, Biogeosciences, 15, 5969–5989, https://doi.org/10.5194/bg-15-5969-2018, 2018. a, b
Laurila, T. K. and Mäkelä, A.: Thunderstorm observations in Finland – historical observations since 1887, FMI's Climate Bulletin: Research Letters, 1, 4, https://doi.org/10.35614/ISSN-2341-6408-IK-2019-13-RL, 2019. a
Lehtonen, I., Ruosteenoja, K., Venäläinen, A., and Gregow, H.: The projected 21st century forest-fire risk in Finland under different greenhouse gas scenarios, Boreal Environ. Res., 19, 127–139, https://www.researchgate.net/publication/285955800_The_projected_21st_century_forest-fire_risk_in_Finland_under_different_greenhouse_gas_scenarios (last access: 30 October 2024), 2014. a
Lehtonen, I., Venäläinen, A., Kämäräinen, M., Peltola, H., and Gregow, H.: Risk of large-scale fires in boreal forests of Finland under changing climate, Nat. Hazards Earth Syst. Sci., 16, 239–253, https://doi.org/10.5194/nhess-16-239-2016, 2016. a, b
Mauritsen, T., Bader, J., Becker, T., Behrens, J., Bittner, M., Brokopf, R., Brovkin, V., Claussen, M., Crueger, T., Esch, M., Fast, I., Fiedler, S., Fläschner, D., Gayler, V., Giorgetta, M., Goll, D. S., Haak, H., Hagemann, S., Hedemann, C., Hohenegger, C., Ilyina, T., Jahns, T., Jimenéz-de-la Cuesta, D., Jungclaus, J., Kleinen, T., Kloster, S., Kracher, D., Kinne, S., Kleberg, D., Lasslop, G., Kornblueh, L., Marotzke, J., Matei, D., Meraner, K., Mikolajewicz, U., Modali, K., Möbis, B., Müller, W. A., Nabel, J. E. M. S., Nam, C. C. W., Notz, D., Nyawira, S.-S., Paulsen, H., Peters, K., Pincus, R., Pohlmann, H., Pongratz, J., Popp, M., Raddatz, T. J., Rast, S., Redler, R., Reick, C. H., Rohrschneider, T., Schemann, V., Schmidt, H., Schnur, R., Schulzweida, U., Six, K. D., Stein, L., Stemmler, I., Stevens, B., von Storch, J.-S., Tian, F., Voigt, A., Vrese, P., Wieners, K.-H., Wilkenskjeld, S., Winkler, A., and Roeckner, E.: Developments in the MPI-M Earth System Model version 1.2 (MPI-ESM1.2) and Its Response to Increasing CO2, J. Adv. Model. Earth Sy., 11, 998–1038, https://doi.org/10.1029/2018MS001400, 2019. a
Moritz, M. A., Parisien, M.-A., Batllori, E., Krawchuk, M. A., Van Dorn, J., Ganz, D. J., and Hayhoe, K.: Climate change and disruptions to global fire activity, Ecosphere, 3, 1–22, https://doi.org/10.1890/ES11-00345.1, 2012. a
Mäkelä, A., Enno, S.-E., and Haapalainen, J.: Nordic Lightning Information System: Thunderstorm climate of Northern Europe for the period 2002–2011, Atmos. Res., 139, 46–61, https://doi.org/10.1016/j.atmosres.2014.01.008, 2014. a
Mäkelä, H.: Estimates of past and future forest fire danger in Finland from a climatological viewpoint, PhD thesis, University of Helsinki, Faculty of Science, Department of Physics, http://hdl.handle.net/10138/153233 (last access: 16 October 2023), 2015. a, b, c, d, e, f, g
Mäkipää, R., Abramoff, R., Adamczyk, B., Baldy, V., Biryol, C., Bosela, M., Casals, P., Yuste, J. C., Dondini, M., Filipek, S., Garcia-Pausas, J., Gros, R., Gömöryová, E., Hashimoto, S., Hassegawa, M., Immonen, P., Laiho, R., Li, H., Li, Q., Luyssaert, S., Menival, C., Mori, T., Naudts, K., Santonja, M., Smolander, A., Toriyama, J., Tupek, B., Ubeda, X., Verkerk, P. J., and Lehtonen, A.: How does management affect soil C sequestration and greenhouse gas fluxes in boreal and temperate forests?: A review, Forest Ecol. Manage., 539, 120637, https://doi.org/10.1016/j.foreco.2022.120637, 2023. a, b, c
North, M., Collins, B., and Stephens, S.: Using Fire to Increase the Scale, Benefits, and Future Maintenance of Fuels Treatments, J. Forestry, 110, 392–401, https://doi.org/10.5849/jof.12-021, 2012. a
Onderka, M. and Melicherčik, I.: Fire-prone areas delineated from a combination of the Nesterov Fire-risk Rating Index with multispectral satellite data, Appl. Geomat., 2, 1–7, https://doi.org/10.1007/s12518-009-0014-0, 2010. a
Pierce, E.: Latitudinal Variation of Lightning Parameters, J. Appl. Meteorol., 9, 194–195, https://doi.org/10.1175/1520-0450(1970)009<0194:LVOLP>2.0.CO;2, 1970. a
Pérez-Invernón, F., Gordillo-Vázquez, F., Huntrieser, H., and Jöckel, P.: Variation of lightning-ignited wildfire patterns under climate change., Nat. Commun., 14, 739, https://doi.org/10.1038/s41467-023-36500-5, 2023. a
Ramberg, E.: The role of fire in the boreal forests of Fennoscandia: Past, present and future. Introductory Research Essay, Department of Ecology, Swedish University of Agricultural Sciences, https://res.slu.se/id/publ/104591 (last access: 4 March 2023), 2020. a, b, c, d, e, f
Ramberg, E., Strengbom, J., and Granath, G.: Coordination through databases can improve prescribed burning as a conservation tool to promote forest biodiversity, Ambio, 47, 298–306, https://doi.org/10.1007/s13280-017-0987-6, 2018. a, b
Reick, C. H., Gayler, V., Goll, D., Hagemann, S., Heidkamp, M., Nabel, J., Raddatz, T., Roeckner, E., Schnur, R., and Wilkenskjeld, S.: JSBACH 3 – The land component of the MPI Earth System Model: Documentation of version 3.2, Berichte zur Erdsystemforschung, MPG PuRe, https://doi.org/10.17617/2.3279802, 2021. a, b
Rothermel, R.: A mathematical model for predicting fire spread in wildland fuels, Res. Pap. INT-115. Ogden, UT: U.S. Department of Agriculture, Forest Service, Intermountain Forest and Range Experiment Station, 40 pp., https://research.fs.usda.gov/treesearch/32533 (last access: 30 October 2024), 1972. a
Running, S. W., Nemani, R. R., and Hungerford, R. D.: Extrapolation of synoptic meteorological data in mountainous terrain and its use for simulating forest evapotranspiration and photosynthesis, Can. J. Forest Res., 17, 472–483, https://doi.org/10.1139/x87-081, 1987. a
Ruosteenoja, K., Jylhä, K., and Kämäräinen, M.: Climate projections for Finland under the RCP forcing scenarios, Geophysica, 51, 17–50, 2016. a
Rädler, A., Groenemeijer, P., Faust, E., Sausen, R., and Púčik, T.: Frequency of severe thunderstorms across Europe expected to increase in the 21st century due to rising instability, npj Climate and Atmospheric Science, 2, 30, https://doi.org/10.1038/s41612-019-0083-7, 2019. a
Samuelsson, P., Jones, C. G., Willén, U., Ullerstig, A., Gollvik, S., Hansson, U., Jansson, E., Kjellström, C., Nikulin, G., and Wyser, K.: The Rossby Centre Regional Climate model RCA3: model description and performance, Tellus A, 63, 4–23, https://doi.org/10.1111/j.1600-0870.2010.00478.x, 2011. a
Thonicke, K., Spessa, A., Prentice, I. C., Harrison, S. P., Dong, L., and Carmona-Moreno, C.: The influence of vegetation, fire spread and fire behaviour on biomass burning and trace gas emissions: results from a process-based model, Biogeosciences, 7, 1991–2011, https://doi.org/10.5194/bg-7-1991-2010, 2010. a, b, c, d, e, f
Tolonen, K. and Pitkänen, A.: Kulojen toistuvuus ja merkitys jääkauden jälkeisenä aikana Suomessa, Metsätieteen aikakauskirja 2/2004, 224–228, https://doi.org/10.14214/ma.6252, 2004. a
Tuomi, T. and Mäkelä, A.: Thunderstorm Climate of Finland 1998–2007, Geophysica, 44, 67–80, 2008. a
Turetsky, M. R., Harden, J. W., Friedli, H. R., Flannigan, M., Payne, N., Crock, J., and Radke, L.: Wildfires threaten mercury stocks in northern soils, Geophys. Res. Lett., 33, L16403, https://doi.org/10.1029/2005GL025595, 2006. a
Vajda, A., Venäläinen, A., Suomi, I., Junila, P., and Mäkelä, H.: Assessment of forest fire danger in a boreal forest environment: Description and evaluation of the operational system applied in Finland, Meteorol. Appl., 21, 879–887, https://doi.org/10.1002/met.1425, 2014. a, b
van Vuuren, D., Edmonds, J., Kainuma, M., Riahi, K., Thomson, A., Hibbard, K., Hurtt, G., Kram, T., Krey, V., Lamarque, J., Masui, T., Meinshausen, M., Nakicenovic, N., Smith, S., and Rose, S.: The representative concentration pathways: an overview, Climatic Change 109, 5–31, https://doi.org/10.1007/s10584-011-0148-z, 2011. a
Veira, A., Lasslop, G., and Kloster, S.: Wildfires in a warmer climate: Emission fluxes, emission heights, and black carbon concentrations in 2090–2099, J. Geophys. Res.-Atmos., 121, 3195–3223, https://doi.org/10.1002/2015JD024142, 2016. a, b
Venäläinen, A., Lehtonen, I., Laapas, M., Ruosteenoja, K., Tikkanen, O.-P., Viiri, H., Ikonen, V.-P., and Peltola, H.: Climate change induces multiple risks to boreal forests and forestry in Finland: A literature review, Global Change Biology, 26, 4178–4196, https://doi.org/10.1111/gcb.15183, 2020. a, b
Venevsky, S., Thonicke, K., Sitch, S., and Cramer, W.: Simulating fire regimes in human-dominated ecosystems: Iberian Peninsula case study, Glob. Change Biol., 8, 984–998, https://doi.org/10.1046/j.1365-2486.2002.00528.x, 2002. a
Xu, J., Morris, P. J., Liu, J., and Holden, J.: PEATMAP: Refining estimates of global peatland distribution based on a meta-analysis, University of Leeds [data set], https://doi.org/10.5518/252, 2017. a
Yang, W., Andréasson, J., Phil Graham, L., Olsson, J., Rosberg, J., and Wetterhall, F.: Distribution-based scaling to improve usability of regional climate model projections for hydrological climate change impacts studies, Hydrol. Res., 41, 211–229, https://doi.org/10.2166/nh.2010.004, 2010. a
Yang, W., Gardelin, M., Olsson, J., and Bosshard, T.: Multi-variable bias correction: application of forest fire risk in present and future climate in Sweden, Nat. Hazards Earth Syst. Sci., 15, 2037–2057, https://doi.org/10.5194/nhess-15-2037-2015, 2015. a
Zhou, N., Hu, X., Byskov, I., Næss, J. S., Wu, Q., Zhao, W., and Cherubini, F.: Overview of recent land cover changes, forest harvest areas, and soil erosion trends in Nordic countries, Geography and Sustainability, 2, 163–174, https://doi.org/10.1016/j.geosus.2021.07.001, 2021. a


