the Creative Commons Attribution 4.0 License.
the Creative Commons Attribution 4.0 License.
 | 15 Feb 2024
The effect of forest cover changes on the regional climate conditions in Europe during the period 1986–2015
Marcus Breil
Vanessa K. M. Schneider
Joaquim G. Pinto
Afforestation affects the earth's climate system by changing the biogeochemical and biogeophysical characteristics of the land surface. While the regional effects of afforestation are well understood in the tropics and the high latitudes, its climate impact on the midlatitudes is still the subject of scientific discussions. The general impact of afforestation on the regional climate conditions in Europe during the last decades is investigated in this study. For this purpose, regional climate simulations are performed with different forest cover fractions over Europe. In a first simulation, afforestation in Europe is considered, while this is not the case for a second simulation. We focus on the years 1986–2015, a period in which the forest cover in Europe increased comparatively strongly, accompanied by a strong general warming over the continent.
Results show that afforestation has both local and non-local effects on the regional climate system in Europe. Due to an increased transport of turbulent heat (latent + sensible) into the atmosphere, afforestation leads to a significant reduction of the mean local surface temperatures in summer. In northern Europe, mean local surface temperatures were reduced about −0.3 K with afforestation, in central Europe about −0.5 K, and in southern Europe about −0.8 K. During heat periods, this local cooling effect can reach −1.9 K. In winter, afforestation results in a slight local warming in both northern and southern Europe because of the albedo effect of forests. However, this effect is rather small and the mean temperature changes are not significant. In the downwind direction, locally increased evapotranspiration rates with afforestation increase the general cloud cover, which results in a slight non-local warming in winter in several regions of Europe, particularly during cold spells. Thus, afforestation had a discernible impact on the climate change signal in Europe during the period 1986–2015, which may have mitigated the general warming trend in Europe, especially on the local scale in summer.
- Article
(7290 KB) - Full-text XML
-
Supplement
(360 KB) - BibTeX
- EndNote


Afforestation is one of the most frequently debated strategies to mitigate the impacts of the anthropogenic climate change (Sonntag et al., 2016; Harper et al., 2018; Roe et al., 2019) because forests are able to remove large amounts of CO2 from the atmosphere during their growth and store the carbon long term in their biomass (Luyssaert, et al., 2010; Pan et al., 2011). Besides this beneficial biogeochemical effect on the global greenhouse effect, afforestation is also changing the biogeophysical characteristics of the land surface (Pielke et al., 2011; Bright et al., 2017). For instance, the evapotranspiration potential of forests is generally higher than of other vegetation types (Zhang et al., 2001) due to higher biomass and a deeper root system. Thus, a comparatively large part of the incoming solar radiation is transformed into latent heat instead of heating up the land surface (Strandberg and Kjellström, 2019). This effect of afforestation is particularly relevant in regions with large amounts of available energy for evapotranspiration, like the tropics. Therefore, afforestation is known to have a regional cooling effect in the tropics (Lawrence and Vandecar, 2015; Zeppetello et al., 2020).
On the other hand, the surface albedo of forests is lower in comparison to other vegetation types (Bonan, 2008). A larger part of the incoming solar radiation is absorbed, and thus more energy is available to heat up the land surface. This albedo effect is further intensified by the presence of snow, since forests are only partially masked by snow, while other vegetation types are completely covered and reflect more solar radiation (Essery, 2013). The snow-masking effect is therefore especially important in the high latitudes, where the land surface is covered with snow over a large part of the year. Afforestation consequently has a regional warming effect in the high latitudes (Bala et al., 2007; Li et al., 2015; Duveiller et al., 2018).
In the midlatitudes, both the increased turbulent heat transport (sensible + latent) and the albedo effect are relevant (Bonan, 2008). In this geographical area, solar radiation is sufficiently available, and thus the albedo effect has a major impact on the regional climate conditions. In addition, the energy and water supplies are generally high in the midlatitudes, and the increased evaporative potential with afforestation consequently has an important effect on the surface energy balance. The question of whether afforestation leads to a warming or a cooling of the regional climate conditions in Europe is therefore the subject of current research and scientific discussions (e.g., Breil et al., 2023a).
Recent studies indicate that afforestation in Europe leads to a warming in winter due to the snow-masking effect of forests (Lejeune et al., 2017; Davin et al., 2020). In this season, large parts of the land surface are covered with snow in the midlatitudes, and thus more solar radiation is absorbed by forests than by other vegetation types. In summer, surface temperatures are generally reduced, while boundary layer temperatures are increased with afforestation (Breil et al., 2020). Because of the higher surface roughness of forests in comparison to other vegetation types, the increased solar radiation with afforestation is efficiently transformed into sensible heat and transported away from the surface into the atmosphere (Lee et al., 2011; Burakowski et al., 2018). Atmospheric temperatures are consequently increased, and surface temperatures are reduced, although more solar radiation is absorbed (Breil et al., 2020). Moreover, the commonly higher evapotranspiration rates of forests increase the moisture content in the atmosphere and can therefore increase downwind precipitation sums in Europe (Meier et al., 2021).
These effects of afforestation in the midlatitudes are generally derived either from point measurements of adjacent eddy covariance stations in forests and grasslands (e.g., Lee et al., 2011), from satellite data (e.g., Li et al., 2015), from coarsely resolved global climate simulations (e.g., Bala et al., 2007), or from idealized modeling studies (e.g., Davin et al., 2020). However, it is not possible on the basis of these methods to quantify the effects of afforestation on the regional climate conditions in the midlatitudes. Although satellite data provide a high spatial coverage, they are not suitable to analyze the underlying land–atmosphere interactions. Such interactions can be investigated with point measurements of flux towers, but the arising atmospheric feedback processes cannot be analyzed with such observations. While all these processes can be simulated with global climate models, the spatial resolution of these simulations is generally too low to investigate all relevant processes in the necessary detail. Although regional climate simulations have higher resolution, regional climate models until now, to our knowledge, have only been applied in idealized afforestation scenarios (e.g., Davin et al., 2020; Breil et al., 2020). The actual effects of afforestation on the regional climate conditions in Europe are therefore not yet comprehensively analyzed. This is especially the case for the impact of afforestation on the European climate trend since the 1980s. During this period, the strongest temperature increase in the last 2000 years took place (Gulev et al., 2021), while at the same time, the forest cover increased comparatively strongly.
Therefore, the goal of this study is to quantify how strongly afforestation affected the regional climate conditions during this period of intense regional warming in Europe by considering the actual afforestation between 1986 and 2015 in higher-resolved simulations with a regional climate model (RCM). In this RCM experiment, a simulation is performed in which all land use changes during this 30-year period (including afforestation) are implemented and compared to an RCM simulation in which afforestation is not considered. In this way, we are able to explicitly quantify the impact of afforestation on the recent climate conditions in Europe and analyze whether afforestation regionally counteracted the general climate trend by, e.g., an increased evapotranspiration rate and an enhanced turbulent heat exchange or if the increased absorption of solar radiation with afforestation even intensified the regional climate trend in Europe.
The design of the modeling experiment is described in Sect. 2. In Sect. 3, the local (Sect. 3.1) and non-local (Sect. 3.2) effects of afforestation on the climate conditions in Europe are assessed, with a special focus on extremes (Sect. 3.3) and climate variability (Sect. 3.4). Results are discussed in Sect. 4 and conclusions are drawn in Sect. 5.
2.1 Model simulations
In the framework of this study, regional climate simulations with the RCM COSMO-CLM (CCLM, Rockel et al., 2008) coupled to the land surface model VEG3D (Breil and Schädler, 2021) are used to analyze the impact of afforestation on the regional climate conditions in Europe between 1986 and 2015. The simulations are performed for the Coordinated Downscaling Experiment – European Domain (EURO-CORDEX; Jacob et al., 2014) at a horizontal resolution of 0.11∘ (∼ 12.5 km). The simulations are driven by the ERA5 reanalysis (Hersbach et al., 2020) at the lateral boundaries and the lower boundary over sea. The simulation period is 1986–2015, with a spin-up of 7 years before 1986.
During the first simulation, yearly updated land use maps of the land cover conditions in Europe are implemented in CCLM-VEG3D in which all historical land use changes between 1986 and 2015 are considered, excluding afforestation (Fig. 1a). This experiment constitutes the reference simulation (REF). In the second simulation, the same land use dataset is used as in REF, but now afforested areas are additionally implemented (AFF). Figure 1b shows all grid cells in which afforestation took place between 1986 and 2015.
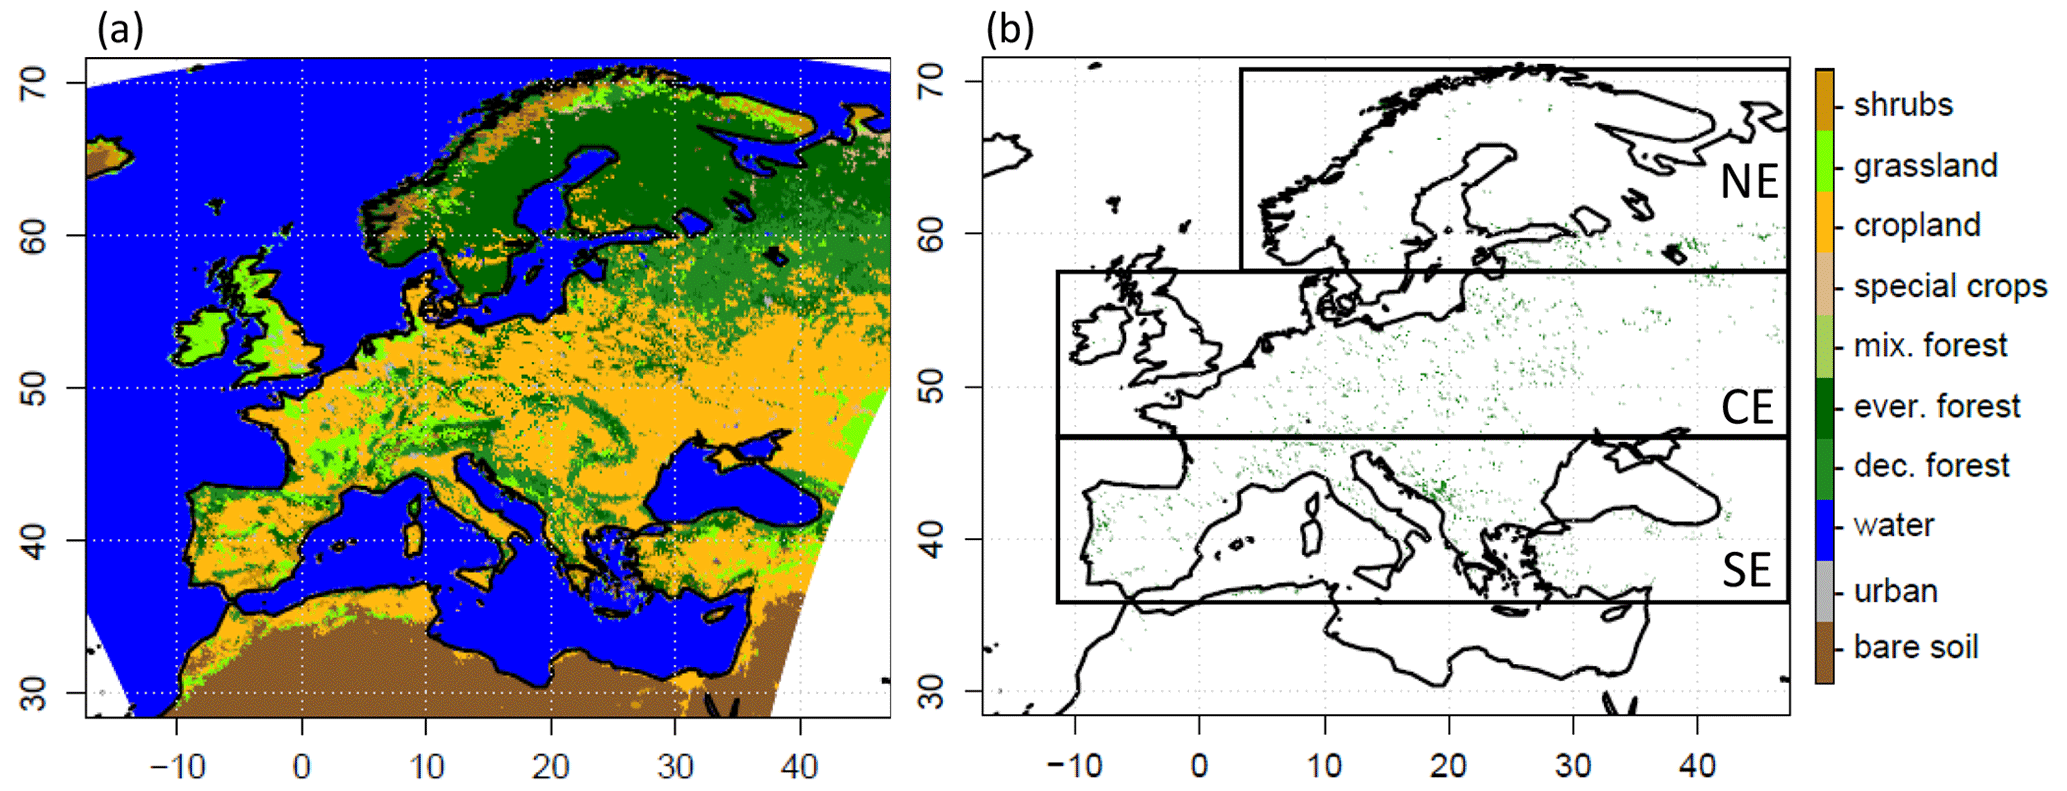
Figure 1(a) CCLM-VEG3D land use classes. (b) Grid cells in which afforestation took place between 1986 and 2015 in the AFF simulation. The black boxes show the locations of the three geographical subregions, northern Europe (NE), central Europe (CE), and southern Europe (SE).
The underlying land use dataset was developed within the Land Use and Climate Across Scales (LUCAS) project (Davin et al., 2020) based on the European Space Agency Climate Change Initiative Land Cover (ESA-CCI LC) dataset (European Space Agency, 2017). The yearly changes in the land use map during the simulation period are derived from the Land-Use Harmonization 2 (LUH2) dataset (Hurtt et al., 2020). More information on how the applied land use map was constructed can be found in Hoffmann et al. (2023).
In CCLM-VEG3D, only the dominant land use class in a grid cell is considered. Thus, afforestation is only considered in our model setup in grid cells in which forest is becoming the dominant land use class. The land use information in these grid cells is then completely assigned to forest. Although the spatial resolution of the grid cells is rather small in our modeling experiment, this results in an overestimation of the forest fraction in afforested grid cells. In return, afforested areas in which forest is not the dominant land use class are not considered and the forest fraction is consequently underestimated in the model.
By comparing the results of the AFF simulation with the results of the REF simulation, the effects of afforestation on the regional climate conditions in Europe during the simulation period are assessed. For the analysis, we differentiate between local effects and non-local effects. As local effects, we define changes in the climate conditions in a grid cell in which afforestation took place. A non-local effect is defined as a change in the climate conditions in non-afforested areas, which is indirectly caused by changes in the surface energy balance in afforested grid cells. The statistical significance of the temperature changes in AFF in comparison to REF is calculated with a Wilcoxon rank-sum test, a nonparametric statistical test analyzing the differences between two paired datasets.
Beside the effects of afforestation on the general climate conditions in Europe, we also investigate its impact on climate extremes and the interannual climate variability. Changes in heat extreme intensities are expressed as differences in the days above the 90th percentile of the daily maximum temperatures in 2 m height in summer (JJA). In this context, we define the heat period intensities as the mean daily maximum 2 m temperature for these warmest 10 % of summer days and compare these mean values for AFF and REF with each other. Changes in cold extreme intensities are expressed as differences in the mean daily maximum 2 m temperature for the coldest 10 % of winter days (DJF). Effects on the climate variability are analyzed by calculating the standard deviation of the mean seasonal surface temperatures.
2.2 Afforested areas
According to the land use dataset derived in the LUCAS project (Hoffmann et al., 2023), about 1.1 % of the land mass in the EURO-CORDEX domain was afforested during the period 1986–2015. By converting this land use change information into CCLM-VEG3D with its dominant land use class approach, about 1.7% of the CCLM-VEG3D model domain was afforested. These land use changes were not homogeneous and evenly distributed, but were carried out on small scales and in isolated locations. In Fig. 1, all regions in CCLM-VEG3D are shown which were afforested during the 30-year period in Europe. Larger areas were afforested in the Balkan region and central and northeastern Europe, while in Scandinavia and southeastern Europe almost no afforestation took place. All over Europe, 63 % of the afforested areas were converted from croplands and 31 % from grasslands.
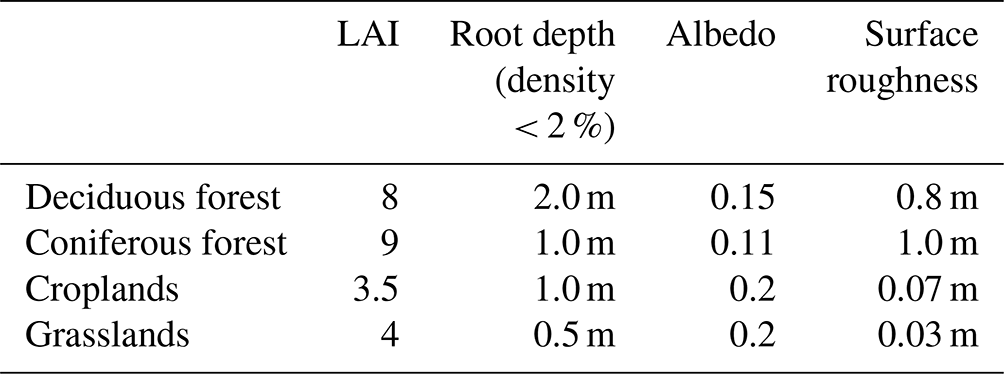
The main differences in the vegetation characteristics between different forest types and croplands and grasslands are summarized in Table 1. While the surface albedo of forests is lower and the surface roughness is higher, croplands and grasslands are characterized by a shallow root system and a lower leaf area index (LAI). In this context, the vegetation characteristics of different deciduous tree species (e.g., beech, oak) and different coniferous tree species (pine, spruce, etc.) are all combined into one representative forest class. This means that for the different vegetation parameters describing the characteristics of these different tree species, the mean values over the parameter space of the respective deciduous and coniferous trees are used. In CCLM-VEG3D, therefore, only one deciduous forest class and one coniferous forest class are considered. For the deciduous forest class, only deciduous broadleaved trees are taken into account, while in the coniferous forest class, only evergreen needle-leaved trees are included. Evergreen broadleaved trees (e.g., Mediterranean oaks) or deciduous needle-leaved trees (e.g., larch) are consequently not considered.
Table 1Maximum parameter values of the surface roughness, leaf area index (LAI), surface albedo, and root depth used in CCLM-VEG3D for deciduous forests, coniferous forests, croplands, and grasslands.
First, we analyze the capability of CCLM-VEG3D to reproduce the general climate conditions in Europe. Figure 2 shows the differences between the reference simulation (REF) and the ERA5-Land reanalysis (Muñoz-Sabater et al., 2021) for (a) the yearly mean 2 m temperatures and (b) the yearly total precipitation sums during the period 1986–2015.
A warm bias is simulated over most parts of Europe in the reference simulation, extending from southern Europe over central Europe to eastern Europe. However, these deviations from ERA5-Land are in the same range as the biases of other RCMs, as demonstrated by Kotlarski et al. (2014). Regarding northern Europe and the British Isles, the simulation results agree well with the reanalysis data.
Total precipitation sums are underestimated in CCLM-VEG3D in southern and western Europe, but overestimated in eastern and parts of northern Europe (shown as a percent deviation in Fig. 2). This is also true for the mountainous regions of the Pyrenees and the Alps. On the other hand, the simulated precipitation sums agree well with the reanalysis data over large parts of central and eastern Europe as well as of southern Scandinavia. Thus, the results of CCLM-VEG3D reflect the already known precipitation pattern of regional climate simulations with CCLM (Kotlarski et al., 2014).
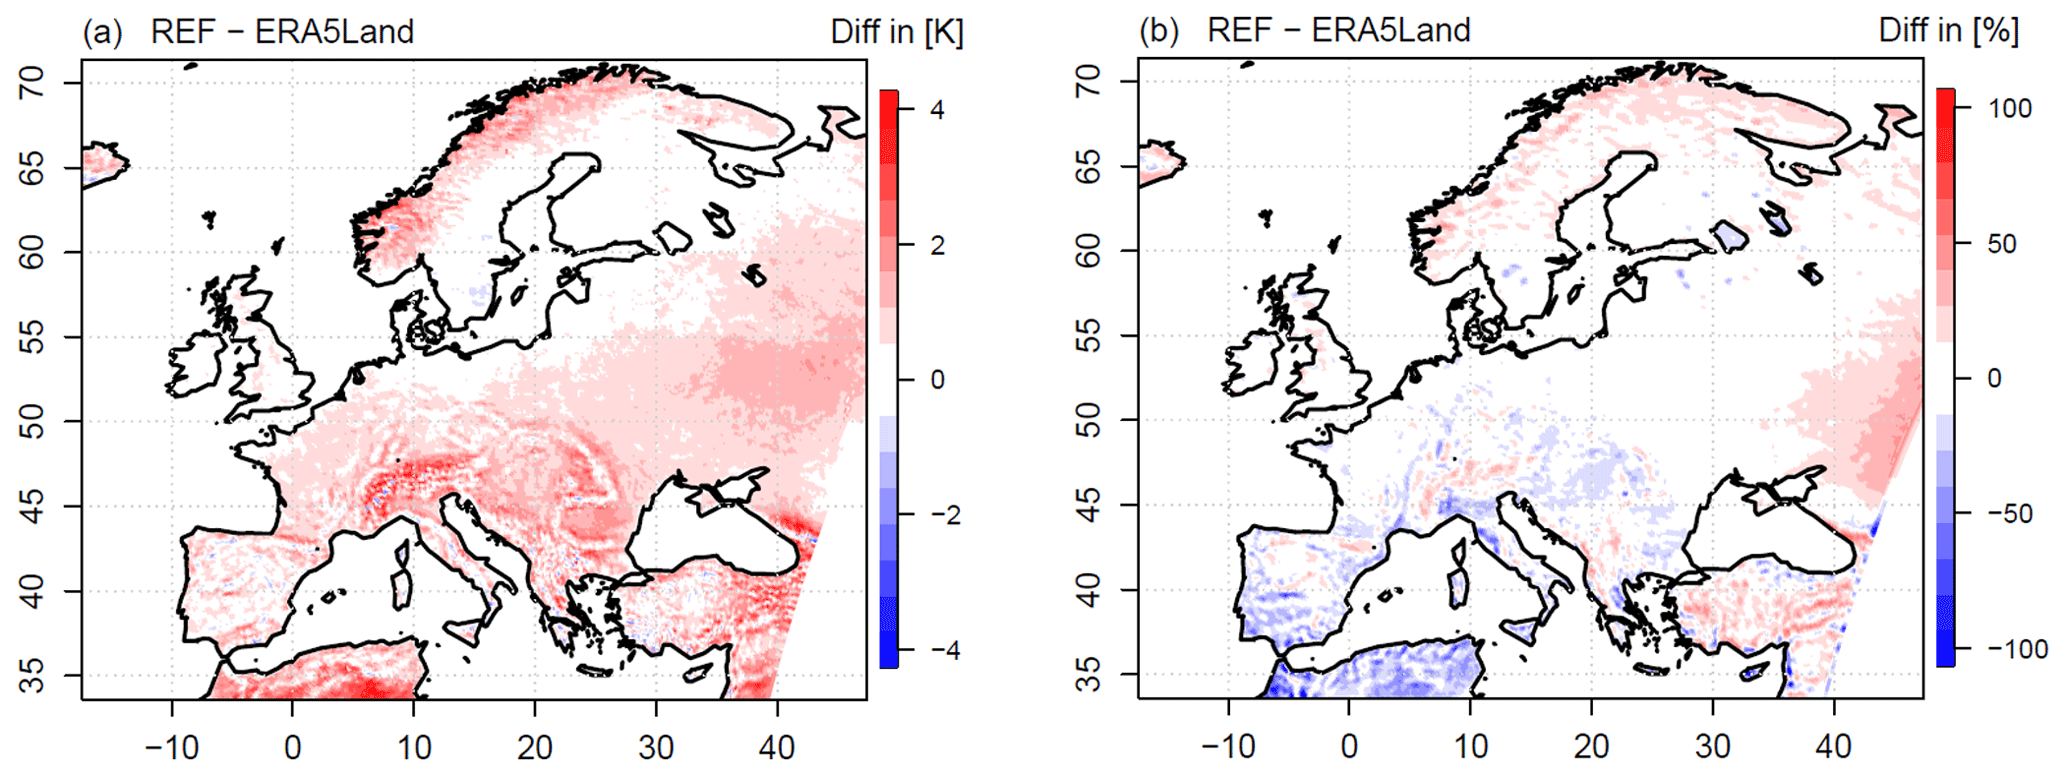
Figure 2Differences in the (a) yearly mean 2 m temperature and (b) the percentage deviation in the yearly mean total precipitation sums between REF and the ERA5-Land reanalysis for the period 1986–2015.
Therefore, although a certain model bias for the simulated 2 m temperature and the total precipitation sums is found, the simulation results of CCLM-VEG3D are comparable with the results of other RCMs (Kotlarski et al., 2014) and we conclude that the model is generally able to reproduce the general climate conditions in Europe.
3.1 Local effects
3.1.1 Winter
The local effects of afforestation in Europe on different components of the surface energy balance are analyzed for the period 1986–2015 (Fig. 3). Since afforestation in Europe took place only on small scales and in isolated locations, local effects are summarized for three geographical subregions, northern Europe (NE), central Europe (CE), and southern Europe (SE), for visualization purposes, which are highlighted in Fig. 1.
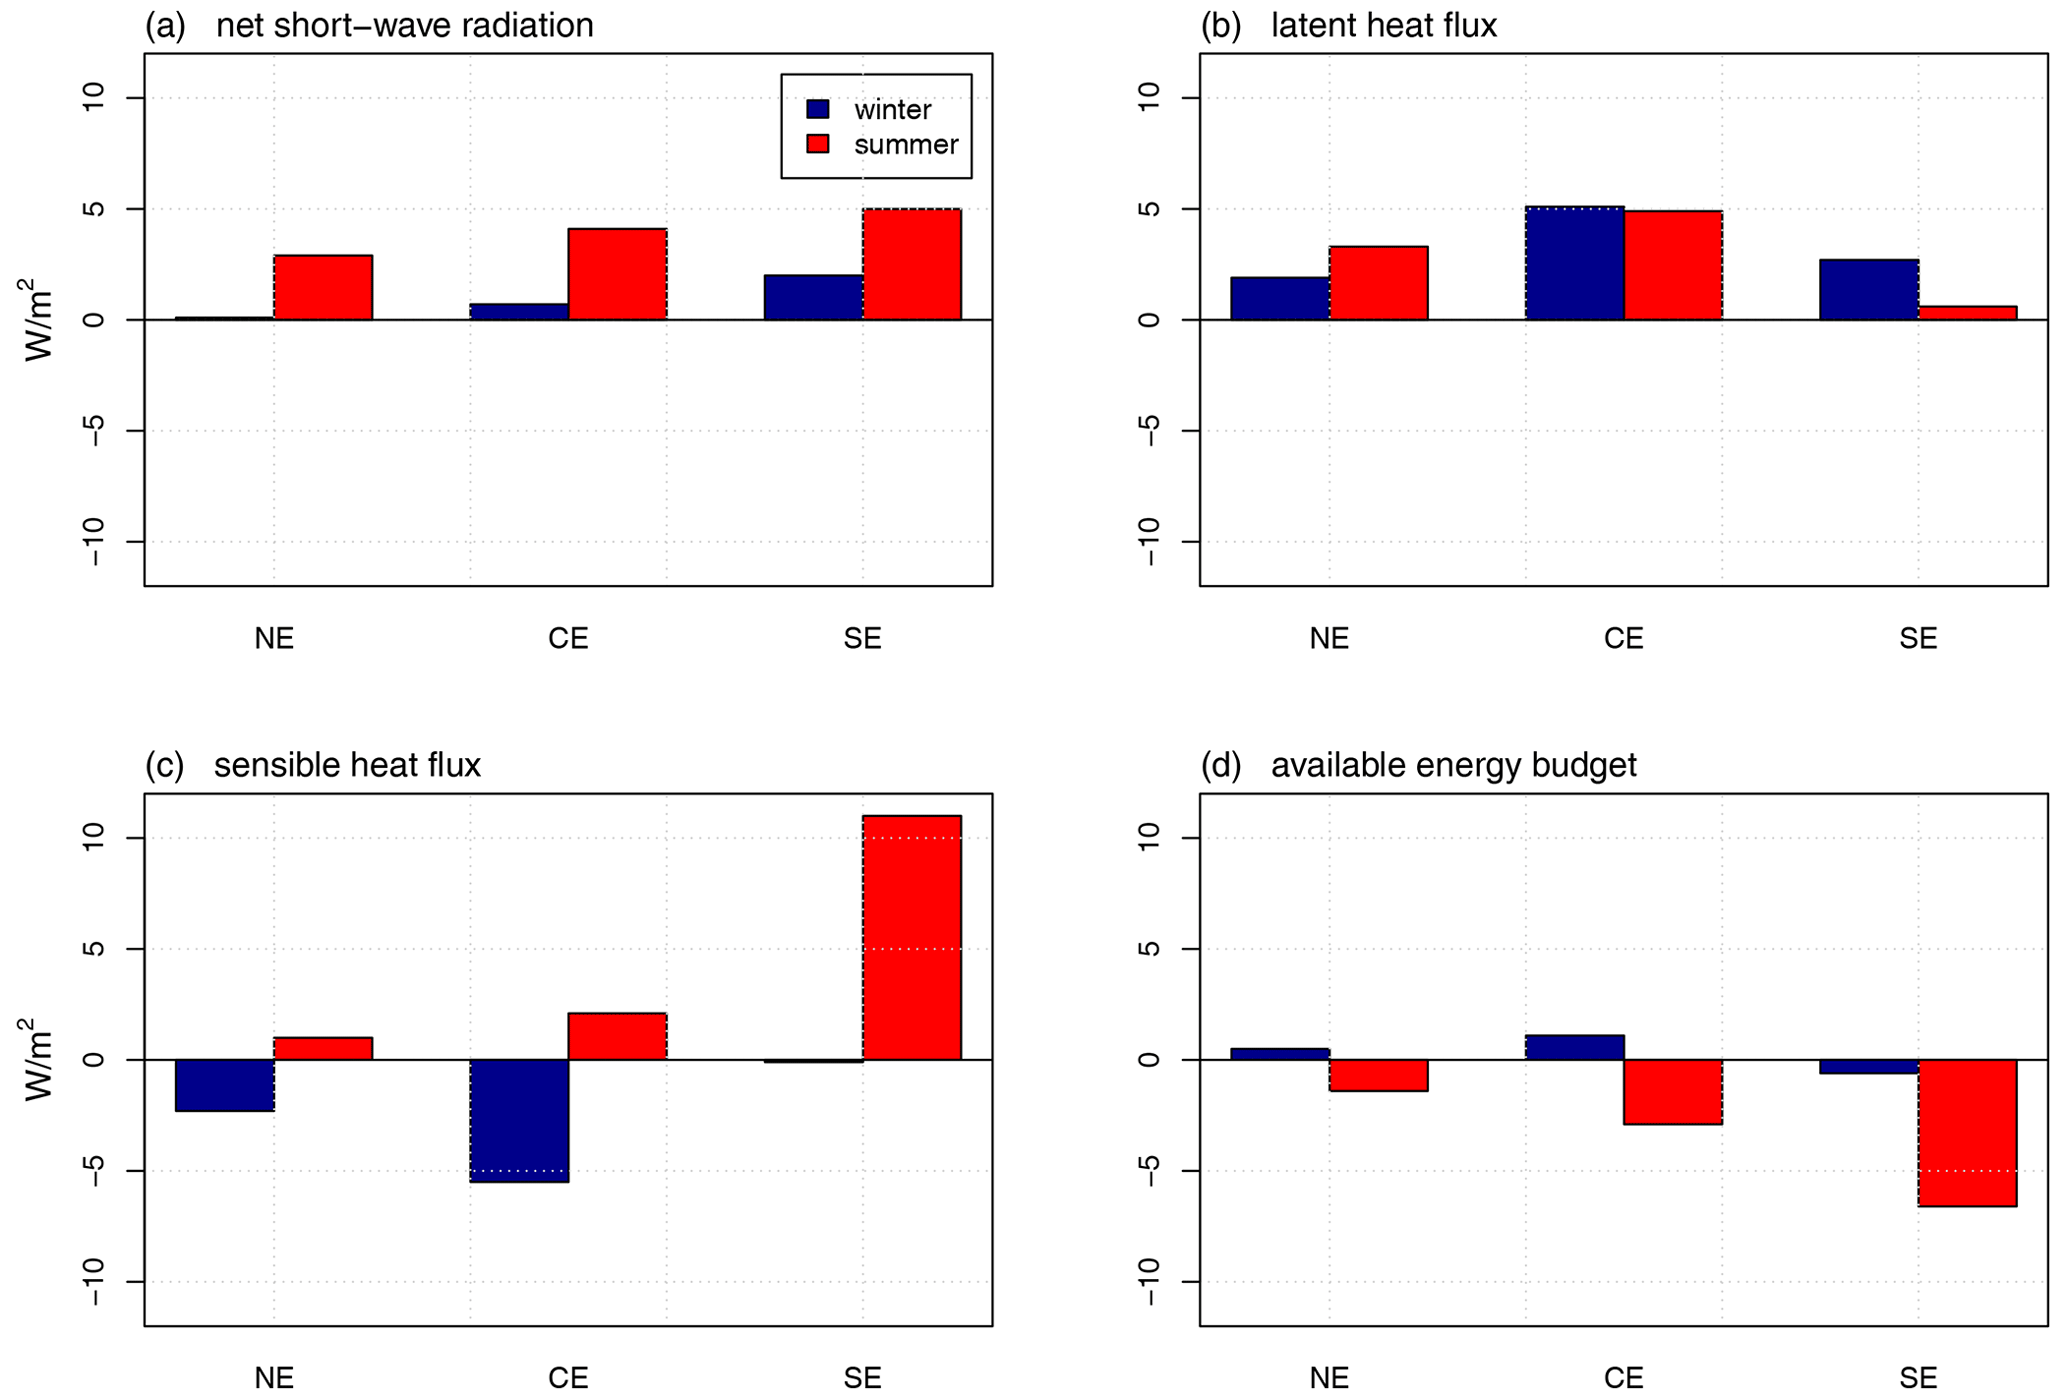
Figure 3Local effects of afforestation (AFF-REF) on (a) the mean net shortwave radiation (R), (b) the mean latent heat fluxes (L), (c) the mean sensible heat fluxes (H), and (d) the available energy budget at the surface (defined as R − (L+H)) for the three subregions NE, CE, and SE. Local effects in winter are shown in blue, and local effects in summer are shown in red.
In winter, an important change with afforestation is that trees (particularly coniferous trees) maintain dense vegetation throughout the whole season (characterized by a high leaf area index – LAI), while the original vegetation types have only a low vegetation cover (especially croplands). Therefore, forests are generally able to transpire more water than grasslands and particularly croplands during winter (Fig. 3b). As a consequence, more energy is transformed into latent heat and less energy is transformed into sensible heat in forests (Fig. 3c).
This feature is especially pronounced in central Europe. Within the period 1986–2015, mean local latent heat fluxes were increased by about 5.1 W m−2 in winter (Fig. 3b), while mean local sensible heat fluxes were reduced by about −5.5 W m−2 (Fig. 3c). At the same time, mean local net shortwave radiation was slightly increased by about 0.7 W m−2 (Fig. 3a), leading to a positive surface energy budget (+1.1 W m−2, Fig. 3d). Thus, afforestation in central Europe led to a slight local warming in winter for the period 1986–2015 (+0.2 K, Fig. 4a).
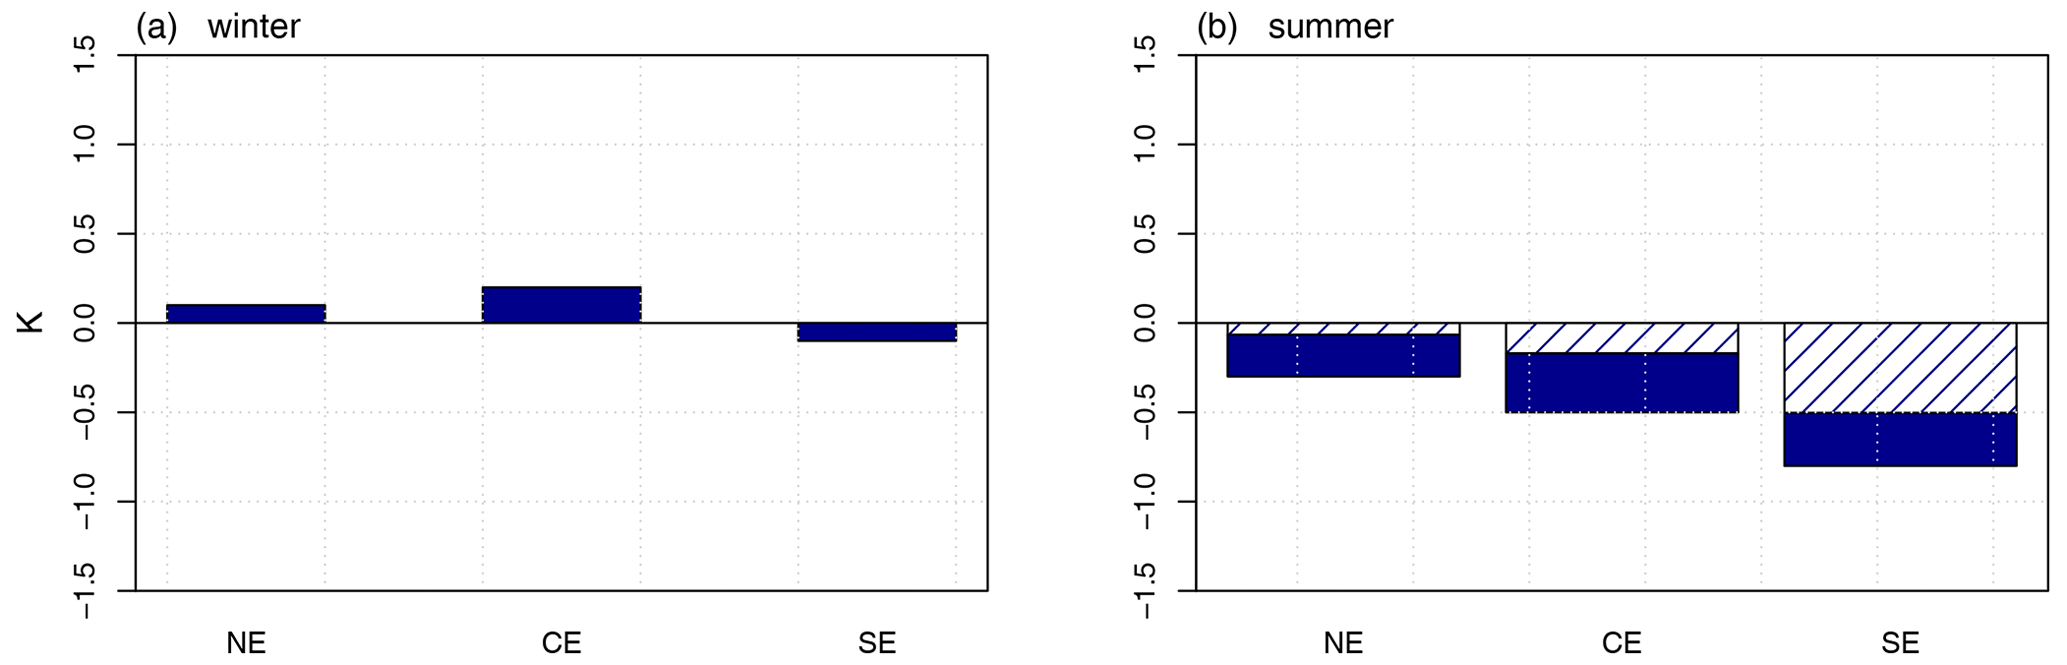
Figure 4Local effects of afforestation (AFF-REF) on the mean surface temperature in (a) winter and (b) summer for the three subregions NE, CE, and SE. The fractions of significant local effects in the respective subregions (calculated with a Wilcoxon rank-sum test at a 95 % level) are indicated by dashed lines.
The same processes were also simulated in northern Europe. The mean local latent heat fluxes in winter were increased (+1.9 W m−2, Fig. 3b), while the mean local sensible heat fluxes were reduced (−2.3 W m−2, Fig. 3c). The increase in the mean local net shortwave radiation was at 0.1 W m−2 (Fig. 3a) even smaller than in central Europe. The impact of the reduced surface albedo on the mean radiative energy input, associated with the snow-masking effect of forests in winter, must therefore be rather small. The generally low insolation in this season consequently impeded stronger differences in the mean local radiative energy input in central and particularly in northern Europe. As a consequence, the surface energy budget was slightly increased in northern Europe (+0.5 W m−2, Fig. 3d) and the mean warming with afforestation was small (+0.1 K, Fig. 4a).
Since the general insolation in southern Europe in winter is higher than in central and northern Europe, a comparatively strong increase in the mean local net shortwave radiation was simulated with afforestation (+2.0 W m−2, Fig. 3a) due to the lower albedo values. Therefore, one could assume that this enhanced radiative energy input should also have led to the strongest temperature increase in Europe during winter. But this is not the case. On the contrary, afforestation resulted in a slight reduction of the mean local surface temperature in southern Europe in winter within the simulated 30-year period (−0.1 K, Fig. 4a). This is because in southern Europe, not only were the mean local latent heat fluxes increased with afforestation (+2.7 W m−2, Fig. 3b), but the mean local sensible heat fluxes were also high and at a level comparable to croplands and grasslands (−0.1 W m−2, Fig. 3c). That means the increased local radiative energy input was transformed into high latent heat fluxes as well as high sensible heat fluxes. As a result, the surface energy budget was slightly negative (−0.6 W m−2, Fig. 3d), resulting in a slight local cooling in southern Europe in winter (Fig. 4a).
Although these slight temperature changes in northern, central, and southern Europe can be consistently explained by changes in the surface energy budget, the local temperature effects of afforestation are statistically not significant in winter, as calculated by a Wilcoxon rank-sum test at a 95 % level. Thus, random causes for the temperature changes cannot be excluded.
3.1.2 Summer
In summer, the most striking effect of afforestation is the general increase in absorbed solar radiation. The mean local net shortwave radiation was increased all over Europe within the period 1986–2015 (Fig. 3a). However, this increased radiative energy input at the surface did not result in a warming of the surface temperatures. Because of the higher surface roughness of forests in comparison to croplands and grasslands (Table 1) the absorbed solar radiation is, in general, more efficiently transformed into turbulent heat with afforestation (e.g., Breil et al., 2020). Therefore, both the mean local latent heat fluxes and the mean local sensible heat fluxes were enhanced in all subregions (Fig. 3b, c). As a result, more energy was released as turbulent heat into the atmosphere than was additionally absorbed by solar radiation. Thus, the surface energy budget became negative (Fig. 3d), although the mean local net shortwave radiation was increased. Afforestation consequently led to a cooling of the mean local surface temperatures all over Europe in summer for the period 1986–2015 (Fig. 4b).
The strongest cooling was simulated in southern Europe, with a mean temperature reduction of −0.8 K (Fig. 4b). However, at single locations, the cooling was more strongly pronounced. The maximum cooling effect was about −3.1 K, with 20 % of the afforested areas showing a mean cooling of more than −1.3 K with afforestation. This strong cooling was reached, although the albedo effect of afforestation was highest in southern Europe, due to the high solar altitude in summer. But the increase in mean local net shortwave radiation of 5.0 W m−2 (Fig. 3a) was completely counteracted by a considerably increased mean local sensible heat flux (+11.0 W m−2, Fig. 3c) and a slightly increased mean local latent heat flux (+0.6 W m−2, Fig. 3b). The comparatively small increase in latent heat fluxes and the pronounced increase in sensible heat fluxes were caused by the generally low soil water contents in summer and the resulting soil moisture limitation of evapotranspiration in southern Europe (Seneviratne et al., 2010).
In central and northern Europe, the soil moisture limitation in summer was not as strongly pronounced as in southern Europe. The mean local latent heat fluxes were consequently at a higher level (+4.9 W m−2 in CE and +3.3 W m−2 in NE, Fig. 3b), although the additional radiative energy input with afforestation was not as high as in southern Europe (+4.1 W m−2 in CE and + 2.9 W m−2 in NE, Fig. 3a). Since the mean local sensible heat fluxes were also increased (+2.1 W m−2 in CE and + 1.0 W m−2 in NE, Fig. 3c), afforestation in central and northern Europe led to a mean local surface cooling of −0.5 and −0.3 K, respectively. The maximum mean local cooling effect in central Europe was about −2.6 and −1.6 K in northern Europe.
In contrast to the local effects of afforestation in winter, local temperature changes in summer are in fact statistically significant, as calculated by a Wilcoxon rank-sum test at a 95 % level. In northern Europe, 22 % of the afforested areas show statistically significant temperature changes. In central Europe, 34 % of the temperature changes with afforestation are statistically significant and in southern Europe as much as 63 %. However, this also means that for 78 % of the afforested areas in northern Europe, for 66 % in central Europe, and for 37 % in southern Europe simulated temperature changes are not significant. Although for these non-significant regions afforestation has the same physical effects and the same process chain is simulated as for the significant areas, random causes for the temperature changes in the non-significant regions cannot be excluded.
3.2 Non-local effects
3.2.1 Winter
The non-local effects of afforestation in Europe on the mean climate conditions in winter are now investigated (Fig. 5). In the period 1986–2015, local afforestation led to a slight warming in Scandinavia, central Europe, and parts of southern Europe, more precisely Italy and the Balkan region (Fig. 5a). The locally increased evapotranspiration rates with afforestation (Fig. 3b) enhanced the moisture content in the atmosphere, with the consequence that the mean cloud cover in winter was slightly increased over these regions (Fig. 5b). From the perspective of the surface energy balance, the effects of clouds are stronger in winter on the outgoing longwave radiation than on the incoming shortwave radiation due to generally short sunshine duration. Therefore, the net shortwave radiation was just slightly reduced in these regions (Fig. 5c), while the reduction in the net longwave radiation was stronger (Fig. 5d). This reduction in outgoing longwave radiation consequently led to a decreased nocturnal cooling and thus to higher mean surface temperatures in Scandinavia, central Europe, and parts of southern Europe for the period 1986–2015. The mean non-local warming in these regions was +0.06 K, with a warming less than +0.14 K in 90 % of the area. However, only a small proportion of these non-local temperature changes is statistically significant. Only in southern Europe was the non-local warming with afforestation significant in 15 % of the affected area. For the other regions, no statistically significant temperature changes were simulated. Thus, random causes for the differences between AFF and REF cannot be excluded.
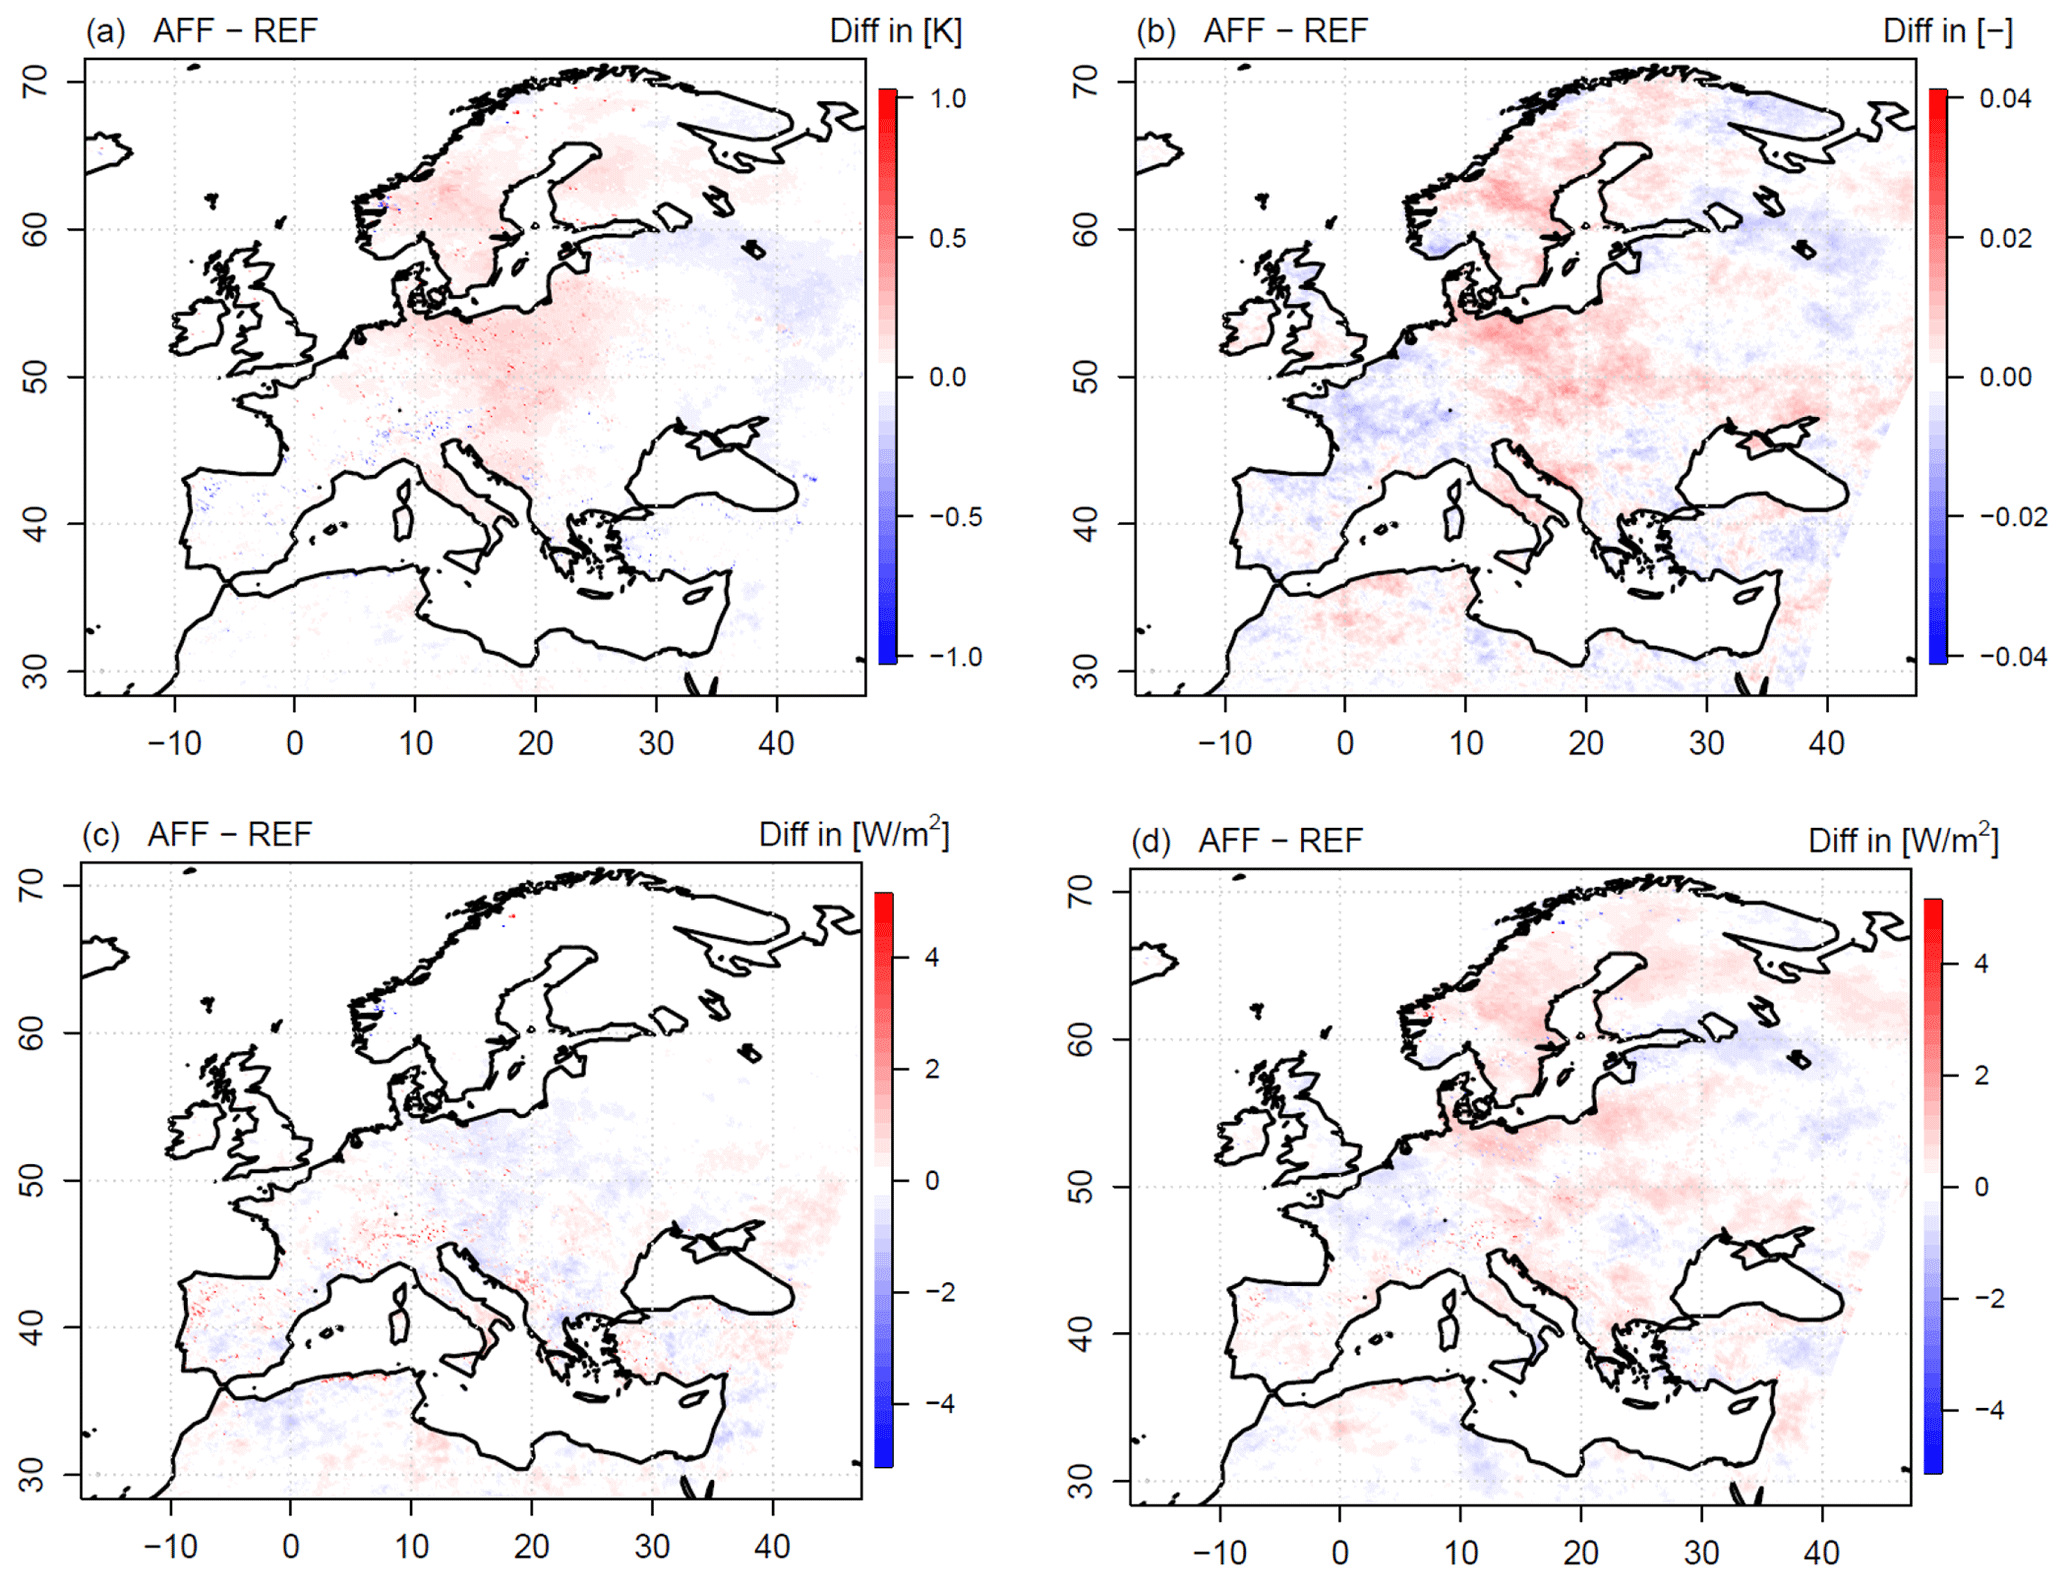
Figure 5Non-local effects of afforestation in Europe on (a) the mean surface temperatures, (b) the mean cloud cover, (c) the mean net shortwave radiation, and (d) the mean net longwave radiation in winter between AFF and REF.
The local temperature changes with afforestation are clearly larger than the surrounding non-local changes, as can be seen in Fig. 5. In addition, the local temperature changes often show an opposite sign and are thus detached from the large-scale temperature patterns.
3.2.2 Summer
As already described for the winter season, the locally increased evapotranspiration rates in afforested areas (Fig. 3b) also enhanced the atmospheric moisture content in summer under the dominant west-wind circulation. The mean downwind cloud cover (Fig. 6b) and precipitation sums (Fig. 6c) were consequently slightly increased over large parts of central and eastern Europe in the period 1986–2015. Exceptions were an area north of the Black Sea and parts of northeastern Europe. In the upwind areas of western Europe, however, no systematic changes with afforestation were simulated for the mean seasonal cloud cover and the mean seasonal precipitation sums.
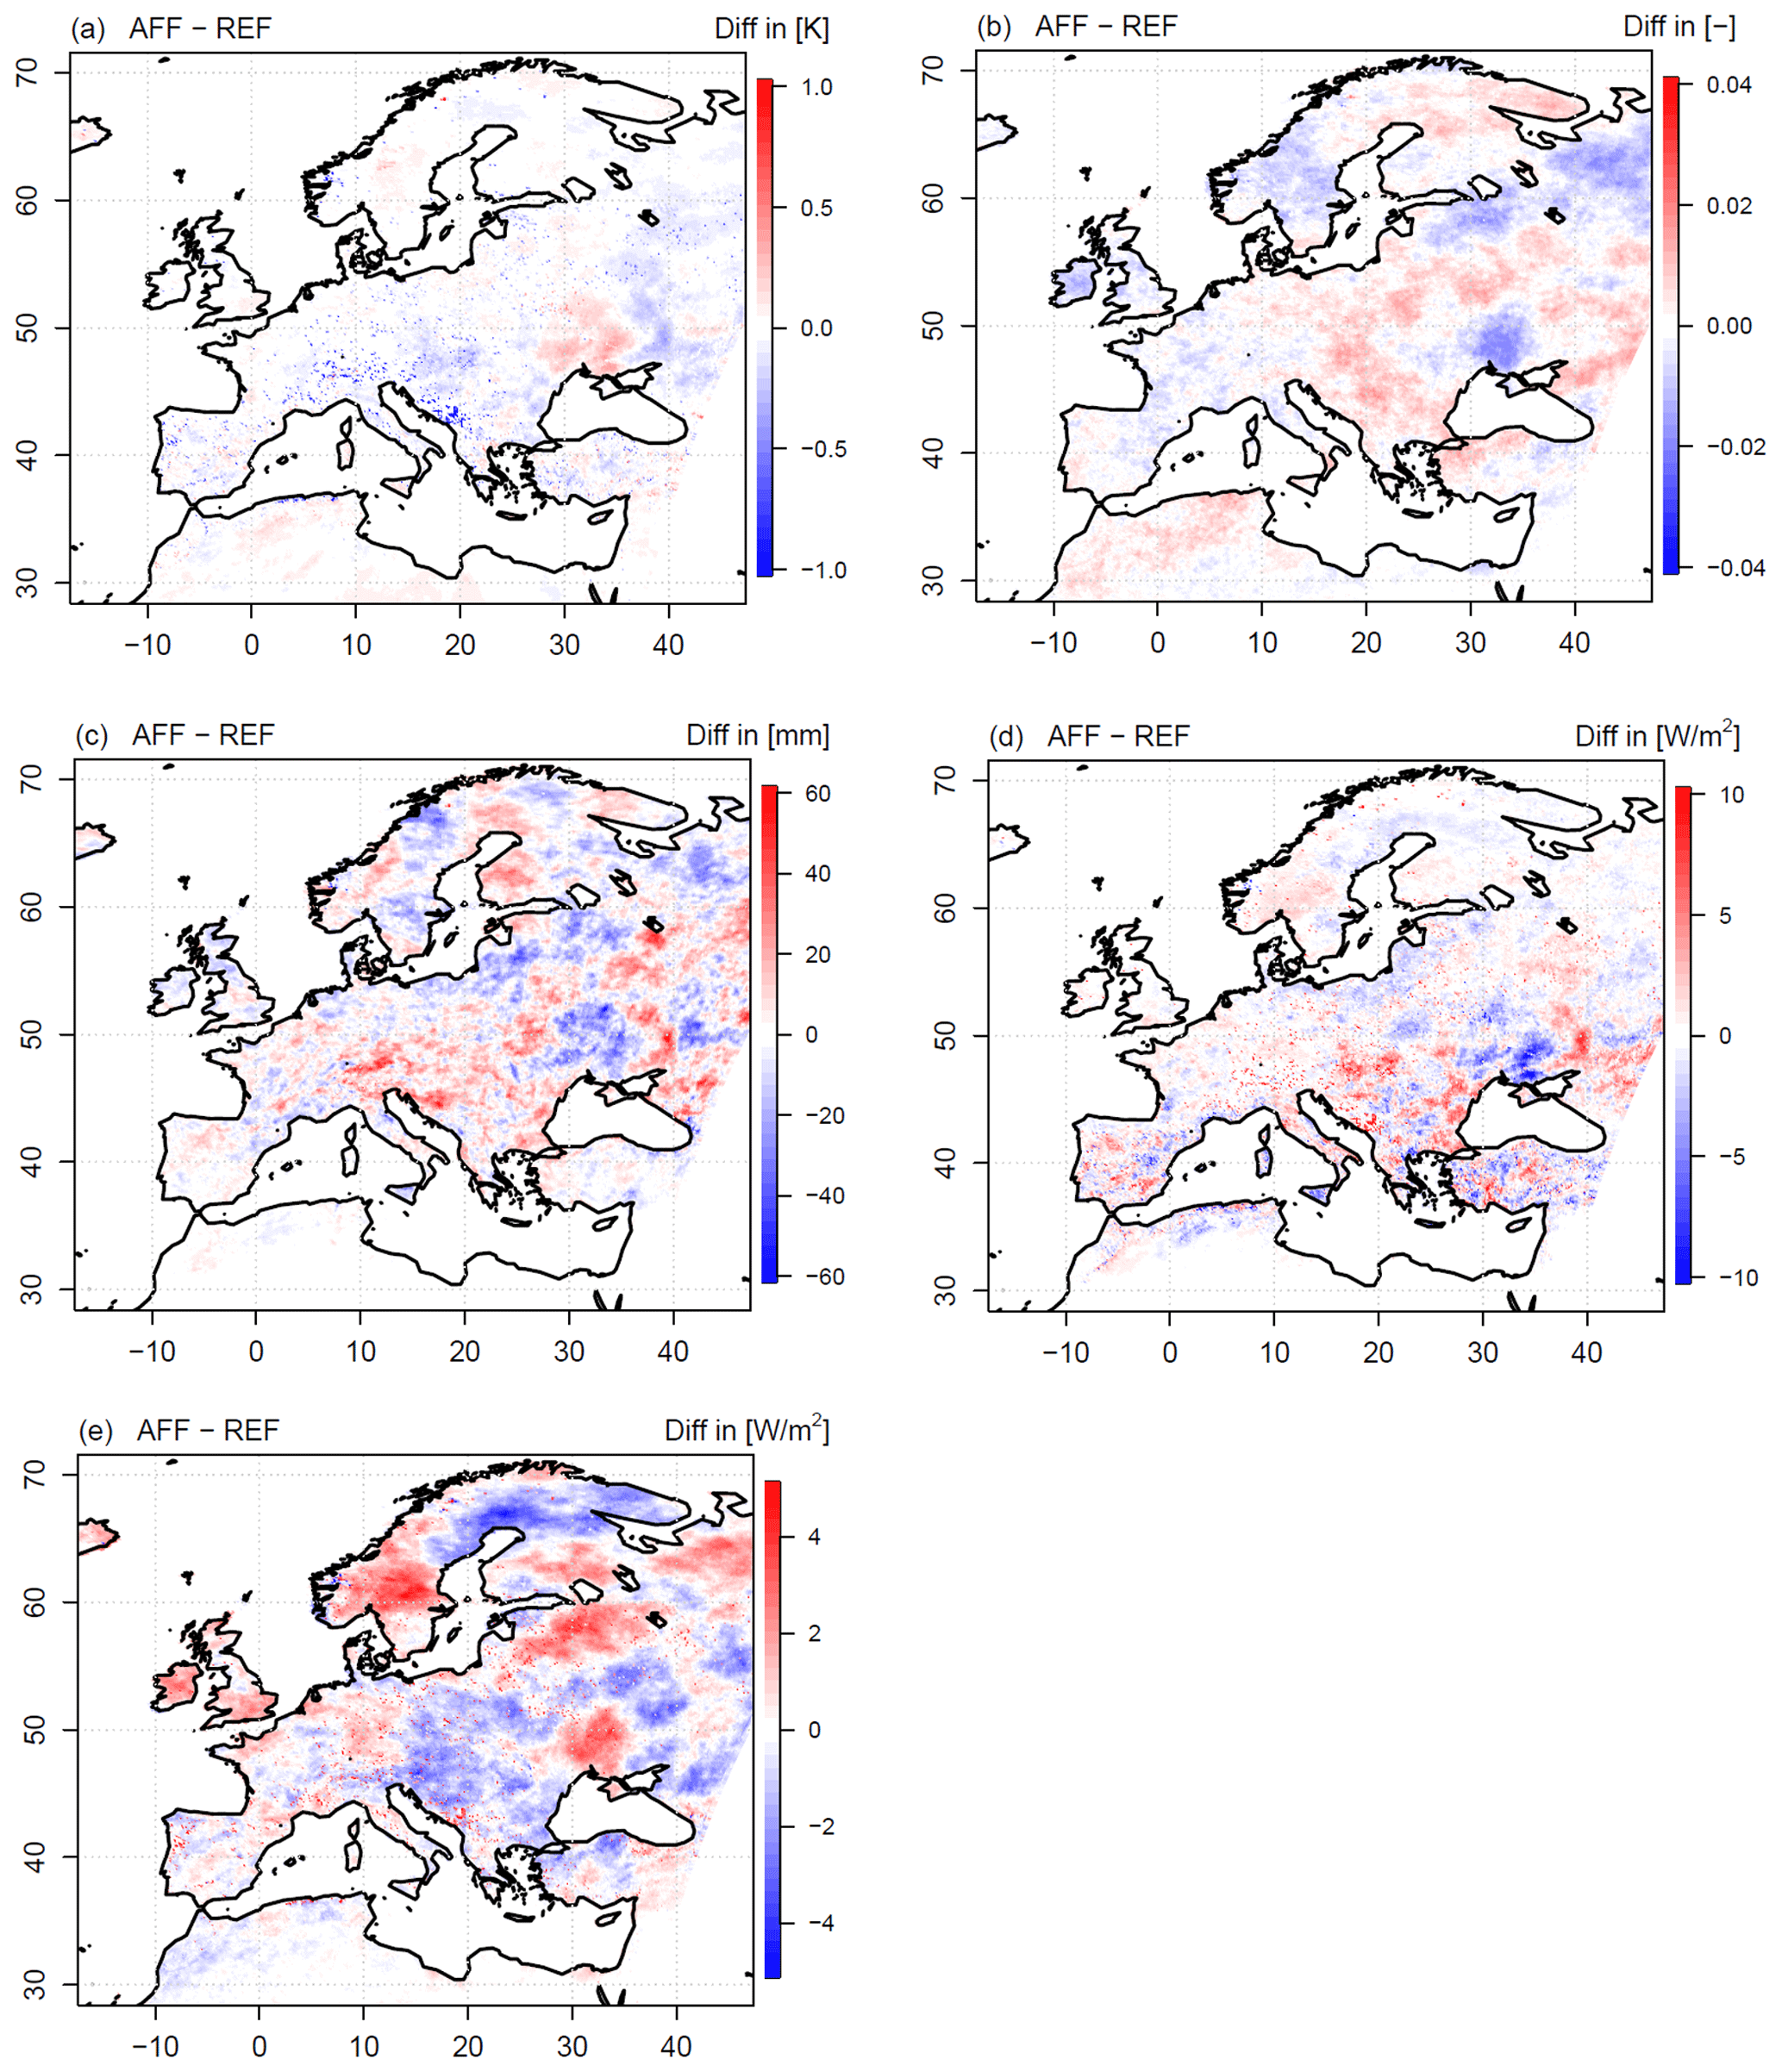
Figure 6Non-local effects of afforestation in Europe on (a) the mean surface temperatures, (b) the mean cloud cover, (c) the mean precipitation sums, (d) the mean evapotranspiration rates, and (e) the mean net shortwave radiation in summer between AFF and REF.
The increased mean precipitation sums in the downwind direction slightly increased the amount of available water for evapotranspiration in these regions. As a result, the mean seasonal evapotranspiration rates were also enhanced in non-afforested regions of Europe (Fig. 6d), and thus more radiative energy could be transformed into latent heat instead of heating up the land surface in summer.
In addition, the increased mean cloud cover slightly reduced the incoming mean solar radiation in summer (Fig. 6e) and thus the radiative energy input in the respective regions. Therefore, local afforestation in Europe led mainly to a slight cooling in the non-afforested areas of central and eastern Europe in summer for the period 1986–2015 (Fig. 6a). The mean non-local cooling effect in these regions was −0.06 K, with a cooling less than −0.13 K in 10 % of the area. Exceptions are the areas north of the Black Sea and parts of northeastern Europe where the mean cloud cover and the mean precipitation sums were reduced. The mean non-local warming in these areas was +0.05 K, with a warming less than +0.11 K in 90 % of the area. Just like in winter, the non-local temperature changes in summer are not statistically significant, although these non-local effects can be explained by a physically consistent process chain. Therefore, random causes for the temperature changes cannot be excluded. Furthermore, the local temperature changes are again more strongly pronounced than non-local changes and detached from the large-scale temperature pattern.
3.3 Extremes
3.3.1 Temperature extremes
The non-local effects of afforestation on heat extremes (Fig. 7a) showed the same spatial patterns as for the mean temperature effects in summer (Fig. 6a). The daily maximum temperatures during heat extremes were slightly reduced over large parts of Europe, but slightly increased in an area north of the Black Sea and in parts of northeastern Europe. However, the regional warming in these areas is pronounced more strongly than for the mean conditions in summer.
During heat periods, the surface energy budget strongly depends on the available amount of soil water for evapotranspiration. A reduction of the soil water availability has the consequence that less solar radiation can be transformed into latent heat and more energy is used to heat up the surface. The reduction of the mean seasonal precipitation sums north of the Black Sea and in northeastern Europe during summer (Fig. 6c) leads to such a soil water limitation in these regions. The heat period intensities were therefore enhanced in these areas.
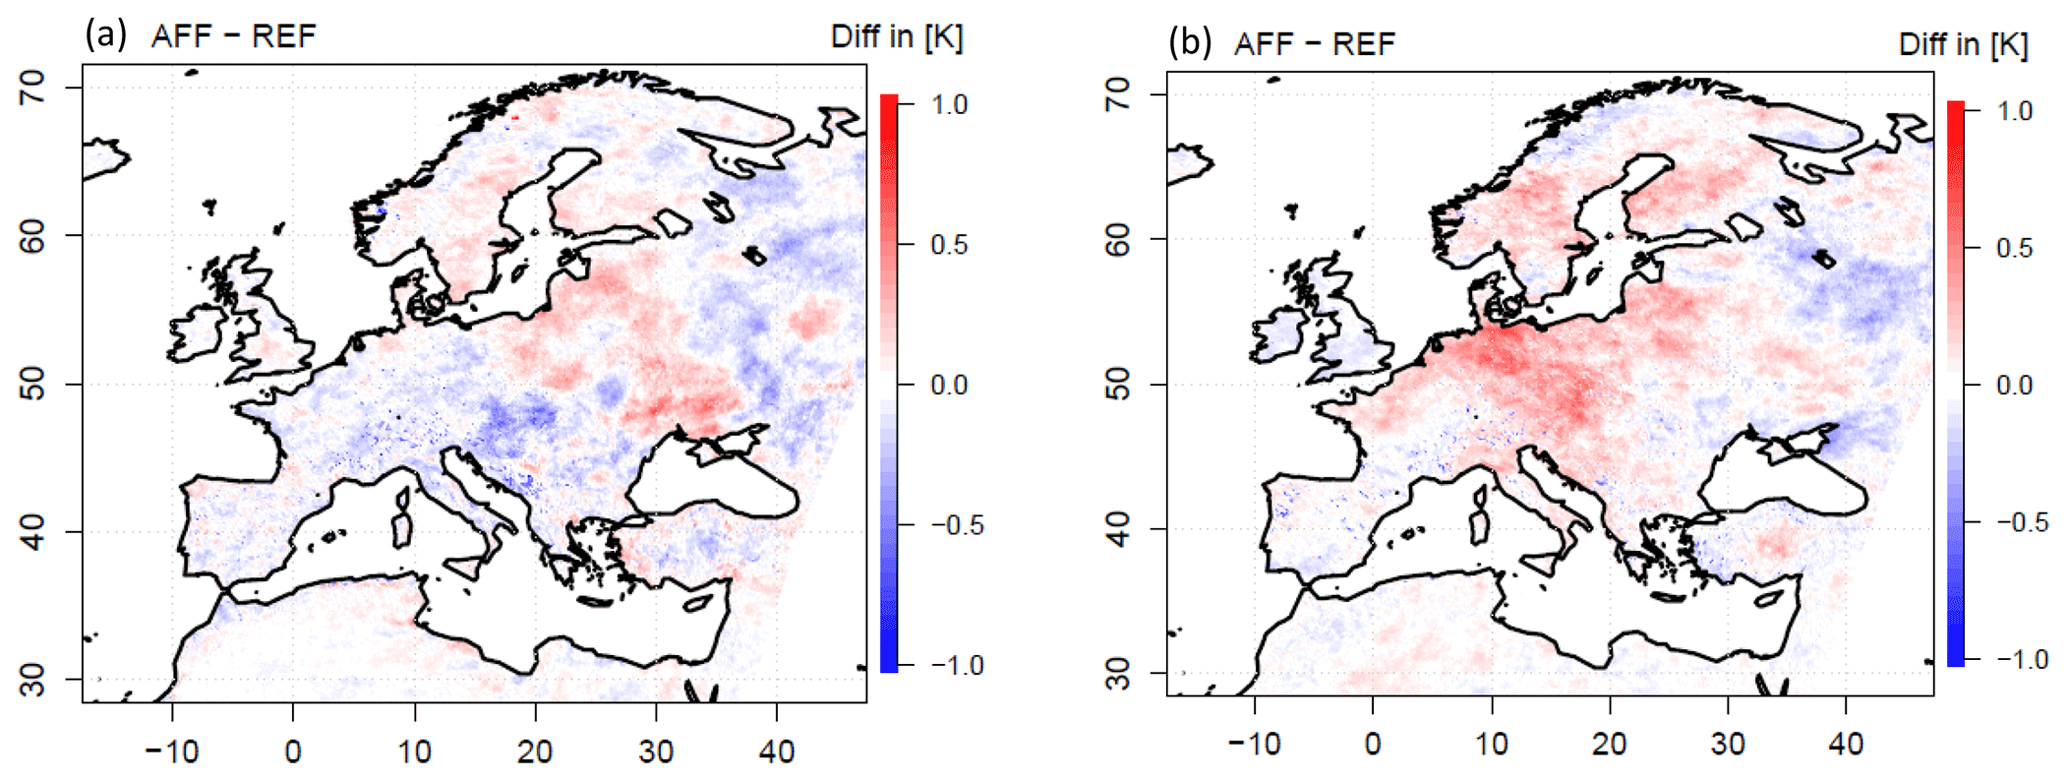
Figure 7Effects of afforestation on temperature extreme intensities in Europe for the period 1986–2015. Changes in temperature extreme intensities are expressed as the mean temperature differences in the days (a) above the 90th percentile of the daily maximum temperatures in 2 m height in summer and (b) below the 10th percentile of the daily maximum temperatures in 2 m height in the winter season between AFF and REF.
In the regions in which afforestation had a non-local cooling effect, the daily maximum temperatures during heat extremes were reduced in mean by −0.1 K, with no cooling below −0.2 K in 90 % of the area. Comparable temperature effects were simulated for the regions in which afforestation had a non-local warming effect. North of the Black Sea and in parts of northeastern Europe, mean heat extremes were intensified by +0.1 K with a 90th percentile of +0.2 K. The non-local effects of afforestation on heat extreme intensities were consequently low.
The local effects of afforestation on the daily maximum temperatures during heat extremes were partly stronger. All over Europe, the intensities of heat extremes were locally reduced with afforestation. Although the mean local cooling effect was at −0.2 K comparable to the non-local effect, at some locations in southern Europe, temperature reductions as strong as −1.9 K were simulated during heat extremes.
Figure 7b shows the effects of afforestation on cold extreme intensities in Europe for the period 1986–2015. In general, afforestation had the same spatial effects on cold extreme intensities as on the mean surface temperatures in winter (Fig. 5a). In Scandinavia, central Europe, and parts of southern Europe (Italy and the Balkan region) cold extremes were reduced, while they were slightly increased in eastern Europe. However, the warming effect of afforestation on cold extreme intensities in Scandinavia, central Europe, and southern Europe was more pronounced than the changes in the mean temperature conditions. Although the mean non-local warming was at +0.1 K rather small, maximum warming effects of up to +0.8 K were simulated in these regions.
Furthermore, the local effects of afforestation on the mean cold extreme temperatures were intensified. Particularly, the intensification of the local winter cooling in southern Europe is clearly evident during cold extremes. On average, the local daily minimum temperatures were reduced by −0.3 K in this region, while 10 % of the local temperature reduction was even larger than −0.8 K. Thus, local temperature responses had an opposite sign and were detached from the large-scale temperature pattern in southern Europe (Fig. 7b).
3.3.2 Precipitation extremes
In summer (Fig. S1) as well as in winter (Fig. S2), the number of small and moderate precipitation intensities was just slightly increased with afforestation. As shown in Fig. 3, evapotranspiration rates were locally increased with afforestation throughout the year all over Europe and particularly in central Europe. The atmospheric moisture content in Europe was consequently increased and downwind precipitation events became slightly more extensive. However, these increased evapotranspiration rates with afforestation did not affect the number and intensity of extreme precipitation events themselves. For precipitation events larger than 10 mm d−1, no significant changes between AFF and REF were simulated over the simulated 30 years, indicating that the contribution of the slightly increased evapotranspiration rates with afforestation to the total precipitated water amount is negligible for such strong events.
3.4 Variability
The effects of afforestation in Europe on the interannual climate variability in winter and summer for the local and the non-local scales are shown in Fig. 8. On average, afforestation did not change the interannual climate variability in Europe within the period 1986–2015. In both seasons, the mean change in the standard deviation was almost zero for both the local and the non-local effects. However, a wider range of interannual variability was simulated for both the summer and the winter season. On the local scale, the spread in variability is higher in summer than in winter. But in both cases, positive as well as negative variability changes with afforestation are evenly distributed and do not show any consistent spatial patterns. Thus, interannual variability changes with afforestation are balanced on the local scale, indicating random effects caused by the natural climate variability. On the non-local scale, the changes in the interannual variability are almost negligible. Therefore, afforestation did not have systematic effects on the interannual climate variability in Europe in our experiments.
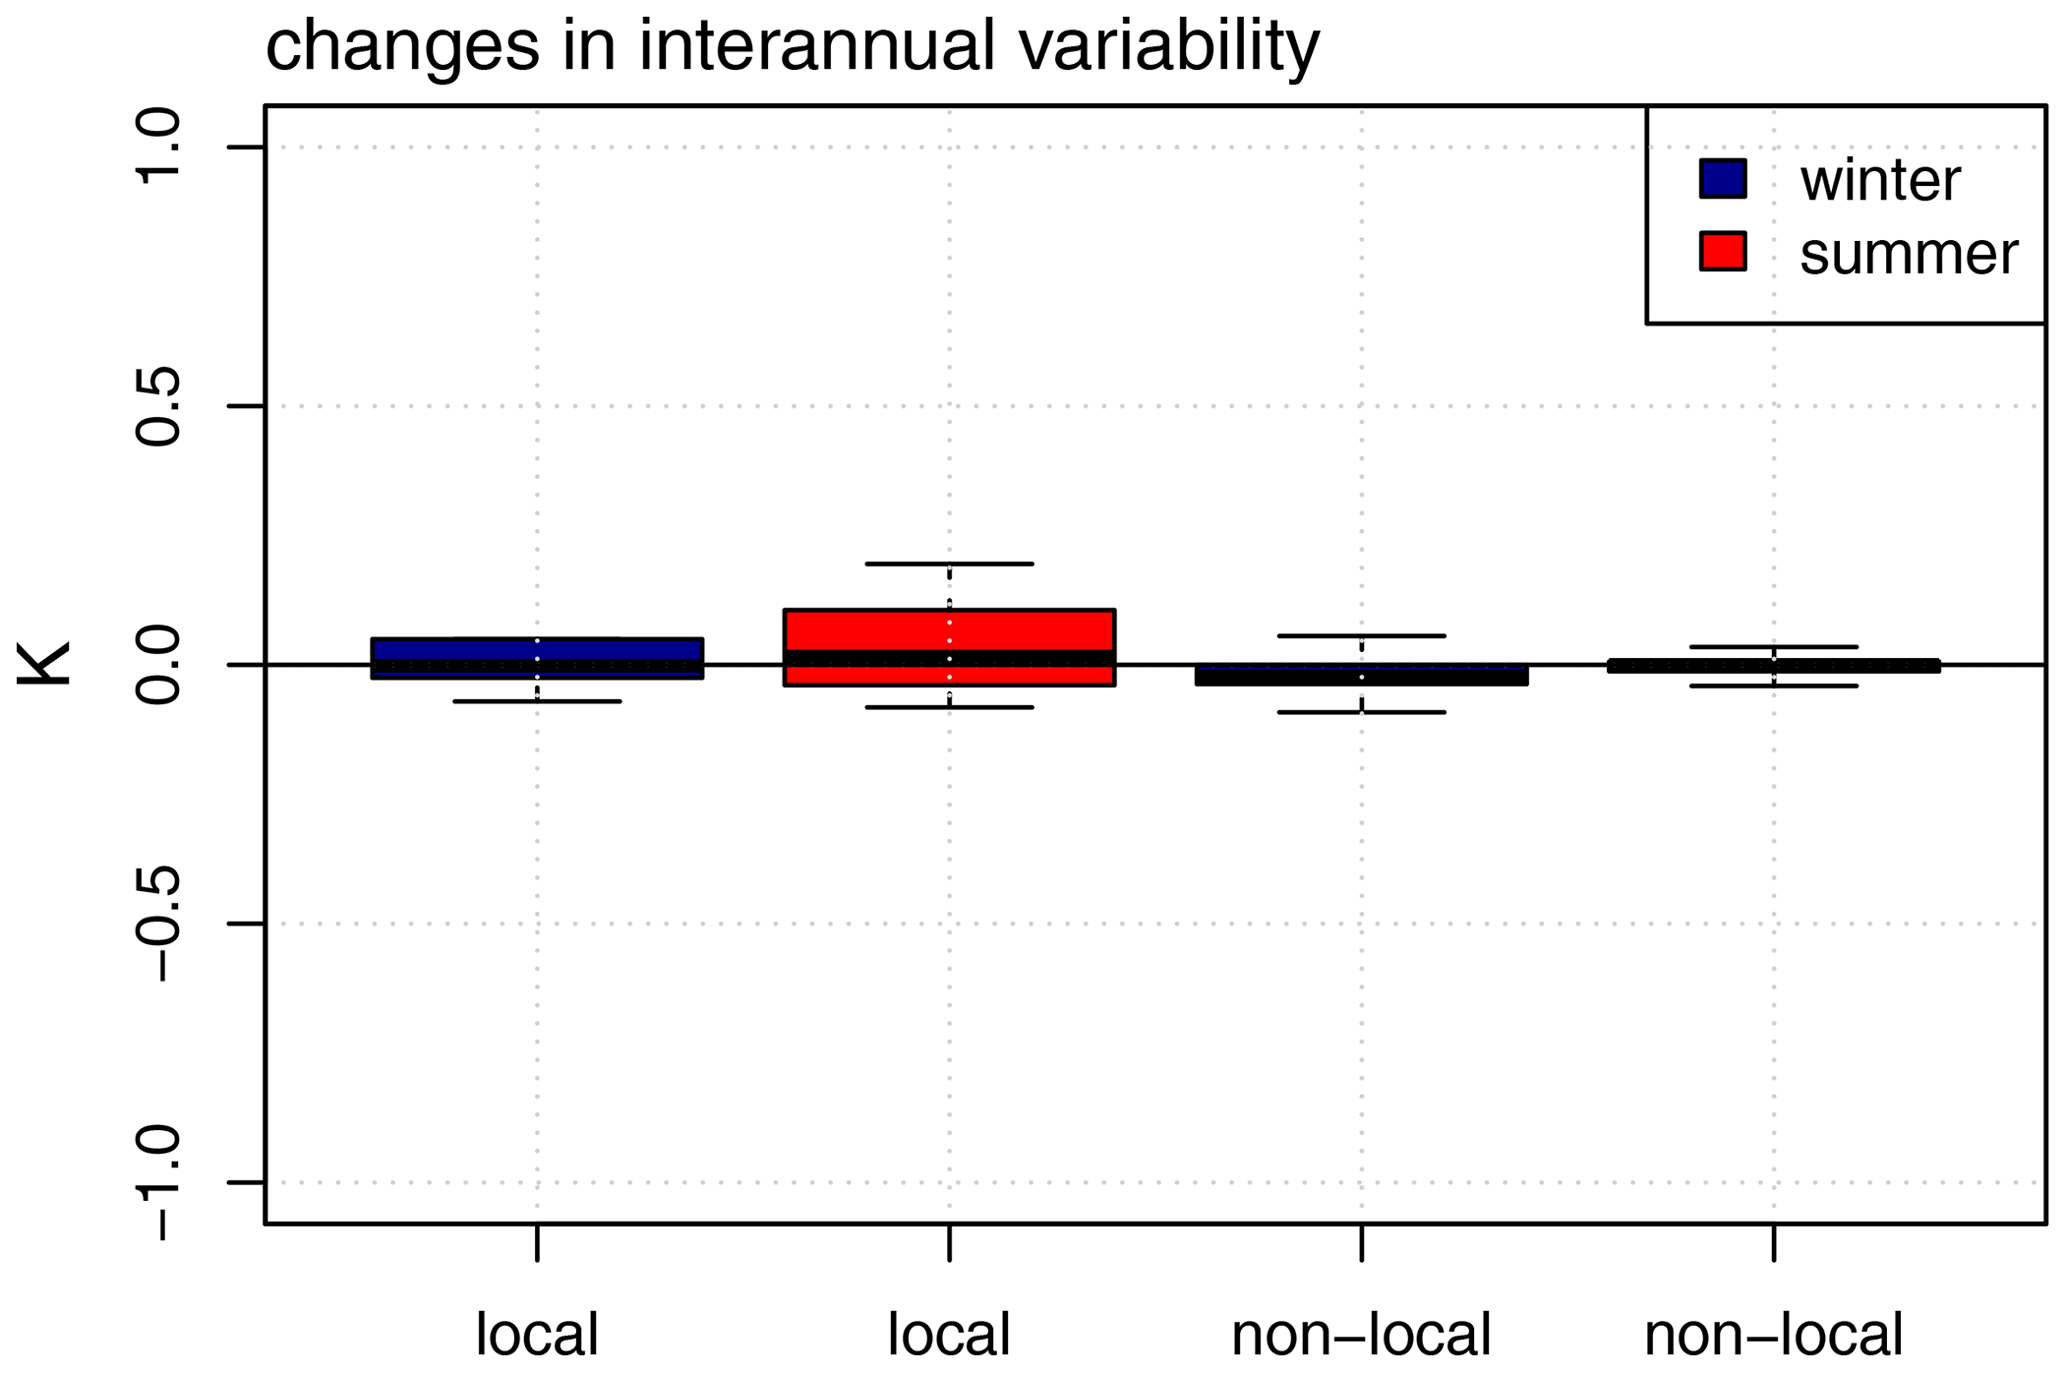
Figure 8The effects of afforestation in Europe on the interannual climate variability in winter and summer for the local and the non-local scales, derived from the standard deviation of the mean seasonal surface temperatures.
The results of our study reflect the well-known effects of afforestation on the surface temperatures (e.g., Bonan et al., 2008), which are already documented in several measurement (e.g., Li et al., 2015; Duveiller et al., 2018) and modeling studies (e.g., Strandberg and Kjellström, 2019; Davin et al., 2020). On the local scale, European afforestation led to a slight warming of the surface temperatures in winter within the period 1986–2015, with the strongest warming effect in central Europe (Fig. 4a). However, statistically significant local effects of afforestation could only be simulated in summer, where afforestation resulted in a slight local cooling of the surface temperatures, with the strongest cooling effect in southern Europe (Fig. 4b). These general effects of afforestation on the surface temperatures in summer seem to be independent of the afforested area, as shown by the results of coordinated model intercomparison studies with idealized afforestation scenarios. For instance, Davin et al. (2020) and Breil et al. (2020) show that afforestation would have the same local temperature effects if the whole European continent were afforested.
In contrast, the small local warming effect in winter is quite astonishing, since it is generally assumed that afforestation is associated with a pronounced warming in the midlatitudes in boreal winter, as shown by Lejeune et al. (2017), for example, for North America. Using the Land-Use and Climate, Identification of Robust Impacts (LUCID) model and phase 5 of the Coupled Model Intercomparison Project (CMIP5), Lejeune et al. (2017) provided evidence that the snow-masking effect of forests (e.g., Essery, 2013) is clearly pronounced in North America. In combination with slightly increased evapotranspiration rates, winter temperatures of forests are about 0.3 K (LUCID) and 0.4 K (CMIP5) higher than those of other vegetation forms. However, the snow-masking effect is less pronounced in Europe than in North America, as shown by Asselin et al. (2022) within the framework of an idealized afforestation experiment for Europe and North America. They could show that snow masking reduces the surface albedo on both continents in a similar way, but the reduced surface albedo effect on the surface temperatures is much stronger in North America than in Europe. For the same latitude, European climate is warmer than the climate in North America, and snow cover in winter is consequently restricted only to higher latitudes, notably central and northern Europe. There, insolation is low in winter, and thus the albedo effect on surface temperatures is small. The same conclusions were drawn by Strandberg and Kjellströ (2019) from regional climate simulations with an idealized afforestation scenario for Europe.
In southern Europe, where insolation is higher, snow cover plays a minor role for the surface energy balance. Surface temperatures are typically higher than for central and northern Europe, and therefore buoyancy is generally stronger in this region. In combination with the higher surface roughness of forests and the associated increased wind shear, afforested areas in southern Europe are consequently able to efficiently transform this increased energy input from solar radiation into turbulent heat and release the energy into the atmosphere (e.g., Breil et al., 2020), counteracting the increased solar radiation. Thus, afforestation did not have a warming effect in southern Europe in winter (Fig. 4). These described general effects of afforestation on the different components of the surface energy balance are intensified in summer and also take place in central and northern Europe (Fig. 3; Breil et al., 2020). A general reduction of the surface albedo, an increased release of turbulent energy into the atmosphere, and a resulting local cooling in summer are also described by Burakowski et al. (2018) for North America. This indicates that the results of this study may be representative for afforestation in the midlatitudes and transferable to other regions.
Beyond these local effects, afforestation also affects the climate conditions in Europe on the non-local scale (Figs. 5 and 6). As already demonstrated by Meier et al. (2021), afforestation can increase downwind cloud cover and precipitation sums in Europe through increased evapotranspiration rates and thus a higher moisture content in the atmosphere. These findings are confirmed by the results of this study (Fig. 6b–d). Although the non-local effects of afforestation can be explained by a physically consistent process chain, simulated non-local temperature changes are statistically not significant in Europe.
However, a missing significance does not necessarily mean that there is no causal relationship (Wasserstein and Lazar, 2016) between afforestation and the simulated non-local temperature changes. On the contrary, the traceability of the complete physical process chain is, from our point of view, a strong indicator that the non-local afforestation effects are not random. Downwind processes in particular are spatially and temporally highly variable. Thus, locally induced changes in the atmospheric moisture conditions do not always lead to precipitation and cloud cover at the same downwind locations (Perugini et al., 2017). This high spatial and temporal variability has the consequence that the mean downwind effects are small and difficult to detect, resulting in non-significant temperature changes. Nevertheless, during extreme events, like heat periods in summer or cold spells in winter, the described effects of afforestation on the local and the non-local surface energy and water balance are more strongly pronounced than for the mean climate conditions so that afforestation had a notable impact on the characteristics of these extremes within the period 1986–2015 (Fig. 7, Breil et al., 2023b).
However, the presented work is a modeling study and therefore associated with certain modeling uncertainties. Even though CCLM-VEG3D is able to properly reproduce the observed regional climate conditions in Europe during the simulated 30 years (Fig. 2), the effects of afforestation on the surface temperatures may locally differ from measurement studies (e.g., Li, et al., 2015; Duveiller et al., 2018). These differences from observations might result from the fact that in CCLM-VEG3D only the dominant land use class is considered within a model grid box. This means that the local effects of afforestation on the surface temperatures are overestimated at some places and underestimated at other places. However, the total afforested area in CCLM-VEG3D of 1.7 % of the European continent has nearly the same extent as the real one of 1.1 % (Hoffman et al., 2022). The simulated total effects of afforestation on the regional surface energy balance in Europe are therefore reasonable, and the applied modeling approach is suitable to analyze the general impact of afforestation on the European climate for the period 1986–2015. Nonetheless, regional variations in the described local and non-local process chains have to be acknowledged.
In addition, the results of this study are only valid for evergreen needle-leaved trees and deciduous broadleaved trees that are characteristic for the midlatitudes. Other tree species, for example evergreen broadleaved trees or deciduous needle-leaved trees, can of course have other effects on the local surface energy balance and consequently induce other remote effects. The described afforestation effects in this study could therefore be both stronger and weaker.
On the other hand, the advantage of an idealized modeling study like this is that the effects of afforestation on the surface energy balance can be locally isolated and comprehensively analyzed by performing and comparing simulations with and without afforestation. This is not possible in observation-based studies. Thus, the analyzed effects of afforestation on the surface energy balance are in such measurement studies potentially superimposed by other processes, which are not easy to separate from each other.
In conclusion, it is noticeable that the temperature changes with afforestation appear to be rather small in Europe. However, in comparison to the mean temperature changes during the investigation period of 1986–2015, the impact of afforestation on the climate change signal is considerable. While the mean temperatures in winter rose about 1.7 K in Europe during the simulated 30 years (Twardosz et al., 2021), mean summer temperatures between 1986 and 2015 were 1.3 K warmer compared to pre-industrial levels (Luterbacher et al., 2016). During the last decade of the investigation period, mean annual temperatures were 1.5 K above pre-industrial levels (European Environment Agency, 2017). Thus, the simulated non-local warming of up to 0.1 K in Scandinavia, central Europe, and parts of southern Europe in winter additionally contributed to the general winter warming signal in these regions. On the other hand, the local cooling effect of afforestation of about −0.3 K in northern Europe and about −0.8 K in southern Europe in summer may have mitigated the general warming trend in summer. That means that without afforestation, the climate change signal would have been much stronger in these regions for the period 1986–2015, especially in summer.
In this study, we analyzed the general effects of afforestation on the regional climate conditions in Europe for the period 1986–2015 by performing long-term regional climate simulations, with one simulation considering changes in forest cover and another simulation not accounting for changes in forest cover. The comparison of these simulations reveals that afforestation led to a discernible reduction of the mean local surface temperatures all over Europe in summer in the simulated 30 years. In northern and central Europe local surface temperatures were reduced by −0.3 and −0.5 K, respectively. In southern Europe, this cooling effect is particularly pronounced and a mean local cooling of −0.8 K was simulated. During heat extremes, the local cooling effect of afforestation is intensified. At some locations in Europe, temperature reductions reached values up to −1.9 K. In winter, afforestation did not have a significant local effect due to a small general impact of the snow-masking effect.
Beyond these local effects, afforestation also had an impact on the downwind climate conditions. By increasing the local evapotranspiration rates, afforestation led to an increase in the atmospheric moisture content and thus to non-locally enhanced cloud cover and precipitation sums in Scandinavia, central Europe, and parts of southern Europe. These changes in the atmospheric water cycle resulted in a slight warming of the mean non-local surface temperatures in winter and a slight cooling in these regions in summer. Although these mean non-local temperature changes are not statistically significant, non-local afforestation effects can be consistently explained by non-local changes in the energy and water balance, which had a notable impact on the non-local climate conditions in Europe, especially during temperature extremes.
The applied land use dataset is accessible from the World Data Center for Climate (WDCC) at DKRZ (https://doi.org/10.26050/WDCC/LUC_hist_EU_v1.1, Hoffmann et al., 2022). The ERA5 reanalysis data are obtained from the ECMWF (https://apps.ecmwf.int/data-catalogues/era5/?class=ea, Hersbach et al., 2018). The CCLM-VEG3D data are available upon request from the corresponding author.
The supplement related to this article is available online at: https://doi.org/10.5194/bg-21-811-2024-supplement.
MB designed the study, performed the CCLM-VEG3D simulations, and wrote the paper. MB and VKMS analyzed the data and MB prepared the figures. All authors contributed to discussion, interpretation of results, and text revisions.
The contact author has declared that none of the authors has any competing interests.
Publisher's note: Copernicus Publications remains neutral with regard to jurisdictional claims made in the text, published maps, institutional affiliations, or any other geographical representation in this paper. While Copernicus Publications makes every effort to include appropriate place names, the final responsibility lies with the authors.
Marcus Breil was supported by the Vector Foundation. Joaquim G. Pinto was supported by the AXA Research Fund.
This paper was edited by Kirsten Thonicke and reviewed by two anonymous referees.
Asselin, O., Leduc, M., Paquin, D., Di Luca, A., Winger, K., Bukovsky, M., Music, B., and Giguère, M.: On the Intercontinental Transferability of Regional Climate Model Response to Severe Forestation, Climate, 10, 138, https://doi.org/10.3390/cli10100138, 2022
Bala, G., Caldeira, K., Wickett, M., Phillips, T. J., Lobell, D. B., Delire, C., and Mirin, A.: Combined climate and carbon-cycle effects of large-scale deforestation, P. Natl. Acad. Sci. USA, 104, 6550–6555, https://doi.org/10.1073/pnas.0608998104, 2007.
Bonan, G. B.: Forests and climate change: forcings, feedbacks, and the climate benefits of forests, Science, 320, 1444–1449, https://doi.org/10.1126/science.1155121, 2008.
Breil, M. and Schädler, G.: The reduction of systematic temperature biases in soil moisture-limited regimes by stochastic root depth variations, J. Hydrometeorol., 22, 1897–1911, https://doi.org/10.1175/JHM-D-20-0265.1, 2021.
Breil, M., Rechid, D., Davin, E. L., de Noblet-Ducoudré, N., Katragkou, E., Cardoso, R. M., Hoffmann, P., Jach, L. L., Soares, P. M. M., Sofiadis, G., Strada, S., Strandberg, G., Tölle, M. H., and Warrach-Sagi, K.: The opposing effects of reforestation and afforestation on the diurnal temperature cycle at the surface and in the lowest atmospheric model level in the European summer, J. Clim., 33, 9159–9179, https://doi.org/10.1175/JCLI-D-19-0624.1, 2020.
Breil, M., Krawczyk, F., and Pinto, J. G.: The response of the regional longwave radiation balance and climate system in Europe to an idealized afforestation experiment, Earth Syst. Dynam., 14, 243–253, https://doi.org/10.5194/esd-14-243-2023, 2023a.
Breil, M., Weber, A., and Pinto, J. G.: The potential of an increased deciduous forest fraction to mitigate the effects of heat extremes in Europe, Biogeosciences, 20, 2237–2250, https://doi.org/10.5194/bg-20-2237-2023, 2023b.
Bright, R. M., Davin, E., O'Halloran, T., Pongratz, J., Zhao, K., and Cescatti, A.: Local temperature response to land cover and management change driven by non-radiative processes, Nat. Clim. Change, 7, 296–302, https://doi.org/10.1038/nclimate3250, 2017.
Burakowski, E., Tawfik, A., Ouimette, A., Lepine, L., Novick, K., Ollinger, S., Zarzycki, C., and Bonan, G.: The role of surface roughness, albedo, and Bowen ratio on ecosystem energy balance in the Eastern United States, Agr. Forest Meteorol., 249, 367–376, https://doi.org/10.1016/j.agrformet.2017.11.030, 2018.
Davin, E. L., Rechid, D., Breil, M., Cardoso, R. M., Coppola, E., Hoffmann, P., Jach, L. L., Katragkou, E., de Noblet-Ducoudré, N., Radtke, K., Raffa, M., Soares, P. M. M., Sofiadis, G., Strada, S., Strandberg, G., Tölle, M. H., Warrach-Sagi, K., and Wulfmeyer, V.: Biogeophysical impacts of forestation in Europe: first results from the LUCAS (Land Use and Climate Across Scales) regional climate model intercomparison, Earth Syst. Dynam., 11, 183–200, https://doi.org/10.5194/esd-11-183-2020, 2020.
Duveiller, G., Hooker, J., and Cescatti, A.: The mark of vegetation change on Earth's surface energy balance, Nat. Commun., 9, 679, https://doi.org/10.1038/s41467-017-02810-8, 2018.
European Space Agency: Land Cover CCI Product User Guide Version 2, Tech. Rep., European Space Agency, https://www.esa-landcover-cci.org/?q=webfm_send/84 (last access: 9 February 2024), 2017.
Essery, R.: Large-scale simulations of snow albedo masking by forests, Geophys. Res. Lett., 40, 5521–5525, https://doi.org/10.1002/grl.51008, 2013.
European Environment Agency: Climate change, impacts and vulnerability in Europe 2016, an indicator-based report, Publications Office, https://doi.org/10.2800/534806, 2017.
Gulev, S. K., Thorne, P. W., Ahn, J., Dentener, F. J., Domingues, C. M., Gerland, S., Gong, D., Kaufman, D. S., Nnamchi, H. C., Quaas, J., Rivera, J. A., Sathyendranath, S., Smith, S. L., Trewin, B., von Schuckmann, K., and Vose, R. S.: Changing State of the Climate System, in: Climate Change 2021: The Physical Science Basis. Contribution of Working Group I to the Sixth Assessment Report of the Intergovernmental Panel on Climate Change, edited by: Masson-Delmotte, V., Zhai, P., Pirani, A., Connors, S. L., Péan, C., Berger, S., Caud, N., Chen, Y., Goldfarb, L., Gomis, M. I., Huang, M., Leitzell, K., Lonnoy, E., Matthews, J. B. R., Maycock, T. K., Waterfield, T., Yelekçi, O., Yu, R., and Zhou, B., Cambridge University Press, Cambridge, United Kingdom and New York, NY, USA, 287–422, https://doi.org/10.1017/9781009157896.004, 2021.
Harper, A. B., Powell, T., Cox, P. M., House, J., Huntingford, C., Lenton, T. M., Sitch, S., Burke, E., Chadburn, S. E., Collins, W. J., Comyn-Platt, E., Daioglou, V., Doelman, J. C., Hayman, G., Robertson, E., van Vuuren, D., Wiltshire, A., Webber, C. P., Bastos, A., Boysen, L., Ciais, P., Devaraju, N., Jain, A. K., Krause, A., Poulter, B., and Shu, S.: Land-use emissions play a critical role in land-based mitigation for Paris climate targets, Nat. Commun., 9, 1–13, https://doi.org/10.1038/s41467-018-05340-z, 2018.
Hersbach, H., Bell, B., Berrisford, P., Biavati, G., Horányi, A., Muñoz Sabater, J., Nicolas, J., Peubey, C., Radu, R., Rozum, I., Schepers, D., Simmons, A., Soci, C., Dee, D., and Thépaut, J.-N.: ERA5 hourly data on single levels from 1940 to present, Copernicus Climate Change Service (C3S) Climate Data Store (CDS) [data set], https://doi.org/10.24381/cds.adbb2d47, 2018.
Hersbach, H., Bell, B., Berrisford, P., Hirahara, S., Horanyi, A., Munoz-Sabater, J., Nicolas, J., Peubey, C., Radu, R., Schepers, D., Simmons, A., Soci, C., Abdalla, S., Abellan, X., Balsamo, G., Bechtold, P., Biavati, G., Bidlot, J., Bonavita, M., de Chiara, G., Dahlgren, P., Dee, D., Diamantakis, M., Dragani, R., Flemming, J., Forbes, R., Fuentes, M., Geer, A., Haimberger, L., Healy, S., Hogan, R. J., Holm, E., Janiskova, M., Keeley, S., Laloyaux, P., Lopez, P., Lupu, C., Radnoti, G., de Rosnay, P., Rozum, I., Vamborg, F., Villaume, S., and Thepaut, J.-N.: The ERA5 global reanalysis, Q. J. Roy. Meteorol. Soc., 146, 1999–2049, https://doi.org/10.1002/qj.3803, 2020.
Hoffmann, P., Reinhart, V., and Rechid, D.: LUCAS LUC historical land use and land cover change dataset for Europe (Version 1.1), World Data Center for Climate (WDCC) at DKRZ [data set], https://doi.org/10.26050/WDCC/LUC_hist_EU_v1.1, 2022.
Hoffmann, P., Reinhart, V., Rechid, D., de Noblet-Ducoudré, N., Davin, E. L., Asmus, C., Bechtel, B., Böhner, J., Katragkou, E., and Luyssaert, S.: High-resolution land use and land cover dataset for regional climate modelling: historical and future changes in Europe, Earth Syst. Sci. Data, 15, 3819–3852, https://doi.org/10.5194/essd-15-3819-2023, 2023.
Hurtt, G. C., Chini, L., Sahajpal, R., Frolking, S., Bodirsky, B. L., Calvin, K., Doelman, J. C., Fisk, J., Fujimori, S., Klein Goldewijk, K., Hasegawa, T., Havlik, P., Heinimann, A., Humpenöder, F., Jungclaus, J., Kaplan, J. O., Kennedy, J., Krisztin, T., Lawrence, D., Lawrence, P., Ma, L., Mertz, O., Pongratz, J., Popp, A., Poulter, B., Riahi, K., Shevliakova, E., Stehfest, E., Thornton, P., Tubiello, F. N., van Vuuren, D. P., and Zhang, X.: Harmonization of global land use change and management for the period 850–2100 (LUH2) for CMIP6, Geosci. Model Dev., 13, 5425–5464, https://doi.org/10.5194/gmd-13-5425-2020, 2020.
Jacob, D., Petersen, J., Eggert, B., Alias, A., Christensen, O. B., Bouwer, L. M., Braun, A., Colette, A., Deque, M., Georgievski, G., Georgopoulou, E., Gobiet, A., Menut, L., Nikulin, G., Haensler, A., Hempelmann, N., Jones, C., Keuler, K., Kovats, S., Kröner, N., Kotlarski, S., Kriegsmann, A., Martin, E., van Meijgaard, E., Moseley, C., Pfeifer, S., Preuschmann, S., Radermacher, C., Radtke, K., Rechid, D., Rounsevell, M., Samuelsson, P., Somot, S., Soussana J.-F., Teichmann, C., Valentini, R., Vautard, R., Weber, B., and Yiou, P.: EURO-CORDEX: new high-resolution climate change projections for European impact research, Reg. Environ. Change, 14, 563–578, https://doi.org/10.1007/s10113-013-0499-2, 2014.
Kotlarski, S., Keuler, K., Christensen, O. B., Colette, A., Déqué, M., Gobiet, A., Goergen, K., Jacob, D., Lüthi, D., van Meijgaard, E., Nikulin, G., Schär, C., Teichmann, C., Vautard, R., Warrach-Sagi, K., and Wulfmeyer, V.: Regional climate modeling on European scales: a joint standard evaluation of the EURO-CORDEX RCM ensemble, Geosci. Model Dev., 7, 1297–1333, https://doi.org/10.5194/gmd-7-1297-2014, 2014.
Lawrence, D. and Vandecar, K.: Effects of tropical deforestation on climate and agriculture, Nat. Clim. Change, 5, 27–36, https://doi.org/10.1038/nclimate2430, 2015.
Lee, X., Goulden, M. L., Hollinger, D. Y., Barr, A., Black, T. A., Bohrer, G., Bracho, R., Drake, B., Goldstein, A., Gu, L., Katul, G., Kolb, T., Law, B. E., Margolis, H., Meyers, T., Monson, R., Munger, W., Oren, R., Paw, K. T. U., Richardson, A. D., Schmid, H. P., Staebler, R., Wofsy, S., and Zhao, L.: Observed increase in local cooling effect of deforestation at higher latitudes, Nature, 479, 384–387, https://doi.org/10.1038/nature10588, 2011.
Lejeune, Q., Seneviratne, S. I., and Davin, E. L.: Historical land-cover change impacts on climate: Comparative assessment of LUCID and CMIP5 multimodel experiments, J. Clim., 30, 1439–1459, https://doi.org/10.1175/JCLI-D-16-0213.1, 2017.
Li, Y., Zhao, M., Motesharrei, S., Mu, Q., Kalnay, E., and Li, S.: Local cooling and warming effects of forests based on satellite observations, Nat. Commun., 6, 6603, https://doi.org/10.1038/ncomms7603, 2015.
Luterbacher, J., Werner, J. P., Smerdon, J. E., Fernández-Donado, L., González-Rouco, F. J., Barriopedro, D., Ljungqvist, F. C., Büntgen, U., Zorita, E., Wagner, S., Esper, J., McCarroll, D., Toreti, A., Frank, D., Jungclaus, J. H., Barriendos, M., Bertolin, C., Bothe, O., Brázdil, R., Camuffo, D., Dobrovolný, P., Gagen, M., García-Bustamante, E., Ge, Q., Gómez-Navarro, J. J., Guiot, J., Hao, Z., Hegerl, G. C., Holmgren, K., Klimenko, V. V., Martín-Chivelet, J., Pfister, C., Roberts, N., Schindler, A., Schurer, A., Solomina, O., von Gunten, L., Wahl, E., Wanner, H., Wetter, O., Xoplaki, E., Yuan, N., Zanchettin, D., Zhang, H., and Zerefos, C.: European summer temperatures since Roman times, Environ. Res. Lett., 11, 024001, https://doi.org/10.1088/1748-9326/11/2/02400, 2016.
Luyssaert, S., Ciais, P., Piao, S. L., Schulze, E. D., Jung, M., Zaehle, S., Schelhaas, M. J., Reichstein, M., Churkina, G., Papale, D., Abril, G., Beer, C., Grace, J., Loustau, D., Matteucci, G., Magnani, F., Nabuurs, G. J., Verbeeck, H., Sulkava, M., van der Werf, G. R., Janssens, I. A., and members of the Carboeurope-Ip Synthesis Team: The European carbon balance, Part 3: forests, Glob. Change Biol., 16, 1429–1450, https://doi.org/10.1111/j.1365-2486.2009.02056.x, 2010.
Meier, R., Schwaab, J., Seneviratne, S. I., Sprenger, M., Lewis, E., and Davin, E. L.: Empirical estimate of forestation-induced precipitation changes in Europe, Nat. Geosci., 14, 473–478, https://doi.org/10.1038/s41561-021-00773-6, 2021.
Muñoz-Sabater, J., Dutra, E., Agustí-Panareda, A., Albergel, C., Arduini, G., Balsamo, G., Boussetta, S., Choulga, M., Harrigan, S., Hersbach, H., Martens, B., Miralles, D. G., Piles, M., Rodríguez-Fernández, N. J., Zsoter, E., Buontempo, C., and Thépaut, J.-N.: ERA5-Land: a state-of-the-art global reanalysis dataset for land applications, Earth Syst. Sci. Data, 13, 4349–4383, https://doi.org/10.5194/essd-13-4349-2021, 2021.
Pan, Y., Birdsey, R. A., Fang, J., Houghton, R., Kauppi, P. E., Kurz, W. A., Phillips, O. L., Shvidenko, A., Lewis, S. L., Canadell, J. G., Ciais, P., Jackson, R. B., Pacala, S. W., McGuire, A. D., Paio, S., Rautiainen, A., Sitch, S., and Hayes, D.: A large and persistent carbon sink in the world's forests, Science, 333, 988–993, https://doi.org/10.1126/science.1201609, 2011.
Perugini, L., Caporaso, L., Marconi, S., Cescatti, A., Quesada, B., de Noblet-Ducoudré, N., House, J. I., and Arneth, A.: Biophysical effects on temperature and precipitation due to land cover change, Environ. Res. Lett., 12, 053002, https://doi.org/10.1088/1748-9326/aa6b3f, 2017.
Pielke Sr, R. A., Pitman, A., Niyogi, D., Mahmood, R., McAlpine, C., Hossain, F., Goldewijk, K. K., Nair, U., Betts, R., Fall, S., Reichstein, M., Kabat, P., and de Noblet, N.: Land use/land cover changes and climate: modeling analysis and observational evidence, WIRES Clim. Change, 2, 828–850, https://doi.org/10.1002/wcc.144, 2011.
Rockel, B., Will, A., and Hense, A.: The Regional Climate Model COSMO-CLM (CCLM), Meteorol. Z., 17, 347–348, https://doi.org/10.1127/0941-2948/2008/0309, 2008.
Roe, S., Streck, C., Obersteiner, M., Frank, S., Griscom, B., Drouet, L., Fricko, O., Gusti, M., Harris, N., Hasegawa, T., Hausfather, Z., Havlik, P., House, J., Nabuurs, G.-J., Popp, A., Sanz Sanchez, M. J., Sanderman, J., Smit, P., Stehfest, E., and Lawrence, D.: Contribution of the land sector to a 1.5 ∘C world, Nat. Clim. Change, 9, 817–828, https://doi.org/10.1038/s41558-019-0591-9, 2019.
Seneviratne, S. I., Corti, T., Davin, E. L., Hirschi, M., Jaeger, E. B., Lehner, I., Orlowsky, B., and Teuling, A. J.: Investigating soil moisture–climate interactions in a changing climate: A review, Earth-Sci. Rev., 99, 125–161, https://doi.org/10.1016/j.earscirev.2010.02.004, 2010.
Sonntag, S., Pongratz, J., Reick, C. H., and Schmidt, H.: Reforestation in a high-CO2 world – Higher mitigation potential than expected, lower adaptation potential than hoped for, Geophys. Res. Lett., 43, 6546–6553, https://doi.org/10.1002/2016GL068824, 2016.
Strandberg, G. and Kjellström, E.: Climate impacts from afforestation and deforestation in Europe, Earth Int., 23, 1–27, https://doi.org/10.1175/EI-D-17-0033.1, 2019.
Twardosz, R., Walanus, A., and Guzik, I.: Warming in Europe: Recent trends in annual and seasonal temperatures, Pure Appl. Geophys., 178, 4021–4032, https://doi.org/10.1007/s00024-021-02860-6, 2021.
Wasserstein, R. L. and Lazar, N. A.: The ASA statement on p-values: context, process, and purpose, Am. Stat., 70, 129–133, https://doi.org/10.1080/00031305.2016.1154108, 2016.
Zeppetello, L. R. V., Parsons, L. A., Spector, J. T., Naylor, R. L., Battisti, D. S., Masuda, Y. J., and Wolff, N. H.: Large scale tropical deforestation drives extreme warming, Environ. Res. Lett., 15, 084012, https://doi.org/10.1088/1748-9326/ab96d2, 2020.
Zhang, L., Dawes, W. R., and Walker, G. R.: Response of mean annual evapotranspiration to vegetation changes at catchment scale, Water Resour. Res., 37, 701–708, https://doi.org/10.1029/2000WR900325, 2001.