the Creative Commons Attribution 4.0 License.
the Creative Commons Attribution 4.0 License.
 | 26 Feb 2025
Spatial distributions of iron and manganese in surface waters of the Arctic's Laptev and East Siberian seas
Naoya Kanna
Kazutaka Tateyama
Takuji Waseda
Anna Timofeeva
Maria Papadimitraki
Laura Whitmore
Hajime Obata
Daiki Nomura
Hiroshi Ogawa
Youhei Yamashita
Igor Polyakov
The Arctic Laptev and East Siberian seas (LESS) have high biogeochemical activity. Nutrient inputs associated with river runoff and shelf sediment–water exchange processes are vital for supporting primary production in the LESS. Relative to macronutrients, data on dissolved iron (dFe) and manganese (dMn), which are essential micronutrients for primary producers, have historically been sparse for LESS. Some dFe and dMn are reportedly carried in the central Arctic by the Transpolar Drift, a major current that directly transports Eurasian shelf water, river water, and sea ice from the LESS continental margins. However, the supply of dFe and dMn to the surface waters of the LESS and the subsequent biogeochemical processes are not well constrained. In the summer of 2021, we investigated the following questions: what are the sources of dFe and dMn in the surface layer and which factors control their concentrations and distributions on the LESS continental margins? We demonstrated strong regional controls on dFe and dMn distributions based on distinct hydrographic regimes between the eastern side of the LESS (East Siberian Sea and Chukchi Abyssal Plain) and the western side (Makarov and Amundsen basins). Specifically, the East Siberian Sea and Chukchi Abyssal Plain were governed by Pacific-sourced water, and the Makarov and Amundsen basins were influenced by Atlantic-sourced water. Pacific-sourced water contained higher levels of dMn released from continental shelf sediments than Atlantic-sourced water. In contrast, elevated dFe signals were not observed, likely because sedimentary dFe was more rapidly removed from the water column through oxidation or scavenging than dMn was. The impact of river water discharge on the dFe distributions of Pacific- and Atlantic-sourced water was significant. A positive correlation between the fraction of meteoric water (river water and precipitation), dFe, and humic-like colored dissolved organic matter (CDOM) in these waters confirmed that dFe and CDOM are common freshwater sources. Terrigenous organic ligands likely stabilize Fe in the dissolved phase, which is not the case for Mn. Sea ice melting and formation were not significant sources during the observation period. We conclude that the major sources controlling the dFe and dMn distributions on the LESS continental margins are river discharge and shelf sediment input.
- Article
(3676 KB) - Full-text XML
-
Supplement
(1220 KB) - BibTeX
- EndNote


The Arctic Laptev and East Siberian seas (LESS) are strongly influenced by ongoing changes in the Arctic climate. The LESS has shown a drastic increase in net primary production in recent decades, as evidenced by satellite records (Lewis et al., 2020), as the region has warmed (Rantanen et al., 2022) and seasonal ice coverage has decreased (Fox-Kemper et al., 2021; Sumata et al., 2023). Since the middle of the 2010s, increased penetration of Atlantic Water into the LESS continental margins has driven “Atlantification”, which has weakened oceanic stratification, enhanced upward fluxes of heat and nutrients due to increased vertical mixing, and reduced sea ice coverage (Polyakov et al., 2017, 2020, 2023). Given the increasing trend in the discharge of Eurasian rivers (Feng et al., 2021), the export of terrestrial materials, including nutrients and trace metals, to the LESS might intensify, potentially affecting biological production and carbon deposition on the shelves. The fluxes of shelf-derived materials from the LESS to the central Arctic have likely increased over the past decade (Kipp et al., 2018). Moreover, Arctic sea ice often contains sediments entrained in the East Siberian Arctic Shelf (Eicken et al., 2000, 2005; Hölemann et al., 1999a; Krumpen et al., 2020; Waga et al., 2022; Wegner et al., 2017), such that the decreasing trend in seasonal ice coverage might affect material fluxes to the central Arctic upon melting. Therefore, the LESS region is key to understanding how climate change impacts biogeochemical cycling in the Arctic Ocean.
Iron (Fe) and manganese (Mn) are essential micronutrients for primary producers and are involved in important phytoplankton metabolic pathways (Morel and Price, 2003; Twining and Baines, 2013). Fe and Mn are supplied to surface waters from common sources, such as the porewaters of shelf sediments (Cid et al., 2012; Jensen et al., 2020; Kondo et al., 2016), sea ice meltwater (Bolt et al., 2020; Evans and Nishioka, 2019; Hölemann et al., 1999a, b), and river water (Guieu et al., 1996; Pokrovsky et al., 2016; Savenko and Pokrovsky, 2019). When paired, the Fe and Mn concentrations can often be used as indicators of common-source fluxes (Jensen et al., 2020; Landing and Bruland, 1987). Ongoing changes in the LESS may intensify the supply of Fe and Mn to surface waters in the central Arctic. Some Fe and Mn derived from these sources are transported to the central Arctic by the Transpolar Drift, a major current that directly transports Eurasian shelf water, river water, and sea ice from the LESS (Charette et al., 2020; Gerringa et al., 2021). A few studies have indicated the importance of Lena River runoff and sea ice melt for Fe and Mn distributions near the Laptev Sea (Hölemann et al., 1999b, 2005; Klunder et al., 2012; Middag et al., 2011). However, the LESS region is still one of the least studied areas of the Arctic Ocean in terms of trace metal dynamics. In particular, limited data on trace metals have been reported over the East Siberian Sea.
This study reports the spatial distributions of Fe and Mn in the surface waters of the LESS, including the East Siberian Sea, Chukchi Abyssal Plain, Makarov Basin, and Amundsen Basin. Observations were made through international cooperation with the Nansen and Amundsen Basin Observational System (NABOS) expedition during the late summer of 2021 in the Arctic Ocean. A detailed water mass analysis was performed to clarify potential sources of Fe and Mn in the surface LESS. Sea ice cores were also collected to calculate Fe and Mn sea ice inventories, and the potential supply to the surface ocean upon melting was evaluated. Moreover, we investigated the interaction of dissolved organic matter with Fe and Mn in the LESS. By combining these datasets, we interpreted the factors controlling the concentrations and the distributions of Fe and Mn at the surface of the LESS.
2.1 Shipboard sampling
Observations in the LESS were conducted on board the Russian R/V Akademik Tryoshnikov from September to October 2021 (Fig. 1a). Low-density polyethylene (LDPE) bottles and buckets (Thermo Fisher Scientific, USA), polyethylene bags (GL Sciences, Japan), AcroPak capsules with Supor membrane filters (0.8/0.2 µm pore size, Pall, USA), and a Tygon tube (Masterflex, Germany) used for sampling trace metals were thoroughly acid-cleaned in a class-100 clean-air laboratory. Seawater was collected from a depth of approximately 10 m from the side of the ship using a peristaltic pump (Geopump, Geotech Environmental Equipment, USA) and a Tygon tube. Filtered and unfiltered Fe and Mn samples were obtained to assess their labile particulate fractions. Samples of the dissolved fractions of Fe and Mn (dFe and dMn) were collected in LDPE bottles after filtration through AcroPak filters connected to Tygon tubes. Samples for total acid dissolvable Fe and Mn (TdFe and TdMn) were collected in LDPE bottles without filtration. The pH of the Fe and Mn samples was adjusted to < 1.8 by adding ultrapure-grade 6 M hydrochloric acid (Tamapure AA-100, Tama Chemicals, Japan), and the samples were stored for a year before the analysis. Therefore, the concentration differences between the unfiltered (i.e., TdFe and TdMn) and filtered (i.e., dFe and dMn) samples were attributed to the acid-labile particulate fraction. Samples for nutrient analysis were collected in acrylic vials after filtration. Samples for dissolved organic matter (DOM) were collected in precombusted (450 °C for 5 h) glass bottles after filtration through precombusted glass fiber filters (0.7 µm nominal pore size, Whatman GF/F, UK). The samples for the stable isotope of oxygen (δ18O) in the seawater were collected in glass bottles with rubber inserts in the caps. The samples for nutrients and DOM were frozen immediately after collection at −20 °C and were shipped back to the onshore laboratory.
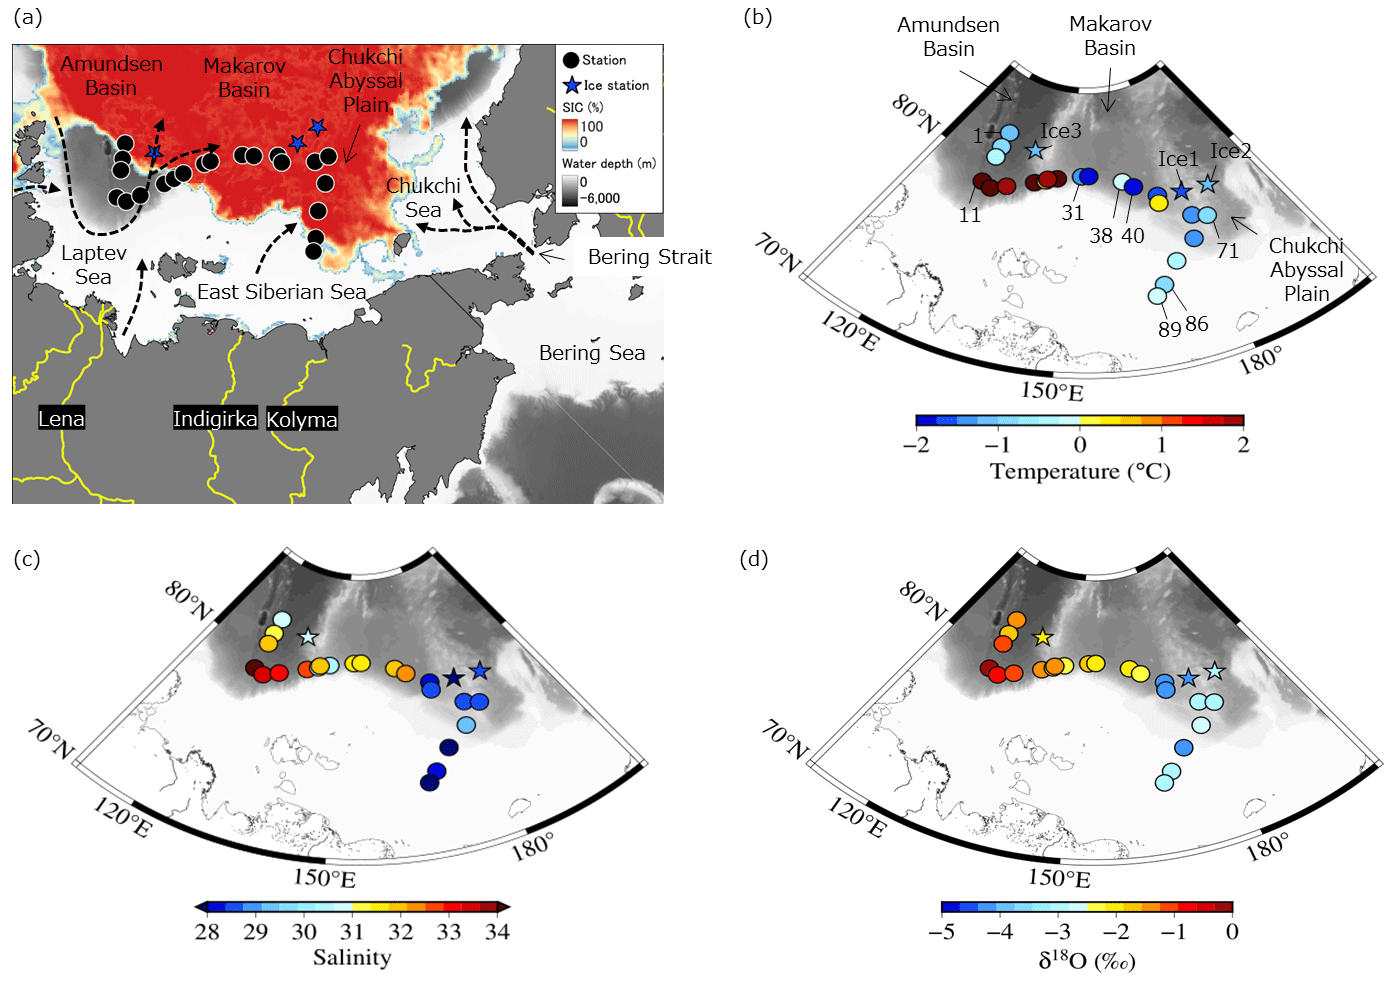
Figure 1(a) Locations of stations sampled in the Arctic's Laptev and East Siberian seas (LESS) in the late summer of 2021. Spatial distributions of (b) water temperature, (c) salinity, and (d) δ18O at the surface. Sea ice concentration (SIC, %) on 1 October 2021 (GCOM-W/AMSR2, Japan Aerospace Exploration Agency) and general water flow on the surface of the LESS (Anderson and Macdonald, 2015; Bauch and Cherniavskaia, 2018; Clement Kinney et al., 2022; Doglioni et al., 2023; Rudels et al., 2004; Stabeno et al., 2018) are depicted in panel (a).
The water properties at depths of 0–30 m were measured using a portable conductivity–temperature–depth (CTD) sensor (RINKO 102, JFE Advantech, Japan) and are shown in a temperature–salinity diagram (Fig. S1 in the Supplement). Full-depth temperature and salinity profiles were obtained using a Seabird SBE911plus CTD system (Figs. S2 and S3).
2.2 Sampling of sea ice and sample processing
Sea ice observations were made at three ice stations on 1 October (St. Ice 1), 2 October (St. Ice 2), and 10 October (St. Ice 3) 2021 (Fig. 1a and b). Water sampling under sea ice was performed to analyze Fe, Mn, nutrients, DOM, and δ18O at depths of 1, 5, and 10 m using the pump system described in Sect. 2.1. Sea ice cores were collected using an ice corer (Mark II Coring System, Kovacs Enterprise, USA) and sectioned into five subsamples using a titanium flat-headed screwdriver. The subsamples were cleaned at the site by removing more than 2 cm of their outer layers using acid-cleaned ceramic knives, following previously reported methods (Evans and Nishioka, 2019; Kanna et al., 2014). The cleaned ice samples were transferred to LDPE buckets. Snow samples were collected in polyethylene bags by using an acid-cleaned polycarbonate scoop. The snow and cleaned ice samples were melted inside a class-100 clean-air bench in the laboratory. The meltwaters for Fe, Mn, nutrients, DOM, and δ18O analyses were subsampled and processed as described in Sect. 2.1. The salinity of the meltwater samples was measured using a portable salinity sensor (Multi 3510; Xylem, USA).
2.3 Sample analysis
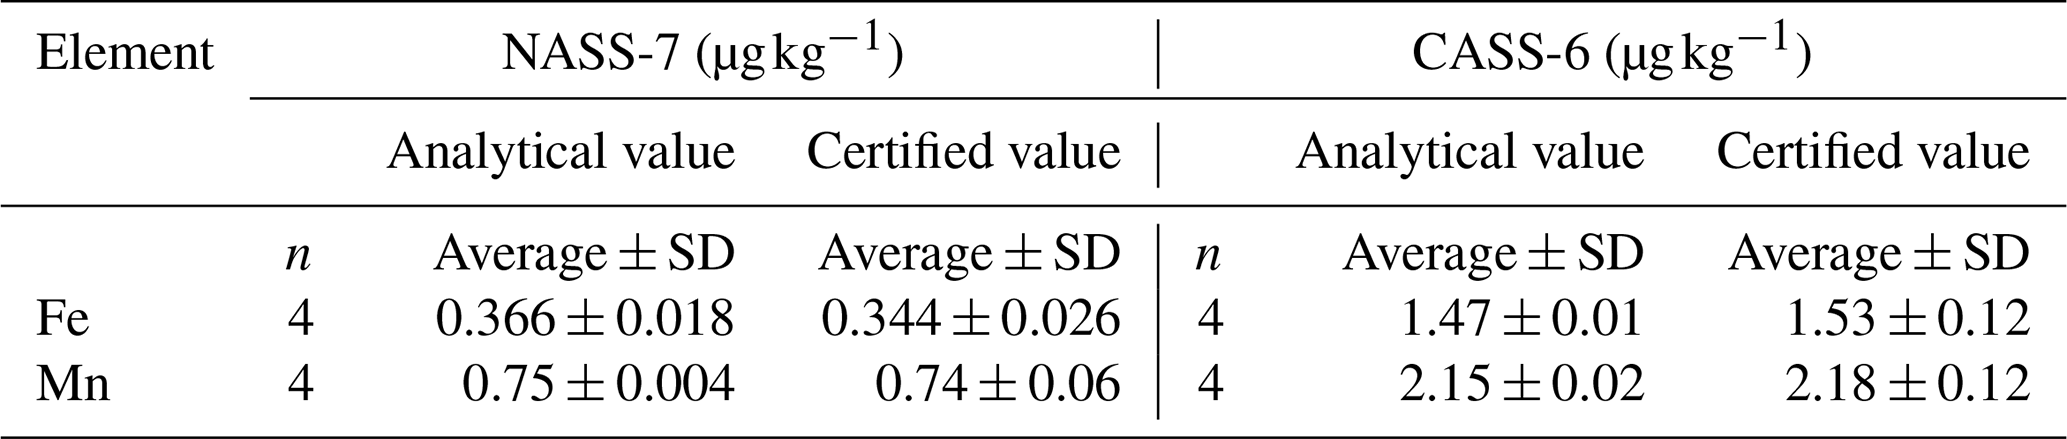
The acidified water samples for Fe and Mn analyses were preconcentrated using a manual solid-phase extraction system equipped with a Nobias Chelate-PA1 resin column (Hitachi High Technologies, Japan) (Sohrin et al., 2008; Kondo et al., 2016; Kanna et al., 2022). Ultrapure-grade nitric acid, acetic acid, and ammonium solution (Tamapure AA-100, Tama Chemicals, Japan) were used for preconcentration and extraction. The water samples were adjusted to pH 6.0 ± 0.1 by adding a 3.6 M ammonium acetate buffer solution prepared from the acetic acid and ammonium solution. Fe and Mn concentrated on the resin were eluted with 2 M nitric acid and analyzed using high-resolution inductively coupled plasma mass spectrometry (ELEMENT XR, Thermo Fisher Scientific, USA). Procedure blanks of Fe and Mn were evaluated using ultrapure water following the preconcentration procedures that showed 0.13 ± 0.04 nmol kg−1 (n=84) for Fe and 0.002 ± 0.005 nmol kg−1 (n=84) for Mn, respectively. Certified reference materials for trace metals, NASS-7 and CASS-6 (National Research Council of Canada), were used to validate the preconcentration procedures. The analytical values were within the error range of the certified reference materials (Table 1).
Table 1Results of measurement of the certified reference materials for the trace metals, NASS-7 and CASS-6.
Dissolved organic carbon (DOC) was analyzed using a total organic carbon analyzer (TOC-L, Shimadzu, Japan). Absorbance spectra for chromophoric dissolved organic matter (CDOM) were analyzed between 200 and 800 nm at 1 nm intervals using a dual-beam spectrophotometer (UV-1800, Shimadzu, Japan) with a 1 cm quartz-windowed cell. The sample spectra were corrected using ultrapure water spectra and converted to Napier absorption coefficients at wavelength (a (λ), m−1) (Green and Blough, 1994).
The excitation–emission matrix fluorescence spectra of the CDOM were analyzed using a fluorescence spectrophotometer (FP-8500, JASCO, Japan). The spectra were obtained at excitation wavelengths ranging from 250 to 500 nm and emission wavelengths ranging from 280 to 600 nm. The fluorescence intensity was corrected to the area under the Raman peak of ultrapure water (excitation wavelength = 350 nm) and calibrated to Raman units (RUs) using the methods outlined by Lawaetz and Stedmon (2009) and Tanaka et al. (2016).
The δ18O value of the water samples was determined using an isotope water analyzer (Picarro L2120-i, Picarro, USA) with an analytical precision of ± 0.3 ‰. Macronutrient concentrations were determined using an autoanalyzer (QuAAtro, BL TEC, Japan) with a continuous-flow system. The measurements were calibrated using seawater as a reference (KANSO Technos, Japan).
2.4 CDOM characterization
The CDOM absorption coefficient at 350 nm (a350) was used to indicate terrestrial humic substances. In addition, parallel factor analysis (PARAFAC) was applied to statistically decompose the excitation–emission matrix fluorescence spectra into their components. PARAFAC was performed in MATLAB (MathWorks, Natick, MA, USA) using the DOMFluor toolbox (Stedmon and Bro, 2008). The dataset used in this study comprises 42 samples of seawater, snow, and sea ice. A brine sample (n=1) was assessed as an outlier in the PARAFAC model and was not used in this study. The wavelengths for PARAFAC were obtained at excitation wavelengths ranging from 250 to 500 nm and emission wavelengths ranging from 280 to 535 nm. The correct number of components was primarily determined using split-half analysis and random initialization (Stedmon and Bro, 2008). The three-component model was validated using the PARAFAC model (Fig. S4). Components 1 and 2 exhibit fluorescence peaks in the visible region, which is defined as visible fluorescence. Component 1 peaks at an emission wavelength of 410 nm and is traditionally categorized as a humic-like fluorophore of marine origin (Coble, 1996). Component 2 peaks at an emission wavelength of 470 nm and is traditionally categorized as a humic-like fluorophore of terrestrial origin (Coble, 1996), although it has been reported that marine microbes produce this type of fluorophore (Goto et al., 2020). In this study, component 1 was combined with component 2 and interpreted as all humic-like fluorophores because their fluorescence intensities were not very different among the sampling locations. Component 3 exhibits fluorescence peaks in the ultraviolet A (UVA) region, which is defined as UVA fluorescence. This fluorophore is traditionally categorized as a protein-like fluorophore (Coble, 1996).
2.5 Calculation for water mass fractions
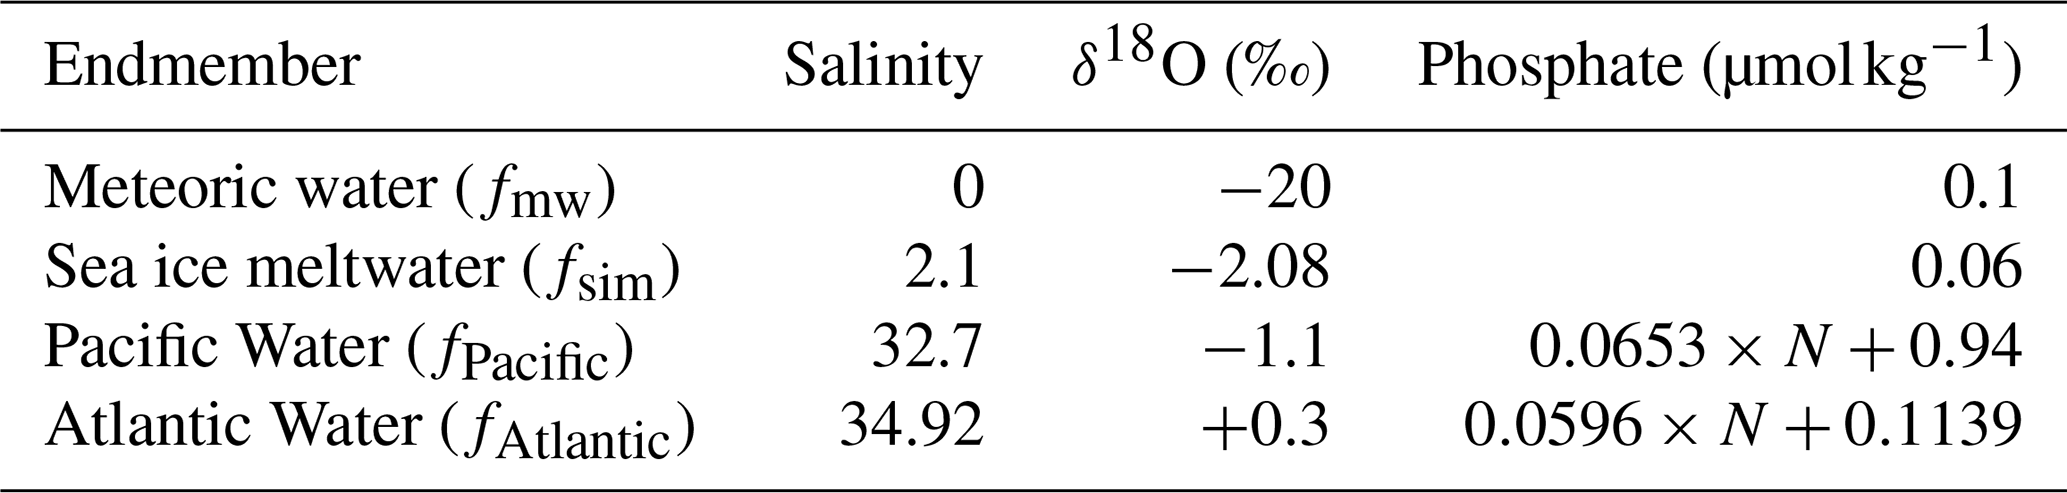
To quantify the relative contribution of freshwater to changes in the surface water properties of the LESS, we assumed a mixture of four components: meteoric water, sea ice meltwater, Pacific Water, and Atlantic Water. Fractions of mass, salinity, and δ18O together with the nitrate : phosphate ratio balance equations are described using the water properties of these four endmembers (Bauch et al., 2011; Charette et al., 2020; Gerringa et al., 2021; Newton et al., 2013):
where f, S, δ, and P are the fractions of mass, salinity, δ18O, and phosphate concentration based on the nitrate : phosphate ratio and the suffixes mw, sim, Pacific, and Atlantic indicate meteoric water, sea ice meltwater, Pacific Water, and Atlantic Water, respectively (Table 2). fmw includes river runoff and local precipitation. The measured values of nitrate + nitrite (N) in each sample were used to compute the individual phosphate endmembers for the Pacific and Atlantic fractions of the Atlantic Water Line (; Bauch et al., 2011) and Pacific Water Line (; Jones et al., 2008) for each sample. Notably, this calculation produced a slightly negative fPacific value owing to inaccuracies in the endmembers and measurements (Bauch et al., 2011). Indeed, our calculation showed negative fPacific values at the four stations, with an average of −2 %. However, this error remains relatively small within the Atlantic regime and is still within the uncertainty (∼ 10 % for marine waters) of the method (Yamamoto-Kawai et al., 2008).
Table 2Endmember values of meteoric water, sea ice meltwater, Pacific Water, and Atlantic Water for salinity, δ18O, and phosphate concentration based on the nitrate : phosphate ratio. N represents the measured value of nitrate + nitrite. The endmember value of sea ice meltwater was obtained from this study, and the others were obtained from the studies performed by Bauch et al. (2011), Gerringa et al. (2021), Jones et al. (2008), and Newton et al. (2013).
3.1 Hydrography of the LESS surface waters
Water properties in the East Siberian Sea and Chukchi Abyssal Plain differed significantly from those of the Makarov and Amundsen basins in the late summer of 2021. The surface waters in the East Siberian Sea and Chukchi Abyssal Plain were relatively cold (temperature < 0 °C) and fresh (salinity < 30) compared with those in the Makarov and Amundsen basins (Figs. 1b, c and S2). The waters in the East Siberian Sea and Chukchi Abyssal Plain were characterized by low δ18O values of less than −2.5 ‰ (Fig. 1d). The differences between the regions were likely due to the magnitude of the mixing of Pacific-sourced water with Atlantic-sourced water, river runoff, and the melting of sea ice. Pacific-sourced water enters the Bering Strait, passes through the Chukchi Sea, and penetrates the East Siberian Sea (Fig. 1a). Atlantic-sourced water enters the Amundsen Basin and flows along a continental slope (Fig. 1a). The mixed layers in the Atlantic and Pacific sectors have different geochemical and physical characteristics. In the temperature–salinity diagram, the properties of the upper water layers (< 30 m) of the East Siberian Sea and Chukchi Abyssal Plain (Sts. 71 and 89 and Ice 1; Fig. 1b) were similar to those of the Surface Polar Mixed Water that originated in the Pacific sector of the Arctic Ocean, which is characterized by temperatures < 0 and salinity < 31 (Figs. 2 and S1). In contrast, the upper water layers found in the Makarov and Amundsen basins (Sts. 1, 11, and 31 and Ice 3; Fig. 1b) are not derived from Surface Polar Mixed Water but are a product of a mixture of warm, saline Atlantic Water (temperature > 0 and salinity > 34.8) and freshwater (Figs. 2 and S1).
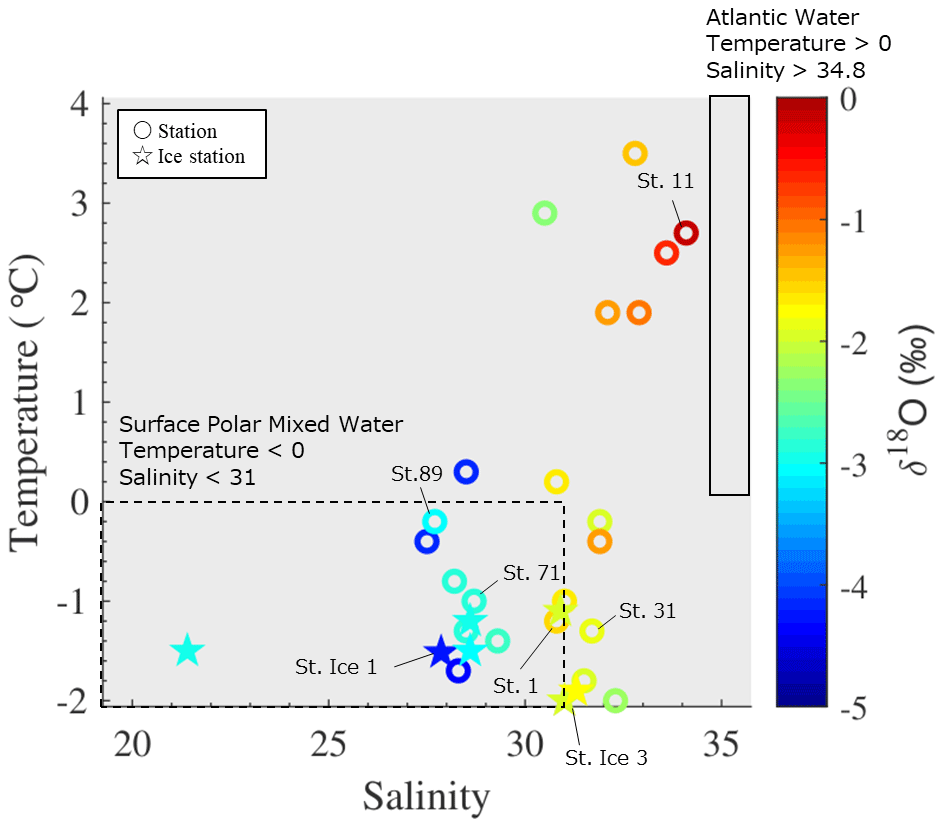
Figure 2Temperature–salinity diagram of the surface with stations sampled in the Arctic's Laptev and East Siberian seas. The color scale shows the δ18O values in each water sample. The temperature and salinity ranges of Surface Polar Mixed Water and Atlantic Water are indicated by the area surrounded by the dashed and solid lines, respectively.
The surface water in the East Siberian Sea and Chukchi Abyssal Plain was generally enriched in silicate and Mn but depleted in Fe relative to the Makarov and Amundsen basins (Fig. 3a–e). The concentrations of silicate and TdMn reached 8.9 µmol L−1 and 83.5 nmol kg−1, respectively, and the concentration of TdFe was as low as 0.9 nmol kg−1 in the East Siberian Sea and Chukchi Abyssal Plain. The TdFe concentration tended to be high along the continental slope (Fig. 3e), with a maximum value of 79.2 nmol kg−1. Differences between the Fe and Mn distributions were also observed at the two shallow (∼ 40 m bottom depth) southernmost stations on the shelf of the East Siberian Sea (Sts. 86 and 89; Fig. 3). The TdFe concentrations were relatively low (1.58–1.62 nmol kg−1) at the stations where the notably high TdMn values were detected (70.7–83.5 nmol kg−1). dFe and dMn, which did not include particles, exhibited spatial variations similar to those of TdFe and TdMn. The concentration differences between the unfiltered (i.e., TdFe and TdMn) and filtered (i.e., dFe and dMn) samples are attributed to the acid-labile particulate fractions of these metals. The acid-labile particulate fractions of Fe accounted for 48 %–61 % of the TdFe but only 6 %–18 % of the TdMn at the stations on the shelf. These results indicate that Fe was relatively abundant in the particulate phase and Mn in the dissolved phase on the shelf. Various DOC concentrations were observed at the different sampling locations (Fig. 3f) and exceeded 100 µmol L−1 at most of the stations. The detailed DOC distributions are discussed in Sect. 4.3 along with the optical information of the CDOM.
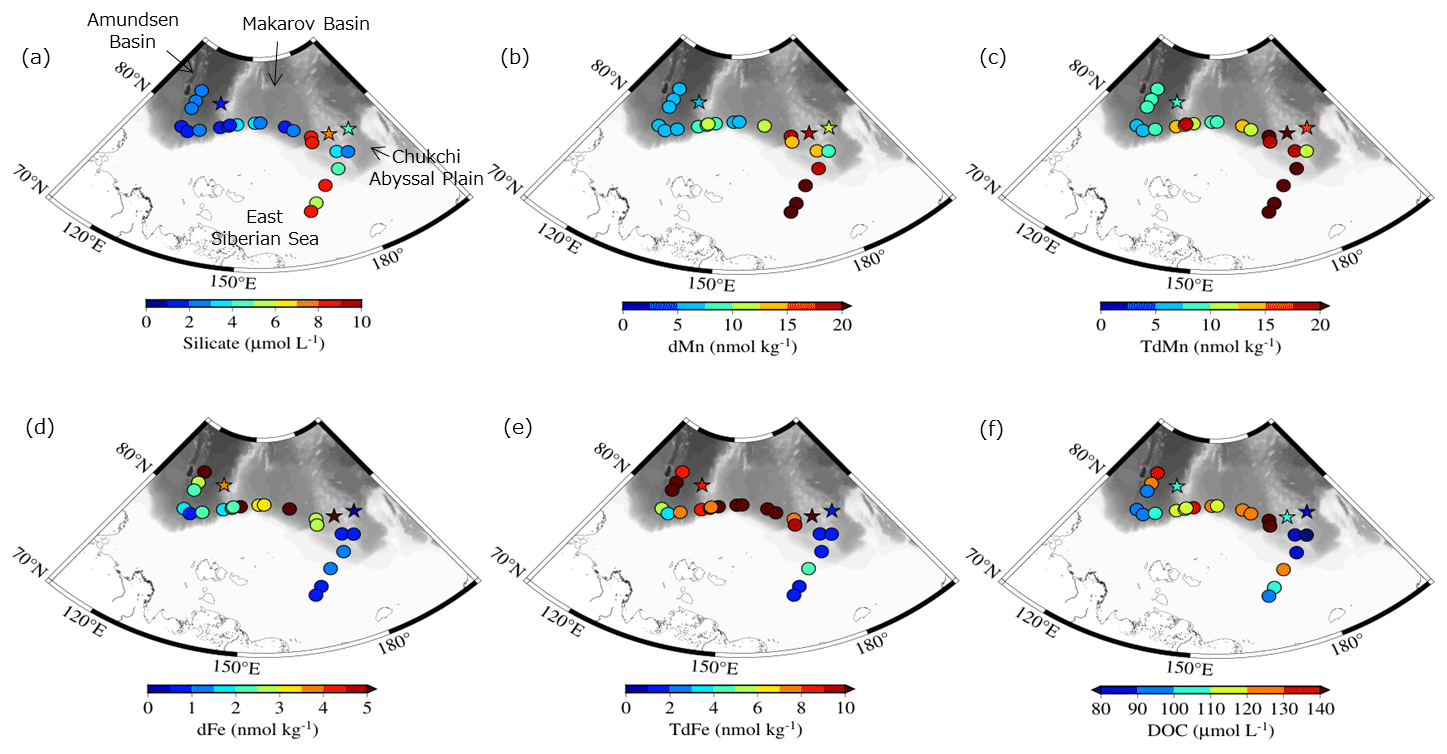
Figure 3Spatial distributions of (a) silicate, (b) dMn, (c) TdMn, (d) dFe, (e) TdFe, and (f) DOC at the surface of the Arctic's Laptev and East Siberian seas.
3.2 Water mass analysis
The mass fractions of the Pacific Water (fPacific), Atlantic Water (fAtlantic), sea ice meltwater (fsim), and meteoric water (fmw) components computed by solving Eqs. (1)–(4) are shown in Fig. 4a–d. fPacific was greater than 50 % in the surface waters of the East Siberian Sea and Chukchi Abyssal Plain and less than 20 % in the Makarov Basin (Fig. 4a). Small values of fPacific (up to 2 %) were observed in the Amundsen Basin. At this location, however, the fPacific signal does not originate from Pacific-sourced water but from water modifications by denitrification within the sediment over the Laptev Shelf (Bauch et al., 2011). A negative or positive value of fsim indicates the addition of brine or meltwater to the surface layer (Fig. 4c). The fsim values in the surface water were as high as 5.8 % over the East Siberian Sea and 3.4 % over the Amundsen Basin (Fig. 4c), where the melting of sea ice was likely predominant. In contrast, a negative value of fsim in the Makarov Basin suggests that sea ice formation is dominant, which agrees with previous studies (Bauch et al., 2011; Yamamoto-Kawai et al., 2005). The fmw in the surface water increased by approximately 20 % from west to east (Fig. 4d). The long-term trend of fmw has increased in the Pacific sector of the Arctic Ocean since 1981 (Polyakov et al., 2020), which may be due to the influence of Siberian river runoff or increased freshwater flux through the Bering Strait.
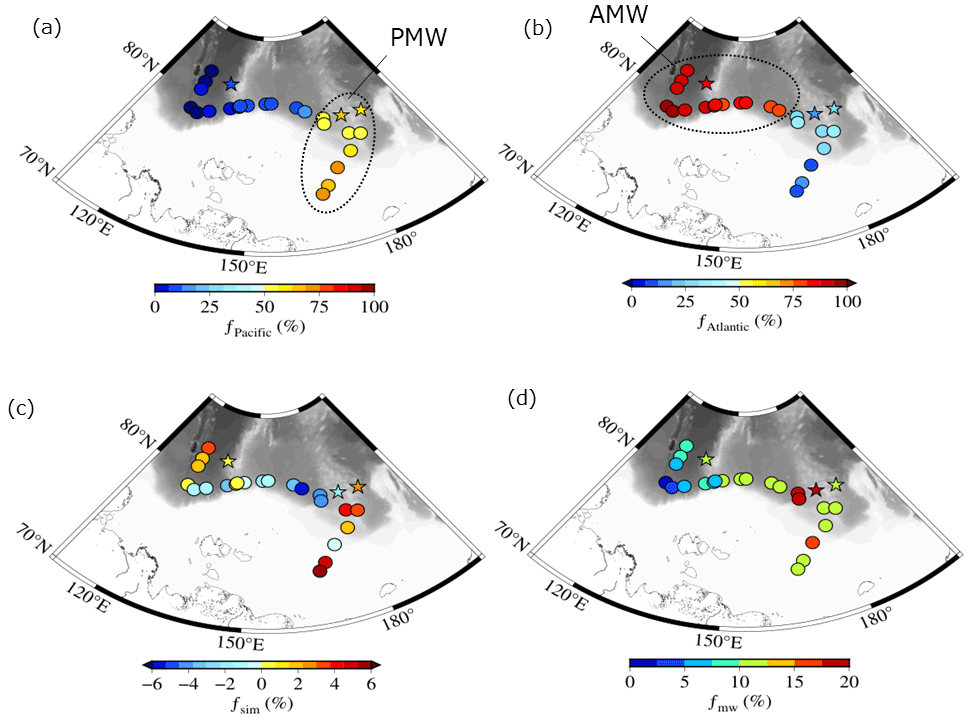
Figure 4Spatial distributions of fractional (a) Pacific Water (fPacific), (b) Atlantic Water (fAtlantic), (c) sea ice meltwater (fsim), and (d) meteoric water (fmw) at the surface of the Arctic's Laptev and East Siberian seas. Abbreviations in panels (a) and (b): Surface Polar Mixed Water (PMW) and Surface Atlantic Mixed Water (AMW).
3.3 Physical and chemical properties of sea ice
During the NABOS expedition in the late summer of 2021, snow, sea ice, and under-ice water were collected from three ice stations (Fig. 1). Detailed observations of the ice cores and snow pits at these stations can be found in the NABOS 2021 Cruise Report (https://uaf-iarc.org/nabos/cruise-reports/, last access: 2 November 2024). Thin-section analysis of a single ice core collected at St. Ice 2 revealed that the sea ice was composed of approximately 9 % granular ice, 37 % columnar ice, and 54 % mixed ice (Fig. S5). Salinity and δ18O values in the sea ice were similar between the stations, ranging from 0 to 3.8 and from −3.6 ‰ to 0 ‰, respectively (Fig. 5a and b). Generally, Fe and Mn concentrations in the sea ice were lower than those in the under-ice water, except for the ice section (0.2 m from the bottom) collected at St. Ice 3 (Fig. 5c–f). The dFe concentrations in the sea ice gradually decreased from 3.2 to 1.7 nmol kg−1 with the ice core depth, while the dMn concentrations increased from 2.4 to 5.2 nmol kg−1. The TdFe and TdMn concentrations exhibited vertical variations, similar to those of the dissolved fractions. The TdFe concentration tended to be higher in the snow samples than in the sea ice and under-ice water; however, this did not apply to TdMn.
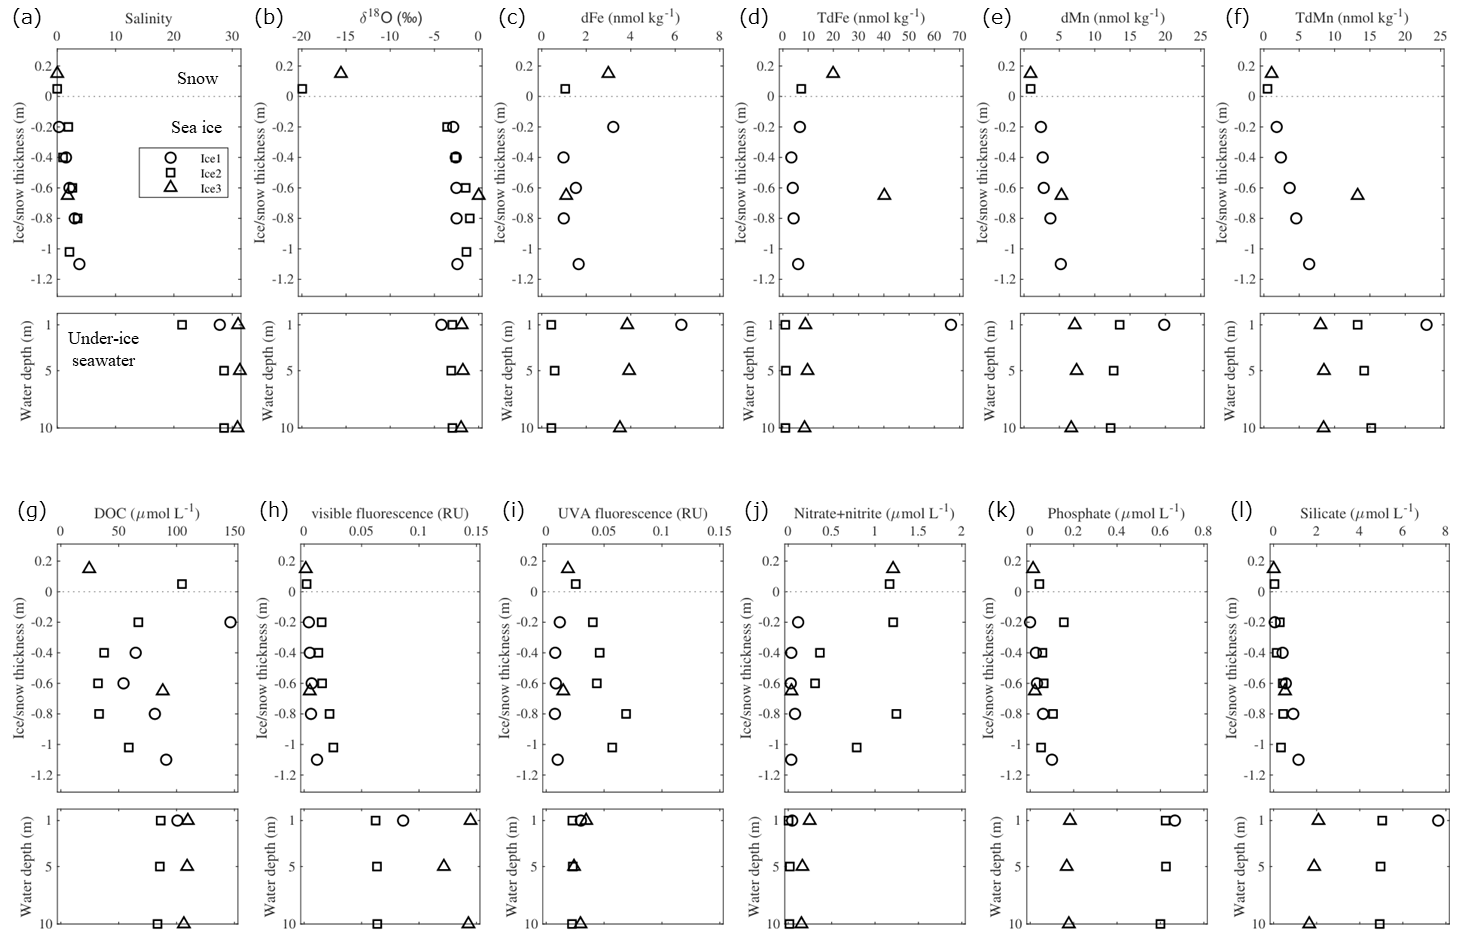
Figure 5Vertical profiles of (a) salinity, (b) δ18O, (c) dFe, (d) TdFe, (e) dMn, (f) TdMn, (g) DOC, (h) visible fluorescence, (i) UVA fluorescence, (j) nitrate + nitrite, (k) phosphate, and (l) silicate in the snow, sea ice, and under-ice water, respectively.
We calculated the inventories of Fe and Mn from the cumulative metal loads of the 110 cm ice cores collected at St. Ice 1 (Table 3). The metal inventory of the ice core was comparable to that obtained from the Canada Basin (Evans and Nishioka, 2019), except for TdFe, which had a lower inventory value. Moreover, the reported particulate Fe inventory in the ice core from the western and central Arctic Ocean (Bolt et al., 2020) exceeded the TdFe inventory in this study. Such discrepancies are likely due to greater heterogeneity in the distribution of particulate Fe loads in Arctic pack ice (Bolt et al., 2020). The sediment loadings of the collected ice samples were low based on visual observations, such that there was no evidence of ice-rafted sediment adding Fe and Mn to the surface waters, although their importance has been reported (Hölemann et al., 1999a, b; Measures, 1999; Rogalla et al., 2022; Tovar-Sánchez et al., 2010).
Table 3Comparison of inventories of Fe and Mn (µmol m−2) in the sea ice core from the Arctic.
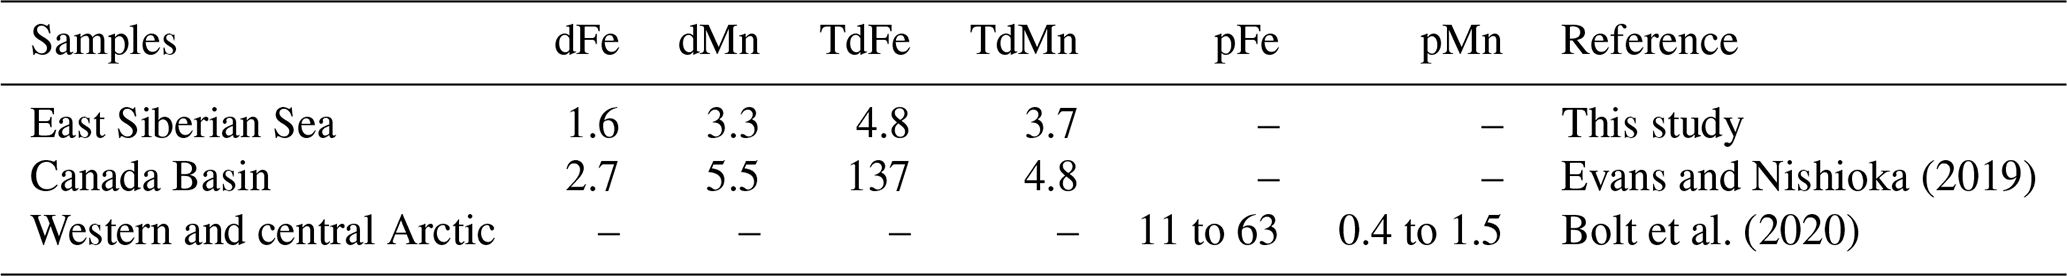
TdFe and TdMn were determined in acidified unfiltered samples. pFe and pMn were determined in acid-digested particle samples.
The DOC concentration varied in the snow (24.5–105 µmol L−1) and sea ice (32.1–147 µmol L−1) samples, while the concentrations were relatively uniform vertically in the under-ice water (84–110 µmol L−1) (Fig. 5g). The optical properties of the CDOM showed that the intensities of the visible fluorescence were lower in the snow and sea ice than in the under-ice water (Fig. 5h). The intensity of the UVA fluorescence was relatively high in the sea ice at St. Ice 2 but not at St. Ice 1 (Fig. 5i). Macronutrients were generally depleted in the sea ice, except for nitrate + nitrite at St. Ice 2, which showed an enrichment of 1.3 µmol L−1 compared to the under-ice water (< 0.25 µmol L−1) (Fig. 5j–l). The enrichment of nitrate + nitrite was also observed in the snow samples (1.2 µmol L−1).
4.1 Comparison of the Fe and Mn concentrations in the seawater and freshwater sources
Variations in the salinity and δ18O values in the surface water of the LESS continental margins are attributed to local precipitation or river runoff and melting or formation of sea ice. Figure 6 shows the salinity–δ18O diagram based on the samples of the surface water, snow, sea ice meltwater, and previously reported freshwater sources (Evans and Nishioka, 2019; Marsay et al., 2018; Peterson et al., 2016). The salinity and δ18O values in most of the surface water samples deviated from those of the meteoric endmember, including the snow meltwater and the Siberian rivers. However, the salinity and δ18O values in the under-ice water at St. Ice 2 rather deviated toward the sea ice endmember, which resulted from substantial input of sea ice meltwater into the station.
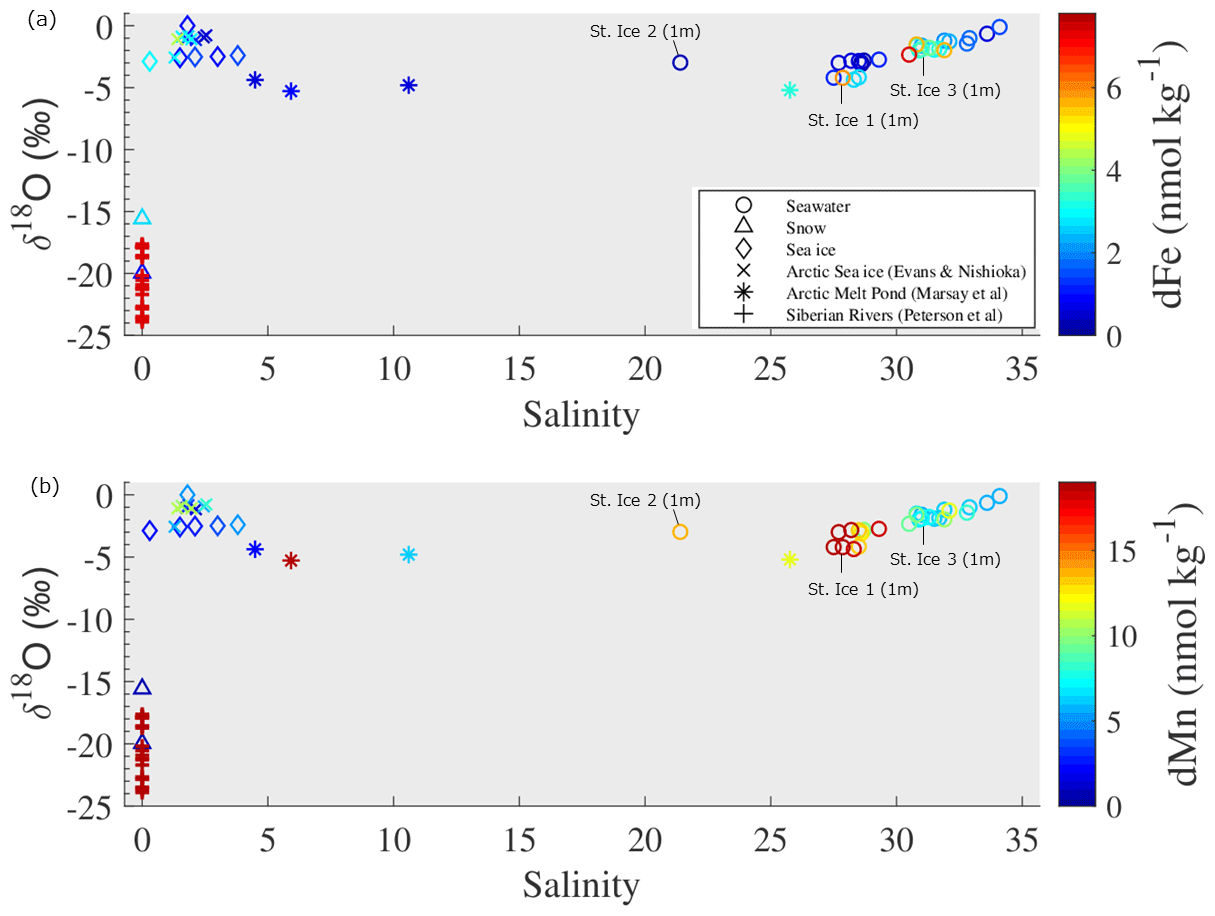
Figure 6Salinity–δ18O diagram for seawater, snow, and sea ice. The color scale shows the concentrations of (a) dFe and (b) dMn in each water sample. The values of the other freshwater sources are cited by Evans and Nishioka (2019), Marsay et al. (2018), and Peterson et al. (2016).
The dMn concentration in the surface water gradually increased with decreasing salinity (Fig. 6b). The dFe concentration also showed a similar increasing trend in salinity ranges from 31 to 34 (Fig. 6a); however, the dFe concentration in less saline waters (salinity < 31) was independent of the salinity variation. Previous studies have shown notably high dFe and dMn concentrations in the Siberian rivers of 1751 ± 1218 and 208 ± 279 nmol L−1, respectively (Peterson et al., 2016), such that river waters must have supplied substantial amounts of Fe and Mn to the surface of the LESS. In contrast, dFe and dMn concentrations in the sea ice endmember were relatively low (2.0 ± 1.3 nmol kg−1 for dFe and 5.3 ± 3.3 nmol kg−1 for dMn). The enriched dMn in the under-ice water at St. Ice 2 (13.5 nmol kg−1) was likely not derived from the input of sea ice meltwater because of the low level of dMn in the sea ice endmember, suggesting the existence of extra Mn sources in the surface water. In the subsequent section, we discuss the factors controlling the distribution of Fe and Mn on the surface of the LESS.
4.2 Potential sources of Fe and Mn in the surface LESS
Based on the water mass analysis described in Sect. 3.2, we classified the surface water as Surface Polar Mixed Water (PMW) and Surface Atlantic Mixed Water (AMW) (Fig. 4a and b; the dotted circles border the area). The PMW contains a large fraction of Pacific-sourced water (fPacific > 50 %) and is mostly found in the East Siberian Sea and Chukchi Abyssal Plain, whereas the AMW is found in the Makarov and Amundsen basins. The PMW is generally characterized by high-silicate, low-Fe, and high-Mn concentrations relative to the AMW (Fig. 3a–e). The high silicate content of the PMW likely resulted from nutrient-rich Pacific Water entering the shallow Bering Strait (Chen et al., 2018; Jensen et al., 2020; Nishino et al., 2013). The maximum surface silicate concentration along the continental margin of the western Makarov Basin, which is a typical signature of runoff from the Lena River in the region (Alling et al., 2010; Anderson et al., 2017), was not observed in this study (Fig. 3a).
A significant correlation between dFe and dMn has been observed in the deeper waters (> 3000 m) of the Amundsen and Makarov basins because scavenging removal is the dominant process in deep-water masses (Klunder et al., 2012). In the LESS surface water, Fe was not correlated with Mn in the unfiltered and filtered fractions (Fig. S6). Additional factors, such as external inputs, influence the distribution of dFe and dMn in surface waters, leading to the disappearance of the Fe–Mn relationship. Moreover, the enrichment of dMn compared to that of dFe (Fig. S6a) was observed in all the sampled surface waters, suggesting the importance of the input fluxes of dMn or the preferential scavenging of dFe relative to dMn. Fe and Mn are redox-active metals that share common sources in surface water, such as sediments, dust deposition, and freshwater inputs. The dust deposition is considered to be of minor importance in the LESS, given the relatively low concentrations of TdFe (∼ 19.9 nmol kg−1) and TdMn (∼ 1.1 nmol kg−1) observed in the snow samples in this study (Fig. 5d, f). In general, the summertime atmospheric deposition fluxes of Fe and Mn into the Arctic Ocean are reportedly low (Kadko et al., 2016; Marsay et al., 2018), especially in comparison to Arctic rivers and coastal erosion and diagenetic fluxes from shelf sediments (Charette et al., 2020; Jensen et al., 2021; Kadko et al., 2018). In the following discussion, we evaluate the potential sources (sedimentary input, river runoff, and sea ice formation and melt) of these metals in the PMW and AMW.
4.2.1 Sedimentary input
To distinguish between the shelf-derived Fe and Mn, parameter N∗ (; Gruber and Sarmiento, 1997) was evaluated for the PMW and AMW. A negative or positive value of N∗ in the water indicates a nitrate deficit (denitrification) or excess nitrate (nitrogen fixation), respectively, relative to phosphate. In the Chukchi Sea, significant denitrification occurs within the shelf sediments because nitrate is consumed instead of oxygen for organic matter decomposition (Yamamoto-Kawai et al., 2006). Nitrogen fixation also occurs throughout the Chukchi Sea; however, this is a minor process in the overall nitrogen cycle (Shiozaki et al., 2018). A negative N∗ value could indicate water passing through the reductive Chukchi Sea shelf and penetrating the Makarov Basin (Nishino et al., 2013). Our results showed that the N∗ value in the PMW was much lower (< −5) than that in the AMW (Fig. 7). Although Fe and Mn are considered to be released in the dissolved phase from reductive sediments over the Chukchi Sea shelf, these metals are gradually removed from the water column in the particulate phase (Jensen et al., 2020). The TdMn and dMn concentrations tended to be high in the low-N∗ PMW, suggesting a reductive sedimentary flux that released Mn from the Chukchi Sea shelf (Fig. 7b and d). Mn was more elevated at shallow shelf stations 86 and 89, which were the stations most influenced by shelf inputs. Given that the dMn : TdMn ratio in the PMW is as high as 85.2 ± 10.2 %, Mn was primarily in the dissolved phase. In contrast, the TdFe and dFe concentrations in the PMW were relatively low (Fig. 7a and c) compared to those typically observed in the continental margin of the Arctic Ocean (Aguilar-Islas et al., 2013; Cid et al., 2011, 2012; Jensen et al., 2020; Klunder et al., 2012; Kondo et al., 2016; Nakayama et al., 2011; Nishimura et al., 2012). This is likely because Fe is removed much more rapidly from the Chukchi Sea shelf water column than Mn via oxidation and reprecipitation (Jensen et al., 2020; Millero et al., 1987; Vieira et al., 2018). Indeed, we observed a lower dFe : TdFe ratio (43.6 ± 23.8 %) in the PMW, such that Fe was primarily in the particulate phase. The relatively high Fe concentrations at stations Ice 1, 38, and 40 are likely attributable to riverine flux because these stations show a relatively high fractional fmw (see the discussion below).
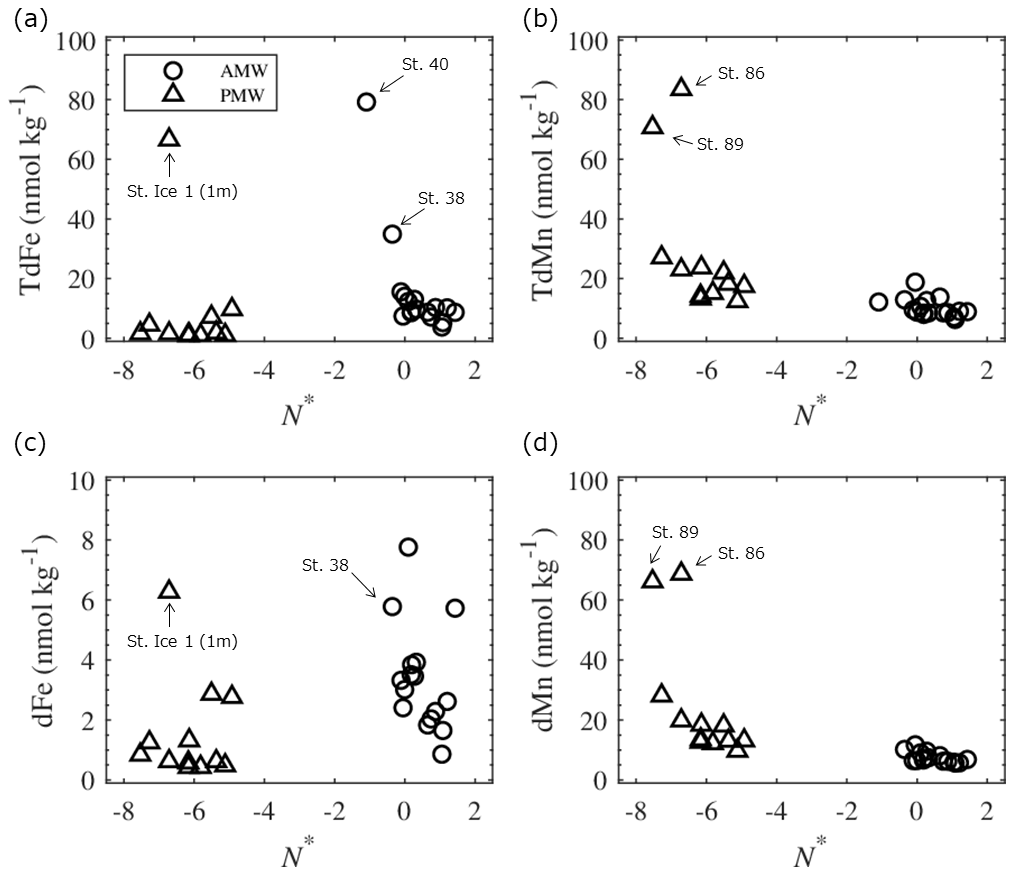
Figure 7Plots of (a) TdFe, (b) TdMn, (c) dFe, and (d) dMn in the AMW and PMW against N∗ values.
4.2.2 River runoff
The meteoric water fractions included river runoff and local precipitation. The former dominates the signals of the Fe and Mn sources in Arctic surface waters (Dai and Martin, 1995; Guieu et al., 1996; Pokrovsky et al., 2016; Savenko and Pokrovsky, 2019). Although there was no clear relationship between fmw, TdFe, and TdMn in the surface waters (Fig. S7), the dissolved fractions of the metals exhibited distinct characteristics. The dFe concentrations in the PMW and AMW were positively correlated with fmw (Fig. 8a), suggesting that river runoff is an important factor controlling dFe concentrations in surface waters. Three large Siberian rivers, the Lena, Kolyma, and Indigirka (Fig. 1a), discharge into the LESS, likely affecting dFe concentrations in the surface waters. Moreover, the Ob and Yenisei rivers flow into the northwestern Laptev Sea via eastward coastal currents (Bauch et al., 2011, 2014). The contribution of river water flowing into the Chukchi Sea (e.g., the Yukon River) is already included in the Pacific-sourced water assignment based on water mass calculations. Thus, the variation in fmw in the PMW is mainly attributed to input from Siberian rivers. At the same fmw level of approximately 10 %, the AMW had a higher dFe relative to the PMW. This could indicate that the river sources contributing to the AMW had a relatively higher dFe endmember or that some dFe in the PMW underwent more removal processes than in the AMW. In contrast to dFe, the dMn concentrations in the PMW and AMW did not correlate individually with fmw (Fig. 8b). However, when we combined the AMW with the PMW in all the water samples and considered outliers for samples that were largely influenced by sedimentary input (Sts. 86 and 89, Fig. 1b), the dMn concentrations in the water were positively correlated with fmw (r=0.70; p < 0.001; Fig. 8b). Consequently, dMn exhibited characteristics that differed from those of dFe.
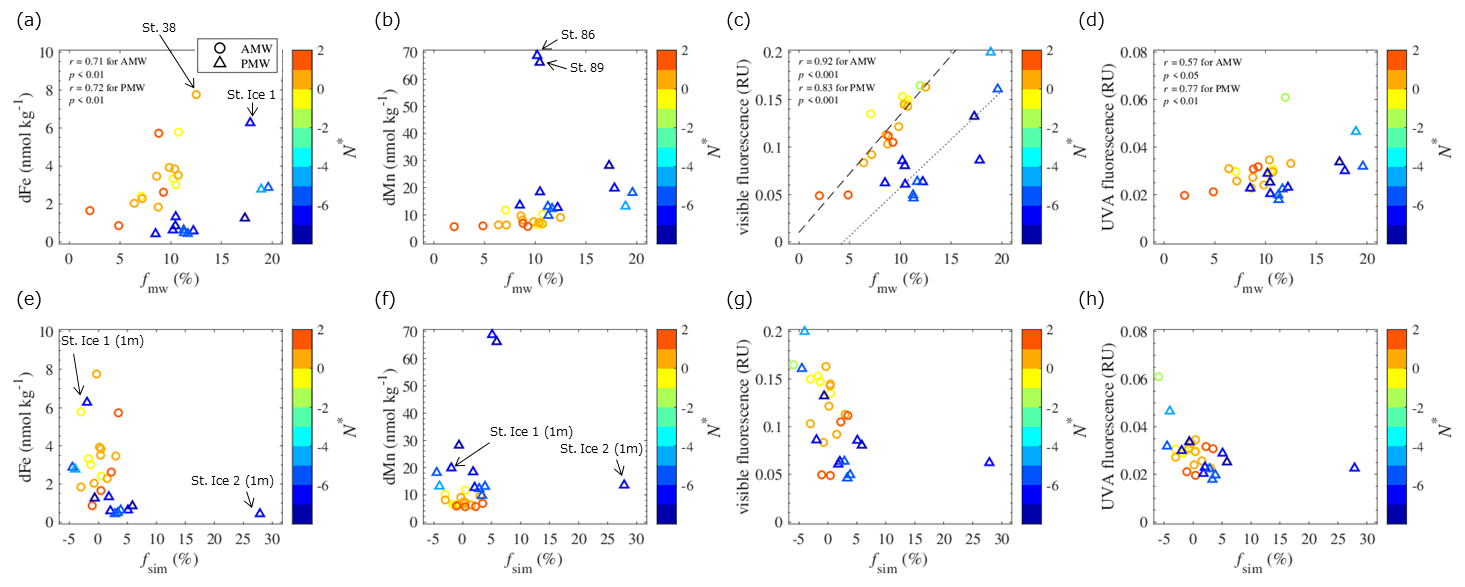
Figure 8Plots of dFe, dMn, visible fluorescence, and UVA fluorescence in the AMW and PMW against fractional meteoric water (fmw) in panels (a–d) and sea ice meltwater (fsim) in panels (e–h). The color scale shows the N∗ values of each water sample. Linear relationships were evaluated based on the Pearson correlation coefficient (r). The linear fits of the visible fluorescence–fmw relationships in the AMW and PMW are shown by the dashed and dotted lines in panel (c).
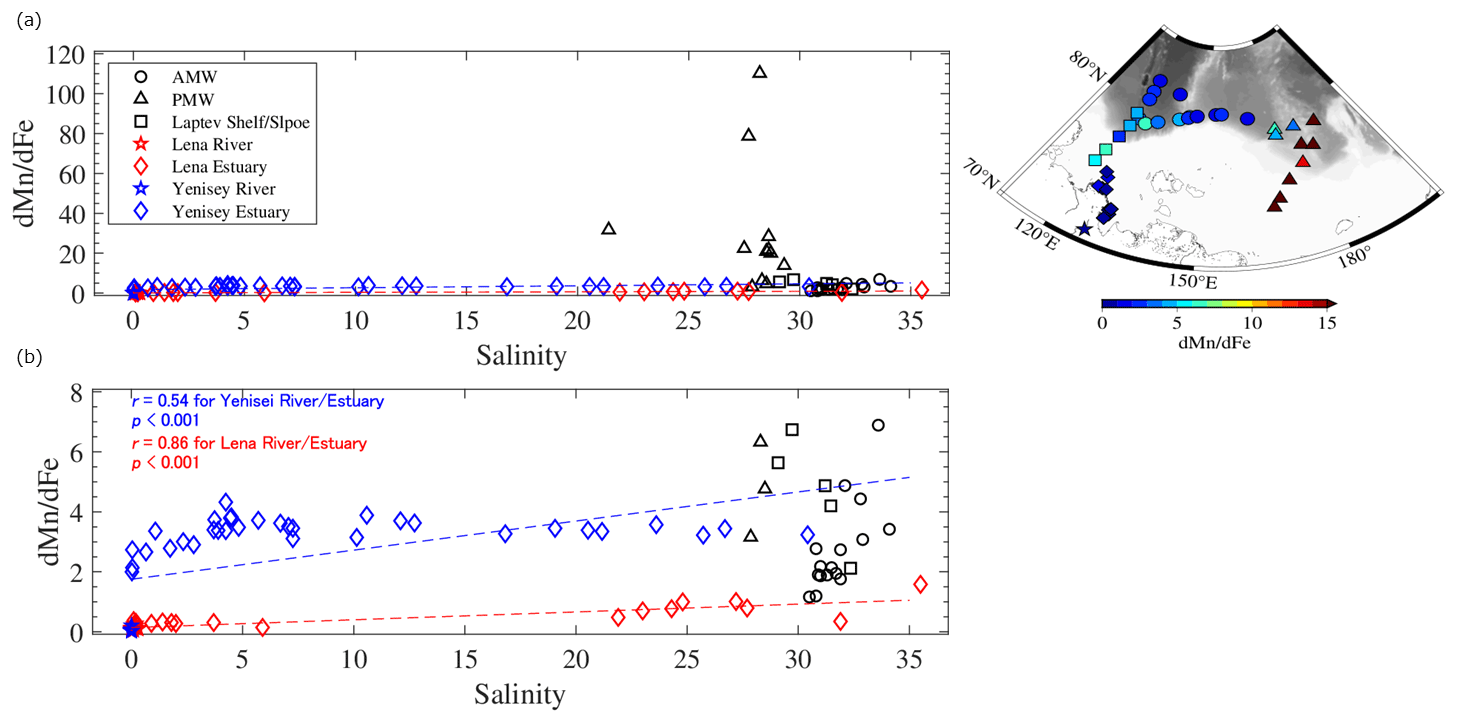
Figure 9(a) Relationships between salinity and the ratio in specific water masses. A smaller scale of the y axis is shown in panel (b). The geographical distribution of each sample is indicated by the different symbols as shown on the map. Mixing lines of freshwater (Lena and Yenisei rivers) and seawater (Lena and Yenisei estuaries) were derived from Hölemann et al. (2005), Peterson et al. (2016), and Savenko and Pokrovsky (2019). Linear relationships were evaluated against the freshwater–seawater line based on r. The value for surface water on the Laptev shelf or slope (Klunder et al., 2012; Middag et al., 2011) is plotted for comparison.
Both metals are not equally preserved in seawater after being released from river water owing to differences in their removal kinetics. We examined the salinity– ratio relationships in specific waters in the LESS (Fig. 9). Data from the Yenisei River and the estuarine waters are presented for comparison. In the Lena and Yenisei estuaries, the ratios increased with increasing salinity because of the preferential loss of dFe relative to dMn after release from these rivers (Fig. 9). The ratios in the AMW and the surface water on the Laptev shelf or slope were plotted around a mixing line of freshwater (rivers) and seawater (estuaries) (Fig. 9b). On the other hand, the ratio in the PMW deviated far from the freshwater–seawater line (Fig. 9a). This was due to the intrusion of shelf-derived water with excess dMn relative to dFe into the eastern part of the LESS, as discussed in Sect. 4.2.1. Thus, the dMn distribution was driven by inputs from both shelf sediments and riverine fluxes, particularly in the PMW.
4.2.3 Sea ice formation and melt
The fraction of sea ice meltwater includes brine drainage (fsim < 0) or meltwater input (fsim > 0) associated with sea ice formation or melting. The fsim values in the PMW and AMW did not correlate with any metal concentration (Figs. 8e, f and S7). The fsim in the under-ice water at St. Ice 1, where we collected the ice core for trace metal analysis, showed a negative value of −2.0 % (Fig. 8e, f), indicating that the water had received brine from the overlying sea ice. Indeed, the ice sample from St. Ice 1 was effectively permeable because the ice temperature was approximately −2 °C through the ice core with a bulk salinity of 2 (NABOS 2021 cruise report; https://uaf-iarc.org/nabos/cruise-reports/). For temperatures warmer than −5 °C, brine-loading-dissolved fractions of trace metals, as well as heat and nutrients, can move through the ice and finally be released into the water column (Golden et al., 1998; Lannuzel et al., 2008; van der Merwe et al., 2011). Given 2 % brine inclusion in the under-ice water at St. Ice 1, the added dFe and dMn in the water column associated with brine drainage account for 0.12 and 0.39 nmol kg−1, respectively. The same calculation for TdFe and TdMn showed 1.3 and 0.45 nM, respectively. The metal inputs throughout the brine drainage were considered low compared to other sources of Fe and Mn in the studied region.
In contrast to St. Ice 1, the under-ice water at St. Ice 2 was largely influenced by sea ice melt, with fsim as high as 27.9 % at a depth of 1 m (Fig. 8e, f). The inventories of dFe and dMn at depths of 1–10 m at St. 2 were computed as 4.5 and 115 µmol m−2, respectively. The same calculation for the TdFe and TdMn showed 9.7 and 128 µmol m−2, respectively. The inventories of under-ice water were higher than those of the ice cores collected in this study (Table 3), suggesting that sea ice melt is not the only source of these metals in under-ice water. It should be noted that this study did not resolve the temporal evolution of sea ice melt; thus, we did not capture Fe and Mn concentrations in the sea ice at the early stages of sea ice melt. A time series experiment conducted in Antarctic pack ice demonstrated that 70 % of the Fe in the sea ice was released into the under-ice water during the first 10 d of the survey while ice cover was still present (Lannuzel et al., 2008). The lack of time series observations in this study may result in an underestimation of the inventories of metals in sea ice. Nevertheless, sea ice formation and/or melting were less important to the overall distribution of Fe and Mn in the surface LESS during the study period, although the process had a potentially local impact on the Fe and Mn cycles.
An important conclusion in this section is that the major factors controlling Fe and Mn concentrations in the LESS were river discharge and shelf sediment–water exchange processes. DOM is also sourced from rivers and seafloor sediments, which are linked to the biogeochemical cycles of Fe and Mn in the Arctic (e.g., Charette et al., 2020). In the following section, we discuss the link between DOM and these metals on the LESS continental margins.
4.3 Characteristics and origins of the DOM and its relation to trace metals
In the surface LESS, various concentrations of DOC were observed, with the highest value of 146 µmol L−1 (Fig. 3f). The mean value of DOC (108 ± 19 µmol L−1) was similar to the value previously observed in the Laptev and East Siberian seas (Hölemann et al., 2021) but tended to be high compared to the Chukchi Sea (Chen et al., 2018; Jung et al., 2021; Tanaka et al., 2016). In addition to DOM release from productive shelf sediments (Cooper et al., 2005), regional DOM inputs from East Siberian rivers (Stedmon et al., 2011) and inputs of fresh-plankton-derived DOM (Davis and Benner, 2007) result in surface waters of the LESS with a high DOC signal. This study investigated the optical properties of CDOM, which are useful for understanding the composition and origin of the DOM in the studied region.
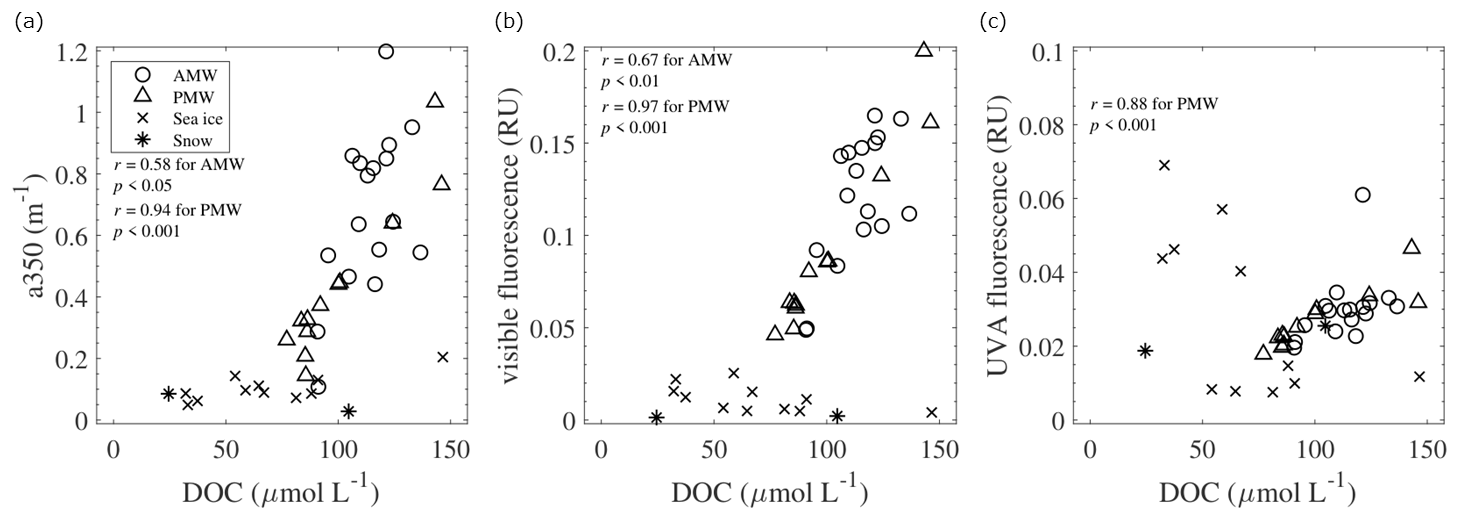
Figure 10Relationships of DOC with (a) a350, (b) visible fluorescence, and (c) UVA fluorescence in the AMW, PMW, sea ice, and snow. Linear relationships were evaluated based on r.
The DOC concentrations in the AMW and PMW were positively correlated with the absorption coefficient a350 and the intensities of visible fluorescence (Fig. 10a, b). This correlation implies that the factors controlling the DOC concentrations and the abundance of humic-like CDOM are similar in these surface waters. The intensities of visible fluorescence in the AMW and PMW were strongly correlated with fmw (Fig. 8c), suggesting the importance of riverine humic-like CDOM sources in surface waters. Interestingly, the linear fits of the visible fluorescence–fmw relationships were different between the AMW and PMW (Fig. 8c). This result indicates that the riverine endmembers of humic-like CDOM were different between the AMW and PMW; i.e., the Lena River was the riverine endmember of the AMW, whereas the Indigirka and/or Kolyma rivers were the endmembers of the PMW. Microbial processing of DOM can also generate visible fluorescence (Nelson et al., 2004; Rochelle-Newall and Fisher, 2002; Yamashita and Tanoue, 2008). The low-N∗ PMW must have received microbially mediated visible fluorescence from the benthic remineralization of sinking organic matter on the productive Chukchi Sea shelf (Hioki et al., 2014; Yamashita et al., 2019).
In addition to visible fluorescence, the intensity of UVA fluorescence in the PMW was positively correlated with DOC concentration; however, this does not apply to the AMW (Fig. 10c). In the Arctic Ocean, UVA fluorescence is regarded as a phytoplankton-derived component (Brogi et al., 2019), including its direct release from phytoplankton and its release during grazing by zooplankton. We integrated chlorophyll fluorescence into the water column (0–10 m depth) of the PMW and compared it with the UVA fluorescence intensity (Fig. S8). The linear correlation between chlorophyll fluorescence and UVA fluorescence in the PMW (r=0.80; p < 0.01) indicates that the local production (and degradation) of UVA fluorescence is an important process. In addition, the intensity of UVA fluorescence in the PMW and AMW increased with increasing fmw (Fig. 8d). This result can be interpreted as the rapid transport of freshly produced labile CDOM by river water to the surface of the LESS.
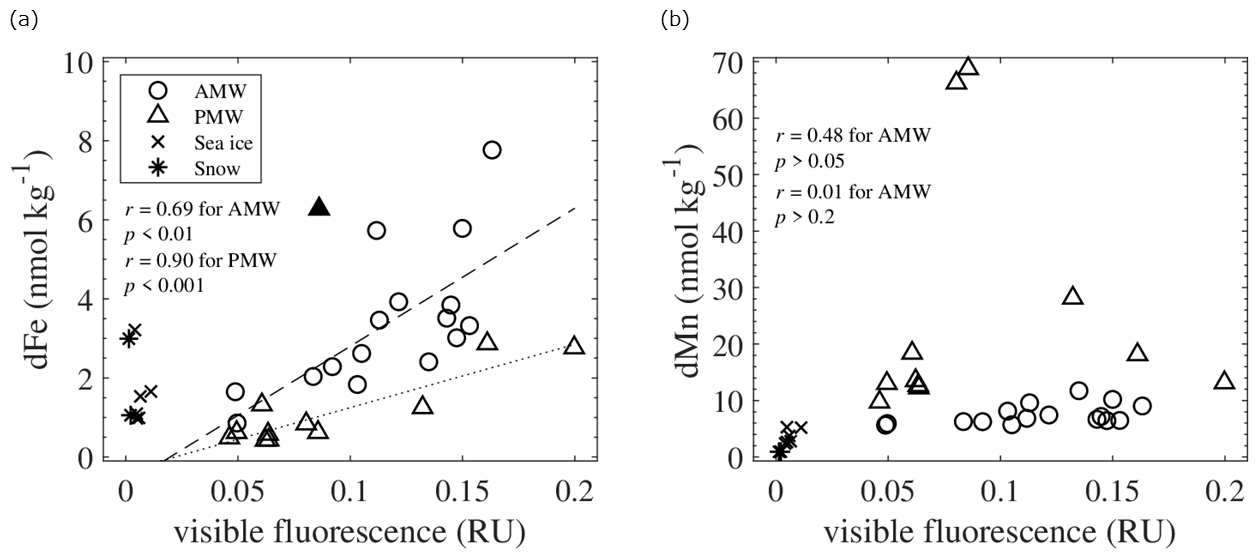
Figure 11Relationships of visible fluorescence with (a) dFe and (b) dMn in the AMW, PMW, sea ice, and snow. Linear relationships were evaluated based on r, except for an outlier (▴) in panel (a). The linear fits of the relationships in the AMW and PMW are shown by the dashed and dotted lines in panel (a).
The relationship between fmw and trace metal concentrations revealed that the riverine source of dFe behaved more conservatively than that of dMn (Fig. 8a, b), which could be explained by the existence of organic ligands complexed with Fe. Previous studies on the Arctic Ocean reported that the CDOM pool contains Fe-binding organic ligands in the form of humic substances (Laglera et al., 2007, 2011; Laglera and van den Berg, 2009; Slagter et al., 2017; Williford et al., 2021). Complexes of Fe-humic substances account for approximately 80 % of the dFe concentrations in the Arctic Ocean, and the concentrations of these complexes are highly correlated with the CDOM and dFe concentrations (Laglera et al., 2019). Our results show significant correlations between dFe and visible fluorescence in both the AMW and PMW (Fig. 11a). The input of humic substances from Siberian rivers into these waters was evident from the elevated intensities of visible fluorescence with fmw (Fig. 8c). Thus, humic substances strongly affect the dFe concentration in seawater through complexation with Fe, which stabilizes Fe in the dissolved phase. A difference in the linear fits of dFe–visible fluorescence relationships between the AMW and PMW (Fig. 11a) may be explained by the contribution of excess humic ligands from rivers to the PMW. In addition to Fe, Mn is known to form organic complexes with the degradation products of organic matter, such as humic materials (e.g., Oldham and Tebo, 2017) and biogenic siderophores (e.g., Parker et al., 2004). However, complexation of organic ligands with Mn in the Arctic Ocean is poorly understood. None of the AMW or PMW samples exhibited a significant correlation between dMn and visible fluorescence (Fig. 11b). Unlike dFe, dMn is not stabilized by humic-type organic complexes in surface waters.
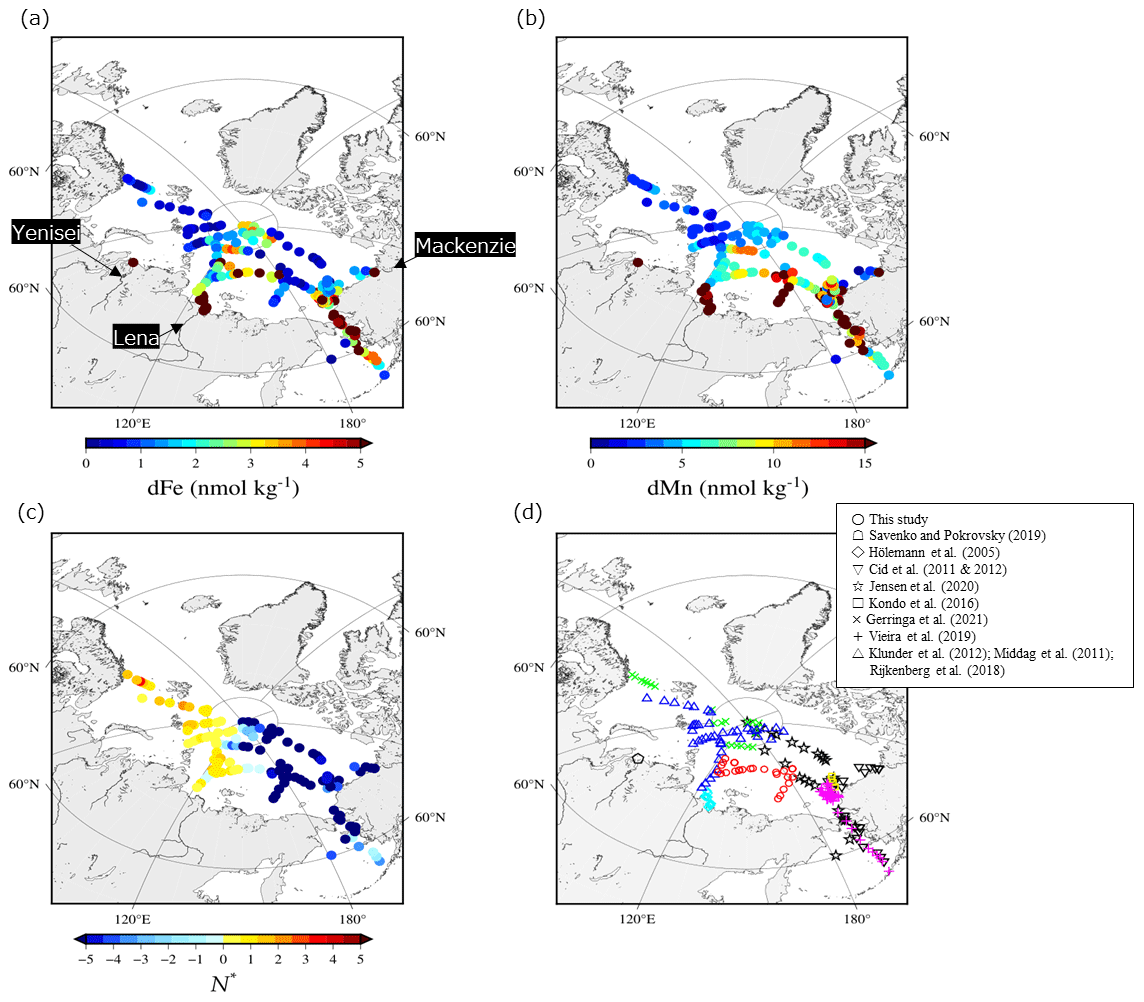
Figure 12Spatial distributions in (a) dFe, (b) dMn, and (c) N∗ in surface water (< 25 m depth) in the Arctic Ocean. (d) Locations of the stations for dFe, dMn, and N∗ reported by this study and the previous studies.
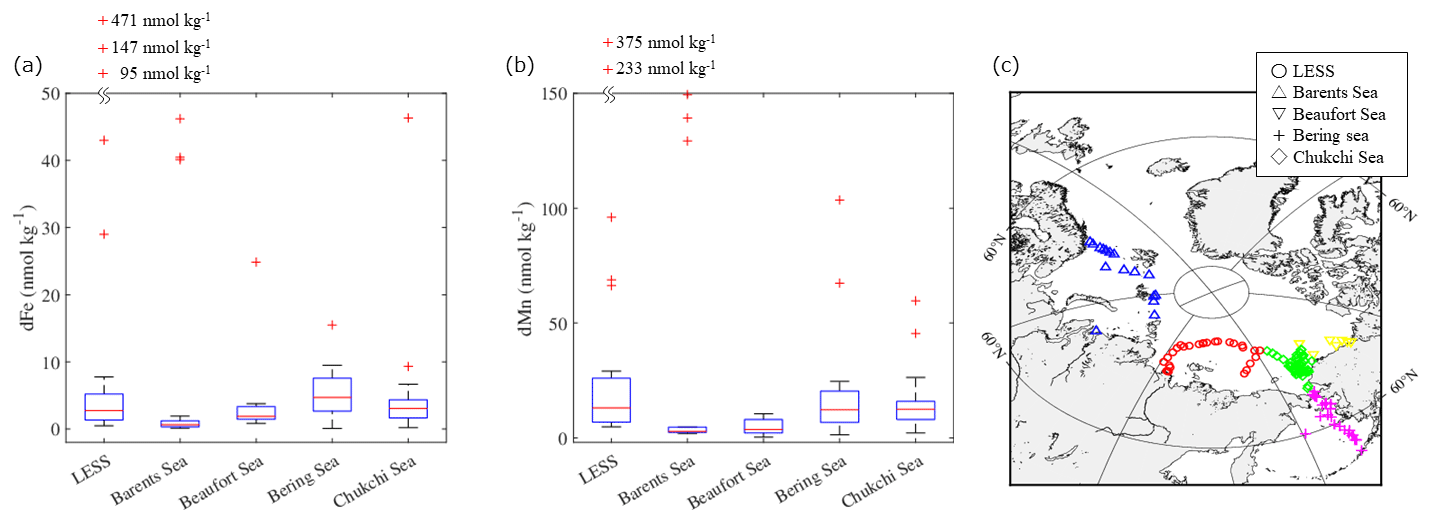
Figure 13Boxplots of the (a) dFe and (b) dMn concentrations in the surface water (< 25 m depth) of each region of the Arctic Ocean. (c) Locations of the stations used in this boxplot. The bottom and top of the boxes in panels (a) and (b) indicate the 25th and 75th percentiles, respectively, and the line inside the box indicates the median. The bottom and top error bars in panels (a) and (b) show minimum and maximum values, respectively, and the outliers are plotted individually using the “+” marker symbol. Some outliers are plotted on the outside of the figures in order to better represent the differences between the regions.
4.4 Comparison of Fe and Mn in the LESS with other regions of the Arctic
To investigate the distribution patterns of dFe and dMn in the surface waters, we combined our dataset with data available for the Arctic Ocean (Cid et al., 2011, 2012; GEOTRACES Intermediate Data Product Group, 2023; Gerringa et al., 2021; Hölemann et al., 2005; Jensen et al., 2020; Klunder et al., 2012; Kondo et al., 2016; Middag et al., 2011; Rijkenberg et al., 2018; Savenko and Pokrovsky, 2019). The dFe concentrations are relatively low (up to 2 nmol kg−1) in the Atlantic sector of the Arctic Ocean (Fig. 12a). At the surfaces of the Nansen Basin and Barents Sea, Fe is expected to be the first nutrient to be depleted by primary producers (Rijkenberg et al., 2018), and phytoplankton consumption could be an important sink for Fe. On the LESS continental margins, however, surface dFe concentrations are significant (> 5 nmol kg−1) and even persist in the late summer of 2021 (Fig. 12a). Figure 13a shows a boxplot of the surface dFe concentration combined with our dataset, with the available data reported for each region in the Arctic Ocean (Fig. 13a and c). All the water samples in Fig. 13 had salinities greater than 25. The result shows that the median value was highest in the Bering Sea (4.7 nmol kg−1), followed by the Chukchi Sea (3.1 nmol kg−1) and the LESS (2.8 nmol kg−1). We deduce that sedimentary Fe originating from the reductive Bering Sea shelf was gradually removed from the Chukchi Sea after entering it from the Bering Strait (Jensen et al., 2020), and it then penetrated the East Siberian Sea. The dFe concentrations also increased in the estuaries of the Lena, Yenisei, and Mackenzie rivers (Fig. 12a). Other studies determined that the dFe concentration in the estuary water (salinity < 25) of the Lena, Yenisei, and Mackenzie rivers was as high as 9000 nmol kg−1. Fe-binding organic ligands in the form of humic substances originating from the Lena River strongly affect the dFe concentration, as discussed in the previous section. The natural humic substance Fe-binding ligands of the Arctic Ocean surface belong to a group of strong ligands ubiquitous in surface ocean waters (Laglera et al., 2019). Strongly complexed Fe may be less biologically available to the phytoplankton community than weakly complexed Fe released from grazing and bacterial remineralization of organic matter (Gledhill and Buck, 2012). The river-influenced water from the LESS continental margins is the source water of the Transpolar Drift, which enriches the dFe in the central Arctic Ocean (Fig. 12a) (Charette et al., 2020; Gerringa et al., 2021; Klunder et al., 2012).
The high dMn value found in the central Arctic Ocean (Fig. 12b) was also related to the presence of the Transpolar Drift (Charette et al., 2020; Gerringa et al., 2021). In addition to riverine inputs, sediment–water column exchange over shelves leads to relatively dMn-rich water in the Pacific sector of the Arctic Ocean. The dMn concentrations increased toward the broad shelves of the East Siberian Sea (∼ 68 nmol kg−1), Chukchi Sea (∼ 45 nmol kg−1), and Bering Sea (∼ 103 nmol kg−1), whereas the concentration was relatively low (∼ 8 nmol kg−1) over a narrow shelf of the Beaufort Sea (Fig. 12b). A boxplot of the surface dMn concentration in Fig. 13b shows that the difference in median values is relatively small in the LESS (13.0 nmol kg−1), Chukchi Sea (12.4 nmol kg−1), and Bering Sea (12.2 nmol kg−1). As discussed previously, the shelf sediment–water exchange processes over the Chukchi Sea largely influence the Fe and Mn distributions in the East Siberian Sea. Vieira et al. (2018) provided the first estimate of the benthic flux of the radium isotope (Ra228) in the Chukchi Sea as a tracer of benthic trace metal inputs, which was among the highest rates reported globally. The low-N∗ water spread over regions where nitrate was already depleted relative to phosphate, mainly because of the oxidation of organic matter by bacteria in the reductive shelf sediment (Fig. 12c). The East Siberian Sea and Chukchi Sea are likely hotspots of sediment-sourced dMn via the reductive dissolution of Mn oxide in the sediment. A multistep removal process of dMn has been suggested in the Arctic (Jensen et al., 2020): dMn is removed rapidly in the particulate phase within 150 km of the shelf break, but some dMn remains preserved throughout the next 1000 km away from the shelf. The dMn from the LESS continental margins appears to be exported effectively by the Transpolar Drift to the central Arctic Ocean (Fig. 12b), although stabilization by organic complexation is unlikely for Mn during offshore transport.
Our results indicate that two governing hydrographic regimes existed in the surface waters of the LESS continental margins in the late summer of 2021. The East Siberian Sea and Chukchi Abyssal Plain were dominated by Pacific-sourced water, whereas the Makarov and Amundsen basins were dominated by the intrusion of Atlantic-sourced water, which is in agreement with previous studies (e.g., Bauch et al., 2011). In these regions, the impact of river water discharge on the chemical properties of the surface water is significant. However, sea ice melting and formation were less important during our observations. A positive correlation between the fmw, dFe, and humic-like CDOM at the LESS site confirmed a common freshwater source of dFe and the humic-like CDOM. Humic-like organic ligands likely stabilized Fe in the dissolved phase, which was not the case for Mn. The East Siberian Sea and Chukchi Abyssal Plain are characterized by particularly low N∗ values resulting from a large sedimentary flux that releases Mn over the continental shelf. The LESS area is a key region originating from large amounts of shelf-derived nutrients, organic carbon, and trace elements (Charette et al., 2020; Jensen et al., 2021; Kipp et al., 2018). Shelf-derived materials and materials from riverine sources are transported to the central Arctic via the Transpolar Drift. Changes in the LESS region may affect the magnitude of the material flux to the remote open ocean. This effect likely has a major impact on primary production and species composition in the Arctic surface waters. Further investigations in the LESS are required to elucidate how shelf- and river-derived elements are mixed within the water column and transported off the shelf.
Data are available upon request from the corresponding author (Naoya Kanna).
The supplement related to this article is available online at https://doi.org/10.5194/bg-22-1057-2025-supplement.
NK and HO designed this study. IP and TW supervised the NABOS expedition. NK, KT, AT, MP, and LW carried out the sampling, and NK analyzed the samples. DN, HO, and YY supervised the δ18O, nutrient, and DOM analyses. All the authors contributed to the manuscript.
The contact author has declared that none of the authors has any competing interests.
Publisher's note: Copernicus Publications remains neutral with regard to jurisdictional claims made in the text, published maps, institutional affiliations, or any other geographical representation in this paper. While Copernicus Publications makes every effort to include appropriate place names, the final responsibility lies with the authors.
This expedition was supported by the ArCSII International Exchange Program “Arctic Ocean: Improving tools and information for northern populations and safe navigation” and was coordinated by Tatiana Aleekseva of AARI, Russia. We thank the members of the 2021 NABOS expedition. We are grateful to Keiko Kurashima and Shigeyoshi Otosaka for their assistance with the laboratory work.
This research has been supported by the Ministry of Education, Culture, Sports, Science and Technology (grant nos. 20J01213, 20K19949, 23K17028, 23H04814, and JPMXD1420318865), the Joint Research Program of the Japan Arctic Research Network Center, and the Research Institute for Oceanochemistry Foundation.
This paper was edited by EDEM Mahu and reviewed by two anonymous referees.
Aguilar-Islas, A. M., Rember, R., Nishino, S., Kikuchi, T., and Itoh, M.: Partitioning and lateral transport of iron to the Canada Basin, Polar Sci., 7, 82–99, 2013.
Alling, V., Sanchez-garcia, L., Porcelli, D., Pugach, S., Vonk, J. E., Van Dongen, B., Mörth, C., Anderson, L. G., Sokolov, A., Andersson, P., Humborg, C., Semiletov, I., and Gustafsson, Ö.: Nonconservative behavior of dissolved organic carbon across the Laptev and East Siberian seas, Global Biogeochem. Cy., 24, GB4033, https://doi.org/10.1029/2010GB003834, 2010.
Anderson, L. G. and Macdonald, R. W.: Observing the Arctic Ocean carbon cycle in a changing environment, Polar Res., 34, 26891, https://doi.org/10.3402/polar.v34.26891, 2015.
Anderson, L. G., Björk, G., Holby, O., Jutterström, S., Mörth, C. M., O'Regan, M., Pearce, C., Semiletov, I., Stranne, C., Stöven, T., Tanhua, T., Ulfsbo, A., and Jakobsson, M.: Shelf–Basin interaction along the East Siberian Sea, Ocean Sci., 13, 349–363, https://doi.org/10.5194/os-13-349-2017, 2017.
Bauch, D. and Cherniavskaia, E.: Water mass classification on a highly variable arctic shelf region: Origin of Laptev sea water masses and implications for the nutrient budget, J. Geophys. Res.-Oceans 123, 1896–1906, 2018.
Bauch, D., Van Der Loeff, M. R., Andersen, N., Torres-Valdes, S., Bakker, K., and Abrahamsen, E. P.: Origin of freshwater and polynya water in the Arctic Ocean halocline in summer 2007, Prog. Oceanogr., 91, 482–495, https://doi.org/10.1016/j.pocean.2011.07.017, 2011.
Bauch, D., Torres-Valdes, S., Polyakov, I., Novikhin, A., Dmitrenko, I., McKay, J., and Mix, A.: Halocline water modification and along-slope advection at the Laptev Sea continental margin, Ocean Sci., 10, 141–154, https://doi.org/10.5194/os-10-141-2014, 2014.
Bolt, C., Aguilar-Islas, A., and Rember, R.: Particulate trace metals in Arctic snow, sea ice, and underlying surface waters during the 2015 US western Arctic GEOTRACES cruise GN01, ACS Earth Space Chem., 4, 2444–2460, 2020.
Brogi, S., Jung, J. Y., Ha, S., and Hur, J.: Seasonal differences in dissolved organic matter properties and sources in an Arctic fjord: Implications for future conditions, Sci. Total Environ., 694, 133740, https://doi.org/10.1016/j.scitotenv.2019.133740, 2019.
Charette, M. A., Kipp, L. E., Jensen, L. T., Dabrowski, J. S., Whitmore, L. M., Fitzsimmons, J. N., Williford, T., Ulfsbo, A., Jones, E., Bundy, R. M., Vivancos, S. M., Pahnke, K., John, S. G., Xiang, Y., Hatta, M., Petrova, M. V., Heimbürger-Boavida, L., Bauch, D., Newton, R., Pasqualini, A., Agather, A. M., Amon, R. M. W., Anderson, R. F., Andersson, P. S., Benner, R., Bowman, K. L., Edwards, R. L., Gdaniec, S., Gerringa, L. J. A., González, A. G., Granskog, M., Haley, B., Hammerschmidt, C. R., Hansell, D. A., Henderson, P. B., Kadko, D. C., Kaiser, K., Laan, P., Lam, P. J., Lamborg, C. H., Levier, M., Li, X., Margolin, A. R., Measures, C., Middag, R., Millero, F. J., Moore, W. S., Paffrath, R., Planquette, H., Rabe, B., Reader, H., Rember, R., Rijkenberg, M. J. A., Roy-Barman, M., Rutgers van der Loeff, M., Saito, M., Schauer, U., Schlosser, P., Sherrell, R. M., Shiller, A. M., Slagter, H., Sonke, J. E., Stedmon, C., Woosley, R. J., Valk, O., van Ooijen, J., and Zhang, R.: The transpolar drift as a source of riverine and shelf-derived trace elements to the Central Arctic Ocean, J. Geophys. Res.-Oceans, 125, e2019JC015920, https://doi.org/10.1029/2019JC015920, 2020.
Chen, M., Jung, J., Lee, Y. K., and Hur, J.: Surface accumulation of low molecular weight dissolved organic matter in surface waters and horizontal off-shelf spreading of nutrients and humic-like fluorescence in the Chukchi Sea of the Arctic Ocean, Sci. Total Environ., 639, 624–632, https://doi.org/10.1016/j.scitotenv.2018.05.205, 2018.
Cid, A. P., Urushihara, S., Minami, T., Norisuye, K., and Sohrin, Y.: Stoichiometry among bioactive trace metals in seawater on the Bering Sea shelf, J. Oceanogr., 67, 747–764, https://doi.org/10.1007/s10872-011-0070-z, 2011.
Cid, A. P., Nakatsuka, S., and Sohrin, Y.: Stoichiometry among bioactive trace metals in the Chukchi and Beaufort Seas, J. Oceanogr., 68, 985–1001, https://doi.org/10.1007/s10872-012-0150-8, 2012.
Clement Kinney, J., Assmann, K. M., Maslowski, W., Björk, G., Jakobsson, M., Jutterström, S., Lee, Y. J., Osinski, R., Semiletov, I., Ulfsbo, A., Wåhlström, I., and Anderson, L. G.: On the circulation, water mass distribution, and nutrient concentrations of the western Chukchi Sea, Ocean Sci., 18, 29–49, https://doi.org/10.5194/os-18-29-2022, 2022.
Coble, P. G.: Characterization of marine and terrestrial DOM in seawater using excitation-emission matrix spectroscopy, Mar. Chem., 51, 325–346, 1996.
Cooper, L. W., Benner, R., Mcclelland, J. W., Peterson, B. J., Holmes, R. M., Raymond, P. A., Hansell, D. A., Grebmeier, J. M., and Codispoti, L. A.: Linkages among runoff, dissolved organic carbon, and the stable oxygen isotope composition of seawater and other water mass indicators in the Arctic Ocean, J. Geophys. Res., 110, G02013, https://doi.org/10.1029/2005JG000031, 2005.
Dai, M. and Martin, J.: First data on trace metal level and behavior in two major Arctic river-estuarine systems (Ob and Yenisey) and in the adjacent Kara Sea, Russia, Earth Planet. Sc. Lett., 131, 127–141, 1995.
Davis, J. and Benner, R.: Quantitative estimates of labile and semi-labile dissolved organic carbon in the Western Arctic Ocean: A molecular approach, Limnol. Oceanogr., 52, 2434–2444, 2007.
Doglioni, F., Ricker, R., Rabe, B., Barth, A., Troupin, C., and Kanzow, T.: Sea surface height anomaly and geostrophic current velocity from altimetry measurements over the Arctic Ocean (2011–2020), Earth Syst. Sci. Data, 15, 225–263, https://doi.org/10.5194/essd-15-225-2023, 2023.
Eicken, H., Kolatschek, J., Freitag, J., Lindemann, F., Kassens, H., and Dmitrenko, I.: A key source area and constraints on entrainment for basin-scale sediment transport by Arctic sea ice, Geophys. Res. Lett., 27, 1919–1922, 2000.
Eicken, H., Gradinger, R., Gaylord, A., Mahoney, A., Rigor, I., and Melling, H.: Sediment transport by sea ice in the Chukchi and Beaufort Seas: Increasing importance due to changing ice conditions?, Deep-Sea Res. Pt. II, 52, 3281–3302, 2005.
Evans, L. K. and Nishioka, J.: Accumulation processes of trace metals into Arctic sea ice: distribution of Fe, Mn and Cd associated with ice structure, Mar. Chem., 209, 36–47, 2019.
Feng, D., Gleason, C. J., Lin, P., Yang, X., Pan, M., and Ishitsuka, Y.: Recent changes to Arctic river discharge, Nat. Commun., 12, 6917, https://doi.org/10.1038/s41467-021-27228-1, 2021.
Fox-Kemper, B., H. T. Hewitt, C. Xiao, G. Aðalgeirsdóttir, S. S. Drijfhout, T. L. Edwards, N. R. Golledge, M. Hemer, R. E. Kopp, G. Krinner, A. Mix, D. Notz, S. Nowicki, I. S. Nurhati, L. Ruiz, J.-B. Sallée, A. B. A. Slangen, and Y. Yu.: Ocean, cryosphere and sea Level Change, in: Climate Change 2021: The Physical Science Basis. Contribution of Working Group I to the Sixth Assessment Report of the Intergovernmental Panel on Climate Change, edited by: Masson-Delmotte, V., Zhai, P., Pirani, A., Connors, S. L., Péan, C., Berger, S., Caud, N., Chen, Y., Goldfarb, L., Gomis, M. I., Huang, M., Leitzell, K., Lonnoy, E., Matthews, J. B. R., Maycock, T. K., Waterfield, T., Yelekçi, O., Yu, R., and Zhou, B., Cambridge University Press, Cambridge, United Kingdom and New York, NY, USA, https://doi.org/10.1017/9781009157896.011, 1211–1362, 2021.
GEOTRACES Intermediate Data Product Group: The GEOTRACES Intermediate Data Product 2021v2 (IDP2021v2), NERC EDS British Oceanographic Data Centre NOC [data set], https://doi.org/10.5285/ff46f034-f47c-05f9-e053-6c86abc0dc7e, 2023.
Gerringa, L. J. A., Rijkenberg, M. J. A., Slagter, H. A., Laan, P., Paffrath, R., Bauch, D., Rutgers Van Der Loeff, M., and Middag, R.: Dissolved Cd, Co, Cu, Fe, Mn, Ni, and Zn in the Arctic Ocean, J. Geophys. Res.-Oceans, 126, e2021JC017323, https://doi.org/10.1029/2021JC017323, 2021.
Gledhill, M. and Buck, K. N.: The organic complexation of iron in the marine environment: a review, Front. Microbiol., 3, 18807, https://doi.org/10.3389/fmicb.2012.00069, 2012.
Golden, K. M., Ackley, S. F., and Lytle, V. I.: The percolation phase transition in sea ice, Science, 282, 2238–2241, 1998.
Goto, S., Tada, Y., Suzuki, K., and Yamashita, Y.: Evaluation of the Production of Dissolved Organic Matter by Three Marine Bacterial Strains, Front. Microbiol., 11, 584419, https://doi.org/10.3389/fmicb.2020.584419, 2020.
Green, S. A. and Blough, N. V.: Optical absorption and fluorescence properties of chromophoric dissolved organic matter in natural waters, Limnol. Oceanogr., 39, 1903–1916, 1994.
Gruber, N. and Sarmiento, J. L.: Global patterns of marine nitrogen fixation and denitrification, Global Biogeochem. Cy., 11, 235–266, 1997.
Guieu, C., Huang, W. W., Martin, J., and Yong, Y. Y.: Outflow of trace metals into the Laptev Sea by the Lena River, Mar. Chem., 53, 255–267, 1996.
Hioki, N., Kuma, K., Morita, Y., Sasayama, R., Ooki, A., Kondo, Y., Obata, H., Nishioka, J., Yamashita, Y., Nishino, S., and Kikuchi, T.: Laterally spreading iron, humic-like dissolved organic matter and nutrients in cold, dense subsurface water of the Arctic Ocean, Sci. Rep., 4, 6775, https://doi.org/10.1038/srep06775, 2014.
Hölemann, J. A., Schirmacher, M., Kassens, H., and Prange, A.: Geochemistry of surficial and ice-rafted sediments from the Laptev Sea (Siberia), Estuar. Coast. Shelf S., 49, 45–59, 1999a.
Hölemann, J. A., Schirmacher, M., and Prange, A.: Dissolved and particulate major and trace elements in newly formed ice from the Laptev Sea (Transdrift III, October 1995), in: Anonymous land-ocean systems in the Siberian Arctic: Dynamics and history, Springer, Berlin, 101–111, https://doi.org/10.1007/978-3-642-60134-7_11, 1999b.
Hölemann, J. A., Schirmacher, M., and Prange, A.: Seasonal variability of trace metals in the Lena River and the southeastern Laptev Sea: Impact of the spring freshet, Global Planet. Change, 48, 112–125, https://doi.org/10.1016/j.gloplacha.2004.12.008, 2005.
Hölemann, J. A., Juhls, B., Bauch, D., Janout, M., Koch, B. P., and Heim, B.: The impact of the freeze–melt cycle of land-fast ice on the distribution of dissolved organic matter in the Laptev and East Siberian seas (Siberian Arctic), Biogeosciences, 18, 3637–3655, https://doi.org/10.5194/bg-18-3637-2021, 2021.
Jensen, L. T., Morton, P., Twining, B. S., Heller, M. I., Hatta, M., Measures, C. I., John, S., Zhang, R., Pinedo-Gonzalez, P., Sherrell, R. M., and Fitzsimmons, J. N.: A comparison of marine Fe and Mn cycling: U. S. GEOTRACES GN01 Western Arctic case study, Geochim. Cosmochim. Ac., 288, 138–160, https://doi.org/10.1016/j.gca.2020.08.006, 2020.
Jensen, L. T., Lanning, N. T., Marsay, C. M., Buck, C. S., Aguilar-Islas, A. M., Rember, R., Landing, W. M., Sherrell, R. M., and Fitzsimmons, J. N.: Biogeochemical cycling of colloidal trace metals in the Arctic Cryosphere, J. Geophys. Res.-Oceans, 126, e2021JC017394, https://doi.org/10.1029/2021JC017394, 2021.
Jones, E. P., Anderson, L. G., Jutterström, S., Mintrop, L., and Swift, J. H.: Pacific freshwater, river water and sea ice meltwater across Arctic Ocean basins: Results from the 2005 Beringia Expedition, J. Geophys. Res.-Oceans 113, C08012, https://doi.org/10.1029/2007JC004124, 2008.
Jung, J., Son, J. E., Lee, Y. K., Cho, K., Lee, Y., Yang, E. J., Kang, S., and Hur, J.: Tracing riverine dissolved organic carbon and its transport to the halocline layer in the Chukchi Sea (western Arctic Ocean) using humic-like fluorescence fingerprinting, Sci. Total Environ., 772, 145542, https://doi.org/10.1016/j.scitotenv.2021.145542, 2021.
Kadko, D., Galfond, B., Landing, W. M., and Shelley, R. U.: Determining the pathways, fate, and flux of atmospherically derived trace elements in the Arctic ocean/ice system, Mar. Chem., 182, 38–50, 2016.
Kadko, D., Aguilar-Islas, A., Bolt, C., Buck, C. S., Fitzsimmons, J. N., Jensen, L. T., Landing, W. M., Marsay, C. M., Rember, R., Shiller, A. M., Whitmore, L. M., and Anderson, R. F.: The residence times of trace elements determined in the surface Arctic Ocean during the 2015 US Arctic GEOTRACES expedition, Mar. Chem., 208, 56–69, https://doi.org/10.1016/j.marchem.2018.10.011, 2018.
Kanna, N., Toyota, T., and Nishioka, J.: Iron and macro-nutrient concentrations in sea ice and their impact on the nutritional status of surface waters in the southern Okhotsk Sea, Prog. Oceanogr., 126, 44–57, 2014.
Kanna, N., Sugiyama, S., Ando, T., Wang, Y., Sakuragi, Y., Hazumi, T., Matsuno, K., Yamaguchi, A., Nishioka, J., Yamashita, Y.: Meltwater discharge from marine-terminating glaciers drives biogeochemical conditions in a Greenlandic fjord, Global Biogeochem. Cy., 36, e2022GB007411, https://doi.org/10.1029/2022GB007411, 2022.
Kipp, L. E., Charette, M. A., Moore, W. S., Henderson, P. B., and Rigor, I. G.: Increased fluxes of shelf-derived materials to the central Arctic Ocean, Sci. Adv. 4, eaao1302, https://doi.org/10.1126/sciadv.aao1302, 2018.
Klunder, M. B., Bauch, D., Laan, P., De Baar, H. J. W., Van Heuven, S., and Ober, S.: Dissolved iron in the Arctic shelf seas and surface waters of the central Arctic Ocean: Impact of Arctic river water and ice-melt, J. Geophys. Res., 117, C01027, https://doi.org/10.1029/2011JC007133, 2012.
Kondo, Y., Obata, H., Hioki, N., Ooki, A., Nishino, S., Kikuchi, T., and Kuma, K.: Transport of trace metals (Mn, Fe, Ni, Zn and Cd) in the Western Arctic Ocean (Chukchi sea and Canada basin) in late summer 2012, Deep-Sea Res. Pt. I, 116, 236–252, 2016.
Krumpen, T., Birrien, F., Kauker, F., Rackow, T., von Albedyll, L., Angelopoulos, M., Belter, H. J., Bessonov, V., Damm, E., Dethloff, K., Haapala, J., Haas, C., Harris, C., Hendricks, S., Hoelemann, J., Hoppmann, M., Kaleschke, L., Karcher, M., Kolabutin, N., Lei, R., Lenz, J., Morgenstern, A., Nicolaus, M., Nixdorf, U., Petrovsky, T., Rabe, B., Rabenstein, L., Rex, M., Ricker, R., Rohde, J., Shimanchuk, E., Singha, S., Smolyanitsky, V., Sokolov, V., Stanton, T., Timofeeva, A., Tsamados, M., and Watkins, D.: The MOSAiC ice floe: sediment-laden survivor from the Siberian shelf, The Cryosphere, 14, 2173–2187, https://doi.org/10.5194/tc-14-2173-2020, 2020.
Laglera, L. M. and van den Berg, C. M.: Evidence for geochemical control of iron by humic substances in seawater, Limnol. Oceanogr., 54, 610–619, 2009.
Laglera, L. M., Battaglia, G., and van den Berg, C. M.: Determination of humic substances in natural waters by cathodic stripping voltammetry of their complexes with iron, Anal. Chim. Acta, 599, 58–66, 2007.
Laglera, L. M., Battaglia, G., and van den Berg, C. M.: Effect of humic substances on the iron speciation in natural waters by CLE/CSV, Mar. Chem., 127, 134–143, 2011.
Laglera, L. M., Sukekava, C., Slagter, H. A., Downes, J., Aparicio-Gonzalez, A., and Gerringa, L. J. A.: First quantification of the controlling role of humic substances in the transport of iron across the surface of the Arctic Ocean, Environ. Sci. Technol., 53, 13136, https://doi.org/10.1021/acs.est.9b04240, 2019.
Landing, W. M. and Bruland, K. W.: The contrasting biogeochemistry of iron and manganese in the Pacific Ocean, Geochim. Cosmochim. Ac., 51, 29–43, 1987.
Lannuzel, D., Schoemann, V., De Jong, J., Chou, L., Delille, B., Becquevort, S., and Tison, J.: Iron study during a time series in the western Weddell pack ice, Mar. Chem., 108, 85–95, 2008.
Lawaetz, A. J. and Stedmon, C. A.: Fluorescence intensity calibration using the Raman scatter peak of water, Appl. Spectrosc., 63, 936–940, 2009.
Lewis, K. M., van Dijken, G. L., and Arrigo, K. R.: Changes in phytoplankton concentration now drive increased Arctic Ocean primary production, Science, 369, 198–202, 2020.
Marsay, C. M., Kadko, D., Landing, W. M., Morton, P. L., Summers, B. A., and Buck, C. S.: Concentrations, provenance and flux of aerosol trace elements during US GEOTRACES Western Arctic cruise GN01, Chem. Geol., 502, 1–14, 2018.
Measures, C. I.: The role of entrained sediments in sea ice in the distribution of aluminium and iron in the surface waters of the Arctic Ocean, Mar. Chem., 68, 59–70, 1999.
Middag, R., De Baar, H. J. W., Laan, P., and Klunder, M. B.: Fluvial and hydrothermal input of manganese into the Arctic Ocean, Geochim. Cosmochim. Ac., 75, 2393–2408, https://doi.org/10.1016/j.gca.2011.02.011, 2011.
Millero, F. J., Sotolongo, S., and Izaguirre, M.: The oxidation kinetics of Fe(II) in seawater, Geochim. Cosmochim. Ac., 51, 793–801, 1987.
Morel, F. M. and Price, N. M.: The biogeochemical cycles of trace metals in the oceans, Science, 300, 944–947, 2003.
Nakayama, Y., Fujita, S., Kuma, K., and Shimada, K.: Iron and humic-type fluorescent dissolved organic matter in the Chukchi Sea and Canada Basin of the western Arctic Ocean. J. Geophys. Res.-Oceans, 116, C07031, https://doi.org/10.1029/2010JC006779, 2011.
Nelson, N. B., Carlson, C. A., and Steinberg, D. K.: Production of chromophoric dissolved organic matter by Sargasso Sea microbes, Mar. Chem., 89, 273–287, 2004.
Newton, R., Schlosser, P., Mortlock, R., Swift, J., and Macdonald, R.: Canadian Basin freshwater sources and changes: Results from the 2005 Arctic Ocean Section, J. Geophys. Res.-Oceans 118, 2133–2154, https://doi.org/10.1002/jgrc.20101, 2013.
Nishimura, S., Kuma, K., Ishikawa, S., Omata, A., and Saitoh, S.: Iron, nutrients, and humic-type fluorescent dissolved organic matter in the northern Bering Sea shelf, Bering Strait, and Chukchi Sea, J. Geophys. Res.-Oceans, 117, C02025, https://doi.org/10.1029/2011JC007355, 2012.
Nishino, S., Itoh, M., Williams, W. J., and Semiletov, I.: Shoaling of the nutricline with an increase in near-freezing temperature water in the Makarov Basin, J. Geophys. Res.-Oceans 118, 635–649, https://doi.org/10.1029/2012JC008234, 2013.
Oldham, J. and Tebo, L.: Oxidative and reductive processes contributing to manganese cycling at oxic-anoxic interfaces, Mar. Chem., 195, 122–128, 2017.
Parker, D. L., Sposito, G., and Tebo, B. M.: Manganese (III) binding to a pyoverdine siderophore produced by a manganese (II)-oxidizing bacterium, Geochim. Cosmochim. Ac., 68, 4809–4820, 2004.
Peterson, B. J., Holmes, R. M., McClelland, J. W., Amon, R., Brabets, T., Cooper, L., Gibson, John., Gordeev, V. V., Guay, C., Milburn, D., Staples, R., Raymond, I. P. A., Shiklomanov, G., Striegl, R. G., Zhulidov, A., Gurtovaya, T., and Sergey, Z.: PARTNERS Project Arctic River Biogeochemical Data, Arctic Data Center [data set], https://doi.org/10.18739/A2HD33, 2016.
Pokrovsky, O. S., Manasypov, R. M., Loiko, S. V., Krickov, I. A., Kopysov, S. G., Kolesnichenko, L. G., Vorobyev, S. N., and Kirpotin, S. N.: Trace element transport in western Siberian rivers across a permafrost gradient, Biogeosciences, 13, 1877–1900, https://doi.org/10.5194/bg-13-1877-2016, 2016.
Polyakov, I. V., Pnyushkov, A. V., Alkire, M. B., Ashik, I. M., Baumann, T. M., Carmack, E. C., Goszczko, I., Guthrie, J., Ivanov, V. V., Kanzow, T., Krishfield, R., Kwok, R., Sundfjord, A., Morison, J., Rember, R., and Yulin, A.: Greater role for Atlantic inflows on sea-ice loss in the Eurasian Basin of the Arctic Oceanl, Science, 356, 285–291, 2017.
Polyakov, I. V., Alkire, M. B., Bluhm, B. A., Brown, K. A., Carmack, E. C., Chierici, M., Danielson, S. L., Ellingsen, I., Ershova, E. A., Gårdfeldt, K., Ingvaldsen, R. B., Pnyushkov, A. V., Slagstad, D., and Wassmann, P.: Borealization of the Arctic Ocean in Response to Anomalous Advection From Sub-Arctic Seas, Front. Mar. Sci., 7, 491, https://doi.org/10.3389/fmars.2020.00491, 2020.
Polyakov, I. V., Ingvaldsen, R. B., Pnyushkov, A. V., Bhatt, U. S., Francis, J. A., Janout, M., Kwok, R., and Skagseth, Ø.: Fluctuating Atlantic inflows modulate Arctic atlantification, Science, 381, 972–979, 2023.
Rantanen, M., Karpechko, A. Y., Lipponen, A., Nordling, K., Hyvärinen, O., Ruosteenoja, K., Vihma, T., and Laaksonen, A.: The Arctic has warmed nearly four times faster than the globe since 1979, Commun. Earth. Environ., 3, 168, https://doi.org/10.1038/s43247-022-00498-3, 2022.
Rijkenberg, M. J. A., Slagter, H. A., Rutgers van der Loeff, M., van Ooijen, J., and Gerringa, L. J. A.: Dissolved Fe in the Deep and Upper Arctic Ocean With a Focus on Fe Limitation in the Nansen Basin, Front. Mar. Sci., 5, 88, https://doi.org/10.3389/fmars.2018.00088, 2018.
Rochelle-Newall, E. J. and Fisher, T. R.: Production of chromophoric dissolved organic matter fluorescence in marine and estuarine environments: an investigation into the role of phytoplankton, Mar. Chem., 77, 7–21, 2002.
Rogalla, B., Allen, S. E., Colombo, M., Myers, P. G., and Orians, K. J.: Sediments in sea ice drive the Canada Basin surface Mn maximum: insights from an Arctic Mn ocean model, Global Biogeochem. Cy., 36, e2022GB007320, https://doi.org/10.1029/2022GB007320, 2022.
Rudels, B., Jones, E. P., Schauer, U., and Eriksson, P.: Atlantic sources of the Arctic Ocean surface and halocline waters, Polar Res., 23, 181–208, 2004.
Savenko, A. V. and Pokrovsky, O. S.: Distribution of dissolved matter in the Yenisei estuary and adjacent Kara Sea areas and its inter-annual variability, Geochem. Int., 57, 1201–1212, 2019.
Shiozaki, T., Fujiwara, A., Ijichi, M., Harada, N., Nishino, S., Nishi, S., Nagata, T., and Hamasaki, K.: Diazotroph community structure and the role of nitrogen fixation in the nitrogen cycle in the Chukchi Sea (western Arctic Ocean), Limnol. Oceanogr., 63, 2191–2205, https://doi.org/10.1002/lno.10933, 2018.
Slagter, H. A., Reader, H. E., Rijkenberg, M. J. A., Rutgers Van Der Loeff, M., De Baar, H. J. W., and Gerringa, L. J. A.: Organic Fe speciation in the Eurasian Basins of the Arctic Ocean and its relation to terrestrial DOM, Mar. Chem., 197, 11–25, https://doi.org/10.1016/j.marchem.2017.10.005, 2017.
Sohrin, Y., Urushihara, S., Nakatsuka, S., Kono, T., Higo, E., Minami, T., Norisuye, K., and Umetani, S.: Multielemental determination of GEOTRACES key trace metals in seawater by ICPMS after preconcentration using an ethylenediaminetriacetic Acid Chelating Resin, Anal. Chem., 80, 6267–6273, 2008.
Stabeno, P., Kachel, N., Ladd, C., and Woodgate, R.: Flow patterns in the eastern Chukchi Sea: 2010–2015, J. Geophys. Res.-Oceans, 123, 1177–1195, 2018.
Stedmon, C. A. and Bro, R.: Characterizing dissolved organic matter fluorescence with parallel factor analysis: a tutorial, Limnol. Oceanogr.-Meth., 6, 572–579, 2008.
Stedmon, C. A., Amon, R., Rinehart, A. J., and Walker, S. A.: The supply and characteristics of colored dissolved organic matter (CDOM) in the Arctic Ocean: Pan Arctic trends and differences, Mar. Chem., 124, 108–118, 2011.
Sumata, H., De Steur, L., Divine, D. V., Granskog, M. A., and Gerland, S.: Regime shift in Arctic Ocean sea ice thickness, Nature, 615, 443–449, https://doi.org/10.1038/s41586-022-05686-x, 2023.
Tanaka, K., Takesue, N., Nishioka, J., Kondo, Y., Ooki, A., Kuma, K., Hirawake, T., and Yamashita, Y.: The conservative behavior of dissolved organic carbon in surface waters of the southern Chukchi Sea, Arctic Ocean, during early summer, Sci. Rep., 6, 34123, https://doi.org/10.1038/srep34123, 2016.
Tovar-Sánchez, A., Duarte, C. M., Alonso, J. C., Lacorte, S., Tauler, R., and Galbán-Malagón, C.: Impacts of metals and nutrients released from melting multiyear Arctic sea ice, J. Geophys. Res.-Oceans, 115, C07003, https://doi.org/10.1029/2009JC005685, 2010.
Twining, B. S. and Baines, S. B.: The Trace Metal Composition of Marine Phytoplankton, Annu. Rev. Mar. Sci., 5, 191–215, https://doi.org/10.1146/annurev-marine-121211-172322, 2013.
Van der Merwe, P., Lannuzel, D., Bowie, A. R., and Meiners, K. M.: High temporal resolution observations of spring fast ice melt and seawater iron enrichment in East Antarctica, J. Geophys. Res.-Biogeo., 116, G03017, https://doi.org/10.1029/2010JG001628, 2011.
Vieira, L. H., Achterberg, E. P., Scholten, J., Beck, A. J., Liebetrau, V., Mills, M. M., and Arrigo, K. R.: Benthic fluxes of trace metals in the Chukchi Sea and their transport into the Arctic Ocean, Mar. Chem., 208, 43–55, https://doi.org/10.1016/j.marchem.2018.11.001, 2018.
Waga, H., Eicken, H., Light, B., and Fukamachi, Y.: A neural network-based method for satellite-based mapping of sediment-laden sea ice in the Arctic, Remote Sens. Environ., 270, 112861, https://doi.org/10.1016/j.rse.2021.112861, 2022.
Wegner, C., Wittbrodt, K., Hölemann, J. A., Janout, M. A., Krumpen, T., Selyuzhenok, V., Novikhin, A., Polyakova, Y., Krykova, I., and Kassens, H.: Sediment entrainment into sea ice and transport in the Transpolar Drift: A case study from the Laptev Sea in winter 2011/2012, Cont. Shelf Res., 141, 1–10, 2017.
Williford, T., Amon, R. M. W., Benner, R., Kaiser, K., Bauch, D., Stedmon, C., Yan, G., Walker, S. A., Van Der Loeff, M. R., and Klunder, M. B.: Insights into the origins, molecular characteristics and distribution of iron-binding ligands in the Arctic Ocean, Mar. Chem., 231, 103936, https://doi.org/10.1016/j.marchem.2021.103936, 2021.
Yamamoto‐Kawai, M., Tanaka, N. and Pivovarov, S.: Freshwater and brine behaviors in the Arctic Ocean deduced from historical data of δ18O and alkalinity (1929–2002 AD), J. Geophys. Res.-Oceans, 110, C10003, https://doi.org/10.1029/2004JC002793, 2005.
Yamamoto-Kawai, M., Carmack, E., and Mclaughlin, F.: Nitrogen balance and Arctic throughflow, Nature, 443, 43, https://doi.org/10.1038/443043a, 2006.
Yamamoto-Kawai, M., McLaughlin, F. A., Carmack, E. C., Nishino, S., Shimada, K.: Freshwater budget of the Canada Basin, Arctic Ocean, from salinity, δ18O, and nutrients, J. Geophys. Res., 113, C01007, https://doi.org/10.1029/2006JC003858, 2008.
Yamashita, Y. and Tanoue, E.: Production of bio-refractory fluorescent dissolved organic matter in the ocean interior, Nat. Geosci., 1, 579–582, 2008.
Yamashita, Y., Yagi, Y., Ueno, H., Ooki, A., and Hirawake, T.: Characterization of the water masses in the shelf region of the Bering and Chukchi Seas with fluorescent organic matter, J. Geophys. Res.-Oceans, 124, 7545–7556, 2019.