the Creative Commons Attribution 4.0 License.
the Creative Commons Attribution 4.0 License.
 | 03 Mar 2025
Eddy covariance evaluation of ecosystem fluxes at a temperate saltmarsh in Victoria, Australia, shows large CO2 uptake
Edoardo Daly
Tivanka Anandappa
Eboni-Jane Vienna-Hallam
Harriet Robertson
Matthew Peck
Adrien Guyot
Recent studies have highlighted the important role of vegetated coastal ecosystems in atmospheric carbon sequestration. Saltmarshes constitute 30 % of these ecosystems globally and are the primary intertidal coastal wetland habitat outside the tropics. Eddy covariance (EC) is the main method for measuring biosphere–atmosphere fluxes, but its use in coastal environments is rare. At an Australian temperate saltmarsh site on French Island, Victoria, we measured CO2 and water gas concentration gradients, temperature, wind speed, and radiation. The marsh was dominated by a dense cover of Sarcocornia quinqueflora. Fluxes were seasonal, with minima in winter when vegetation is dormant. Net ecosystem productivity (NEP) during the growing season averaged 10.54 g CO2 m−2 d−1, decreasing to 1.64 g CO2 m−2 d−1 in the dormant period, yet the marsh remained a CO2 sink due to some sempervirent species. Ecosystem respiration rates were lower during the dormant period compared with the growing season (1.00 vs. 1.77 ), with a slight positive relationship with temperature. During the growing season, fluxes were significantly influenced by light levels, ambient temperatures, and humidity, with cool temperatures and cloud cover limiting NEP. The ecosystem water use efficiency of 0.86 g C kg−1 H2O was similar to other C3 intertidal marshes, and evapotranspiration averaged 2.48 mm d−1 during the growing season.
- Article
(5841 KB) - Full-text XML
- BibTeX
- EndNote


This is the first study using eddy covariance to measure CO2 fluxes at an Australian temperate saltmarsh, revealing temperature and light limitations to CO2 uptake.
CO2 fluxes varied seasonally; growing-season net ecosystem productivity was 10.54 , dropping to 1.64 in winter.
Productivity at the French Island saltmarsh is high relative to global saltmarsh estimates but below global mangrove averages.
Despite their relatively small global footprint of 54 650 km2 (Mcowen et al., 2017), saltmarshes provide a range of ecosystem services, including shoreline protection (Shepard et al., 2011), nutrient uptake, and nursery grounds for fish populations (Whitfield, 2017), as well as functioning as significant carbon sinks through CO2 uptake and storage in their organic-rich sediments (McLeod et al., 2011). These “blue carbon” habitats are recognised for their significant contribution to the global carbon cycle, as coastal wetlands more broadly are estimated to have accumulated more than a quarter of global organic soil carbon (Duarte, 2017).
Saltmarshes are a widely distributed intertidal habitat but are floristically divergent globally (Adam, 2002) such that commonalities in function and form do not extend across biogeographic realms. US saltmarshes, for example, are extensively dominated by a single grassy species, Spartina alterniflora, as opposed to the dominance of C3 Chenopodioideae species in the Southern Hemisphere (Adam, 2002). Temperate saltmarshes occupy a latitudinal range spanning approximately 30 to 60° (Mcowen et al., 2017) and are most commonly found along protected coastlines such as bays, estuaries, and lagoons, where they are sheltered from the full force of wave action (Mitsch and Gosselink, 2000). In the Southern Hemisphere, temperate saltmarshes have a strong Gondwanan element with high floristic similarity among the marshes of Aotearoa / New Zealand, the southernmost coasts of South America and South Africa, and the southern coastlines of Australia (Adam, 1990). These marshes are often associated with extensive seagrass meadows and mudflats and, in parts of their range, mangroves, forming complex coastal mosaics (Huxham et al., 2018). Saltmarshes have been heavily degraded across their range, and it is estimated that perhaps up to 50 % of the global saltmarsh area has been lost since 1900 (Gedan et al., 2009), primarily due to land use change.
In most areas where they occur, seasonality plays a major role in the functioning of temperate saltmarshes (Ghosh and Mishra, 2017). These ecosystems experience distinct growing and dormant seasons, primarily driven by temperature, light availability, and precipitation patterns (Adam, 2000). During the growing season (typically spring and summer), increased temperatures and longer daylight hours stimulate plant growth, photosynthetic activity, and decomposition processes. Photosynthesis typically outpaces decomposition during this period, resulting in the temperate saltmarsh acting as a net CO2 sink (Chmura et al., 2003). Conversely, the dormant season (usually autumn and winter) is characterised by cooler temperatures and shorter days (Adam, 2000; Howe et al., 2010). These factors lead to reduced plant growth and photosynthetic activity (Adam, 2000), and while decomposition processes also slow down due to cooler temperatures, CO2 release through decomposition often exceeds CO2 uptake during this period (Artigas et al., 2015). In Australia, saltmarshes have been assumed to not exhibit seasonality (Owers et al., 2018) despite there being a scarcity of data on saltmarsh phenology and the implication this untested assumption could have on carbon budget estimations.
Gross primary production (GPP) of saltmarshes is the total amount of CO2 uptake by plants through photosynthesis. Respiration (Re) leads to a CO2 flux directed back to the atmosphere due to all respiration processes occurring within the saltmarsh, involving both autotrophs and heterotrophs. The difference between these two fluxes is the net ecosystem exchange (NEE). Saltmarsh ecosystems can act as both sources and sinks of carbon dioxide (CO2), influencing atmospheric CO2 concentrations (Chmura et al., 2003). However, quantifying their net exchange remains challenging (Lu et al., 2017), hindering their effective inclusion in Earth system models (Ward et al., 2020) and confounding the incorporation of saltmarsh restoration in emission reduction targets. Eddy covariance (EC) provides a powerful method for near-continuous, high-frequency monitoring of gas exchange between a vegetated surface and the atmosphere (Baldocchi, 2003), enabling the determination of net ecosystem exchange (NEE) of CO2 and identifying the forcings that determine how CO2 fluxes will respond to global climate change (Borges et al., 2006; Cai, 2011).
Previous EC studies in coastal saltmarshes have been focused on the Northern Hemisphere, in sites in the USA (e.g. Hill and Vargas, 2022; Kathilankal et al., 2008; Moffett et al., 2010; Nahrawi et al., 2020; Schäfer et al., 2019), France (Mayen et al., 2024), Japan (Otani and Endo, 2019), and China (Wei et al., 2020), but interest in the Southern Hemisphere is growing (Bautista et al., 2023). The NEE values from these studies indicate that there is high inter-site (as well as interannual; Erickson et al., 2013) variability in carbon dynamics of saltmarshes, with a link to species types, salinity, hydrology (Moffett et al., 2010; Nahrawi et al., 2020), site-specific biochemical conditions (Seyfferth et al., 2020), and latitude (Feagin et al., 2020). While generally considered important carbon sinks (e.g. ranging between 130 and 775 in the USA, according to Kathilankal et al. (2008) and Wang et al. (2016) respectively) and globally hypothesised to average 382 (Alongi, 2020), some EC studies have revealed saltmarshes to be net sources of CO2 to the atmosphere (Vázquez-Lule and Vargas, 2021), especially in temperate saltmarshes that experience long dormant periods.
The aim of this study is to estimate CO2 and water fluxes in a temperate saltmarsh in Victoria, southern Australia, to better characterise the effect of seasonality and environmental variables on the saltmarsh CO2 budgets. This is the first study in an Australian coastal saltmarsh where CO2 fluxes are estimated using the EC method.
2.1 Site description
Ecosystem flux measurements were collected at the Tortoise Head Ramsar coastal wetland on French Island, Victoria (38.388° S, 145.278° E; Fig. 1), within the Western Port embayment. French Island is within the Cfb climate zone (temperate oceanic climate) and experiences distinct seasonal variations in temperature and precipitation. Long-term (30-year) climate data averaged from the nearby Cerberus Station (Australian Bureau of Meteorology, site 86361) indicates that summers, spanning December through February, are generally mild to warm, with maximum temperatures typically ranging from 17 to 25 °C, although occasional heatwaves lead to temporary spikes in temperature that can exceed 30 °C. Winters, from June to September, are cooler, with maximum temperatures ranging between 7 and 14 °C and a mean minimum temperature of 6 °C. Frost is infrequent due to maritime influence, though crisp mornings below 0 °C occur 10 % of the time in winter. Rainfall, evenly distributed throughout the year, averages ca. 715 mm yr−1, although in 2020 the site had higher-than-average rainfall (860 mm yr−1). The island is exposed to weather patterns influenced by the Southern Ocean and Bass Strait, leading to occasional storm systems, particularly in winter, bringing gusty winds and increased precipitation. Western Port has semi-diurnal tides with a range of nearly 3 m, resulting in wide intertidal flats occupied by mangroves of the species Avicennia marina and saltmarshes. The saltmarsh in this study experiences complex hydrological conditions, and we found that inundation is not directly linked to tides.
The site at French Island is dominated by an extensive temperate coastal saltmarsh community that is a particularly good natural representation of a broader biogeographic saltmarsh grouping which covers an area of ca. 7000 ha along Victoria's central coast embayments (Navarro et al., 2021). While the wetland at the site is a saltmarsh–mangrove–seagrass wetland system, the footprint of the flux tower was limited to the saltmarsh alone, which extends more than a kilometre from the shoreline in places. This geography provided the critical horizontally homogenous area with flat terrain required for ecosystem flux measurements. Floristically this saltmarsh is species-poor, dominated by Sarcocornia quinqueflora. Stands of Tecticornia arbuscula are common in this saltmarsh, while Atriplex cinerea and Distichlis distichophylla can be prevalent depending on elevation and soil drainage conditions. Sarcocornia quinqueflora is a perennial succulent, and at the temperate ranges of its distribution, it has a distinct growing season from October to May (Fig. 1c), when the stems turn red, followed by a woody and fibrous dormant period during the colder months of June through September (Fig. 1d). The height of the dominant vegetation ranged between 0.3 and 0.8 m.

Figure 1(a) The location of French Island along the Bass Strait coast of Australia and (b) the location of the flux tower on French Island as well as the nearby Cerberus meteorological station (Bureau of Meteorology, Australia), © Google Earth. (c) An image of the saltmarsh within the flux tower footprint during the growing season (with the tower and one of the paper's authors in the background), taken in February 2020 by Prudence Perry. (d) An image of the saltmarsh during the dormant period, taken at the same location in September 2020 by Ruth Reef.
2.2 Data collection and analysis
Eddy covariance measurements were made between November 2019 and August 2021, capturing both the saltmarsh growing season (October–May) and a dormant period (June–September). An array of standard micro-meteorological instruments included a three-dimensional sonic anemometer (CSAT3, Campbell Scientific, USA), an open-path infrared carbon dioxide (CO2) gas and water vapour (H2O) analyser (LI-7500, LI-COR, USA), and two data loggers. The tower was powered by a solar array with two accompanying 12 V DC storage batteries. The sonic anemometer was mounted 2.3 m above ground. The gas analyser was mounted 0.11 m longitudinally displaced from the anemometer. A CR3000 data logger (Campbell Scientific, USA) recorded the LI-7500, anemometer, short- and long-wave radiation (CNR4, Kipp & Zonen, the Netherlands), and air temperature and humidity (083E, Met One, USA) readings at 10 Hz frequency. Due to the location of the site in the Bass Strait (a region that experiences regular winter storms, high wind speeds, and higher-than-national-average cloud cover), the tower sustained damage due to winter storms several times during the deployment, as well as suffering periods of poor power supply due to short day lengths and high cloud cover; this was exacerbated by poor accessibility to the remote location during COVID-19 travel restrictions. The analysis thus focused on extended periods of continuous daily records, and periods with large gaps in the dataset were removed.
Ecosystem fluxes were calculated for 30 min intervals using EddyPro software v.7 (LI-COR, USA) Express Mode protocols (see settings at https://www.licor.com/env/support/EddyPro/topics/express-defaults.html, last access: 17 February 2025). This processing step includes coordinate axis rotation correction, trend correction, data synchronisation, statistical tests for quality, density corrections, and spectrum corrections. As part of this step, flux quality flags were assigned to the calculated CO2 fluxes using the 0–2 flag policy of “Mauder and Foken 2004”, based on the steady-state test and the test of developed turbulent conditions. The steady-state test checks if fluxes remain consistent over the 30 min averaging period by comparing the mean and standard deviation (SD) of fluxes in the first and second halves of the period. The test of developed turbulent conditions ensures turbulence is well-developed and its energy spectra fit the Kolmogorov spectrum. Both tests assign partial flags that are combined into a single flag (0–2) in EddyPro, indicating the overall data quality. Only data that met the criteria of being in quality class 0 (“best-quality fluxes”) for CO2 flux were chosen for further analysis. We further removed anomalous data points defined as values that exceed 4 SDs of the mean CO2 flux; this resulted in the additional loss of ca. 1 % of the dataset. Gap filling was not applied. Additional filtering was applied to nighttime data due to known weak convection at night; thus CO2 flux data during periods of atmospheric stability, i.e. when night friction wind velocities (u*) were below 0.2 m s−1, were excluded following inspection of the nightly NEE vs. u* curve to detect the threshold where NEE fall-off occurs (i.e. the change point detection method; Barr et al., 2013). This resulted in a dataset of 674 daytime and 606 nighttime flux measurements during the dormant period and 4124 daytime and 3020 nighttime flux measurements for the growing period (Table 1). The growing-season dataset included 90 d with 85 % or more flux data coverage, while the dormant-season dataset included 18 d, and these days were used for 24 h flux integrations.
Table 1Mean (± SD) net ecosystem exchange () during the day- and nighttime respectively, as well as the corresponding number of half-hourly measurements from each month, following filter applications (n).
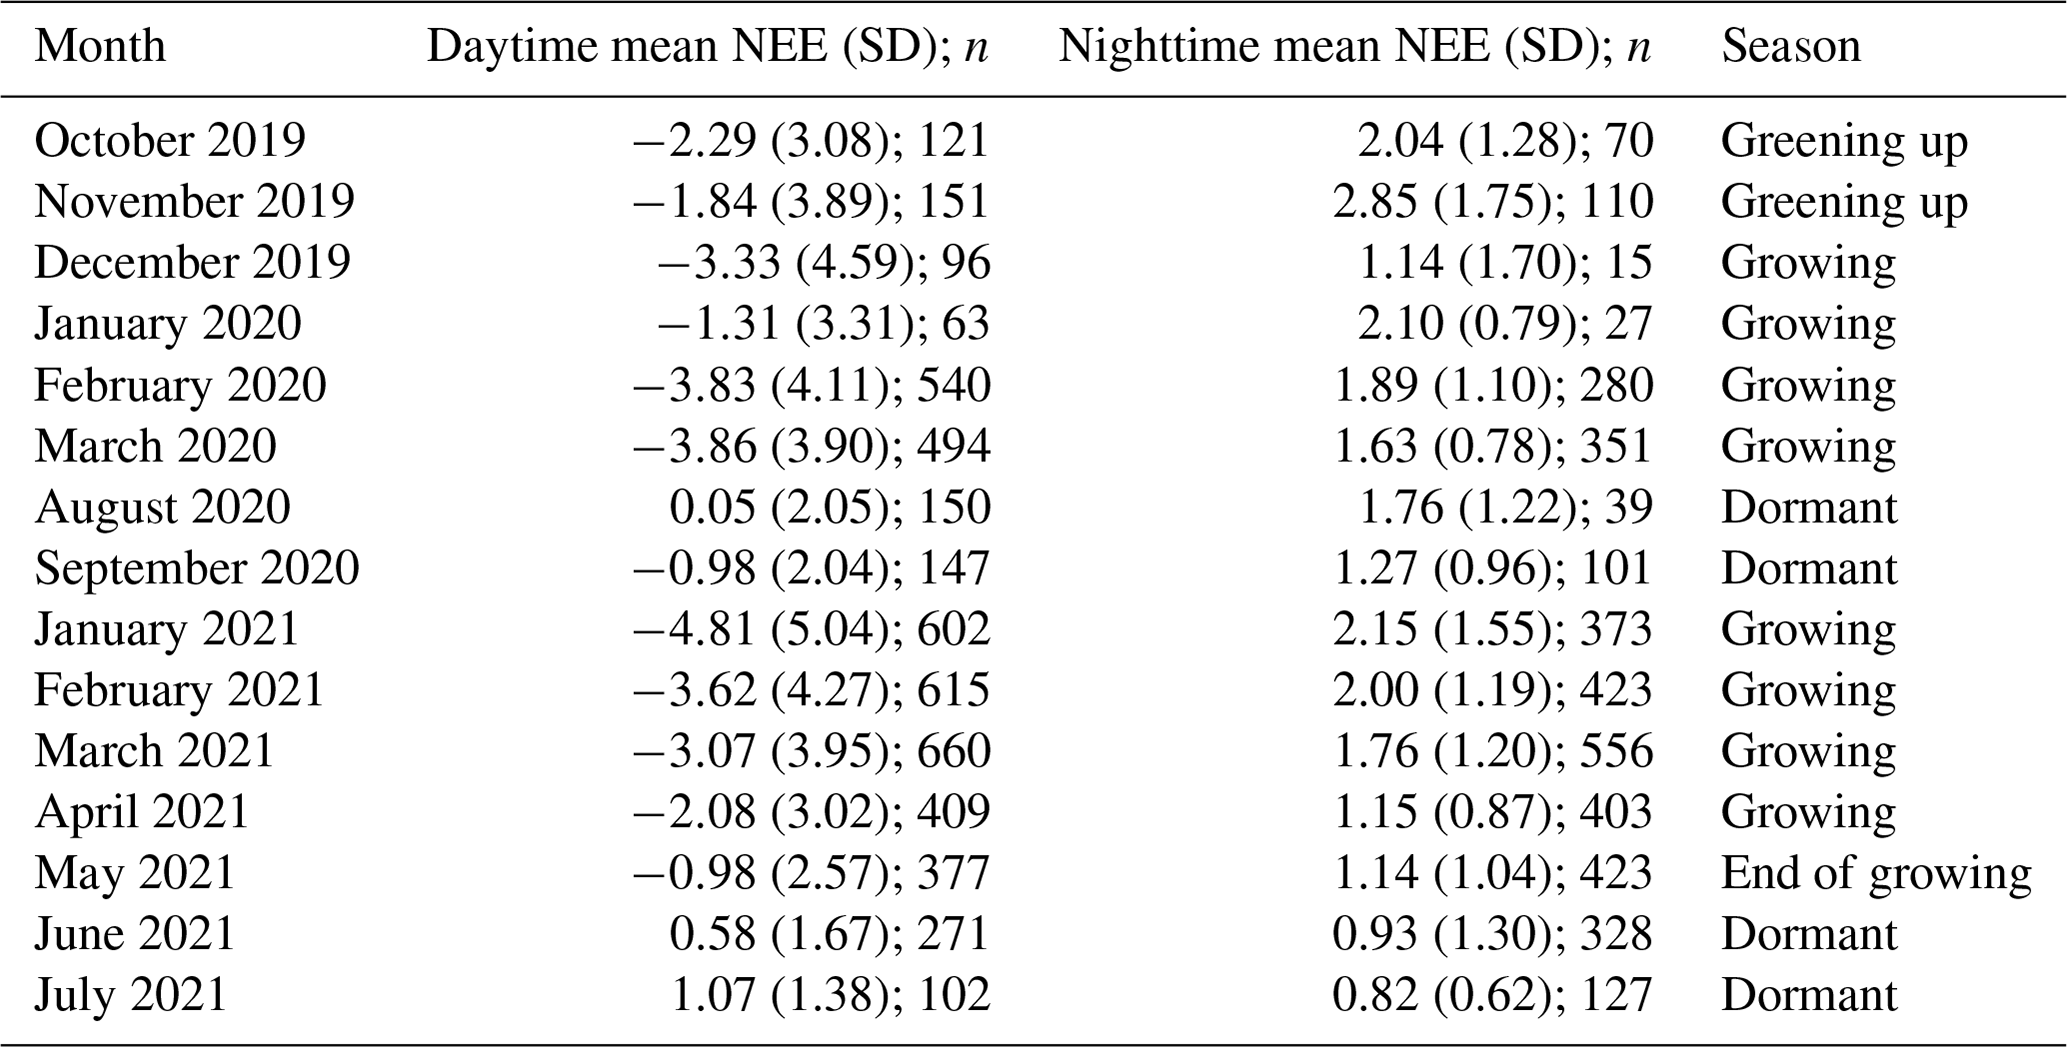
Half-hourly average CO2 flux was measured in , with positive fluxes indicating a flux direction from the Earth's surface to the atmosphere. Net ecosystem exchange (NEE) was defined as the net flux of CO2 from the atmosphere to the marsh and was often negative during the daytime, indicating that gross primary productivity (GPP) was larger than ecosystem respiration (Re). Evapotranspiration (ET) was calculated by EddyPro as the ratio between the latent heat flux (LE) and latent heat of vaporisation (λ). Ecosystem water use efficiency (WUEe) was then expressed as the ratio between daytime net ecosystem productivity in g CO2 m−2 h−1 and evapotranspiration in mm h−1.
A two-dimensional footprint estimation was provided according to the simple footprint parameterisation described in Kljun et al. (2015), calculating the ground position of the cumulative fraction of flux source contribution by distance for each 30 min interval. We assessed the short-term effects of environmental factors on CO2 fluxes at a half-hourly timescale (e.g. the effects of light, air temperature, and vapour pressure deficit) using a series of non-linear or linear models. These analyses were limited to the growing season, when the plants were actively photosynthesising. To calculate the daily integrated CO2 and H2O fluxes, the daily sum of these fluxes was determined for days with at least 85 % data coverage. This involved using the trapezoid rule to estimate the area under the curve for each of these 24 h periods. The trapezoid rule approximates the total flux by dividing the day into smaller intervals, each lasting 1800 s (30 min). For each data interval, the area is calculated by averaging the flux values at the beginning and end of the interval and then multiplying by the interval duration. These areas are then summed to obtain the total daily flux. This method ensures that even with some missing data points, a reliable estimate of the daily flux can be obtained. All post-processing and statistical analyses were performed in R 4.3.2 (R Core Team, 2024) including the packages ggplot2, clifro, MASS, dismo, amerifluxr, rmarkdown, geosphere, ggmap, and gbm.
For the CO2 budget, net ecosystem production (NEP) was defined as NEP NEE. Nighttime NEE is referred to as Re and was corrected for temperature effects on respiration using an exponential Arrhenius-type relationship (Lloyd and Taylor, 1994).
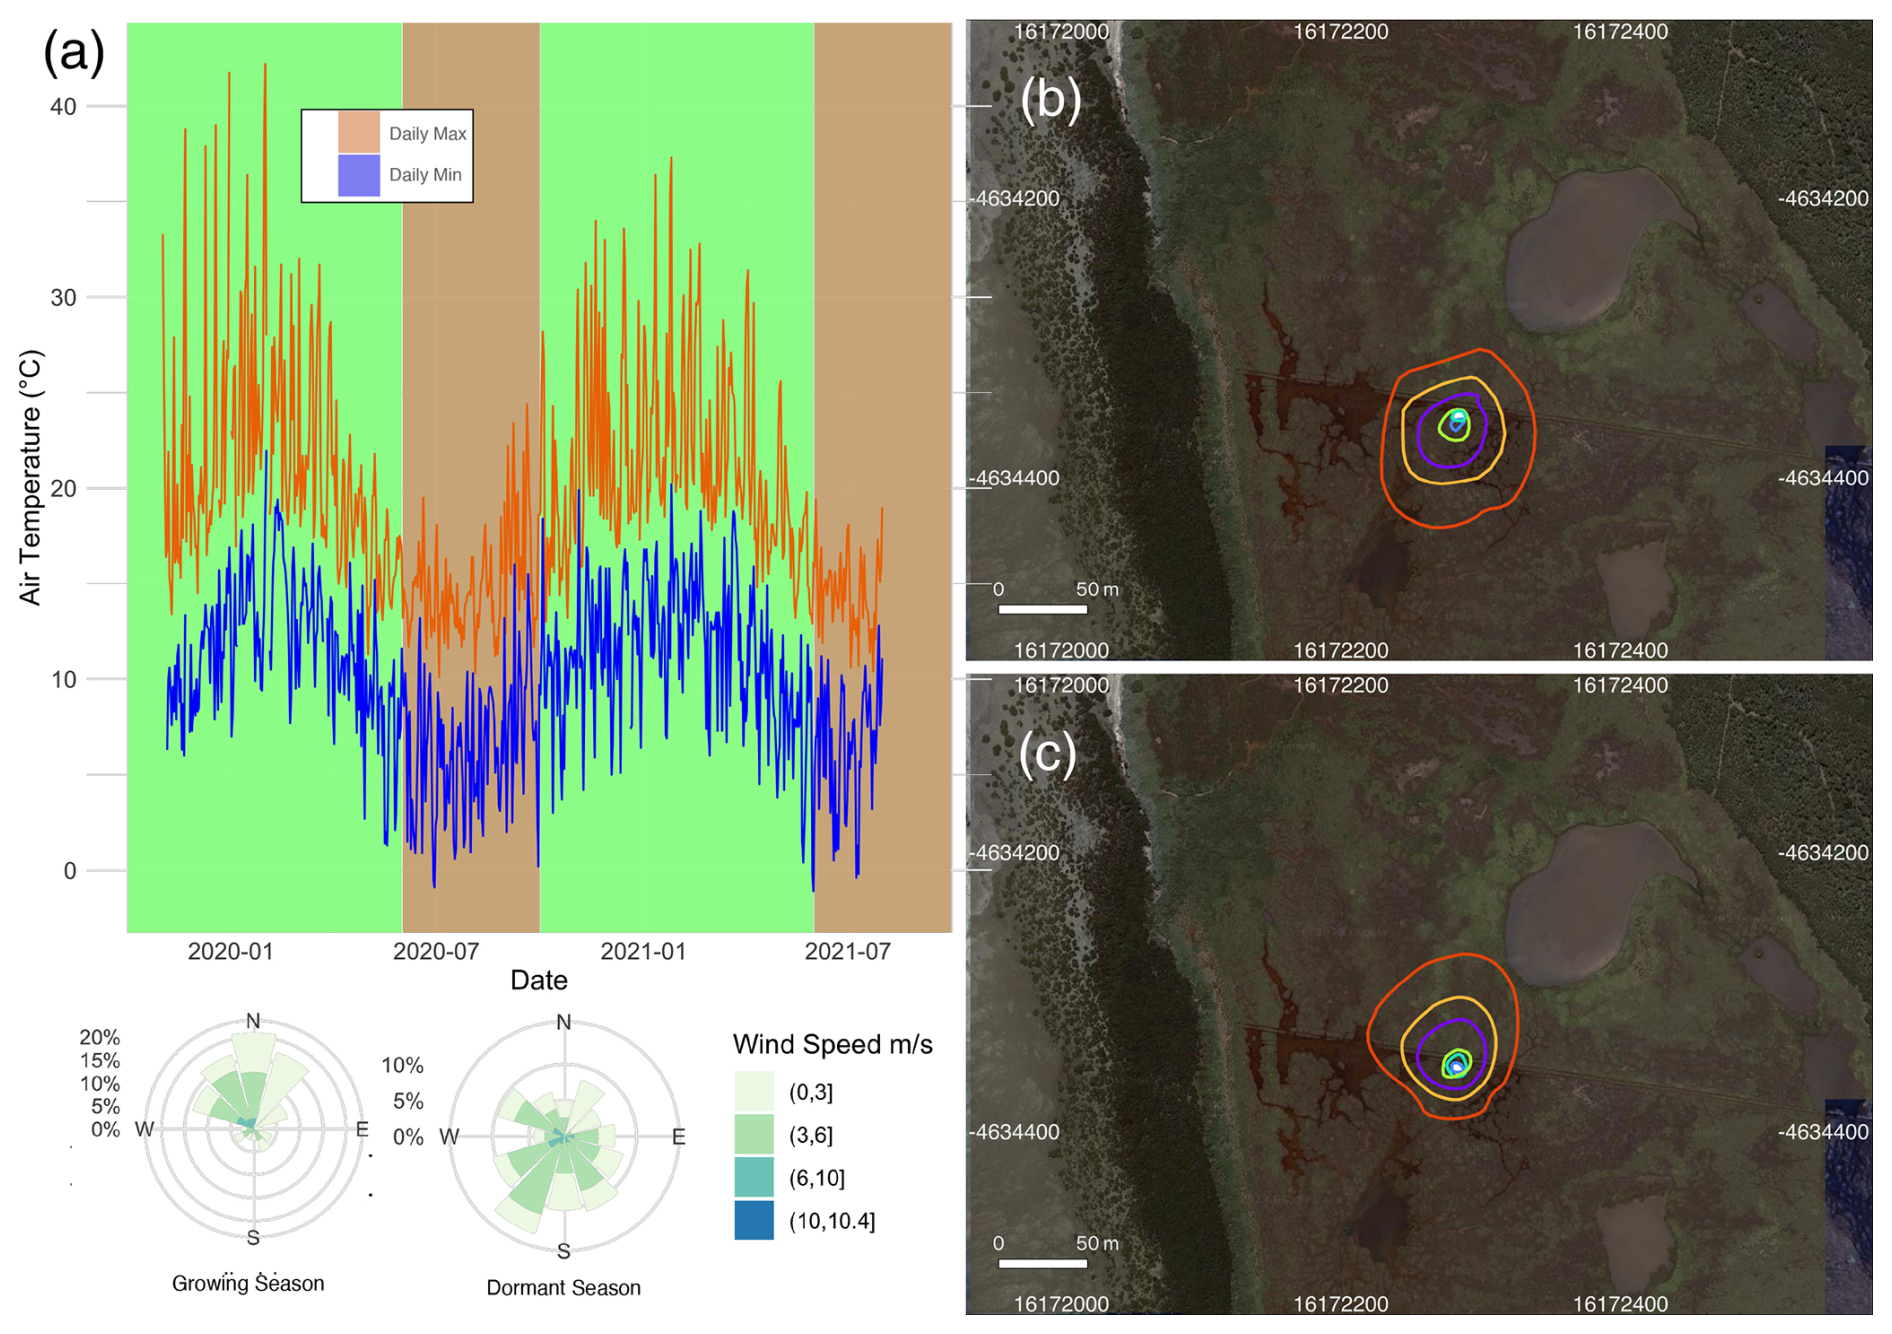
Figure 2(a) The minimum and maximum daily temperature recorded at the Cerberus meteorological station (Bureau of Meteorology, Fig. 1b) during 2019–2021. The marsh growing (October–May) and dormant (June–September) periods are shaded in green and pink respectively. A corresponding wind rose diagram summarises the wind speeds and directions measured at the tower site during the observation periods. The flux source footprint surrounding the tower during the dormant season (b) and the growing season (c) shows the cumulative flux source contribution to the flux measurements, with the outer red line representing the distance of which 90 % of the calculated flux is sourced and the other isolines from the tower outwards corresponding to 10 %, 20 %, 40 %, 60 %, and 80 % of the flux.
The observations were divided into a growing season and a dormant season to reflect the seasonal phenology of the dominant vegetation type within the flux tower footprint. During the growing season, mean temperature averaged 22.3 °C. Several heatwaves occurred during this period, with temperatures exceeding 40 °C on a few occasions in 2019. The dormant season was significantly colder and windier, with frequent southerly winds (Fig. 2a). Footprint models showed a slight variation in the flux source between the two seasons, although in both cases the size of the footprint and the vegetation composition within the footprint were similar (Fig. 2b and c), but the shape was skewed to the north during winter due to the prevalent southerly winds in that season (Fig. 2a). Of the flux measurement source, 70 % was from within 50 m of the tower, while the maximum length of the source location was 73 m.
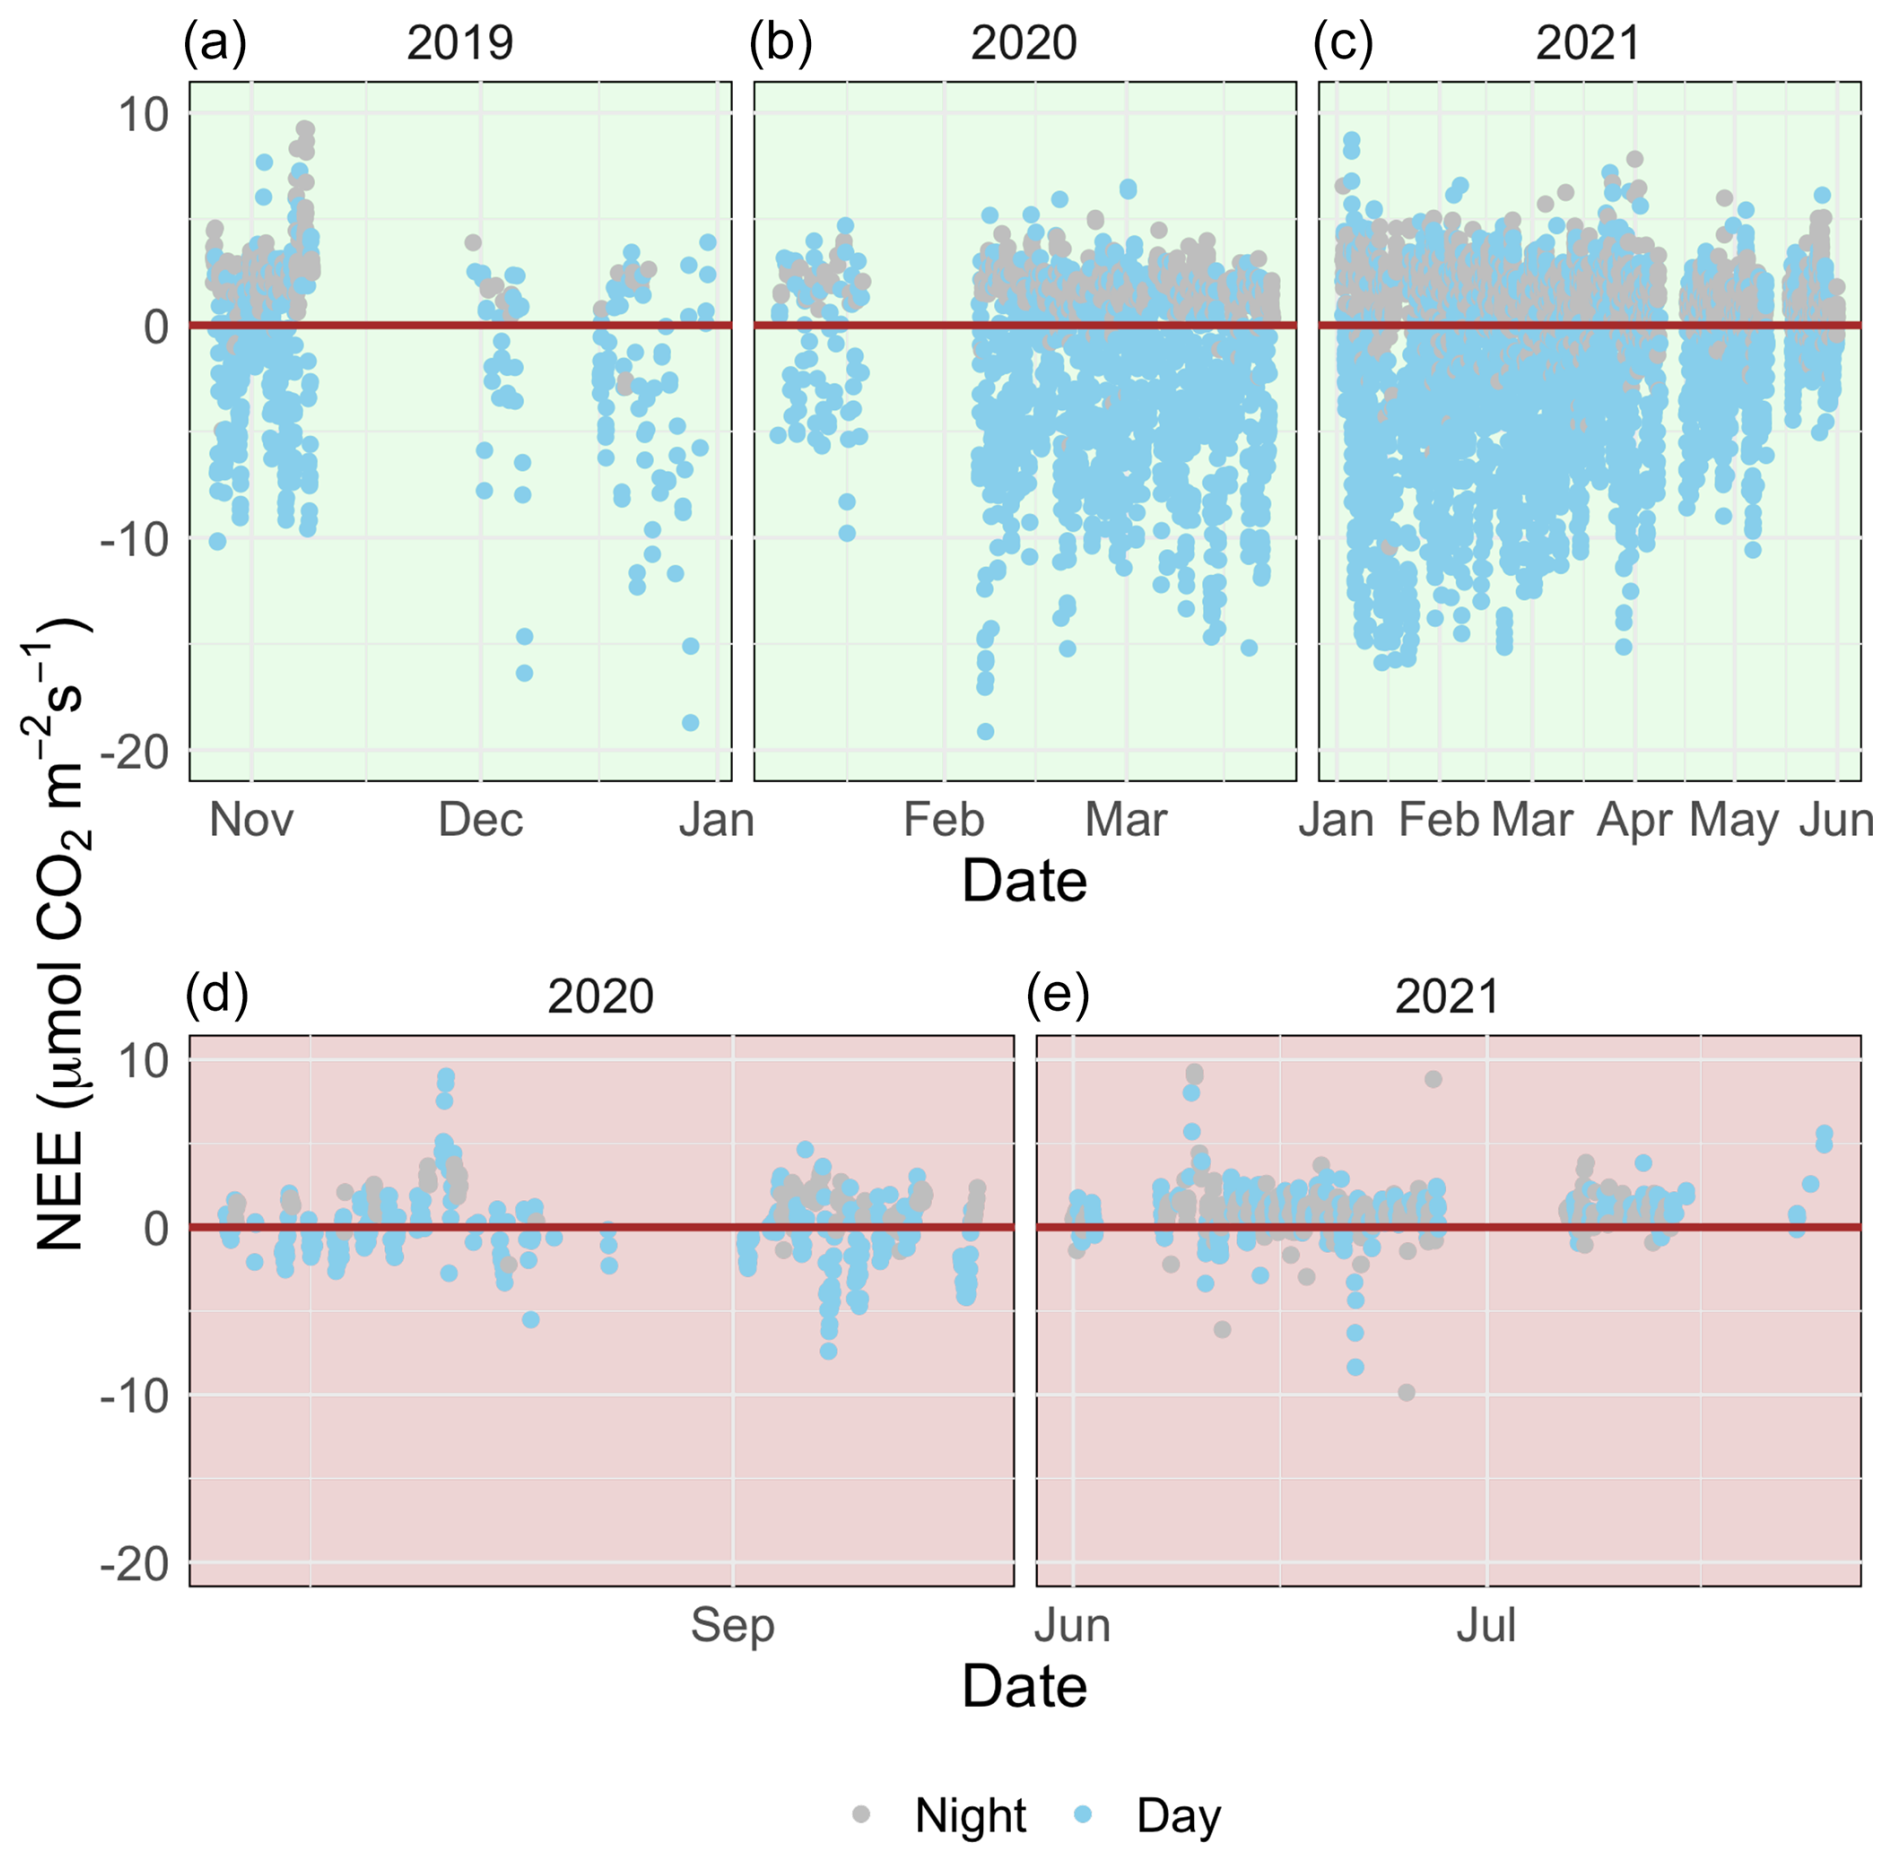
Figure 3A time series of half-hourly measurements of CO2 flux between a temperate saltmarsh and the atmosphere measured by eddy covariance during the marsh growing season (a–c) and the dormant season (d–e). Blue and grey points indicate measurements taken during the daytime and nighttime respectively. Positive fluxes indicate a direction of flux from the Earth's surface to the atmosphere.
The growing-season dataset included 90 d with 85 % or more flux data coverage, while the dormant-season dataset included 18 d. There was strong temporal variability in net ecosystem exchange (NEE) across both short (daily) and long (seasonal) temporal scales (Fig. 3). Daytime fluxes were defined as flux points where the global radiation values in the flux averaging half-hour interval were >12 W m−2 (as per EddyPro methodology). At the diurnal scale, saltmarsh NEE were negative mostly during the day and positive mostly during the night and ranged between −19.1 and 10.86 across the measurement periods. Monthly averages and data coverage are shown in Table 1.
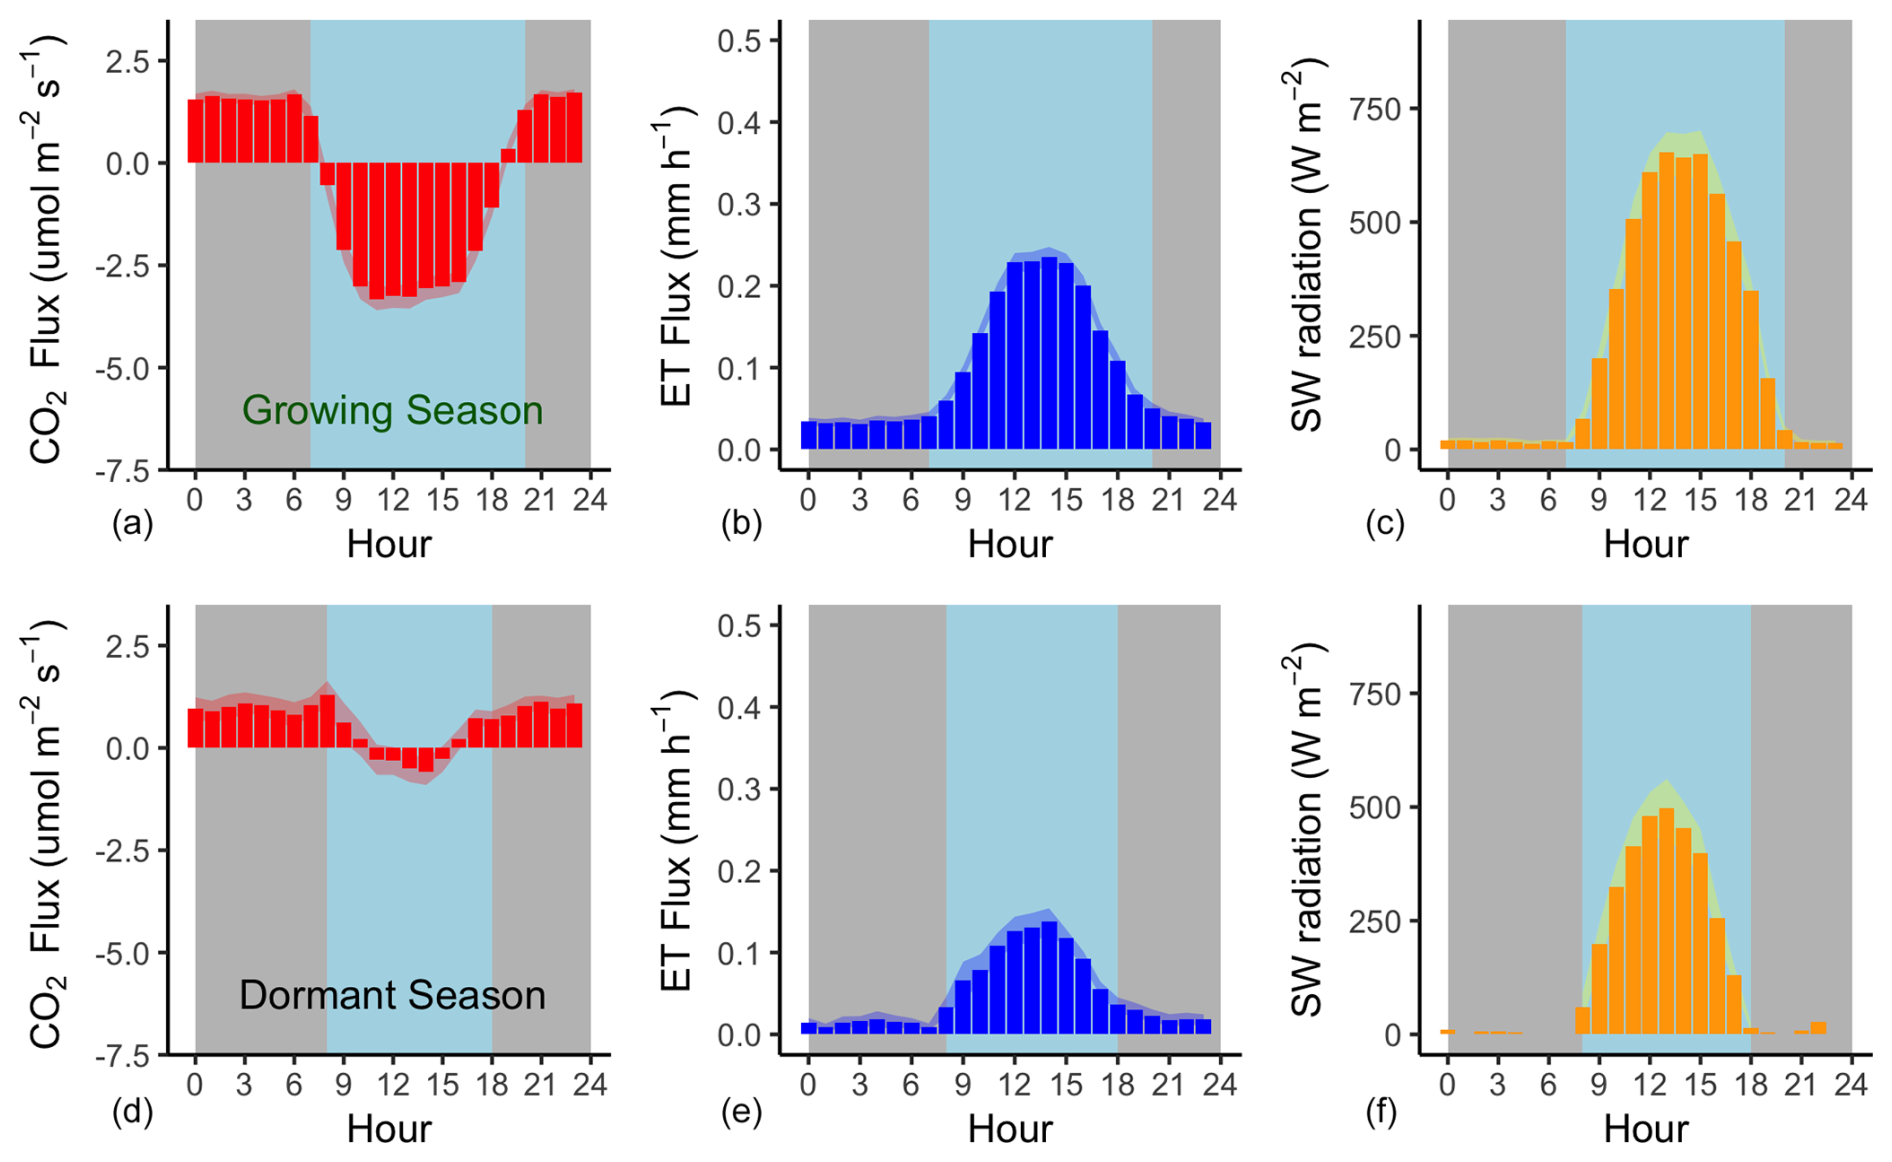
Figure 4Mean hourly CO2 and H2O flux (evapotranspiration) rates during the growing season (a–c) and the dormant season (d–f) alongside mean short-wave incoming radiation. Shading corresponds to 1 standard deviation (SD) around the mean. The grey background approximates nighttime periods, while light blue approximates the daytime (the actual day length varies within each season).
Flux rates varied across the day, with CO2 uptake peaking at 11:00 AEST during the growing season and later in the day (14:00 AEST) during the dormant period (Fig. 4). Ecosystem respiration rates (Re, defined as nighttime CO2 flux) were on average (± SD) 1.77 (±1.12) during the growing season and 1.0 (±0.93) during the dormant period. The difference in ecosystem respiration between the growing and dormant seasons is highly significant (t test, p<0.01). Daytime CO2 flux was on average (± SD) −3.53 (±4.15) during the growing season and −0.25 (±2.18) during the dormant season. Thus, we derive that the maximum gross primary productivity (GPP) of this ecosystem from NEE and temperature-corrected Re (Fig. 5), measured during the growing season, is ca. ( g C m−2 d−1). Average Re is thus estimated to comprise 33 % of GPP.
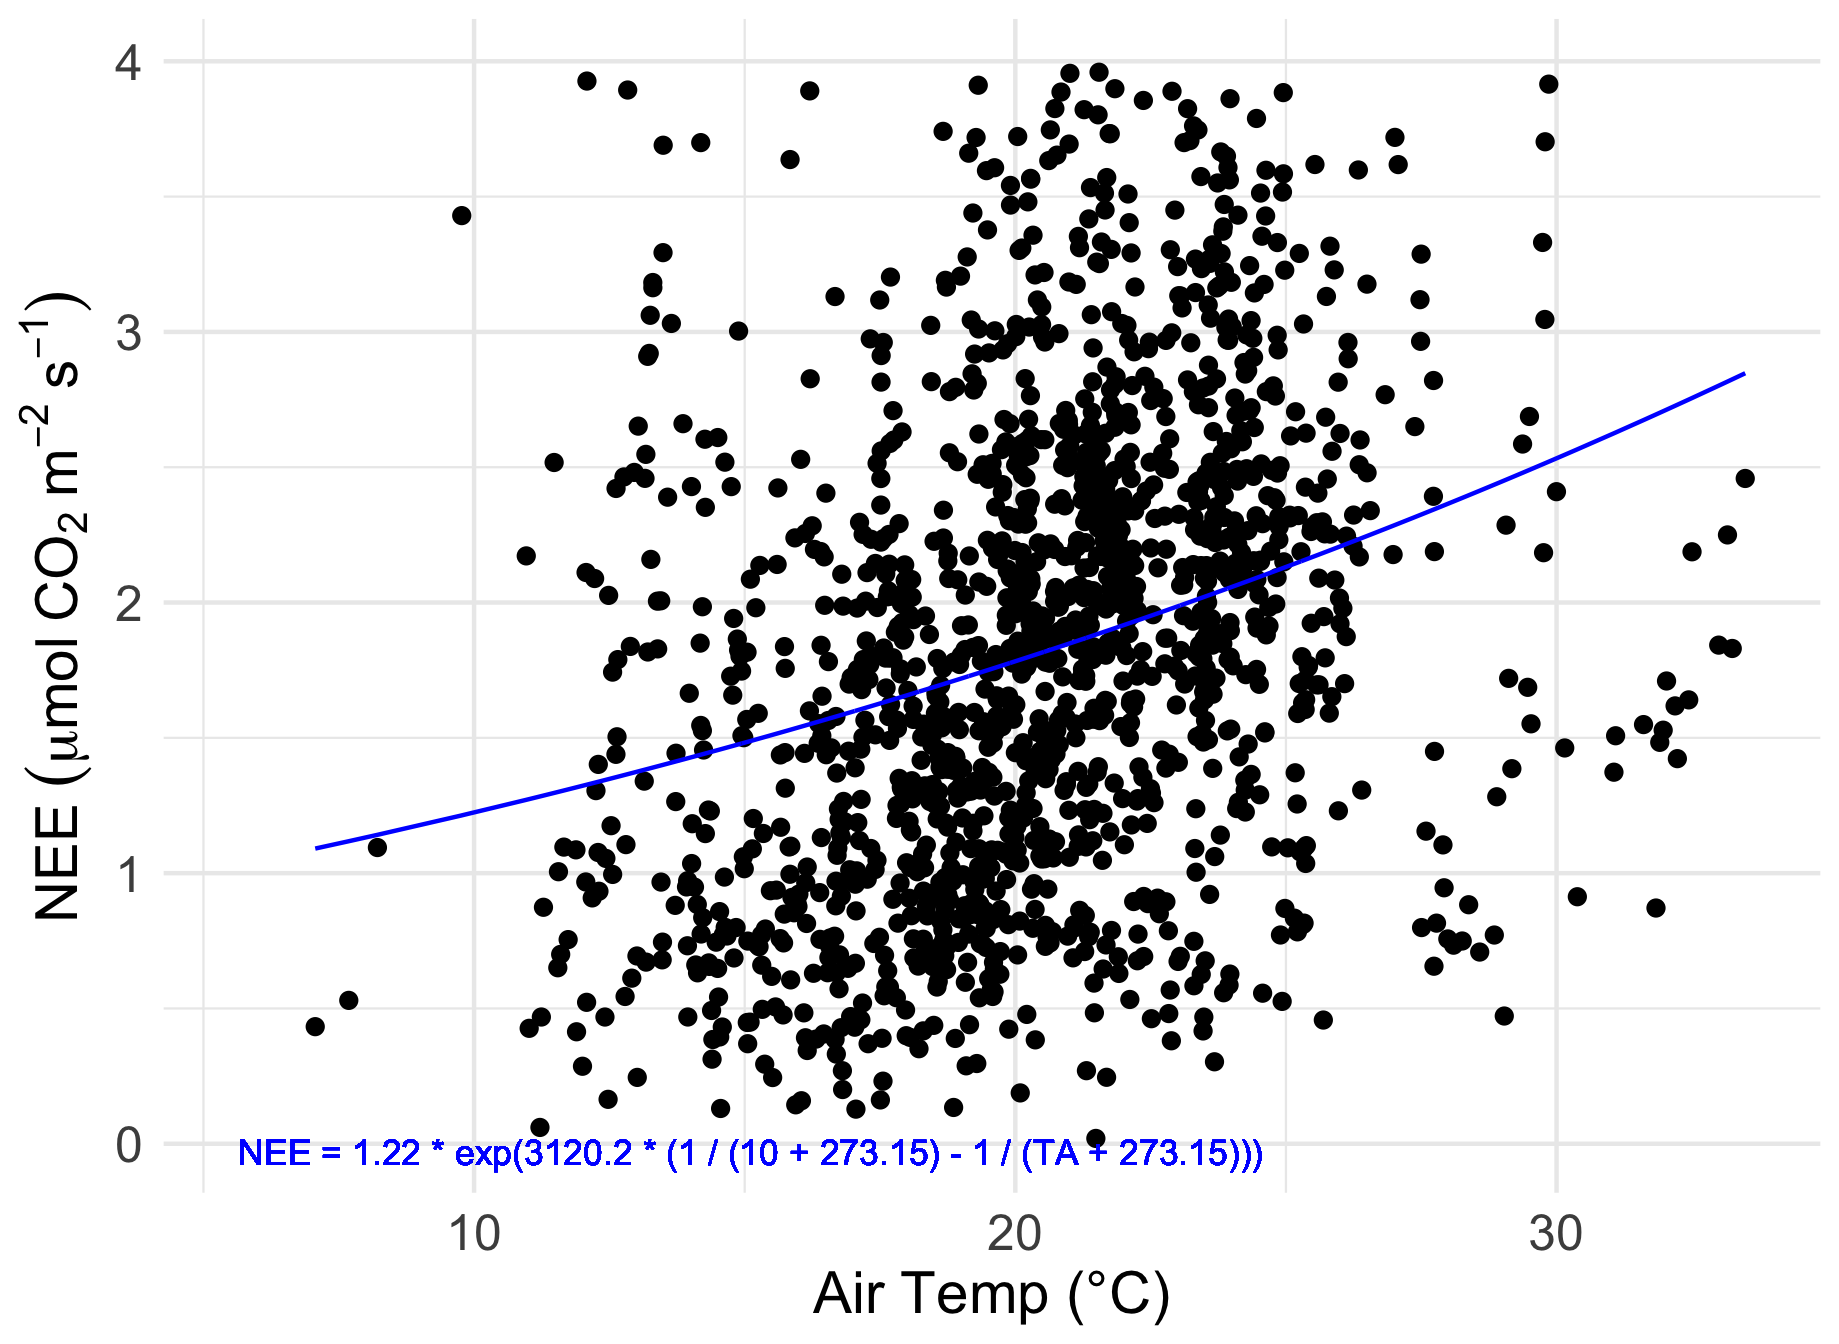
Figure 5The relationship between nighttime half-hourly flux measurements (NEE) taken between the hours of 22:00 and 02:00 AEST and air temperature (TA). The fitted curve (blue line) is the fitted Lloyd–Taylor Arrhenius non-linear model: NEE = , with R2=0.09.
Mean (± SD) daily evapotranspiration was 2.48 mm (±2.79 mm) during the growing season and 0.97 mm (±1.35 mm) during the dormant season (Fig. 4). Evapotranspiration peaked at noon AEST during the growing season (0.26 mm h−1) and later in the day (14:00 AEST) during the dormant season (0.14 mm h−1).
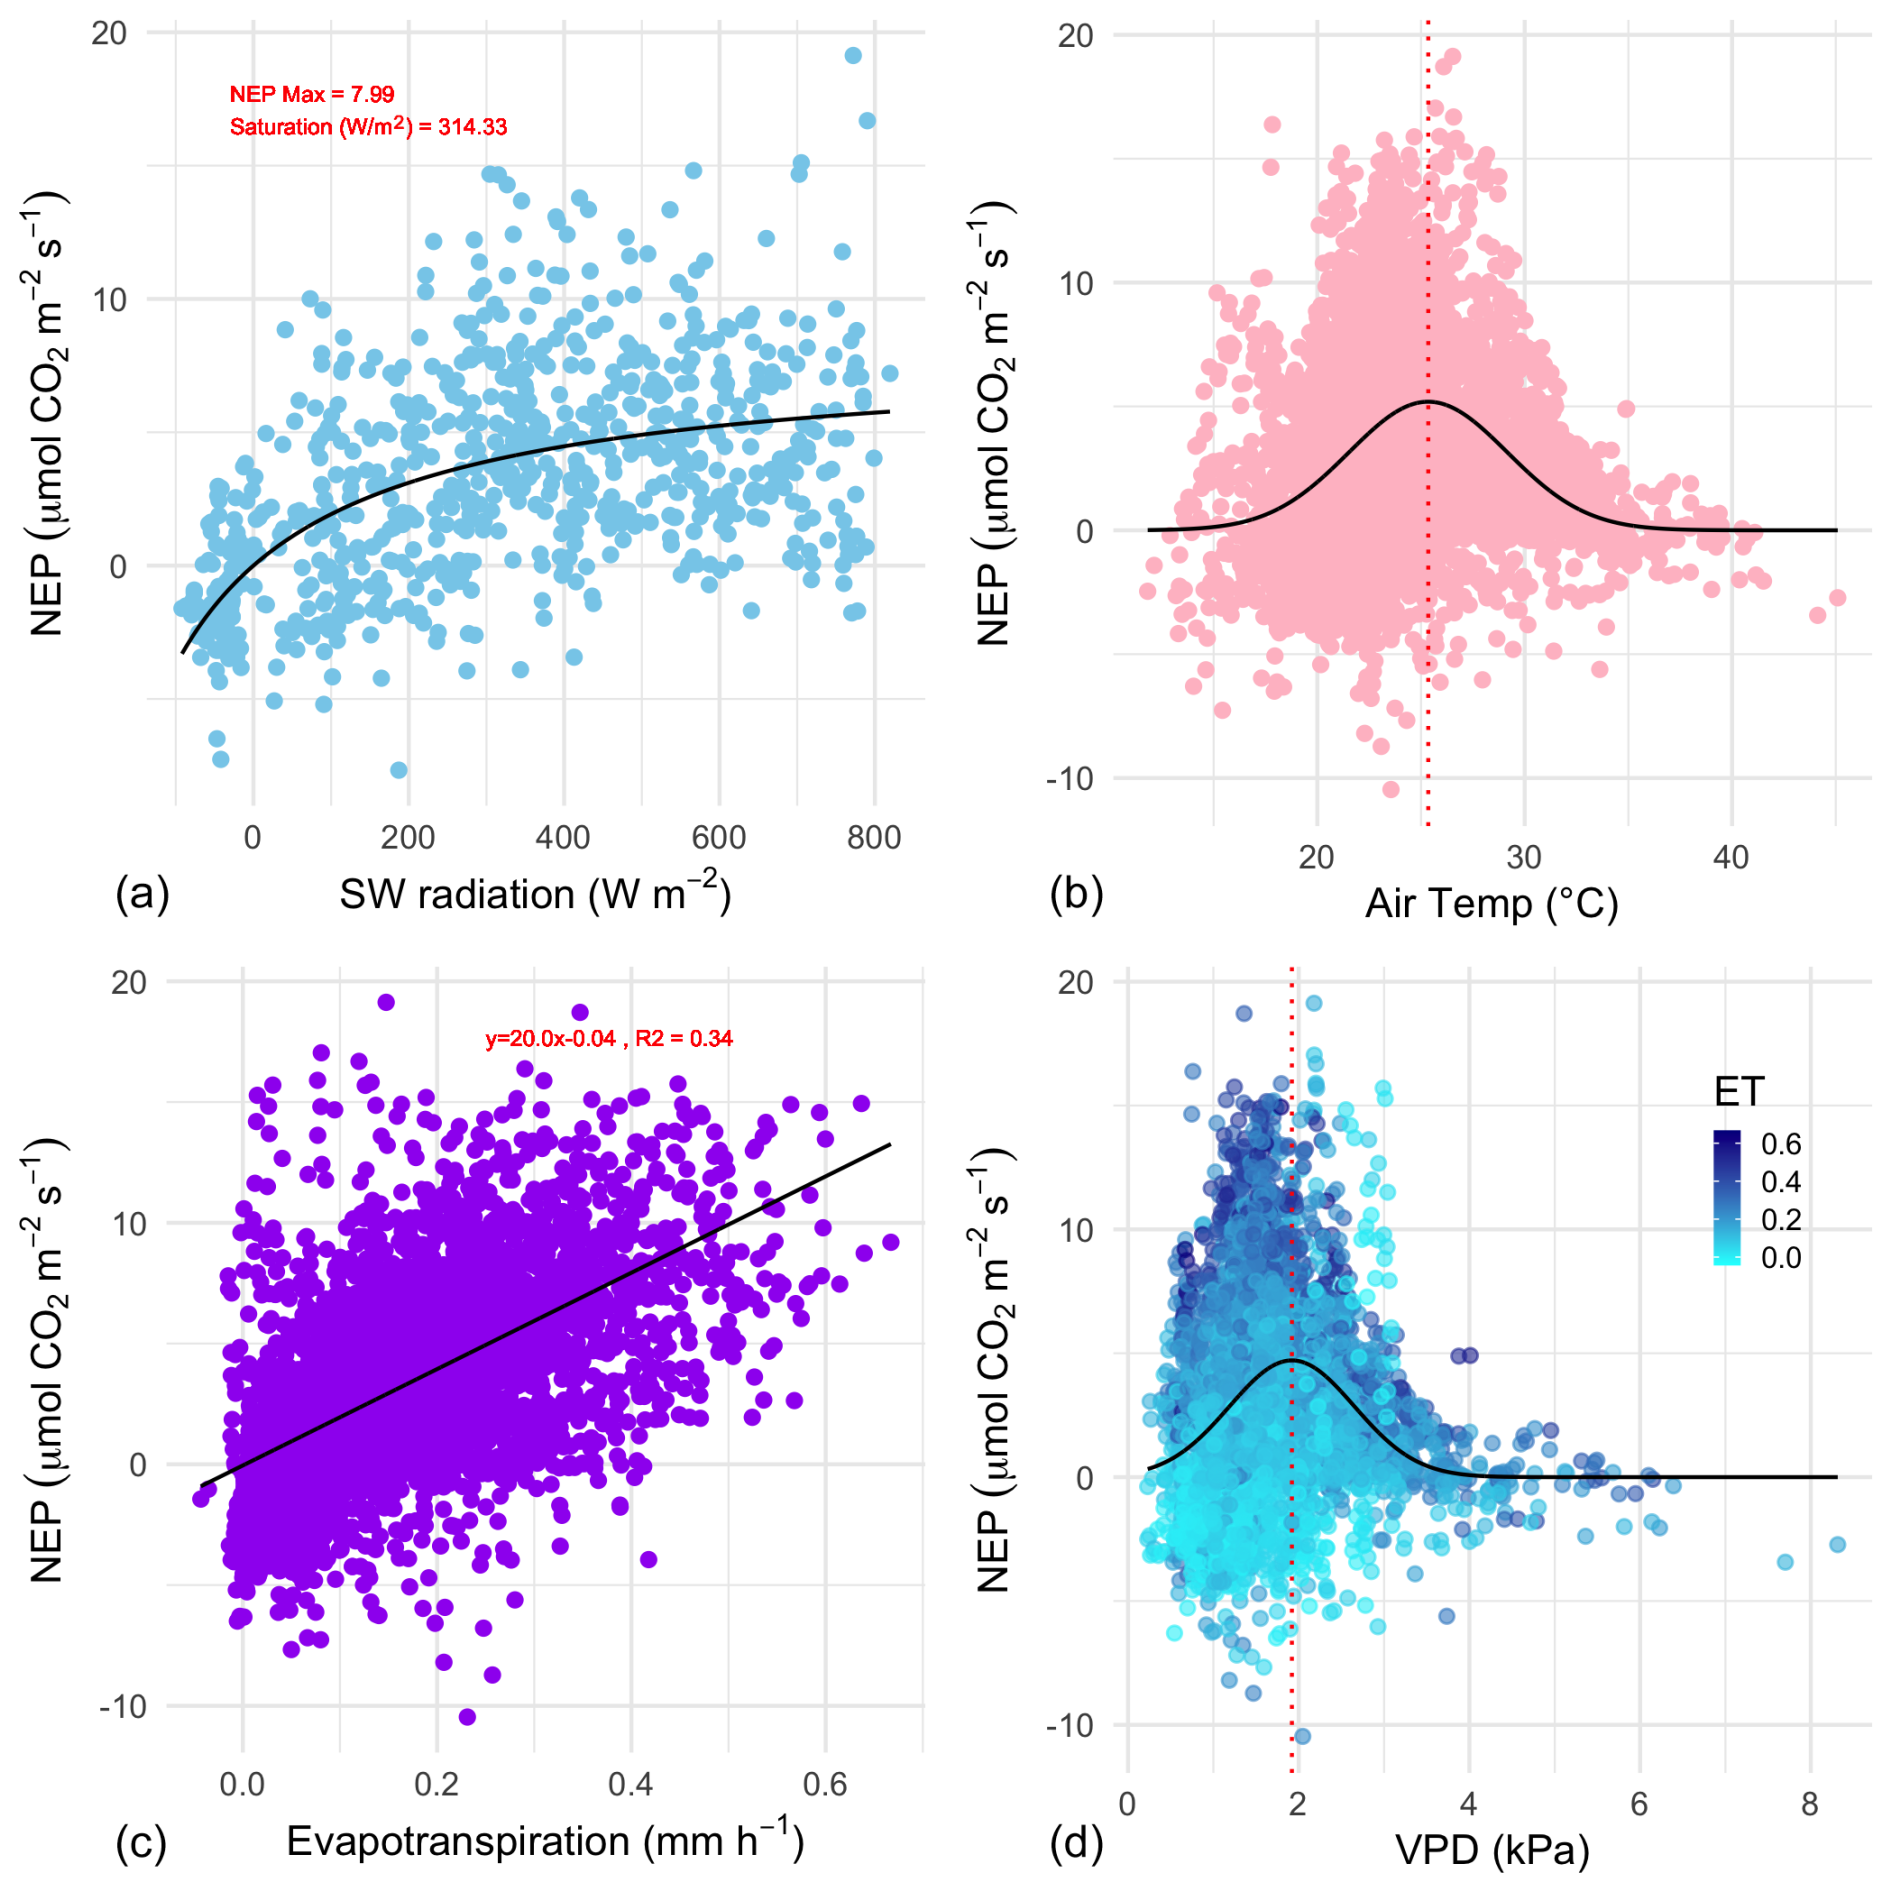
Figure 6The relationship between growing-season daytime half-hourly values of net ecosystem productivity (NEP, ) and corresponding environmental variables. (a) Net short-wave (SW) radiation (visible light); the black line is the Michaelis–Menten model of best fit. The coefficient of saturation is at 314 W m−2, and maximum net productivity is 8.0 . (b) Air temperature (TA); the black line is a Gaussian model of best fit with a temperature optimum at 25.3 °C. (c) Evapotranspiration; the linear model (R2=0.34) has a slope of 20.0. (d) vapour pressure deficit; the black line is a Gaussian model of best fit with a vapour pressure deficit (VPD) optimum at 1.92 kPa; points are coloured by the level of evapotranspiration during the half-hourly NEP measurement.
The effect of some environmental forcings on daytime NEE during the saltmarsh growing season was explored (Fig. 6). To distinguish this daytime-only value from the 24 h carbon balance integration and to better highlight CO2 uptake, NEP values are shown.
Short-wave radiation (visible light) was a limiting factor for NEP below approximately 300 W m−2, but radiation did not reach damaging levels that would lead to a drop in NEP throughout the measurement range, which reached a maximum level of ca. 800 W m−2. Unlike light, the NEP–air temperature relationship followed a Gaussian response, with the highest NEP achieved at the optimal temperature of 25.3 °C, with an SD of 3.8 °C, followed by a decline in CO2 uptake by the marsh at higher temperatures. The minimum and maximum air temperatures for which modelled NEP nears zero (defined here as 3 SDs from the mean) are 13.9 and 36.7 °C respectively. Temperature also had a slight but significant positive linear relationship with ecosystem respiration (slope = 0.07 , p<0.01, data not shown).
NEP was positively correlated with evapotranspiration during the growing season (Pearson r=0.59, Fig. 6c). The slope of the NEP ET relationship was 20.0, indicating an ecosystem water use efficiency (WUEe) of 0.86 g C kg−1 H2O (R2=0.34, p<0.001). The response of NEP to atmospheric vapour pressure deficit (VPD) fit a Gaussian relationship (the commonly observed inverse U-shaped curve relationship in response to VPD in plants), with NEP declining rapidly when VPD exceeded 2.39 kPa. The optimal range of VPD within which NEP was maximised in this ecosystem was 1.92 kPa (±0.73 kPa).
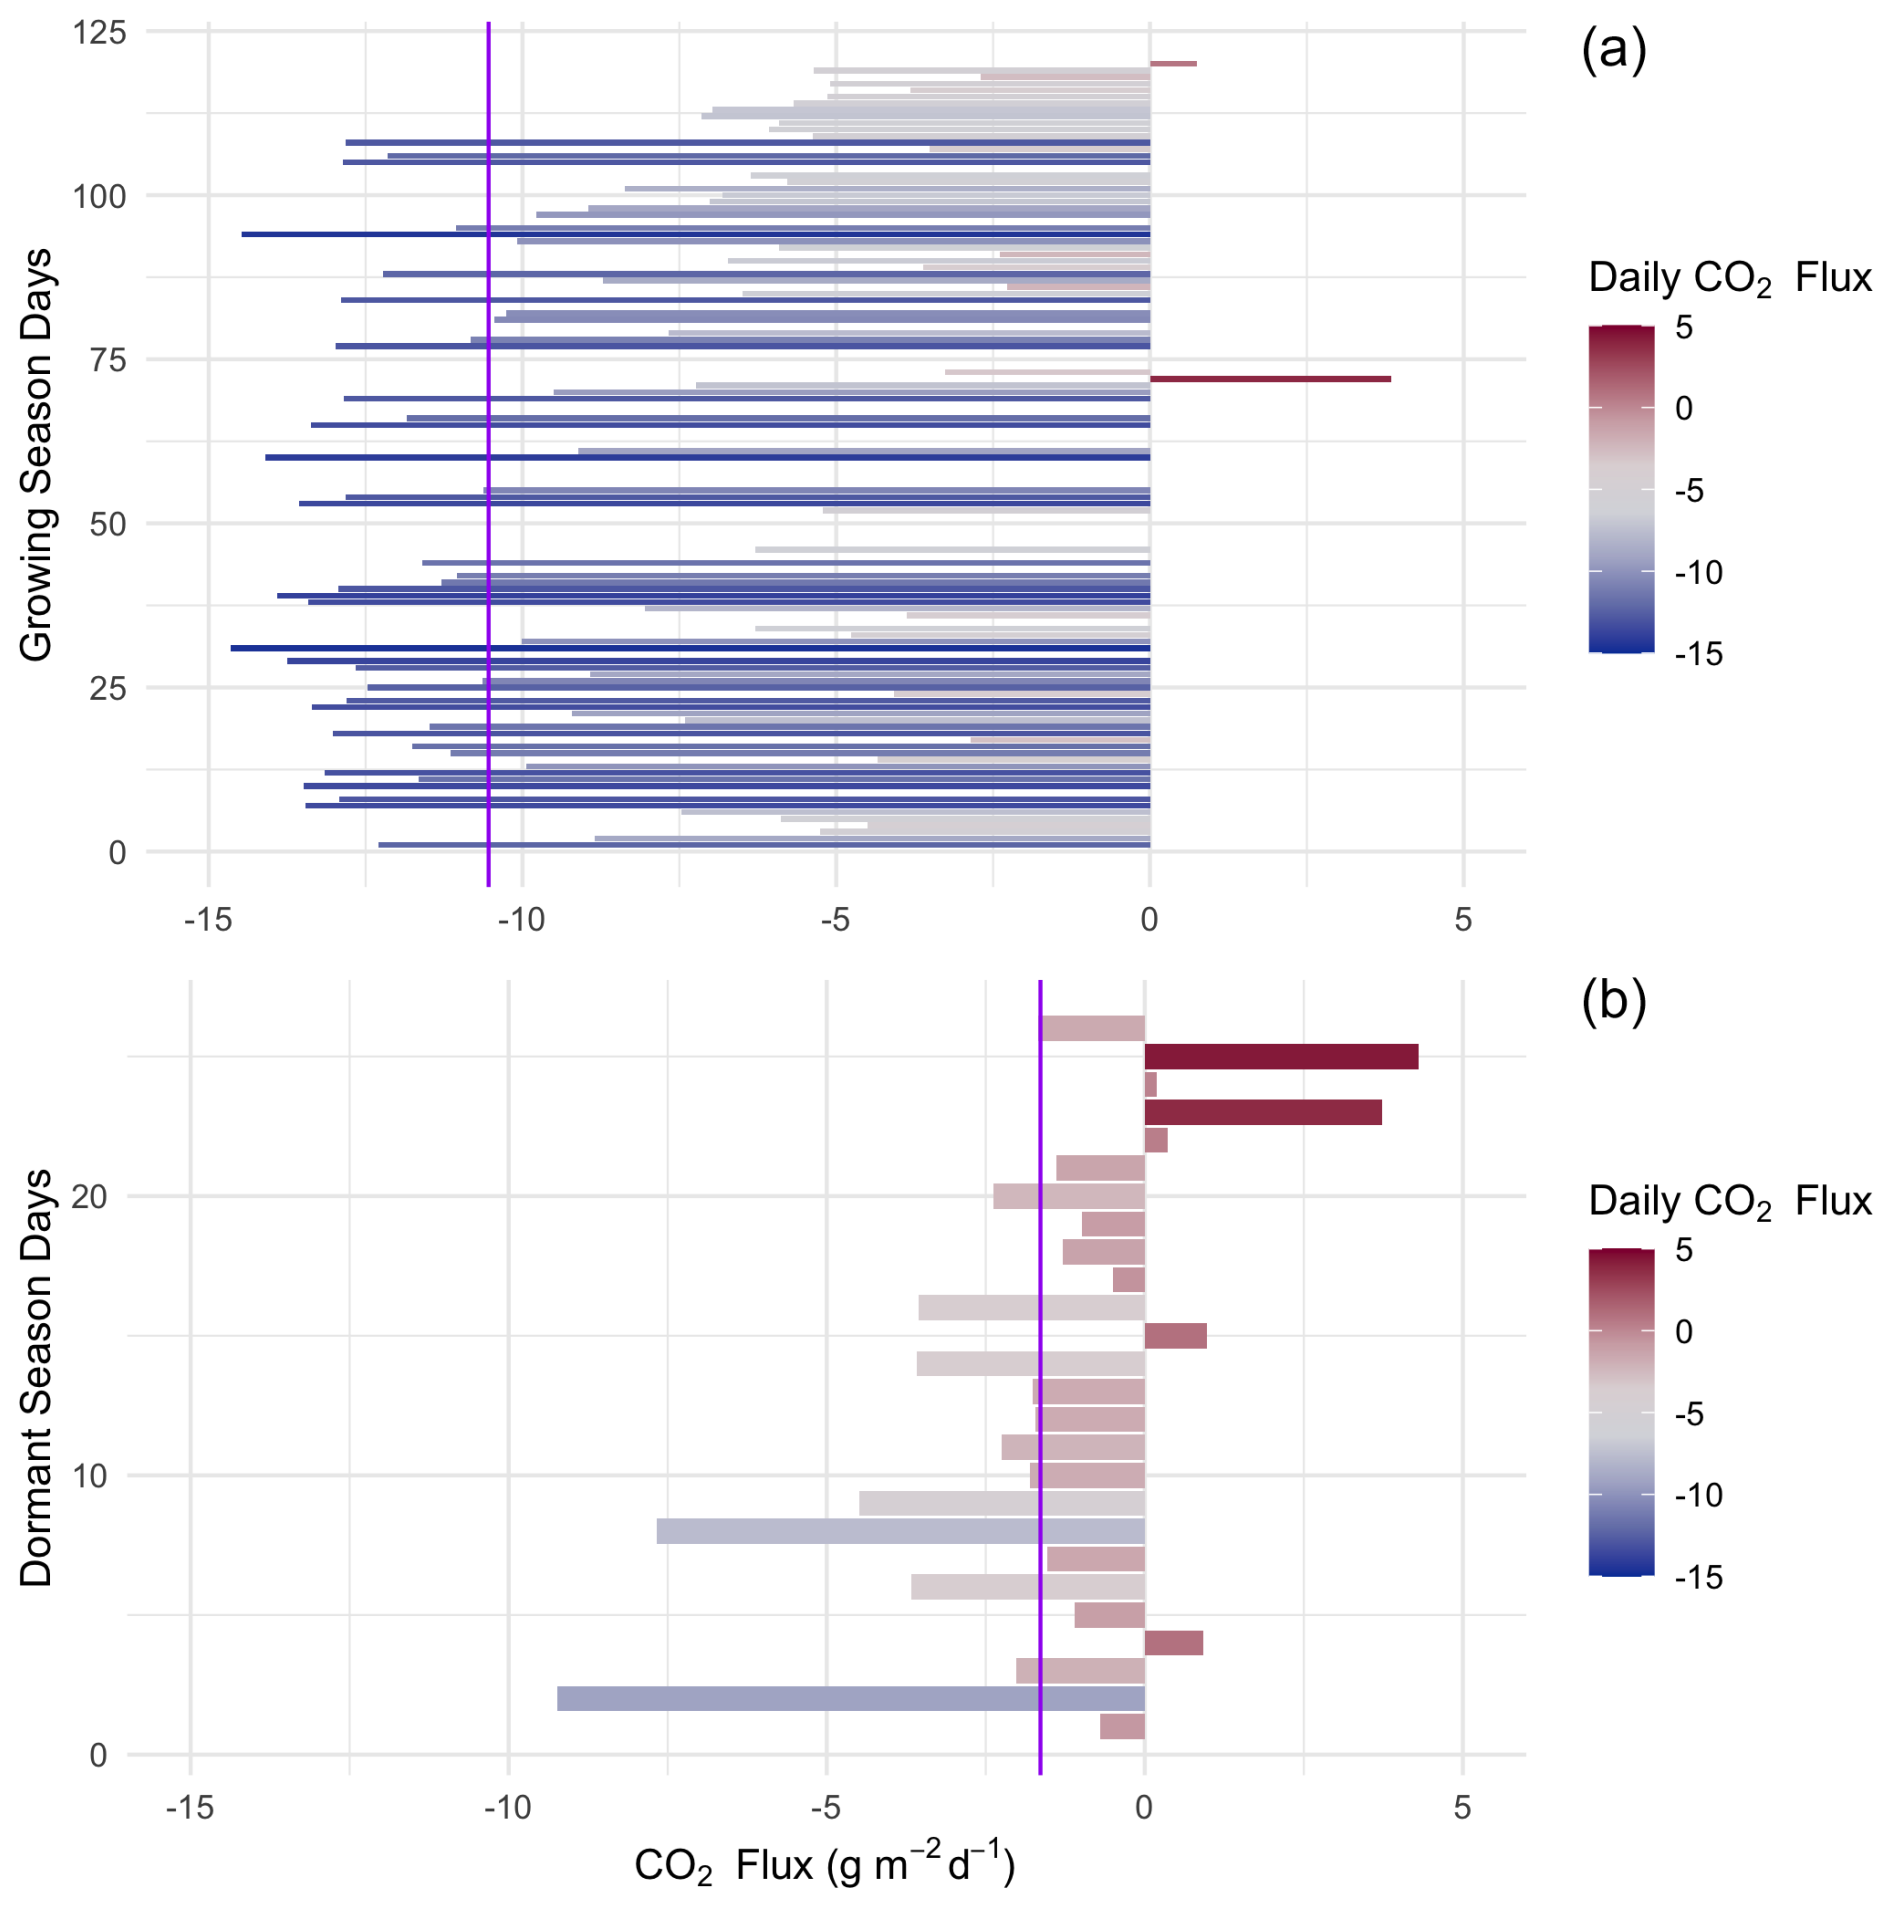
Figure 7Daily (24 h) integrated NEE in during the saltmarsh growing season (a) and the dormant season (b) for days with data density >85 %. Purple lines indicate the mean daily integrated flux for each season (−10.54 and −1.64 with an SD of 4.98 and 2.54 for growing and dormant respectively). A positive balance indicates an integrated net flux of CO2 from the Earth's surface to the atmosphere over the 24 h period.
When integrated over a 24 h period, the saltmarsh is on average a daily CO2 sink during all canopy phenological phases (Fig. 7), although during the dormant season the sink is weaker, with an average uptake of −2.42 (±2.54). During the growing season (defined as the non-dormant period and thus reflecting several phenological stages), the marsh is a substantial sink with a mean (± SD) daily NEP of 10.95 (±4.98) over a 24 h period (ranging between −22.8 and 4.3 g m−2 d−1 in terms of CO2 emission to the atmosphere). The daily CO2 budget during the growing season showed some variability among days (coefficient of variation (CV) = 0.46, Fig. 7), and days with lower average light levels (i.e. cloudy days) had a significant negative impact on the CO2 budget (multiple linear regression, p<0.02, R2=0.27). Daily maximum air temperatures did not have a significant impact on the daily CO2 budget (p=0.77) at this location, although NEE was significantly affected by temperature at finer temporal scales (Fig. 6).
The study provided high-frequency measurements of an abundant greenhouse gas (CO2) using a precise technique (eddy covariance flux) in an ecosystem with limited historical measurements. Time series analysis was performed on CO2 flux measurements across various scales (daily, nightly, diel, half-hourly, hourly, seasonally) to assess the impacts of ET, short-wave (SW) radiation, VPD, and air temperature (TA) on CO2 flux and how these relationships change throughout the year. Seasonality was observed for the first time in an Australian saltmarsh and had a significant effect on carbon and water flux. Growing-season net ecosystem productivity was 5 times greater than during the dormant period. Seasonality in Australian marshes has not been previously reported in the scientific literature and contradicts previous assumptions that Australian saltmarshes do not exhibit the growing and dormant phenology observed on other continents (Clarke and Jacoby, 1994). Seasonality had a significant impact on the daily carbon fluxes in this marsh and is an important characteristic of this habitat that has been overlooked (Owers et al., 2018). Seasonality can also have other broader implications yet to be considered in Australian marshes. For example, in the USA, the saltmarsh greening-up period was shown to be an important range-wide timing event for migratory birds (Smith et al., 2020), with plant-growth metrics predicting the timing of nest initiation for shorebirds. Saltmarshes in Australia are important roosting and feeding sites along the East Asian–Australasian Flyway, particularly for waders, thus potentially a similar relationship between migration timing and saltmarsh phenology could be occurring. Seasonality also affects other significant ecosystem functions such as the biogeomorphological feedback between saltmarshes, coastal hydrodynamics, and landscape evolution (Reents et al., 2022).
We derived the light response and associated coefficients of light regulation of saltmarsh NEE using the Michaelis–Menten model (Chen et al., 2002). Quantum (or production) efficiency is the predominant input in remote sensing techniques to model productivity and is specific to the biome (Hilker et al., 2010). While not directly comparable to leaf-level quantum efficiency measurements, the quantum efficiency (α) of the NEP light response curve was estimated from the slope of the Michaelis–Menten model to be 0.025 µmol CO2 J−1. The ecosystem reached light saturation at an insolation level of 314 W m−2, but daytime insolation was below this value more than 50 % of the time, suggesting that light might be a significant limiting factor for NEP at this marsh, especially during winter. The level of light limitation we observed is an underestimation due to the loss of high-quality EC data during periods of rain. The solar geometry at this latitude and the length of day result in annual average top-of-atmosphere SW radiation of 250 W m−2, but clouds can strongly modulate the SW radiation balance (SWCRE), and apart from the months of January and February when cloudy days are less frequent (10–12 d per month), cloudy days are frequent at this site, averaging 15–17 d per month (Bureau of Meteorology), and could significantly impact NEP.
Temperature is another forcing that significantly impacts NEE at this marsh, with an optimal value for maximum NEP at 25.3 °C (21.5–29.1 °C). Data for Australian saltmarshes are not available, but this optimal temperature response range is similar to that measured experimentally in a saltmarsh species in an equivalent climate zone (e.g. Georgia, USA; Giurgevich and Dunn, 1981) and to the values hypothesised for the habitat from data collected along the US Atlantic coast (Feher et al., 2017). The long-term average maximum daytime temperature at this site is 19.2 °C, which is cooler than the optimal range for NEE, suggesting temperature can be a significant limiting factor for productivity, especially during the dormancy period when average monthly maximum temperatures are only 13.7 to 16.6 °C (Bureau of Meteorology). During the growing season, the average maximum temperatures are within the range of optimal NEE (20.6 to 23.1 °C), although hot days (>30 °C) significantly depress NEE and, depending on the year, can be common during summer months (averaging 2–6 d per month). Within the diversity of saltmarsh species found globally, some species have C4 photosynthetic pathways (Drake, 1989). C4 photosynthesis plants often exhibit higher optimum temperature ranges (30–35 °C; Berry and Björkman, 1980) than C3 photosynthesis plants (20–25 °C), and the cooler conditions at this site could explain the absence of C4 plants from this bioregion. The parabolic relationships between NEP and air temperature and NEP and VPD suggest that higher air temperatures and VPD (which are expected with climate change) could negatively impact CO2 uptake by these coastal ecosystems. High VPD was related to lower NEP and, to a lesser extent, lower ET (Fig. 6d). However, VPD increases atmospheric demand for water, increasing the evaporation from the saturated marsh surfaces in the footprint, and this atmospheric demand could be forcing ET at high VPD rather than plant moderation via reduced transpiration, even if transpiration is reduced. Thus, despite maintained ET during VPD periods, we cannot conclude that there was a non-closure of stomata. NEP was also reduced below a VPD of 1.92 kPa, but at our field site, low VPD correlated with low temperatures (r=0.88) and low temperatures were shown to limit NEP.
In saltmarshes, evapotranspiration occurs not only via plant-mediated transpiration but also via soil pores (which tend to be saturated), wetted leaves, and open water. We observed average evaporation rates of 2.48 mm d−1 during the growing season and 0.97 mm d−1 during the dormant season. Actual evapotranspiration in this region modelled using the CMRSET algorithm is estimated to range between 0.6 and 3.2 mm d−1 during winter and summer respectively (McVicar et al., 2022); our field measurements support the model. Overall, rainfall is in excess of the requirements for maintaining ET at this site, although deficits can develop for short periods during the growing season, when ET is higher, perhaps explaining the drier saltmarsh surface during this period. Conversely, long-term rainfall excess could be contributing to the complicated hydrology at this location, where inundation is not strictly associated with the tidal stage (data not shown) and our observation of long (5 d) periods of inundation during winter.
Growing-season ET rates are significantly higher than those of the dormant season, partly due to the solar configuration in winter as opposed to summer but also due to phenological changes. A big-leaf model estimation of evapotranspiration from saltmarshes in New South Wales estimates ET to be highly sensitive to vegetation height, increasing by more than 1 mm d−1 as vegetation height increases from 0.1 to 0.4 m (Hughes et al., 2001), and transpiration in saltmarsh plants in the cold season has been shown to account for only 20 % of the annual transpiration budget (Giurgevich and Dunn, 1981), following the same pattern as the seasonal distribution of productivity.
The rate of carbon uptake per unit of water loss (WUE) is a key ecosystem characteristic, which is a result of a suite of physical and canopy physiological forcings, and has direct implications for ecosystem function and global water and carbon cycling. The mean water use efficiency (WUEe) of this saltmarsh was estimated at 0.86 g C kg−1 H2O, which is markedly lower than for grass-dominated saltmarshes in China (2.9 g C kg−1 H2O; Xiao et al., 2013) but similar to the value for WUEe based on NEP and ET in mangroves (0.77 g C kg−1 H2O; Krauss et al., 2022), which also consist of C3 plants. The Chinese saltmarshes studied in Xiao et al. (2013) are dominated by Spartina alterniflora, a C4 perennial grass. C4 plants have higher (often double) water use efficiencies than C3 plants due to CO2 concentrating mechanisms (Osborne and Freckleton, 2009). The saltmarsh at French Island includes only C3 plants, and the dominant chenopod Sarcocornia quinqueflora has been suspected to have higher evapotranspiration rates than saltmarsh by approx. 15 % (Hughes et al., 2001), but while Sarcocornia quinqueflora dominates at this site, the footprint is a mix of species, and the lower WUEe cannot be directly linked to the presence of Sarcocornia quinqueflora. Furthermore, like most wetlands, the wetland surface is a mixed composition of emergent vegetation, unsaturated soil, and waterbodies; thus the spatial scale at which WUEe is determined encompasses both the canopy (Ec) and any open water present in the footprint. Transpiration is predicted to account for only 55 % of ET in these systems (Hughes et al., 2001), which is an Ec-to-ET ratio similar to that of mangroves (Krauss et al., 2022) but significantly lower than terrestrial forests, where more than 90 % of ET can be attributed to transpiration. Thus, regional variations in WUEe can be attributed to multiple forcings that form complex spatiotemporal patterns.
Saltmarshes are considered among the most productive ecosystems on Earth, with estimated global NEP of 634 Tg C yr−1 (Fagherazzi et al., 2013) and 601 Tg C yr−1 (Rosentreter et al., 2023). Productivity of southern Australian marshes was previously estimated at 0.8 kg m−2 yr−1 by repeated measurements of aboveground standing crops (Clarke and Jacoby, 1994), which, if not accounting for season, equates to 2.2 g C m−2 d−1. Similar studies on saltmarshes in France report lower productivity (483 ; Mayen et al., 2024) and daily growing-season rates of 1.53 g C m−2 d−1, but mid-latitude saltmarsh sites in the USA and China show productivity rates of 775 (Wang et al., 2016) and 668 (Xiao et al., 2013) respectively. It is clear that productivity across climate zones and biogeographic regions varies widely, with some studies even reporting net emissions over an annual period from some marshes and a global average estimated between 382 (Alongi, 2020) and 1585 (Chmura et al., 2003), albeit based on a small subset of studies. An analysis of GPP across latitudes in the USA shows that warmer sites (including mangrove wetlands in southern USA) had significantly higher GPP than GPP values of mid-latitude saltmarshes such as the one on French Island (Feagin et al., 2020). Mangroves have higher NEE than saltmarshes, estimated by Krauss et al. (2022) to average 1200 . While our data do not provide enough coverage for a long-term annual estimate of carbon flux, our daily values of an average of 2.88 g C m−2 d−1 during the growing season, combined with the relatively short dormant season relative to other temperate locations, suggest a high carbon sequestration rate for this ecosystem type. In another Southern Hemisphere study, growing-season rates at an EC tower site in Argentina are extrapolated by us to average 1.6 g C m−2 d−1 (Bautista et al., 2023), but in that saltmarsh, flooding reduced vegetation biomass and productivity.
The data presented here are the exchange of carbon between the land surface and the atmosphere, but saltmarshes, like other marine-connected communities, also exchange carbon through dissolved carbon pathways, which can be significant (Cai, 2011). Thus, the fluxes presented here do not constitute the entire carbon budget of this ecosystem.
The response of the French Island saltmarsh to environmental drivers is indicative of the complex interactions determining saltmarsh productivity. The unique long-term, high-resolution record enabled us to derive temperature, VPD and light response functions, thus formulating equations that describe how climate-change-sensitive parameters, such as temperature, relative humidity, and cloud cover, affect CO2 uptake, respiration, and evapotranspiration. The marsh operated as a CO2 sink throughout the various canopy phenological phases, but during the dormant period, CO2 uptake was less than 25 % that of the growing season. Seasonality of greenhouse gas fluxes in Australian saltmarshes is an understudied but important aspect of global carbon budgeting.
Data used for this analysis are available at https://doi.org/10.26180/26027005.v1 (Reef, 2024).
RR conceptualised the study, acquired funding, prepared the manuscript, designed and carried out the field campaign, and performed the analysis. ED acquired funding, developed methodology, and prepared the manuscript. AG developed methodology and prepared the manuscript. TA, EJVH, HR, and MP were involved in the field investigation and administration of the project and provided manuscript edits.
The contact author has declared that none of the authors has any competing interests.
Publisher's note: Copernicus Publications remains neutral with regard to jurisdictional claims made in the text, published maps, institutional affiliations, or any other geographical representation in this paper. While Copernicus Publications makes every effort to include appropriate place names, the final responsibility lies with the authors.
The work was carried out with the permission of Parks Victoria (permit 10008684). We thank Phil and Yuko Bock for logistic support and accommodation on French Island. We thank Leigh Burgess, Kiri Mason, and Ian McHugh for technical support and the Australian OzFlux community for ongoing collaboration.
The work was funded by an Australian Research Council Discovery Award to Ruth Reef and Edoardo Daly (grant no. DP220102873).
This paper was edited by Ivonne Trebs and reviewed by two anonymous referees.
Adam, P.: Saltmarsh Ecology, Cambridge University Press, Cambridge, England, UK, 461 pp., ISBN 10 0521245087 1990.
Adam, P.: Morecambe Bay saltmarshes: 25 years of change, in: British Saltmarshes, Forrest Text, Cardigan, UK, 81–107, 2000.
Adam, P.: Saltmarshes in a time of change, Environ. Conserv., 29, 39–61, https://doi.org/10.1017/S0376892902000048, 2002.
Alongi, D. M.: Carbon balance in salt marsh and mangrove ecosystems: A global synthesis, J. Mar. Sci. Eng., 8, 767, https://doi.org/10.3390/jmse8100767, 2020.
Artigas, F., Shin, J. Y., Hobble, C., Marti-Donati, A., Schäfer, K. V. R., and Pechmann, I.: Long term carbon storage potential and CO2 sink strength of a restored salt marsh in New Jersey, Agric. For. Meteorol., 200, 313–321, https://doi.org/10.1016/j.agrformet.2014.09.012, 2015.
Baldocchi, D. D.: Assessing the eddy covariance technique for evaluating carbon dioxide exchange rates of ecosystems: past, present and future, Glob. Change Biol., 9, 479–492, https://doi.org/10.1046/j.1365-2486.2003.00629.x, 2003.
Barr, A. G., Richardson, A. D., Hollinger, D. Y., Papale, D., Arain, M. A., Black, T. A., Bohrer, G., Dragoni, D., Fischer, M. L., Gu, L., Law, B. E., Margolis, H. A., McCaughey, J. H., Munger, J. W., Oechel, W., and Schaeffer, K.: Use of change-point detection for friction-velocity threshold evaluation in eddy-covariance studies, Agric. For. Meteorol., 171, 31–45, https://doi.org/10.1016/j.agrformet.2012.11.023, 2013.
Bautista, N. E., Gassmann, M. I., and Pérez, C. F.: Gross primary production, ecosystem respiration, and net ecosystem production in a southeastern South American salt marsh, Estuar. Coast, 46, 1923–1937, https://doi.org/10.1007/s12237-023-01224-8, 2023.
Berry, J. and Björkman, O.: Photosynthetic response and adaptation to temperature in higher plants, Ann. Rev. Plant Physiol., 31, 491–543, https://doi.org/10.1146/annurev.pp.31.060180.002423, 1980.
Borges, A. V., Schiettecatte, L.-S., Abril, G., Delille, B., and Gazeau, F.: Carbon dioxide in European coastal waters, Trace Gases Eur. Coast. Zone, 70, 375–387, https://doi.org/10.1016/j.ecss.2006.05.046, 2006.
Cai, W.-J.: Estuarine and coastal ocean carbon paradox: CO2 sinks or sites of terrestrial carbon incineration?, Annu. Rev. Mar. Sci., 3, 123–145, https://doi.org/10.1146/annurev-marine-120709-142723, 2011.
Chen, J., Falk, M., Euskirchen, E., Paw U, K. T., Suchanek, T. H., Ustin, S. L., Bond, B. J., Brosofske, K. D., Phillips, N., and Bi, R.: Biophysical controls of carbon flows in three successional Douglas-fir stands based on eddy-covariance measurements, Tree Physiol., 22, 169–177, https://doi.org/10.1093/treephys/22.2-3.169, 2002.
Chmura, G. L., Anisfeld, S. C., Cahoon, D. R., and Lynch, J. C.: Global carbon sequestration in tidal, saline wetland soils, Glob. Biogeochem. Cycles, 17, 1111, https://doi.org/10.1029/2002GB001917, 2003.
Clarke, P. J. and Jacoby, C. A.: Biomass and above-ground productivity of salt-marsh plants in South-eastern Australia, Aust. J. Mar. Freshw. Res., 45, 1521–1528, 1994.
Drake, B. G.: Photosynthesis of salt marsh species, Aquat. Bot., 34, 167–180, https://doi.org/10.1016/0304-3770(89)90055-7, 1989.
Duarte, C. M.: Reviews and syntheses: Hidden forests, the role of vegetated coastal habitats in the ocean carbon budget, Biogeosciences, 14, 301–310, https://doi.org/10.5194/bg-14-301-2017, 2017.
Erickson, J. E., Peresta, G., Montovan, K. J., and Drake, B. G.: Direct and indirect effects of elevated atmospheric CO2 on net ecosystem production in a Chesapeake Bay tidal wetland, Glob. Change Biol., 19, 3368–3378, 2013.
Fagherazzi, S., Wiberg, P. L., Temmerman, S., Struyf, E., Zhao, Y., and Raymond, P. A.: Fluxes of water, sediments, and biogeochemical compounds in salt marshes, Ecol. Process., 2, 3, https://doi.org/10.1186/2192-1709-2-3, 2013.
Feagin, R. A., Forbrich, I., Huff, T. P., Barr, J. G., Ruiz-Plancarte, J., Fuentes, J. D., Najjar, R. G., Vargas, R., Vázquez-Lule, A., Windham-Myers, L., Kroeger, K. D., Ward, E. J., Moore, G. W., Leclerc, M., Krauss, K. W., Stagg, C. L., Alber, M., Knox, S. H., Schäfer, K. V. R., Bianchi, T. S., Hutchings, J. A., Nahrawi, H., Noormets, A., Mitra, B., Jaimes, A., Hinson, A. L., Bergamaschi, B., King, J. S., and Miao, G.: Tidal wetland gross primary production across the continental United States, 2000–2019, Glob. Biogeochem. Cycles, 34, e2019GB006349, https://doi.org/10.1029/2019GB006349, 2020.
Feher, L. C., Osland, M. J., Griffith, K. T., Grace, J. B., Howard, R. J., Stagg, C. L., Enwright, N. M., Krauss, K. W., Gabler, C. A., Day, R. H., and Rogers, K.: Linear and nonlinear effects of temperature and precipitation on ecosystem properties in tidal saline wetlands, Ecosphere, 8, e01956, https://doi.org/10.1002/ecs2.1956, 2017.
Gedan, K. B., Silliman, B. R., and Bertness, M. D.: Centuries of human-driven change in salt marsh ecosystems, Annu. Rev. Mar. Sci., 1, 117–141, https://doi.org/10.1146/annurev.marine.010908.163930, 2009.
Ghosh, S. and Mishra, D. R.: Analyzing the long-term phenological trends of salt marsh ecosystem across coastal Louisiana, Remote Sens., 9, 1340, https://doi.org/10.3390/rs9121340, 2017.
Giurgevich, J. R. and Dunn, E. L.: A comparative analysis of the CO2 and water vapor responses of two Spartina species from Georgia coastal marshes, Estuar. Coast. Shelf Sci., 12, 561–568, https://doi.org/10.1016/S0302-3524(81)80082-5, 1981.
Hilker, T., Hall, F. G., Coops, N. C., Lyapustin, A., Wang, Y., Nesic, Z., Grant, N., Black, T. A., Wulder, M. A., Kljun, N., Hopkinson, C., and Chasmer, L.: Remote sensing of photosynthetic light-use efficiency across two forested biomes: Spatial scaling, Remote Sens. Environ., 114, 2863–2874, https://doi.org/10.1016/j.rse.2010.07.004, 2010.
Hill, A. C. and Vargas, R.: Methane and carbon dioxide fluxes in a temperate tidal salt marsh: comparisons between plot and ecosystem measurements, J. Geophys. Res.-Biogeo., 127, e2022JG006943, https://doi.org/10.1029/2022JG006943, 2022.
Howe, A. J., Rodríguez, J. F., Spencer, J., MacFarlane, G. R., and Saintilan, N.: Response of estuarine wetlands to reinstatement of tidal flows, Mar. Freshw. Res., 61, 702–713, 2010.
Hughes, C. E., Kalma, J. D., Binning, P., Willgoose, G. R., and Vertzonis, M.: Estimating evapotranspiration for a temperate salt marsh, Newcastle, Australia, Hydrol. Process., 15, 957–975, https://doi.org/10.1002/hyp.189, 2001.
Huxham, M., Whitlock, D., Githaiga, M., and Dencer-Brown, A.: Carbon in the coastal seascape: how interactions between mangrove forests, seagrass meadows and tidal marshes influence carbon storage, Curr. For. Rep., 4, 101–110, https://doi.org/10.1007/s40725-018-0077-4, 2018.
Kathilankal, J. C., Mozdzer, T. J., Fuentes, J. D., D'Odorico, P., McGlathery, K. J., and Zieman, J. C.: Tidal influences on carbon assimilation by a salt marsh, Environ. Res. Lett., 3, 044010, https://doi.org/10.1088/1748-9326/3/4/044010, 2008.
Kljun, N., Calanca, P., Rotach, M. W., and Schmid, H. P.: A simple two-dimensional parameterisation for Flux Footprint Prediction (FFP), Geosci. Model Dev., 8, 3695–3713, https://doi.org/10.5194/gmd-8-3695-2015, 2015.
Krauss, K. W., Lovelock, C. E., Chen, L., Berger, U., Ball, M. C., Reef, R., Peters, R., Bowen, H., Vovides, A. G., Ward, E. J., Wimmler, M., Carr, J., Bunting, P., and Duberstein, J. A.: Mangroves provide blue carbon ecological value at a low freshwater cost, Sci. Rep., 12, 17636, https://doi.org/10.1038/s41598-022-21514-8, 2022.
Lloyd, J. and Taylor, J. A.: On the temperature dependence of soil respiration, Funct. Ecol., 8, 315–323, https://doi.org/10.2307/2389824, 1994.
Lu, W., Xiao, J., Liu, F., Zhang, Y., Liu, C., and Lin, G.: Contrasting ecosystem CO2 fluxes of inland and coastal wetlands: a meta-analysis of eddy covariance data, Glob. Change Biol., 23, 1180–1198, https://doi.org/10.1111/gcb.13424, 2017.
Mayen, J., Polsenaere, P., Lamaud, É., Arnaud, M., Kostyrka, P., Bonnefond, J.-M., Geairon, P., Gernigon, J., Chassagne, R., Lacoue-Labarthe, T., Regaudie de Gioux, A., and Souchu, P.: Atmospheric CO2 exchanges measured by eddy covariance over a temperate salt marsh and influence of environmental controlling factors, Biogeosciences, 21, 993–1016, https://doi.org/10.5194/bg-21-993-2024, 2024.
McLeod, E., Chmura, G. L., Bouillon, S., Salm, R., Björk, M., Duarte, C. M., Lovelock, C. E., Schlesinger, W. H., and Silliman, B. R.: A blueprint for blue carbon: toward an improved understanding of the role of vegetated coastal habitats in sequestering CO2, Front. Ecol. Environ., 9, 552–560, https://doi.org/10.1890/110004, 2011.
Mcowen, C. J., Weatherdon, L. V., Bochove, J.-W. V., Sullivan, E., Blyth, S., Zockler, C., Stanwell-Smith, D., Kingston, N., Martin, C. S., Spalding, M., and Fletcher, S.: A global map of saltmarshes, Biodivers. Data J., 5, e11764, https://doi.org/10.3897/BDJ.5.e11764, 2017.
McVicar, T., Vleeshouwer, J., Van Niel, T., Guerschman, J., and Peña-Arancibia, J. L.: Actual Evapotranspiration for Australia using CMRSET algorithm, Version 1.0, Terrestrial Ecosystem Research Network [data set], https://doi.org/10.25901/gg27-ck96, 2022.
Mitsch, W. J. and Gosselink, J. G.: The value of wetlands: importance of scale and landscape setting, Ecol. Econ., 35, 25–33, https://doi.org/10.1016/S0921-8009(00)00165-8, 2000.
Moffett, K. B., Wolf, A., Berry, J. A., and Gorelick, S. M.: Salt marsh–atmosphere exchange of energy, water vapor, and carbon dioxide: Effects of tidal flooding and biophysical controls, Water Resour. Res., 46, W10525, https://doi.org/10.1029/2009WR009041, 2010.
Nahrawi, H., Leclerc, M. Y., Pennings, S., Zhang, G., Singh, N., and Pahari, R.: Impact of tidal inundation on the net ecosystem exchange in daytime conditions in a salt marsh, Agric. For. Meteorol., 294, 108133, https://doi.org/10.1016/j.agrformet.2020.108133, 2020.
Navarro, A., Young, M., Macreadie, P. I., Nicholson, E., and Ierodiaconou, D.: Mangrove and saltmarsh distribution mapping and land cover change assessment for south-eastern Australia from 1991 to 2015, Remote Sens., 13, 1450, https://doi.org/10.3390/rs13081450, 2021.
Osborne, C. P. and Freckleton, R. P.: Ecological selection pressures for C4 photosynthesis in the grasses, P. Roy. Soc. B, 276, 1753–1760, https://doi.org/10.1098/rspb.2008.1762, 2009.
Otani, S. and Endo, T.: CO2 flux in tidal flats and salt marshes, Blue Carbon Shallow Coast, Ecosyst. Carbon Dyn. Policy Implement., 223–250, 2019.
Owers, C. J., Rogers, K. and Woodroffe, C. D.: Spatial variation of above-ground carbon storage in temperate coastal wetlands, Estuar. Coast. Shelf Sci., 210, 55–67, https://doi.org/10.1016/j.ecss.2018.06.002, 2018.
R Core Team: R: A Language Environment for Statistical Computing, Vienna, Austria, https://www.R-project.org/ (last access: 12 December 2024), 2024.
Reef, R.: Eddy Covariance flux averages from French Island, Figshare [data set], https://doi.org/10.26180/26027005.v1, 2024.
Reents, S., Möller, I., Evans, B. R., Schoutens, K., Jensen, K., Paul, M., Bouma, T. J., Temmerman, S., Lustig, J., Kudella, M., and Nolte, S.: Species-specific and seasonal differences in the resistance of salt-marsh vegetation to wave impact, Front. Mar. Sci., 9, 898080, https://doi.org/10.3389/fmars.2022.898080, 2022.
Rosentreter, J. A., Laruelle, G. G., Bange, H. W., Bianchi, T. S., Busecke, J. J. M., Cai, W. J., Eyre, B. D., Forbich, I., Kwon, E. Y., Maavara, T., Moosdorf, N., Najjar, R. G, Sarma, V. V. S. S., Van Dam, B. and Regnier, P.: Coastal vegetation and estuaries are collectively a greenhouse gas sink, Nat. Clim. Chang., 13, 579–587, https://doi.org/10.1038/s41558-023-01682-9, 2023.
Schäfer, K. V. R., Duman, T., Tomasicchio, K., Tripathee, R., and Sturtevant, C.: Carbon dioxide fluxes of temperate urban wetlands with different restoration history, Agric. For. Meteorol., 275, 223–232, https://doi.org/10.1016/j.agrformet.2019.05.026, 2019.
Seyfferth, A. L., Bothfeld, F., Vargas, R., Stuckey, J. W., Wang, J., Kearns, K., Michael, H. A., Guimond, J., Yu, X., and Sparks, D. L.: Spatial and temporal heterogeneity of geochemical controls on carbon cycling in a tidal salt marsh, Geochim. Cosmochim. Ac., 282, 1–18, 2020.
Shepard, C. C., Crain, C. M., and Beck, M. W.: The protective role of coastal marshes: a systematic review and meta-analysis, PLoS ONE, 6, e27374, https://doi.org/10.1371/journal.pone.0027374, 2011.
Smith, J. A. M., Regan, K., Cooper, N. W., Johnson, L., Olson, E., Green, A., Tash, J., Evers, D. C., and Marra, P. P.: A green wave of saltmarsh productivity predicts the timing of the annual cycle in a long-distance migratory shorebird, Sci. Rep., 10, 20658, https://doi.org/10.1038/s41598-020-77784-7, 2020.
Vázquez-Lule, A. and Vargas, R.: Biophysical drivers of net ecosystem and methane exchange across phenological phases in a tidal salt marsh, Agric. For. Meteorol., 300, 108309, https://doi.org/10.1016/j.agrformet.2020.108309, 2021.
Wang, Z. A., Kroeger, K. D., Ganju, N. K., Gonneea, M. E., and Chu, S. N.: Intertidal salt marshes as an important source of inorganic carbon to the coastal ocean, Limnol. Oceanogr., 61, 1916–1931, https://doi.org/10.1002/lno.10347, 2016.
Ward, N. D., Megonigal, J. P., Bond-Lamberty, B., Bailey, V. L., Butman, D., Canuel, E. A., Diefenderfer, H., Ganju, N. K., Goñi, M. A., and Graham, E. B.: Representing the function and sensitivity of coastal interfaces in Earth system models, Nat. Commun., 11, 2458, https://doi.org/10.1038/s41467-020-16236-2, 2020.
Wei, S., Han, G., Jia, X., Song, W., Chu, X., He, W., Xia, J., and Wu, H.: Tidal effects on ecosystem CO2 exchange at multiple timescales in a salt marsh in the Yellow River Delta, Estuar. Coast. Shelf Sci., 238, 106727, https://doi.org/10.1016/j.ecss.2020.106727, 2020.
Whitfield, A. K.: The role of seagrass meadows, mangrove forests, salt marshes and reed beds as nursery areas and food sources for fishes in estuaries, Rev. Fish Biol. Fish., 27, 75–110, https://doi.org/10.1007/s11160-016-9454-x, 2017.
Xiao, J., Sun, G., Chen, J., Chen, H., Chen, S., Dong, G., Gao, S., Guo, H., Guo, J., Han, S., Kato, T., Li, Y., Lin, G., Lu, W., Ma, M., McNulty, S., Shao, C., Wang, X., Xie, X., Zhang, X., Zhang, Z., Zhao, B., Zhou, G., and Zhou, J.: Carbon fluxes, evapotranspiration, and water use efficiency of terrestrial ecosystems in China, Agric. For. Meteorol., 182–183, 76–90, https://doi.org/10.1016/j.agrformet.2013.08.007, 2013.