the Creative Commons Attribution 4.0 License.
the Creative Commons Attribution 4.0 License.
 | 10 Mar 2025
Earth observation reveals reduced winter wheat growth and the importance of plant available water during drought
Lukas Valentin Graf
Tino Colombi
Juliane Hirte
Thomas Keller
Helge Aasen
Drought poses increasing challenges to global food production. Knowledge about the influence of drought on crop development and the role of soil properties for crop drought severity is important in drought risk analysis and for mitigating drought impacts at the landscape level. Here, we tested if satellite images from Sentinel-2 could be used to assess the impacts of drought on crop development and the influence of soil properties on crop drought responses at the landscape scale and what the responses were. As a case study, we assessed winter wheat growth on 13 fields belonging to commercial farmers in southern Sweden in a dry year (2018) and in a year with normal weather conditions (2021). To track crop growth, the green leaf area index (GLAI) was estimated from satellite imagery using a radiative transfer model. Proxies for winter wheat growth rate, peak GLAI, and the timing of peak GLAI were derived from the GLAI development at the single-field level. We then compared the crop growth proxies between the 2 years and related the year-to-year differences between fields to measured soil properties. We found lower estimated growth rates, lower peak GLAI, and earlier peak GLAI in the dry year compared to the year with normal weather conditions. A higher peak GLAI in the dry year was related to a higher growth rate, and this was not shown in the year with normal precipitation. Differences in crop development between years were large for some fields but small for other fields, suggesting that soil properties play a role in crop response to drought. We found that fields with a higher plant available water capacity had a higher growth rate in the dry year and smaller relative differences in growth rate between the 2 years. This shows the importance of soils in mitigating drought conditions, which will likely become more relevant in an increasingly drier climate. Our case study demonstrates that satellite-derived crop growth proxies can identify crop responses to drought events and that satellite imagery can be used to discover impacts of soil properties on crop development at scales relevant to commercial farming.
- Article
(1472 KB) - Full-text XML
-
Supplement
(561 KB) - BibTeX
- EndNote


Extreme weather events such as droughts have become more frequent and severe in recent years due to climate change, posing challenges to global food and feed production (IPCC 2022). Drought is one of the main climatic constraints limiting crop growth and crop productivity (Fahad et al., 2017; Matiu et al., 2017; Ru et al., 2023). Water is crucial for plant growth, and plants can respond to water limitation through different mechanisms, such as reducing water losses through transpiration by closing their stomata (Huang et al., 2020) or by reducing leaf area (Wasaya et al., 2023). In turn, the photosynthesis rate and thus carbon acquisition decrease. Plants may also accelerate their development to complete the plant life cycle before the occurrence of a severe water deficit (Abid et al., 2018; Seleiman et al., 2021). The impact of drought on crops is complex and depends on several factors, including the plant species and variety; the developmental stage of plants; the timing, duration, and severity of the drought (Gray and Brady 2016); and the properties of the soil (Bodner et al., 2015).
The capacity of soil to sustain plant growth and crop productivity is affected by biological, chemical, and physical soil properties, which collectively determine the soil conditions for plant growth (Stockdale et al., 2002). Soils that allow water to infiltrate and can store sufficient amounts of water to sustain plant growth can mitigate drought conditions (Rockström, 2003; Bodner et al., 2015). Higher soil moisture may also benefit nutrient uptake during drought, while a water deficit could lead to a lack of nutrients in crops, as nutrients are mainly transported into plants through water uptake (He and Dijkstra, 2014). Plant roots must also be able to penetrate the soil to access water and nutrient resources, where a high penetration resistance, which increases under dry conditions, could impede root growth and resource accessibility (Bengough et al., 2011; Colombi et al., 2018). Recent research also provides evidence that certain rhizosphere microbiomes might enhance plant growth during dry conditions (Rolli et al., 2015; Rubin et al., 2017; de Vries et al., 2020). Therefore, soil properties are of high importance to sustain crop growth during drought.
Plant growth dynamics can be quantified with ecophysiological properties such as the green leaf area index (GLAI), which is the ratio of photosynthetically active leaf area to ground area (Watson, 1947). Previous studies using field experiments demonstrated that the influence of soil properties and soil-borne stress on plant growth can be detected using GLAI. For example, positive relationships between GLAI and soil water content have been found (Chen et al., 2021), and GLAI at the heading stage of spring barley has been shown to decrease with a high degree of soil compaction (Lipiec et al., 1991). The growth rate estimated from GLAI has also been shown to be related to soil organic carbon and nitrogen contents (Hirooka et al., 2017). In addition, the GLAI may vary by crop species, scales, and environmental factors (Kang et al., 2002; Kang et al., 2016; Lawal et al., 2022), and there is still limited information about how soil properties affect crop GLAI development under extreme weather conditions, at scales relevant to commercial agriculture (i.e. at the landscape scale). Pot and field plot experiments are needed to understand single factors, but conducting research at larger scales is important to capture the heterogeneity of environmental factors in the landscape.
Monitoring crop growth at the landscape scale can be done with satellite remote sensing, for example, using the twin constellation of Sentinel-2A and 2B. The Sentinel-2 multispectral sensors have been shown to be suitable for estimating GLAI for different crop species (Clevers et al., 2017; Revill et al., 2019; Dong et al., 2020; Ali et al., 2021). One promising way to interpret satellite data for ecophysiological traits is the use of radiative transfer models that describe the relationship between leaf and canopy traits and spectral properties of plants using physical principles (Jacquemoud et al., 1996; Myneni et al., 1997; Verhoef, 1998). Thus, in contrast to the widely used vegetation indices, there is no need to establish empirical relationships between vegetation indices and crop traits (Atzberger et al., 2011). Those empirical relationships are usually not transferable in space and time and are hence not suitable for studies at the landscape scale. In addition, vegetation indices such as the widely used normalised difference vegetation index (NDVI) saturate at low biomass levels (Myneni and Williams, 1994; Prabhakara et al., 2015), which is undesirable for a reliable and robust quantification of plant growth. The combination of satellite images and radiative transfer models allows the estimation of GLAI on a large scale.
The use of satellite-derived GLAI for crop growth characterisation and productivity has become common in recent years (Punalekar et al., 2018; Peng et al., 2019; Dong et al., 2020; He et al., 2021; Graf et al., 2023), and many remote-sensing studies motivate their work by the potential of remote sensing to detect crop stress. Still, studies that (a) demonstrate how extreme weather, such as drought, affects GLAI development and (b) provide the link to environmental variables, such as soil properties, to explain the observed differences remain scarce. Investigating if satellite images can be used to identify crop stress responses at the landscape scale, and if the importance of soil properties can be identified under drought stress at agricultural fields, could motivate the use of satellite images in crop monitoring at farm fields. In the present study, the aims were to
- i.
analyse winter wheat development in farm fields within a region in southern Sweden by quantifying GLAI based on Sentinel-2 data,
- ii.
investigate if the impact of drought on winter wheat growth can be identified using satellite images at the farm fields by comparing the GLAI development between a dry year (year 2018) and a year with normal weather conditions (year 2021), and
- iii.
examine if differences in soil properties relate to differences between GLAI development across fields and between the 2 years.
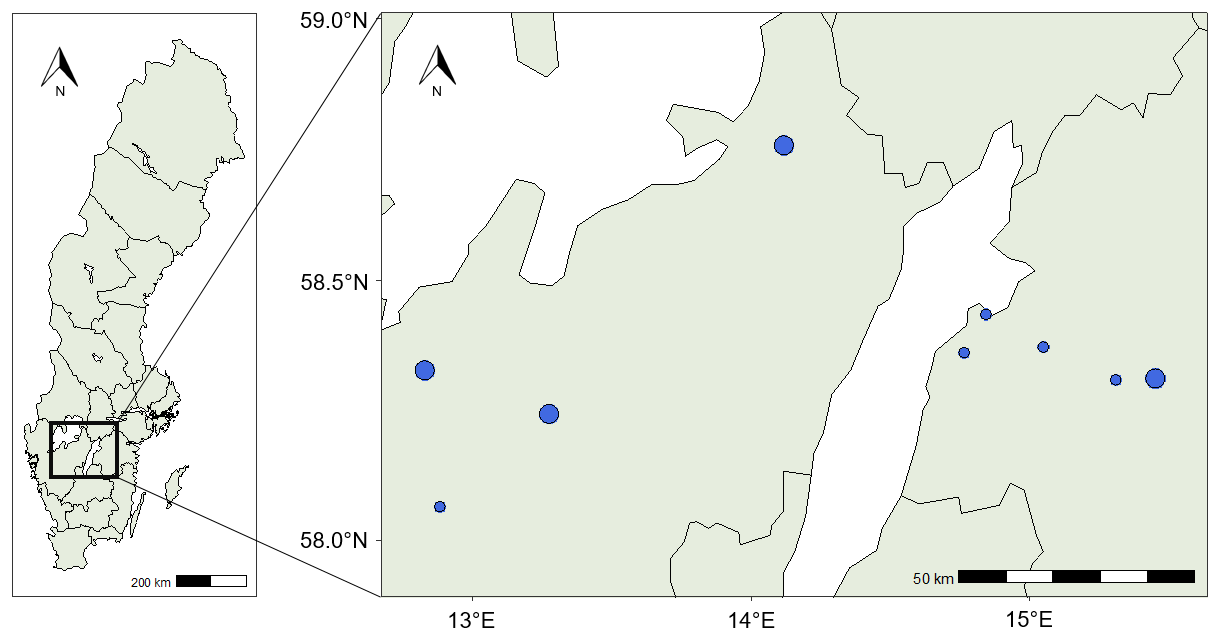
Figure 1A map of Sweden with county borders showing the location of the study area (left) and a map displaying the locations of the 13 fields (right). A small blue circle indicates the location of one field, and a larger blue circle indicates two fields close to each other.
1.1 Materials and methods
1.2 Study area and meteorological data
The study area was located in the south of Sweden at a latitude of approximately 58.5°, spanning 160 km from west to east (Fig. 1), and is characterised by a humid continental climate (Peel et al., 2007). Winter wheat is the major crop cultivated in Sweden in general and in the study area (Sjulgård et al., 2022). We included 13 fields in this study, belonging to commercial farmers. The fields were cultivated with winter wheat (Triticum aestivum L.) in both 2018 and 2021, and detailed soil data were available for all fields. All fields were managed conventionally, and they were not irrigated. The farmers manage their fields according to best practices, but detailed information about crop and soil management practices was only available from some of the farmers. We therefore minimised the variation in management practises between years by selecting fields that were managed by the same farmer in 2018 and 2021 and with the same crop cultivated in both years.
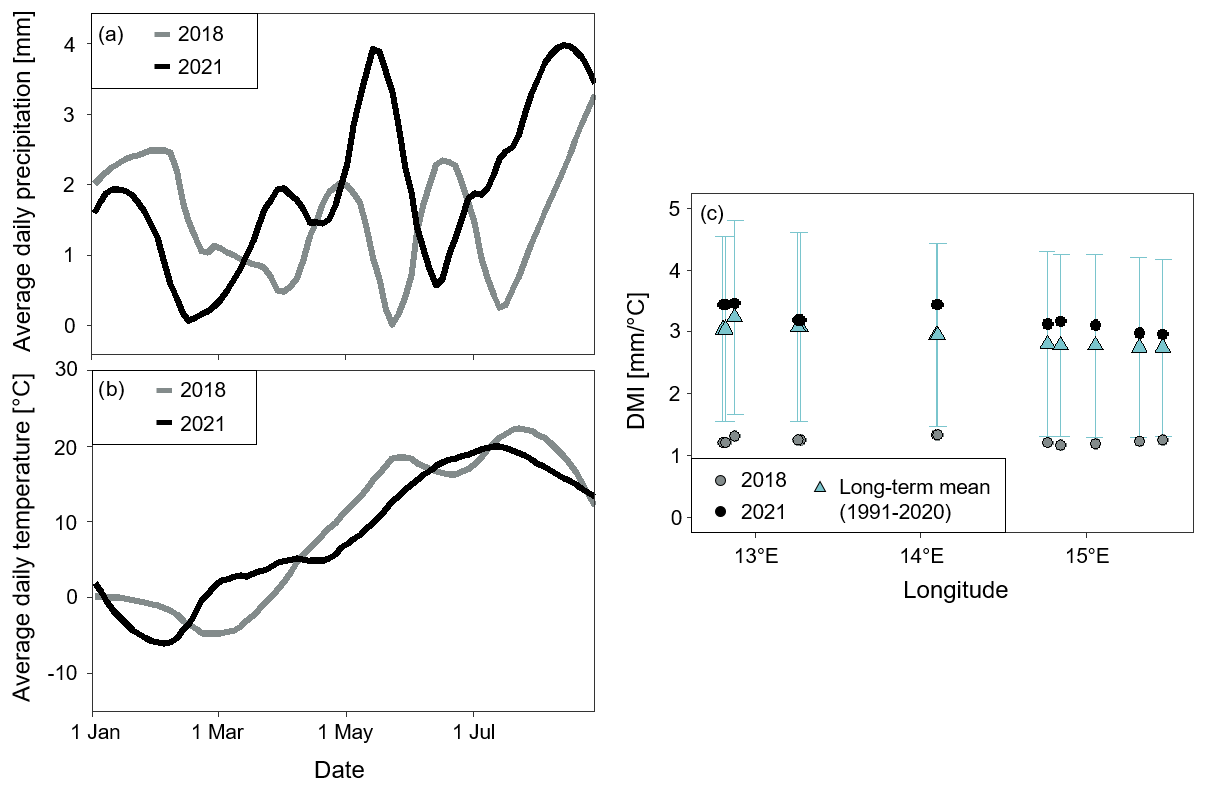
Figure 2Weather conditions in 2018 and 2021 at the locations of the 13 fields. Locally estimated scatterplot smoothing curves plotting the average (a) daily temperature and (b) precipitation against calendar date for the 13 fields in 2018 and 2021. (c) The average De Martonne aridity index (DMI) during the months May to July in 2018 and 2021 and the long-term mean of May to July between 1991 and 2020 with error bars indicating the standard deviation.
The centroid coordinates of the fields were used to obtain daily temperature and precipitation data for each field. Meteorological data were obtained from the PTHBV database, available from the Swedish Meteorological and Hydrological Institute (SMHI). Data include gridded and interpolated daily mean temperature and precipitation at a resolution of 4 km by 4 km (SMHI, 2023). The interpolation is based on 700 meteorological stations across Sweden and considers orographic effects (Berg et al., 2015). Differences in weather conditions between fields and years were assessed by the De Martonne aridity index (DMI) (De Martonne, 1926), defined as
where Pm is the monthly total precipitation (mm) and Tm is the monthly average temperature (°C). A higher DMI indicates wetter conditions, while a lower DMI indicates drier conditions. Weather conditions during the main winter wheat growing period (May to July) in 2018 and 2021 were contrasting: 2018 was unusually dry, while 2021 was “normal” (Fig. 2). The lack of precipitation has been referred to as the main reason for the large yield losses observed in 2018 (Bakke et al., 2020, Beillouin et al., 2020). In 2018, May was already unusually warm and dry in Sweden (SMHI, 2018). Between May and July, the DMI was on average 1.2 mm °C−1 (SD = 0.06) per month in 2018, which was drier than the long-term average of 2.9 mm °C−1 (SD = 0.19) for the same period. In 2021, the DMI was close to the long-term average with a monthly mean of 3.2 mm °C−1 (SD = 0.16) in May to July. In both years, DMI was similar across fields.
1.3 GLAI derived from satellite data
The twin constellations of the Sentinel-2A and B satellites have a revisit time of 2 d in the study area. The downloading and processing of Sentinel-2 data were performed using the open-source Python Earth Observation Data Analysis Library (EOdal; Graf et al., 2022). The Sentinel-2 scenes were obtained for the years 2018 and 2021 from Microsoft Planetary Computer. 20 m and 10 m bands were obtained, and the Sentinel-2 scenes and 20 m bands were resampled to 10 m using nearest-neighbour interpolation to generate equal spatial resolution. The Sentinel-2 scenes were cropped to only retain pixels within the 13 fields based on a shapefile containing the field boundaries. From the resampled scene classification layer, only pixels from the scene classification layer class 4 (vegetation) and class 5 (bare soil) were kept to filter out pixels containing clouds, snow, shadow, and dark areas. Further filtering was performed to remove dates with a cloud cover of ≥ 10 % on a field-per-field basis.
GLAI was derived from the radiative transfer model PROSAIL, following the approach described in Graf et al. (2023). A lookup table consisting of 50 000 spectra was generated by running PROSAIL in forward mode for each Sentinel-2 scene. We randomly generated combinations of leaf and canopy parameters according to a uniform or Gaussian distribution (Table S2 in the Supplement; Graf et al., 2023; Wocher et al., 2020; Danner et al., 2021). View and illumination geometry were set to scene-specific values extracted from Sentinel-2 scene metadata. Building on the workflow of Graf et al. (2023), known empirical relationships between GLAI and chlorophyll a and b and between GLAI and the carotenoid content of leaves were used to increase the physiological plausibility of the input parameter combinations. For GLAI retrieval, we compared the Sentinel-2 pixel spectra with the PROSAIL simulated spectra using the mean absolute error as a cost function. We then used the median of the 5000 (10 %) best matching simulated spectra in terms of the smallest mean absolute error to derive a GLAI value per Sentinel-2 pixel.
For each Sentinel-2 scene, an average value of GLAI was calculated per field. A smoothed curve was fitted to the GLAI time series by the locally estimated scatterplot smoothing method with a span of 0.3 (Fig. 3). The smoothed curve was also used to identify and remove outliers that were missed by the scene classification layer and the cloud filtering (Fig. S1 in the Supplement).
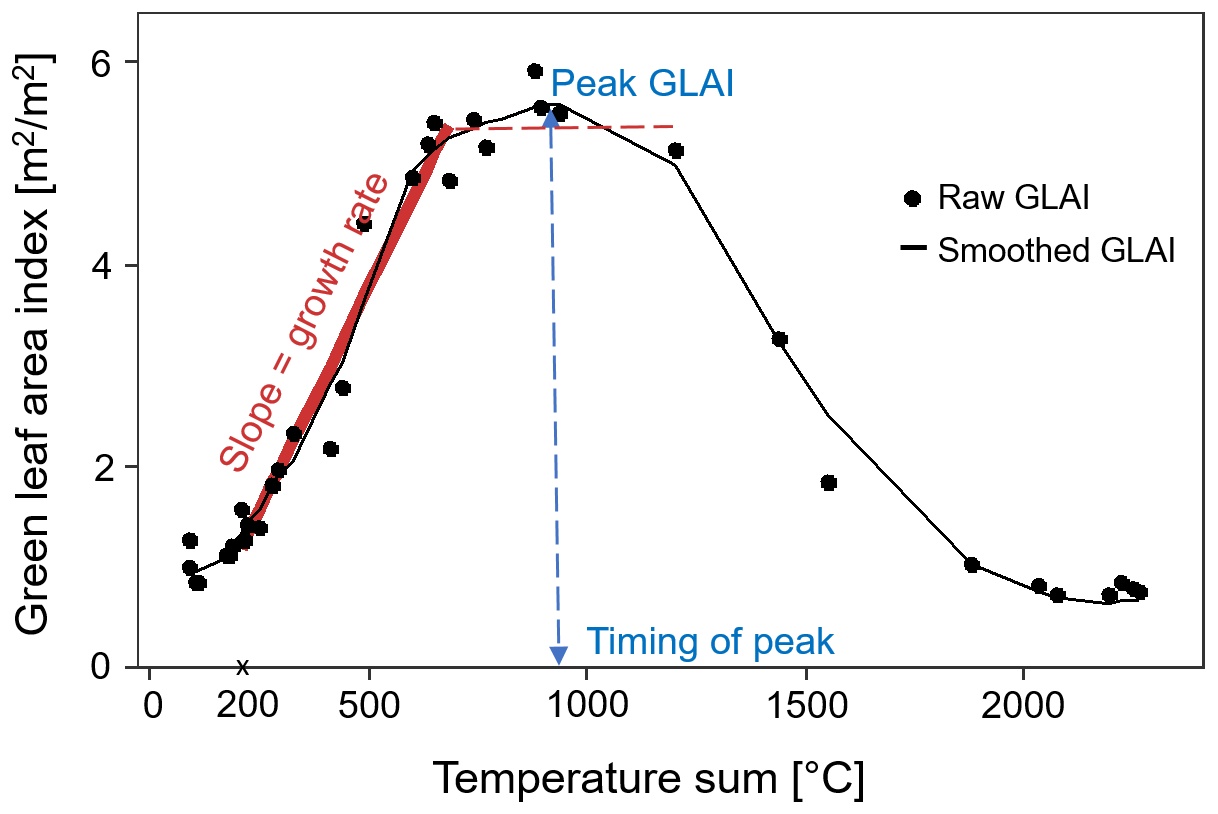
Figure 3Example from one of the fields showing the green leaf area index (GLAI) temporal development curve. We obtained proxies for the growth rate from the slope between a temperature sum of 200 °C until the start of the plateau (dashed red line), the peak GLAI from the maximum GLAI, and the timing of peak GLAI from the temperature sum at the peak GLAI. The raw GLAI values are shown by black dots, and the smoothed GLAI is shown by the black curve.
1.4 Crop growth curve parametrisation
The air temperature sum (Tsum) at each field was assessed by adding up the daily mean temperatures exceeding a threshold value of 0 °C, where growth for winter wheat starts (Porter and Gawith, 1999), from 1 January, following
where Ti is the daily mean temperature and j is the number of days. From the GLAI development curve, characteristic properties were calculated to estimate crop growth rate, green biomass, and timing of heading stage for each field and year (Fig. 3). GLAI increases early in the season due to leaf production in the vegetative growth phase (Bhattacharya, 2019). Growth rate during the vegetative growth phase was estimated from the slope of a linear plateau curve with an endpoint at the start of the upper plateau. The linear plateau model was fitted to the GLAI values with a start at a temperature sum of 200 °C (corresponding to the end of April) when GLAI started to increase around the beginning of stem elongation (Chen et al., 2009). The GLAI development curve is typically bell-shaped, with the peak GLAI observed around the heading stage for winter wheat (Feng et al., 2019). The timing of the peak GLAI was assessed from the corresponding temperature sum (Fig. 3). The peak GLAI indicates the maximum green biomass (Lambert et al., 2018; Skakun et al., 2019) and was assessed from the smoothed GLAI curve.
1.5 Soil sampling and analyses
Soil sampling was conducted in June and at the beginning of July 2021. Loose soil samples and undisturbed soil cores were collected from the topsoil at five locations in each field. Sampling locations within each field were arranged in a quincunx, with one point in the middle of the field and the others at least a few metres from the field borders. Loose soil samples were taken with a shovel from 0–20 cm depth. The five samples taken in each field were pooled into a plastic bag, and the resulting composite sample was air-dried. Five undisturbed soil cores (5 cm in height, 7.2 cm inner diameter) were collected at a depth of 10 cm in each field. The soil core samples were wrapped airtight and stored at 4 °C until further processing.
Soil organic matter content was determined by loss of ignition from the loose soil samples. Cation exchange capacity was analysed using an inductively coupled plasma optical emission spectrometer (ICP-OES) to obtain the base cations in the soil samples. The base cations and acidity titration were used to calculate the cation exchange capacity at pH 7. Soil water content at the permanent wilting point (−1500 kPa) was determined with pressure plate extractors. Soil water content at field capacity was assessed by equilibrating the soil cores to −10 kPa (i.e. field capacity; Krueger and Ochsner, 2024) on ceramic plates (ecoTech, Bonn). Plant available water capacity was obtained by calculating the difference in gravimetric soil water content between field capacity and the permanent wilting point. Dry soil bulk density was determined on the undisturbed soil core samples by drying the samples at 105 °C for 48 h. Soil texture, including clay (< 0.002 mm) content, was determined from the loose soil samples by sedimentation (“pipette” method).
1.6 Statistical analyses
GLAI development responses to drought were analysed by comparing differences in crop growth proxies (i.e. growth rate, peak GLAI, and the timing of peak) between the dry year (2018) and the year with normal weather conditions (2021). A two-tailed t-test was applied to determine whether there was a significant difference in growth rate, peak GLAI, and the timing of the peak GLAI between the 2 years. Spearman correlation was used to assess relationships between soil properties. Multiple linear regression was used to assess relationships between the crop growth proxies while accounting for the average monthly DMI (May–July) of the corresponding year. To relate soil properties to differences in growth rate, peak GLAI, and the timing of the peak GLAI between years, the relative difference in crop growth proxies (ΔGP) between the years 2018 and 2021 was calculated as
where GP is a crop growth proxy (i.e, growth rate, peak GLAI, or the timing of the peak GLAI) for the years 2018 and 2021.
A variance decomposition method proposed by Zuber and Strimmer (2011), called Correlation-Adjusted coRelation (CAR) scores, was used to determine the relative importance of the soil properties for the growth rate, the peak GLAI, and the timing of the peak GLAI in each year (i.e. for 2021 and 2018) and for the relative difference in the crop growth proxies between the years. CAR scores provide a criterion for variable ranking in linear regression based on the Mahalanobis decorrelation of covariates (Zuber and Strimmer 2011). The direction of the relationships and p-values was obtained from univariate linear regressions between the crop growth proxies and the soil properties for each year and for the relative difference in crop growth proxies between 2021 and 2018, respectively. Statistical analyses were carried out in R version 4.2.1 (R Core Team, 2022), CAR scores were calculated with the R package “relaimpo” (Groemping and Lehrkamp, 2006), and the linear mixed models were calculated using the “lme4” package (Bates et al., 2015).
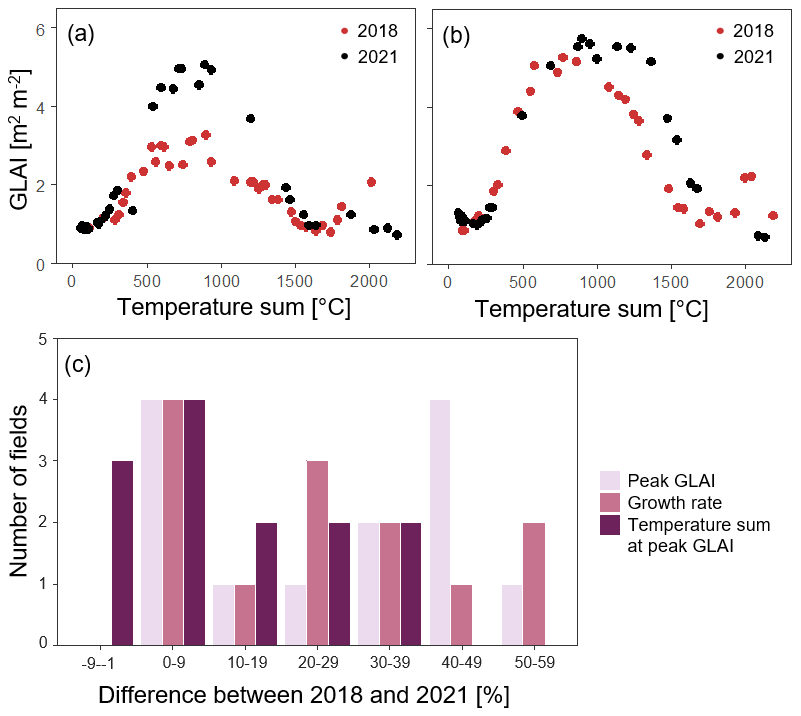
Figure 4Examples of temporal evolution of GLAI during 2018 (dry year) and 2021 (year with normal weather conditions) for two different fields with (a) a large difference between the years and (b) a small difference between the years. (c) Number of fields by the percentage difference in crop growth proxies (i.e. peak GLAI, growth rate, and temperature sum at peak GLAI) between the years 2018 (dry year) and 2021 (year with normal weather conditions).
2.1 Growth patterns across years
Differences in crop development between years varied across fields, where certain fields showed a large difference in growth rate, peak GLAI, and the timing of the peak GLAI between years, while others had only small differences (Figs. 4 and S2 in the Supplement). For growth rate and peak GLAI, four fields had an increase from 2018 to 2021 of less than 10 %, while some fields had a difference of 50 %–59 %. The difference between years in the timing of the peak GLAI was lower in comparison, with four fields having an increase < 10 % and three fields a decrease < 10 %, while the maximum difference was 30 %–39 % (Figs. 4 and S2).
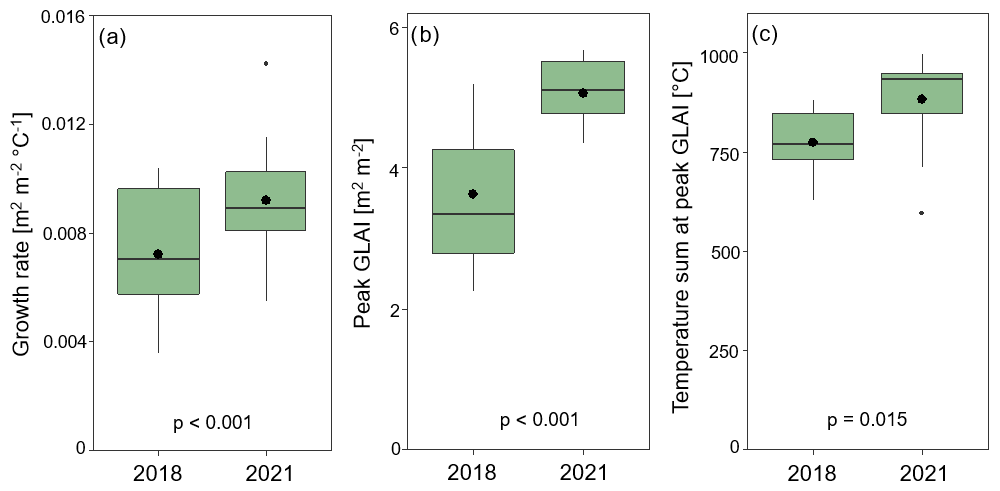
Figure 5Crop growth proxies obtained from the temporal evolution of green leaf area index (GLAI) in the dry year (2018) and the year with normal weather conditions (2021). (a) Growth rate, (b) peak GLAI, and (c) temperature sum at peak GLAI. Data show yearly average (black dots), median, upper and lower quartiles (box), and minimum and maximum values (whiskers). p-values from the t-test are displayed for the differences between the years (number of fields, n=13).
The growth rate was lower in the dry year (2018) than in the year with normal weather conditions (2021; Fig. 5), indicating reduced crop growth in response to drought. The growth rate during the reproductive period was on average 19 % lower in the dry year (2018) than in the year 2021 with close-to-normal weather conditions, and we found a significant effect of the year on growth rate (p < 0.001; Fig. 5a). The peak GLAI was in general lower during the dry year compared to the year with normal weather conditions (p < 0.001; Fig. 5c), with an average difference of 28 % between the 2 years. The timing of peak GLAI occurred significantly earlier, i.e. at a lower temperature sum, during the dry year, with the peak GLAI around a temperature sum of 775 °C in the dry year and 881 °C in the year with normal weather conditions (p = 0.015; Fig. 5d).
Relationships among the different crop growth proxies showed a positive relationship between growth rate and peak GLAI in the dry year (year 2018), while the relationship was not significant during the year with normal weather conditions. The timing of the peak GLAI had no significant relationship to growth rate or peak GLAI for either year (Table S3 in the Supplement).
2.2 Relationships between soil properties and crop development
On average across the 13 fields, plant available water capacity was 0.23 m3 m−3, bulk density was 1.5 g cm−3, cation exchange capacity was 16 cmol kg−1, soil organic matter content was 3.6 %, and clay content was 31 % (Table S1 in the Supplement). Some soil properties were related to each other, with positive correlations between soil organic matter content and cation exchange capacity and between clay content and cation exchange capacity (p < 0.05; Fig. S4 in the Supplement). Negative relationships were found between clay content and bulk density and between clay content and plant available water capacity (p < 0.05; Fig. S4).
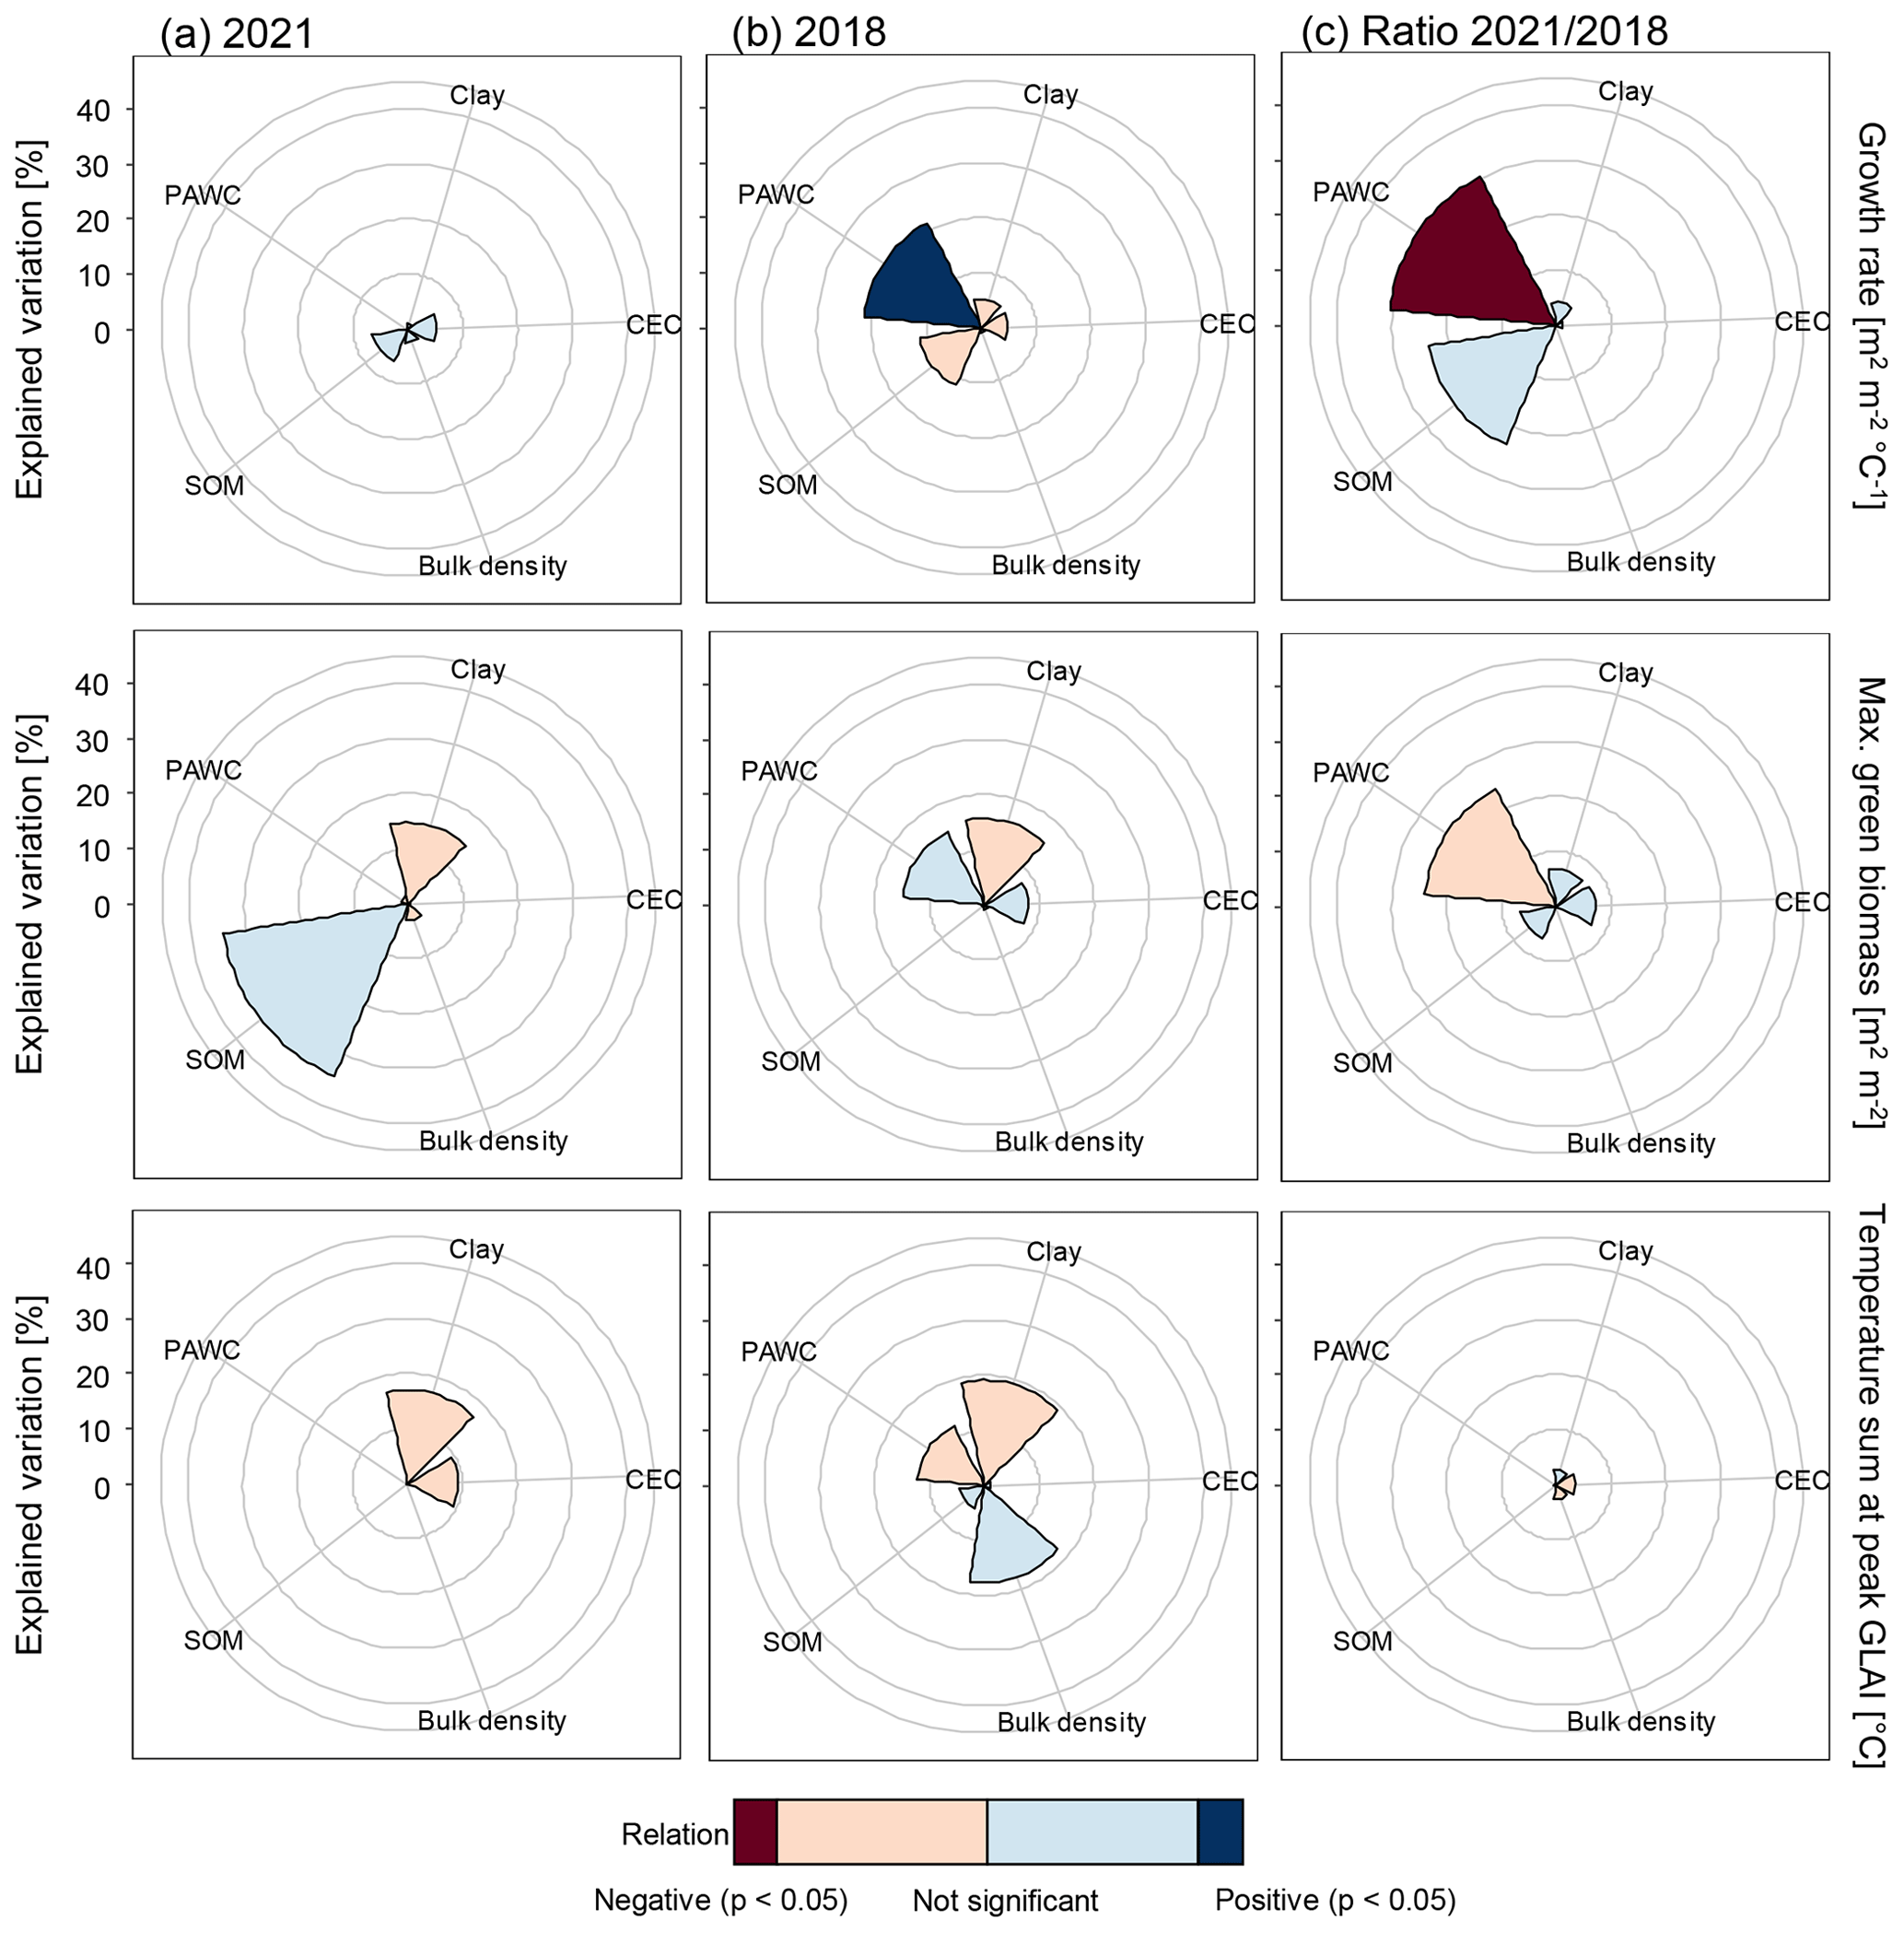
Figure 6Explained variation in growth rate, peak GLAI, and temperature sum at peak GLAI, calculated from Correlation-Adjusted coRelation (CAR) scores, by the soil properties of clay content, soil organic matter content (SOM), bulk density, cation exchange capacity (CEC), and plant available water capacity (PAWC) in (a) a year with normal weather conditions (year 2021), (b) a dry year (year 2018), and (c) the relative difference between the years 2021 and 2018. The p-values and the positive or negative relationships between each soil property and crop growth proxy were obtained from univariate linear regressions. The rings are 10 %, 20 %, 30 %, and 40 % explained variation, starting from the smallest, and the last ring is the outside border of the plot area.
Together, soil properties explained 15 %, 54 %, and 27 % of the variations across fields in growth rate, peak GLAI, and timing of peak GLAI, respectively, in the year with normal weather conditions (2021). However, none of the soil properties were significantly related to growth rate, peak GLAI, or timing of the peak GLAI in 2021 (Fig. 6a). In the dry year (2018), soil properties together explained 44 %, 40 %, and 55 % of the variation in growth rate, peak GLAI, and timing of peak GLAI, respectively. Plant available water capacity was significantly related to crop growth rate in 2018, with a positive association of increased crop growth with higher plant available water capacity (p < 0.05). In addition, plant available water capacity explained 21 % of the variation in growth rate across fields in the dry year. There were no significant relationships between the other soil properties and growth rate, peak GLAI, or timing of peak GLAI in 2018 (Fig. 6b). Plant available water capacity was the most important soil property in explaining the relative difference between the year with normal weather conditions (2021) and the dry year (2018). The relative difference in growth rate between the years was negatively related to plant available water capacity (p < 0.05), and plant available water capacity explained 30 % of the variation in the difference in growth rates between the years.
3.1 The impact of drought on crop development
In the present study, we used satellite images to assess winter wheat development in farm fields by quantifying GLAI based on Sentinel-2 data. We investigated whether the impact of drought on GLAI development and relationships between soil properties and GLAI development during drought could be identified by using satellite images. The early growing season in 2018 was exceptionally dry and warm (Fig. 2), resulting in reduced winter wheat development compared to 2021 (Fig. 5) that had close-to-long-term average weather conditions. Previous research has shown negative effects of drought on crop yield at the landscape and country scale (Zipper et al., 2016; Ray et al., 2018; Sjulgård et al., 2023), and lower growth rate and lower peak GLAI during water-limited conditions have been found in field trials in which GLAI was measured at the canopy (Meinke et al., 1997; Boedhram et al., 2001). The lower crop growth rate and the earlier GLAI peak during drought that we observed in our study demonstrate that Sentinel-2 derived estimates of crop growth proxies can be used to detect drought responses in crop development at the landscape scale.
The dry conditions early in the growing season in 2018 resulted in lower peak GLAI compared to the year with normal weather conditions (Fig. 5). Peak GLAI is a proxy of the maximum green biomass (Lambert et al., 2018; Skakun et al., 2019), and reduced wheat biomass during drought has been shown in earlier studies (Villegas et al., 2001; Zhang et al., 2018). According to Villegas et al. (2001), the decrease in biomass during drought was mainly due to a lower growth rate. Similarly, we found a positive relationship between crop growth rate and peak GLAI in the dry year but not in the year with normal weather conditions (Table S3). The positive relationship in the dry year suggests that a faster growth is important to obtain higher maximum biomass and in turn higher yield during dry conditions, and the non-significant relationship during the year with normal weather conditions suggests that growth rate is not as critical for biomass accumulation during normal weather conditions. Using farm fields, earlier research has shown that leaf area (He et al., 2020; Sun et al., 2024) and peak GLAI (Lambert et al., 2018, Yamamoto et al., 2023) can be related to crop yield. For the fields with yield data available in this study (six fields), together with additional 23 farm fields in the same region, there was a strong correlation between higher peak GLAI and higher winter wheat yield in 2021 shown in Sjulgård (2024). The peak GLAI was reached earlier, i.e. at a lower temperature sum, during the dry year. Since the peak GLAI has been associated with heading growth stage (Feng et al., 2019), this might indicate a shift in phenology during dry conditions. Some studies have shown that plants develop faster during drought to reach flowering earlier and complete the life cycle before severe water shortage occurs (Abid et al., 2018; Seleiman et al., 2021). However, we did not find a significant relationship between the timing of peak GLAI and growth rate or peak GLAI in our data, which would imply that the timing of the heading growth stage did not influence the overall crop performance (Table S3).
3.2 The influence of soil properties on crop development
We found that differences in crop development between the 2 years varied across fields. When comparing 2018 and 2021, we identified a large difference of up to 50 %–59 % in growth rate and peak GLAI for certain fields and up to 30 %–39 % in the timing of peak GLAI, while there was a smaller difference for other fields (Figs. 4 and S2). As weather conditions across all fields within a specific year were similar (Fig. 2c), the varying crop responses to drought stress among fields imply that additional factors than the weather must have had an impact on crop development. Here, we show that soil properties influenced the crop growth proxies. In 2018, a positive relationship between plant available water capacity and growth rate demonstrates the importance of sufficient soil water retention to sustain crop growth during drought (Fig. 6). Fields with lower plant available water capacity had a larger relative difference in growth rate between the dry year and the normal year. Earlier studies have shown that soil water retention is crucial for crop performance during drought (Wang et al., 2009; Huang et al., 2020). Accordingly, the performance of crops grown on soils with high plant available water capacity has been found less affected by changes in rainfall compared to crops grown on soils with low plant available water capacity (Wang et al., 2017). The relevance of plant available water capacity on crop growth during drought identified in our study demonstrates that the influence of soil properties on crop development can be detected during drought stress at the landscape scale by using Sentinel-2 derived GLAI.
Other soil properties assessed in this study were not correlated with estimates of growth rate, peak GLAI, or timing of peak GLAI in 2018, and none of the soil properties were significantly related to the crop growth proxies in 2021 (Fig. 6). Clay content only explained a small part of the variation in crop growth proxies, but it influenced other soil properties such as cation exchange capacity, bulk density, and plant available water capacity (Fig. S4). Cation exchange capacity only explained a low part of the variation in crop growth proxies. All fields were above the recommended cation exchange capacity for crop production of 10 cmol kg−1 (Table S1) (Chowdhury et al., 2021), implying that cation exchange capacity was not a limiting factor for crop development. Our findings that bulk density had no direct relationship with the crop growth proxies may seem to contradict the study of Lipiec et al. (1991), who found decreasing GLAI at the heading stage of spring barley with increasing degree of soil compaction. However, in our fields, bulk density was not critically high, with an average bulk density of 1.5 g cm−3 (Table S1). We found no relationships between crop growth rate, peak GLAI, or timing of peak GLAI and soil organic matter content. Earlier studies have shown positive effects of soil organic matter content on soil fertility (Lal, 2009; Fageria, 2012; Oldfield et al., 2019) and on crop productivity during drought (Kane et al., 2021; Mahmood et al., 2023); however, negative effects of soil organic matter content on crop yields have also been found in Sweden (Kirchmann et al., 2020).
3.3 Limitations and motivations
In our study, soil sampling was conducted in 2021 only. With soil properties changing over time, this may introduce uncertainty in the relationships between soil properties and crop development that we established for 2018. However, a number of studies have shown only small year-to-year changes in soil organic carbon content (Krauss et al., 2020), water content at field capacity (Alam et al., 2014), and bulk density (Alam et al., 2014; Alnaimy et al., 2020) within given soil management systems. The small differences between years suggests that the soil properties are probably rather similar between the years 2021 and 2018 within the same fields included in this study. In addition to soil properties and weather conditions, crop development is influenced by soil and crop management practices such as fertilisation (Agenbag and Maree, 1991; Shankar et al., 2021), tillage (Agenbag and Maree, 1991; Abagandura et al., 2017), sowing date, and crop variety selection (Ihsan et al., 2016; Minoli et al., 2022). Earlier studies have shown differences in leaf area index between farming systems, with higher leaf area index in conventional systems in comparison to organic systems (Petcu et al., 2011; Pużyńska et al., 2021). In this study, all fields selected were conventionally managed to reduce these differences. Additional information about the winter wheat varieties, sowing date, and fertilisation levels was not available from all farmers. However, winter wheat is sown within a short time window around the middle of September in the study region (Andersson, 1983; SCB 1993). A change of a few days in sowing date of winter wheat has been shown to have a limited influence on crop yield (Ding et al., 2016) and would therefore not substantially influence our findings. According to Stenberg et al. (2005), the average inorganic fertiliser used for winter wheat cultivation is 160 N kg ha−1 (SD = 19) in Östergötland and 170 N kg ha−1 (SD = 27) in Västra Götaland, respectively, based on extensive data collection between 2000 and 2003. This shows that the fertilisation levels between the two counties that covered our study region are similar and that the variation between years is generally low.
The varying soil and crop management practices among fields and the different availability of baseline data (e.g. soil management and input history) are some of the challenges with on-farm research, but such studies are essential to evaluate the use of satellite data in the context of commercial farms (Doole et al., 2023). Our results show that satellite-derived GLAI can be used to identify environmental stress response on plants, and this could help farmers to monitor crops and to identify when stresses occur. The influence of soil properties on crop response during drought demonstrates the importance of accounting for soil properties when evaluating the impact of drought on crops.
The impact of drought on winter wheat development was shown by comparing Sentinel-2-derived GLAI development during a dry year (2018) and a year with normal weather conditions (2021) across 13 fields belonging to commercial farm fields in southern Sweden. We observed lower crop growth rate, lower peak GLAI, and earlier peak GLAI during the dry year compared to the year with normal weather conditions. Our data revealed the importance of a faster crop growth to obtain more biomass during dry conditions, while the growth rate was less crucial for crop performance during the year with normal weather conditions. Differences in crop development between the years demonstrate that stress-related crop response to changing environmental conditions can be detected by monitoring crops using satellite images at the landscape level, and this could be useful for farmers to monitor their crops and identify when the plants are stressed. In addition, we found that plant available water capacity was important for crop growth rate during the dry year. This suggests that satellite imagery can be used to discover soil impacts on crop development at scales relevant to commercial farming. The inclusion of soil properties in satellite image analyses could further improve the accuracy of the prediction of drought stress on crops.
The Sentinel-2 scenes were obtained from Microsoft Planetary Computer (Microsoft Open Source et al., 2022). The precipitation and temperature data are available from the Swedish Meteorological and Hydrological Institute (SMHI, 2023).
The supplement related to this article is available online at https://doi.org/10.5194/bg-22-1341-2025-supplement.
Funding was acquired by TC, TK, and HA. HS, TK, and HA contributed to project conceptualisation. HS performed the investigations with advice from LVG, JH, TC, TK, and HA. LVG implemented the programming code in EOdal. HS wrote the paper, and LVG, JH, TC, TK, and HA contributed to the review and editing.
The contact author has declared that none of the authors has any competing interests.
Publisher's note: Copernicus Publications remains neutral with regard to jurisdictional claims made in the text, published maps, institutional affiliations, or any other geographical representation in this paper. While Copernicus Publications makes every effort to include appropriate place names, the final responsibility lies with the authors.
This article is part of the special issue ”Drought, society, and ecosystems (NHESS/BG/GC/HESS inter-journal SI)”. It is not associated with a conference.
The authors want to thank all the farmers involved in this study for allowing soil sampling on their fields. We also thank Laura Martínez, Leah Eitelberg, and Loraine ten Damme for help with the soil sampling and Ana María Mingot Soriano, Anna Oskar, and Jan Fiedler for laboratory measurements.
This research has been supported by the Swedish Farmers' Foundation for Agricultural Research (grant no. O-19-23-309) and by the Swedish Research Council for Sustainable Development (grant no. 2022-00218). In addition, Tino Colombi was supported by the University of Nottingham (Nottingham Research Fellowship). Lukas Valentin Graf and Helge Aasen were supported by the Swiss National Science Foundation (grant no. IZCOZ0_198091).
The publication of this article was funded by the Swedish Research Council, Forte, Formas, and Vinnova.
This paper was edited by Mana Gharun and reviewed by two anonymous referees.
Abagandura, G. O., Nasr, G. E.-D. M., and Moumen, N. M.: Influence of Tillage Practices on Soil Physical Properties and Growth and Yield of Maize in Jabal al Akhdar, Libya, Open Journal of Soil Science, 7, 118–132, https://doi.org/10.4236/ojss.2017.77010, 2017.
Abid, M., Ali, S., Qi, L. K., Zahoor, R., Tian, Z., Jiang, D., Snider, J. L., and Dai, T.: Physiological and biochemical changes during drought and recovery periods at tillering and jointing stages in wheat (Triticum aestivum L.), Sci. Rep., 8, 4615, https://doi.org/10.1038/s41598-018-21441-7, 2018.
Agenbag, G. A. and Maree, P. C. J.: Effect of tillage on some soil properties, plant development and yield of spring wheat (Triticum aestivum L.) in stony soil, Soil Till. Res., 21, 97–112, https://doi.org/10.1016/0167-1987(91)90008-L, 1991.
Alam, M. K., Islam, M. M., Salahin, N., and Hasanuzzaman, M.: Effect of Tillage Practices on Soil Properties and Crop Productivity in Wheat–Mungbean–Rice Cropping System under Subtropical Climatic Conditions, Sci. World J., 2014, e437283, https://doi.org/10.1155/2014/437283, 2014.
Ali, A. M., Savin, I., Poddubskiy, A., Abouelghar, M., Saleh, N., Abutaleb, K., El-Shirbeny, M., and Dokukin, P.: Integrated method for rice cultivation monitoring using Sentinel-2 data and Leaf Area Index, Egyptian Journal of Remote Sensing and Space Science, 24, 431–441, https://doi.org/10.1016/j.ejrs.2020.06.007, 2021.
Alnaimy, M., Zelenakova, M., Vranayova, Z., and Abu-Hashim, M.: Effects of Temporal Variation in Long-Term Cultivation on Organic Carbon Sequestration in Calcareous Soils: Nile Delta, Egypt, Sustainability, 12, 4514, https://doi.org/10.3390/su12114514, 2020.
Andersson, B.: Odlingstekniska försök med höstvete, Institutionen för Växtodling, Sveriges lantbruksuniversitet, Uppsala, 1983.
Atzberger, C., Richter, K., Vuolo, F., Darvishzadeh, R., and Schlerf, M.: Why confining to vegetation indices? Exploiting the potential of improved spectral observations using radiative transfer models, in: Remote Sensing for Agriculture, Ecosystems, and Hydrology XIII, Remote Sensing for Agriculture, Ecosystems, and Hydrology XIII, 2011/10/07, SPIE, Prague, 263–278, https://doi.org/10.1117/12.898479, 2011.
Bakke, S. J., Ionita, M., and Tallaksen, L. M.: The 2018 northern European hydrological drought and its drivers in a historical perspective, Hydrol. Earth Syst. Sci., 24, 5621–5653, https://doi.org/10.5194/hess-24-5621-2020, 2020.
Bates, D., Mächler, M., Bolker, B., and Walker, S.: Fitting Linear Mixed-Effects Models Using lme4, J. Stat. Softw., 67, 1–48, https://doi.org/10.18637/jss.v067.i01, 2015.
Beillouin, D., Schauberger, B., Bastos, A., Ciais, P., and Makowski, D.: Impact of extreme weather conditions on European crop production in 2018, Philos. T. Roy. Soc. B, 375, 20190510, https://doi.org/10.1098/rstb.2019.0510, 2020.
Bengough, A. G., McKenzie, B. M., Hallett, P. D., and Valentine, T. A.: Root elongation, water stress, and mechanical impedance: a review of limiting stresses and beneficial root tip traits, J. Exp. Bot., 62, 59–68, https://doi.org/10.1093/jxb/erq350, 2011.
Berg, P., Norin, L., and Olsson, J.: Creation of a high resolution precipitation data set by merging gridded gauge data and radar observations for Sweden, J. Hydrol., 541, 6–13, https://doi.org/10.1016/j.jhydrol.2015.11.031, 2015.
Bhattacharya, A.: Chapter 3 – Water-Use Efficiency Under Changing Climatic Conditions, in: Changing Climate and Resource Use Efficiency in Plants, edited by: Bhattacharya, A., Academic Press, https://doi.org/10.1016/B978-0-12-816209-5.00003-9, 111–180, 2019.
Bodner, G., Nakhforoosh, A., and Kaul, H.-P.: Management of crop water under drought: a review, Agron. Sustain. Dev., 35, 401–442, https://doi.org/10.1007/s13593-015-0283-4, 2015.
Boedhram, N., Arkebauer, T. J., and Batchelor, W. D.: Season-Long Characterization of Vertical Distribution of Leaf Area in Corn, Agron. J., 93, 1235–1242, https://doi.org/10.2134/agronj2001.1235, 2001.
Chen, S., Du, T., Wang, S., Parsons, D., Wu, D., Guo, X., and Li, D.: Quantifying the effects of spatial-temporal variability of soil properties on crop growth in management zones within an irrigated maize field in Northwest China, Agr. Water Manage., 244, 106535, https://doi.org/10.1016/j.agwat.2020.106535, 2021.
Chen, Y., Carver, B. F., Wang, S., Zhang, F., and Yan, L.: Genetic loci associated with stem elongation and winter dormancy release in wheat, Theor. Appl. Genet., 118, 881–889, https://doi.org/10.1007/s00122-008-0946-5, 2009.
Chowdhury, S., Bolan, N., Farrell, M., Sarkar, B., Sarker, J. R., Kirkham, M. B., Hossain, M. Z., and Kim, G.-H.: Chapter Two – Role of cultural and nutrient management practices in carbon sequestration in agricultural soil, in: Advances in Agronomy, vol. 166, edited by: Sparks, D. L., Academic Press, https://doi.org/10.1016/bs.agron.2020.10.001, 131–196, 2021.
Clevers, J. G. P. W., Kooistra, L., and Van den Brande, M. M. M.: Using Sentinel-2 Data for Retrieving LAI and Leaf and Canopy Chlorophyll Content of a Potato Crop, Remote Sens.-Basel, 9, 405, https://doi.org/10.3390/rs9050405, 2017.
Colombi, T., Torres, L. C., Walter, A., and Keller, T.: Feedbacks between soil penetration resistance, root architecture and water uptake limit water accessibility and crop growth – A vicious circle, Sci. Total Environ., 626, 1026–1035, https://doi.org/10.1016/j.scitotenv.2018.01.129, 2018.
Danner, M., Berger, K., Wocher, M., Mauser, W., and Hank, T.: Efficient RTM-based training of machine learning regression algorithms to quantify biophysical & biochemical traits of agricultural crops, ISPRS J. Photogramm., 173, 278–296, https://doi.org/10.1016/j.isprsjprs.2021.01.017, 2021.
de Vries, F. T., Griffiths, R. I., Knight, C. G., Nicolitch, O., and Williams, A.: Harnessing rhizosphere microbiomes for drought-resilient crop production, Science, 368, 270–274, https://doi.org/10.1126/science.aaz5192, 2020.
De Martonne, E.: L’indice d’aridité, Bulletin de l’Association de Géographes Français, 3, 3–5, https://doi.org/10.3406/bagf.1926.6321, 1926.
Ding, D. Y., Feng, H., Zhao, Y., He, J. Q., Zou, Y. F., and Jin, J. M.: Modifying Winter Wheat Sowing Date as an Adaptation to Climate Change on the Loess Plateau, Agron. J., 108, 53–63, https://doi.org/10.2134/agronj15.0262, 2016.
Dong, T., Liu, J., Qian, B., He, L., Liu, J., Wang, R., Jing, Q., Champagne, C., McNairn, H., Powers, J., Shi, Y., Chen, J. M., and Shang, J.: Estimating crop biomass using leaf area index derived from Landsat 8 and Sentinel-2 data, ISPRS J. Photogramm., 168, 236–250, https://doi.org/10.1016/j.isprsjprs.2020.08.003, 2020.
Doole, G., Tozer, K., Sauermann, C., Stevens, D., and Ward, J.: Challenges and opportunities for conducting on-farm research, Journal of New Zealand Grasslands, 85–93, https://doi.org/10.33584/jnzg.2023.85.3659, 2023.
Fageria, N. K.: Role of Soil Organic Matter in Maintaining Sustainability of Cropping Systems, Commun. Soil Sci. Plan., 43, 2063–2113, https://doi.org/10.1080/00103624.2012.697234, 2012.
Fahad, S., Bajwa, A. A., Nazir, U., Anjum, S. A., Farooq, A., Zohaib, A., Sadia, S., Nasim, W., Adkins, S., Saud, S., Ihsan, M. Z., Alharby, H., Wu, C., Wang, D., and Huang, J.: Crop Production under Drought and Heat Stress: Plant Responses and Management Options, Front. Plant Sci., 8, 1147, https://doi.org/10.3389/fpls.2017.01147, 2017.
Feng, W., Wu, Y., He, L., Ren, X., Wang, Y., Hou, G., Wang, Y., Liu, W., and Guo, T.: An optimized non-linear vegetation index for estimating leaf area index in winter wheat, Precis. Agric., 20, 1157–1176, https://doi.org/10.1007/s11119-019-09648-8, 2019.
Graf, L. V., Perich, G., and Aasen, H.: EOA-team/eodal_notebooks: EOdal Notebooks, Zenodo, https://doi.org/10.5281/ZENODO.7278252, 2022.
Graf, L. V., Merz, Q. N., Walter, A., and Aasen, H.: Insights from field phenotyping improve satellite remote sensing based in-season estimation of winter wheat growth and phenology, Remote Sens. Environ., 299, 113860, https://doi.org/10.1016/j.rse.2023.113860, 2023.
Gray, S. B. and Brady, S. M.: Plant developmental responses to climate change, Dev. Biol., 419, 64–77, https://doi.org/10.1016/j.ydbio.2016.07.023, 2016.
Groemping, U. and Lehrkamp, M.: Relative Importance for Linear Regression in R: The Package relaimpo, J. Stat. Softw., 17, 1–27, https://cran.r-project.org/web/packages/relaimpo/index.html (last access: 20 December 2023), 2006.
He, J., Shi, Y., Zhao, J., Yu, Z., He, J., Shi, Y., Zhao, J., and Yu, Z.: Strip rotary tillage with subsoiling increases winter wheat yield by alleviating leaf senescence and increasing grain filling, Crop Journal, 8, 327–340, 2020.
He, L., Wang, R., Mostovoy, G., Liu, J., Chen, J. M., Shang, J., Liu, J., McNairn, H., and Powers, J.: Crop Biomass Mapping Based on Ecosystem Modeling at Regional Scale Using High Resolution Sentinel-2 Data, Remote Sens.-Basel, 13, 806, https://doi.org/10.3390/rs13040806, 2021.
He, M. and Dijkstra, F. A.: Drought effect on plant nitrogen and phosphorus: a meta-analysis, New Phytol., 204, 924–931, https://doi.org/10.1111/nph.12952, 2014.
Hirooka, Y., Homma, K., Maki, M., Sekiguchi, K., Shiraiwa, T., and Yoshida, K.: Evaluation of the dynamics of the leaf area index (LAI) of rice in farmer's fields in Vientiane Province, Lao PDR, J. Agric. Meteorol., 73, 16–21, https://doi.org/10.2480/agrmet.D-14-00021, 2017.
Huang, Z., Liu, Y., Tian, F.-P., and Wu, G.-L.: Soil water availability threshold indicator was determined by using plant physiological responses under drought conditions, Ecol. Indic., 118, 106740, https://doi.org/10.1016/j.ecolind.2020.106740, 2020.
Ihsan, M. Z., El-Nakhlawy, F. S., Ismail, S. M., Fahad, S., and daur, I.: Wheat Phenological Development and Growth Studies As Affected by Drought and Late Season High Temperature Stress under Arid Environment, Front. Plant Sci., 7, 795, https://doi.org/10.3389/fpls.2016.00795, 2016.
IPCC: Climate Change 2022: Impacts, Adaptation and Vulnerability Working Group II Contribution to the Sixth Assessment Report of the Intergovernmental Panel on Climate Change, Cambridge University Press, https://doi.org/10.1017/9781009325844, 2022.
Jacquemoud, S., Ustin, S. L., Verdebout, J., Schmuck, G., Andreoli, G., and Hosgood, B.: Estimating leaf biochemistry using the PROSPECT leaf optical properties model, Remote Sens. Environ., 56, 194–202, https://doi.org/10.1016/0034-4257(95)00238-3, 1996.
Kane, D. A., Bradford, M. A., Fuller, E., Oldfield, E. E., and Wood, S. A.: Soil organic matter protects US maize yields and lowers crop insurance payouts under drought, Environ. Res. Lett., 16, 044018, https://doi.org/10.1088/1748-9326/abe492, 2021.
Kang, S., Zhang, F., Hu, X., and Zhang, J.: Benefits of CO2 enrichment on crop plants are modified by soil water status, Plant Soil, 238, 69–77, https://doi.org/10.1023/A:1014244413067, 2002.
Kang, Y., Özdoğan, M., Zipper, S. C., Román, M. O., Walker, J., Hong, S. Y., Marshall, M., Magliulo, V., Moreno, J., Alonso, L., Miyata, A., Kimball, B., and Loheide, S. P.: How Universal Is the Relationship between Remotely Sensed Vegetation Indices and Crop Leaf Area Index? A Global Assessment, Remote Sens.-Basel, 8, 597, https://doi.org/10.3390/rs8070597, 2016.
Kirchmann, H., Börjesson, G., Bolinder, M. A., Kätterer, T., and Djodjic, F.: Soil properties currently limiting crop yields in Swedish agriculture – An analysis of 90 yield survey districts and 10 long-term field experiments, Eur. J. Agron., 120, 126132, https://doi.org/10.1016/j.eja.2020.126132, 2020.
Krauss, M., Berner, A., Perrochet, F., Frei, R., Niggli, U., and Mäder, P.: Enhanced soil quality with reduced tillage and solid manures in organic farming – a synthesis of 15 years, Sci. Rep., 10, 4403, https://doi.org/10.1038/s41598-020-61320-8, 2020.
Krueger, E. S. and Ochsner, T. E.: Traditional matric potential thresholds underestimate soil moisture at field capacity across Oklahoma, Soil Sci. Soc. Am. J., 88, 1678–1690, https://doi.org/10.1002/saj2.20733, 2024.
Lal, R.: Challenges and opportunities in soil organic matter research, Eur. J. Soil Sci., 60, 158–169, https://doi.org/10.1111/j.1365-2389.2008.01114.x, 2009.
Lambert, M.-J., Traoré, P. C. S., Blaes, X., Baret, P., and Defourny, P.: Estimating smallholder crops production at village level from Sentinel-2 time series in Mali's cotton belt, Remote Sens. Environ., 216, 647–657, https://doi.org/10.1016/j.rse.2018.06.036, 2018.
Lawal, S., Sitch, S., Lombardozzi, D., Nabel, J. E. M. S., Wey, H.-W., Friedlingstein, P., Tian, H., and Hewitson, B.: Investigating the response of leaf area index to droughts in southern African vegetation using observations and model simulations , Hydrol. Earth Syst. Sci., 26, 2045–2071, https://doi.org/10.5194/hess-26-2045-2022, 2022.
Lipiec, J., Håkansson, I., Tarkiewicz, S., and Kossowski, J.: Soil physical properties and growth of spring barley as related to the degree of compactness of two soils, Soil Till. Res., 19, 307–317, https://doi.org/10.1016/0167-1987(91)90098-I, 1991.
Mahmood, S., Nunes, M. R., Kane, D. A., and Lin, Y.: Soil health explains the yield-stabilizing effects of soil organic matter under drought, Soil & Environmental Health, 1, 100048, https://doi.org/10.1016/j.seh.2023.100048, 2023.
Matiu, M., Ankerst, D. P., and Menzel, A.: Interactions between temperature and drought in global and regional crop yield variability during 1961–2014, PLOS ONE, 12, e0178339, https://doi.org/10.1371/journal.pone.0178339, 2017.
Meinke, H., Hammer, G. L., van Keulen, H., Rabbinge, R., and Keating, B. A.: Improving wheat simulation capabilities in Australia from a cropping systems perspective: water and nitrogen effects on spring wheat in a semi-arid environment, in: Developments in Crop Science, vol. 25, edited by: van Ittersum, M. K. and van de Geijn, S. C., Elsevier, 99–112, https://doi.org/10.1016/S0378-519X(97)80012-8, 1997.
Microsoft Open Source, McFarland, M., Emanuele, R., Morris, D., and Augspurger, T.: microsoft/PlanetaryComputer: October 2022, last access: 26 September 2023, Zenodo [data set], https://doi.org/10.5281/ZENODO.7261897, 2022.
Minoli, S., Jägermeyr, J., Asseng, S., Urfels, A., and Müller, C.: Global crop yields can be lifted by timely adaptation of growing periods to climate change, Nat. Commun., 13, 7079, https://doi.org/10.1038/s41467-022-34411-5, 2022.
Myneni, R. B. and Williams, D. L.: On the relationship between FAPAR and NDVI, Remote Sens. Environ., 49, 200–211, https://doi.org/10.1016/0034-4257(94)90016-7, 1994.
Myneni, R. B., Ramakrishna, R., Nemani, R., and Running, S. W.: Estimation of global leaf area index and absorbed par using radiative transfer models, IEEE T. Geosci. Remote, 35, 1380–1393, https://doi.org/10.1109/36.649788, 1997.
Oldfield, E. E., Bradford, M. A., and Wood, S. A.: Global meta-analysis of the relationship between soil organic matter and crop yields, SOIL, 5, 15–32, https://doi.org/10.5194/soil-5-15-2019, 2019.
Peel, M. C., Finlayson, B. L., and McMahon, T. A.: Updated world map of the Köppen-Geiger climate classification, Hydrol. Earth Syst. Sci., 11, 1633–1644, https://doi.org/10.5194/hess-11-1633-2007, 2007.
Peng, Y., Zhu, T., Li, Y., Dai, C., Fang, S., Gong, Y., Wu, X., Zhu, R., and Liu, K.: Remote prediction of yield based on LAI estimation in oilseed rape under different planting methods and nitrogen fertilizer applications, Agr. Forest Meteorol., 271, 116–125, https://doi.org/10.1016/j.agrformet.2019.02.032, 2019.
Petcu, E., Ion, T., Pompiliu, M., and Petcu, V.: Effect of organic and conventional farming systems on some physiological indicators of winter wheat, Romanian Agricultural Research, 28, 131–135, 2011.
Porter, J. R. and Gawith, M.: Temperatures and the growth and development of wheat: a review, Eur. J. Agron., 10, 23–36, https://doi.org/10.1016/S1161-0301(98)00047-1, 1999.
Prabhakara, K., Hively, W. D., and McCarty, G. W.: Evaluating the relationship between biomass, percent groundcover and remote sensing indices across six winter cover crop fields in Maryland, United States, Int. J. Appl. Earth Obs., 39, 88–102, https://doi.org/10.1016/j.jag.2015.03.002, 2015.
Punalekar, S. M., Verhoef, A., Quaife, T. L., Humphries, D., Bermingham, L., and Reynolds, C. K.: Application of Sentinel-2A data for pasture biomass monitoring using a physically based radiative transfer model, Remote Sens. Environ., 218, 207–220, https://doi.org/10.1016/j.rse.2018.09.028, 2018.
Pużyńska, K., Synowiec, A., Pużyński, S., Bocianowski, J., Klima, K., and Lepiarczyk, A.: The Performance of Oat-Vetch Mixtures in Organic and Conventional Farming Systems, Agriculture, 11, 332, https://doi.org/10.3390/agriculture11040332, 2021.
R Core Team: R: The R Project for Statistical Computing, RStudio, PBC, Boston, https://www.r-project.org/ (last access: 22 December 2023), 2022.
Ray, R. L., Fares, A., and Risch, E.: Effects of Drought on Crop Production and Cropping Areas in Texas, Agricultural & Environmental Letters, 3, 170037, https://doi.org/10.2134/ael2017.11.0037, 2018.
Revill, A., Florence, A., MacArthur, A., Hoad, S. P., Rees, R. M., and Williams, M.: The Value of Sentinel-2 Spectral Bands for the Assessment of Winter Wheat Growth and Development, Remote Sens.-Basel, 11, 2050, https://doi.org/10.3390/rs11172050, 2019.
Rockström, J.: Resilience building and water demand management for drought mitigation, Phys. Chem. Earth Pts. A/B/C, 28, 869–877, https://doi.org/10.1016/j.pce.2003.08.009, 2003.
Rolli, E., Marasco, R., Vigani, G., Ettoumi, B., Mapelli, F., Deangelis, M. L., Gandolfi, C., Casati, E., Previtali, F., Gerbino, R., Pierotti Cei, F., Borin, S., Sorlini, C., Zocchi, G., and Daffonchio, D.: Improved plant resistance to drought is promoted by the root-associated microbiome as a water stress-dependent trait, Environ. Microbiol., 17, 316–331, https://doi.org/10.1111/1462-2920.12439, 2015.
Ru, C., Hu, X., Chen, D., Wang, W., Zhen, J., and Song, T.: Individual and combined effects of heat and drought and subsequent recovery on winter wheat (Triticum aestivum L.) photosynthesis, nitrogen metabolism, cell osmoregulation, and yield formation, Plant Physiol. Bioch., 196, 222–235, https://doi.org/10.1016/j.plaphy.2023.01.038, 2023.
Rubin, R. L., van Groenigen, K. J., and Hungate, B. A.: Plant growth promoting rhizobacteria are more effective under drought: a meta-analysis, Plant Soil, 416, 309–323, https://doi.org/10.1007/s11104-017-3199-8, 2017.
SCB: Jordbruksstatistisk årsbok 1993, Statistiska centralbyrån, Bulls Tryckeriaktiebolag, Halmstad, 1993.
Seleiman, M. F., Al-Suhaibani, N., Ali, N., Akmal, M., Alotaibi, M., Refay, Y., Dindaroglu, T., Abdul-Wajid, H. H., and Battaglia, M. L.: Drought Stress Impacts on Plants and Different Approaches to Alleviate Its Adverse Effects, Plants, 10, 259, https://doi.org/10.3390/plants10020259, 2021.
Shankar, T., Banerjee, M., Malik, G. C., Dutta, S., Maiti, D., Maitra, S., Alharby, H., Bamagoos, A., Hossain, A., Ismail, I. A., and EL Sabagh, A.: The Productivity and Nutrient Use Efficiency of Rice–Rice–Black Gram Cropping Sequence Are Influenced by Location Specific Nutrient Management, Sustainability, 13, 3222, https://doi.org/10.3390/su13063222, 2021.
Sjulgård, H.: The potential of agricultural management to alleviate extreme weather impacts on Swedish crop production, Acta Universitatis Agriculturae Sueciae,84, https://doi.org/10.54612/a.107ri2j3pt, 2024.
Sjulgård, H., Colombi, T., and Keller, T.: Spatiotemporal patterns of crop diversity reveal potential for diversification in Swedish agriculture, Agriculture, Ecosystems & Environment, 336, 108046, https://doi.org/10.1016/j.agee.2022.108046, 2022.
Sjulgård, H., Keller, T., Garland, G., and Colombi, T.: Relationships between weather and yield anomalies vary with crop type and latitude in Sweden, Agr. Syst., 211, 103757, https://doi.org/10.1016/j.agsy.2023.103757, 2023.
Skakun, S., Vermote, E., Franch, B., Roger, J.-C., Kussul, N., Ju, J., and Masek, J.: Winter Wheat Yield Assessment from Landsat 8 and Sentinel-2 Data: Incorporating Surface Reflectance, Through Phenological Fitting, into Regression Yield Models, Remote Sens.-Basel, 11, 1768, https://doi.org/10.3390/rs11151768, 2019.
SMHI: Maj 2018 – Sommarväder med rekordvärme, Swedish Meteorological and Hydrological Institute, https://www.smhi.se/klimat/klimatet-da-och-nu/manadens-vader-och-vatten-sverige/manadens-vader-i-sverige/maj-2018-sommarvader-med-rekordvarme-1.134781 (last access: 3 October 2024), 2018.
SMHI: Nedladdning av griddad nederbörd – och temperaturdata (PTHBV), Swedish Meteorological and Hydrological Institute, SMHI [data set], https://www.smhi.se/data/ladda-ner-data/griddade-nederbord-och-temperaturdata-pthbv (last access: 8 March 2023), 2023.
Stenberg, M., Bjurling, E., Gruvaeus, I., and Gustafsson, K.: Gödslingsrekommendationer och optimala kvävegivor för lönsamhet och kväveeffektivitet i praktisk spannmålsodling, SLU, Skara, 2005.
Stockdale, E. a., Shepherd, M. a., Fortune, S., and Cuttle, S. p.: Soil fertility in organic farming systems – fundamentally different?, Soil Use Manage., 18, 301–308, https://doi.org/10.1111/j.1475-2743.2002.tb00272.x, 2002.
Sun, Q., Gilgen, A. K., Wittwer, R., von Arx, G., van der Heijden, M. G. A., Klaus, V. H., and Buchmann, N.: Drought effects on trait space of winter wheat are independent of land management, New Phytol., 243, 591–606, https://doi.org/10.1111/nph.19851, 2024.
Verhoef, W.: Theory of radiative transfer models applied in optical remote sensing of vegetation canopies: e-book, Landbouwuniversiteit Wageningen (LUW), ISBN: 90-5485-804-4, 1998.
Villegas, D., Aparicio, N., Blanco, R., and Royo, C.: Biomass Accumulation and Main Stem Elongation of Durum Wheat Grown under Mediterranean Conditions, Ann. Bot.-London, 88, 617–627, https://doi.org/10.1006/anbo.2001.1512, 2001.
Wang, B., Liu, D. L., Asseng, S., Macadam, I., and Yu, Q.: Modelling wheat yield change under CO2 increase, heat and water stress in relation to plant available water capacity in eastern Australia, Eur. J. Agron., 90, 152–161, https://doi.org/10.1016/j.eja.2017.08.005, 2017.
Wang, E., Cresswell, H., Xu, J., and Jiang, Q.: Capacity of soils to buffer impact of climate variability and value of seasonal forecasts, Agr. Forest Meteorol., 149, 38–50, https://doi.org/10.1016/j.agrformet.2008.07.001, 2009.
Wasaya, A., Rehman, I., Mohi Ud Din, A., Hayder Bin Khalid, M., Ahmad Yasir, T., Mansoor Javaid, M., El-Hefnawy, M., Brestic, M., Rahman, M. A., and El Sabagh, A.: Foliar application of putrescine alleviates terminal drought stress by modulating water status, membrane stability, and yield- related traits in wheat (Triticum aestivum L.), Front. Plant Sci., 13, 2023.
Watson, D. J.: Comparative Physiological Studies on the Growth of Field Crops: I. Variation in Net Assimilation Rate and Leaf Area between Species and Varieties, and within and between Years, Ann. Bot.-London, 11, 41–76, https://doi.org/10.1093/oxfordjournals.aob.a083148, 1947.
Wocher, M., Berger, K., Danner, M., Mauser, W., and Hank, T.: RTM-based dynamic absorption integrals for the retrieval of biochemical vegetation traits, Int. J. Appl. Earth Obs., 93, 102219, https://doi.org/10.1016/j.jag.2020.102219, 2020.
Yamamoto, S., Hashimoto, N., and Homma, K.: Evaluation of LAI Dynamics by Using Plant Canopy Analyzer and Its Relationship to Yield Variation of Soybean in Farmer Field, Agriculture, 13, 609, https://doi.org/10.3390/agriculture13030609, 2023.
Zhang, J., Zhang, S., Cheng, M., Jiang, H., Zhang, X., Peng, C., Lu, X., Zhang, M., and Jin, J.: Effect of Drought on Agronomic Traits of Rice and Wheat: A Meta-Analysis, Int. J. Env. Res. Pub. He., 15, 839, https://doi.org/10.3390/ijerph15050839, 2018.
Zipper, S. C., Qiu, J., and Kucharik, C. J.: Drought effects on US maize and soybean production: spatiotemporal patterns and historical changes, Environ. Res. Lett., 11, 094021, https://doi.org/10.1088/1748-9326/11/9/094021, 2016.
Zuber, V. and Strimmer, K.: High-Dimensional Regression and Variable Selection Using CAR Scores, Stat. Appl. Genet. Mo. B., 10, 1, https://doi.org/10.2202/1544-6115.1730, 2011.