the Creative Commons Attribution 4.0 License.
the Creative Commons Attribution 4.0 License.
 | 01 Apr 2025
Exploring microscale heterogeneity as a driver of biogeochemical transformations and gas transport in peat
Petri Kiuru
Marjo Palviainen
Maarit Raivonen
Markku Koskinen
Mari Pihlatie
Annamari Laurén
Peat pore network architecture is a key determinant of water retention and gas transport properties and has therefore been hypothesized to control redox conditions in and greenhouse gas emissions from peat soils. Yet, experimental approaches to directly visualize the spatial heterogeneity of biogeochemical reactions in pore networks remain scarce. Here, we report on a 13C pulse–chase assay developed to functionally explain and visualize the centimeter-scale heterogeneity in greenhouse gas emissions in peat cores. We injected a 13C-labeled substrate (13C2 acetate) at 2 to 8 cm depths and monitored its conversion into CO2 and CH4. We then measured the pore network architecture of the same cores by X-ray microtomographic imaging and constructed the air-filled pore networks using pore network modeling. We applied this approach to peat cores collected at a drained peatland forest in southern Finland in an experiment to study the effects of water hysteresis, i.e., differences between peat cores that reached a given water potential (−20 hPa) from drier or wetter conditions. We find large heterogeneity among the replicate cores and injections, indicating the effects of centimeter-scale heterogeneity on biochemical processes and gas transport. These treatments resulted in similar average air-filled porosity but distinct pore networks (higher coordination numbers and clustering coefficients in drying compared to wetting soils) and within-core water distribution. Substrate injection experiments revealed less (potential) microbial activity (less of the substrate emitted as CO2) at greater depth in both treatments. In peat cores from the drying treatment we also find a slower microbial response to label additions at greater depths (slower release of label-derived CO2), while the timing of emissions did not vary in wetting treatments. Air-filled porosity and pore network metrics could not explain the fraction of label converted to CO2, but greater porosity was associated with slower CO2 emissions, whereas higher clustering coefficients and betweenness centrality (two measures of pore network properties) were associated with faster emissions.
- Article
(2904 KB) - Full-text XML
-
Supplement
(467 KB) - BibTeX
- EndNote


Peat pore network architecture controls microscale gas exchange, which determines redox conditions, the production of the greenhouses gases carbon dioxide (CO2) and methane (CH4), and their transport by diffusion and ebullition (Ramirez et al., 2016; Kiuru et al., 2022b). Yet, empirical methods that explain and visualize the role of pore networks and small-scale heterogeneity in the regulation of soil functions remain elusive. This is especially the case for peat soils, which possess complex pore structures distinct from mineral soils and which remain understudied compared to mineral agricultural soils (McCarter et al., 2020).
Peatlands are of global importance as modulators of biogeochemical cycles and greenhouse gas balances (Gorham, 1991; Limpens et al., 2008). Globally, more than 600 Gt of C is stored in peat layers (Yu et al., 2008), which are sensitive to drainage, forest management, and changes in environmental conditions. In a warming climate, peatlands are becoming a major source of greenhouse gases (GHGs) such as CO2 and CH4 (Leifeld et al., 2019; Frolking et al., 2011). In peat, the production of CO2 and CH4 is primarily determined by soil temperature and oxygen (O2) supply (McCarter et al., 2020). Where sufficient O2 is available, heterotrophic respiration dominates, and peat is decomposed to CO2. In the absence of O2, peat decomposition uses other electron acceptors, which eventually leads to methanogenesis. This occurs, for example, below the water table (WT) and above the WT in anaerobic microsites (anaerobic pockets) (Wachinger et al., 2000; Hagedorn et al., 2011). At this microscale, O2 concentrations depend on the balance between O2 consumption, driven by temperature and substrate availability, and on the transport of O2 from the atmosphere to soil (McCarter et al., 2020; Keiluweit et al., 2018). This transport, in turn, depends on the peat water content and the connectivity and structure of the air-filled macropore network in the peat (King and Smith, 1987; Boon et al., 2013; Hamamoto et al., 2016; Kiuru et al., 2022b). Small-scale heterogeneity in the pore structure may explain the noisy and peaky patterns of methane emissions typically observed in field conditions (Xu et al., 2016; Wright et al., 2018).
Despite the progress in pore network modeling, experiments that demonstrate how peat pore networks regulate production of CO2 and CH4 remain missing. One significant reason for this knowledge gap is the lack of experimental approaches to localize biochemical reactions within intact peat cores. Most studies so far have been conducted in mineral soils to identify anoxic microenvironments that allow for the oxygen-sensitive denitrification process to occur within a larger matrix of aerated soil (e.g., Kravchenko et al., 2017; Schlüter et al., 2018; Sihi et al., 2020). Most such studies focus on identifying correlations between pore network parameters, e.g., the distance of particulate organic matter to air-filled pores and macroscopically observed measures like N2O emissions (Kravchenko et al., 2017; Rohe et al., 2021; Du et al., 2023; Ortega-Ramírez et al., 2023). What remains missing is an approach to directly observe the biogeochemical reactions at a given location within the soil pore network. Some progress has been made by measurements with O2 and N2O microsensors (Rohe et al., 2021; Kim et al., 2021) and zymographic imaging (Kim et al., 2021, 2022). While such work has been conducted to identify N2O-producing microsites in agricultural soil, comparable work on CH4 production in organic soils remains missing.
Here, we present an approach to study the microscale heterogeneity in both pore networks and biogeochemical processes within peat cores. To achieve this, we injected an isotopically labeled substrate (13C2-labeled sodium acetate, 13CH3COONa) and followed the emissions of 13CH4 and 13CO2 from these cores during heterotrophic respiration (Reaction R1) and acetoclastic methanogenesis (Reaction R2). Note the position-specific conversion of C2 carbon to methane in Reaction (R2).
We compared the effect of injections at different depths in wetting and drying peat cores held at the same water potential on the conversion rate of the injected label into CO2 and CH4 as well as the time lag between the injection and the emission of these gases from the top of the peat core. After the manipulation experiment, we conducted microtomographic imaging and analyzed the pore space above the injection depth. We hypothesize that greater air-filled porosity would be associated with a higher conversion of the methyl group of acetate to CO2, less conversion to CH4, and a more rapid onset of emissions.
2.1 Site description and peat sampling
Peat samples were collected from a forest (60°38′ N, 23°57′ E; Lettosuo, Tammela) in southern Finland in December 2021. The site was drained in 1969 with parallel ditches in 40 m spacing. The mean annual temperature and precipitation at Lettosuo are 5.2 °C and 621 mm (Jokinen et al., 2021). The peat type is Carex peat. The site was originally a mesotrophic fen classified as a herb-rich tall sedge–birch–pine fen (Laine and Vasander, 1996). The forest stand is dominated by Scots pine (Pinus sylvestris L.) and downy birch (Betula pubescens Ehrh.) with an undergrowth composed of Norway spruce (Picea abies Karst.). The dominant height of the stand was 20 m, and the volume of the growing stock was 230 m3 ha−1. The ground vegetation consists of dwarf shrubs (coverage 4 %), including Vaccinium myrtillus L. and V. vitis-idaea L., as well as herbs (coverage 10.6 %). A detailed site description is available in Kiuru et al. (2022a).
Peat core samples were collected from seven replicate pits that were located at least 30 m apart from each other. The cores were collected by removing the top 15 cm of soil, including a thin ice wedge that had formed in this layer. At each pit, two parallel samples were extracted into cylindrical cores (10.0 cm height, 10.0 cm diameter) from the depth of 15–25 cm.
2.2 Sample storage and water potential setup
Samples were wrapped in shrink-wrap foil and stored at +4 °C until the pretreatment, where all samples were water saturated and placed on two sand beds that were hydraulically connected to hanging water columns (Eijkelkamp sand bed). One parallel sample from each pit was retained close to saturation (5 cm water column below the mid-point of the sample corresponding to a water potential of −5 hPa), while the other parallel sample was moderately drained (35 cm water column, i.e., −35 hPa). All samples were then set to a water potential of −20 hPa; consequently, one parallel sample of each pair reached the final water potential during drying, while the other parallel sample reached it during wetting.
2.3 Measurement setup
For measurements, the peat samples were equipped with ca. 7 cm high collars made from 5 mm thick neoprene rubber sheets that were outfitted with two ports for polytetrafluorethylene (PTFE) tubing. The bottom of each core and the top of each collar were sealed with shrink-wrap foil secured with rubber rings. One of the tube ports was connected to a 16-port selector valve (VICI model EMT-STF16MWE) and further to a Picarro G2201-i () as well as a parallel pump for increasing the flow rate through the measurement system (Fig. 1). The other tube port was equipped with a 1 m long tube open to the atmosphere. The total flow rate of the system was set to 500 mL min−1 by regulating the airflow to the auxiliary pump using a needle valve. In addition to the 14 peat samples, two empty chambers were included in the system as blank controls.
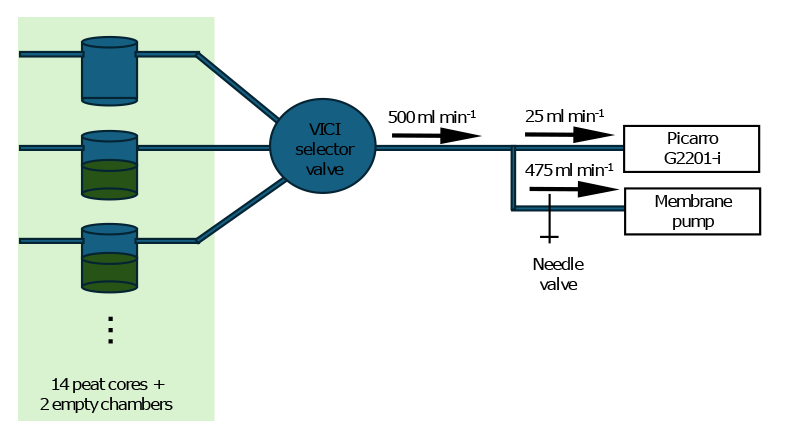
Figure 1Schematic depiction of the measurement setup. Ambient air was pulled through a headspace chamber to a Picarro G2201-i cavity ring-down spectroscopic analyzer. A parallel line to an additional membrane pump was used to increase the sample flow rate and regulate it with a needle valve. The system was connected to 16 chambers (14 peat cores and two empty chambers) using a VICI 16-port selector valve. Headspace air from each chamber was analyzed for 10 min once every 160 min, and CO2 and CH4 emitted by the peat cores were allowed to accumulate in the chamber headspace for 150 min between measurements.
The measurement system was set up to pull air sequentially from each chamber for 10 min periods. Each chamber was analyzed once every 160 min, with a 150 min break between the measurements, during which CO2 and CH4 were allowed to accumulate in the chamber headspace. The time period between the two consecutive air-pulling events in a sample is hereon called a “closure”. During the measurement event, the analyzer initially measures the concentration and isotope values of CO2 and CH4 accumulated in the headspace since the previous measurement event of the chamber, followed by increasing dilution of the headspace with ambient air (Fig. 2). After ca. 2–3 min, a dynamic equilibrium is reached where the headspace CO2 and CH4 concentrations equal the concentration in ambient air plus the current chamber emissions. The closure times of the two empty chambers were slightly different (500 and 700 s) for easier identification of the chambers in the raw data.
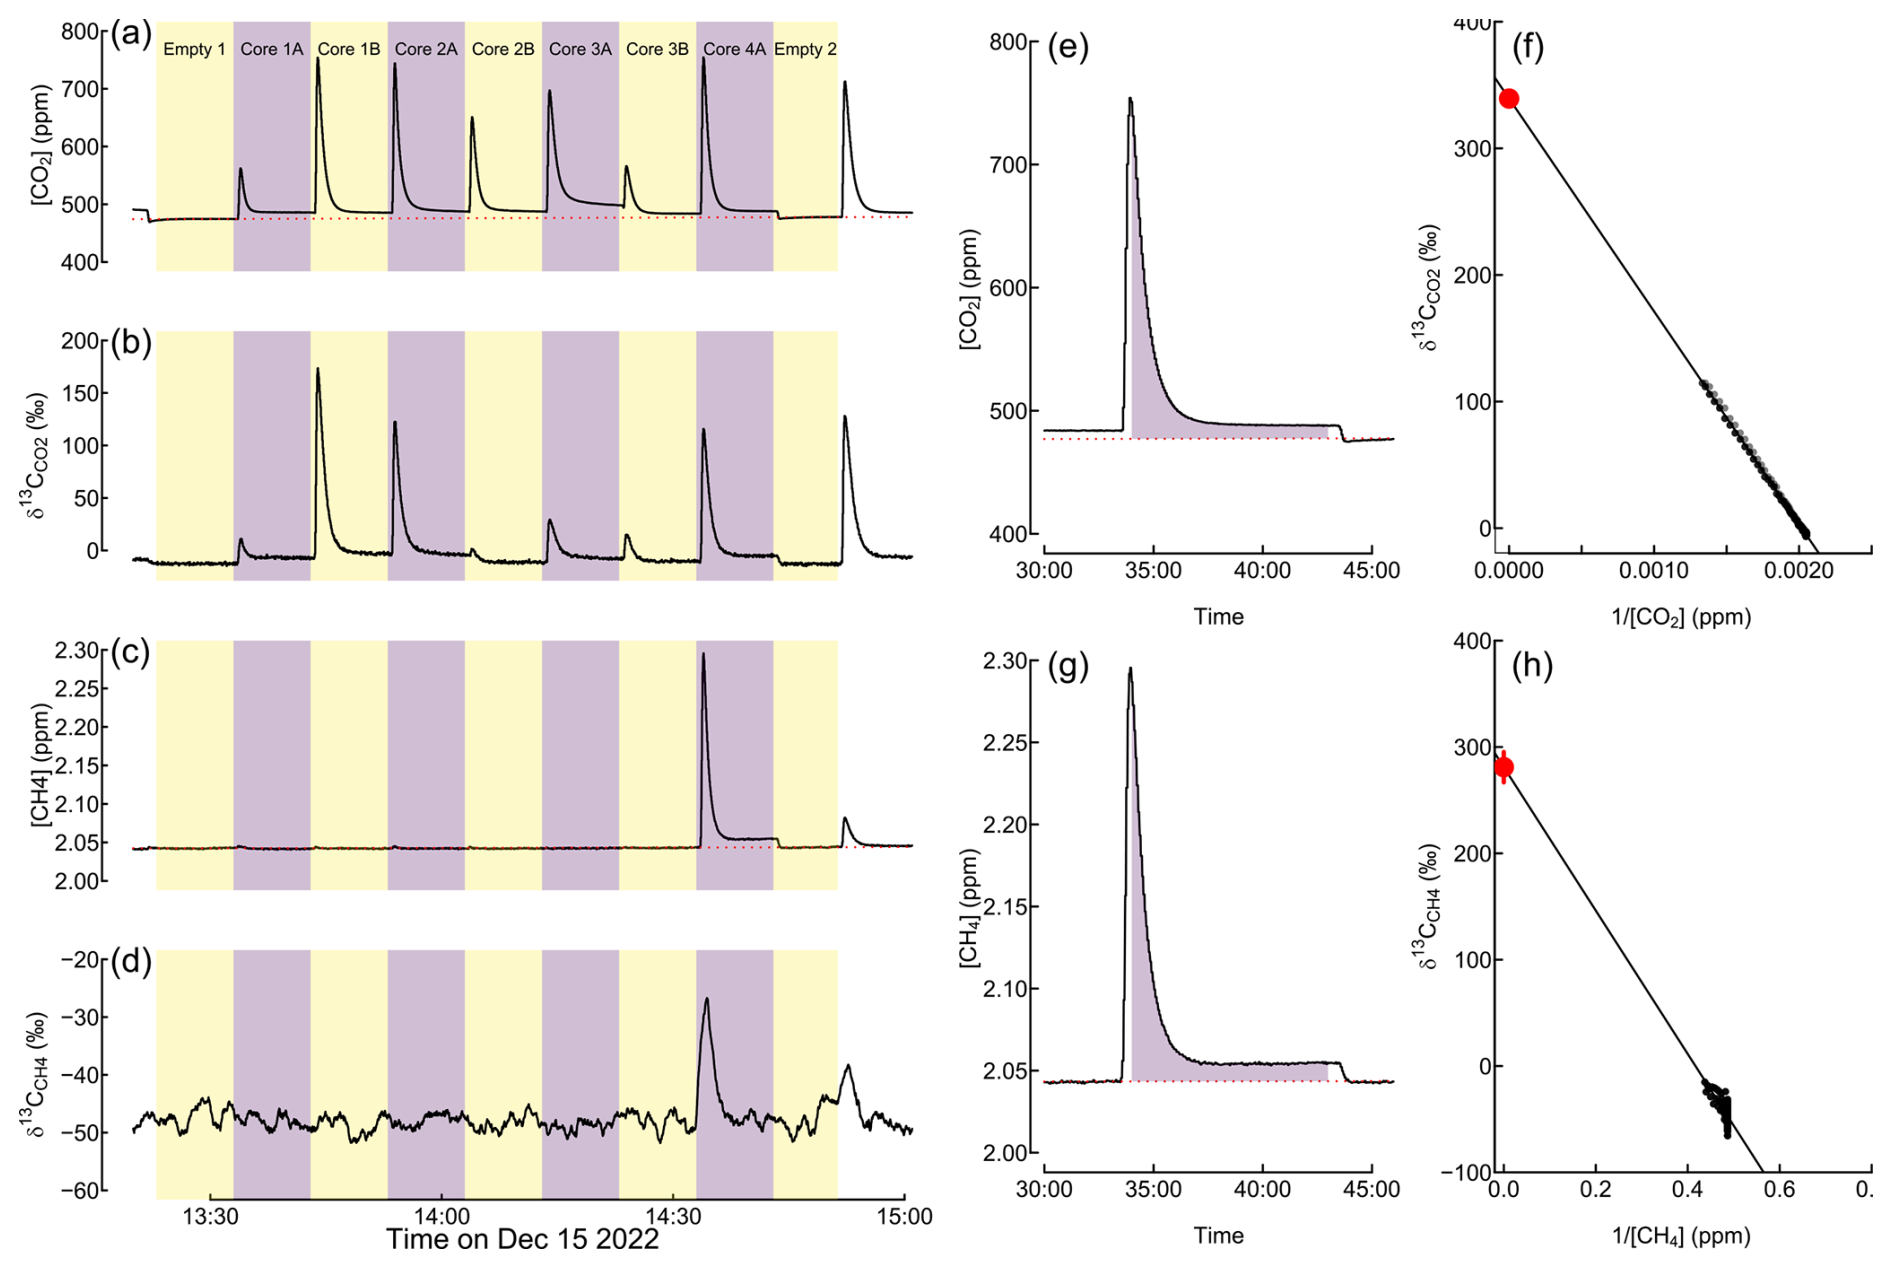
Figure 2Example of raw data, including measured CO2 and CH4 concentrations (a, c), measured carbon isotope ratios (δ13C) in CO2 and CH4 (b, d), integrated area for calculating CO2 and CH4 emissions rates (e, g), and Keeling plots for estimating the δ13C value of peat-emitted CO2 and CH4 (f, h). The dashed red line in (a), (c), (e), and (g) represents the concentration baseline, which was estimated by interpolation from empty-chamber measurements. In (f) and (h), the black symbols represent measured data points, solid lines represent linear regressions, and red points and error bars indicate the δ13C value of peat-emitted CO2 and CH4 (i.e., the intercept of the regression line) and its 2 standard error uncertainty.
2.4 Labeling experiment
13C-labeled substrate was injected three times into each peat sample with 7 d intervals between injections. We injected 1 mL of 10 mM 13C2 sodium acetate solution (i.e., a total of 10 µmol label per sample) followed by 1 mL ultrapure water. The injections were applied using syringes and hypodermal needles at 2.0, 5.0, and 8.0 cm depth. We permutated the order in which these injections were applied (2–5–8, 5–8–2, or 8–2–5 cm) in a different order for each pair of parallel samples.
After each injection, the needles were closed using three-way valves to prevent gas exchange through the needle and left in the peat core for the rest of the experiment. After dismantling the experiment, the needles were removed to avoid metal objects interfering with the microtomographic imaging, and wooden toothpicks were inserted into the vacated needle canals to mark the position of the injections in the μCT image. However, the positions of these could not be identified in the μCT images, preventing the identification of the exact injection location in pore networks.
2.5 Flux calculations
For each chamber closure, we calculated the amount of CO2 and CH4 emitted during a closure from the measured gas concentration using Eq. (3) after subtracting a baseline concentration determined by linear interpolation between the two closest blank measurements (Fig. 2a, c, e, and g). The emission rates (in mol min−1) were then calculated by dividing the amount of accumulated gas (in mol) by the time between measurements (160 min; Eq. 1).
Here, F is the emission rate (mol min−1), A is the integrated baseline-corrected gas concentration from the maximum mixing ratio to 30 s before the end of the closure (mol mol−1 min), f is the gas flow rate (0.5 L min−1), Vmol is the molar volume of an ideal gas (24.055 L mol−1 at 20 °C and 101.325 hPa), and tcycle is the length of a measurement cycle (160 min).
We further calculated the carbon isotope (δ13C) values of CO2 and CH4 emitted during each closure by the Keeling plot method, i.e., as the intercept of the linear regression between the measured δ13C values and the inverse concentration (Fig. 2f and h). We converted the δ13C values to atom percent excess (APE) according to Eq. (2), where δ13Csam is the measured δ13C value; δ13Ccont is the δ13C value of an unlabeled sample, assumed to be −28 ‰ for CO2 and −70 ‰ for CH4; and Rref is the absolute ratio of the δ13C reference material (VPDB; 0.01111233).
The rates of label-derived CO2 and CH4 (FL, mol min−1) emissions were calculated based on the total emission rate F and the APE measured during each closure (Eq. 3).
Equations (2) and (3) were also applied to quantify emissions of label-derived 13CH4 from peat cores that showed net uptake of (unlabeled) CH4. In this case, both F and APE are negative, resulting in a positive FL.
To correct for carry-over from one injection to the next (e.g., emissions of 13CO2 and 13CH4 derived from the first injection after the second injection), we fitted an exponential decay function to the 13CO2 and 13CH4 emissions rates over the 4 d prior to the next injection. This curve was then extrapolated to the measurement period after the subsequent injections and subtracted from the observed emissions.
To analyze the patterns of CO2 and CH4 emissions and compare experiments with slightly different run times, we calculated five measures for each injection. First, we calculated the average total (labeled + unlabeled) CO2 and CH4 emissions over the first 41 measurement cycles (109.3 h) after injection. This measure serves primarily as a control for the impact of the incubation conditions and label injection on the overall functioning of the peat cores: any large change in total emissions after injections would indicate an alteration of microbial processes in the peat cores. Next, we calculated the fraction of the applied label emitted as CO2 or CH4 over the same time as an indicator of the local processes at the injection site. Finally, to characterize the combined effect of the delayed start of label conversion to CO2, we determined the time from each label injection until half of the 13CO2 emissions after the same injection had occurred ().
2.6 Three-dimensional μCT imaging and image processing
After the labeling experiment, the peat samples were covered with shrink-wrap foil and stored in +4 °C until μCT imaging with a GE Phoenix Nanotom system (Waygate Technologies). The flat panel detector was used in 4×4 binning mode, resulting in an effective pixel size of 100 µm at the sample. Two images were merged together at each projection angle by moving the detector sideways in order to have a large enough field of view to cover the whole sample laterally (merged projection image width 1104×100 µm). An exposure time of 1 s was used for each of the images. A CT scan was performed with 1200 projections over a 360° rotation to obtain the dataset. The X-ray generator voltage was 80 kV, and the current was 120 µA. A 0.1 mm thick Cu sheet placed in front of the source was used as a beam filter. Three such CT scans were performed for each sample by moving the sample vertically to cover the whole height of the sample. The CT scans for each sample were then stitched onto one stack of slices for further analysis. The scanning for each sample took 3 h. The 16-bit 3D grayscale images obtained in the μCT reconstruction had a size of voxels (cubic 3D image element) at 100 µm resolutions.
In the image preprocessing stage, the 3D grayscale images were converted to 3D binary images that separated void (air) voxels from voxels representing solid space and water using the Python image processing packages scikit-image (Van Der Walt et al., 2014) and SciPy ndimage (Virtanen et al., 2020) and the image analysis toolkit PoreSpy (Gostick et al., 2019). First, the 3D grayscale images were straightened and cropped to a size of voxels according to the inner dimensions of the cylindrical tubes. A cylindrical peat volume with a height of 1000 voxels and a diameter of 900 voxels was further selected using PoreSpy. Before the noise filtering and binary segmentation stages, the images were linearly mapped to an 8-bit representation. The mapping interval extended from 0.5 % to 99.5 % of the cumulative image gray-level intensity distribution so that the long tails of the intensity distribution formed by noise or occasional small mineral grains were removed. The 8-bit images were then noise filtered using a 3D median filter with a 2-voxel radius. Finally, the images were segmented into void and solid volumes with the global Otsu thresholding algorithm (Otsu, 1979). Isolated solid regions were removed from the resulting binary images using a method for the determination of disconnected voxel space in PoreSpy.
2.7 Image analysis
Because the samples had shrunk slightly and their top and bottom surfaces were rough and uneven, the sample images were also cropped in the vertical direction so that the final image domain did not contain any external void space. The final cylindrical domains had a diameter of 90 mm and a height of 75–95 mm. The air-filled porosity of each image domain was calculated as the ratio of the number of void voxels to the number of total voxels in the domain. The vertical air-filled porosity distribution was obtained by determining the void to voxel ratio for each horizontal voxel layer. For the determination of the radial air-filled porosity distribution, the domain was divided into 45 hollow cylinders with equal diameter increments. Because the samples had shrunk in the vertical direction, some void space had been generated between the peat matrix and the tube walls. To only include the internal void space of the samples, the vertical porosity distribution was calculated for a cylindrical domain with a diameter of 80 mm.
2.8 Pore networks
Pore networks were extracted from the final cylindrical domains of the binary images using a marker-based watershed segmentation method (Gostick, 2017). The segmentation algorithm divides the void space into individual pore regions and determines the connections between the pores and the locations of the 2D interfaces between neighboring pores called pore throats. Because the feature resolution of a μCT-derived image is generally approximately twice the image voxel size (Stock, 2008; Elkhoury et al., 2019), the size of the smallest distinguishable feature in the images was 200 µm.
The pore system generated by the extraction algorithm was divided into clusters of interconnected pores and a group of single isolated pores using the open-source pore network modeling package OpenPNM (Gostick et al., 2016). The largest of these clusters, which was assumed to be the only cluster that extends through the network domain in the axial direction and which was therefore the relevant space regarding gas transport through the domain, was defined as the pore network. The pore volume was determined by counting the number of voxels in an individual pore region. Network porosity was defined as the ratio of the sum of the volumes of the pores in the network to the total volume of the domain. Further network metrics were calculated following Kiuru et al. (2022a). Briefly, the coordination number is defined as the average number of connections of each pore to other pores. The clustering coefficient is defined as the probability that two pores connected to a given pore are also connected to each other. Closeness centrality is the reciprocal of the average shortest path length from one pore to all other pores in the network. Geometrical tortuosity and betweenness centrality represent properties of the pore network that affect gas transport in a certain direction (between the top and bottom of the peat core) and as a whole.
2.9 Statistical analysis
To identify the effects of soil moisture treatments on air-filled porosity and pore network metrics (coordination number, clustering coefficient, geometric tortuosity, closeness centrality, and betweenness centrality), we applied a mixed-effect model that used moisture treatment as a fixed effect and a soil pit as a random effect (n=14).
Further, to test for potential disturbances due to repeated labeling or prolonged incubation, we tested for changes in total (labeled + unlabeled) CO2 emissions after each injection (n=42) by applying a mixed-effect model in which the injection depth, injection round, and moisture treatment were set as fixed effects, while the soil pit and core within the soil pit were chosen as random effects.
Moreover, to test the effects of injection depth on other parameters derived from label injection experiments (n=42), we applied a mixed-effect model that used moisture treatment and injection depth as fixed effects, while soil pit and core within the soil pit were used as random effects. Injection round was added to the model to control for potential changes over time during the incubation. As the limited replication did not allow for a statistical analysis of potential interaction effects, we split the dataset into drying and wetting subsets (n=21) and repeated the analysis with injection depth as a fixed effect and core as a random effect.
Finally, to investigate whether air-filled porosity derived from the μCT images can explain the heterogeneity in label-derived CO2 emissions between peat cores and injections, we tested whether the average air-filled porosity above injection depth was correlated with the fractions of the label emitted as CO2 or . This analysis was performed separately for each injection depth. We also tested for correlations between pore network metrics, label-derived CO2, and , as well as for correlations between these predictors. All statistical analyses were performed in the statistical programming environment R version 4.2.1 (R Development Core Team, 2015) using the lme4, lmerTest, and emmeans packages.
3.1 Microtomography and pore architecture
Microtomographic imaging revealed high heterogeneity both within and between the peat cores. Four examples of vertical cross sections through the cores are shown in Figs. 3 and S1 in the Supplement. Visual inspection showed large, mainly horizontally oriented macropore systems in a dense matrix (Fig. 3a, c, and d) and vertically connected pore networks (Fig. 3b) reflecting a looser peat structure. We found a large degree of vertical heterogeneity in the air-filled pore volume, originating from layered, horizontally oriented macropores (Fig. 3e) and air-filled cavities in the peat samples. In contrast, all peat cores show the same radial porosity trend from the center to the edge (Fig. 3f). This indicated the absence of vertical pore structures, which would be visible distinct features in these plots. All samples showed a similar increase in air-filled porosity towards the edge of the sample, an artifact of shrinkage caused by drying.
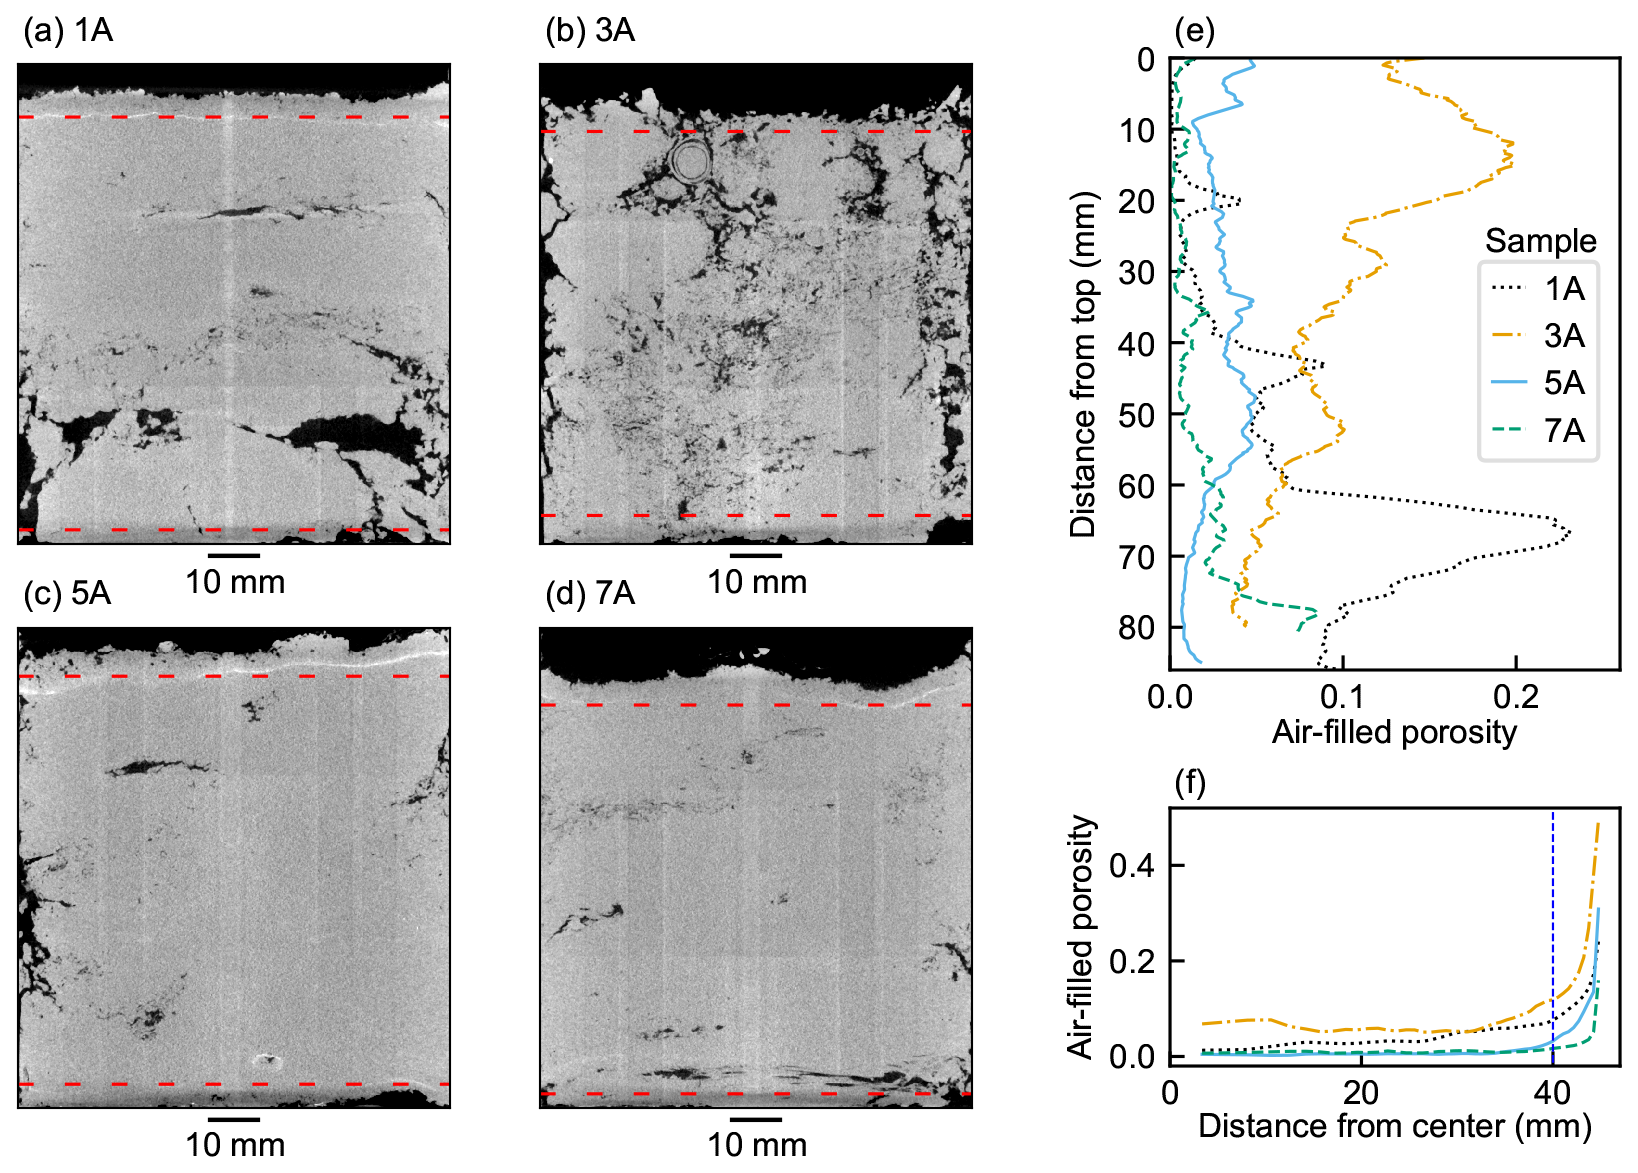
Figure 3Axial cross sections of noise-filtered 3D μCT images of peat samples (a) 1A, (b) 3A, (c) 5A, and (d) 7A. The air-filled pore space is displayed in black and peat in white. Vertical (e) and radial (f) profiles of the air-filled porosity of the samples. The dashed red lines in the images show the boundaries of the final network domain.
Metrics describing network traits are shown in Fig. 4. For most network metrics, the high heterogeneity in pore networks across peat cores prevented us from identifying statistically significant differences between wetting and drying treatments. We have, however, identified several non-significant trends that may be relevant for interpreting the results of our label injection experiments. The mean air-filled porosity in the 14 peat samples ranged from 0.20 % to 6.75 % (average: 2.56 %, standard deviation (SD): 2.02 %). Overall, air-filled porosity did not differ between wetting (2.62 %±2.10 % (mean ± SD)) and drying soils (2.30 %±2.10 %) (Fig. 4a). While we found no difference in the air-filled pore volume of the whole core between treatments, we detected a (non-significant) trend towards a larger number of individual pores in wetting compared to drying treatments; i.e., the wetting treatment led to a smaller average pore volume (Fig. 4a). We further observed (non-significant) trends towards a larger number of pores and a greater pore volume not connected to the main network in wetting treatments (not shown). Moreover, the wetting treatment had significantly lower coordination numbers and clustering coefficients compared to drying treatments (Fig. 4b and c). In contrast, we found no significant difference between treatments in geometric tortuosity, closeness centrality, and betweenness centrality (Fig. 4d–f).
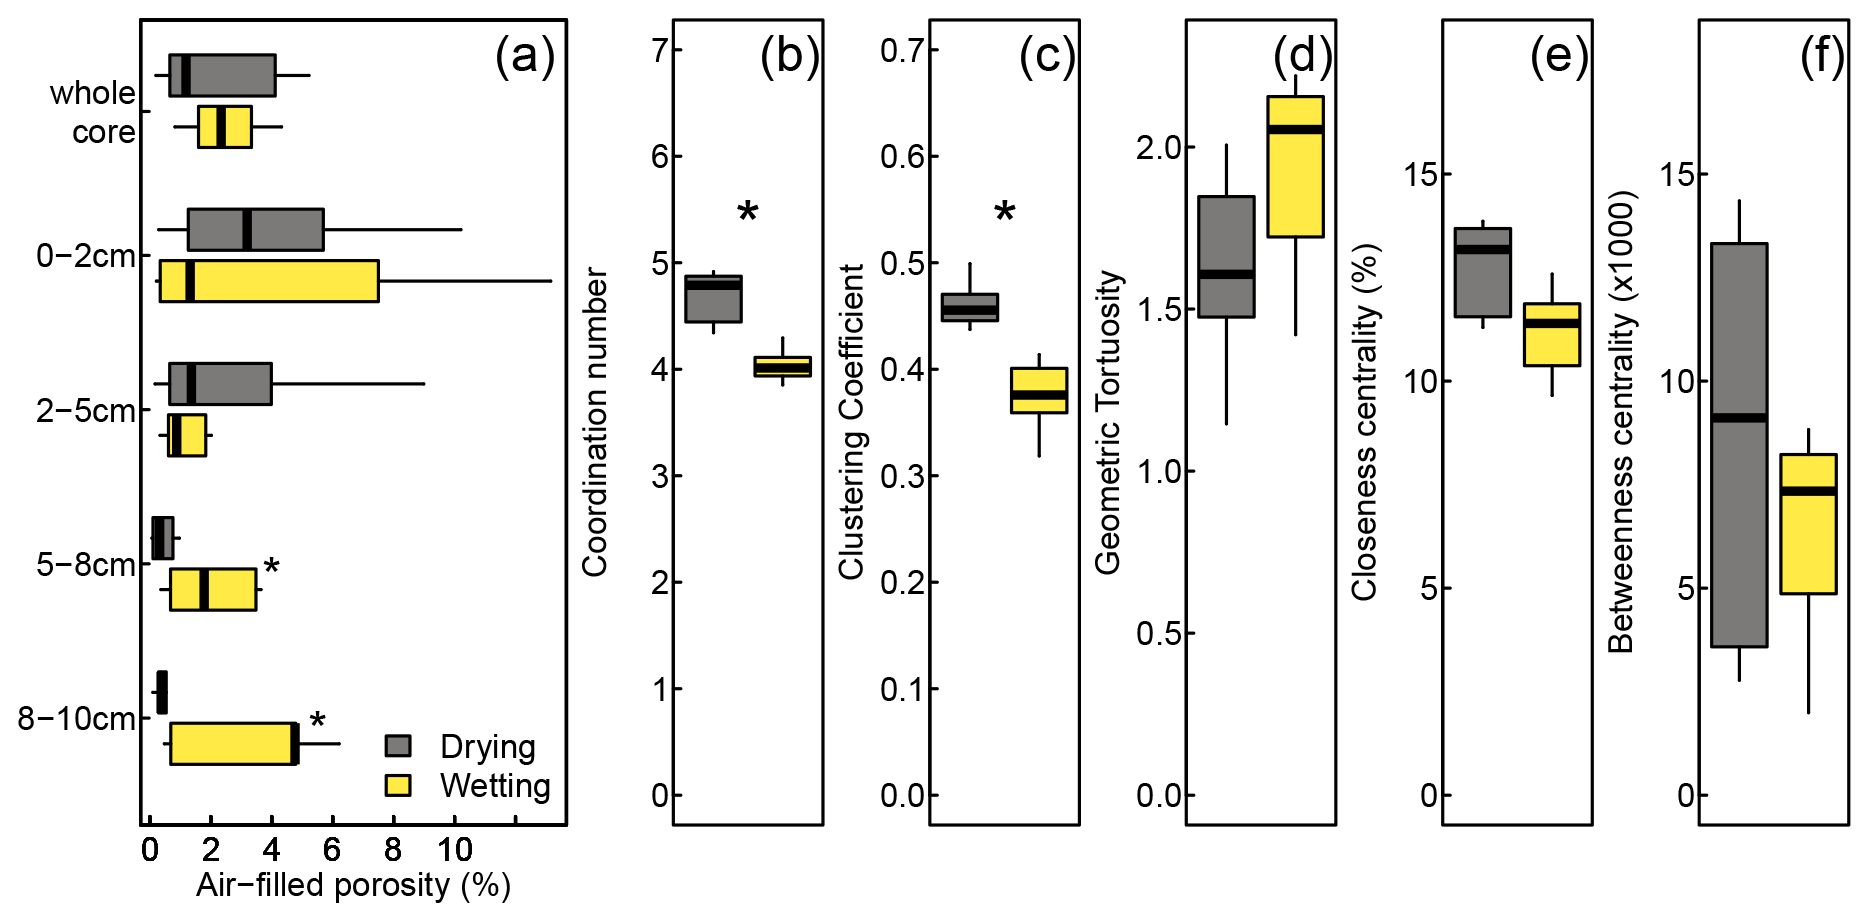
Figure 4Moisture treatment effects on air-filled porosity (a) and pore network metrics (b–f). The asterisks indicate significant differences between treatments (*, ). Betweenness centrality values have been multiplied by 1000 for easier readability.
This similarity in average porosity masked differences between the treatments that became apparent in network metrics and when air-filled porosity was analyzed by the depth layer. Air-filled porosity did not differ in shallow layers (0–2 and 2–5 cm), although we did observe a non-significant trend towards higher air-filled porosity in drying treatments (Fig. 4a). In contrast, we found significantly higher air-filled porosity in wetting than in drying treatments in deeper layers (5–8 and 8–10 cm).
3.2 CO2 and CO4 emissions from peat core
3.2.1 Background emissions of CO2 and CH4
All peat cores emitted CO2 at a mean rate of 1.6±0.6 µmol h−1 (1 SD among cores; range: 0.4 to 2.7 µmol h−1). These total emissions were not affected by the injections, as was indicated by the lack of differences in the background respiration after the injections at different depths (Fig. 5a). We did, however, observe ca. 20 % higher CO2 emissions after the third round of injections (Fig. 5b), indicating a minor increase in peat respiration rates towards the end of the experiment. We observed no differences between the drying and wetting treatments (Fig. 5c).
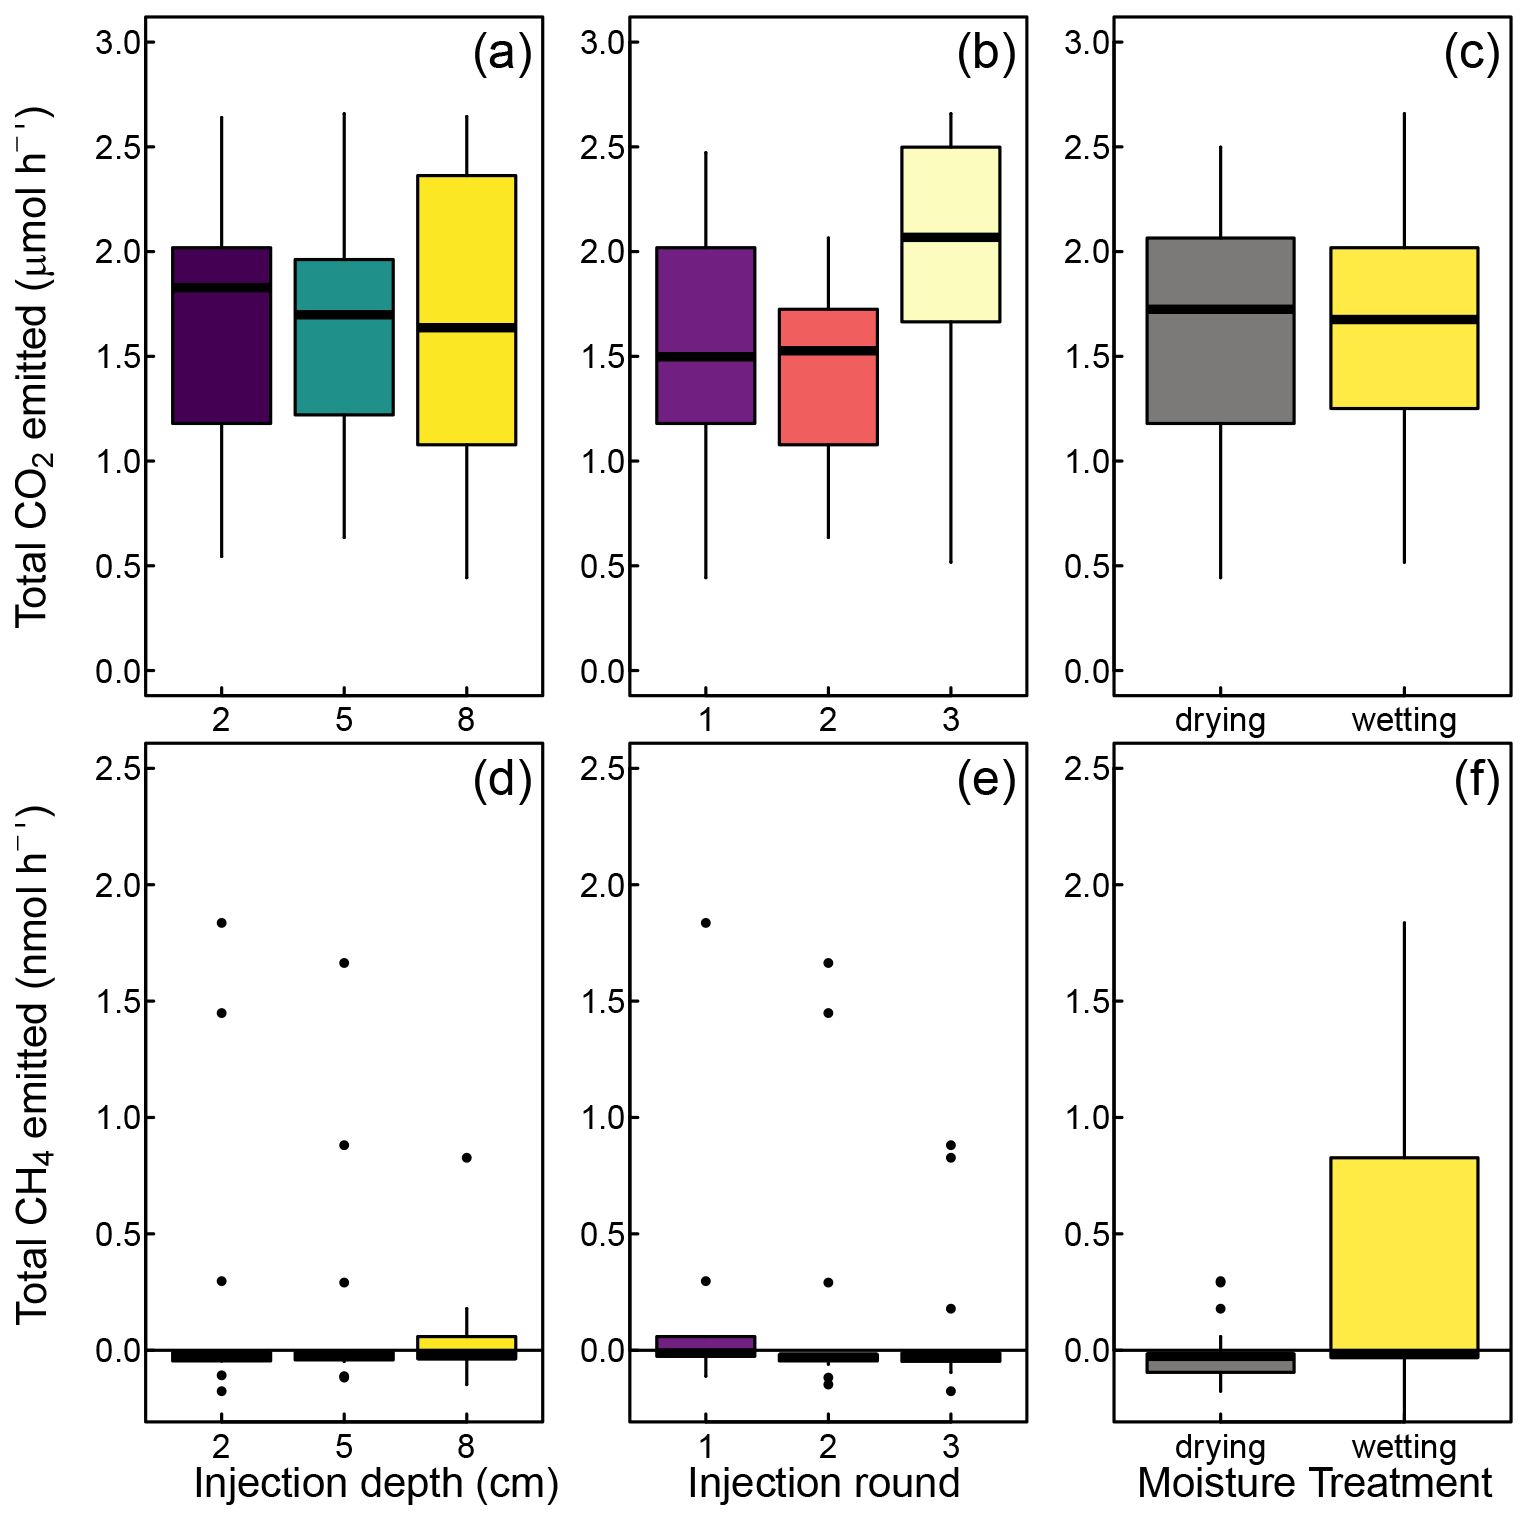
Figure 5Total carbon dioxide (CO2) and methane (CH4) emissions from peat cores, that is, the sum of label-derived and non-label-derived emissions. The positive numbers indicate net release of gases into the atmosphere, and negative numbers indicate net uptake by the peat cores. No significant differences were found in any other case.
A total of 3 of the 14 peat cores acted as methane emitters with emissions rates up to 1.67 nmol h−1, whereas the remaining 11 peat cores acted as small CH4 sinks with a sink strength up to 0.05 nmol h−1. On average, the peat cores were net emitters with an arithmetic mean flux of 0.32±0.95 nmol CH4 h−1. All methane-emitting cores had low air-filled porosities (<1 %), although not all cores with low air-filled porosity emitted methane. We observed no significant changes in the background CH4 emissions over the course of the experiment and no difference in emissions after the injections at different depths (Fig. 5d and e). A trend towards higher emissions in drying compared to wetting treatments (Fig. 5f) was not significant (p=0.96).
3.3 Label-derived CO2 emissions
We followed the release of the label-derived 13CO2 over 43–68 measurement cycles, that is, 114–181 h. We observed a high heterogeneity in these emissions between the peat cores and in the response to individual injections (Fig. 6). Overall, we observed the highest rates of 13CO2 release over the first 24 h after label injection (Fig. 6a–c). However, only some of the injections led to a strong, early 13CO2 release. Other injections showed a longer response time lag, reaching maximum 13CO2 emission rates 24–72 h after the label injection. Although this type of response typically showed lower maximum emission rates (Fig. 6a–c), it often reached a higher cumulative emission throughout the experiment (Fig. 6d–f).
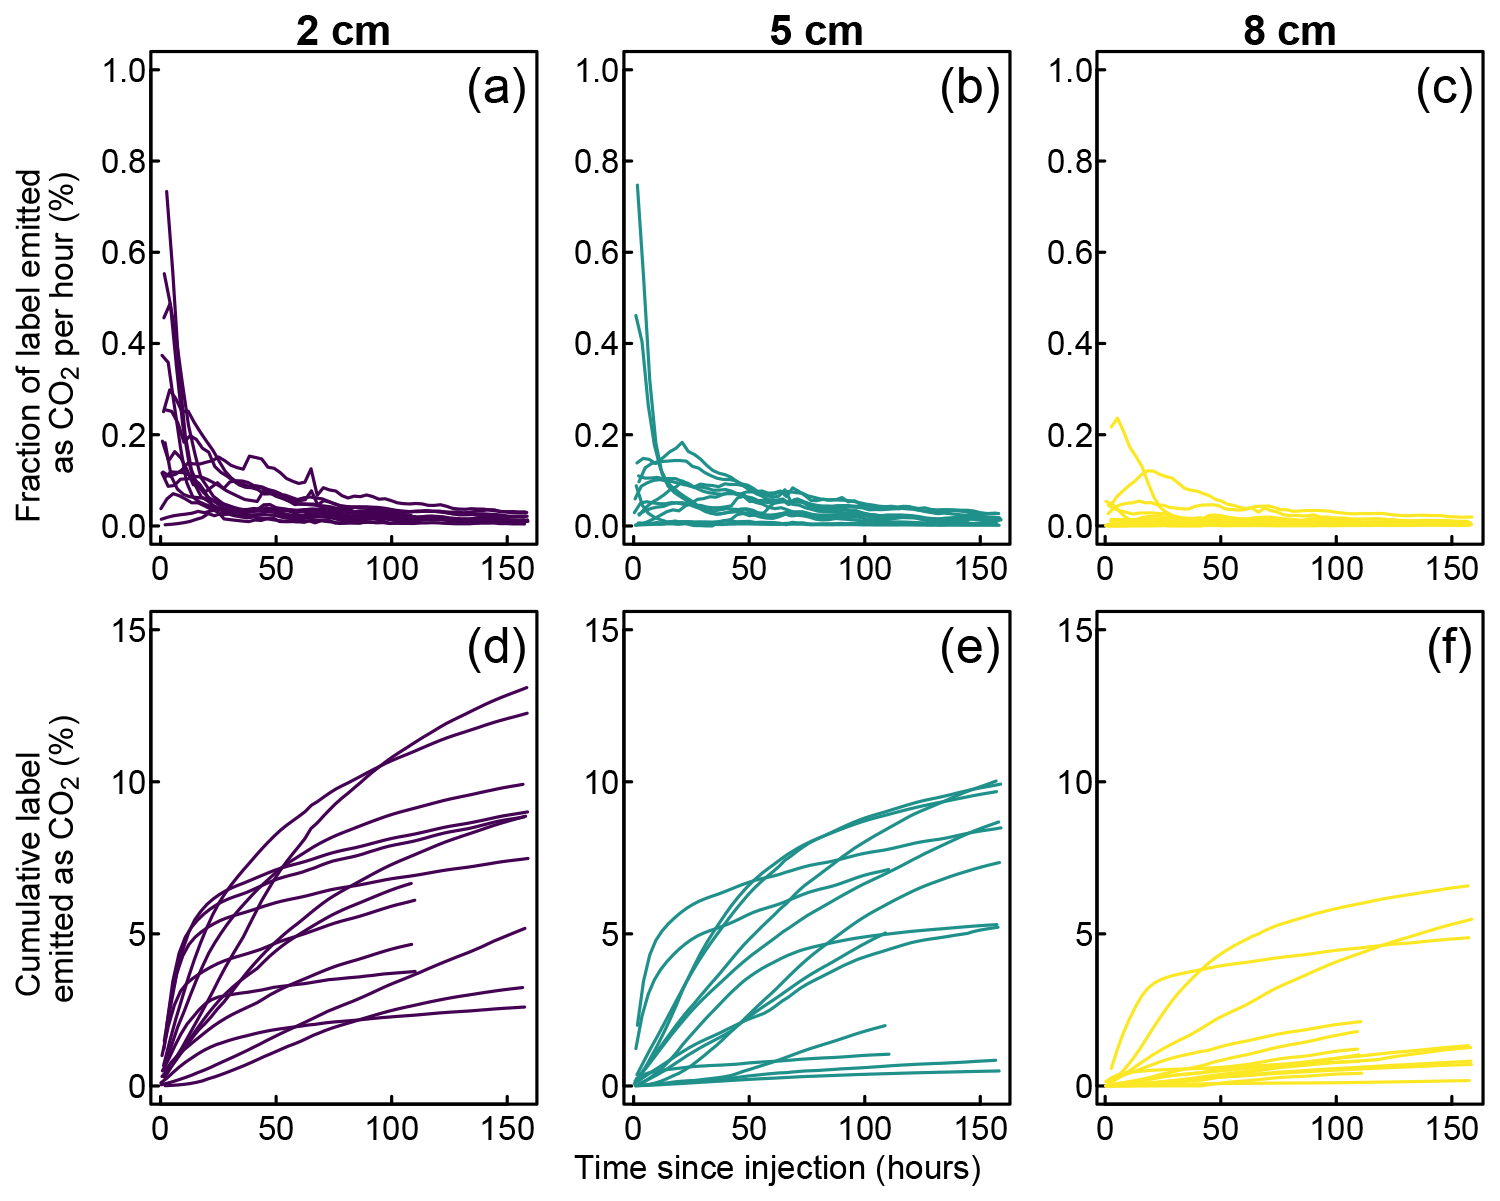
Figure 6Instantaneous (a–c) and cumulative (d–f) emissions of label-derived CO2 grouped by injection depth.
To compare 13CO2 emissions across experiments that had different run times, we integrated the observed emissions over the first 41 measurement cycles (109.3 h). Over this period, we found emissions ranging from 0.01 to 1.22 µmol 13CO2 or 0.11 % to 12.2 % of the injected label. The average fraction of the label emitted as CO2 decreased with injection depth, from 7.2 % at 2 cm depth to 1.9 % at 8 cm depth (F=12.2, p<0.001; Fig. 7a). This depth effect was found in both wetting and drying cores. The emitted 13CO2 did not differ between the injection rounds or soil moisture treatments (Fig. 7b and c).
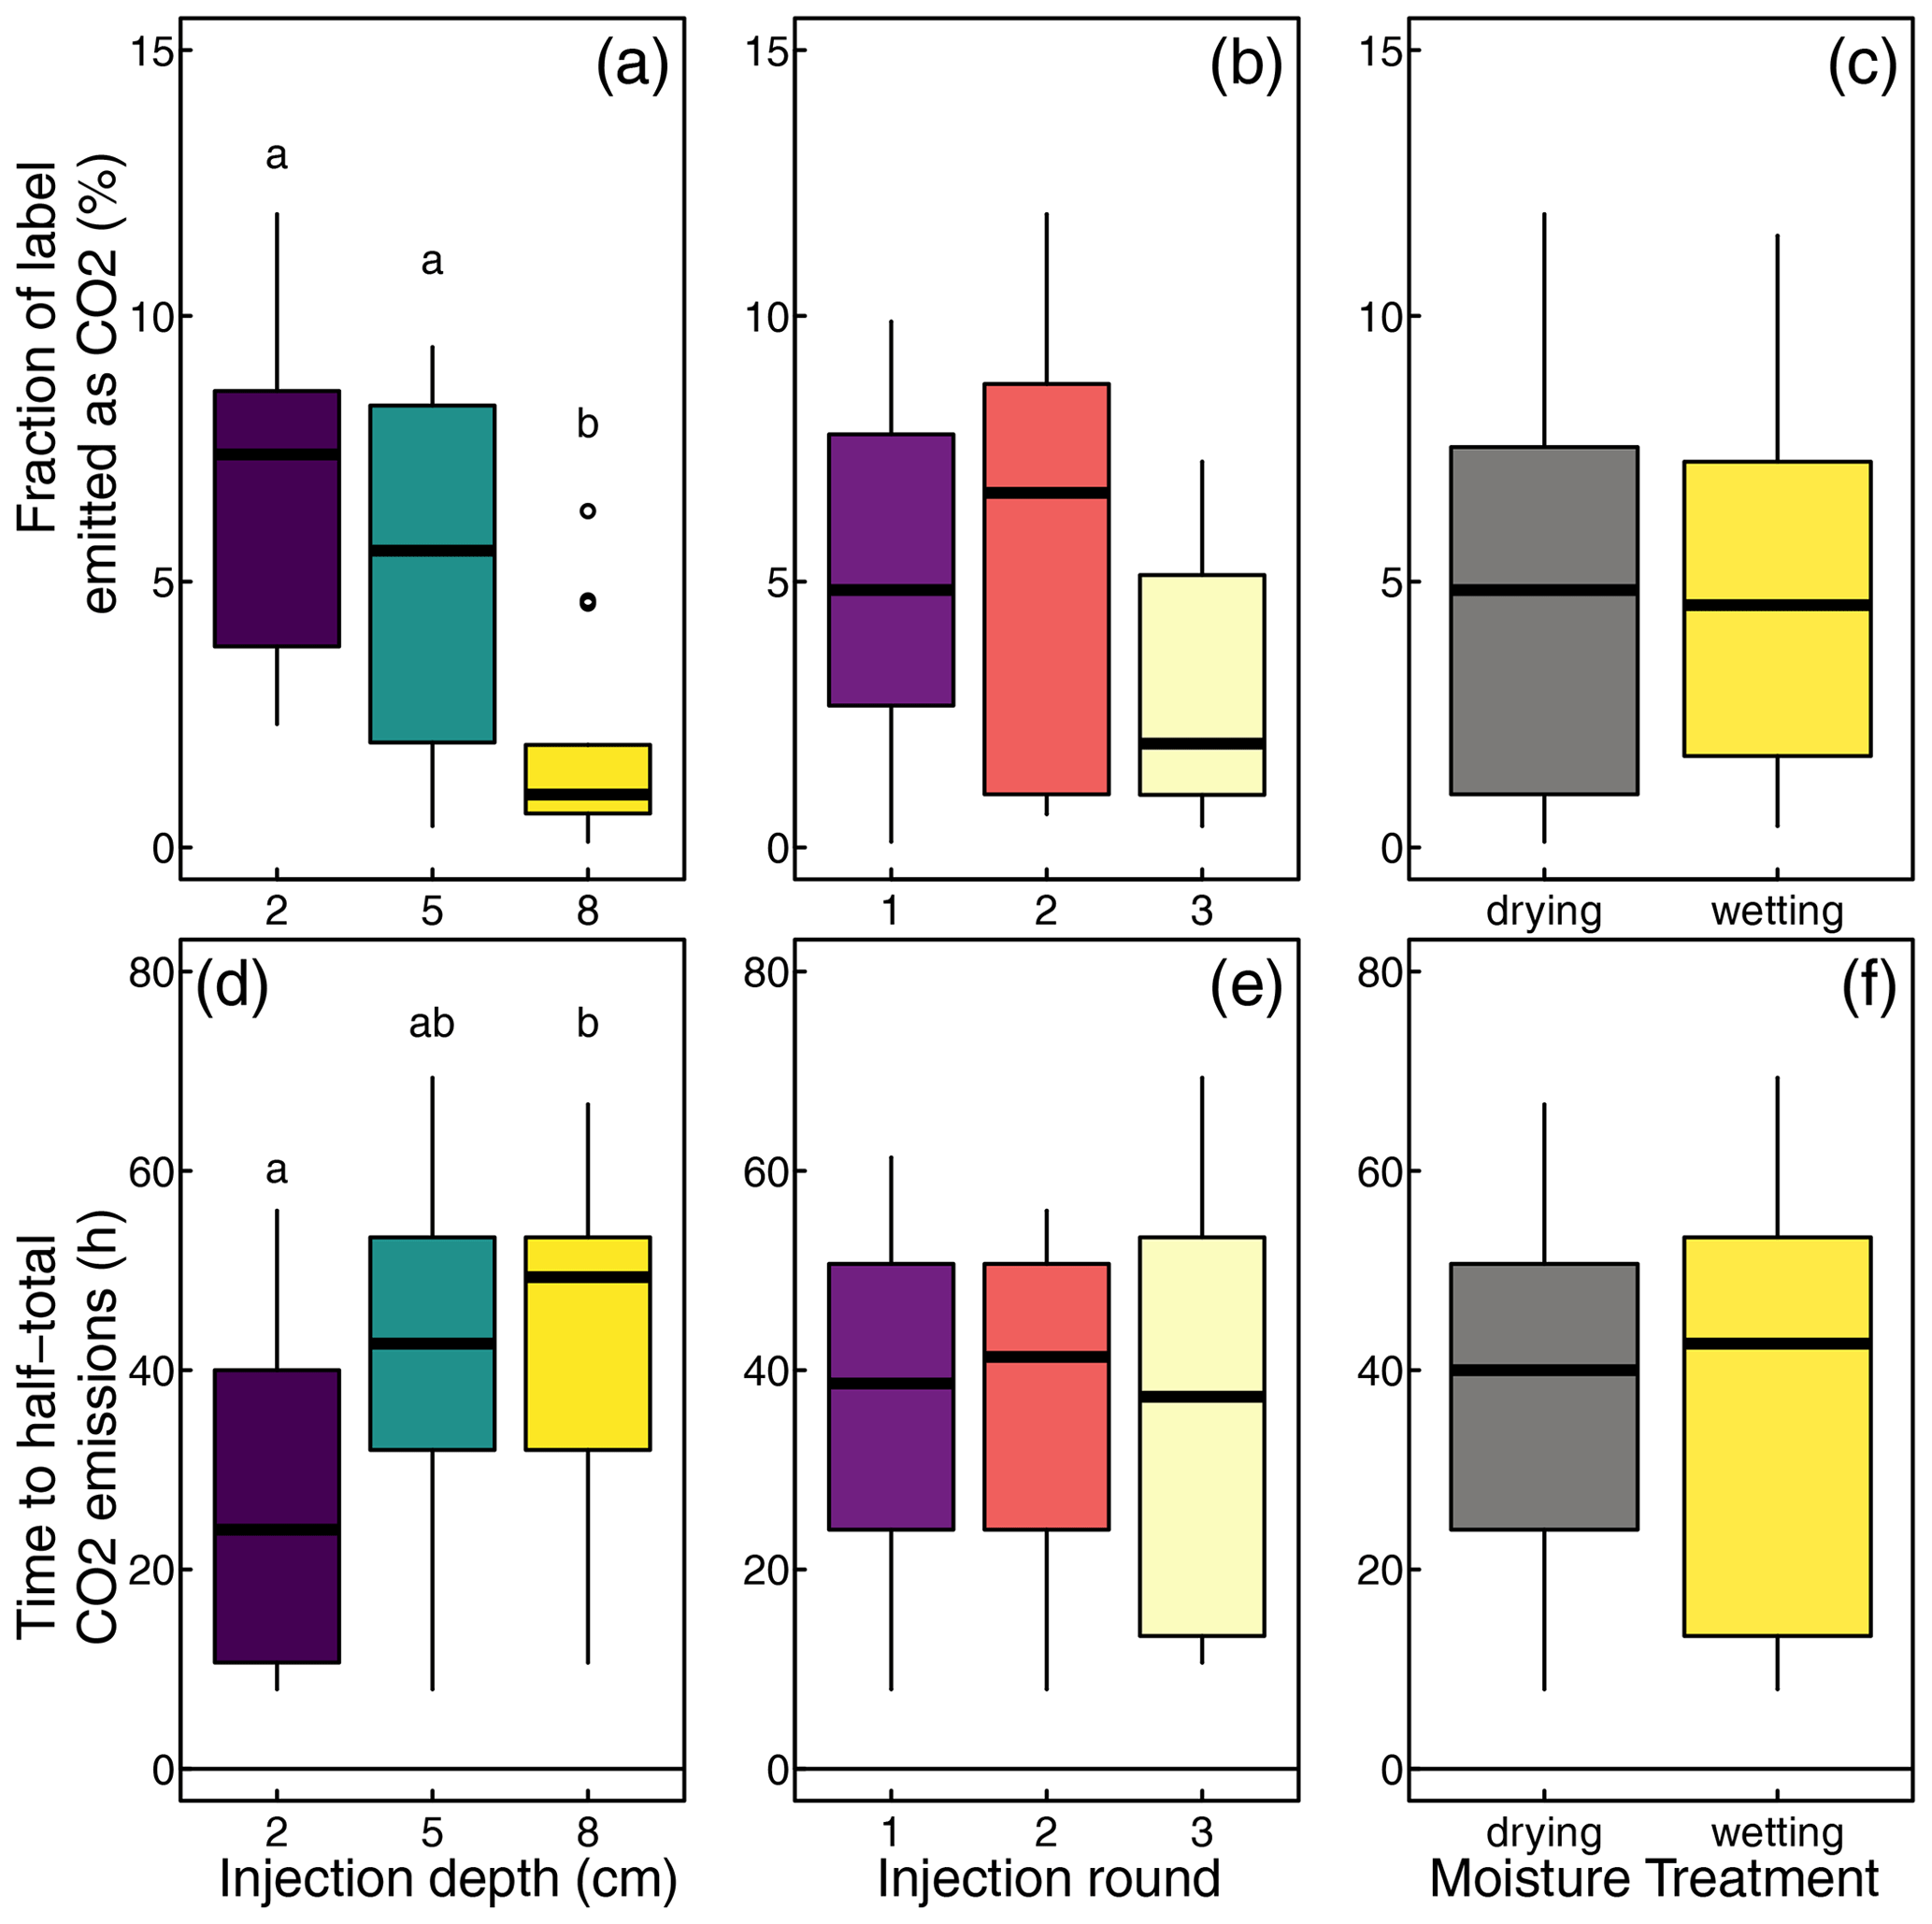
Figure 7Effects of injection depths, injection round, and moisture treatment on the fraction of the label emitted as CO2 and delay to half-total emissions. The letters indicate significant differences between groups.
To characterize the combined effect of the delayed onset of the label conversion to CO2 and the diffusion time, we determined the time from each label injection until half of the 13CO2 emissions after the same injection had occurred (). This level was reached after 3 to 28 h. Again, we found a significant difference between injections at different depths, with13CO2 emissions showing a greater average time lag at greater depths (10.5 h at 2 cm depths vs. 17.1 h at 8 cm depths). A more detailed analysis, however, showed that this was only true among wetting soil cores, while injection depth had no effect on in drying cores. Further, injection round or soil moisture treatment had no significant effect on .
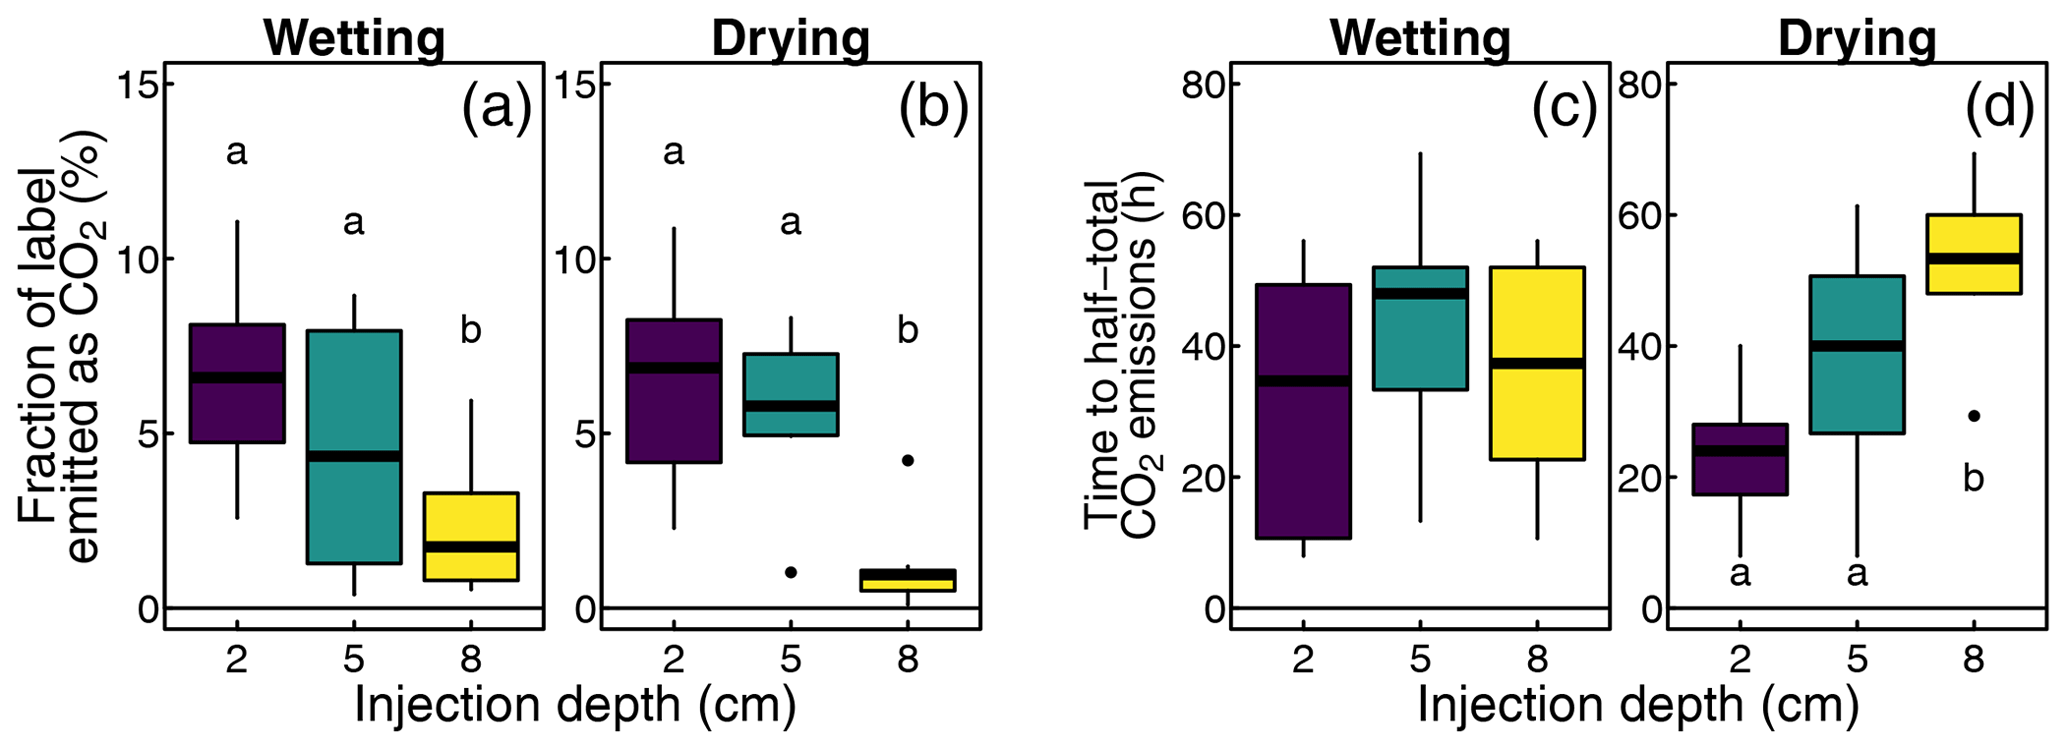
After this initial analysis, we split the dataset to separately analyze depth and injection round effects in wetting and drying cores. This analysis resulted in contrasting results for the different measures. For cumulative 13CO2 emissions, both treatments show the same response found in the overall dataset; that is, less of the injected label was emitted as CO2 after deeper injections (Fig. 8a and b). In contrast, we find distinct responses of the timing of 13CO2 release () in wetting and drying treatments, with injection depth having little effect on in wetting treatments (Fig. 8c) but greater depth leading to a slower release in drying treatments (Fig. 8d).
3.4 Label-derived CH4 emissions
The label-derived CH4 emissions showed highly variable responses to the individual label injections (Fig. 9a–c). Quantitatively, however, the conversion of the injected label to CH4 was very limited, with less than 0.01 % of the injected label emitted as methane. We detected 13CH4 emissions in both peat cores that showed background (non-labeled) CH4 emission and peat cores that showed no such background emission, but 13CH4 emissions increased with higher background emissions (R>0.73, p<0.003, tested separately for each injection depth).
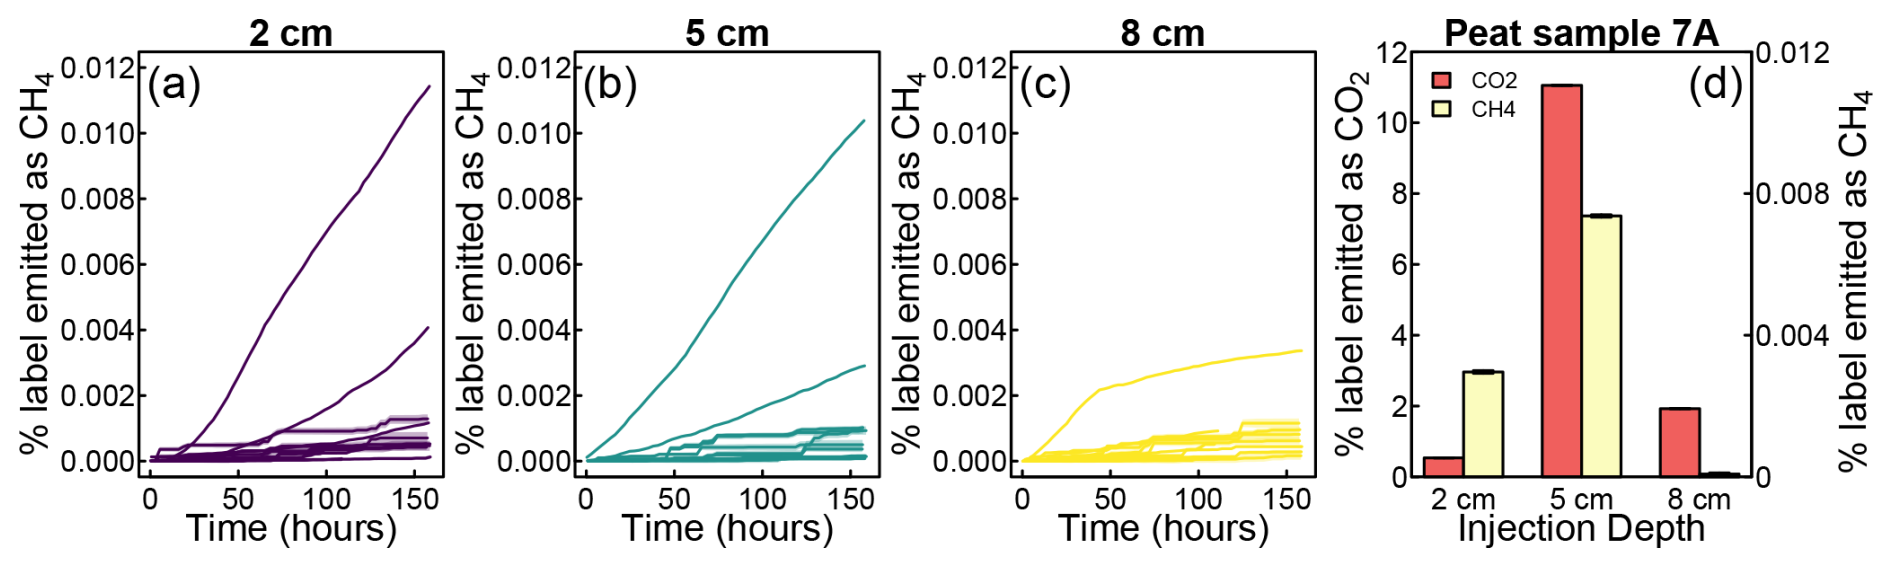
Figure 9Cumulative emissions of label-derived CH4 grouped by injection depth (a–c). A comparison between label-derived CO2 and CH4 emissions after injections at different depths into a peat core sample (d).
Not all label injections into methane-emitting cores resulted in 13CH4 emissions. Rather, we found differences between injections into the same peat core, further highlighting within-core heterogeneity. Injections into one of the peat cores (sample 7A), for example, resulted in the following situations: (1) high 13CH4 with little 13CO2, (2) emissions of both 13CH4 and 13CO2, and (3) only 13CO2 (Fig. 9d). This response was not a simple function of depth – the highest 13CH4 emissions were found after injection at intermediate depths, while the highest CO2 emissions were found after injection into the deepest layer.
4.1 μCT images represent typical peat from peatlands drained for forestry and are suitable for pore network modeling at the low water tensions that prevail at such sites
The structures revealed by μCT imaging of the peat reflect the original plant residues that formed the peat at the site, as well as the changes over time and the effects of site drainage. In forested peatlands, the peat typically contains woody plant fragments and Carex residues, as is the case at Lettosuo. Woody fragments in peat increase spatial heterogeneity with large macropores compared to the more fine-pored and homogeneous Sphagnum-derived peat (McCarter et al., 2020). The presence of dwarf shrub roots and rhizomes likely introduced a looser peat structure and larger macropores. Site drainage, in contrast, enhances peat decomposition, which leads to increasing peat bulk density and a loss of macropore space, particularly in the top layer of the peat (Minkkinen and Laine, 1998). Concurrent with the enhanced decomposition, subsidence, and compaction, a mor humus layer forms on top of the peat (Hökkä et al., 2024). The mor humus layer is mainly formed by litter originating from upland vegetation and might have influenced the top part of the sample, e.g., by forming horizontally layered pore architecture, affecting gaseous diffusion (Ballard, 1970; Laurén and Mannerkoski, 2001).
Scanning whole peat cores with a 100 mm diameter and height required us to limit the measurement resolution to 200 µm. Although we capture only the largest macropores, this enables us to study the architecture of the air-filled pore network that dominates the gas exchange in peat. At the water potential of our samples (−20 hPa), for example, only pores with an equivalent diameter larger than 150 µm are typically air filled. Conversely, the large image domain allowed us to study the long-distance (centimeter-scale) transport of gases throughout the peat cores and properties of the pore network. Our resolution is therefore significantly lower than in other recent studies that focus on anoxic processes in unsaturated mineral soil (e.g., denitrification), where the relevant size is smaller and where researchers have to focus on a more detailed analysis of a smaller image domain. For example, oxygen diffusion was estimated to reach, e.g., a 35 µm distance to the closest pore (Kravchenko et al., 2017).
4.2 Hysteretic behavior during drying and wetting led to distinct water distribution within peat cores and in pore networks with distinct network properties
Our experimental treatments were successful in so far as they allowed us to reach comparable air-filled porosity (indicating similar water content) from drying and wetting directions. Despite this similarity in average moisture content, these treatments led to differences in the water distribution within the cores and the structure of the air-filled pore networks. Drying treatments led to an accumulation of water in the top layers of the peat and in networks with higher coordination numbers and clustering coefficients, while wetting treatments led to an accumulation of water near the bottom of the core and in networks with lower coordination numbers and clustering coefficients.
These results demonstrate the hysteresis during drying and wetting has been studied theoretically (Mualem, 1974) and with models (Ball, 1981; Vidal-Beaudet and Charpentier, 2000) and experimentally at the macroscopic scale (e.g., Chen et al., 2024; Bratbak and Dundas, 1984) and with microtomographic imaging (Pires et al., 2020; Pan et al., 2024; Mady and Shein, 2020; Higo and Kido, 2023). Differences between wetting and drying treatments can be explained by the ink bottle effect (Mualem, 1974): water flow out of peat cores is limited by the smallest throat, while water flow into peat cores is limited by pore size. The representation of these effects in empirically measured pore networks has been evaluated theoretically (Ball, 1981), but this has not been applied to actual μCT-derived pore networks. The differences in pore network structure and within-core water distribution likely affect gas diffusion in the peat core in opposite directions. The higher coordination number and clustering coefficients in drying treatments indicate greater connectivity of the pore space in drying than in wetting treatments, which could lead to higher gas diffusivity in drying cores at a given air-filled porosity. Drying treatments, however, also led to the establishment of a layer with relatively high water content on the top of the peat cores, which may restrict gas exchange between the peat pore network and the atmosphere. We would therefore expect better aeration of the most shallow peat layer (above the depth of most label injections) in wetting treatments but better connectivity between the top and deep peat layers in drying treatments.
It is worth noting that these effects are to some degree specific to our experimental setup, which simulated water movement due to changes in the water table, i.e., changes in the water potential applied at the bottom of the peat core while peat cores were open to air at the surface. Our experiment is therefore not representative of wetting by rainfall, when water infiltrates from the top of the peat column.
Constant background emissions of CO2 and CH4 indicate little overall disturbance due to label injection. All samples emitted (non-labeled) CO2, as is expected from soil samples. With the exception of moderate increases after the third injection round, we did not detect changes in the non-labeled CO2 emissions during the experiment. This indicates that the label injections had only a local impact and did not alter the biogeochemistry elsewhere in the peat cores. The slight increase in CO2 emissions after the third injection round indicates minor stimulation of microbial activity after prolonged exposure to incubation conditions, i.e., higher temperature during the experiment (13–20 °C) than the storage temperature prior to the experiment (4 °C). Nevertheless, the magnitude (<20 %) of this disturbance was limited and acceptable in an experiment that was not designed to exactly replicate field conditions.
The absence of methane emissions from most peat samples was consistent with the field environment where they were collected: a drained peatland that currently acts as a net sink of methane (Korkiakoski et al., 2020). The water potential in our experiment (−20 hPa) was comparable to the location of the water table (−40 to −30 cm) relative to the sampling depths (−15 to −25 cm). Our results thus indicate the presence of individual methane-emitting locations within a larger methane-consuming stand. The trend towards higher methane emissions in the wetting compared to the drying treatment is interesting, as it indicates higher methane emissions in peat cores that have been exposed to more oxic conditions prior to the experiment. This may have been caused by the release of more labile substrates during aerobic episodes, which can then be utilized by methanogens during the following wetting. Peat cores in the wetting treatments also exhibited more poorly connected pore networks and higher pore numbers and pore volumes not connected to the main pore network. This makes the presence of anaerobic pockets more likely in wetting than in drying treatments, even though both treatments had comparable overall air-filled porosity (Kiuru et al., 2022a).
4.3 Label injections allow visualizing differences in biogeochemical transformations
A novel aspect of our work was our attempt to directly demonstrate the spatial heterogeneity in biogeochemical transformation rates by injecting a 13C-labeled substrate at specific locations in the peat core and then following the release of 13CO2 and 13CH4 into the headspace. Our automated measurement setup with a cavity ring-down spectroscopy (CRDS) online isotope analyzer allowed for the simultaneous and continuous monitoring of these emissions in 14 replicate cores. With this experiment, we provide an approach to study the heterogeneity in biogeochemical transformation that can provide information that is complementary to other methods like zygometry (Kim et al., 2021, 2022), microsensors (Rohe et al., 2021; Kim et al., 2021), or the correlative analyses of pore network properties with macroscopic measures like greenhouse gas fluxes (Ortega-Ramírez et al., 2023; Rohe et al., 2021; Du et al., 2023). Our approach complements these methods by allowing for a direct quantification of the local (potential) biogeochemical process rate rather than the local chemical environment (e.g., the local redox conditions in microsensor measurements). Our method differs from zygometry in that it is relatively non-invasive and can be repeated within a given soil sample through multiple label injections at the same or different locations.
Our results show that the injection of 10 µmol of 13C2-labeled acetate was sufficient to produce a strong 13CO2 signal in all peat cores without significantly altering the background CO2 emissions, indicating little impact outside the immediate injection location. It is worth noting that we applied the label in a relatively large volume of water (1 mL), which limited the spatial resolution of our experiments to the centimeter scale. For better spatial resolution, future experiments should reduce this volume. This will, however, require balancing the introduction of a sufficient label amount to produce detectable 13CO2 fluxes whilst avoiding increasing the substrate concentration at the point of injection. The relatively low resolution means that our approach is likely of greater use for visualizing CO2 and CH4 production organic soils with heterogeneity at the millimeter to centimeter scale, compared to N2O production in mineral soil where small-scale structures (tens of micrometers) are of great importance for local oxygen availability (Kravchenko et al., 2017).
We originally aimed at identifying the local environment at the injection locations in μCT images and pore networks, but we were unable to consistently identify these locations due to the poor visibility of our markers (wooden toothpicks) in μCT images. We can therefore only compare GHG emissions to properties at the scale of the scanned peat cores, as we were not able to study the local environment at the very location of each injection. Such characterization of local injection environments is a future direction of development for this method.
4.4 Differences in the amount and timing of label-derived CO2 release between injection depths indicate differences in biogeochemical process rates rather than differences in gas transport
Our finding of systematic differences in the amount of label-derived CO2 emissions after injections at different depths may have resulted from two processes. First, microorganisms might be more active in shallow layers than in deep layers, thus producing more 13CO2 during the duration of the experiment. This represents the local biogeochemical heterogeneity we intended to measure. Second, the greater distance to the surface from deeper layers means that microorganisms could have produced the same amount of 13CO2 after all injections, but when injections were conducted at a greater depth, less would have reach the headspace before the end of the experiment. This would be a confounding effect in our measurements. This confounding effect, however, was likely small in our experiments as gas diffusion is relatively fast at the range of air-filled porosity present in our study (1 %–5 %) (e.g., Bartholomeus et al., 2008). Previous measurements in peat cores collected at the same site and depths and at comparable water potential (−30 to −10 hPa) found gas diffusivities between and (Kiuru et al., 2022b), corresponding to diffusion lengths of between 8.8 and 19.6 cm over one measurement cycle (160 min), i.e., larger than our peat cores. It is therefore unlikely that the lower amount of label-derived CO2 emitted after deeper injection was driven by limited diffusion out of the peat core. This is further supported by the time courses of CO2 release from 8 cm deep injections, which in many cases had their maxima within the first half of the experiment (Fig. 6c). Further evidence is provided from the independence between the amount and timing of label-derived CO2 emissions between moisture treatments. While both treatments show less label-derived emissions after injections at greater depth (Fig. 8a and b), only peat cores from the drying treatment showed that these emissions occurred more slowly at greater depths (Fig. 8c and d). If differences in the amount of label-derived CO2 emissions were driven by a delay due to the diffusion distance, we would expect a similar response of these two measures in the two treatments. Given this evidence, we are confident that the measured differences in the amount and timing of label-derived CO2 emissions represent differences in microbial activities rather than differences in gas transport.
Our finding of different amounts of label-derived CO2 emissions after injections at different depths therefore indicates vertical differences in (potential) microbial activity within the peat core, with greater activity in layers located closer to the surface. Such a greater activity could be a result of higher oxygen availability in layers with better connection to the peat surface. The activity we measured should be considered potential activity as we likely significantly increased the local substrate concentrations at the point of injection (injected concentration 240 mg C L−1) and because the higher activities in shallow layers have been limited by local substrate depletion. Nevertheless, the difference is quite stark, with a ca. 5-fold higher respiration activity at 8 cm than at 2 cm. These results thus suggest a high spatial heterogeneity in the (background) respiration in peat cores – most CO2 is derived from the peat layer closest to the surface. This challenges the assumption made in most experiments with peat columns that microbial processes occur homogeneously throughout the peat column.
The different depth effects on the timing of 13CO2 emissions from drying and wetting peat cores suggest that microorganisms respond more slowly to a sudden increase in (labeled) substrate availability. This was likely due to lower overall activity in drying treatments, which were characterized by particularly high water content in deep layers, suggesting that oxygen availability was relatively low in the deep layers. This is also supported by the (non-significant) trend towards higher (non-labeled) methane emissions in the wetting than in the drying peat cores.
4.5 Methanogenesis exhibits high spatial heterogeneity
Our finding of highly heterogeneous 13CH4 emissions shows that methane production varied both at the scale of tens of centimeters (replicate injections into the same core gave similar responses) and at the centimeter scale (contrasting results from injections into the same peat core). This highlights the great heterogeneity in peat at sub-site scales. It also indicates the presence of methane-generating and non-methane-generating locations within peat cores, likely corresponding to the oxic and anoxic microsites (Fan et al., 2014). The tracing of label-derived CH4 in our study remained associated with some important limitations. First, we measured 13CH4 emissions, which differ from 13CH4 production. It is likely that the anaerobic pockets where 13CH4 is formed are poorly connected to the surface and that the formed 13CH4 may not reach the sample headspace. Indeed, most 13CH4 emissions time series (Fig. 7a–c) showed continuous emissions over the whole duration of the experiment, unlike 13CO2 emissions, which often decreased after 24–48 h (Fig. 6). This may indicate that acetoclastic methanogenesis occurs more slowly than heterotrophic respiration, consistent with the slower nature of anaerobic metabolisms. It may also indicate that 13CH4, once formed in anaerobic pockets with poor connectivity to the peat surface, reaches the sample surface more slowly than CO2. Another limitation is that we cannot exclude that 13CH4 formed at the site of the label injection is oxidized by methanotrophs prior to reaching the peat surface.
4.6 Air-filled porosity has a stronger impact on biogeochemical process rates compared to pore network metrics
We found no correlation between air-filled porosity and the amount of label-derived CO2 emitted after injections, but greater air-filled porosity was associated with more rapid emissions of 13CO2 (lower ) at all injection depths (Fig. 10). We also tested for correlations between these measures and pore network metrics (Fig. S2 in the Supplement). Again, we found no correlation between the analyzed metrics and the fraction of the label emitted as CO2. The slower release of 13CO2 (higher ) was associated with greater clustering coefficients (8 cm depth) and betweenness centrality (all depths). These metrics, however, were themselves associated with lower air-filled porosity (Table S1 in the Supplement) such that we could not distinguish statistically if the differences in were driven by air-filled porosity per se or the properties of the networks described by the network metrics. Clustering coefficients were negatively correlated with air-filled porosity, unlike in previous studies (Kiuru et al., 2022a). Greater clustering coefficients, however, indicate a greater network connectivity, which would have the opposite effect on the timing of 13CO2 production. In contrast, higher air-filled porosity indicates that a greater part of the peat receives sufficient oxygen to convert the label to CO2 and that such CO2 can diffuse out of the peat column faster. It is therefore likely that air-filled porosity, not the clustering coefficient, was responsible for the observed correlations. Betweenness centrality indicates the probability that a given pore is part of the shortest connection between pores at the top and bottom of the peat core. High betweenness centrality indicates that a small number of pores is essential for air transport through the peat cores and may therefore have contributed to a slower CO2 release.
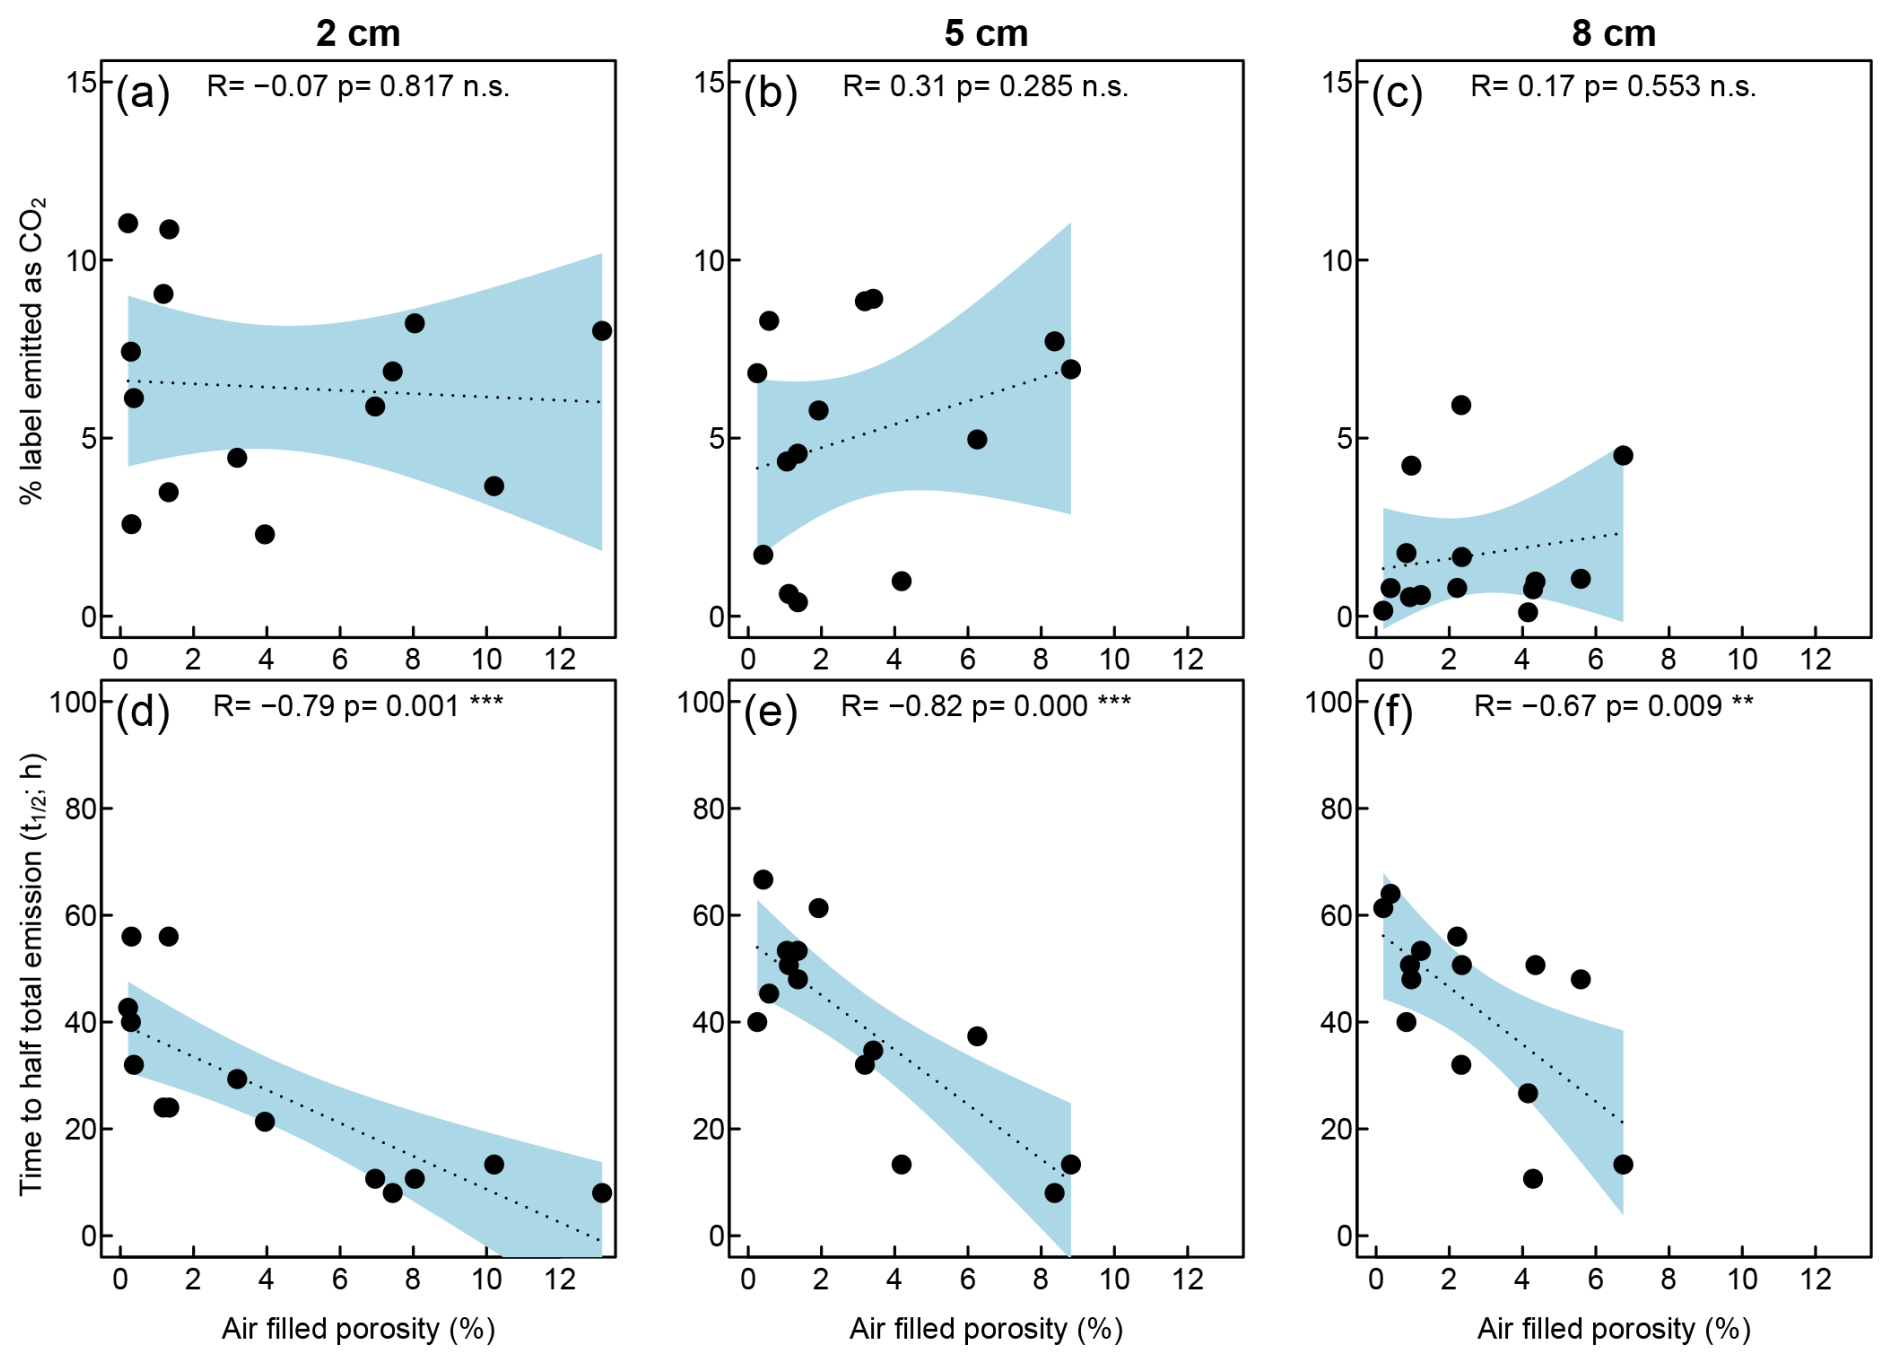
Figure 10Correlations between μCT-derived air-filled porosity measured from the μCT images and the percentage of the label that has been emitted as 13CO2 after injections at depths of 2 cm (a), 5 cm (b), and 8 cm (c). Correlation between air-filled porosity and the time until half of such emission rates had occurred after injections at depths of 2 cm (d), 5 cm (e), and 8 cm (f).
We have established an experimental setup to identify biogeochemical heterogeneity in microenvironments within peat cores that are involved in the production of CO2 and CH4 by combining laboratory-scale manipulation experiments and thorough μCT imaging of relatively large peat cores. μCT imaging has been used before to study physical heterogeneity, but to the best of our knowledge this is the first attempt to directly demonstrate the spatial heterogeneity in (potential) biogeochemical transformation rates through microinjections and monitoring of gas emissions at the peat surface. Our approach is complementary to other recently applied methods, which use microscale measurements by μCT and microsensors to infer soil properties that are then used to explain macroscale properties. In contrast, our approach with locally injected isotope-labeled substrates can help to elucidate distinct biogeochemical transformations, similar to zygometric imaging, but allowing repeated measurements although at lower spatial resolution. The highly variable responses to label injections found in our study demonstrate high biogeochemical heterogeneity at the centimeter scale. Our experiment also highlights the significant challenges associated with such a pursuit. The analysis of the pore network through μCT imaging, which allowed us to study pore network architecture at the scale of fractions of millimeters, could not remove the remaining uncertainties in what governs the spatial heterogeneity in biogeochemical transformations. Nevertheless, our study showed that the biogeochemical heterogeneity observed at a scale of centimeters (injection depths) to tens of centimeters (replicate peat cores from the same pit) was as large as the heterogeneity observed over tens of meters (between pits). Our work thus emphasizes that defining the relevant scale for the investigated processes is of key importance for future studies.
The Python scripts used in the μCT image processing and calculations are available at https://doi.org/10.5281/zenodo.15097314 (Kiuru and Lauren, 2025). The μCT image and binary image data are available from the authors upon reasonable request. Raw data of the labeling experiment and the code used to process them are available from Zenodo (https://doi.org/10.5281/zenodo.11088028, (Kohl, 2024)).
The supplement related to this article is available online at https://doi.org/10.5194/bg-22-1711-2025-supplement.
LK, AL, MP, and MR conceptualized the experiment. LK, AM, and MP collected samples in the field. LK conducted the manipulative experiment. LK processed CO2 and CH4 emission data. PK processed and analyzed μCT images. LK conducted the formal analysis. LK and AL wrote the first draft of the manuscript, which was revised based on input from all co-authors.
The contact author has declared that none of the authors has any competing interests.
Publisher's note: Copernicus Publications remains neutral with regard to jurisdictional claims made in the text, published maps, institutional affiliations, or any other geographical representation in this paper. While Copernicus Publications makes every effort to include appropriate place names, the final responsibility lies with the authors.
We thank Tatu Polvinen for assistance in constructing the measurement system.
This research has been supported by the Academy of Finland (grant nos. 325168, 325169, 339489, and 354501). Annamari Laurén was supported by funding from the Academy of Finland to strengthen university research profiles in Finland for the years 2017–2021 (funding decision 311925). Maarit Raivonen was supported by SRC at the Academy of Finland (SOMPA, grant no. 312932) and EU Horizon 2020 (VERIFY, grant no. 776810). This work used the services of Helsinki University's X-Ray Micro-CT Laboratory, also funded by the Helsinki Institute of Life Science (HiLIFE) under the HAIP platform.
Open-access funding was provided by the Helsinki University Library.
This paper was edited by Steven Bouillon and reviewed by two anonymous referees.
Ball, B.: Modelling of soil pores as tubes using gas permeabilities, gas diffusivities, and water release, J. Soil Sci., 32, 465–481, https://doi.org/10.1111/j.1365-2389.1981.tb01723.x, 1981. a, b
Ballard, T. M.: Gaseous diffusion evaluation in forest humus, Soil Sci. Soc. Am. J., 34, 532–533, https://doi.org/10.2136/SSSAJ1970.03615995003400030046X, 1970. a
Bartholomeus, R. P., Witte, J. P. M., van Bodegom, P. M., van Dam, J. C., and Aerts, R.: Critical soil conditions for oxygen stress to plant roots: substituting the Feddes-function by a process-based model, J. Hydrol., 360, 147–165, https://doi.org/10.1016/J.JHYDROL.2008.07.029, 2008. a
Boon, A., Robinson, J. S., Nightingale, P. D., Cardenas, L., Chadwick, D. R., and Verhoef, A.: Determination of the gas diffusion coefficient of a peat grassland soil, Eur. J. Soil Sci., 64, 681–687, https://onlinelibrary.wiley.com/doi/full/10.1111/ejss.12056, 2013. a
Bratbak, G. and Dundas, I.: Bacterial dry matter content and biomass estimations, Appl. Environ. Microb., 48, 755–757, 1984. a
Chen, K., He, X., Liang, F., and Sheng, D.: Influences of ink-bottle effect evolution on water retention hysteresis of unsaturated soils: an experimental investigation, Eng. Geol., 330, 107409, https://doi.org/10.1016/J.ENGGEO.2024.107409, 2024. a
Du, Y., Guo, S., Wang, R., Song, X., and Ju, X.: Soil pore structure mediates the effects of soil oxygen on the dynamics of greenhouse gases during wetting–drying phases, Sci. Total Environ., 895, 165192, https://doi.org/10.1016/J.SCITOTENV.2023.165192, 2023. a, b
Elkhoury, J. E., Shankar, R., and Ramakrishnan, T. S.: Resolution and limitations of X-Ray micro-CT with applications to sandstones and limestones, Transport Porous Med., 129, 413–425, https://doi.org/10.1007/s11242-019-01275-1, 2019. a
Frolking, S., Talbot, J., Jones, M. C., Treat, C. C., Kauffman, J. B., Tuittila, E. S., and Roulet, N.: Peatlands in the Earth's 21st century climate system, Environ. Rev., 19, 371–396, https://doi.org/10.1139/a11-014, 2011. a
Gorham, E.: Northern Peatlands: role in the carbon cycle and probable responses to climatic warming, Ecol. Appl., 1, 182–195, https://doi.org/10.2307/1941811, 1991. a
Gostick, J., Aghighi, M., Hinebaugh, J., Tranter, T., Hoeh, M. A., Day, H., Spellacy, B., Sharqawy, M. H., Bazylak, A., Burns, A., Lehnert, W., and Putz, A.: OpenPNM: a pore network modeling package, Comput. Sci. Eng., 18, 60–74, https://doi.org/10.1109/MCSE.2016.49, 2016. a
Gostick, J. T.: Versatile and efficient pore network extraction method using marker-based watershed segmentation, Phys. Rev. E, 96, 023307, https://doi.org/10.1103/PhysRevE.96.023307 2017. a
Gostick, J. T., Khan, Z. A., Tranter, T. G., Kok, M. D., Agnaou, M., Sadeghi, M., and Jervis, R.: PoreSpy: a Python toolkit for quantitative analysis of porous media images, Journal of Open Source Software, 4, 1296, https://doi.org/10.21105/JOSS.01296, 2019. a
Hagedorn, G., Mietchen, D., Morris, R., Agosti, D., Penev, L., Berendsohn, W., and Hobern, D.: Creative Commons licenses and the non-commercial condition: implications for the re-use of biodiversity information, ZooKeys, 150, 127, https://doi.org/10.3897/zookeys.150.2189, 2011. a
Hamamoto, S., Dissanayaka, S. H., Kawamoto, K., Nagata, O., Komtatsu, T., and Moldrup, P.: Transport properties and pore-network structure in variably-saturated Sphagnum peat soil, Eur. J. Soil Sci., 67, 121–131, https://doi.org/10.1111/EJSS.12312, 2016. a
Higo, Y. and Kido, R.: A microscopic interpretation of hysteresis in the water retention curve of sand, Geotechnique, https://doi.org/10.1680/jgeot.23.00084, in print, 2023. a
Hökkä, H., Palviainen, M., Stenberg, D., Heikkinen, J., and Laurén, A.: Changing role of water table and weather conditions in diameter growth of Scots pine on drained peatlands, Can. J. Forest Res., 55, 1–12, https://doi.org/10.1139/cjfr-2024-0011, 2024. a
Jokinen, P., Pirinen, P., Kaukoranta, J.-P., Kangas, A., Alenius, P., Eriksson, P., Johansson, M., and Wilkman, S.: Climatological and oceanographic statistics of Finland 1991–2020, Tech. rep., Finnish Meteorological Institute, https://doi.org/10.35614/ISBN.9789523361485, 2021. a
Keiluweit, M., Gee, K., Denney, A., and Fendorf, S.: Anoxic microsites in upland soils dominantly controlled by clay content, Soil Biol. Biochem., 118, 42–50, https://doi.org/10.1016/J.SOILBIO.2017.12.002, 2018. a
Kim, K., Kutlu, T., Kravchenko, A., and Guber, A.: Dynamics of N2O in vicinity of plant residues: a microsensor approach, Plant Soil, 462, 331–347, https://doi.org/10.1007/S11104-021-04871-7, 2021. a, b, c, d
Kim, K., Gil, J., Ostrom, N. E., Gandhi, H., Oerther, M. S., Kuzyakov, Y., Guber, A. K., and Kravchenko, A. N.: Soil pore architecture and rhizosphere legacy define N2O production in root detritusphere, Soil Biol. Biochem., 166, 108565, https://doi.org/10.1016/J.SOILBIO.2022.108565, 2022. a, b
King, J. A. and Smith, K. A.: Gaseous diffusion through peat, J. Soil Sci., 38, 173–177, https://doi.org/10.1111/j.1365-2389.1987.tb02134.x, 1987. a
Kiuru, P. and Lauren, A.: Processing scripts for research article “Exploring microscale heterogeneity as a driver of biogeochemical transformations and gas transport in peat”, Zenodo [data set], https://doi.org/10.5281/zenodo.15097314, 2025. a
Kiuru, P., Palviainen, M., Grönholm, T., Raivonen, M., Kohl, L., Gauci, V., Urzainki, I., and Laurén, A.: Peat macropore networks – new insights into episodic and hotspot methane emission, Biogeosciences, 19, 1959–1977, https://doi.org/10.5194/bg-19-1959-2022, 2022a. a, b, c, d
Kiuru, P., Palviainen, M., Marchionne, A., Grönholm, T., Raivonen, M., Kohl, L., and Laurén, A.: Pore network modeling as a new tool for determining gas diffusivity in peat, Biogeosciences, 19, 5041–5058, https://doi.org/10.5194/bg-19-5041-2022, 2022b. a, b, c
Kohl, L.: Exploring micro-scale heterogeneity as a driver of biogeochemical transformations and gas transport in peat – raw data and code, Zenodo [data set and code] https://doi.org/10.5281/zenodo.11088028, 2024. a
Korkiakoski, M., Ojanen, P., Penttilä, T., Minkkinen, K., Sarkkola, S., Rainne, J., Laurila, T., and Lohila, A.: Impact of partial harvest on CH4 and N2O balances of a drained boreal peatland forest, Agr. Forest Meteorol., 295, 108168, https://doi.org/10.1016/J.AGRFORMET.2020.108168, 2020. a
Kravchenko, A. N., Toosi, E. R., Guber, A. K., Ostrom, N. E., Yu, J., Azeem, K., Rivers, M. L., and Robertson, G. P.: Hotspots of soil N2O emission enhanced through water absorption by plant residue, Nat. Geosci., 10, 496–500, https://doi.org/10.1038/ngeo2963, 2017. a, b, c, d
Laine, J. and Vasander, H.: Ecology and vegetation gradients of peatlands, in: Peatlands in Finland, edited by: Vasander, H., Finnish Peatland Society, Jyvaskyla, 10–19, ISBN 952-90-7971-0, 1996. a
Laurén, A. and Mannerkoski, H.: Hydraulic Properties of Mor Layers in Finland, Scand. J. Forest Res., 16, 429–441, https://doi.org/10.1080/02827580152632829, 2001. a
Leifeld, J., Wüst-Galley, C., and Page, S.: Intact and managed peatland soils as a source and sink of GHGs from 1850 to 2100, Nat. Clim. Change, 9, 945–947, https://doi.org/10.1038/s41558-019-0615-5, 2019. a
Limpens, J., Berendse, F., Blodau, C., Canadell, J. G., Freeman, C., Holden, J., Roulet, N., Rydin, H., and Schaepman-Strub, G.: Peatlands and the carbon cycle: from local processes to global implications – a synthesis, Biogeosciences, 5, 1475–1491, https://doi.org/10.5194/bg-5-1475-2008, 2008. a
Mady, A. Y. and Shein, E. V.: Assessment of pore space changes during drying and wetting cycles in hysteresis of soil water retention curve in Russia using X-ray computed tomography, Geoderma Regional, 21, e00259, https://doi.org/10.1016/J.GEODRS.2020.E00259, 2020. a
McCarter, C. P., Rezanezhad, F., Quinton, W. L., Gharedaghloo, B., Lennartz, B., Price, J., Connon, R., and Van Cappellen, P.: Pore-scale controls on hydrological and geochemical processes in peat: implications on interacting processes, Earth-Sci. Rev., 207, 103227, https://doi.org/10.1016/J.EARSCIREV.2020.103227, 2020. a, b, c, d
Minkkinen, K. and Laine, J.: Effect of forest drainage on the peat bulk density of pine mires in Finland, Can. J. Forest Res., 28, 178–186, https://doi.org/10.1139/x97-206, 1998. a
Mualem, Y.: A conceptual model of hysteresis, Water Resour. Res., 10, 514–520, https://doi.org/10.1029/WR010I003P00514, 1974. a, b
Ortega-Ramírez, P., Pot, V., Laville, P., Schlüter, S., Amor-Quiroz, D. A., Hadjar, D., Mazurier, A., Lacoste, M., Caurel, C., Pouteau, V., Chenu, C., Basile-Doelsch, I., Henault, C., and Garnier, P.: Pore distances of particulate organic matter predict N2O emissions from intact soil at moist conditions, Geoderma, 429, 116224, https://doi.org/10.1016/J.GEODERMA.2022.116224, 2023. a, b
Otsu, N.: Threshold selection method from gray-level histograms, IEEE T. Syst. Man. Cyb., SMC-9, 62–66, 1979. a
Pan, G. F., Zheng, Y. X., Yuan, S. Y., Sun, D. X., Buzzi, O., Jiang, G. L., and Liu, X. F.: Microstructural insight into the hysteretic water retention behavior of intact Mile expansive clay, Soils Found., 64, 101427, https://doi.org/10.1016/J.SANDF.2024.101427, 2024. a
Pires, L. F., Auler, A. C., Roque, W. L., and Mooney, S. J.: X-ray microtomography analysis of soil pore structure dynamics under wetting and drying cycles, Geoderma, 362, 114103, https://doi.org/10.1016/J.GEODERMA.2019.114103, 2020. a
R Development Core Team: R: A Language and Environment for Statistical Computing, http://www.r-project.org (last access: 26 March 2025), 2015. a
Ramirez, J. A., Baird, A. J., and Coulthard, T. J.: The effect of pore structure on ebullition from peat, J. Geophys. Res.-Biogeo., 121, 1646–1656, https://doi.org/10.1002/2015JG003289, 2016. a
Rohe, L., Apelt, B., Vogel, H.-J., Well, R., Wu, G.-M., and Schlüter, S.: Denitrification in soil as a function of oxygen availability at the microscale, Biogeosciences, 18, 1185–1201, https://doi.org/10.5194/bg-18-1185-2021, 2021. a, b, c, d
Schlüter, S., Henjes, S., Zawallich, J., Bergaust, L., Horn, M., Ippisch, O., Vogel, H. J., and Dörsch, P.: Denitrification in soil aggregate analogues-effect of aggregate size and oxygen diffusion, Frontiers in Environmental Science, 6, 358214, https://doi.org/10.3389/FENVS.2018.00017, 2018. a
Sihi, D., Davidson, E. A., Savage, K. E., and Liang, D.: Simultaneous numerical representation of soil microsite production and consumption of carbon dioxide, methane, and nitrous oxide using probability distribution functions, Glob. Change Biol., 26, 200–218, https://doi.org/10.1111/GCB.14855, 2020. a
Stock, S. R.: Recent advances in X-ray microtomography applied to materials, International Materials Reviews, 53, 129–181, https://doi.org/10.1179/174328008X277803, 2008. a
Van Der Walt, S., Schönberger, J. L., Nunez-Iglesias, J., Boulogne, F., Warner, J. D., Yager, N., Gouillart, E., and Yu, T.: Scikit-image: Image processing in python, PeerJ, 2014, e453, https://doi.org/10.7717/PEERJ.453/FIG-5, 2014. a
Vidal-Beaudet, L. and Charpentier, S.: Percolation Theory and Hydrodynamics of Soil-Peat Mixtures, Soil Sci. Soc. Am. J., 64, 827–835, https://doi.org/10.2136/SSSAJ2000.643827X, 2000. a
Virtanen, P., Gommers, R., Oliphant, T. E., Haberland, M., Reddy, T., Cournapeau, D., Burovski, E., Peterson, P., Weckesser, W., Bright, J., van der Walt, S. J., Brett, M., Wilson, J., Millman, K. J., Mayorov, N., Nelson, A. R., Jones, E., Kern, R., Larson, E., Carey, C. J., Polat, I., Feng, Y., Moore, E. W., VanderPlas, J., Laxalde, D., Perktold, J., Cimrman, R., Henriksen, I., Quintero, E. A., Harris, C. R., Archibald, A. M., Ribeiro, A. H., Pedregosa, F., van Mulbregt, P., Vijaykumar, A., Bardelli, A. P., Rothberg, A., Hilboll, A., Kloeckner, A., Scopatz, A., Lee, A., Rokem, A., Woods, C. N., Fulton, C., Masson, C., Häggström, C., Fitzgerald, C., Nicholson, D. A., Hagen, D. R., Pasechnik, D. V., Olivetti, E., Martin, E., Wieser, E., Silva, F., Lenders, F., Wilhelm, F., Young, G., Price, G. A., Ingold, G. L., Allen, G. E., Lee, G. R., Audren, H., Probst, I., Dietrich, J. P., Silterra, J., Webber, J. T., Slavič, J., Nothman, J., Buchner, J., Kulick, J., Schönberger, J. L., de Miranda Cardoso, J. V., Reimer, J., Harrington, J., Rodríguez, J. L. C., Nunez-Iglesias, J., Kuczynski, J., Tritz, K., Thoma, M., Newville, M., Kümmerer, M., Bolingbroke, M., Tartre, M., Pak, M., Smith, N. J., Nowaczyk, N., Shebanov, N., Pavlyk, O., Brodtkorb, P. A., Lee, P., McGibbon, R. T., Feldbauer, R., Lewis, S., Tygier, S., Sievert, S., Vigna, S., Peterson, S., More, S., Pudlik, T., Oshima, T., Pingel, T. J., Robitaille, T. P., Spura, T., Jones, T. R., Cera, T., Leslie, T., Zito, T., Krauss, T., Upadhyay, U., Halchenko, Y. O., and Vázquez-Baeza, Y.: SciPy 1.0: fundamental algorithms for scientific computing in Python, Nat. Methods, 17, 261–272, https://doi.org/10.1038/s41592-019-0686-2, 2020. a
Wachinger, G., Fiedler, S., Zepp, K., Gattinger, A., Sommer, M., and Roth, K.: Variability of soil methane production on the micro-scale: spatial association with hot spots of organic material and Archaeal populations, Soil Biol. Biochem., 32, 1121–1130, https://doi.org/10.1016/S0038-0717(00)00024-9, 2000. a
Wright, W., Ramirez, J. A., and Comas, X.: Methane Ebullition From Subtropical Peat: Testing an Ebullition Model Reveals the Importance of Pore Structure, Geophys. Res. Lett., 45, 6992–6999, https://doi.org/10.1029/2018GL077352, 2018. a
Xu, X., Yuan, F., Hanson, P. J., Wullschleger, S. D., Thornton, P. E., Riley, W. J., Song, X., Graham, D. E., Song, C., and Tian, H.: Reviews and syntheses: Four decades of modeling methane cycling in terrestrial ecosystems, Biogeosciences, 13, 3735–3755, https://doi.org/10.5194/bg-13-3735-2016, 2016. a
Yu, Z., Peng, P., Sheng, G., and Fu, J.: Determination of hexabromocyclododecane diastereoisomers in air and soil by liquid chromatography-electrospray tandem mass spectrometry, J. Chromatogr. A, 1190, 74–79, https://doi.org/10.1016/j.chroma.2008.02.082, 2008. a