the Creative Commons Attribution 4.0 License.
the Creative Commons Attribution 4.0 License.
 | 25 Apr 2025
Detection of fast-changing intra-seasonal vegetation dynamics of drylands using solar-induced chlorophyll fluorescence (SIF)
Giulia Tagliabue
Micol Rossini
Francesco Pietro Fava
Cinzia Panigada
Lutz Merbold
Sonja Leitner
Dryland ecosystems are the habitat supporting 2 billion people on Earth, and they strongly impact the global terrestrial carbon sink. Vegetation growth in drylands is mainly controlled by water availability with strong intra-seasonal variability. Timely availability of information at such scales (e.g., from days to weeks) is essential for early warning of potential catastrophic impacts of emerging climate extremes on crops and natural vegetation. However, the large-scale monitoring of intra-seasonal vegetation dynamics has been very challenging for drylands. Satellite solar-induced chlorophyll fluorescence (SIF) has emerged as a promising tool to characterize the spatiotemporal dynamics of photosynthetic carbon uptake and has the potential to detect intra-seasonal vegetation growth dynamics. However, few studies have evaluated its capability of detecting fast-changing intra-seasonal vegetation dynamics and advantages over traditional approaches in drylands based on vegetation indices (VIs). To fill this knowledge gap, this study utilized the vast dryland ecosystems in the Horn of Africa (HoA) as a testbed to characterize their intra-seasonal dynamics inferred from satellite SIF. The HoA is an ideal testbed because its dryland ecosystems have highly dynamic responses to short-term environmental changes. The satellite-data-based analysis was corroborated with a unique in situ SIF dataset collected in Kenya – so far, the only ground SIF time series collected on the continent of Africa. We found that SIF from the TROPOspheric Monitoring Instrument (TROPOMI) with daily revisit frequency identified highly dynamic week-to-week variations in both shrublands and grasslands; such rapidly changing vegetation dynamics corresponded to the up- and downregulation by the fluctuations in environmental variables (e.g., air temperature, vapor pressure deficit, soil moisture). However, neither reconstructed SIF products nor near-infrared reflectance of terrestrial vegetation (NIRv) from the Moderate Resolution Imaging Spectroradiometer (MODIS), which is widely used in the literature, was able to capture such fast-changing intra-seasonal variations. The same findings hold at the site scale, where we found that only TROPOMI SIF revealed two separate within-season growth cycles in response to extreme soil moisture and rainfall amount and duration, consistent with in situ SIF measurements. This study generates novel insights on the monitoring of dryland vegetation dynamics and the evaluation of their climate sensitivities, enabling the development of predictive and scalable understanding of how dryland ecosystems may respond to future climate change and informing the future design of effective vegetation monitoring systems for dryland vegetation.
- Article
(6211 KB) - Full-text XML
-
Supplement
(2188 KB) - BibTeX
- EndNote


Drylands account for about 41 % of the total terrestrial land surface and play a critical role in maintaining ecological functions and services, regulating global carbon cycles, and contributing to socio-economic wellbeing (Prăvălie, 2016; Poulter et al., 2014; Ahlström et al., 2015; Piao et al., 2020; Yao et al., 2020). In particular, drylands have expanded globally in recent decades (Lian et al., 2021) and are projected to continue expanding in the future (Huang et al., 2015). Therefore, it is of critical importance to understand how dryland ecosystems respond to ongoing and future climate change for the sake of human welfare (Huang et al., 2017; Smith et al., 2018; Zhang et al., 2020a, 2022; Wang et al., 2022a).
Vegetation growth in drylands is mainly controlled by water availability with strong intra-seasonal variability. Monitoring vegetation dynamics at the intra-seasonal scale (e.g., from days to weeks) is critical for understanding climate impacts on carbon dynamics, detecting plant early stress, and informing climate risk management (Otkin et al., 2018; Qing et al., 2022; Gerhards et al., 2019), as dryland ecosystems exhibit hyper-complex and rapid physiological/phenological dynamics at short timescales (Adams et al., 2021; Wang et al., 2022a). To do this, the timely availability of information at such scales is crucial. However, for multiple reasons, intra-seasonal dynamics can be more challenging to monitor than trends at longer timescales, such as inter-seasonal or inter-annual variations. Firstly, the former characterizes variations that are mainly driven by changes in vegetation function (i.e., leaf physiology, such as photosystem redox states, nonphotochemical quenching, and electron transport rate, all of which affect the efficiency of light use) (Gu et al., 2019; Han et al., 2022; Sun et al., 2023a), while the latter characterizes variations that are largely driven by changes in vegetation structure (e.g., leaf area, leaf angle, or pigment content, all of which affect light absorption and scattering) (Li et al., 2024). Secondly, the time window is shorter for the former than for the latter, with less observation sampling for accurate depiction of temporal dynamics. Consequently, detecting fast-changing intra-seasonal vegetation dynamics for early warning purposes requires high-frequency observations that are sensitive to dryland functional changes.
Greenness-based vegetation indices (VIs), such as the Normalized Difference Vegetation Index (Tucker, 1979) and near-infrared reflectance of terrestrial vegetation (NIRv; Badgley et al., 2017), from Earth observation (EO) satellites, have been used for vegetation monitoring for decades (Qu et al., 2019; Lawal et al., 2021; Ouma et al., 2022; Fava et al., 2021). For example, NIRvP, the product of NIRv and photosynthetically active radiation (PAR), was found to be a robust structural proxy for photosynthesis (Dechant et al., 2022). In the last decade, solar-induced chlorophyll fluorescence (SIF) has emerged as a promising proxy for inferring photosynthetic dynamics from canopy to global scales (Porcar-Castell et al., 2014; Sun et al., 2023a, b). SIF has unique mechanistic advantages, as it is emitted from the core of the photosynthetic machinery and therefore contains additional functional information (e.g., light use efficiency) beyond structural information (e.g., light absorption) that is usually carried by VIs. In addition, since SIF signal comes only from active vegetation, it is less susceptible to the brightness of soil background, unlike reflectance-based VIs (Huete et al., 2002). These characteristics make SIF a unique observational signal for inferring photosynthetic dynamics for dryland ecosystems. For example, SIF has demonstrated a superior capability in accurately depicting dryland ecosystem phenology (Wang et al., 2019) and in capturing seasonal variations (Wang et al., 2022c) and inter-annual variations (Smith et al., 2018) in in situ gross primary production (GPP). Furthermore, it has facilitated many applications in drought detection and ecosystem restoration in drylands (Robinson et al., 2019; Mengistu et al., 2021; Constenla-Villoslada et al., 2022). However, most of such evaluations were conducted at the seasonal scale or beyond, and very few have been focused on short timescales, e.g., intra-seasonal. We hypothesize that SIF may present more complex intra-seasonal dynamics due to functional changes in response to short-term environmental fluctuations, while NIRv remains relatively constant, as there are minimal structural changes at a temporal scale of several days to weeks, especially during the peak growing season.
To test this hypothesis, we utilized dryland ecosystems in the Horn of Africa (HoA; Fig. 1a) as a testbed to evaluate the capacity of satellite SIF and NIRv in capturing the intra-seasonal vegetation dynamics of drylands. The HoA has experienced frequent droughts and excessive rainfall (Williams et al., 2012; Lyon and Dewitt, 2012; Funk et al., 2015; Ngoma et al., 2021) and has suffered strong vulnerability to climate change (Trisos et al., 2022). The highly dynamic vegetation growth in response to volatile environmental conditions puts millions of pastoralists and smallholder farmers at risk (Matanó et al., 2022) and exacerbates the persistent food insecurity challenges in this region (Pricope et al., 2013; Beal et al., 2023), calling for accurate and prompt vegetation monitoring and early warning systems (Merbold et al., 2021). In particular, in this study, we focused on the period from October 2019 to February 2020, when excessive rainfall occurred on the HoA (Fig. 1e), leading to anomalous vegetation dynamics that are challenging to depict accurately with satellite measurements. We employed multiple high-temporal-resolution satellite SIF products, including original SIF retrievals from the TROPOspheric Monitoring Instrument (TROPOMI; with unprecedented daily revisit frequency for satellite SIF retrieval; Köhler et al., 2018; Guanter et al., 2021), several machine-learning-reconstructed SIF products (at a temporal resolution of 4 to 16 d), and NIRv from the Moderate Resolution Imaging Spectroradiometer (MODIS; at daily resolution), along with a unique ground SIF dataset measured at an environmental research infrastructure site located in Kenya – so far, the only in situ SIF time series reported on the continent of Africa.
This paper is structured as follows: Sect. 2 introduces the region of interest and datasets employed in this study. Section 3 evaluates different satellite SIF products with in situ SIF time series (Sect. 3.1) and investigates the intra-seasonal vegetation dynamics under excessive precipitation at site and regional levels (in Sect. 3.2 and 3.3, respectively). Section 4 discusses possible reasons and implications for discrepancies among different datasets. Section 5 summarizes the conclusions.
2.1 The HoA drylands
The HoA region is located in eastern Africa, including Somalia, Ethiopia, Kenya, Eritrea, and Djibouti, with most area covered by drylands (Fig. 1a). From the eastern coast to the inner highlands, there is a general gradient of increasing water availability (Fig. 1d), which drives a land cover shift from barren areas to shrublands and to grasslands (Fig. 1b), with a corresponding variation in vegetation greenness (Fig. 1c). The HoA is signatured by a short rainy season (SR season; usually from October to the following January, with variations depending on the location) and a long rainy season (LR season; usually from March to June), with two dry seasons in between (Fig. 1h). Vegetation thrives during the rainy seasons and wanes during the dry seasons (Fig. 1f, g). During the short rainy season in 2019 (i.e., October 2019–January 2020), the HoA experienced anomalously high precipitation compared to normal years (Fig. 1e). Altogether, 50 % of the total area had precipitation 2 standard deviations (>2σ) higher than normal years, mostly in the central and southern HoA drylands, and another 39 % of the area had precipitation 1–2 standard deviations (1–2σ) higher than normal years. In this study, we selected three sub-domains of interest to investigate the intra-seasonal vegetation dynamics under excessive precipitation: Region 1 (including eastern Ethiopia and central Somalia, dominated by shrublands), Region 2 (including southern Somalia, dominated by grasslands), and Region 3 (i.e., Kenya, dominated by grasslands) (Fig. 1b). These three sub-domains were selected because, within each sub-domain, (1) the land cover type is relatively homogeneous and (2) the precipitation pattern and vegetation response are relatively consistent (Sect. 3.3).
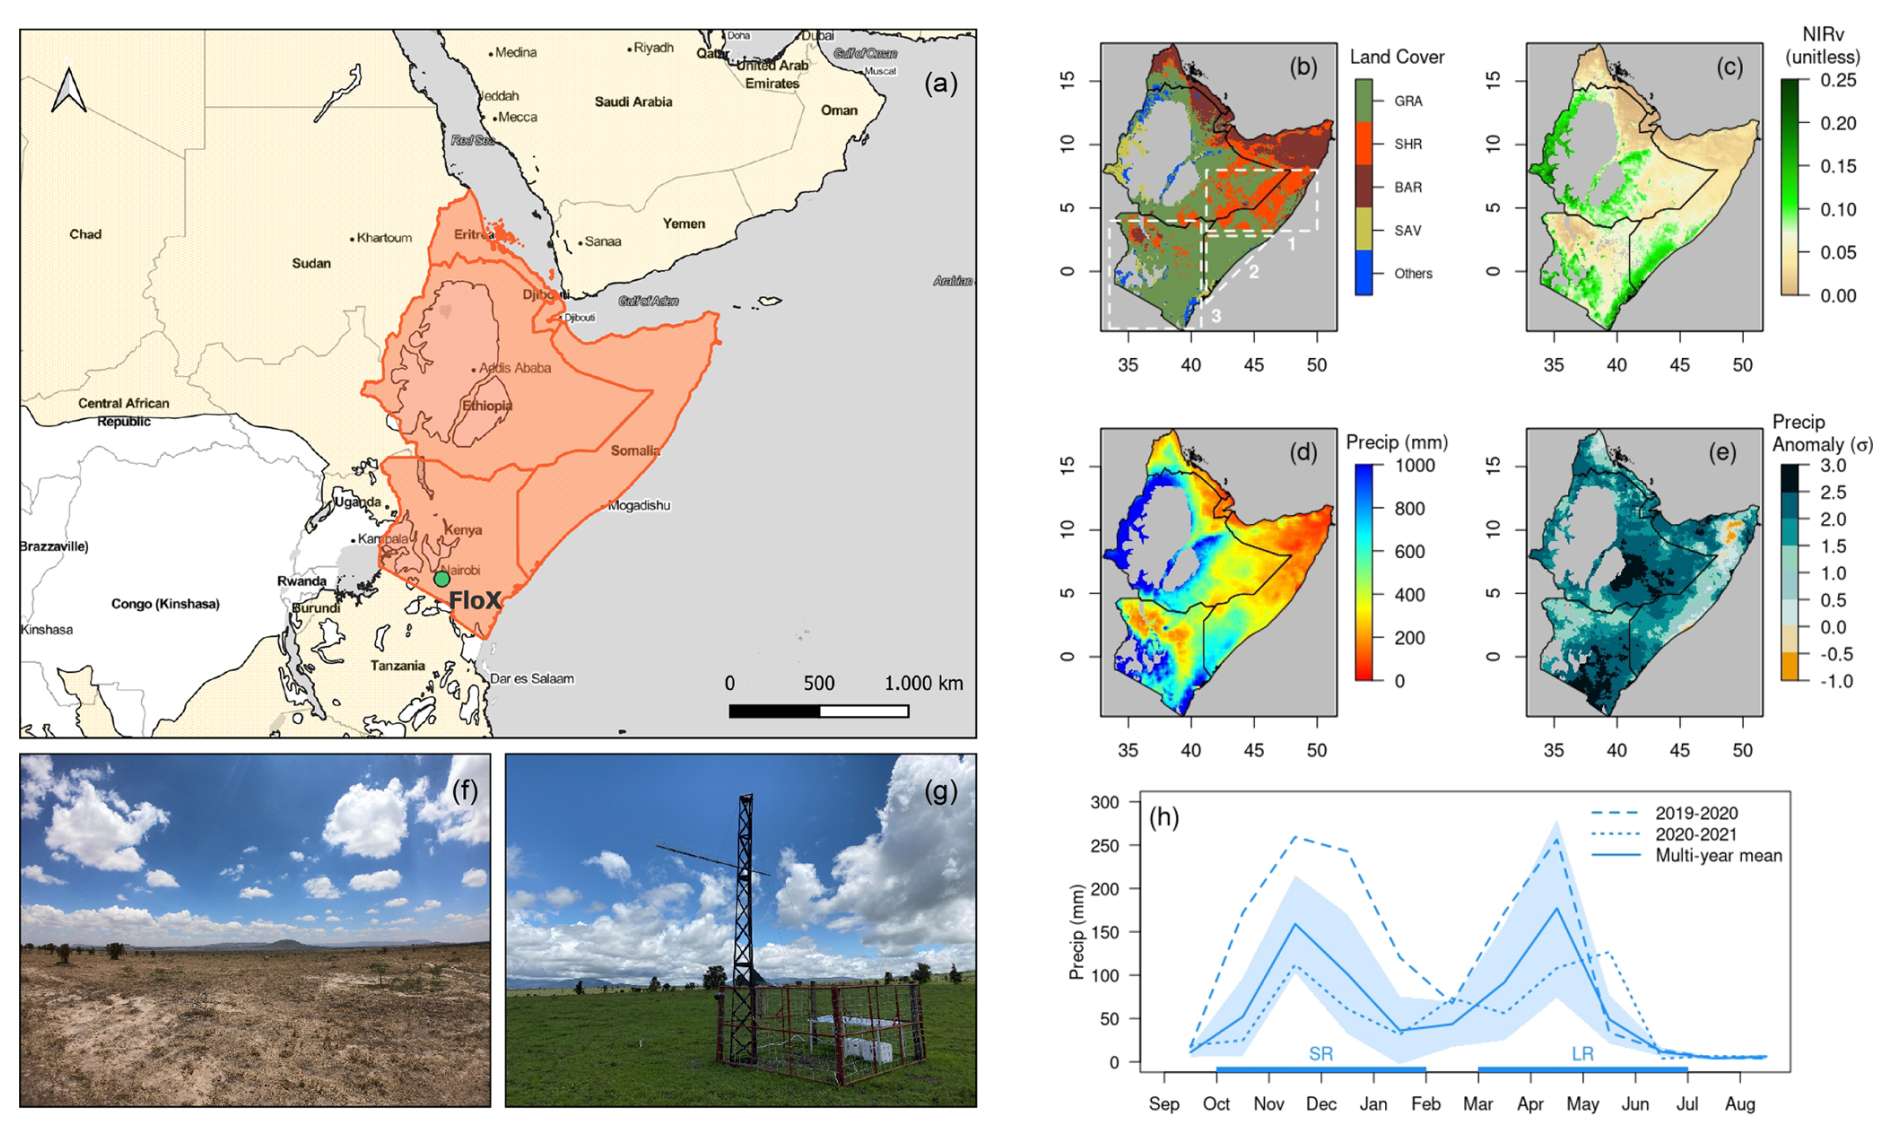
Figure 1(a) Spatial extent of the HoA (orange) and drylands (light yellow), defined as areas where the ratio of precipitation and potential evapotranspiration, i.e., aridity index (AI), is less than 0.65 (Sorensen, 2007). The location of the FloX tower is marked as a green dot. (b) MODIS land cover map (Friedl and Sulla-Menashe 2022) of the HoA in 2019. The land cover categories are grasslands (GRA), shrublands (SHR), barren areas (BAR), savannas (SAV), and others. The three dashed white squares mark the three sub-domains of interest in our regional analysis. (c, d) Spatial maps of the multi-year mean (2011–2020) of near-infrared reflectance of vegetation (NIRv) and annual precipitation (Precip), respectively. (e) Spatial map of the standardized anomaly of precipitation during the SR season in 2019 (from October 2019 to January 2020) relative to the multi-year SR season mean (2011–2020) in the unit of standard deviation σ. (f, g) Pictures of the grasslands at Kapiti where the FloX tower is located, captured before (28 September 2019) and during (26 October 2019) the SR season, respectively. (h) Time series of precipitation at Kapiti during 2019–2020 (dashed) and 2020–2021 (dotted), when in situ SIF was collected, compared to the multi-year mean (2011–2020; solid). The shading denotes 1 standard deviation of monthly precipitation during 2011 and 2020. The lengths of the SR and LR seasons are marked on the x axis in light blue.
2.2 Description of in situ SIF collection: site characteristics, instrumentation, and SIF retrieval algorithms
Site description. The Kapiti Research Station and Wildlife Conservancy (called Kapiti from now on for simplicity) is a research facility owned and managed by the International Livestock Research Institute (ILRI) located in Machakos County, southern Kenya (Fig. 1a). Kapiti, largely characterized by flat or gently sloped topography, covers approximately 13 000 ha and is located at about 1650 m above mean sea level (Dowling et al., 2022; Carbonell et al., 2021). Kapiti is dominated by semi-arid vegetation, including grasses, shrubs, and isolated trees (Fig. 1f, g). The climate is semi-arid with an average annual precipitation of approximately 500 mm distributed among two main rainy seasons (Fig. 1h). However, the mean annual precipitation and the seasonal distribution of precipitation are highly variable, with frequent droughts or excess rain episodes.
In situ instrument. In situ SIF data used in this study were collected from a tower positioned in a flat area of the Kapiti site dominated by open grasslands (1.6144° S, 37.1338° E; Fig. 1a). SIF was measured using the fluorescence box (FloX; JB Hyperspectral Devices GmbH, Germany), an automatic hyperspectral device for the continuous observation of SIF and reflectance. The FloX system consists of two internal spectrometers (Ocean Insight, USA) contained in a temperature-controlled case. The first spectrometer (i.e., QEPro) covers the spectral range 650–800 nm with a full width at half maximum (FWHM) of 0.3 nm and is specifically designed for the retrieval of SIF. The second spectrometer (i.e., FLAME) covers a broader spectral range (400–950 nm) with an FWHM of 1.5 nm and is intended for the observation of reflectance. Each spectrometer measures the downwelling irradiance with an up-looking cosine optic and the upwelling radiance with a down-looking bare optical fiber (25° field of view). The down-looking fibers were placed nadir-looking at a height of 4.5 m above the ground, which corresponds to a footprint of ca. 1.9 m diameter. The system was installed at the Kapiti research site on 25 September 2019 and measured continuously until 31 August 2021.
Processing of in situ SIF. The FloX raw data were processed using a dedicated R script (R Core Team, 2022) developed by the manufacturer (v. 20.7). The processing included the conversion from raw data to radiance using the calibration files of the spectrometers, the retrieval of SIF, the calculation of apparent reflectance, and the computation of quality flags. SIF was retrieved at the O2-A absorption band (i.e., 760 nm) using both the improved Fraunhofer Line Depth (iFLD) method (Alonso et al., 2008) and the Spectral Fitting Method (SFM) (Cogliati et al., 2015), denoted as FloXiFLD SIF and FloXSFM SIF. For the iFLD method, we used the bands at 756.04 and 760.05 nm outside and within the absorption band, respectively, while, for the SFM, we used a fitting window of 750.12–779.90 nm. A multiplicative wavelength conversion factor of 1.72 from Yang et al. (2015) was applied to the retrieved SIF values to allow comparison with satellite SIF datasets derived at 740 nm. The data from both the QEPro and FLAME spectrometers were then filtered to discard low-quality measurements. The filtering criteria were defined as follows: (a) solar zenith angle (SZA) less than 70°, (b) incoming solar radiation variation (i.e., percent difference between the irradiance measurement before and after each target measurement) less than 1 %, (c) dynamic range of the spectrometer between 60 % and 90 %, and (d) clearness index (i.e., the ratio between actual and potential solar irradiance; Chang et al., 2020) between 0.9 and 1.1.
2.3 Satellite vegetation datasets
-
TROPOMI SIF. The TROPOMI instrument on board the Sentinel-5 Precursor (S-5P) satellite was launched in October 2017, with an equatorial overpass time at 13:30 local solar time. It has a spatial resolution of 3.5 × 7.5 km2 (3.5 × 5.5 km2 since August 2019), with a wide swath (∼ 2600 km) that enables daily global coverage (Köhler et al., 2018; Guanter et al., 2021). There are three TROPOMI SIF datasets available: one provided by the California Institute of Technology (Caltech), with a fitting window of 743–758 nm (Köhler et al., 2018), and the other two provided by the European Space Agency (ESA), with fitting windows of 735–758 and 743–758 nm (Guanter et al., 2021). All datasets are retrieved using the singular value decomposition (SVD) approach. We employed two different thresholds of cloud fraction (CF) for SIF intercomparison and intra-seasonal vegetation dynamics analysis, following Guanter et al. (2021): we selected Level 2 SIF retrievals with CF less than 0.2 when we compared TROPOMI SIF with in situ SIF (Sect. 3.1) to minimize the cloud influence on the retrieved SIF; we applied a less strict rule (CF less than 0.8) when we used TROPOMI SIF to evaluate vegetation dynamics (Sect. 3.2 and 3.3) in order to enable a good temporal sampling. Level 2 SIF retrievals with an SZA larger than 70° were excluded. All selected Level 2 SIF retrievals were first converted to daily corrected SIF based on the SZA (Frankenberg et al., 2011) and then regridded to 0.15° pixels using a gridding tool (https://github.com/cfranken/gridding, last access: 27 May 2020). The spatial resolution of 0.15° was selected to include enough soundings for spatial aggregation to reduce measurement noise while maintaining overall representativeness of the area around the tower (Fig. S1).
-
Reconstructed SIF products. CSIF (version 2; Zhang et al., 2018), GOSIF (version 2; Li and Xiao, 2019), and SIF_oco2_005 (updated version based on OCO-2 v10r retrievals; Yu et al., 2019) are reconstructed based on SIF retrievals from OCO-2. OCO-2, launched in 2014, provides SIF retrievals at a resolution of 1.3 × 2.25 km2 with a 16 d revisit cycle and an equatorial overpass time at 13:30 local solar time (Sun et al., 2018). One of the limitations of OCO-2 SIF retrievals is the incomplete global coverage, with large spatial gaps between satellite tracks. The overall strategy for generating these reconstructed SIF products is similar: (1) establishing statistical relationships between available OCO-2 SIF measurements and ancillary variables (e.g., surface reflectance, vegetation indices, meteorological forcings) using machine learning algorithms (e.g., neural networks, cubic regression tree model) and (2) applying the relationship to ancillary variables with global coverage to fill the gaps where OCO-2 retrievals are not available. These three products differ in the choice of machine learning approaches and ancillary variables that were used to generate them. They are provided at a spatial resolution of 0.05° and a temporal resolution of 4, 8, and 16 d, respectively. The three OCO-2-based SIF products (evaluated at 757 nm) were multiplied with a wavelength correction factor of 1.69 to match with TROPOMI SIF (evaluated at 740 nm). In addition, we also employed RTSIF, a recent reconstructed SIF dataset based on TROPOMI SIF (Chen et al., 2022). As TROPOMI SIF has only been available since 2018, Chen et al. (2022) similarly utilized a machine learning algorithm and ancillary datasets to reconstruct a long-term SIF record during 2001–2020 at 0.05° and 8 d resolution.
-
SIF yield. SIF yield carries information on plant physiological/functional variations in response to environmental changes (Sun et al., 2015; Yoshida et al., 2015; Yang et al., 2015; Miao et al., 2018; Magney et al., 2019; Sun et al., 2023a). In this study, to tease out the plant functional variations from structural variations contained in the remotely sensed SIF signal, we derived SIF yield = SIFPARNIRv, following Dechant et al. (2020).
-
MODIS NIRv. NIRv used in this study was calculated from the MODIS MCD43A4 (version 6.1) Nadir Bidirectional Reflectance Distribution Function (BRDF)-Adjusted Reflectance (NBAR) dataset (Schaaf and Wang, 2021), provided at daily and 500 m resolution. To maintain a good sample size for vegetation dynamics analysis, we kept the data with quality flags as 0 (full BRDF inversions) or 1 (magnitude inversion), following Wang et al. (2018).
2.4 Climate variables
Precipitation data were obtained from the Climate Hazards group Infrared Precipitation with Stations (CHIRPS; version 2.0) (Funk et al., 2015). CHIRPS covers 50° S–50° N from 1981 to present at 0.05° and daily resolution and is generated by incorporating cold cloud duration (CCD) from satellite observations and ground data from rain gauges (Funk et al., 2015). CHIRPS precipitation estimates have shown great agreement with ground data in Africa (Dinku et al., 2018; Ayehu et al., 2018; Ageet et al., 2022; Ngoma et al., 2021).
Soil moisture (SM) was from ESA-CCI (v06.1) by the European Space Agency (ESA) Climate Change Initiative (CCI) program, offered at 0.25° daily resolution from 1978 to 2020 (Preimesberger et al., 2021). It was generated by harmonizing the soil moisture estimates (typically at a depth of 0–5 cm) from multiple active and passive satellite microwave sensors (Dorigo et al., 2017; Gruber et al., 2019). In this study, we employed an updated version from Preimesberger et al. (2021).
Air temperature (Tair), water vapor pressure deficit (VPD), and PAR, at the OCO-2 and TROPOMI nominal overpass time at the Equator (i.e., 13:30 local solar time), were extracted from the Global Modeling and Assimilation Office (GMAO) Modern-Era Retrospective analysis for Research and Applications version 2 (MERRA-2) reanalysis (hourly, long 0.625° × lat 0.5°) (GMAO, 2015a, b).
2.5 Spatial and temporal matching criteria
We employed multiple spatial and temporal matching criteria for the intercomparison among different SIF datasets (Sect. 3.1) and for the analysis of intra-seasonal vegetation dynamics (Sect. 3.2 and 3.3). The principle is as follows: for the SIF intercomparison against in situ SIF, we aimed to ensure the best spatial/temporal consistency between in situ SIF and each satellite SIF dataset to be evaluated; for the intra-seasonal analysis, we attempted to ensure the spatial/temporal consistency among all the datasets (including SIF and other ancillary variables) so that all the variables refer to the same spatial domains and time intervals.
2.5.1 Spatial and temporal matching criteria for SIF intercomparison
-
Spatial matching. For comparison with in situ SIF measurements, TROPOMI was regridded to a 0.15° pixel (as explained in Sect. 2.3) centered at the tower location. For the reconstructed SIF products, we extracted the value of the 0.05° pixel where the tower is located to minimize the difference in spatial scales.
-
Temporal matching. For the paired comparison between in situ SIF and TROPOMI, we selected the quality-filtered in situ SIF observations (Sect. 2.2) collected within a time window of ±30 min with respect to the overpass time of each TROPOMI observation. The selected measurements were averaged after applying the daily correction factor based on the SZA, which was also applied to the TROPOMI SIF. The TROPOMI observations for which no in situ SIF observations were available in the ±30 min time window were discarded. In total, 64 data pairs were used for comparison.
For the paired comparison between in situ SIF and the reconstructed SIF products, we extracted the quality-filtered in situ SIF within a ±30 min time window centered at the OCO-2 and TROPOMI nominal overpass time at the Equator (i.e., 13:30 local solar time); applied the daily correction factor; and then averaged the measurements across 4, 8, or 16 d periods to match with the temporal resolution of the reconstructed products. In total, 67, 84, 40, and 55 data pairs were used for comparison for CSIF, GOSIF, SIF_oco2_005, and RTSIF, respectively.
2.5.2 Spatial and temporal matching criteria for intra-seasonal analysis
To ensure consistency among all datasets, we aggregated or resampled all datasets (e.g., in situ SIF, TROPOMI SIF, MODIS NIRv, and climate variables) to the same 0.15° and 8 d resolutions. The 0.15° pixels were set so that the boundary of the 0.15° pixel around the tower was aligned with the 3 × 3 0.05° pixels of GOSIF and RTSIF closest to the tower. Therefore, this is slightly different from the 0.15° pixel for TROPOMI SIF described in Sect. 2.5.1. The 8 d resolution was selected (1) to reduce the measurement noise of TROPOMI SIF and in situ SIF while preserving the fine-scale intra-seasonal temporal variations and (2) to match the coarser temporal resolution of GOSIF and RTSIF. For the analysis of intra-seasonal dynamics at Kapiti (Sect. 3.1), we selected the quality-filtered in situ SIF observations (Sect. 2.2) collected within a time window of ±30 min with respect to the overpass time of TROPOMI and applied a daily correction factor based on the SZA to convert them into daily values. The daily values were then aggregated to the same 8 d intervals.
3.1 Evaluation of satellite SIF datasets with in situ SIF
Leveraging the in situ SIF time series at Kapiti, we evaluated the fidelity of various satellite-based SIF datasets during 2 consecutive years (i.e., from September 2019 to August 2021) when in situ SIF was collected (Figs. 2, S2). In situ SIF showed strong inter-annual variations, with a much stronger signal in the first year compared to the second year, driven by the difference in precipitation between the 2 years (Fig. 1h). It also exhibited pronounced intra-annual variations, such as growth peaks during SR seasons (e.g., November 2019–January 2020, December 2020) and LR seasons (e.g., May 2020, June 2021) and a dry season with intermittent precipitation (February–March 2021; Fig. 1h) (Fig. 2a). The satellite-based SIF datasets showed different degrees of consistency with in situ SIF. The temporal dynamics of in situ SIF were well captured by TROPOMI SIF (Fig. 2a), showing high agreement with FloX SIFiFLD (r=0.71–0.83; Fig. 2c–e) and slightly reduced agreement with FloX SIFSFM (r=0.64–0.76; Fig. S2c–e). Instead, the reconstructed SIF products (i.e., CSIF, GOSIF, SIF_oco2_005, RTSIF), although highly consistent among each other, showed a greater discrepancy with in situ SIF compared to TROPOMI (Fig. 2b). The reconstructed SIF products showed less frequent intra-seasonal variations, and their magnitudes in variation are sometimes inaccurate (e.g., the drop in December 2019 and the peak in February–March 2021), leading to lower correlation with FloX SIFiFLD compared to TROPOMI (r=0.58–0.62; Fig. 2f–i). Their correlation with FloX SIFSFM became insignificant (Fig. S2f–i), likely because the SFM approach with a wide fitting window is more sensitive to atmospheric contamination (Chang et al., 2020). This is probably magnified when the data are aggregated over time windows of several days, such as in the comparison against the reconstructed SIF products. Note that some negative values appear in FloX SIF and TROPOMI SIF, especially during the time periods with weak SIF signals, as a result of measurement and retrieval noise (Guanter et al., 2021). These negative values are retained in the evaluation to avoid an artificial positive bias in spatial and temporal aggregation.
In the following analysis of intra-seasonal vegetation dynamics, we only selected a subset of SIF datasets. We selected FloX SIFiFLD because of its lower data noise compared to FloX SIFSFM, TROPOMI SIF from ESA (fitting window 743–758 nm) because of its higher consistency with in situ SIF compared to the other two TROPOMI SIF datasets (Figs. 2d, S2d), GOSIF as a representative of the three OCO-2-based reconstructed SIF products given the overall consistency among them, and RTSIF as a TROPOMI-based reconstructed SIF product.
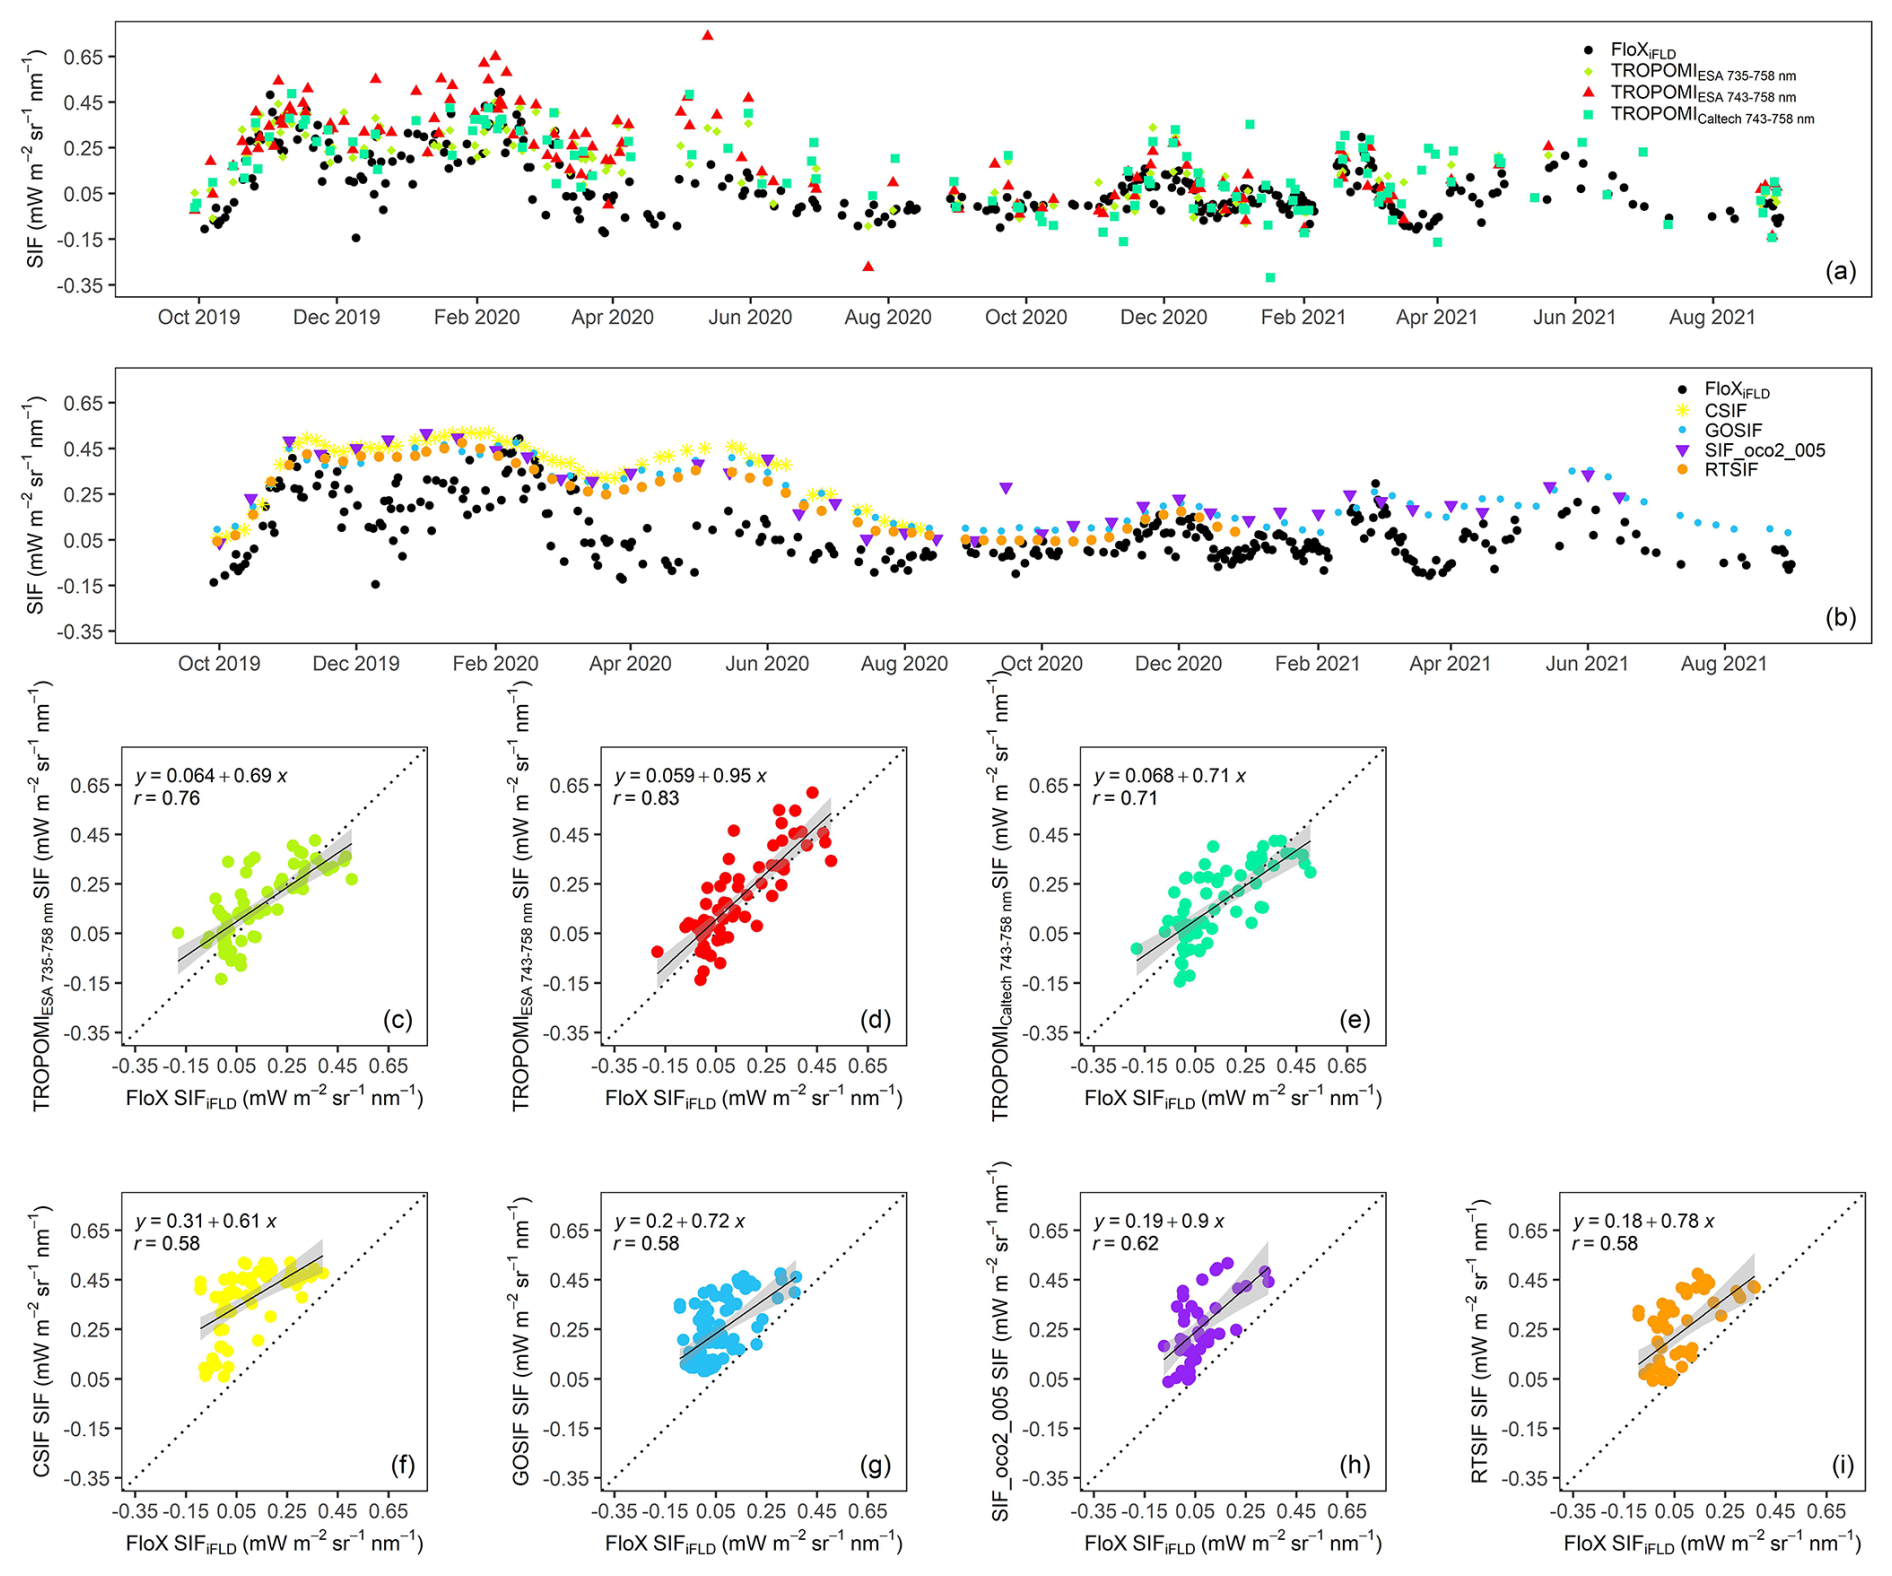
Figure 2(a, b) Time series of FloX SIFiFLD and satellite SIF at 740 nm from October 2019 to September 2021. (c–e) Scatterplots between FloX SIFiFLD and TROPOMI SIF from ESA (fitting window 735–758 and 743–758 nm) and Caltech, respectively. (f–i) Scatterplots between FloX SIFiFLD and CSIF, GOSIF, SIF_oco2_005, and RTSIF, respectively. All SIF values are daily corrected. The dotted line marks the 1:1 line.
3.2 Intra-seasonal dynamics at Kapiti
We evaluated the capability of satellite SIF and NIRv in characterizing the intra-seasonal vegetation dynamics at Kapiti from October 2019 to February 2020 (i.e., the SR season and the subsequent dry season) (Fig. 3), where/when in situ data (including SIF) are available to help verify and interpret the intra-seasonal dynamics. This period was chosen because excessive precipitation occurred during this SR season (i.e., 799 mm relative to the 2011–2020 average of 343 ± 170 mm; Fig. 1h), leading to complex vegetation dynamics that can be challenging to be accurately characterized by satellite measurements. These challenges arise mainly from limited temporal frequency and/or spatial resolution of satellite data that can easily miss fast-changing vegetation functions. Therefore, our chosen period is unique in evaluating the efficacy of satellite measurements in capturing such complex dynamics.
We found that there was a rapid growth revealed in all SIF datasets in response to precipitation and soil moisture increase in October 2019 (Fig. 3a, b). NIRv showed a similar increase during this period. However, divergence among different SIF and NIRv datasets started to emerge in early November 2019 and persisted through February 2020. The reconstructed SIF products (i.e., RTSIF, GOSIF) and MODIS NIRv remained relatively stable from November 2019 to mid-January 2020 before a subsequent gradual decline. In contrast, TROPOMI SIF exhibited distinct dynamics during this period, with double peaks in mid-November 2019 and late January 2020, and a sharp reduction (by 52 % relative to the first peak) in between. This double-peak pattern in TROPOMI SIF held, regardless of sources of TROPOMI data, fitting windows used for SIF retrievals, or quality-filtering criteria (e.g., SZA, CF, and retrieval error) (Fig. S3a–d). The double-peak pattern was not an artifact of variations in escape probability or sun-viewing geometry but was a result of the true SIF emission (Zhang et al., 2020b, Fig. S3e).
In situ SIF confirmed these distinct intra-seasonal dynamics depicted by TROPOMI SIF, with similar magnitude (61 %) and duration of the mid-season dip (Fig. 3b). As the product of NIRv and incoming PAR (i.e., NIRvP; Dechant et al., 2022) has recently been promoted as a strong proxy for photosynthesis, we further computed NIRvP with in situ NIRv and PAR. However, we found that it only accounted for a limited extent of mid-season reduction (22 %, relative to the maximum in mid-November) (Fig. S4). This finding suggests that (1) the suppression of PAR during the excessively rainy period was not the cause of the observed SIF reduction and that (2) NIRv itself is insufficient to timeously capture the rapid and complex intra-seasonal dynamics.
To better demonstrate the intra-seasonal temporal dynamics, we further calculated the temporal change rate for each dataset (i.e., temporal changes between two consecutive time steps that are 8 d apart), to present the rate of temporal fluctuations (Fig. 3c). It was evident that both in situ SIF and TROPOMI SIF showed strong intra-seasonal variations, while the reconstructed SIF products and MODIS NIRv presented minimal intra-seasonal variations.
What are the underlying processes driving such fast-changing intra-seasonal dynamics revealed by in situ and TROPOMI SIF? The strong mid-season reduction in SIF likely resulted from functional changes in vegetation photosynthetic activities, driven by grass phenology due to persistent rainfall (Reyer et al., 2013; Zeppel et al., 2014) (Fig. 3a). The onset of the herbaceous vegetation growth occurred in October 2019, triggered by abundant precipitation and soil moisture; the growth peaked in early November 2019, as alluded to by the PhenoCam images collected at Kapiti (Fig. S5a). The grass progressed to the reproductive stage during early and mid-December (Fig., S5b; Cheng et al., 2020; Zhang et al., 2023), resulting in a gradual decrease in the photosynthetic activity, possibly because of nutrient remobilization and carbohydrate sink limitation (Tejera-Nieves et al., 2023). At the same time, the persistence of soil moisture facilitated the onset of a new growth cycle, likely with a species composition shift (Muthoka et al., 2022; Shaw et al., 2022), which reached its second peak in early February 2020 (Fig. S5c). However, such complex intra-seasonal dynamics cannot be captured by NIRv or the reconstructed SIF (see Sect. 4 for a more thorough discussion).
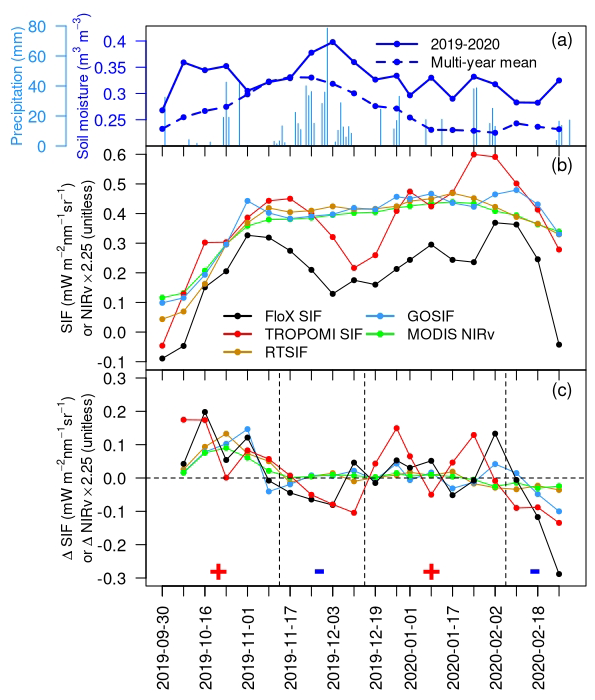
Figure 3(a) Temporal variation in daily precipitation and 8 d average SM at Kapiti between October 2019 and February 2020. The multi-year average of SM during 2011–2020 is plotted as a dashed blue line for reference. (b) Temporal variation in vegetation signals at Kapiti from various SIF and NIRv datasets. NIRv was multiplied with a factor of 2.25 to match the magnitude range of SIF for visual clarity. (c) Temporal change rate in SIF (ΔSIF) or NIRv (ΔNIRv), calculated as the change in the current 8 d period relative to the previous 8 d period. The horizontal dashed line denotes no change in SIF or NIRv. The vertical dashed lines roughly divide the study period into four segments based on the sign of ΔSIF of in situ and TROPOMI SIF (mostly consistent with each other, as marked along the x axis). The x axis labels represent the starting date of each 8 d interval.
3.3 Intra-seasonal dynamics for the entire HoA drylands
Does the stronger sensitivity of TROPOMI SIF (compared to the reconstructed SIF and NIRv) in characterizing fast-changing intra-seasonal dynamics hold across HoA drylands, beyond the single site at Kapiti? To answer this question, we conducted in-depth regional analysis for the entire HoA drylands from October 2019 to February 2020, when excessive precipitation occurred in most of the region (Fig. 1e). Given the outstanding spatial heterogeneity of biome types, precipitation patterns, and vegetation responses in the HoA, we selected three sub-domains for analysis (Fig. 1b) to ensure that, within each sub-domain, (1) the land cover type is relatively homogeneous and (2) the intra-seasonal variations in precipitation and subsequent vegetation growth were relatively consistent (Figs. S6, S7). For example, Region 1 and Region 2 (in central and southeastern HoA, dominated by shrublands and grasslands, respectively) started their rainy season in early October, which stimulated fast vegetation growth. The vegetation activity peaked around early November and gradually decreased after December, when there was little precipitation. In contrast, in Region 3 (in southern HoA, dominated by grasslands), precipitation occurred later (e.g., mainly during late October and early December). Correspondingly, the vegetation phenology was shifted, with a peak around early December.
While all the satellite SIF and NIRv datasets tracked the seasonal variations in the three sub-domains well, we found that TROPOMI SIF revealed more intra-seasonal variations during the growing seasons compared to the reconstructed SIF (i.e., RTSIF and GOSIF) and MODIS NIRv. In addition, TROPOMI SIF also showed higher values during the peak growing season and lower values during the dry season (i.e., February).
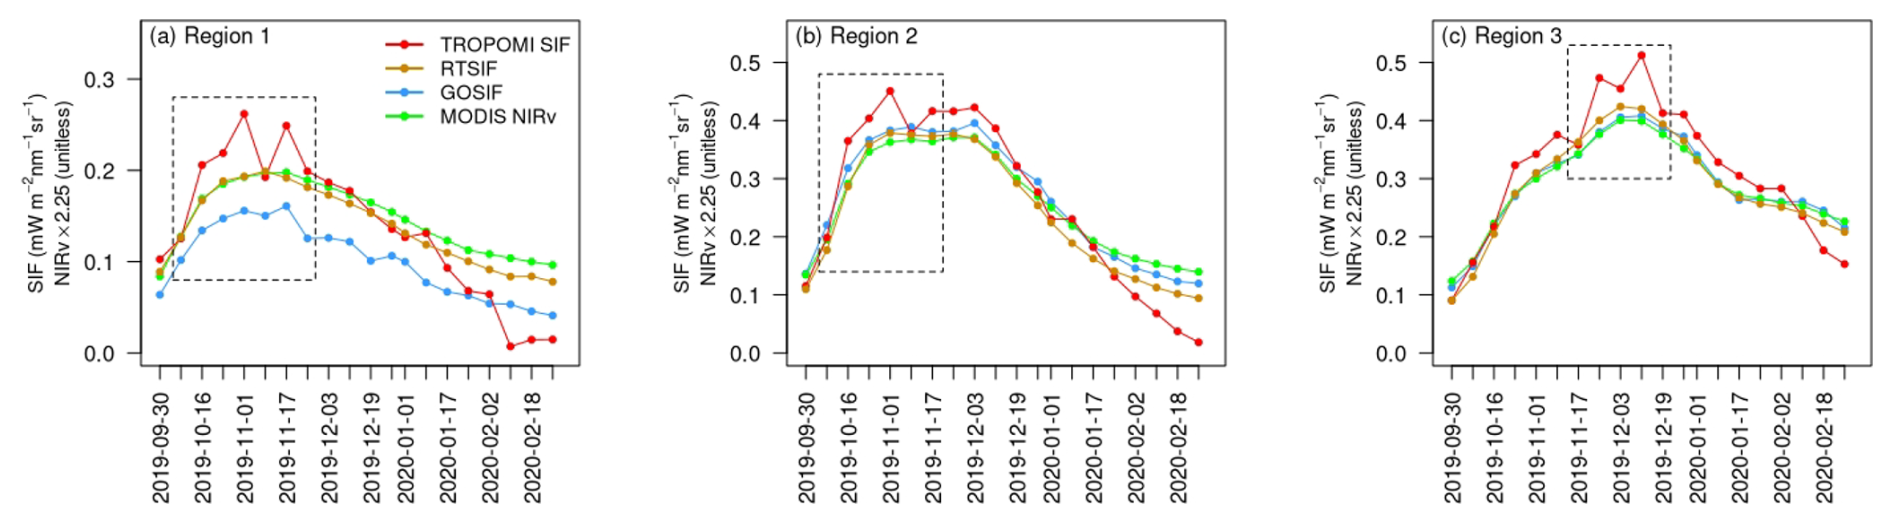
Figure 4Temporal variations in various SIF and NIRv datasets for the three sub-domains (Fig. 1b) in the HoA drylands from October 2019 to February 2020. NIRv was multiplied with a factor of 2.25 to match the magnitude range of SIF for visual clarity. The date labels represent the starting date of each 8 d interval. The dashed boxes mark the periods when TROPOMI SIF revealed strong intra-seasonal variations.
To investigate the intra-seasonal variations revealed by TROPOMI SIF, we zoomed in to a shorter time window for each of the sub-domains (i.e., dashed boxes in Fig. 4). For each time window, TROPOMI SIF showed a faster and stronger increase from a similar starting point, compared to the reconstructed SIF and MODIS NIRv. As a result, TROPOMI SIF showed a much stronger vegetation signal (i.e., higher values) during the peak growing season: 1 November in the central area of Region 1 (Fig. 5), 1 November in the coastal area of Region 2 (Fig. S8), and 25 November in the central and southern area of Region 3 (Fig. S10). After reaching a peak or close-to-peak value, TROPOMI SIF showed a decline during all three selected windows: a region-wide reduction for Region 1 and 2 on 9 November and a reduction in the central and southern area of Region 3 on 3 December. These reductions in TROPOMI SIF were quickly recovered within 1 week. For Region 1 and Region 3, there was another subsequent region-wide sharp reduction, on 25 November and 19 December respectively, before the vegetation activity gradually ceased. Figures 6, S9, S11 depict the temporal change rate in different SIF and NIRv datasets. While TROPOMI revealed strong intra-seasonal variations during the peak growing season, the reconstructed SIF and MODIS NIRv remained nearly invariant.
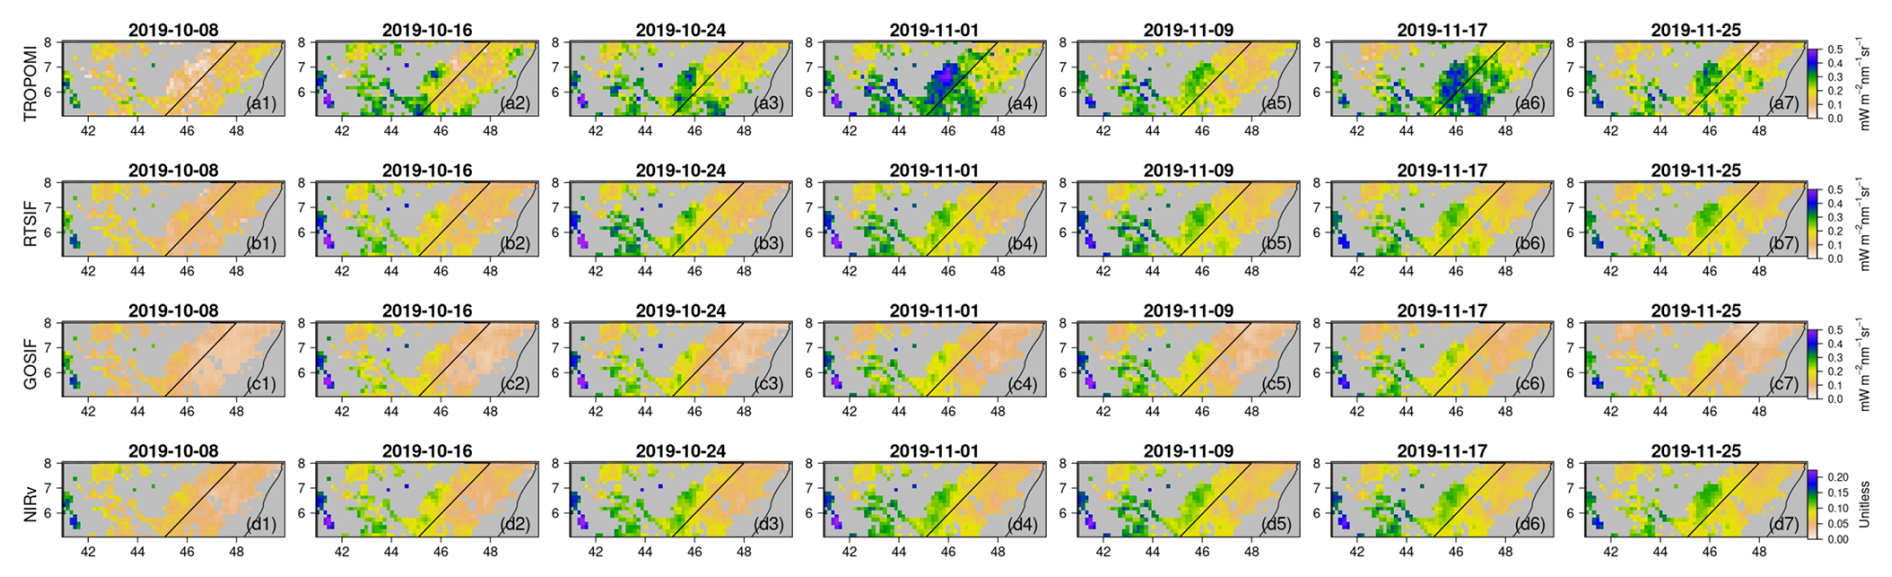
Figure 5Intra-seasonal variations in (a) TROPOMI SIF, (b) RTSIF, (c) GOSIF, and (d) MODIS NIRv in the shrublands of Region 1 during 8 October and 25 November 2019. The date labels represent the starting date of each 8 d period.
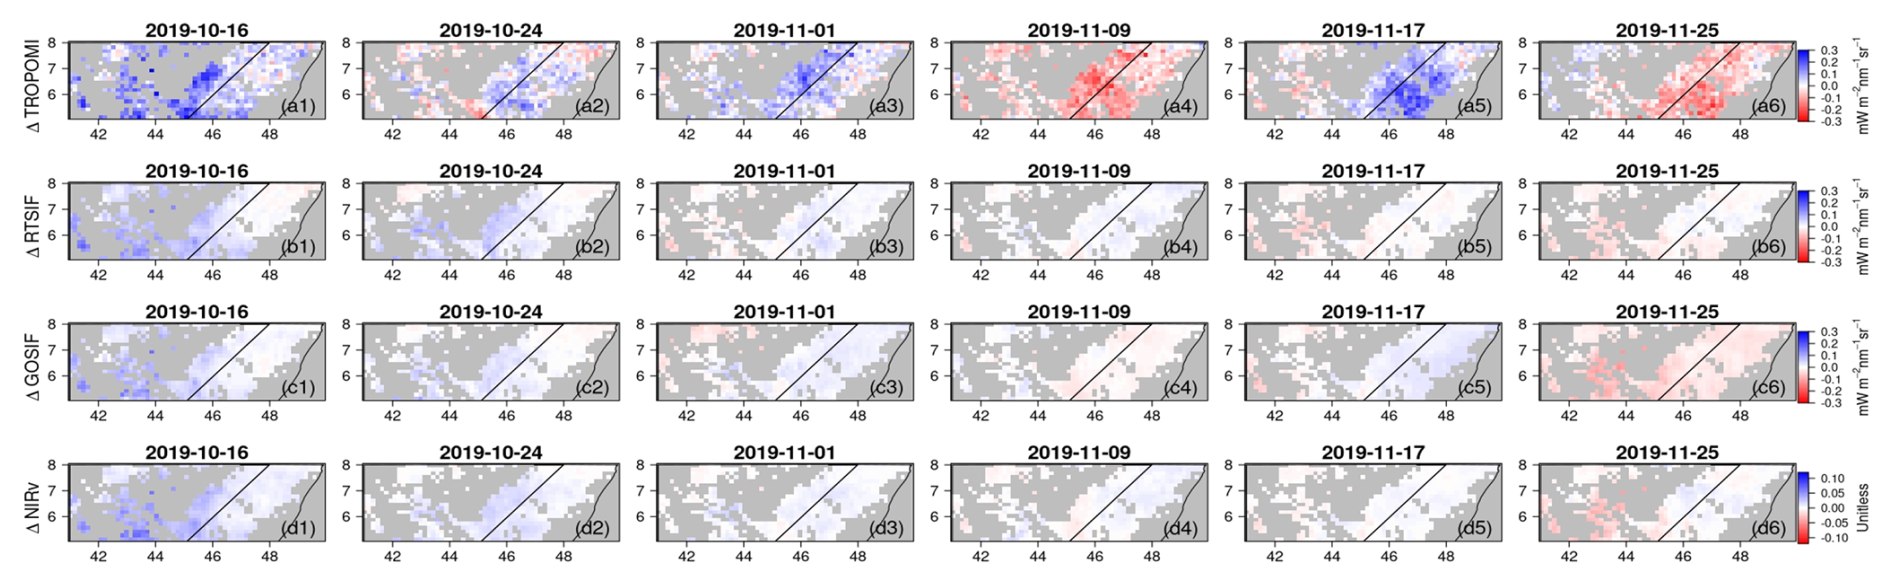
Figure 6Temporal change rate in (a) TROPOMI SIF, (b) RTSIF, (c) GOSIF, and (d) MODIS NIRv in the shrublands of Region 1 during 16 October and 25 November 2019. The date labels represent the starting date of each 8 d period.
To identify drivers underlying the intra-seasonal variations observed in TROPOMI SIF, we further investigated meteorological variables from MERRA-2 and ESA-CCI SM (Fig. 7). We found that the reductions in TROPOMI SIF (e.g., Region 1 on 9 and 25 November, Region 2 on 9 November, and Region 3 on 3 and 19 December) mostly coincided with increased Tair and VPD and with decreased SM. On the other hand, the subsequent recoveries (e.g., Region 1 and 2 on 17 November and Region 3 on 11 December) all corresponded to decreased Tair and VPD and to increased SM. Such relationships between TROPOMI SIF and meteorological variations suggest that the intra-seasonal variations observed in TROPOMI SIF may represent the real vegetation status and are less likely artifacts of data noise. Again, the reconstructed SIF and MODIS NIRv, on the contrary, failed to capture such fast-changing intra-seasonal vegetation dynamics driven by environmental fluctuations (Fig. S12). With variations in PAR mostly showing opposite changes to variations in TROPOMI SIF (e.g., Fig. 7a), NIRvP could not capture such intra-seasonal variations either.
Furthermore, we found that the SIF yield calculated from TROPOMI SIF (i.e., SIF yield = SIFPARNIRv, following Dechant et al., 2020) has an even higher consistency with the short-term fluctuations in Tair, VPD, and SM (Fig. 7). This further suggests that the intra-seasonal variations in TROPOMI SIF are largely driven by the functional changes regulated by environmental conditions. Interestingly, while TROPOMI SIF showed a slight increasing trend in Region 2 during 16 October and 1 November, TROPOMI SIF yield showed a large decreasing trend which corresponded to an increasing trend in Tair and VPD and a decreasing trend in SM (Fig. 7b). While TROPOMI SIF continued to increase as a result of increasing PAR, the grasslands in Region 2 already suffered functional depression due to thermal and/or water stress. Similarly, in Region 1 on 24 October, TROPOMI SIF also showed a slight increase due to an increase in PAR, while TROPOMI SIF yield showed a reduction related to increased Tair and VPD and to decreased SM (Fig. 7a). This underscores the unique and valuable functional information contained in TROPOMI SIF for stress early detection and preparedness. In addition, during the second timestamp of all three selected windows (i.e., 16 October for Region 1 and 2 and 25 November for Region 3), when TROPOMI SIF had a strong increase, TROPOMI SIF yield also increased under favorable conditions (e.g., relatively lower Tair and VPD and higher SM). This might explain the stronger vegetation signals observed in TROPOMI SIF compared to other datasets (with less increase in SIF yield; Fig. S12) during the peak growing season (Fig. 4). The environmental effect on vegetation function is further demonstrated by the strong correlation between SIF yield derived from TROPOMI and meteorological variables, especially Tair and VPD (Fig. 7d–f). This highlights the unique capability of TROPOMI SIF for vegetation monitoring and ultimately carbon budget quantification.
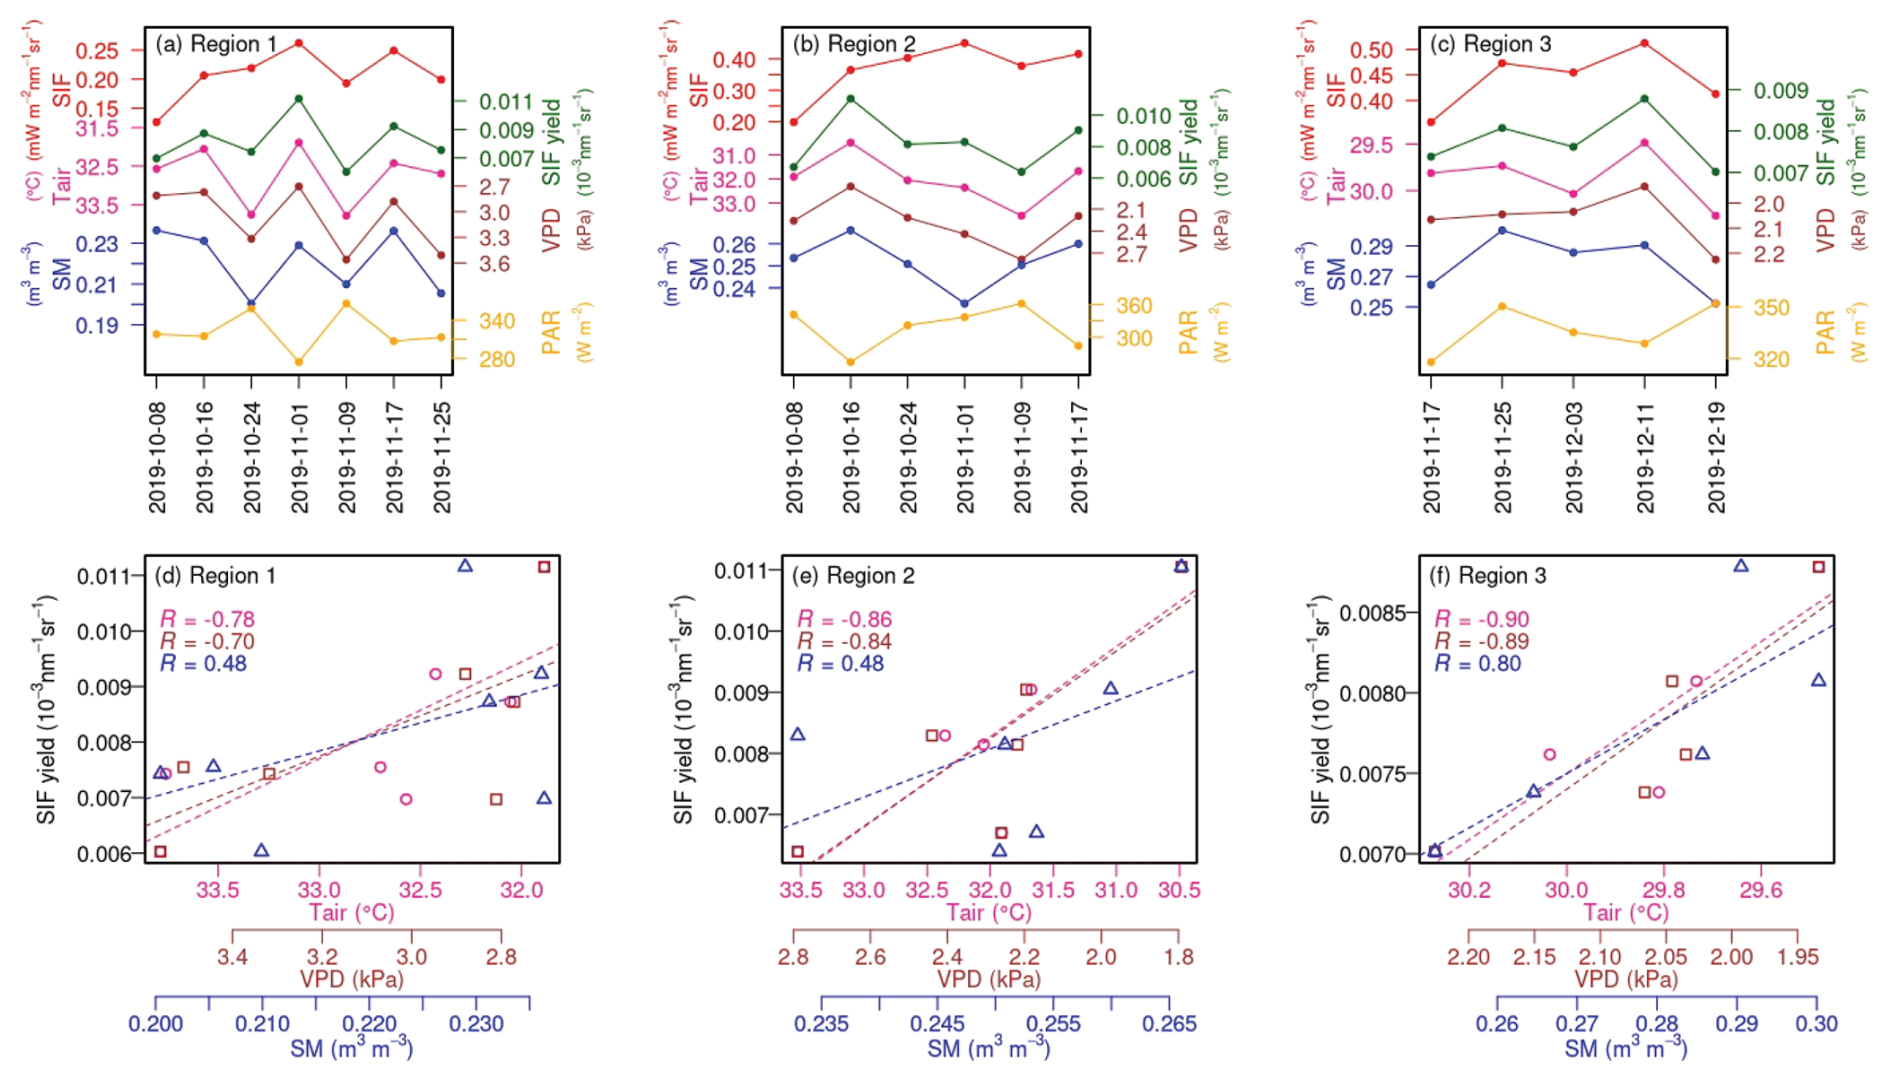
Figure 7(a–c) Intra-seasonal variations in TROPOMI SIF, TROPOMI SIF yield, Tair, VPD, SM, and PAR for the three sub-domains during the selected time windows (Fig. 4). The y axes for Tair and VPD are reversed for visual clarity. The x-axis labels represent the starting date of each 8 d interval. (d–f) Scatterplots between TROPOMI SIF yield and Tair (pink circle), VPD (brown square), and SM (blue triangle) for the three sub-domains during the selected time windows. The dashed lines represent fitted linear regression lines, with correlation coefficients (R) noted in the upper left of each panel.
4.1 Dryland intra-seasonal vegetation dynamics under excessive precipitation
Dryland ecosystems are characterized by highly variable vegetation dynamics in response to environmental drivers at short timescales. Monitoring and understanding their behavior under different environmental conditions is critical for predicting the fate of the global terrestrial carbon sink and for supporting the livelihood of billions of people who live therein. In this study, we revealed the fast-changing intra-seasonal vegetation dynamics of HoA drylands under excessive precipitation, utilizing several high-temporal-resolution SIF and VI datasets, especially TROPOMI SIF with unprecedented daily revisit frequency for satellite SIF retrieval. As revealed by TROPIMI SIF, we found interesting temporal dynamics of dryland vegetation under excessive precipitation at both site and regional levels. At the Kapiti site, there was not only a more pronounced vegetation signal (Fig. 2), but also complex phenological and physiological changes happening. In response to extreme soil moisture and rainfall amount and duration, two separate growth cycles occurred within a single rainy season, accompanied by a reduction in SIF (possibly also productivity) during the transition period between the two growth cycles (Fig. 3). Turner et al. (2020) also reported a double-peak SIF signal within one single growing season, due to the different phenology of grasses and evergreen forests, which MODIS VIs failed to capture. At the regional scale, TROPOMI SIF showed highly dynamic week-to-week variations (Figs. 4–6) functionally up- and downregulated by environment fluctuations (e.g., Tair, VPD, and SM; Fig. 7) for all three selected sub-domains with distinct land cover types, precipitation variations, and vegetation responses. Such short-term plant stresses and recoveries suggested strong environmental constraints (e.g., thermal and/or water stress) on dryland ecosystem functions, even during a rainy season with anomalously high precipitation. Such vegetation dynamics were not able to be unraveled by other datasets (e.g., MODIS NIRv). The findings in this study may alter our knowledge about the monitoring of dryland ecosystems and their phenological and physiological responses to a changing climate under future projections, which inspires further investigation.
4.2 Advantages of SIF over VIs in revealing intra-seasonal dynamics
Satellite SIF has emerged as a promising proxy for inferring spatiotemporal dynamics of photosynthetic activities from canopy to global scales. Numerous studies have compared the capability of SIF and VIs in characterizing the temporal dynamics of GPP at seasonal or inter-annual scales. SIF has unique mechanistic advantages, as it is emitted from the core of the photosynthetic machinery and therefore contains additional functional information beyond the structural information usually carried by VIs. On the other hand, SIF has its practical limitations (e.g., comparatively coarser spatial and temporal resolutions and higher measurement/retrieval noise) relative to the greenness-based VIs that are much easier to retrieve. The general consensus from previous studies is that satellite SIF has an overall similar performance to greenness-based VIs at seasonal cycles and beyond. This is especially the case for crops and deciduous forests where seasonal variations in structure (e.g., leaf area index and pigment content) are dominant (Dechant et al., 2020; Yang et al., 2015). In ecosystems where functional changes (e.g., leaf physiology) play a more impactful role compared to structural changes (e.g., evergreen conifers), more pronounced advantages have been found in SIF over greenness-based VIs in inferring GPP seasonal dynamics (Magney et al., 2019; Pierrat et al., 2022).
While previous studies have mostly been focused on evaluation at the seasonal scale and beyond, this study highlighted the differences on shorter timescales, e.g., intra-seasonal. To achieve this, we took advantage of TROPOMI SIF (with daily revisit frequency) and employed HoA drylands (with highly dynamic vegetation changes in response to the environment) as a testbed. We found that only TROPOMI SIF revealed fast-changing phenological and physiological variations at both site and regional levels, while MODIS NIRv failed to capture them, despite the fact that the latter is provided at high temporal resolution. This is mainly because, at a temporal scale of several days to weeks, especially during the peak growing season, the functional changes (as contained in SIF) in response to short-term environmental fluctuations are dominant compared to structural changes (as represented by NIRv), as greenness remains relatively constant (Daumard et al., 2010; Martini et al., 2022). This is in analogy to the case of evergreen conifers at the seasonal scale (Magney et al., 2019; Pierrat et al., 2022). Such differences suggest that SIF contains unique mechanistic value in estimating carbon sequestration, monitoring vegetation status, detecting early plant stress, and understanding climate–vegetation interactions at short timescales.
A recent study by Wang et al. (2022c) evaluated the ability of satellite SIF and NIRv in capturing the seasonal variation in GPP in dryland ecosystems and found that NIRv performed better than SIF for low-productivity sites, likely because of the low signal-to-noise ratio of SIF retrievals. This does not necessarily contradict the findings of our study. Firstly, Wang et al. (2022c) examined the performance of SIF and NIRv at the seasonal scale over about 2 years, when SIF may have only marginal advantages in inferring function-related variations that are overwhelmed by structure-related variations. In contrast, our study focused on intra-seasonal variations, when functional changes have a stronger impact. Secondly, our evaluation is conducted on a relatively wet period when vegetation signals are strong; therefore the data noise has less influence on the retrieved vegetation signals.
4.3 Deficiencies of reconstructed SIF products
The native satellite SIF retrievals have long suffered coarse spatial and/or temporal resolutions, large data noise, and short time spans. It is hoped that the reconstructed SIF products that are derived from the native SIF retrievals could overcome these practical limitations, improving the capability of satellite SIF in depicting vegetation dynamics across scales. Indeed, there have been many efforts in the past years in developing such products (e.g., Duveiller and Cescatti, 2016; Zhang et al., 2018; Li and Xiao, 2019; Yu et al., 2019; Wen et al., 2020; Ma et al., 2020, 2022; Chen et al., 2022; Wang et al., 2022b). However, this study found that these reconstructed SIF products (i.e., based on OCO-2 or TROPOMI) resembled the spatiotemporal patterns of MODIS NIRv and were unable to characterize the complex fast-changing intra-seasonal dynamics (that were successfully captured by TROPOMI SIF), although these products were provided at fine temporal resolution (e.g., 4 d for CSIF).
This may be explained by two aspects of generating these reconstructed SIF products. Firstly, the native SIF retrievals used for SIF reconstruction must contain the signals of fast-changing intra-seasonal vegetation dynamics. However, the native SIF retrievals from OCO-2 (with a 16 d revisit cycle) most likely miss these fast-changing signals, especially during the rainy seasons, when clouds may exacerbate the issue. In contrast, the native SIF retrievals from TROPOMI (with daily revisit frequency) can track the complex intra-seasonal vegetation dynamics. This highlights the demand for native SIF retrievals with high temporal resolutions, e.g., several upcoming geostationary missions, such as Tropospheric Emissions: Monitoring of Pollution (TEMPO) and the Copernicus Sentinel-4, which may greatly facilitate capturing vegetation dynamics at fine temporal scales and understanding climate–vegetation interactions.
Secondly, the SIF reconstruction must faithfully preserve the spatiotemporal variations in native SIF. The procedure of SIF reconstruction is essentially a mapping from the ancillary datasets to SIF with calibrated relationships (Sect. 2.3). Most of the SIF reconstruction studies calibrated the relationships based on evaluation across all timestamps and all pixels, when/where the structural changes overwhelmingly dominate the variations; therefore whether the important functional information is preserved is not effectively evaluated. For example, the SIF yield calculated from RTSIF and GOSIF is largely dampened compared to that from TROPOMI SIF, which leads to flatter intra-seasonal variations in RTSIF and GOSIF and therefore to much weaker environmental sensitivities (Fig. S12) and lower consistency with in situ SIF (Fig. 2). This is, however, not contradicted with the high consistency between RTSIF and TROPOMI (e.g., R2=0.907, regression slope = 1.001, reported in Chen et al., 2022), probably as a result of both correlating with absorbed PAR. To preserve the functional information of the native SIF retrievals in the reconstructed SIF, one general idea is to impose a stronger constraint from the native SIF during the SIF reconstruction. For example, Wen et al. (2020) demonstrated that, by stratifying the models in time and space, the reconstructed SIF could be better constrained by spatiotemporal variations in the native SIF and therefore be capable of capturing the functional changes. Another possible approach is to calculate the differences between the reconstructed SIF and the native SIF and to redistribute the prediction residuals to the reconstructed SIF. Recently, Ma et al. (2022) utilized such an approach to reconstruct high-resolution SIF from the Global Ozone Monitoring Experiment-2 (GOME-2). With the redistribution of prediction residuals, the reconstructed SIF showed a greater consistency with the native GOME-2 SIF. However, such approaches can only be applied to timestamps/regions when/where the native SIF retrievals are available. It could be challenging to make such adjustments for the extrapolated SIF when/where the native SIF retrievals do not exist (e.g., TROPOMI before 2018, spatial gaps for OCO-2).
4.4 Limitations and future work
Nonetheless, there are still several limitations in this study, which warrants future work. Firstly, while this study utilized the HoA dryland ecosystems as a testbed to evaluate the capability of different satellite SIF and VI products in capturing intra-seasonal dynamics, such comparison could be further conducted for other dryland regions or other vegetation types towards a more comprehensive evaluation. Secondly, limited by the scarcity of in situ data, the intra-seasonal variations in SIF inferred in this study were not directly linked to ecosystem productivity. Such evaluation could be conducted in regions with more in situ data, e.g., flux tower measurements, as a complementary assessment. Thirdly, while this study evaluated the intra-seasonal variations inferred from different products in a qualitative way, further quantitative analysis can be done in future work, e.g., quantifying the climate sensitivities of vegetation carbon dynamics.
Accurately monitoring the fast-changing vegetation dynamics of dryland ecosystems has been critical for understanding their climate sensitivities and informing climate risk management. In this study, we evaluated the advantages of SIF over greenness-based VIs in characterizing intra-seasonal (i.e., from days to weeks) vegetation dynamics, utilizing dryland ecosystems (e.g., shrublands and grasslands) in the Horn of Africa (HoA) as a testbed. At both site and regional levels, we found that TROPOMI SIF revealed fast-changing phenological and physiological variations at the intra-seasonal scale, while MODIS NIRv and several reconstructed SIF products did not. Specifically, at the site level, our results showed that TROPOMI SIF revealed two separate within-season growth cycles in response to extreme soil moisture and rainfall amount and duration, which was corroborated by in situ SIF measurements and PhenoCam images. At the regional level, TROPOMI SIF and SIF yield exhibited highly dynamic week-to-week variations in both shrublands and grasslands, driven by environmental fluctuations (e.g., Tair, VPD, SM). MODIS NIRv could not capture such fast-changing intra-seasonal variations but remained relatively stable during the same period. Interestingly, the machine-learning-reconstructed SIF products were unable to characterize such intra-seasonal dynamics either, despite their approximately weekly temporal resolutions, rooted in insufficient temporal granularity of their original SIF retrievals and inadequate constraints from native SIF retrievals during the reconstruction. Our results indicate that SIF carries mechanistic advantages over NIRv in monitoring fast-changing intra-seasonal dynamics for dryland ecosystems but that high-temporal-resolution SIF is essential for capturing such complicated patterns. This study generates novel and important insights for developing effective real-time vegetation monitoring systems to understand carbon dynamics and inform climate risk management.
In situ SIF data are available upon request to micol.rossini@unimib.it. TROPOMI_ESA can be accessed at https://doi.org/10.5270/esa-s5p_innovation-sif-20180501_20210320-v2.1-202104 (NOVELTIS et al., 2021). TROPOMI_Caltech can be accessed at ftp://fluo.gps.caltech.edu (Köhler, 2023). RTSIF can be accessed at https://doi.org/10.6084/m9.figshare.19336346.v2 (Chen, 2022). CSIF can be accessed at https://doi.org/10.17605/OSF.IO/8XQY6 (Zhang, 2022). GOSIF can be accessed at http://data.globalecology.unh.edu/data/GOSIF_v2 (Li and Xiao, 2022). SIF_oco2_005 can be accessed at https://doi.org/10.3334/ORNLDAAC/1863 (Yu et al., 2021). MODIS MCD43A4 can be accessed at https://doi.org/10.5067/MODIS/MCD43A4.061 (Schaaf and Wang, 2021). CHIRPS precipitation data can be downloaded at https://data.chc.ucsb.edu/products/CHIRPS-2.0/ (Funk et al., 2014). ESA-CCI soil moisture data can be accessed at https://catalogue.ceda.ac.uk/uuid/43d73291472444e6b9c2d2420dbad7d6/ (Dorigo et al., 2021). MERRA-2 reanalysis can be accessed at https://doi.org/10.5067/VJAFPLI1CSIV, https://doi.org/10.5067/L0T5GEG1NYFA (GMAO, 2015a, b). MODIS LC can be accessed at https://doi.org/10.5067/MODIS/MCD12C1.061 (Friedl and Sulla-Menashe, 2022). Code for analyses and figures is available at https://github.com/JiamingWen/Kapiti_intraseasonal (last access: 11 April 2025; DOI: https://doi.org/10.5281/zenodo.15200357, Wen, 2025).
The supplement related to this article is available online at https://doi.org/10.5194/bg-22-2049-2025-supplement.
JW and YS contributed to the conceptualization of this paper. JW and GT curated data, performed the formal analysis, and generated all figures. MR, CP, LM, SL, and FPF curated the in situ data and maintained the research station. YS, MR, and FPF are responsible for supervision and resources. JW and GT prepared the original draft. All authors reviewed and edited the article.
At least one of the (co-)authors is a member of the editorial board of Biogeosciences. The peer-review process was guided by an independent editor, and the authors also have no other competing interests to declare.
Publisher's note: Copernicus Publications remains neutral with regard to jurisdictional claims made in the text, published maps, institutional affiliations, or any other geographical representation in this paper. While Copernicus Publications makes every effort to include appropriate place names, the final responsibility lies with the authors.
We thank Ilona Gluecks (ILRI), the ILRI Mazingira team, and the Kapiti farm staff for their support in the setup and maintenance of the experimental site. We thank Tommaso Julitta, Andreas Burkart, and Paul Näthe (JB Hyperspectral Devices) for their remote support in setting up and maintaining the FloX system. Jiaming Wen would like to acknowledge the helpful discussion with Joe Berry, Jeff Dukes, and Andrea Nebhut at the Carnegie Institution for Science.
This research has been supported by the United States National Aeronautics and Space Administration (grant nos. 80NSSC21K1058, 80NSSC20K1646, and 80NSSC22K1253), the German Federal Ministry for Economic Cooperation and Development (BMZ issued through GIZ) through the Programme of Climate Smart Livestock (PCSL, program no. 2017.0119.2), the EU DeSIRA project “Earth observation and environmental sensing for climate-smart sustainable agropastoral ecosystem transformation in East Africa” (ESSA), the European Union's Horizon Europe program (grant agreement number 101058525) for the project “Knowledge and climate services from an African observation and Data research Infrastructure (KADI)”, and the CGIAR Trust Fund and the One CGIAR research initiatives on Livestock and Climate and MITIGATE+.
This paper was edited by Andrew Feldman and reviewed by Liyin He and one anonymous referee.
Adams, E. C., Parache, H. B., Cherrington, E., Ellenburg, W. L., Mishra, V., Lucey, R., and Nakalembe, C.: Limitations of Remote Sensing in Assessing Vegetation Damage Due to the 2019–2021 Desert Locust Upsurge, Frontiers in Climate, 3, 112, https://doi.org/10.3389/FCLIM.2021.714273, 2021.
Ageet, S., Fink, A. H., Maranan, M., Diem, J. E., Hartter, J., Ssali, A. L., and Ayabagabo, P.: Validation of Satellite Rainfall Estimates over Equatorial East Africa, J. Hydrometeorol., 23, 129–151, https://doi.org/10.1175/JHM-D-21-0145.1, 2022.
Ahlström, A., Raupach, M. R., Schurgers, G., Smith, B., Arneth, A., Jung, M., Reichstein, M., Canadell, J. G., Friedlingstein, P., Jain, A. K., Kato, E., Poulter, B., Sitch, S., Stocker, B. D., Viovy, N., Wang, Y. P., Wiltshire, A., Zaehle, S., and Zeng, N.: The dominant role of semi-arid ecosystems in the trend and variability of the land CO2 sink, Science, 348, 895–899, https://doi.org/10.1126/science.aaa1668, 2015.
Alonso, L., Gómez-Chova, L., Vila-Francés, J., Amorós-López, J., Guanter, L., Calpe, J., and Moreno, J.: Improved fraunhofer line discrimination method for vegetation fluorescence quantification, IEEE Geosci. Remote S., 5, 620–624, https://doi.org/10.1109/LGRS.2008.2001180, 2008.
Ayehu, G. T., Tadesse, T., Gessesse, B., and Dinku, T.: Validation of new satellite rainfall products over the Upper Blue Nile Basin, Ethiopia, Atmos. Meas. Tech., 11, 1921–1936, https://doi.org/10.5194/amt-11-1921-2018, 2018.
Badgley, G., Field, C. B., and Berry, J. A.: Canopy near-infrared reflectance and terrestrial photosynthesis, Sci. Adv., 3, e1602244, https://doi.org/10.1126/sciadv.1602244, 2017.
Beal, T., Gardner, C. D., Herrero, M., Iannotti, L. L., Merbold, L., Nordhagen, S., and Mottet, A.: Friend or Foe? The Role of Animal-Source Foods in Healthy and Environmentally Sustainable Diets, J. Nutr., 153, 409–425, https://doi.org/10.1016/J.TJNUT.2022.10.016, 2023.
Carbonell, V., Merbold, L., Díaz-Pinés, E., Dowling, T. P. F., and Butterbach-Bahl, K.: Nitrogen cycling in pastoral livestock systems in Sub-Saharan Africa: knowns and unknowns, Ecol. Appl., 31, e02368, https://doi.org/10.1002/EAP.2368, 2021.
Chang, C. Y., Guanter, L., Frankenberg, C., Köhler, P., Gu, L., Magney, T. S., Grossmann, K., and Sun, Y.: Systematic Assessment of Retrieval Methods for Canopy Far-Red Solar-Induced Chlorophyll Fluorescence Using High-Frequency Automated Field Spectroscopy, J. Geophys. Res.-Biogeo., 125, e2019JG005533, https://doi.org/10.1029/2019JG005533, 2020.
Chen, X.: RTSIF dataset, Figshare [data set], https://doi.org/10.6084/m9.figshare.19336346.v2, 2022.
Chen, X., Huang, Y., Nie, C., Zhang, S., Wang, G., Chen, S., and Chen, Z.: A long-term reconstructed TROPOMI solar-induced fluorescence dataset using machine learning algorithms, Scientific Data, 9, 427, https://doi.org/10.1038/s41597-022-01520-1, 2022.
Cheng, Y., Vrieling, A., Fava, F., Meroni, M., Marshall, M., and Gachoki, S.: Phenology of short vegetation cycles in a Kenyan rangeland from PlanetScope and Sentinel-2, Remote Sens. Environ., 248, 112004, https://doi.org/10.1016/j.rse.2020.112004, 2020.
Cogliati, S., Verhoef, W., Kraft, S., Sabater, N., Alonso, L., Vicent, J., Moreno, J., Drusch, M., and Colombo, R.: Retrieval of sun-induced fluorescence using advanced spectral fitting methods, Remote Sens. Environ., 169, 344–357, https://doi.org/10.1016/j.rse.2015.08.022, 2015.
Constenla-Villoslada, S., Liu, Y., Wen, J., Sun, Y., and Chonabayashi, S.: Large-scale land restoration improved drought resilience in Ethiopia's degraded watersheds, Nat. Sustain., 5, 488–497, https://doi.org/10.1038/s41893-022-00861-4, 2022.
Daumard, F., Champagne, S., Fournier, A., Goulas, Y., Ounis, A., Hanocq, J. F., and Moya, I.: A field platform for continuous measurement of canopy fluorescence, IEEE T. Geosci. Remote, 48, 3358–3368, https://doi.org/10.1109/TGRS.2010.2046420, 2010.
Dechant, B., Ryu, Y., Badgley, G., Zeng, Y., Berry, J. A., Zhang, Y., Goulas, Y., Li, Z., Zhang, Q., Kang, M., Li, J., and Moya, I.: Canopy structure explains the relationship between photosynthesis and sun-induced chlorophyll fluorescence in crops, Remote Sens. Environ., 241, 111733, https://doi.org/10.1016/j.rse.2020.111733, 2020.
Dechant, B., Ryu, Y., Badgley, G., Köhler, P., Rascher, U., Migliavacca, M., Zhang, Y., Tagliabue, G., Guan, K., Rossini, M., Goulas, Y., Zeng, Y., Frankenberg, C., and Berry, J. A.: NIRVP: A robust structural proxy for sun-induced chlorophyll fluorescence and photosynthesis across scales, Remote Sens. Environ., 268, 112763, https://doi.org/10.1016/J.RSE.2021.112763, 2022.
Dinku, T., Funk, C., Peterson, P., Maidment, R., Tadesse, T., Gadain, H., and Ceccato, P.: Validation of the CHIRPS satellite rainfall estimates over eastern Africa, Q. J. Roy. Meteor. Soc., 144, 292–312, https://doi.org/10.1002/qj.3244, 2018.
Dorigo, W., Wagner, W., Albergel, C., Albrecht, F., Balsamo, G., Brocca, L., Chung, D., Ertl, M., Forkel, M., Gruber, A., Haas, E., Hamer, P. D., Hirschi, M., Ikonen, J., De Jeu, R., Kidd, R., Lahoz, W., Liu, Y. Y., Miralles, D., Mistelbauer, T., Nicolai-Shaw, N., Parinussa, R., Pratola, C., Reimer, C., Van Der Schalie, R., Seneviratne, S. I., Smolander, T., and Lecomte, P.: ESA CCI Soil Moisture for improved Earth system understanding: State-of-the art and future directions, Biogeochemistry Remote Sensing of Environment, 203, 185–215, https://doi.org/10.1016/j.rse.2017.07.001, 2017.
Dorigo, W., Preimesberger, W., Moesinger, L., Pasik, A., Scanlon, T., Hahn, S., Van der Schalie, R., Van der Vliet, M., De Jeu, R., Kidd, R., Rodriguez-Fernandez, N., and Hirschi, M.: ESA Soil Moisture Climate Change Initiative (Soil_Moisture_cci): COMBINED product, Version 06.1, NERC EDS Centre for Environmental Data Analysis [data set] https://catalogue.ceda.ac.uk/uuid/43d73291472444e6b9c2d2420dbad7d6/ (last access: 21 March 2022), 2021.
Dowling, T. P. F., Langsdale, M. F., Ermida, S. L., Wooster, M. J., Merbold, L., Leitner, S., Trigo, I. F., Gluecks, I., Main, B., O'Shea, F., Hook, S., Rivera, G., De Jong, M. C., Nguyen, H., and Hyll, K.: A new East African satellite data validation station: Performance of the LSA-SAF all-weather land surface temperature product over a savannah biome, ISPRS J. Photogramm., 187, 240–258, https://doi.org/10.1016/J.ISPRSJPRS.2022.03.003, 2022.
Duveiller, G. and Cescatti, A.: Spatially downscaling sun-induced chlorophyll fluorescence leads to an improved temporal correlation with gross primary productivity, Remote Sens. Environ., 182, 72–89, https://doi.org/10.1016/j.rse.2016.04.027, 2016.
Fava, F., Vrieling, A., Fu, B., Smith, M. S., and Fu, C.: Earth observation for drought risk financing in pastoral systems of sub-Saharan Africa, Curr. Opin. Environ. Sustain., 48, 44–52, https://doi.org/10.1016/J.COSUST.2020.09.006, 2021.
Frankenberg, C., Fisher, J. B., Worden, J., Badgley, G., Saatchi, S. S., Lee, J.-E., Toon, G. C., Butz, A., Jung, M., Kuze, A., and Yokota, T.: New global observations of the terrestrial carbon cycle from GOSAT: Patterns of plant fluorescence with gross primary productivity, Geophys. Res. Lett., 38, L17706, https://doi.org/10.1029/2011GL048738, 2011.
Friedl, M. and Sulla-Menashe, D.: MODIS/Terra+Aqua Land Cover Type Yearly L3 Global 0.05Deg CMG V061, NASA EOSDIS Land Processes Distributed Active Archive Center [data set], https://doi.org/10.5067/MODIS/MCD12C1.061, 2022.
Funk, C., Peterson, P., Landsfeld, M., Pedreros, D., Verdin, J., Shukla, S., Husak, G., Rowland, J., Harrison, L., Hoell, A., and Michaelsen, J.: The climate hazards infrared precipitation with stations – a new environmental record for monitoring extremes, Scientific Data, 2, 150066, https://doi.org/10.1038/sdata.2015.66, 2015.
Funk, C. C., Peterson, P. J., Landsfeld, M. F., Pedreros, D. H., Verdin, J. P., Rowland, J. D., Romero, B. E., Husak, G. J., Michaelsen, J. C., and Verdin, A. P.: A quasi-global precipitation time series for drought monitoring: U.S. Geological Survey Data Series 832, 4 pp., ftp://ftp.chc.ucsb/pub/org/chg/products/CHIRPS-2.0/docs/USGS-DS832.CHIRPS.pdf (last access: 18 September 2022), 2014 (data available at: https://data.chc.ucsb.edu/products/CHIRPS-2.0/, last access: 18 September 2022).
Gerhards, M., Schlerf, M., Mallick, K., and Udelhoven, T.: Challenges and Future Perspectives of Multi-/Hyperspectral Thermal Infrared Remote Sensing for Crop Water-Stress Detection: A Review, Remote Sensing, 11, 1240, https://doi.org/10.3390/RS11101240, 2019.
Global Modeling and Assimilation Office (GMAO): MERRA-2 tavg1_2d_slv_Nx: 2d,1-Hourly,Time-Averaged,Single-Level,Assimilation,Single-Level Diagnostics V5.12.4, Greenbelt, MD, USA, Goddard Earth Sciences Data and Information Services Center (GES DISC) [data set], https://doi.org/10.5067/VJAFPLI1CSIV, 2015a.
Global Modeling and Assimilation Office (GMAO): MERRA-2 tavg1_2d_lfo_Nx: 2d,1-Hourly,Time-Averaged,Single-Level,Assimilation,Land Surface Forcings V5.12.4, Greenbelt, MD, USA, Goddard Earth Sciences Data and Information Services Center (GES DISC) [data set], https://doi.org/10.5067/L0T5GEG1NYFA, 2015b.
Gruber, A., Scanlon, T., van der Schalie, R., Wagner, W., and Dorigo, W.: Evolution of the ESA CCI Soil Moisture climate data records and their underlying merging methodology, Earth Syst. Sci. Data, 11, 717–739, https://doi.org/10.5194/essd-11-717-2019, 2019.
Gu, L., Han, J., Wood, J. D., Chang, C. Y. Y., and Sun, Y.: Sun-induced Chl fluorescence and its importance for biophysical modeling of photosynthesis based on light reactions, New Phytol., 223, 1179–1191, https://doi.org/10.1111/NPH.15796, 2019.
Guanter, L., Bacour, C., Schneider, A., Aben, I., van Kempen, T. A., Maignan, F., Retscher, C., Köhler, P., Frankenberg, C., Joiner, J., and Zhang, Y.: The TROPOSIF global sun-induced fluorescence dataset from the Sentinel-5P TROPOMI mission, Earth Syst. Sci. Data, 13, 5423–5440, https://doi.org/10.5194/essd-13-5423-2021, 2021.
Han, J., Chang, C. Y. Y., Gu, L., Zhang, Y., Meeker, E. W., Magney, T. S., Walker, A. P., Wen, J., Kira, O., McNaull, S., and Sun, Y.: The physiological basis for estimating photosynthesis from Chla fluorescence, New Phytol., 234, 1206–1219, https://doi.org/10.1111/NPH.18045, 2022.
Huang, J., Yu, H., Guan, X., Wang, G., and Guo, R.: Accelerated dryland expansion under climate change, Nat. Clim. Change, 6, 166–171, https://doi.org/10.1038/nclimate2837, 2015.
Huang, J., Li, Y., Fu, C., Chen, F., Fu, Q., Dai, A., Shinoda, M., Ma, Z., Guo, W., Li, Z., Zhang, L., Liu, Y., Yu, H., He, Y., Xie, Y., Guan, X., Ji, M., Lin, L., Wang, S., Yan, H., and Wang, G.: Dryland climate change: Recent progress and challenges, Rev. Geophys., 55, 719–778, https://doi.org/10.1002/2016RG000550, 2017.
Huete, A., Didan, K., Miura, T., Rodriguez, E. P., Gao, X., and Ferreira, L. G.: Overview of the radiometric and biophysical performance of the MODIS vegetation indices, Remote Sens. Environ., 83, 195–213, https://doi.org/10.1016/S0034-4257(02)00096-2, 2002.
Köhler, P.: TROPOMI SIF, ftp://fluo.gps.caltech.edu, last access: 25 May 2023.
Köhler, P., Frankenberg, C., Magney, T. S., Guanter, L., Joiner, J., and Landgraf, J.: Global Retrievals of Solar-Induced Chlorophyll Fluorescence With TROPOMI: First Results and Intersensor Comparison to OCO-2, Geophys. Res. Lett., 45, 10456–10463, https://doi.org/10.1029/2018GL079031, 2018.
Lawal, S., Hewitson, B., Egbebiyi, T. S., and Adesuyi, A.: On the suitability of using vegetation indices to monitor the response of Africa's terrestrial ecoregions to drought, Sci. Total Environ., 792, 148282, https://doi.org/10.1016/J.SCITOTENV.2021.148282, 2021.
Li, X. and Xiao, J.: Global OCO-2 SIF data set (GOSIF), Global Ecology Data Repository [data set], http://data.globalecology.unh.edu/data/GOSIF_v2, last access: 29 April 2022.
Li, W., Duveiller, G., Wieneke, S., Forkel, M., Gentine, P., Reichstein, M., Niu, S., Migliavacca, M., and Orth, R.: Regulation of the global carbon and water cycles through vegetation structural and physiological dynamics, Environ. Res. Lett., 19, 073008, https://doi.org/10.1088/1748-9326/AD5858, 2024.
Li, X. and Xiao, J.: A global, 0.05-degree product of solar-induced chlorophyll fluorescence derived from OCO-2, MODIS, and reanalysis data, Remote Sens., 11, 517, https://doi.org/10.3390/rs11050517, 2019.
Lian, X., Piao, S., Chen, A., Huntingford, C., Fu, B., Li, L. Z. X., Huang, J., Sheffield, J., Berg, A. M., Keenan, T. F., McVicar, T. R., Wada, Y., Wang, X., Wang, T., Yang, Y., and Roderick, M. L.: Multifaceted characteristics of dryland aridity changes in a warming world, Nature Reviews Earth & Environment, 2, 232–250, https://doi.org/10.1038/s43017-021-00144-0, 2021.
Lyon, B. and Dewitt, D. G.: A recent and abrupt decline in the East African long rains, Geophys. Res. Lett, 39, L02702, https://doi.org/10.1029/2011GL050337, 2012.
Ma, Y., Liu, L., Chen, R., Du, S., and Liu, X.: Generation of a global spatially continuous tansat solar-induced chlorophyll fluorescence product by considering the impact of the solar radiation intensity, Remote Sens., 12, 2167, https://doi.org/10.3390/rs12132167, 2020.
Ma, Y., Liu, L., Liu, X., and Chen, J.: An improved downscaled sun-induced chlorophyll fluorescence (DSIF) product of GOME-2 dataset, Eur. J. Remote Sens., 55, 168–180, https://doi.org/10.1080/22797254.2022.2028579, 2022.
Magney, T. S., Bowling, D. R., Logan, B. A., Grossmann, K., Stutz, J., Blanken, P. D., Burns, S. P., Cheng, R., Garcia, M. A., Köhler, P., Lopez, S., Parazoo, N. C., Raczka, B., Schimel, D., and Frankenberg, C.: Mechanistic evidence for tracking the seasonality of photosynthesis with solar-induced fluorescence, P. Natl. Acad. Sci. USA, 116, 11640–11645, https://doi.org/10.1073/pnas.1900278116, 2019.
Martini, D., Sakowska, K., Wohlfahrt, G., Pacheco-Labrador, J., van der Tol, C., Porcar-Castell, A., Magney, T. S., Carrara, A., Colombo, R., El-Madany, T. S., Gonzalez-Cascon, R., Martín, M. P., Julitta, T., Moreno, G., Rascher, U., Reichstein, M., Rossini, M., and Migliavacca, M.: Heatwave breaks down the linearity between sun-induced fluorescence and gross primary production, New Phytol., 233, 2415–2428, https://doi.org/10.1111/NPH.17920, 2022.
Matanó, A., de Ruiter, M. C., Koehler, J., Ward, P. J., and Van Loon, A. F.: Caught Between Extremes: Understanding Human-Water Interactions During Drought-To-Flood Events in the Horn of Africa, Earth's Future, 10, e2022EF002747, https://doi.org/10.1029/2022EF002747, 2022.
Mengistu, A. G., Mengistu Tsidu, G., Koren, G., Kooreman, M. L., Boersma, K. F., Tagesson, T., Ardö, J., Nouvellon, Y., and Peters, W.: Sun-induced fluorescence and near-infrared reflectance of vegetation track the seasonal dynamics of gross primary production over Africa, Biogeosciences, 18, 2843–2857, https://doi.org/10.5194/bg-18-2843-2021, 2021.
Merbold, L., Scholes, R. J., Acosta, M., Beck, J., Bombelli, A., Fiedler, B., Grieco, E., Helmschrot, J., Hugo, W., Kasurinen, V., Kim, D. G., Körtzinger, A., Leitner, S., López-Ballesteros, A., Ndisi, M., Nickless, A., Salmon, E., Saunders, M., Skjelvan, I., Vermeulen, A. T., and Kutsch, W. L.: Opportunities for an African greenhouse gas observation system, Reg. Environ. Change, 21, 104, https://doi.org/10.1007/S10113-021-01823-W, 2021.
Miao, G., Guan, K., Yang, X., Bernacchi, C. J., Berry, J. A., DeLucia, E. H., Wu, J., Moore, C. E., Meacham, K., and Cai, Y.: Sun-Induced Chlorophyll Fluorescence, Photosynthesis, and Light Use Efficiency of a Soybean Field from Seasonally Continuous Measurements, J. Geophys. Res.-Biogeo., 123, 610–623, 2018.
Muthoka, J. M., Antonarakis, A. S., Vrieling, A., Fava, F., Salakpi, E. E., and Rowhani, P.: Assessing drivers of intra-seasonal grassland dynamics in a Kenyan savannah using digital repeat photography, Ecol. Indic., 142, 109223, https://doi.org/10.1016/J.ECOLIND.2022.109223, 2022.
Ngoma, H., Wen, W., Ojara, M., and Ayugi, B.: Assessing current and future spatiotemporal precipitation variability and trends over Uganda, East Africa, based on CHIRPS and regional climate model datasets, Meteorol. Atmos. Phys., 133, 823–843, https://doi.org/10.1007/S00703-021-00784-3, 2021.
NOVELTIS, UPV, SRON, LSCE, and ESA: The TROPOSIF global sun-induced fluorescence dataset from the TROPOMI mission, ESA [data set], https://doi.org/10.5270/esa-s5p_innovation-sif-20180501_20210320-v2.1-202104, 2021.
Otkin, J. A., Svoboda, M., Hunt, E. D., Ford, T. W., Anderson, M. C., Hain, C., and Basara, J. B.: Flash Droughts: A Review and Assessment of the Challenges Imposed by Rapid-Onset Droughts in the United States, B. Am. Meteorol. Soc., 99, 911–919, https://doi.org/10.1175/BAMS-D-17-0149.1, 2018.
Ouma, J. O., Wakjira, D., Amdihun, A., Nyaga, E., Opijah, F., Muthama, J., Otieno, V., Kayijamahe, E., Munywa, S., and Artan, G.: Forage Monitoring and Prediction Model for Early Warning Application over the East of Africa Region, Journal of Atmospheric Science Research, 5, 1–9, https://doi.org/10.30564/jasr.v5i4.4809, 2022.
Piao, S., Wang, X., Wang, K., Li, X., Bastos, A., Canadell, J. G., Ciais, P., Friedlingstein, P., and Sitch, S.: Interannual variation of terrestrial carbon cycle: Issues and perspectives, Glob. Change Biol., 26, 300–318, https://doi.org/10.1111/GCB.14884, 2020.
Pierrat, Z., Magney, T., Parazoo, N. C., Grossmann, K., Bowling, D. R., Seibt, U., Johnson, B., Helgason, W., Barr, A., Bortnik, J., Norton, A., Maguire, A., Frankenberg, C., and Stutz, J.: Diurnal and Seasonal Dynamics of Solar-Induced Chlorophyll Fluorescence, Vegetation Indices, and Gross Primary Productivity in the Boreal Forest, J. Geophys. Res.-Biogeo., 127, e2021JG006588, https://doi.org/10.1029/2021JG006588, 2022.
Porcar-Castell, A., Tyystjärvi, E., Atherton, J., Van Der Tol, C., Flexas, J., Pfündel, E. E., Moreno, J., Frankenberg, C., and Berry, J. A.: Linking chlorophyll a fluorescence to photosynthesis for remote sensing applications: Mechanisms and challenges, J. Exp. Bot., 65, 4065–4095, https://doi.org/10.1093/jxb/eru191, 2014.
Poulter, B., Frank, D., Ciais, P., Myneni, R. B., Andela, N., Bi, J., Broquet, G., Canadell, J. G., Chevallier, F., Liu, Y. Y., Running, S. W., Sitch, S., and Van Der Werf, G. R.: Contribution of semi-arid ecosystems to interannual variability of the global carbon cycle, Nature, 509, 600–603, https://doi.org/10.1038/nature13376, 2014.
Prăvălie, R.: Drylands extent and environmental issues. A global approach, Earth Sci. Rev., 161, 259–278, https://doi.org/10.1016/j.earscirev.2016.08.003, 2016.
Preimesberger, W., Scanlon, T., Su, C. H., Gruber, A., and Dorigo, W.: Homogenization of Structural Breaks in the Global ESA CCI Soil Moisture Multisatellite Climate Data Record, IEEE T. Geosci. Remote, 59, 2845–2862, https://doi.org/10.1109/TGRS.2020.3012896, 2021.
Pricope, N. G., Husak, G., Lopez-Carr, D., Funk, C., and Michaelsen, J.: The climate-population nexus in the East African Horn: Emerging degradation trends in rangeland and pastoral livelihood zones, Global Environmental Change, 23, 1525–1541, https://doi.org/10.1016/j.gloenvcha.2013.10.002, 2013.
Qing, Y., Wang, S., Ancell, B. C., and Yang, Z.-L.: Accelerating flash droughts induced by the joint influence of soil moisture depletion and atmospheric aridity, Nat. Commun., 13, 1139, https://doi.org/10.1038/s41467-022-28752-4, 2022.
Qu, C., Hao, X., and Qu, J. J.: Monitoring Extreme Agricultural Drought over the Horn of Africa (HOA) Using Remote Sensing Measurements, Remote Sens., 11, 902, https://doi.org/10.3390/rs11080902, 2019.
R Core Team: R: A language and environment for statistical computing. R Foundation for Statistical Computing, Vienna, Austria, https://www.R-project.org/ (last access: 17 April 2025), 2022.
Reyer, C. P. O., Leuzinger, S., Rammig, A., Wolf, A., Bartholomeus, R. P., Bonfante, A., de Lorenzi, F., Dury, M., Gloning, P., Abou Jaoudé, R., Klein, T., Kuster, T. M., Martins, M., Niedrist, G., Riccardi, M., Wohlfahrt, G., de Angelis, P., de Dato, G., François, L., Menzel, A., and Pereira, M.: A plant's perspective of extremes: Terrestrial plant responses to changing climatic variability, Glob. Change Biol., 19, 75–89, https://doi.org/10.1111/GCB.12023, 2013.
Robinson, E. S., Yang, X., and Lee, J.-E.: Ecosystem Productivity and Water Stress in Tropical East Africa: A Case Study of the 2010–2011 Drought, Land, 8, 52, https://doi.org/10.3390/land8030052, 2019.
Schaaf, C. and Wang, Z.: MODIS/Terra+Aqua BRDF/Albedo Nadir BRDF Adjusted Ref Daily L3 Global – 500m V061, NASA EOSDIS Land Processes Distributed Active Archive Center [data set], https://doi.org/10.5067/MODIS/MCD43A4.061, 2021.
Shaw, E. A., White, C. T., Silver, W. L., Suding, K. N., and Hallett, L. M.: Intra-annual precipitation effects on annual grassland productivity and phenology are moderated by community responses, J. Ecol., 110, 162–172, https://doi.org/10.1111/1365-2745.13792, 2022.
Smith, W. K., Biederman, J. A., Scott, R. L., Moore, D. J. P., He, M., Kimball, J. S., Yan, D., Hudson, A., Barnes, M. L., MacBean, N., Fox, A. M., and Litvak, M. E.: Chlorophyll Fluorescence Better Captures Seasonal and Interannual Gross Primary Productivity Dynamics Across Dryland Ecosystems of Southwestern North America, Geophys. Res. Lett, 45, 748–757, https://doi.org/10.1002/2017GL075922, 2018.
Sorensen, L.: A spatial analysis approach to the global delineation of dryland areas of relevance to the CBD Programme of Work on Dry and Subhumid Lands, UNEP-WCMC, Cambridge, https://resources.unep-wcmc.org/products/789fcac8959943ab9ed7a225e5316f08 (last access: 7 December 2022), 2007.
Sun, Y., Fu, R., Dickinson, R., Joiner, J., Frankenberg, C., Gu, L., Xia, Y., and Fernando, N.: Drought onset mechanisms revealed by satellite solar-induced chlorophyll fluorescence: Insights from two contrasting extreme events, J. Geophys. Res.-Biogeo., 120, 2427–2440, https://doi.org/10.1002/2015JG003150, 2015.
Sun, Y., Frankenberg, C., Jung, M., Joiner, J., Guanter, L., Köhler, P., and Magney, T.: Overview of Solar-Induced chlorophyll Fluorescence (SIF) from the Orbiting Carbon Observatory-2: Retrieval, cross-mission comparison, and global monitoring for GPP, Remote Sens. Environ., 209, 808–823, https://doi.org/10.1016/j.rse.2018.02.016, 2018.
Sun, Y., Gu, L., Wen, J., van der Tol, C., Porcar-Castell, A., Joiner, J., Chang, C. Y., Magney, T., Wang, L., Hu, L., Rascher, U., Zarco-Tejada, P., Barrett, C. B., Lai, J., Han, J., and Luo, Z.: From Remotely-Sensed SIF to Ecosystem Structure, Function, and Service: Part I – Harnessing Theory, Glob. Change Biol., 29, 2926–2952, https://doi.org/10.1111/gcb.16634, 2023a.
Sun, Y., Wen, J., Gu, L., Joiner, J., Chang, C. Y., van der Tol, C., Porcar-Castell, A., Magney, T., Wang, L., Hu, L., Rascher, U., Zarco-Tejada, P., Barrett, C. B., Lai, J., Han, J., and Luo, Z.: From remotely-sensed solar-induced chlorophyll fluorescence to ecosystem structure, function, and service: Part II – Harnessing data, Glob. Change Biol., 29, 2893–2925, https://doi.org/10.1111/gcb.16646, 2023b.
Tejera-Nieves, M., Abraha, M., Chen, J., Hamilton, S. K., Robertson, G. P., and Walker James, B.: Seasonal decline in leaf photosynthesis in perennial switchgrass explained by sink limitations and water deficit, Front. Plant Sci., 13, 1023571, https://doi.org/10.3389/FPLS.2022.1023571, 2023.
Trisos, C. H., Adelekan, I.O., Totin, E., Ayanlade, A., Efitre, J., Gemeda, A., Kalaba, K., Lennard, C., Masao, C., Mgaya, Y., Ngaruiya, G., Olago, D., Simpson, N. P., and Zakieldeen, S.: Africa, in: Climate Change 2022: Impacts, Adaptation, and Vulnerability. Contribution of Working Group II to the Sixth Assessment Report of the Intergovernmental Panel on Climate Change, edited by: Pörtner, H.-O., Roberts, D. C., Tignor, M., Poloczanska, E. S., Mintenbeck, K., Alegría, A., Craig, M., Langsdorf, S., Löschke, S., Möller, V., Okem, A., and Rama, B., Cambridge University Press, Cambridge, UK and New York, NY, USA, 1285–1455, https://doi.org/10.1017/9781009325844.011, 2022.
Tucker, C. J.: Red and photographic infrared linear combinations for monitoring vegetation, Remote Sens. Environ., 8, 127–150, https://doi.org/10.1016/0034-4257(79)90013-0, 1979.
Turner, A. J., Köhler, P., Magney, T. S., Frankenberg, C., Fung, I., and Cohen, R. C.: A double peak in the seasonality of California's photosynthesis as observed from space, Biogeosciences, 17, 405–422, https://doi.org/10.5194/bg-17-405-2020, 2020.
Wang, C., Beringer, J., Hutley, L. B., Cleverly, J., Li, J., Liu, Q., and Sun, Y.: Phenology Dynamics of Dryland Ecosystems Along the North Australian Tropical Transect Revealed by Satellite Solar-Induced Chlorophyll Fluorescence, Geophys. Res. Lett, 46, 5294–5302, https://doi.org/10.1029/2019GL082716, 2019.
Wang, L., Jiao, W., MacBean, N., Rulli, M. C., Manzoni, S., Vico, G., and D'Odorico, P.: Dryland productivity under a changing climate, Nat. Clim. Change, 12, 981–994, https://doi.org/10.1038/s41558-022-01499-y, 2022a.
Wang, S., Zhang, Y., Ju, W., Wu, M., Liu, L., He, W., and Peñuelas, J.: Temporally corrected long-term satellite solar-induced fluorescence leads to improved estimation of global trends in vegetation photosynthesis during 1995–2018, ISPRS J. Photogramm., 194, 222–234, https://doi.org/10.1016/j.isprsjprs.2022.10.018, 2022b.
Wang, X., Biederman, J. A., Knowles, J. F., Scott, R. L., Turner, A. J., Dannenberg, M. P., Köhler, P., Frankenberg, C., Litvak, M. E., Flerchinger, G. N., Law, B. E., Kwon, H., Reed, S. C., Parton, W. J., Barron-Gafford, G. A., and Smith, W. K.: Satellite solar-induced chlorophyll fluorescence and near-infrared reflectance capture complementary aspects of dryland vegetation productivity dynamics, Remote Sens. Environ., 270, 112858, https://doi.org/10.1016/j.rse.2021.112858, 2022c.
Wang, Z., Schaaf, C. B., Sun, Q., Shuai, Y., and Román, M. O.: Capturing rapid land surface dynamics with Collection V006 MODIS BRDF/NBAR/Albedo (MCD43) products, Remote Sens. Environ., 207, 50–64, https://doi.org/10.1016/J.RSE.2018.02.001, 2018.
Wen, J.: JiamingWen/Kapiti_intraseasonal: Code for Detecting Intra-Seasonal Dryland Vegetation Dynamics Using SIF (v1.0.0), Zenodo [code], https://doi.org/10.5281/zenodo.15200357, 2025.
Wen, J., Köhler, P., Duveiller, G., Parazoo, N. C., Magney, T. S., Hooker, G., Yu, L., Chang, C. Y., and Sun, Y.: A framework for harmonizing multiple satellite instruments to generate a long-term global high spatial-resolution solar-induced chlorophyll fluorescence (SIF), Remote Sens. Environ., 239, 111644, https://doi.org/10.1016/j.rse.2020.111644, 2020.
Williams, A. P., Funk, C., Michaelsen, J., Rauscher, S. A., Robertson, I., Wils, T. H. G., Koprowski, M., Eshetu, Z., and Loader, N. J.: Recent summer precipitation trends in the Greater Horn of Africa and the emerging role of Indian Ocean sea surface temperature, Clim. Dynam., 39, 2307–2328, https://doi.org/10.1007/s00382-011-1222-y, 2012.
Yang, X., Tang, J., Mustard, J. F., Lee, J.-E., Rossini, M., Joiner, J., Munger, J. W., Kornfeld, A., and Richardson, A. D.: Solar-induced chlorophyll fluorescence that correlates with canopy photosynthesis on diurnal and seasonal scales in a temperate deciduous forest, Geophys. Res. Lett., 42, 2977–2987, https://doi.org/10.1002/2015GL063201, 2015.
Yao, J., Liu, H., Huang, J., Gao, Z., Wang, G., Li, D., Yu, H., and Chen, X.: Accelerated dryland expansion regulates future variability in dryland gross primary production, Nat. Commun., 11, 1665, https://doi.org/10.1038/s41467-020-15515-2, 2020.
Yoshida, Y., Joiner, J., Tucker, C., Berry, J., Lee, J. E., Walker, G., Reichle, R., Koster, R., Lyapustin, A., and Wang, Y.: The 2010 Russian drought impact on satellite measurements of solar-induced chlorophyll fluorescence: Insights from modeling and comparisons with parameters derived from satellite reflectances, Remote Sens. Environ., 166, 163–177, https://doi.org/10.1016/j.rse.2015.06.008, 2015.
Yu, L., Wen, J., Chang, C. Y., Frankenberg, C., and Sun, Y.: High-Resolution Global Contiguous SIF of OCO-2, Geophys. Res. Lett, 46, 1449–1458, https://doi.org/10.1029/2018GL081109, 2019.
Yu, L., Wen, J., Chang, C. Y., Frankenberg, C., and Sun, Y.: High Resolution Global Contiguous SIF Estimates from OCO-2 SIF and MODIS, Version 2, ORNL DAAC, Oak Ridge, Tennessee, USA [data set], https://doi.org/10.3334/ORNLDAAC/1863, 2021.
Zeppel, M. J. B., Wilks, J. V., and Lewis, J. D.: Impacts of extreme precipitation and seasonal changes in precipitation on plants, Biogeosciences, 11, 3083–3093, https://doi.org/10.5194/bg-11-3083-2014, 2014.
Zhang, L., Xiao, J., Zheng, Y., Li, S., and Zhou, Y.: Increased carbon uptake and water use efficiency in global semi-arid ecosystems, Environ. Res. Lett., 15, 034022, https://doi.org/10.1088/1748-9326/AB68EC, 2020a.
Zhang, Y.: Contiguous solar induced chlorophyll fluorescence (CSIF), Zenodo [data set], https://doi.org/10.17605/OSF.IO/8XQY6, 2022.
Zhang, Y., Joiner, J., Alemohammad, S. H., Zhou, S., and Gentine, P.: A global spatially contiguous solar-induced fluorescence (CSIF) dataset using neural networks, Biogeosciences, 15, 5779–5800, https://doi.org/10.5194/bg-15-5779-2018, 2018.
Zhang, Y., Gentine, P., Luo, X., Lian, X., Liu, Y., Zhou, S., Michalak, A. M., Sun, W., Fisher, J. B., Piao, S., and Keenan, T. F.: Increasing sensitivity of dryland vegetation greenness to precipitation due to rising atmospheric CO2, Nat. Commun., 13, 4875, https://doi.org/10.1038/s41467-022-32631-3, 2022.
Zhang, Z., Zhang, Y., Porcar-Castell, A., Joiner, J., Guanter, L., Yang, X., Migliavacca, M., Ju, W., Sun, Z., Chen, S., Martini, D., Zhang, Q., Li, Z., Cleverly, J., Wang, H., and Goulas, Y.: Reduction of structural impacts and distinction of photosynthetic pathways in a global estimation of GPP from space-borne solar-induced chlorophyll fluorescence, Remote Sens. Environ., 240, 111722, https://doi.org/10.1016/j.rse.2020.111722, 2020b.
Zhang, Z., Zhang, Z., Hautier, Y., Qing, H., Yang, J., Bao, T., Hajek, O. L., and Knapp, A. K.: Effects of intra-annual precipitation patterns on grassland productivity moderated by the dominant species phenology, Front. Plant Sci., 14, 1142786, https://doi.org/10.3389/FPLS.2023.1142786, 2023.