the Creative Commons Attribution 4.0 License.
the Creative Commons Attribution 4.0 License.
 | 27 May 2025
Biogeochemical functioning of Lake Alaotra (Madagascar): a reset of aquatic carbon sources along the land–ocean aquatic continuum
Vao Fenotiana Razanamahandry
Alberto Vieira Borges
Liesa Brosens
Cedric Morana
Tantely Razafimbelo
Tovonarivo Rafolisy
Gerard Govers
Steven Bouillon
Our understanding of the role of tropical lakes in regional carbon budgets remains hampered by a lack of data covering the vast diversity of lake types and settings. Here, we provide a first comprehensive survey of the carbon (C) biogeochemistry of the Lake Alaotra system, a large shallow lake (surface of 200 km2 and maximum depth of 2 m) surrounded by an extensive floodplain and rice fields located in the highlands of Madagascar. The current landscape in the region is grassland-dominated and dotted by major gullies called “lavaka”, which have historically been claimed to lead to high erosion rates and would, thus, also mobilize large amounts of soil C. We investigated the seasonal variability in the concentrations and stable isotope ratios of inorganic and organic C pools; moreover, we examined a range of other relevant proxies, including physicochemical parameters, dissolved CO2 and CH4 concentrations, total alkalinity, and chlorophyll a (Chl a) from spatially distributed sampling and seasonal monitoring of several rivers. While rivers were found to carry high total suspended matter (TSM) loads with a modest particulate organic C (POC) content, the lake itself and its outflow were characterized by much lower TSM values and a high relative contribution of POC to TSM (% POC). The POC concentration of the outflow (13.0±7.7 mg L−1) was substantially higher than in the inflowing water (1.9±2.1 mg L−1), and δ13C values were also distinct between inflowing water ( ‰) and the lake ( ‰) or its outflow ( ‰). Similarly, the lake outflow was surprisingly rich in dissolved organic carbon (DOC) (9.5±1.4 mg L−1) compared to inflowing water (2.6±1.1 mg L−1). This indicates that the lake and its surrounding wetlands act as a substantial source of additional organic C which is exported downstream. The CO2 and CH4 concentrations in inflowing and outflowing rivers were substantially higher than in lake waters, and they peaked during the rainy season due to lateral inputs from wetlands. However, sources of POC and DOC were uncoupled: δ13C data indicated that marsh vegetation was the main source of net DOC inputs, while phytoplankton contributed substantially to POC in the lacustrine waters, at least during parts of the sampling period. Indeed, lake suspended matter has relatively low POC Chl a ratios (143–564, particularly during the May sampling period), high % POC (10 % to 29 %), and δ13C values ( ‰) distinct from those in marsh-derived organic matter. Despite the evidence for phytoplankton production as a contributor to the lake POC pool, the lake acted as a net source of CO2 to the atmosphere, likely due to the high C inputs from the surrounding marshes and to sediment respiration (considering the shallow water depth). Nevertheless, the partial pressure of CO2 (pCO2) levels in the surface waters of the lake were lower than those in the inflowing and outflowing rivers. This reduction is likely due to the combined effects of phytoplankton production, which assimilates CO2 during photosynthesis, and degassing processes. When CO2-supersaturated riverine water enters the open lake, increased turbulence caused by wind fetch enhances gas exchange with the atmosphere, allowing CO2 to escape more readily from the water column. The biogeochemical functioning of Lake Alaotra differs substantially from the large and deeper East African (sub)tropical lakes and is more similar to lakes surrounded by flooded forests in the Congo River basin, likely due to a combination of its large surface area and shallow water depth and the large extent of surrounding wetlands and floodplains. It acts as an abrupt element in the land–ocean continuum of the catchment, whereby the biogeochemical characteristics of the Maningory River (i.e. the lake outflow) are strongly determined by processes taking place in Lake Alaotra and its wetlands, rather than being reflective of characteristics and processes further upstream in the catchment.
- Article
(3944 KB) - Full-text XML
-
Supplement
(1018 KB) - BibTeX
- EndNote


Datasets on the biogeochemistry and carbon (C) cycling along the terrestrial–aquatic continuum in tropical environments are still scarce in comparison to the boreal and temperate zones. Lakes have traditionally been characterized as sources of CO2 to the atmosphere (Cole et al., 1994, 2007) sustained by the production of CO2 from the degradation of terrestrial organic matter. Accordingly, lakes would then be net heterotrophic systems sustained by external inputs of allochthonous organic matter (dissolved organic C, DOC, and particulate organic C, POC) from the surrounding landscape (catchment) (Del Giorgio et al., 1999). However, the impact of external inputs of allochthonous organic matter on the cycling of organic matter partly depends on the size of the system (surface area and depth), with larger and deeper lakes being less heterotrophic (Del Giorgio and Peters, 1994; Staehr et al., 2012). In tropical lakes, aquatic primary production can be intense due to combined year-round favourable light and temperature conditions and weak water column stratification, favourable to nutrient inputs from deep to surface waters (Lewis, 2010). Morana et al. (2022) showed that African tropical lakes with a low DOC content (non-humic) were net autotrophic systems, leading to low CO2 sources or even sinks of atmospheric CO2 (Borges et al., 2022). Lakes with a high DOC content from wetlands were characterized by low primary production and were strong sources of CO2 to the atmosphere (Borges et al., 2022). In addition, DOC plays an important function in lake ecosystems and regulates the carbon and energy cycle of inland waters (Wetzel, 2003). The study by Morana et al. (2022) showed that in situ primary production in some of the studied lakes could be ∼20 times higher than the organic C burial in sediments. This indicates that much of the carbon fixed through phytoplankton production is rapidly recycled within the lake system, through processes such as microbial respiration, grazing, and remineralization, rather than being buried in sediments or emitted as CO2 to the atmosphere. This finding challenges the traditional view of lakes as net heterotrophic systems (Del Giorgio and Peters, 1993; Duarte and Prairie, 2005; Aufdenkampe et al., 2011).
Irrespective of their trophic status, lakes are often highly active areas in terms of organic matter processing and biogeochemical modifications (Sobek et al., 2006; Tranvik et al., 2018). Moreover, during the transit of water in the lakes, repartitioning of organic matter between dissolved and particulate organic C might take place, and changes in characteristics in the lake could occur and might result in a difference between inflow and outflow characteristics (Tranvik et al., 2009; Hanson et al., 2011). While the number of data on the origin of DOC and POC and on transport fluxes in tropical rivers (e.g. Cuevas-Lara et al., 2021; Richey et al., 2022) has grown steadily, much less is known about the biogeochemical cycling and OC source contributions in tropical lakes. Global data syntheses often show the African continent to be a particular blind spot in terms of data availability (e.g. Toming et al., 2020, for lake DOC and Johnson et al., 2022, for lake methane fluxes), and studies from Madagascar's inland waters are very scarce (Ralison et al., 2008; Marwick et al., 2014). Madagascar's lakes are interesting as they lie within a region that combines tropical, subtropical, and anthropogenically influenced landscapes. These ecosystems are highly sensitive to environmental changes, such as deforestation, agricultural expansion, and climate variability, which affect carbon cycling processes and sediment fluxes. Understanding OC dynamics in Madagascar's lakes provides critical insights into carbon processing in subtropical regions with similar environmental pressures. This lack of data and uncertainty, especially in underrepresented regions like Madagascar, highlight the requirement for the collection of additional datasets over adequate spatial and temporal scales to refine global models of carbon cycling and better predict responses to anthropogenic and climatic changes.
Lake Alaotra is the largest freshwater system in Madagascar and is recognized as a hot spot of biodiversity. It is surrounded by marshes that provide the only remaining habitat of for endangered lemur species (Hapalemur alaotrensis) and by extensive floodplains that represent the most important rice-producing region of Madagascar (Lammers et al., 2015). Because of its high ecological, economical, and scientific value, the Lake Alaotra wetland is recognized as a Ramsar site. The wetland marshes of Lake Alaotra occupy a surface area (∼230 km2) (Mietton et al., 2018) larger than the lake itself (currently ∼200 km2 of open water; Bakoariniaina et al., 2006; Ranarijaona, 2009) and are mainly located in the south-western part of the lake. Water and sediment transported through the rivers pass via floodplains and marshes before entering the lake. The characteristic hills in the Lake Alaotra watershed are currently dominated by grasslands but were likely to have been forested or characterized by wooded savannah vegetation up to ∼2000 years ago (Broothaerts et al., 2022; Razanamahandry et al., 2022). Particular erosional features called “lavaka” – gullies which can reach very large dimensions – dot these landscapes (Brosens et al., 2022; Cox et al., 2010, 2023). Lavaka mainly occur in the central highlands of Madagascar, and their density is particularly high in the region of Lake Alaotra (Cox et al., 2010). Studies of 10Be in river sediments in central Madagascar have indicated that sediments in the river are mainly lavaka-derived rather than colluvial sediments (Cox et al., 2009). In addition, as Lake Alaotra is located in one of the most important agricultural regions of Madagascar, it has been heavily impacted by human activities. The wetlands surrounding the lake have undergone significant alterations, primarily due to their conversion into rice paddies to support local agriculture. This process involves draining natural wetlands, altering their hydrology, and replacing native vegetation with cultivated rice crops. These changes have profoundly impacted the wetlands' ecological balance, biodiversity, and natural functions (such as water filtration, flood control, and providing critical habitats for biodiversity) (Lammers et al., 2015). This transformation has been accompanied by extensive deforestation along the hillslopes, which has increased sediment runoff. Furthermore, the construction of channels and dams for irrigation in the floodplains has disrupted natural hydrological processes, further modifying the state of the Lake Alaotra wetlands. Therefore, there appears to be an intuitive relationship between the forest disappearance, erosional processes, and the sedimentation of the lowlands (Kull, 2002). Erosion has a huge impact in both the upstream and downstream parts of a catchment. In the upstream regions, it not only induces soil losses but, in doing so, also degrades terrestrial ecosystems and their biodiversity (An et al., 2008; Montgomery, 2007; Zheng et al., 2005). Further downstream, the eroded soil is deposited in floodplains and lakes, and will affect the viability of aquatic ecosystems (Jenkins et al., 2010; Pattanayak and Wendland, 2007). There are indications that the productivity of rice in the Lake Alaotra basin dropped considerably to only about 40 % of its former level as a result of the silting of rivers and irrigation channels (Bakoariniaina et al., 2006). A reduction in rice production, along with demographic pressure, leads to increased rates of marshland conversion into agricultural fields or clearing for fishing. Therefore, the natural marshland vegetation has been reduced considerably, often by fire. Although some authors have claimed that eroded sediments have gradually filled Lake Alaotra and had reduced it to 60 % of its original size by the 1960s (Bakoariniaina et al., 2006), recent data on the bathymetry and characteristics of the materials on the bottom of Lake Alaotra indicate that sedimentation in the lake itself remains non-significant (Ferry et al., 2013).
Studies on pollen from Lake Alaotra sediment archives have shown sedimentation rates of 0.3–0.6 mm yr−1 (Broothaerts et al., 2022), which are remarkably low given the high erosion rates in the catchment. This apparent discrepancy can be explained by the significant trapping of sediments in the floodplain and wetlands surrounding the lake. According to Broothaerts et al. (2022), sedimentation rates in the floodplain are approximately 100 times greater than in the lake, while wetlands exhibit rates about 10 times higher. These findings suggest that the majority of sediments mobilized from hillslope erosion are deposited in upstream floodplain and wetland areas, leaving relatively little to reach the lake itself.
Studies on pollen from Lake Alaotra sediment archives have shown sedimentation rates of 0.3–0.6 mm yr−1 (Broothaerts et al., 2022), which are very low considering the high erosion rates of the catchment. Moreover, during the last 1000 years, no significant increase in sedimentation rate was observed (Broothaerts et al., 2022). This highlights the critical role of the floodplain and wetlands as sediment sinks, buffering the lake from excessive sedimentation. This process will be further explored in the discussion and in a follow-up paper that examines elemental and stable isotope data from sediment cores taken within the floodplain, marsh, and lake, which reinforce these observations. In order to adequately interpret organic proxies within such sediment cores and link them to changes in the catchment, a thorough understanding of potential carbon sources within the system is critical; however, the contemporary functioning of Lake Alaotra has never been studied from a limnological or biogeochemical perspective. This context provided an additional rationale for the current study, in which we adopt a landscape-scale approach to investigate the different aquatic C pools and their stable isotope ratios, along with a range of other physicochemical and geochemical parameters, across the continuum of different inflowing water, along the lake surface waters and in its outflow.
2.1 Study area
This study was conducted in the Lake Alaotra basin, Madagascar. Lake Alaotra is Madagascar's largest lake and is situated in the north-east of the island in the Toamasina Province, between 17 and 18° S and between 48 and 49° E, at an altitude of 775 m a.s.l. (above sea level) (Mietton et al., 2018) (Fig. 1). The catchment of the lake drains an area of 4042 km2 (Ferry et al., 2013), and the lake and its wetlands and floodplains are surrounded by hills in an altitude range between 900 and 1300 m a.s.l. (Bakoariniaina et al., 2006). Grasslands form the dominant vegetation type in the Lake Alaotra catchment, and a high density of “lavaka” can be found across the landscape. On average, these reach dimensions of ∼30 m wide, 60 m long, and 15 m deep. The region experiences a tropical climate with two distinct seasons: a hot, rainy season from November to April and a cooler, dry season from May to October, which aligns with the division of our sampling period into (1) a dry season (June–October), characterized by cooler temperatures and lower precipitation, and (2) a rainy season (November–May), with higher temperatures and increased rainfall (Fig. S1). Annual rainfall ranges from 900 to 1250 mm, with the dry season contributing only 7 %–22 % of the total. Rainfall typically peaks in January, with monthly totals exceeding 250 mm. The mean annual temperature in the Lake Alaotra region is 20.6 °C, with average daily minima of 12 °C in July and maxima of 28 °C in January (Ferry et al., 2009).
Lake Alaotra is a shallow lake with an average water depth of 2–4 m (Andrianandrasana et al., 2005). The open-water surface of Lake Alaotra is less than 200 km2, and freshwater water marshes cover around 230 km2 (Bakoariniaina et al., 2006; Copsey et al., 2009); however, these relative areas have varied over the years (Lammers et al., 2015). Lake Alaotra and its wetland marshes are surrounded by floodplains and rice fields, covering around 820 km2 (Ferry et al., 2009).
Lake Alaotra is filled by water mainly from infiltration, runoff, and flooding (Copsey et al., 2009). More than 20 rivers enter the lake, the largest of which are the Anony and Sahamaloto in the north-west and the Sahabe and Ranofotsy in the south-west (Fig. S2). A network of non-natural irrigation canals in the rice fields form an extra connection between the rivers and the lake. The only outflow of the lake is the Maningory River, situated in the north-east of the lake (Figs. 1, S3).
In 1923, the construction of rice fields was initiated in the Lake Alaotra region. In the 1950s, dam construction and the delimitation of rice fields was carried out in order to improve the rice production capacity (Moreau, 1980). Most of the rivers flowing into the lake were progressively equipped with small-scale hydraulic infrastructure to irrigate the rice fields towards the end of the 1980s. This infrastructure generally consisted of small water storage reservoirs and dams (e.g. Sahamaloto) with a large network of canals, thereby impacting the natural river network. Between 2003 and 2009, an additional reservoir was constructed (located in Andilanatoby on the Ranofotsy River) as part of an irrigation rehabilitation project. During the time of our fieldwork, a dam was constructed in the south-east on the Sahabe River.
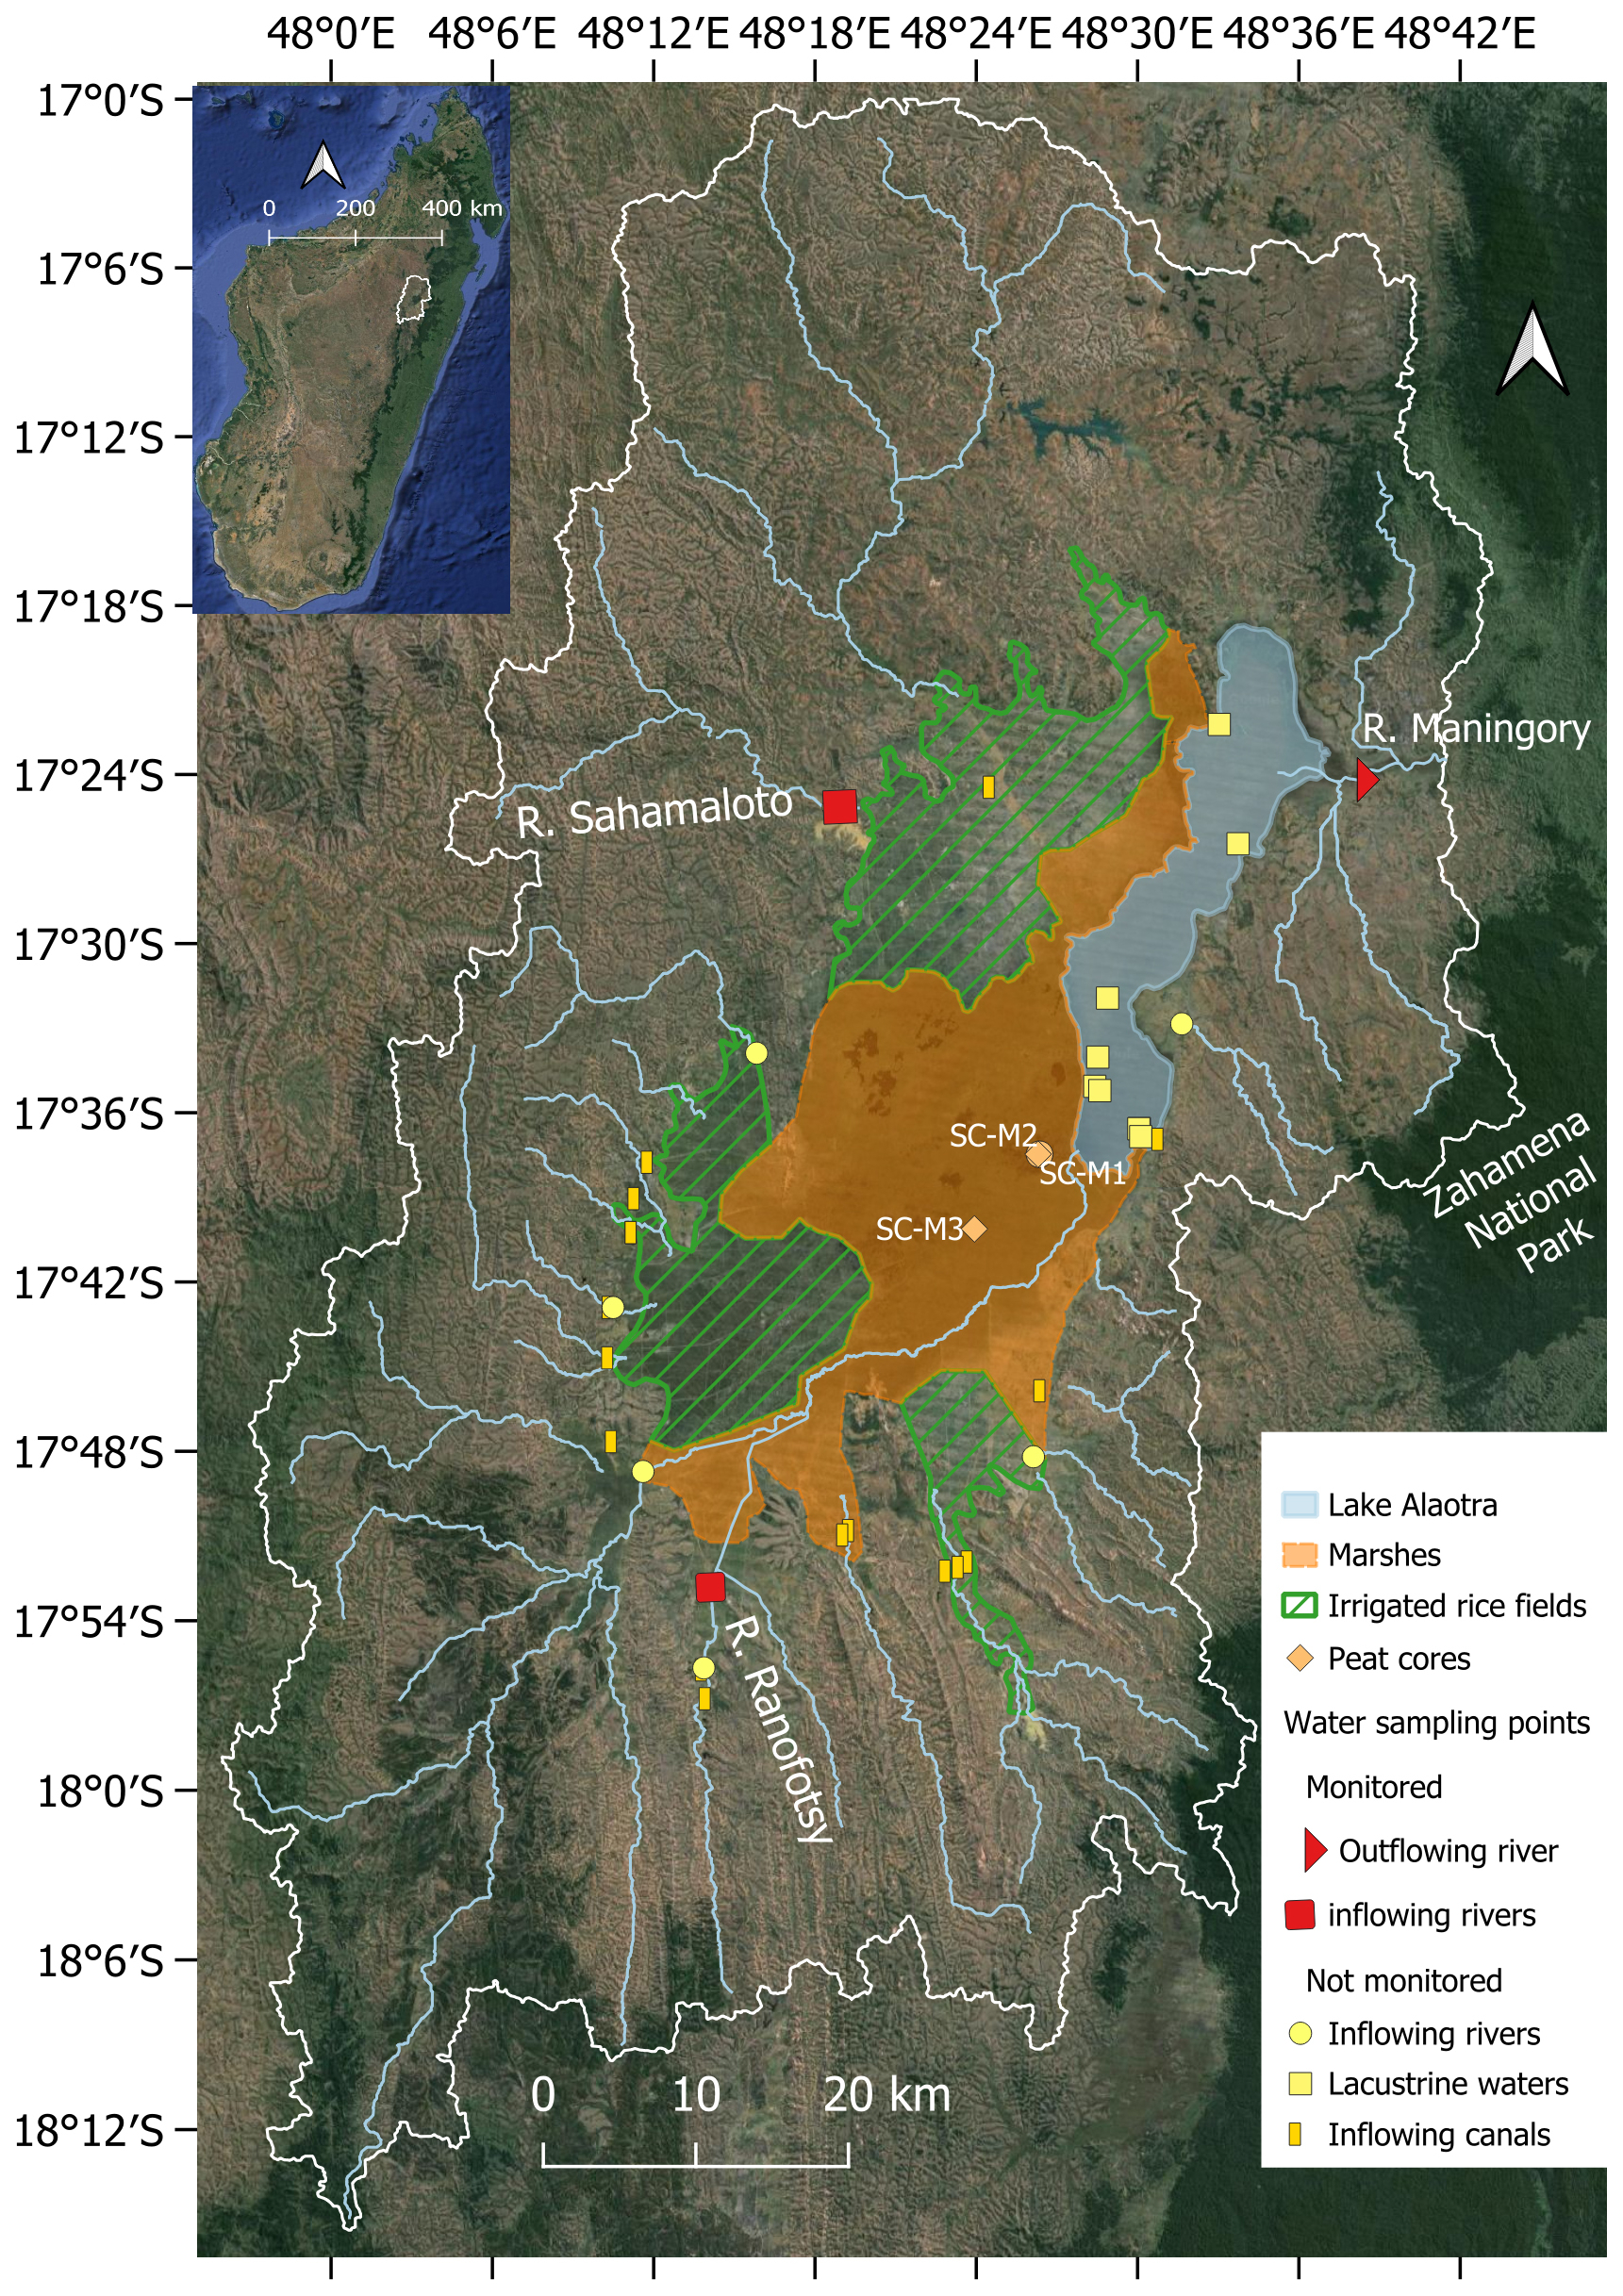
Figure 1Map of the Lake Alaotra catchment (delineated by the white line), indicating the location of sampling sites. Lake Alaotra is indicated by the filled blue polygon, wetlands are delineated by the orange polygon, and the extent of the floodplains is indicated by the dashed green polygon. The background map was taken from © Google Earth 2021.
The monthly discharge of the Maningory River was measured between the years of 1976 and 1986 and ranged from 66 to 315 m3 s−1 (Chaperon et al., 1993). Average discharge of water from the principal inflowing rivers' basins (basin area of 4042 km2) to Lake Alaotra and the Maningory River outflow have been calculated for the period between 1945 and 1979 (Chaperon et al., 1993; Dosseur and Ibiza, 1982). Results showed that there is a delay in the rise of the annual peak discharge of approximately 6 weeks between the inflowing rivers and the Maningory River. The outflow presented a slower decrease in discharge compared to the rapid drop in flows from March to April–May for inflowing rivers, with a time difference of 6 weeks to 3.5 months (Fig. 2). There was also a significant difference between the runoff of the inflowing sub-catchments (500 mm) and the outlet catchment (340 mm).
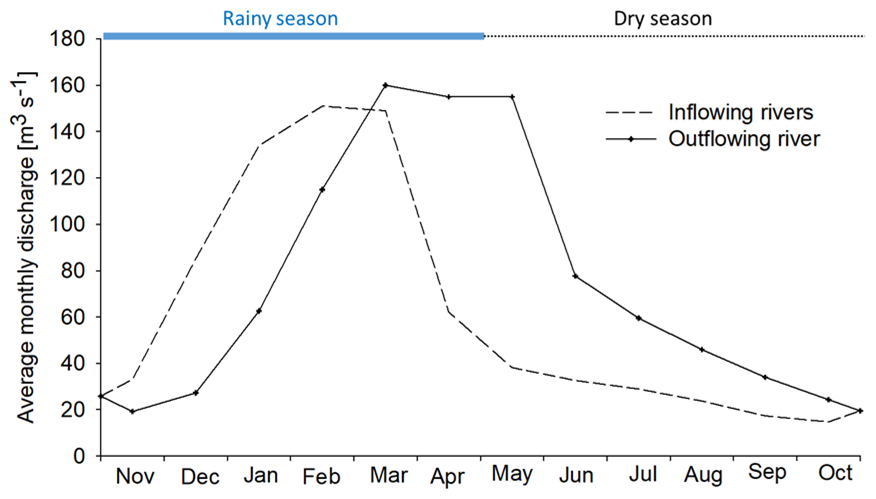
Figure 2Comparison between the average monthly discharge of inflowing rivers and the outflowing river (Maningory River) of Lake Alaotra; data were collected between 1976 and 1987 (Chaperon et al., 1993). The continuous blue line and the dotted black line represent the rainy season and dry season, respectively.
The natural wetland and lake waterbody combined cover around 430 km2, with the wetlands largely located in the south-east of the lake, while the inflowing rivers in the north (Anony) and those in the west are not surrounded by substantial marshes before entering into the lake. These wetlands are seasonally flooded and are dominated by Cyperus madagascariensis or “zozoro” (Cyperaceae), covering ∼50 % of the marshes (Lammers et al., 2015) (see Fig. S4). This tall, robust, floating species requires either the permanent presence of a water column (up to nearly 3 m deep) or at least a waterlogged environment. The population of Cyperus madagascariensis in the Alaotra marshes has degraded due to the installation of rice fields and the clearing of this vegetation for traditional fishing (Ranarijaona, 2009).
The expansion of rice fields in the areas surrounding the lake has predominantly occurred through the conversion of wetland ecosystems (Mietton et al., 2018). Since the era of cultivation, floodplains have been the main zone in which farmers in Lake Alaotra cultivate rice (especially irrigated rice) (Fig. S5). During the rainy season, floods regularly occur in the Alaotra plain and lead to strong siltation over the rice fields (Ferry et al., 2013).
Around 750 000 people, who rely on rice cultivation and fishing as important sources of livelihood (Penot et al., 2012), live in the area of Lake Alaotra (estimate for 2011), a stark increase from ∼110 000 people in the 1960s (CREAM, 2013). Due to this demographic pressure (Jacoby and Minten, 2007), agricultural land is becoming limited, forcing many people to convert the marshes to rice fields (Lammers et al., 2017b). This practice of cultivation consists of growing rice in shallow lake water and converting the marshes at the lake edge. In addition, farmers have started to use the hillslopes for the production of upland rice, maize, peanuts, and cassava and a range of vegetables (Penot et al., 2018).
2.2 Sampling design
2.2.1 River water sampling and monitoring
Water samples from inflowing rivers and canals were collected during our first and second fieldwork campaigns: (i) April–June 2018 (dry season) and (ii) January–March 2019 (rainy season). Due to low water levels during the dry season, sampling was limited to six rivers with sufficient flow. In contrast, the rainy season campaign benefited from higher-flow conditions, allowing for weekly sampling across most rivers and canals. Sites were chosen based on accessibility and their hydrological significance with respect to representing catchment-wide inflow to the lake.
Biweekly monitoring of select rivers and the lake outlet was conducted from April 2018 to August 2019 to assess seasonal changes in water parameters. Rivers selected for monitoring – the Sahamaloto and Ranofotsy rivers – were chosen because they drain grassland-dominated catchments and are accessible before entering the floodplain. The Maningory River, the only outlet of Lake Alaotra, was monitored at the bridge approximately 5 km downstream of the lake outlet, which is assumed to largely reflect the lake outflow characteristics, although periodic inputs by the local riparian environment cannot be excluded.
2.2.2 Lake water sampling
Lake sampling was carried out along a north–south gradient during field campaigns, covering both nearshore and open-water areas. Water samples were collected at a depth of ∼0.5 m using a Niskin bottle to ensure consistency across sites. This sampling depth was chosen to represent surface water conditions where primary productivity and POC are most active.
2.2.3 Marsh vegetation sampling
Marsh sampling was included to examine the role of wetlands as contributors of organic matter to the lake. Marsh plant samples were prioritized over terrestrial plants because they were the dominant vegetation in the wetland zones adjacent to the lake. Terrestrial plant data were referenced from existing studies (e.g. Razanamahandry et al., 2022). Phytoplankton were not sampled directly due to methodological constraints, but constraints on their expected stable isotope composition will be discussed based on δ13C measurements of dissolved inorganic carbon (DIC) and POC, and their potential importance is represented indirectly through in situ measurements of the primary production in the lake water.
2.2.4 Sediment cores
Marsh sediment cores were collected from marshes to study historical deposition patterns and organic matter sources over time. These cores provide a time-resolved view of biogeochemical processes that cannot be captured with surface samples. Within the scope of this paper, data from these depth profiles will be summarized to present an end-member value for marshland-derived OC inputs into the lake.
2.2.5 Rainfall data
Rainfall data were obtained from http://meteoblue.com (last access: 30 May 2024; dataset spanning 40 years), a meteorological service that employs weather models based on NMM (nonhydrostatic mesoscale modelling) technology. We selected two locations: Tanambe (north-west of Lake Alaotra) and Ambatondrazaka (south-east of Lake Alaotra).
2.3 Field and laboratory analyses
Water temperature, conductivity, dissolved oxygen, and pH were measured in situ using a Pro Plus probe (YSI, USA) in surface waters (≤0.5 m).
2.3.1 CH4 measurement and analysis
Samples for the determination of CH4 and were collected with a Niskin bottle in surface waters (≤0.5 m), and the water was transferred, taking care to avoid the inclusion of air bubbles, with a silicone flexible tube into two 60 mL borosilicate serum bottles (Wheaton™), preserved with 200 µL of a saturated solution of HgCl2, sealed with a butyl stopper without a headspace and crimped with an aluminium cap, for subsequent analysis at the laboratory. Measurements of dissolved CH4 concentrations were made with the headspace technique (Weiss, 1981) with a gas chromatograph (GC) on a headspace (20 mL) made with ultrapure N2 (Air Liquide™, Belgium) in two 60 mL serum bottles for a replicate analysis of CH4. The GC (SRI™ 8610C) was equipped with a flame ionization detector for CH4, and it was calibrated with CH4 N2 gas mixtures with mixing ratios of 1, 10, and 30 ppm that were manufactured and certified at ±2 % by Air Liquide™, Belgium. The precision based on duplicate samples was better than ±4 %, and the detection limit was 0.5 nmol L−1.
2.3.2 Partial pressure of CO2 (pCO2) analysis
To measure the partial pressure of CO2 (pCO2), 60 mL syringes were filled either directly with surface water (≤0.5 m) from the river and lake or from the Niskin bottle. An additional syringe was filled with ambient air. A 30 mL headspace (ambient air) was created, and after 10 min of vigorous shaking, the headspace was injected into a LI-COR LI-820 infrared gas analyser (Borges et al., 2015). Calibration of the LI-COR instrument was performed before and after each sampling campaign with ultrapure N2 and a standard (Air Liquide™, Belgium) with a CO2 mixing ratio of 1019 ppm (Air Liquide™, Belgium). The precision of pCO2 measurements was estimated to be ±5 %, and the detection limit was 3 ppm. For logistical reasons, pCO2 measurements were conducted in situ during field campaigns only, using the set-up described above. However, regular monitoring was limited to a subset of rivers and was performed by a separate team without access to the same equipment, resulting in gaps in the dataset. Additionally, not all rivers sampled during the field campaigns were included in the regular monitoring programme, further contributing to the observed gaps.
2.3.3 TSM, POC, PN, and δ13C-POC
Samples for TSM (total suspended matter), POC (particulate organic C), PN (particulate nitrogen), and stable isotope ratios in POC (δ13C-POC) involved the collection of water samples in the centre of the rivers using a Niskin bottle. Samples for TSM were obtained by filtering a known volume of water (approximately 100–250 mL of water) on pre-weighed and pre-combusted (450 °C) 47 mm Whatman GF/F filters with a nominal pore size of 0.7 µm, and the filters were then air-dried. These were later oven-dried prior to weighing to calculate TSM loads.
A known volume (20–50 mL) of water was filtered through pre-combusted (450 °C) 25 mm Whatman GF/F filters to determine the concentrations of POC, PN, and δ13C-POC. These filters were air-dried after collection and then later treated with concentrated-HCl fumes in a desiccator for 4 h to eliminate inorganic C. Afterwards, the filters were dried in the oven at 50 °C and packed in Ag cups. The analysis was conducted using an elemental analyser–isotope ratio mass spectrometer (EA-IRMS: Thermo Flash HT/EA and Delta V Advantage) set-up. Calibrations of concentrations and δ13C data were based on certified caffeine (IAEA-600) and two in-house references: leucine and tuna muscle tissue (previously calibrated versus certified standards). Reproducibility of δ13C measurement was better than ±0.2 ‰. POC PN ratios are reported as mass mass ratios.
δ15N data were measured alongside POC, PN, and δ13C, and while they are not discussed in detail in this study, the full data are provided in the Supplement to ensure that they can be used in future research.
2.3.4 DOC and δ13C-DOC
To determine the dissolved organic C (DOC) concentration and δ13C-DOC values, 40 mL of the filtered water samples (first filtered with pre-combusted (450 °C) 47 mm Whatman GF/F filters with a pore size of 0.7 µm and subsequently with 0.2 µm syringes filters) was collected and stored in glass vials with Teflon-coated screw caps. To preserve the water samples, 100 µL of H3PO4 was added. Analysis of DOC and δ13C-DOC was performed on a wet-oxidation total organic carbon (TOC) analyser (OI Analytical Aurora 1030W) coupled with an isotope ratio mass spectrometer (Thermo Finnigan Delta XP). Quantification and calibration were performed with IAEA-C6 (δ13C = −10.4 ‰) and an internal sucrose standard (δ13C = ‰).
2.3.5 Total alkalinity (TA)
Total alkalinity (TA) was measured via an open-cell titration with 0.1 mol L−1 HCl (Gran, 1952) on 50 mL water samples filtered at 0.2 µm. Data quality was verified based on certified reference material from Andrew Dickson (Scripps Institution of Oceanography, University of California, San Diego, USA). Typical reproducibility of TA measurements was better than ±3 µmol L−1.
2.3.6 DIC and δ13C-DIC
To measure δ13C-DIC, water was transferred directly from the Niskin sampler and stored air-free in 12 mL glass vials. Samples were poisoned with 20 µL of a saturated HgCl2 solution. Analysis of δ13C-DIC was done 1 d after a He (helium) headspace of 2.5 mL was created. To convert DIC to CO2, 100 µL of acid H3PO4 (99 %) was added into the vials, followed by an overnight equilibration. Approximately 1 mL of the headspace was then injected into the He flow of the EA-IRMS set-up described above. δ13C values were corrected for isotope fractionation between the dissolved CO2 in the water and the CO2 in the created headspace and for the partitioning of CO2 between the two phases as described in Gillikin and Bouillon (2007).
The DIC concentration was calculated with the CO2SYS (V2.1) Excel macro created by Lewis and Wallace (1998), in which values of water temperature, TA measurement, and pCO2 direct measurement are the inputs.
2.3.7 Chlorophyll a
The concentration of chlorophyll a (Chl a) was determined from the extraction of pigments from filtered lake water. A known volume of water was filtered through pre-combusted (450 °C) 47 mm Whatman GF/F 0.7 µm filters and later stored in a freezer until analysis. High-performance liquid chromatography (HPLC) was used to determine pigment concentrations. Pigments were extracted in 10 mL of 90 % HPLC-grade acetone. The pigment extract was stored in 2 mL amber vials at −25 °C prior to two sonification steps of 15 min separated by an overnight period at 4 °C. The gradient elution method described by Wright et al. (1991), combined with a Waters Corporation system comprising a photodiode array and fluorescence detectors were used to perform the HPLC analyses. Calibration is based on commercial external standards (DHI Laboratory Products, Denmark). Typical reproducibility of pigment concentration measurement was better than 7 %. The CHEMTAX software (CSIRO Marine Laboratories) based on input ratio matrices adapted for freshwater phytoplankton is used to process pigment concentration data.
2.3.8 Primary production rates
We measured the pelagic primary production (PP) rate in the lake by in situ 13C incubations at different light intensities. First, a solution of 500 mL of surface water spiked with NaH13CO3 was prepared. A subsample of this solution was transferred and preserved in triplicate 12 mL Exetainer vials and immediately poisoned with saturated 20 µL solution of HgCl2 to measure the initial δ13C-DIC value of the spiked water. Eight 50 mL polycarbonate flasks were filled with the spiked solution and were organized into a floating incubator with different filters to provide light shading from 0 % to 90 % of natural midday light energy. An Odyssey photosynthetic irradiance recording system (photosynthetic active radiance (PAR) logger) was used to monitor the incident light during the entire period of the field campaign. At the end of the incubation, which lasted at least 2 h, we added 100 µL of formalin to instantly stop the biological activity. One supplementary bottle was processed in a similar way at the beginning and at the end of the incubation to produce a dark incorporation control. Each water sample was then filtered on a pre-combusted (450 °C) 25 mm Whatman GF/F filter to collect the particulate fraction. These PP incubations were performed four times during the first campaign (April–July 2018), two times during the second fieldwork campaign (January 2019–March 2019), and three times during the third campaign (August–October 2019). In addition, PP incubations were performed in the reservoirs of Andilanatoby (in the south of the catchment) and Sahamaloto (in the north-west of the catchment) during the first and second campaign (Fig. 1). Analyses of δ13C-POC and δ13C-DIC for primary production samples followed the same procedures as described earlier; however, given the high 13C enrichments in the DIC pool, the obtained δ13C values were not corrected for isotope fractionation between gaseous and dissolved CO2.
To calculate the specific photosynthetic rate in each individual bottle i,Pi (in ), we followed Dauchez et al. (1995) based on the initial and final δ13C-POC values and δ13C-DIC of the spiked incubated solution and assuming that isotopic discrimination is negligible (Legendre and Gosselin, 1997).
For each experiment, the maximum specific photosynthetic rate Pm (in ) and the irradiance at the onset of light saturation Ik (, where µE denotes microeinsteins) were obtained by fitting Pi into the irradiance gradient provided by the incubator Ii (), using the following Vollenweider equation, with a=1 and n=1, allowing for photoinhibition (Vollenweider, 1966):
where Pi is the photosynthetic rate in bottle i during the incubation time and Ii is the corresponding mean light during the incubation. Fitting was performed using the Gauss–Newton logarithm for non-linear least-squares regression. Daily depth-integrated primary production (mg C m−2 d−1) was calculated according to Kirk (1994) using the following equation:
where P(z,t) is the photosynthesis at depth z and time t, and I(z,t) is the underwater light determined from Ke and surface irradiance recorded every 5 min and assuming a vertically homogenous Chl a profile. Assuming that short-term incubation provides an estimate that is close to gross primary production (GPP), we calculated water column daily respiration (R, in mg C m−2 d−1) as in Reynolds (2006), considering a respiration rate of 0.16 mg C mg Chl a−1 h−1 at 18 °C (based on López-Sandoval et al., 2014, and a Q10 of 2 for adjusting for lake temperature, a constant respiration rate over 24 h, and the whole lake depth at the study sites).
2.4 OC analysis of vegetation and marsh sediment cores
Different common marsh plant species were sampled. Vegetation samples were air-dried in the field and then oven-dried at 50 °C in the laboratory. A mortar, pestle, and liquid nitrogen were used to grind dried vegetation samples into a well-homogenized powder.
Sediment cores were collected in Lake Alaotra marsh (Fig. 1) with an UWITEC gravity corer adapted for manual coring with 2 m sampling tubes (diameter of 6 cm). SC-M1 and SC-M2 were collected in the eastern part of the marshes, which is permanently waterlogged, whereas core SC-M3 was collected further south at a location that is not waterlogged throughout the year (Fig. 1). All cores were sliced at a resolution of 1 cm. Samples were stored in a portable freezer at −18 °C for preservation. Afterwards, sediment core samples were freeze-dried and homogenized in order to take subsamples for laboratory analysis.
Subsamples were weighed into Ag cups to determine OC content, total nitrogen content, and δ13C and δ15N of organic matter. All subsamples (except for vegetation) were acidified with 40 µL HCl (10 %) to eliminate all inorganic C. OC content, total nitrogen content, and δ13C of OC were measured as described above for POC, PN, and δ13C-POC.
3.1 Seasonal water level variability
The discharge of inflowing rivers and canals (inflowing water) responds strongly to the seasonality in precipitation in the catchment; thus, water levels were high mainly during the rainy season and low (up to dry conditions) during the dry season (Fig. 3). Water levels of the Maningory River (lake outlet) also varied seasonally (Fig. 3), although with a much smoother cycle, being lowest in December and highest in May of the year of sampling.
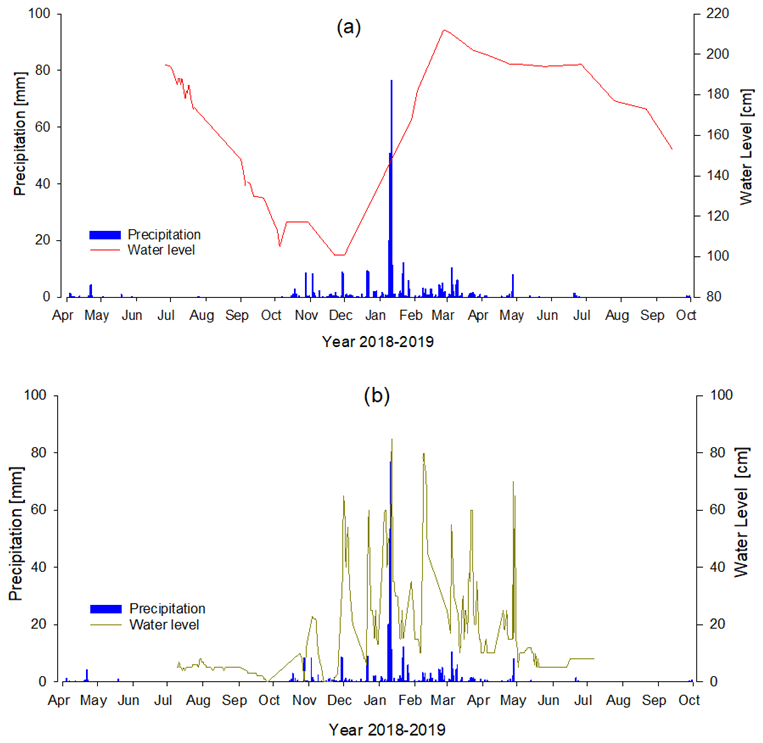
Figure 3Variation in water levels (solid line, right y axis; our data) of the Maningory (a) and the Ranofotsy (b) rivers and the amount of daily precipitation (bars, left y axis) in the region during sampling period. Precipitation data were obtained from meteoblue (http://www.meteoblue.com, last access: 30 May 2024).
3.2 Dissolved oxygen
The saturation level of dissolved oxygen (expressed as a %) in inflowing water showed a higher value during the dry season (87.3±18.2 %) compared to the rainy season (77.0±14.5 %). No seasonal variation was observed for the saturation of dissolved oxygen in lacustrine water, and the values ranged between 58.4 % and 104.5 % with an average value of 83.4 %. The saturation of dissolved oxygen in the outlet waters was higher during the dry season, with an average value of 71.2±29.3 % compared to the value during the rainy season (47.1±28.5 %). The saturation levels of dissolved oxygen inflowing and lacustrine water were higher compared to the saturation level of outflowing water.
3.3 pH and dissolved inorganic carbon (DIC)
Inflowing water showed pH values of 7.2±0.5, increasing slightly in Lake Alaotra (7.4±0.6), but lower values were found in the Maningory River (outlet; 6.9±0.6). The DIC concentrations for inflowing water varied between 213 and 2149 µmol L−1, with an average value of 690±158 µmol L−1, and no significant seasonal variation was observed. The trends in the DIC concentrations of lacustrine water showed a seasonal variation, with a higher value during the rainy season (812±106 µmol L−1) compared to the dry season (608±134 µmol L−1). For the water in the lake outlet, the DIC concentration values ranged between 485 and 931 µmol L−1, with an average of 768 µmol L−1, and no seasonal variation was observed. There was a significant difference between the DIC concentrations of the inflowing and outlet waters. The DIC concentration at the outlet showed a higher value.
3.4 pCO2 and CH4 dynamics
The pCO2 values were higher in the lake outflow (7242±3709 ppm) than in the inflowing rivers and canals (3507±2861 ppm). The lowest pCO2 values were observed in the lake (1595±881 ppm) (Fig. 4). Dissolved CH4 concentrations were greater in the lake outflow (2040±804 nmol L−1) than in the inflowing rivers and canals (1157±1986 nmol L−1). The lowest dissolved CH4 values were found in the lake (91±171 nmol L−1). pCO2 and CH4 were correlated across the datasets (Fig. 5). pCO2 and dissolved CH4 concentrations increased during the rainy season, as shown in Fig. 6.
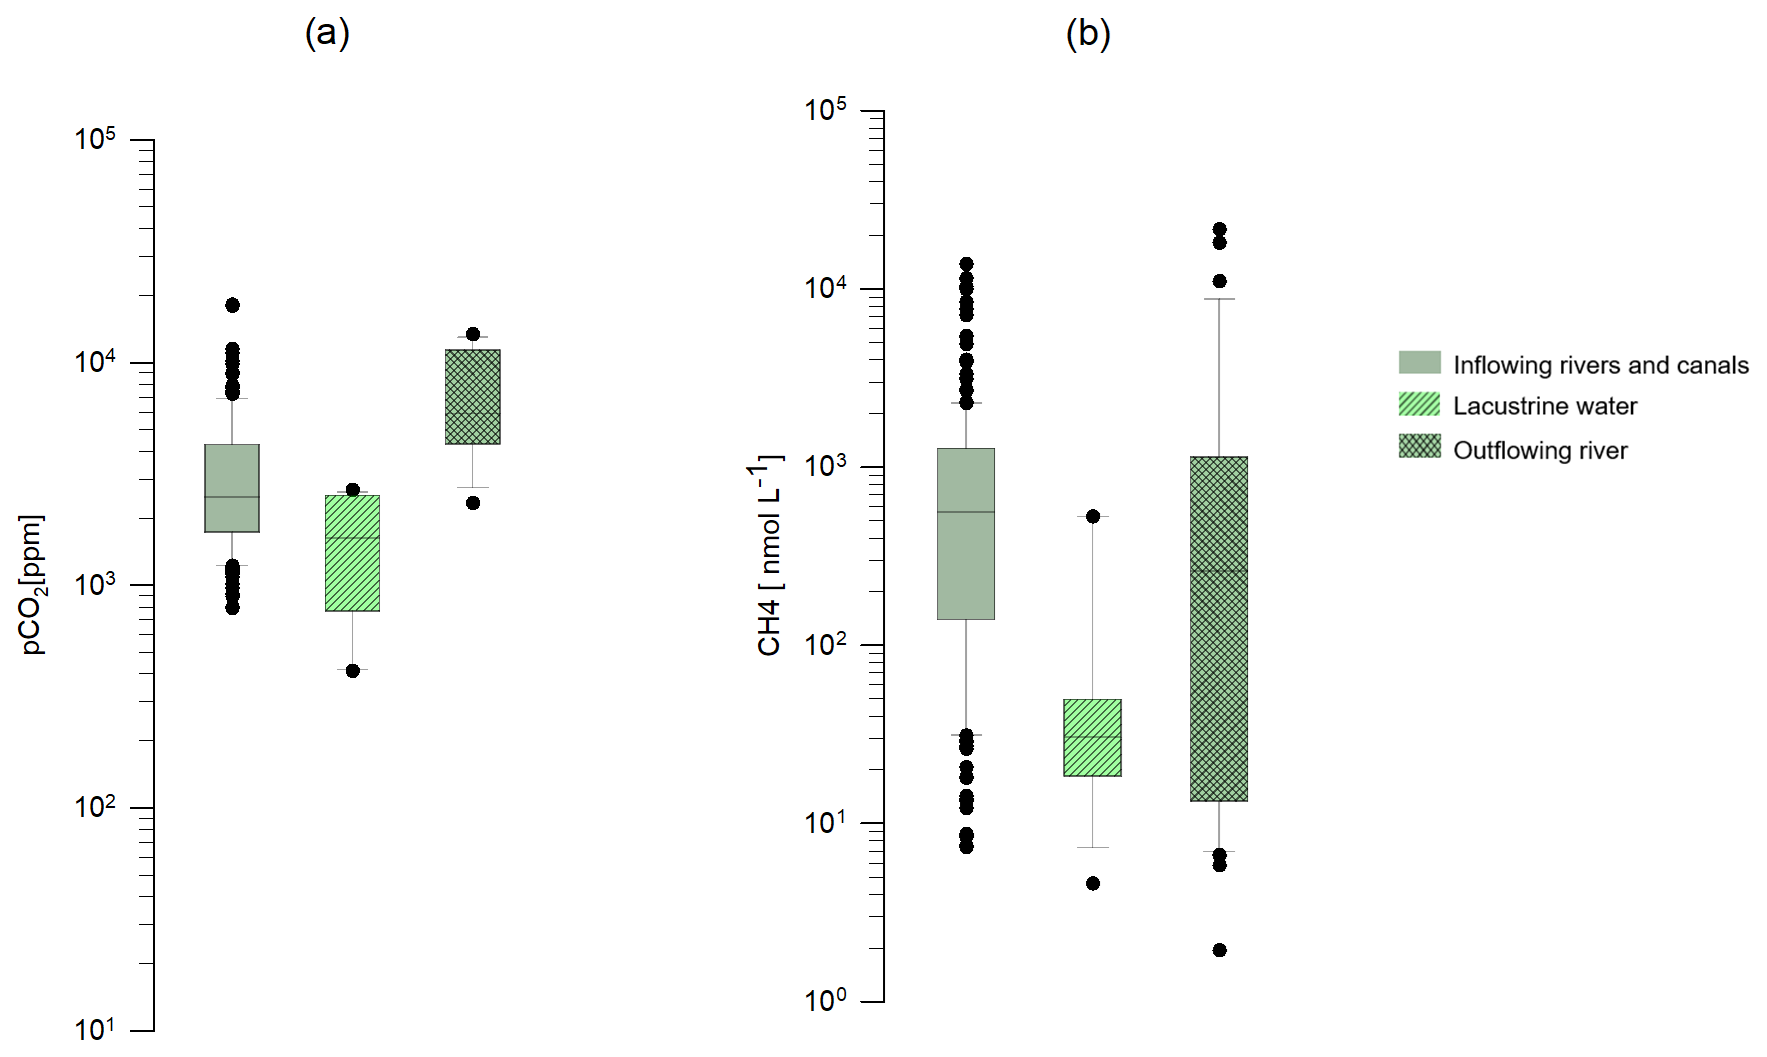
Figure 4Box plot of the pCO2 (a) and the dissolved CH4 concentration (b) of inflowing rivers and canals, Lake Alaotra, and the Maningory River (lake outflow).
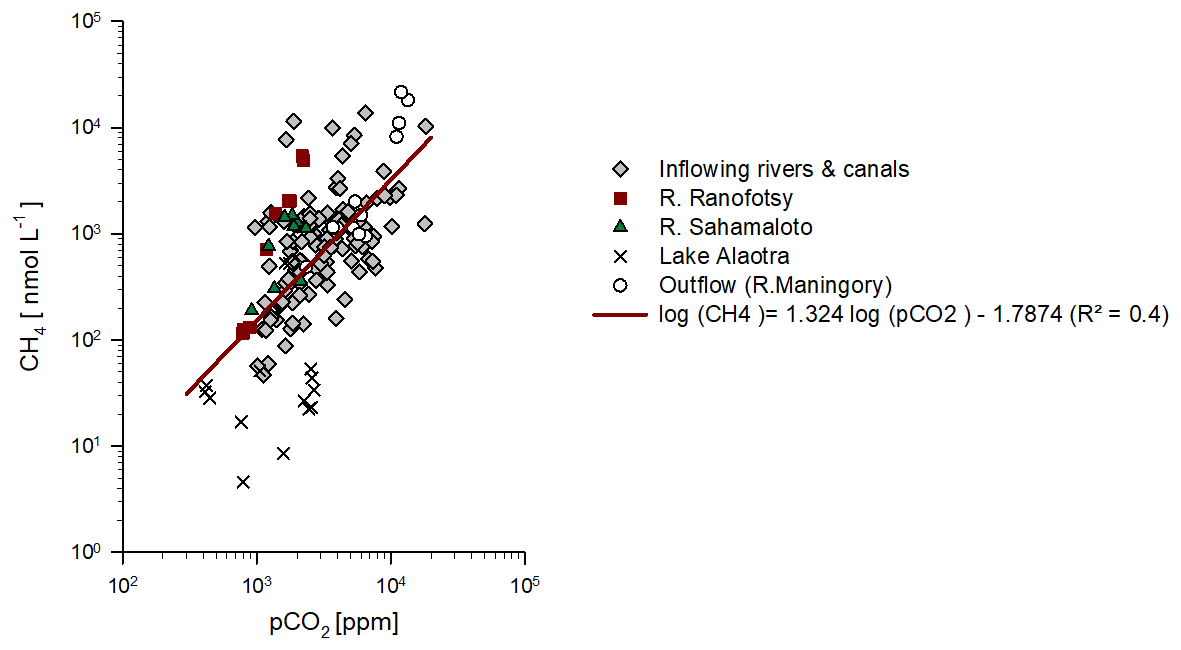
Figure 5Relation of CH4 versus pCO2 in water samples. The solid red line represents the regression line of CH4 versus pCO2 on a log–log scale.
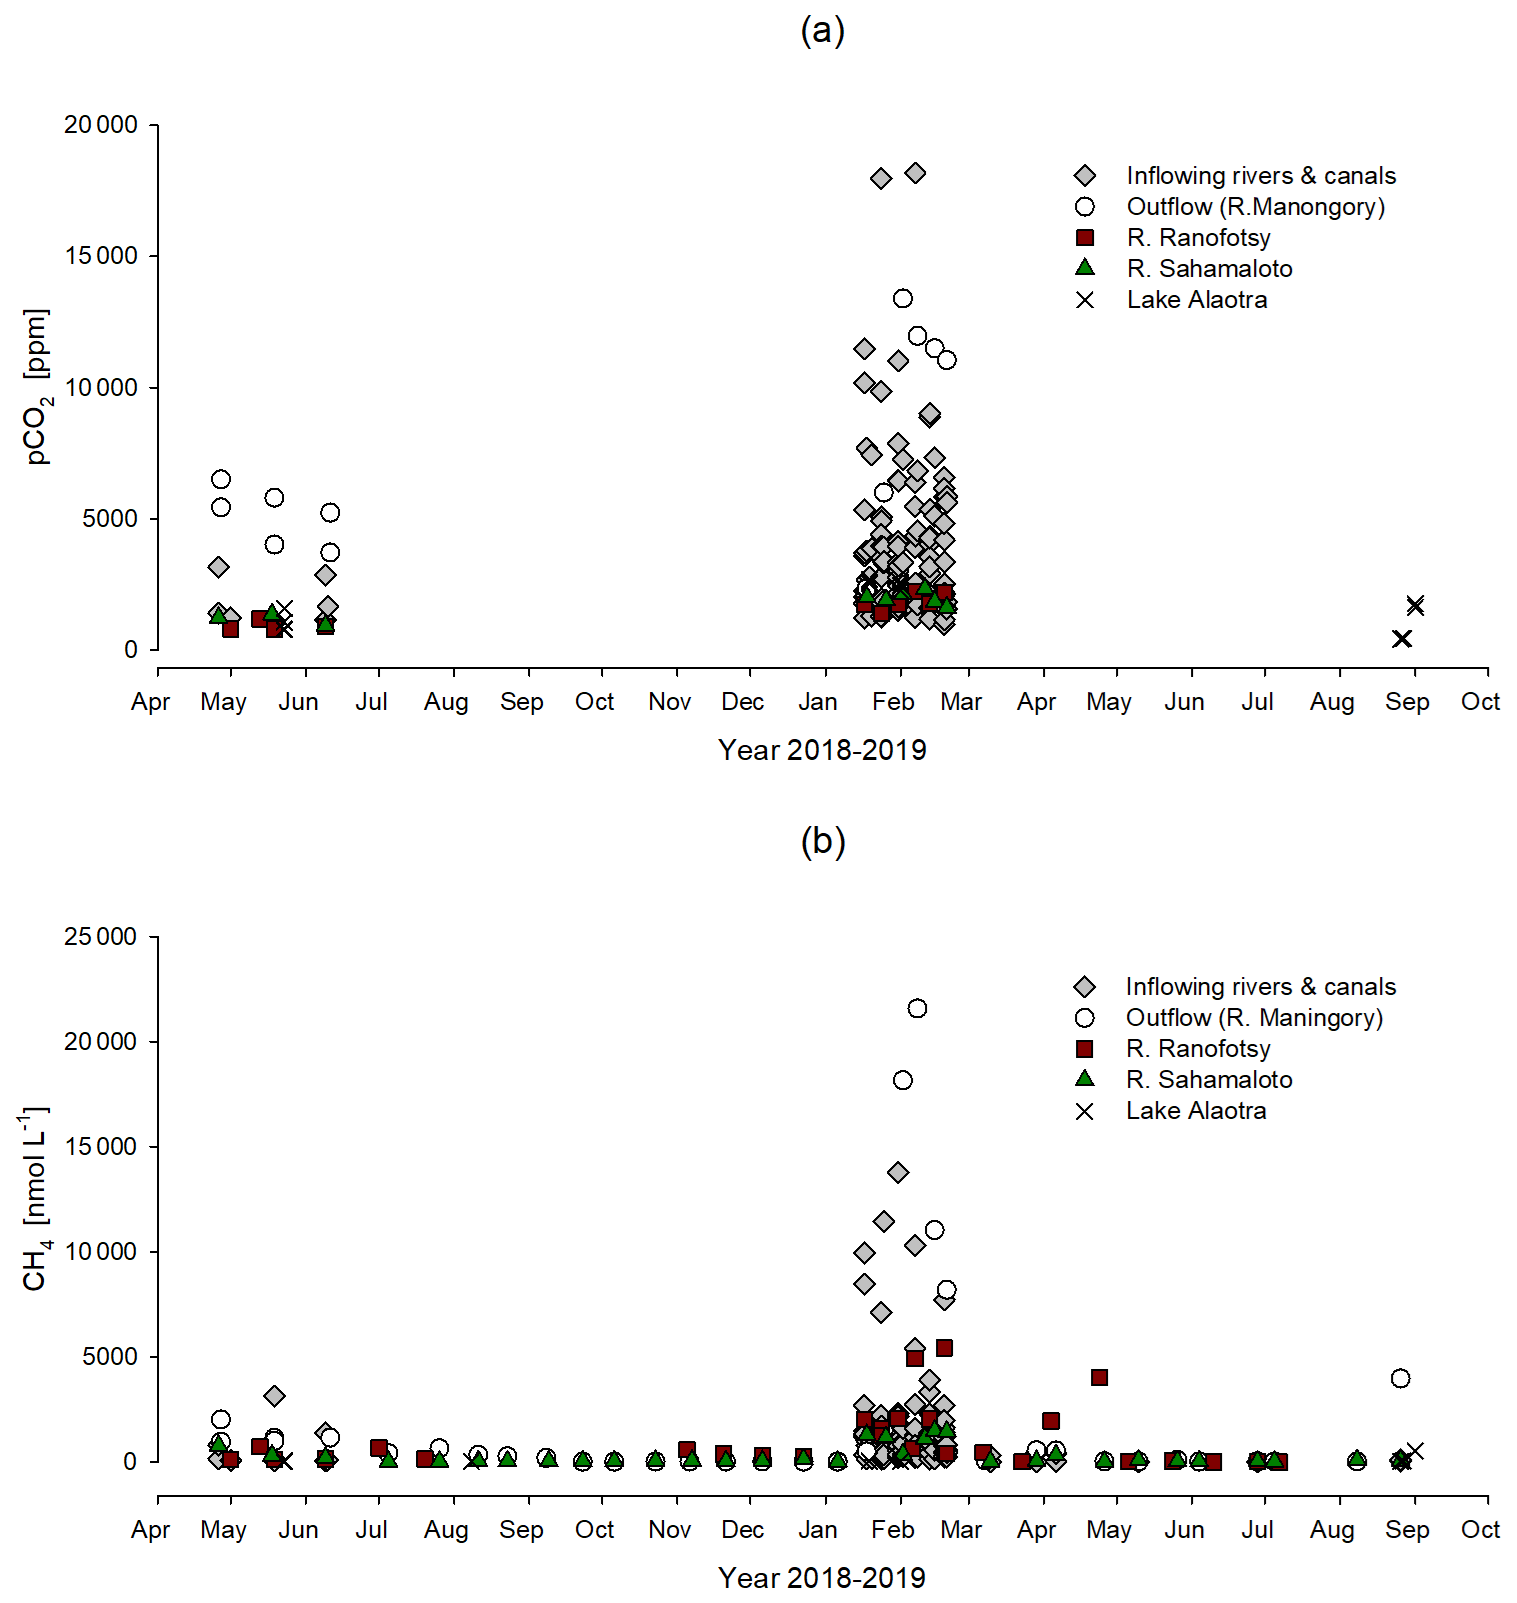
Figure 6Seasonal variation in (a) the pCO2 (expressed in ppm) and (b) CH4 (expressed in nmol L−1) in water from inflowing rivers and canals, in the lake, and in lake outflow (Maningory River) in the Alaotra Lake system (Madagascar) between May 2018 and September 2019.
3.5 Total suspended matter (TSM)
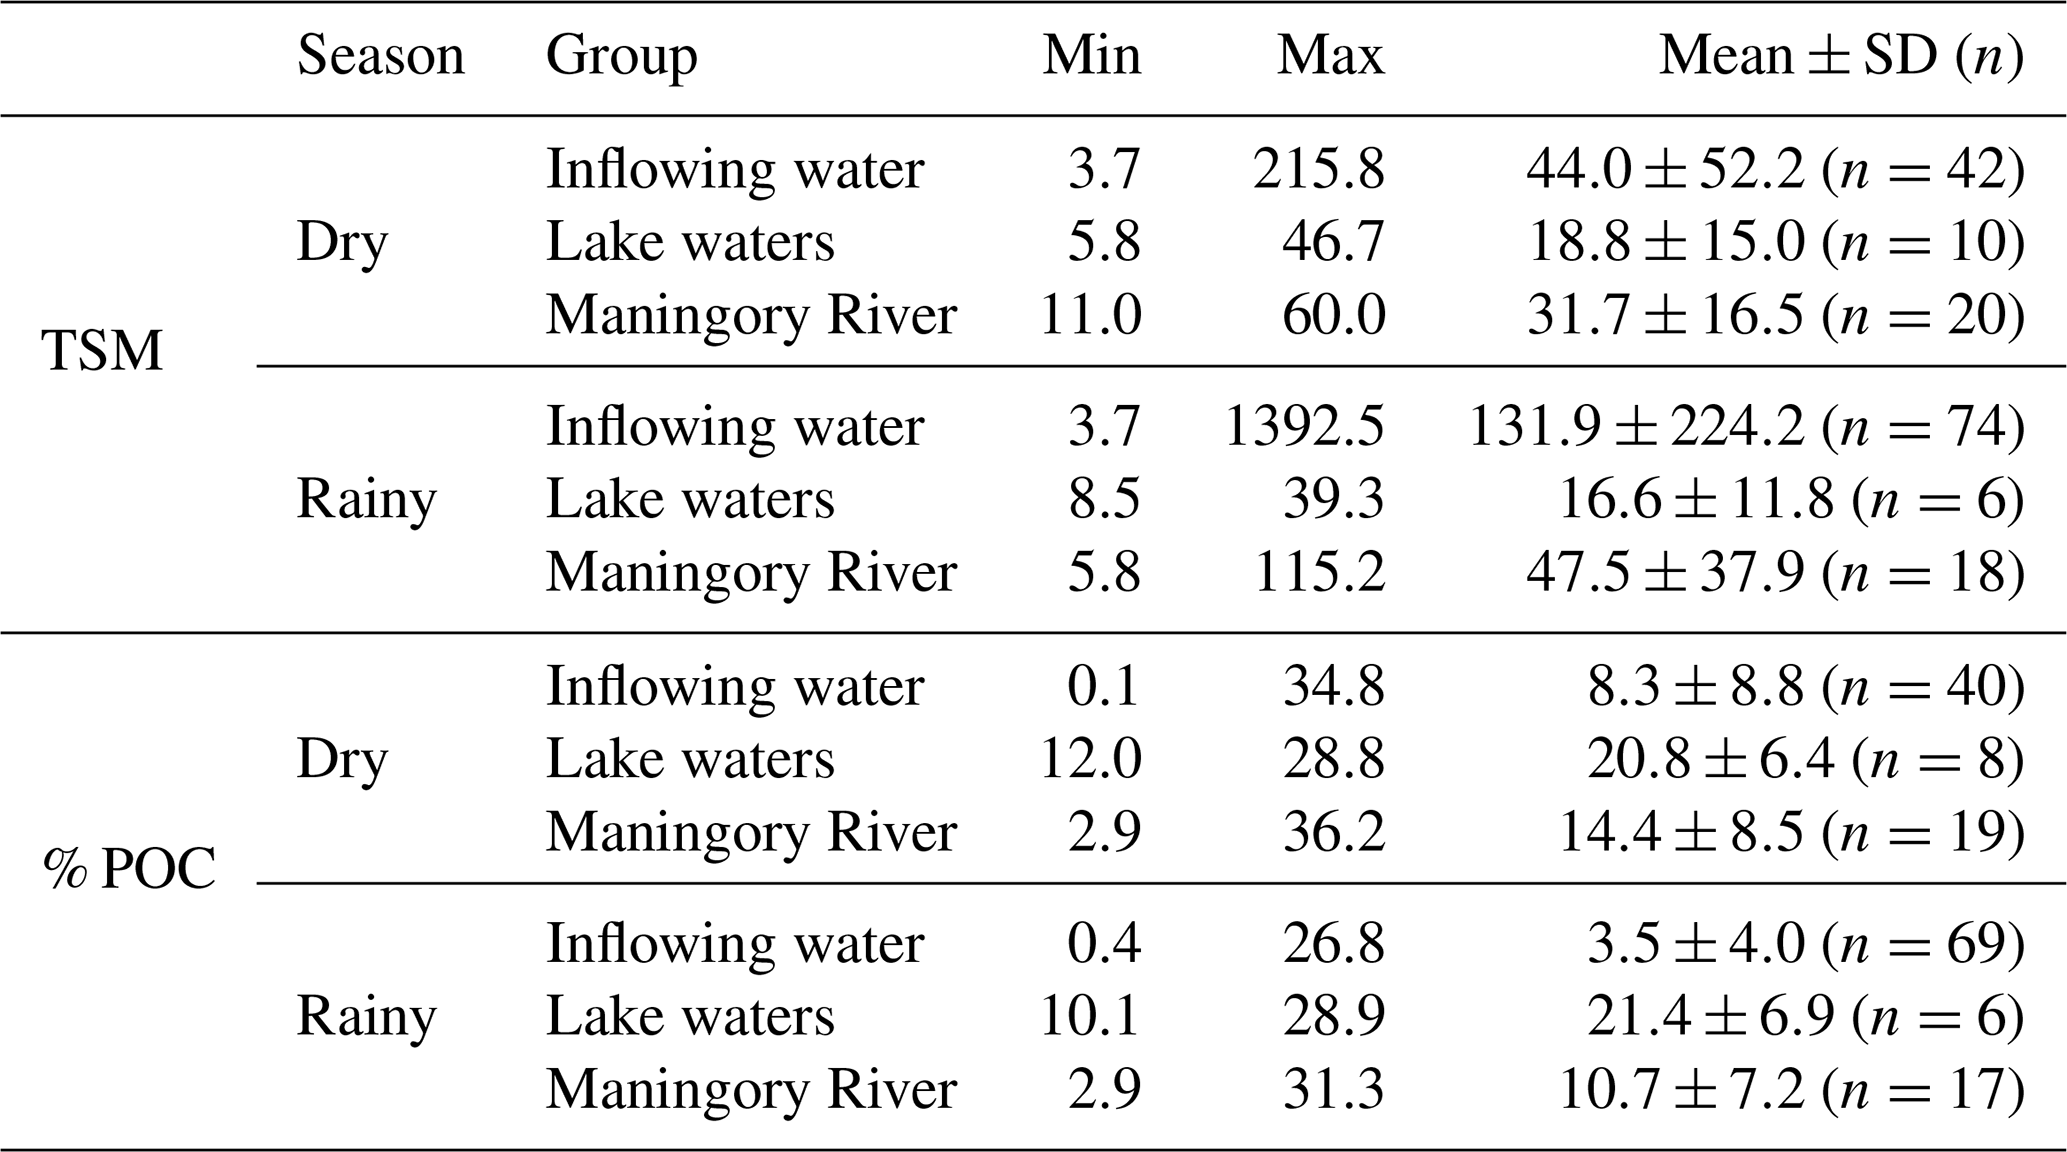
TSM concentrations of the inflowing water ranged between 3.7 and 215 mg L−1 during the dry season and between 3.7 and 1392.5 mg L−1 during the rainy season (Table 1), reaching maximum values during the middle of the rainy season (January and February). Within Lake Alaotra, TSM varied between 5.8 and 46.7 mg L−1 during the dry season and between 8.5 and 39.3 mg L−1 during the rainy season. At the outlet (Maningory River), TSM ranged between 11 and 60 mg L−1 and between 5.8 and 115.2 mg L−1 during the dry and rainy seasons, respectively. The highest TSM values in the Maningory River were reached at the start of the rainy season, when the water levels were the lowest.
3.6 Particulate organic carbon (POC) and its characteristics
POC concentrations of inflowing water varied between 0.3 and 2.4 mg C L−1 and between 0.5 and 7.5 mg C L−1 during the dry and rainy seasons, respectively, reaching maximal values in the middle of the rainy season (Fig. 7a). POC concentrations in Lake Alaotra ranged between 1.4 and 6.5 mg L−1, with an average value of 3.0±1.7 mg L−1, and increased further at the Maningory River outlet (1.2–10 mg L−1) with an average value of 4.2±2.4 mg L−1.
The contribution of POC to the TSM loads of inflowing water (% POC) was on average 8.3±8.8 % and ranged between 0.1 % and 34.8 % during the dry season. During the rainy season, % POC varied between 0.4 % and 26.5 % with an average of 2.4±4.0 %. The contribution of POC to the TSM was much higher within Lake Alaotra, ranging between 12.0 % and 28.9 % with no clear seasonal variation (20.8±6.4 % and 21.4±6.9 % during the dry and rainy season, respectively). In the lake outlet, % POC varied in a narrow range and was significantly higher compared to that of rivers: on average 14.4±8.5 % and 10.7±7.2 % during the dry and rainy seasons, respectively.
δ13C-POC of inflowing waters ranged between −28.3 ‰ and −19.0 ‰ (Fig. 8) with an average of ‰. The average δ13C-POC value of inflowing water during the rainy season ( ‰) was slightly higher than that during the dry season ( ‰), whereas no seasonality was evident in Lake Alaotra ( ‰). δ13C-POC at the outlet varied between −28.3 ‰ and −21.9 ‰ with an average of ‰. The suspended organic matter pool of inflowing waters was characterized by an average POC PN of 10.3±2.6, while the POC PN ratio of the outlet averaged 9.5 and varied between 6 and 12.2. The POC PN ratio of lacustrine water ranged from 8.3 to 11.3.
Table 1TSM and % POC (minimum, maximum, and mean values) of samples from inflowing water, Lake Alaotra, and for the Maningory River (lake outlet) during the rainy and dry season.
3.7 Dissolved organic carbon (DOC) and δ13C values
DOC concentrations of the inflowing waters ranged between 1.0 and 8.1 mg C L−1 (Figs. 7b, 8), with an average value of 2.6±1.1 mg C L−1. DOC concentrations of the two monitored rivers (Ranofotsy and Sahamaloto rivers) ranged between 1.0 and 5.3 mg C L−1, and no significant seasonal variation was observed (Fig. 7). DOC concentrations of lacustrine water varied between 7.5 and 18.6 mg L−1, and the maximum DOC concentrations were obtained during the rainy season (Fig. 7b). The DOC concentration of the Maningory River varied between 7.6 and 13.7 mg L−1, with an average of 9.5±1.4 mg L−1.
The δ13C-DOC values of inflowing water (river and canals) ranged between −30.9 ‰ and −15.2 ‰, with an average value of ‰. The δ13C-DOC values of lacustrine water ranged between −24.0 ‰ and −20.3 ‰, with an average value of ‰. The δ13C-DOC values at the outlet varied between −23.6 ‰ and −19.4 ‰, with an average value of ‰ (Figs. 7, 8).
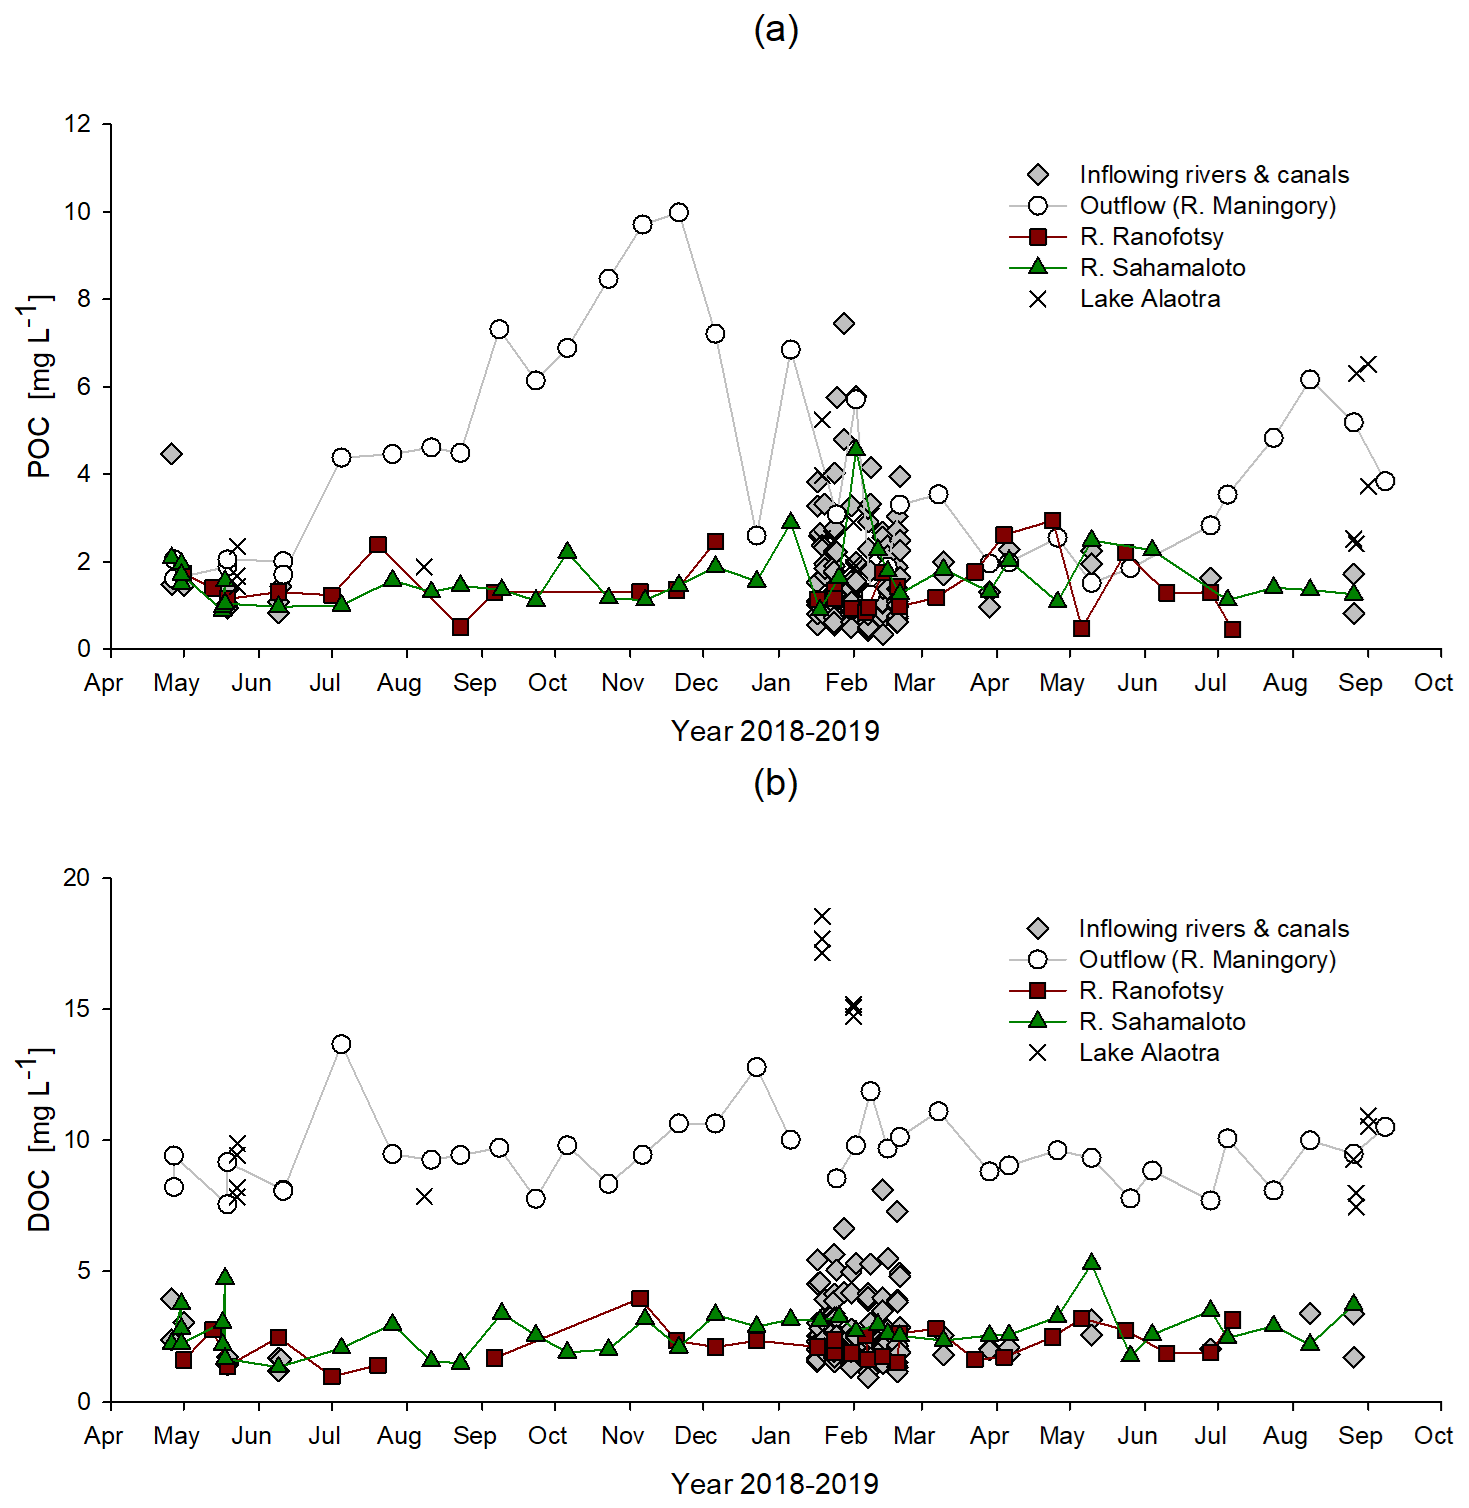
Figure 7Seasonal variation in (a) the particulate organic carbon (POC) and (b) the dissolved organic carbon (DOC) concentrations (expressed in mg C L−1) in water from inflowing rivers and canals, in the lake, and in lake outflow (Maningory River) in the Alaotra Lake system (Madagascar) between May 2018 and September 2019.
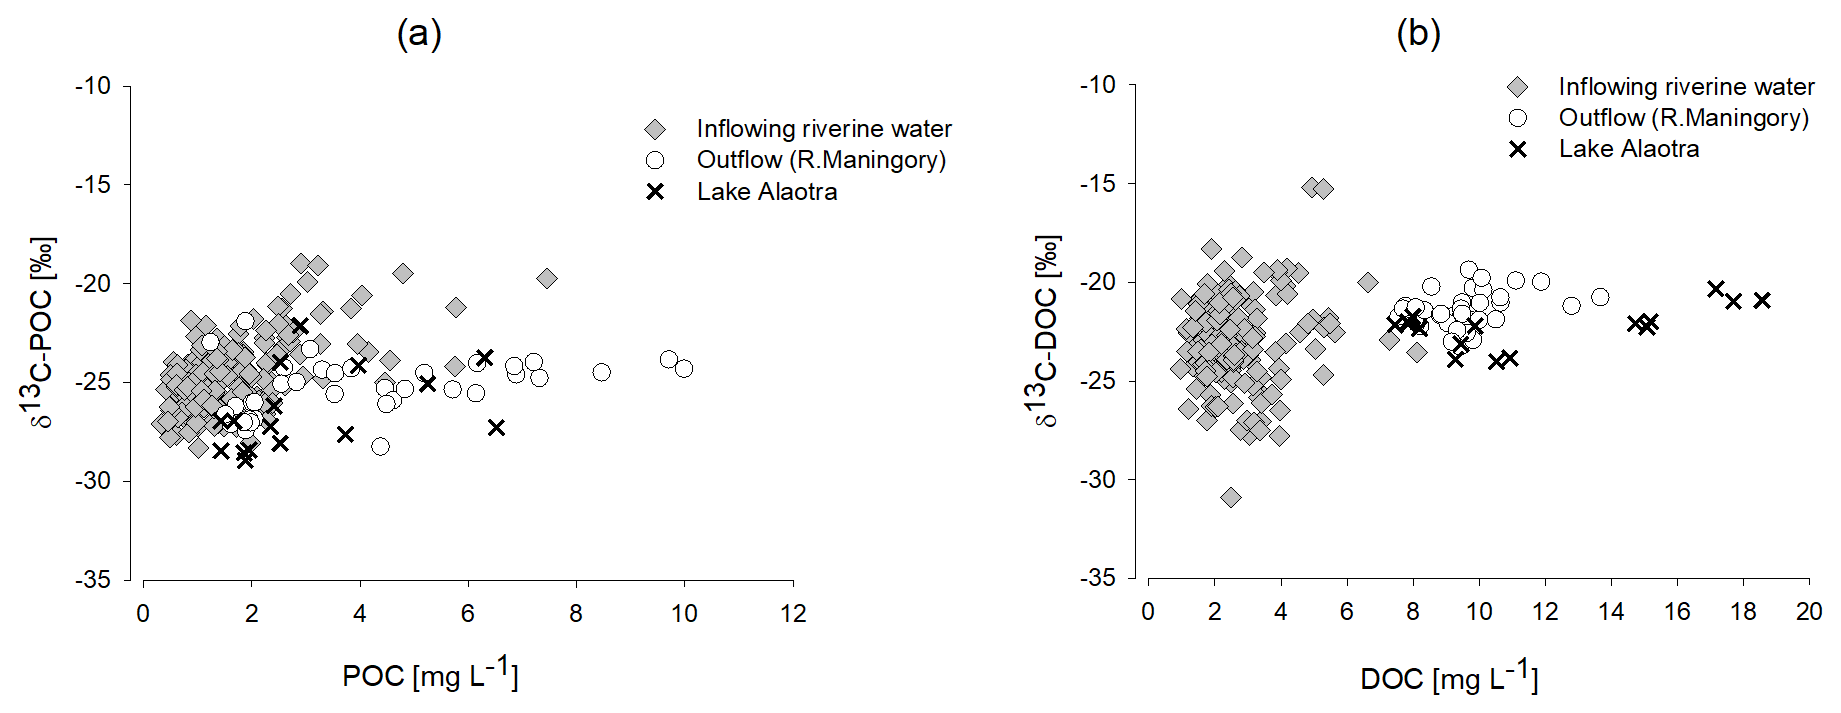
Figure 8Stable isotope composition versus concentrations for (a) particulate organic carbon (POC) and (b) dissolved organic carbon (DOC) for inflowing water, Lake Alaotra, and the lake outflow (Maningory River).
3.8 Chl a concentrations
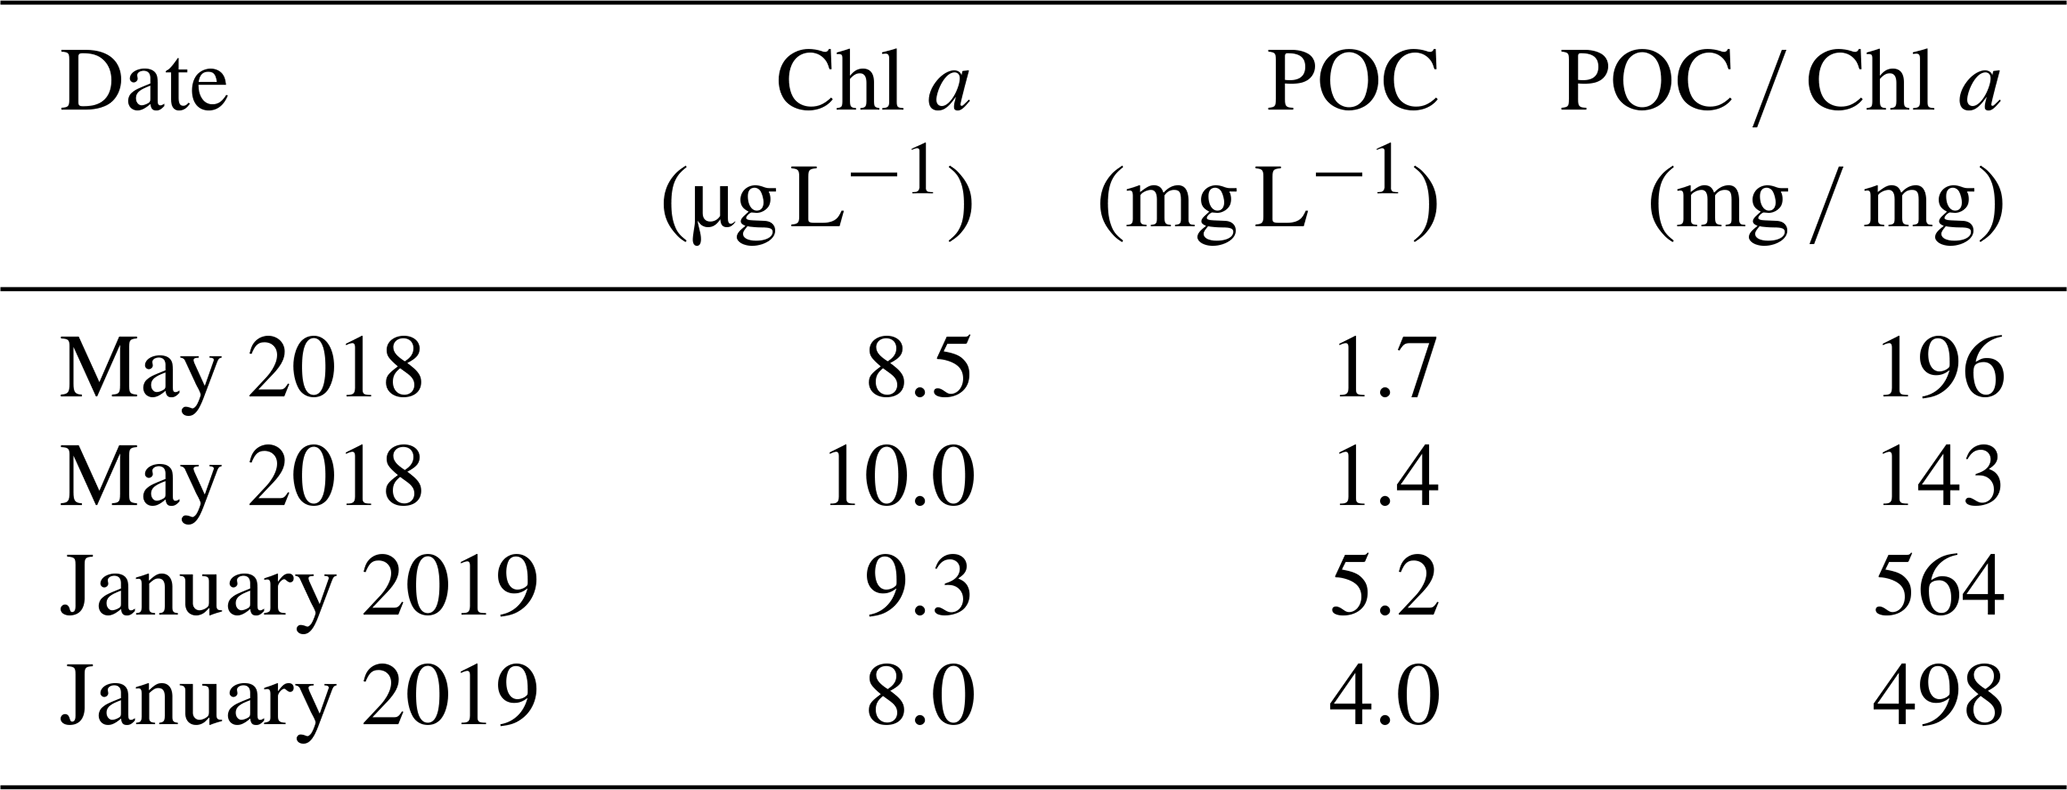
The mean Chl a concentration of the lake ranged between 8.0 and 10.0 µg L−1 (Table 2), and the mean daily net primary production (NPP) was estimated at 538.3 mg C m−2 d−1 (range: 144.5–1250 mg C m−2 d−1). For TSM, POC, δ13C-POC, DOC, δ13C-DOC, and POC PN values, paired t tests did not reveal any significant differences between Lake Alaotra and the lake outflow (Maningory River).
Table 2The chlorophyll a (Chl a) concentration, POC content, and POC Chl a ratios of lacustrine water (Lake Alaotra).
3.9 OC content, δ13C-OC, and OC TN ratio values in marsh sediment cores
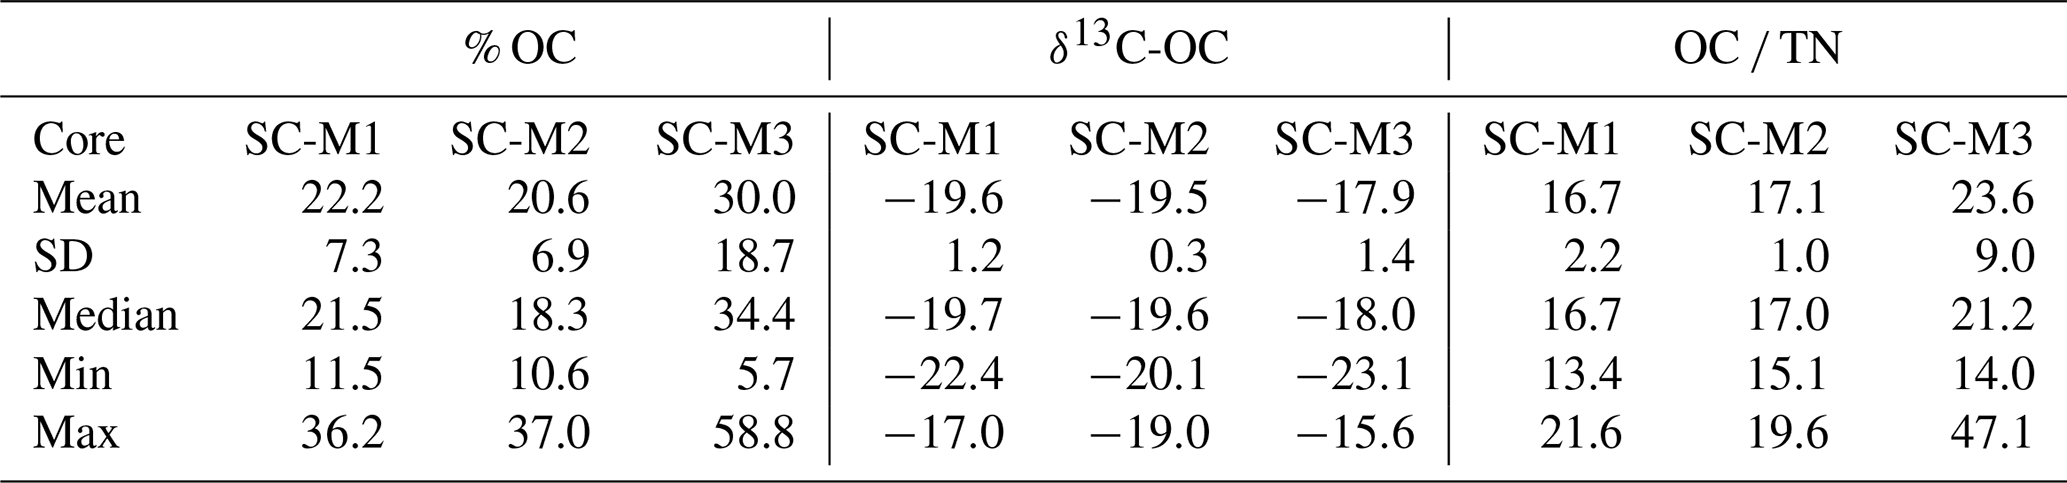
The marsh sediment cores exhibit a range of organic carbon content (% OC), stable isotope (δ13C-OC), and OC TN ratio values (summarized in Table 3). SC-M1 shows consistent % OC values, with a mean of 22.2 % (range: 11.5 %–36.2 %) and δ13C-OC values averaging −19.6 ‰ (range: −22.4 ‰ to −17.0 ‰). The OC TN ratios for SC-M1 are relatively stable, with a mean of 16.74 (range: 13.4–21.6). SC-M2 presents a similar pattern, with % OC averaging 20.6 % (range: 10.6 %–37.0 %), δ13C-OC values of −19.5 ‰ (range: −20.0 ‰ to −19.0 ‰), and OC TN ratios averaging 17.0 (range: 15.1–19.6). SC-M3, however, demonstrates greater variability, with % OC ranging widely from 5.7 % to 58.8 % (mean: 29.9 %), δ13C-OC values averaging −17.9 ‰ (range: −23.1 ‰ to −15.6 ‰), and OC TN ratios showing a broad range of 14.0–47.1 (mean: 23.6).
Table 3Summary of OC content, δ13C-OC, and OC TN ratio values in marsh sediment cores.
3.10 OC content and δ13C-OC values of marsh vegetation
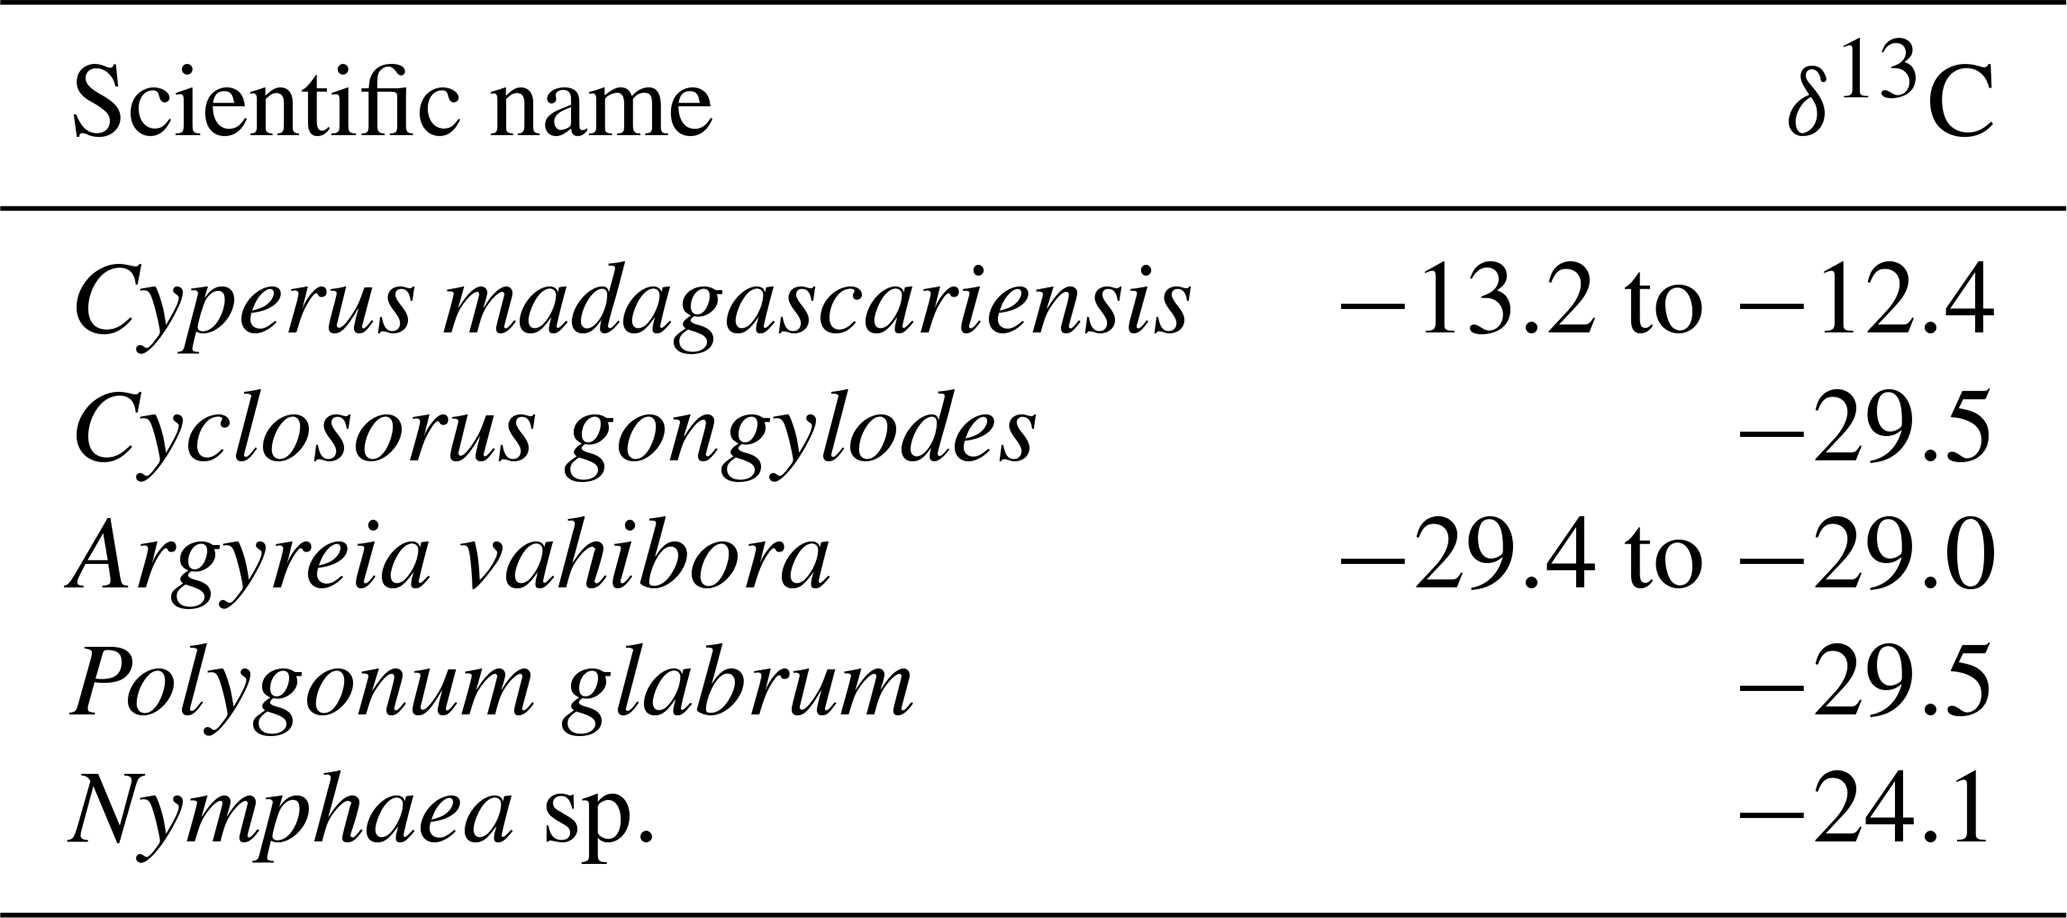
The C content of marsh vegetation varied in a narrow range, with an average value of 40.9±2.8 %. Cyperus madagascariensis, which covers more than 50 % of the marsh area (Lammers et al., 2015), showed a clear C4 signature (δ13C: −13.2 ‰ to −12.4 ‰; Table 4). In contrast, Argyreia vahibora, which covers ∼30 % of the marsh area, had δ13C values consistent with its C3 metabolism (−29.4 ‰ to −29.0 ‰), and other marsh plant species showed δ13C values ranging between −29.5 ‰ and −24.1 ‰. δ13C values of terrestrial C3 and C4 vegetation in the catchment were previously reported as ‰ and ‰, respectively, but noting that the C3 values were likely biased by the understorey effect, with overall C3 vegetation in the region expected to show values closer to −29 ‰ (Razanamahandry et al., 2022). The latter would also be consistent with forest topsoil δ13C data between −28 ‰ and −26 ‰, while grassland topsoil δ13C values in the catchment were higher and more variable (−23 ‰ to −16 ‰; Razanamahandry et al., 2022).
Table 4δ13C values of marsh vegetation (leaves) found in Lake Alaotra and sampled in February 2019 (rainy season).
4.1 Sources of POC in the Lake Alaotra system
TSM concentrations of the inflowing water varied widely with season, with higher values during the rainy season (mean: 131±262 mg L−1) compared with the dry season (61±39 mg L−1). Sediment loads of inflowing water are within the range of TSM concentrations reported for streams and rivers of the Betsiboka Basin (a basin that drains much of the grassland-dominated central highlands of Madagascar; Marwick et al., 2014), but they are higher than values reported from Rianila Basin, which drains part of the eastern slopes of Madagascar and is vegetated by low- or mid-latitude humid evergreen forest (Marwick et al., 2014). There was a significant difference between TSM concentrations of inflowing water (104±186 mg L−1) and lacustrine water (18±13 mg L−1; Fig. 9a), indicating that sedimentation must have occurred between the upstream area and the lake.
In addition, % POC was significantly lower in the inflowing rivers compared to lake and outflow waters (paired t test, p value < 0.001). Hydrodynamic sorting of sediments along the flow path is one mechanism that could influence particle-associated POC and its characteristics including % POC (e.g. Bouchez et al., 2014), although its effect in our setting is difficult to predict given that we have no information on % POC in different grain size fractions. In general, however, we can anticipate that the finer material, with a typically low POC content (<5 %), is preferentially exported further downstream, while coarser material is retained within floodplains. While little empirical work on this has been done with respect to how hydrodynamic sorting affects POC fluxes and characteristics in river systems, Repasch et al. (2022) found that the coarser mineral fraction and organic-rich particles were more retained, while the fine mineral fraction became progressively more important in the Bermejo River (Argentina). Thus, we do not anticipate hydrodynamic sorting to offer a viable explanation for the strong difference in % POC between inflowing rivers and Lake Alaotra.
In contrast to TSM, POC concentrations were higher in Lake Alaotra and its outflow compared to inflowing waters (Figs. 8, 9b). In the latter, POC concentrations were not strongly dependent on river discharge, while POC concentrations in the lake outflow increased steadily throughout the dry season – consistent with local inputs rather than with a link to POC derived from the catchment (Fig. 7a; see further discussion below). δ13C-POC values measured in inflowing waters ( ‰) are largely consistent with δ13C values measured in subsoils within our study area catchment (Razanamahandry et al., 2022), although the relative contribution of POC to TSM (% POC) was on average higher than in soil profiles (Fig. 10), suggesting that either direct vegetation inputs or more OC-rich soils closer to the stream network may contribute substantially (e.g. see Marwick et al., 2014, regarding the disproportional contribution of riparian zones). Along the aquatic continuum, % POC values increased further in the lake and its outflow (p value for lake versus inflowing water and for outflow versus inflowing water: <0.001) (Fig. 7).
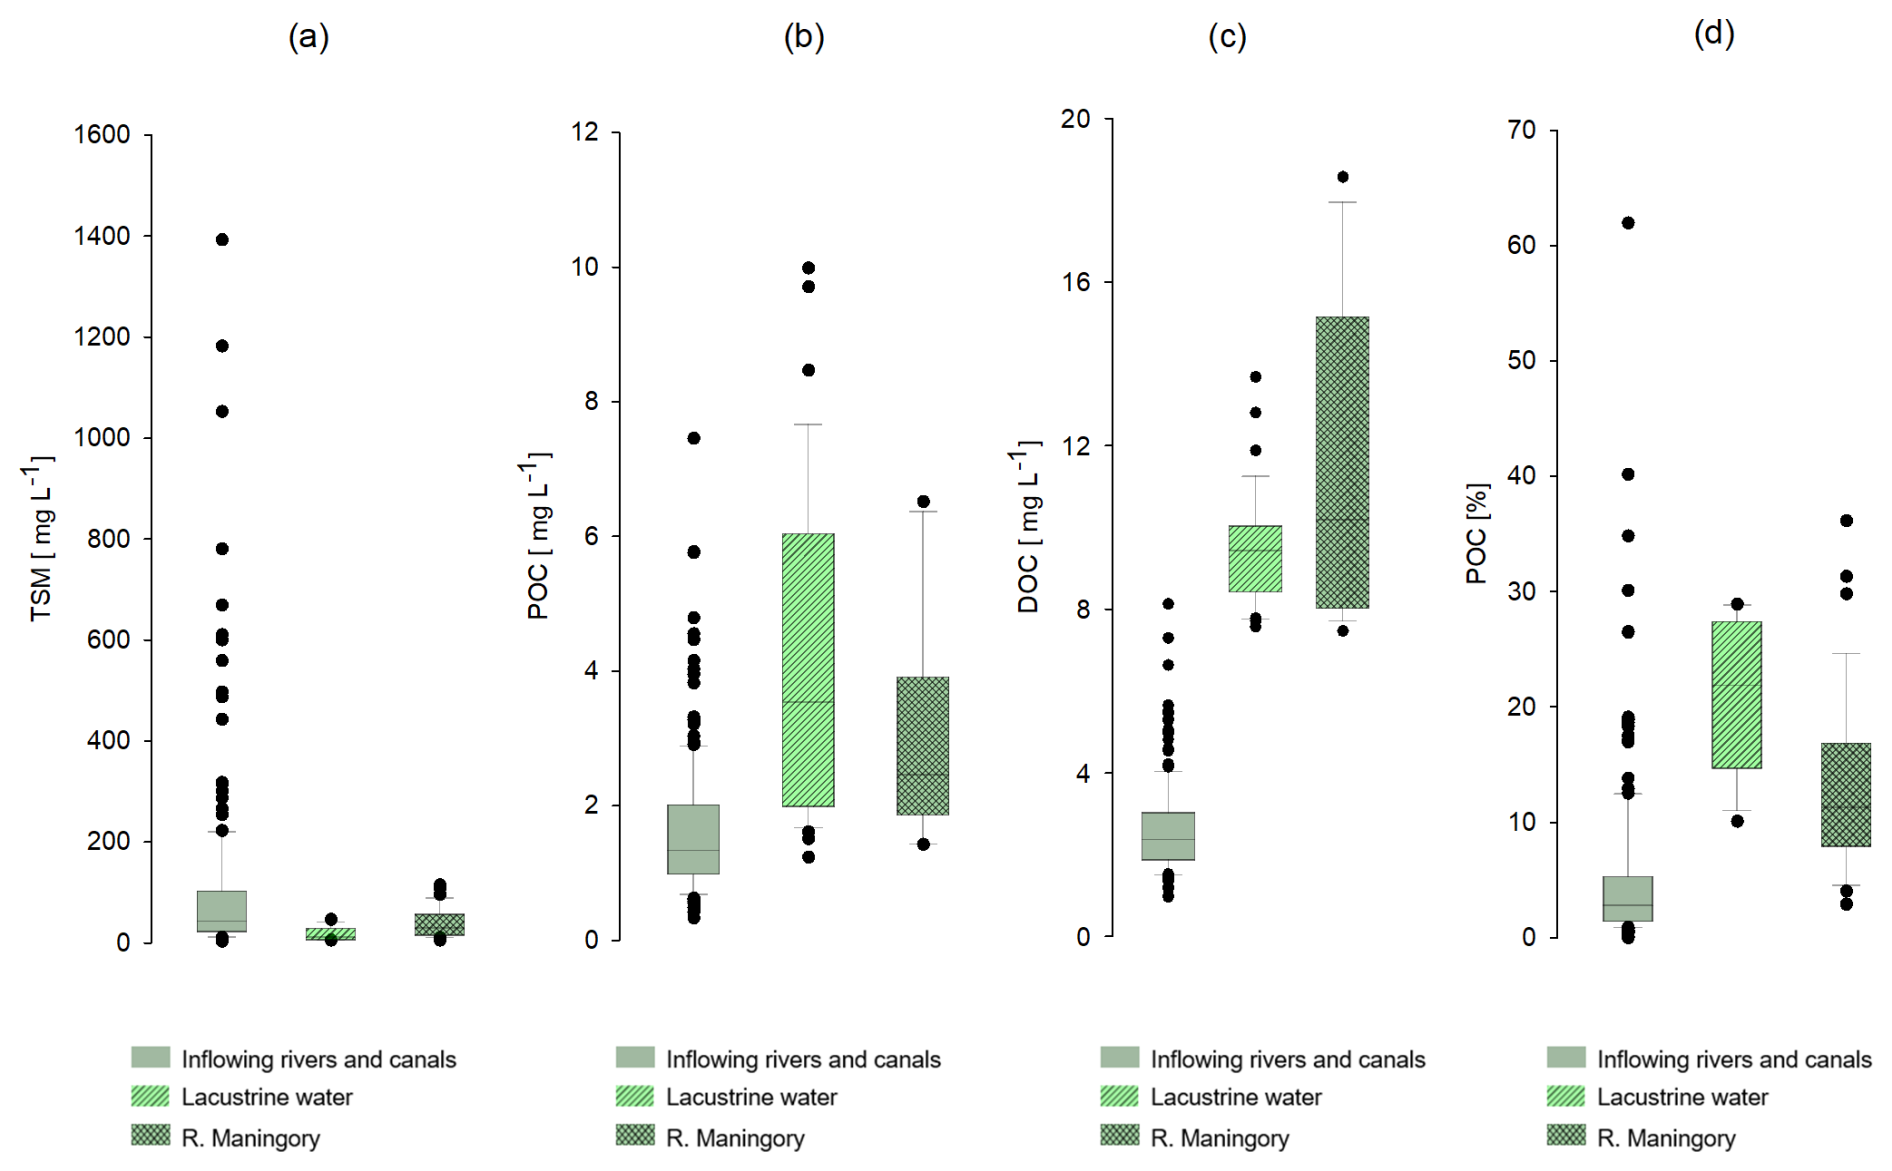
Figure 9Box plots of (a) TSM concentrations, (b) particulate organic carbon (POC) concentrations, (c) dissolved organic carbon (DOC) concentrations, and (d) the relative contribution of POC to the TSM pool for inflowing rivers and canals, lacustrine water, and the outflowing Maningory River.
In addition to POC transported by the inflowing waters (i.e. from the upper catchment), there are two additional potential sources of POC to consider for Lake Alaotra and its outflow: POC formed along the river's path via wetlands (peat in marshes and aquatic plants) and in situ phytoplankton production within the lake. These new inputs of POC could be more important than riverine (terrestrial) inputs, due to the high productivity of the marshes and phytoplankton production. The fact that we observed higher POC concentrations as well as a higher % POC in the surface water compared to inflowing water (Fig. 10) indeed suggests that the POC of the lake is, to a large extent, not derived from the river inputs but, instead, must be linked to other sources such as phytoplankton biomass and/or marsh vegetation. Using the current distribution of different vegetation species in the marshes (Table 4), the expected δ13C value of the mixture of different vegetation species based on their approximate relative abundance (Lammers et al., 2017a) would be in the −21 ‰ to −18 ‰ range (∼50 % of −12.3 ‰, ∼30 % of −29.2 ‰, and ∼20 % of ‰ to −24.1 ‰). This value corresponds closely to the δ13C-OC values of the peat cores ( ‰; see Table 3) and lake sediment cores ( ‰; data not shown here), but it is distinct from the δ13C values of POC in the lake ( ‰) and lake outlet ( ‰) (Fig. 10). This suggests that POC in the lake must be largely derived from other sources, rather than from the remobilization of OC from the marsh. The mean daily primary production rates that we measured (0.5±0.3 g C m−2 d−1) were moderate compared to the broader range of East African lakes, where primary production averages around 10±5 g C m−2 d−1 (Morana et al., 2022), and similar to those measured in locations such as the oligotrophic Lake Kivu (0.6 g C m−2 d−1; Darchambeau et al., 2014). The steady increase in POC concentrations during the dry season (Fig. 7a) would be consistent with the development of phytoplankton biomass during a period in which the lake water residence time increases. A widely used proxy for phytoplankton biomass is the Chl a concentration, and POC Chl a ratios (µg L−1 µg L−1) in the water column can be used to evaluate the contribution of various sources of organic matter to POC in the lacustrine water (Cifuentes et al., 1988). Indeed, a high POC Chl a ratio suggests that organic matter is primarily derived from terrestrial sources, while a low ratio implies that POC is derived from in situ phytoplankton production. Phytoplankton biomass has POC Chl a ratios of between 40 and 200, whereas terrestrial organic matter POC Chl a ratios are typically higher than 500 (Gawade et al., 2018). The POC Chl a ratios of lacustrine water in our study ranged between 143 and 564, with an average value of 350±183.1. These values were relatively low and indicate that phytoplankton biomass represents an important fraction of the lake suspended POC. Moreover, the suspended organic matter of Lake Alaotra had POC PN ratios close to those expected for phytoplankton (algae), between 7 and 9. The δ13C of phytoplankton (δ13C-Phyto) can be estimated based on δ13C-DIC data, but the variability in isotope fractionation has been shown to be high. Indeed, an approximation of ∼20 ‰ for the fractionation factor during C fixation by phytoplankton is often assumed (Peterson and Fry, 1987), and many studies have found that the degree of isotope fractionation is determined by factors such as growth rates, cell geometry, nutrient status, and dissolved CO2 concentrations (e.g. Burkhardt et al., 1999; Lammers et al., 2017b). Studies focussing on freshwater lakes have found inconsistent relationships between isotope fractionation and pCO2 (Bade et al., 2006; de Kluijver et al., 2014), with εp values (isotope fractionation between phytoplankton and CO2) ranging between 1 ‰ and 16 ‰. The δ13C-DIC values of Lake Alaotra water ranged between −9 ‰ and −4 ‰ (mean of 6.7 ‰; Fig. 11a), corresponding to δ13C-CO2 values of between −18 ‰ and −13 ‰ (mean of −15.7 ‰), which places our measured δ13C values of suspended POC (δ13C-POC) within the expected range for phytoplankton (between −16 ‰ and −32 ‰) (Fig. 11b). Thus, while the δ13C data alone do not unambiguously demonstrate that phytoplankton dominate the POC pool, several lines of evidence do point towards an important contribution from phytoplankton biomass: the much higher % POC than in inflowing rivers, low POC PN ratios, relatively low POC Chl a ratios (particularly in May, Table 2), and the fact that lake δ13C-POC values do not match with marsh-derived organic matter (see Fig. 10). No significant difference was observed between values of lacustrine water and the outflow river during the rainy and dry seasons for TSM, the POC concentration, δ13C-POC values, and POC PN values. Therefore, rather than exporting POC derived from soil erosion in the catchment, the Maningory River POC flux at the lake outlet appears, to an important extent, to be comprised of within-lake phytoplankton production.
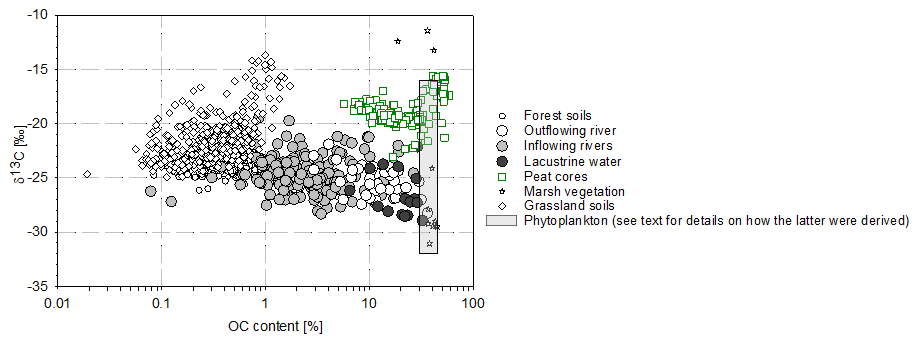
Figure 10The % OC and δ13C-OC values of marsh sediment cores, marsh vegetation, riverine suspended matter (inflowing rivers, outflowing river, and lacustrine water), and soil samples (see Razanamahandry et al., 2022) in the Lake Alaotra region and estimated ranges for phytoplankton (see text for details on how the latter were derived).
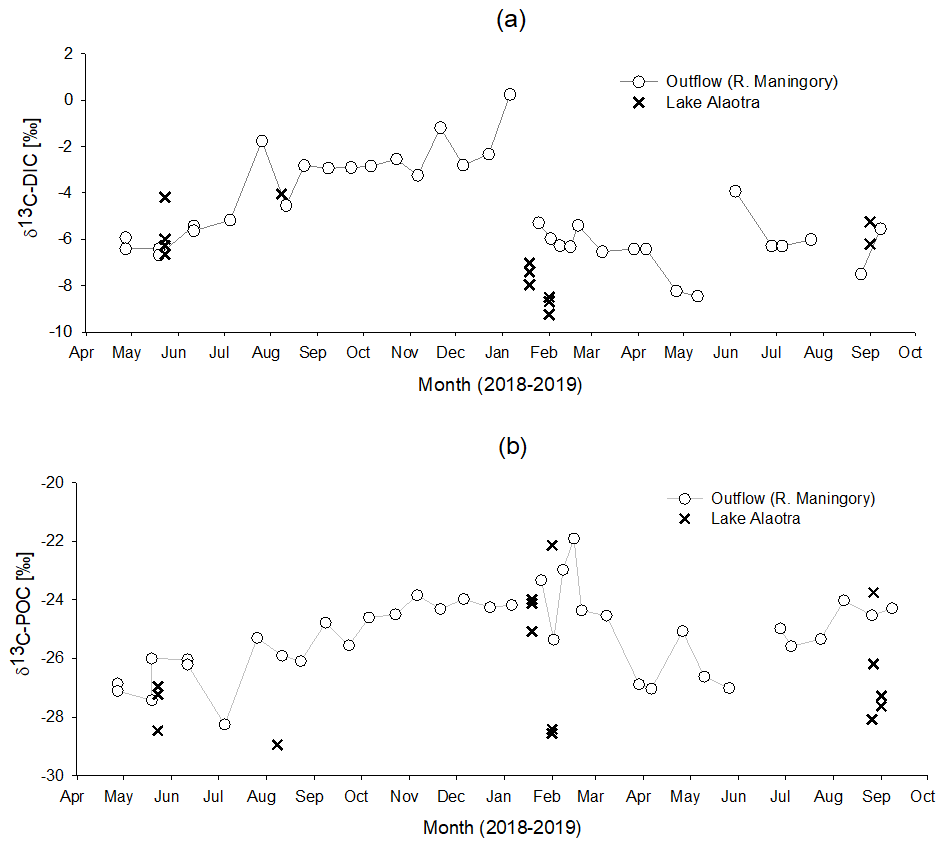
Figure 11(a) Seasonal variation in δ13C-DIC and (b) δ13C-POC values in the Maningory River (lake outflow) and lacustrine water.
4.2 Sources of DOC in the Lake Alaotra system
Lake Alaotra and its outflow were found to show consistently higher DOC concentrations than the inflowing water (Fig. 9). Thus, analogous to the discussion on POC, we examine which possible sources are most likely to supply these new DOC inputs along the aquatic continuum. DOC concentrations of the inflowing water were relatively low (2.6±1.1 mg C L−1) and show δ13C representing a mixture of C3–C4 vegetation ( ‰) (Fig. 8). These value are similar to those found in Marwick et al. (2014) in the Betsiboka River (central/western Madagascar; bulk DOC concentration ranges from 0.4 to 2.9 mg C L−1 and δ13C-DOC varied between −29.5 ‰ and −15.4 ‰). In contrast, DOC in the Rianila Basin (eastern Madagascar, largely covered by evergreen forest) was more depleted in 13C (δ13C values of ‰) but had a similar DOC concentration range (2.6±1.4 mg C L−1; Marwick et al., 2014).
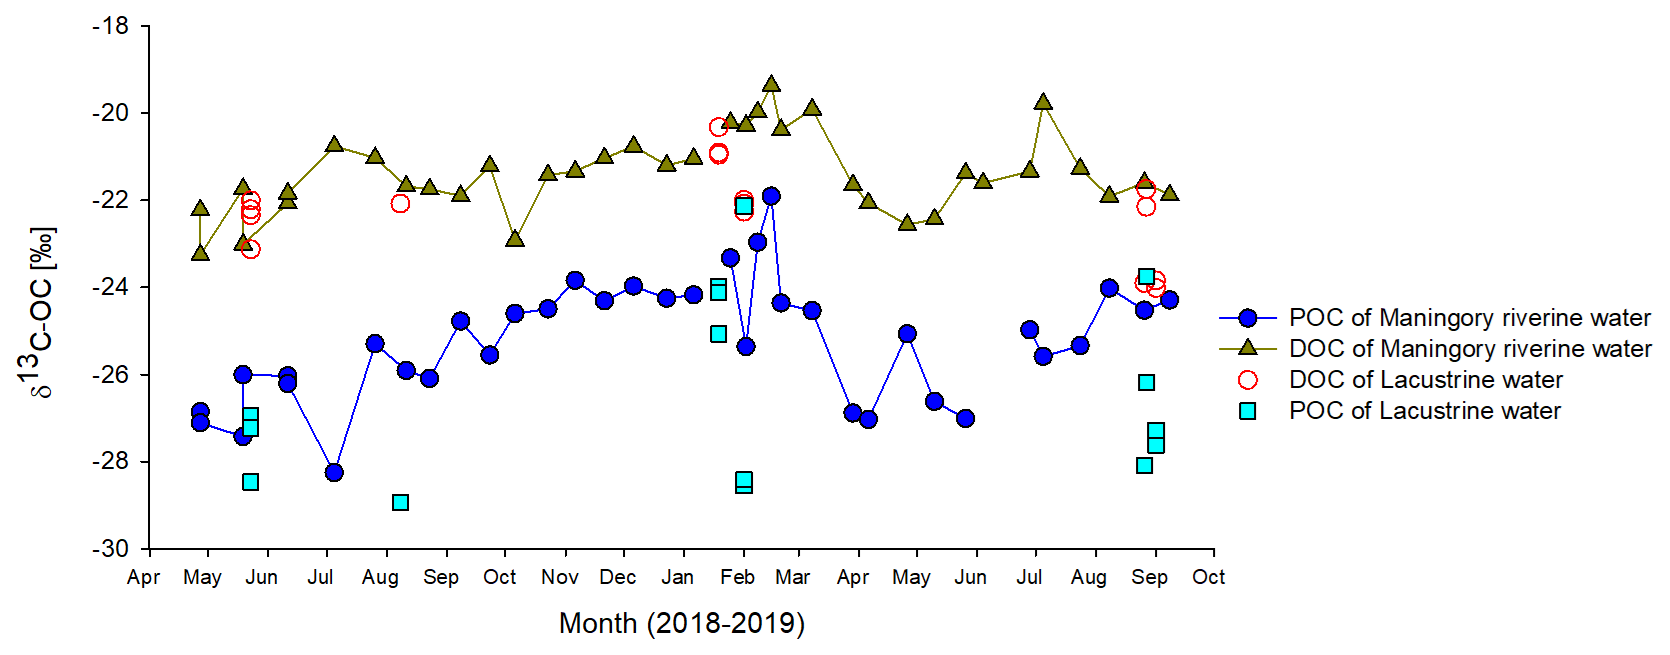
Figure 12Seasonal variation in δ13C-POC and δ13C-DOC in Lake Alaotra and in the Maningory River (lake outflow).
Possible sources for the net inputs of DOC within the lake include (1) the production of DOC by phytoplankton or (2) DOC derived directly or indirectly from wetland vegetation. DOC production from phytoplankton has been shown to be rapidly mineralized in the water column and, therefore, does not appear to accumulate in the water column (Morana et al., 2014). Moreover, δ13C-DOC values within the lake and its outflow ( ‰ and ‰, respectively) were relatively well constrained, and they are distinct from those observed in POC, which we expect to have a substantial phytoplankton contribution (see section on δ13C-POC). In addition, based on the relatively high seasonal variability in δ13C-DIC in the lake outflow, one would expect δ13C-DOC to show a correspondingly high variability if phytoplankton production were fuelling the net DOC inputs to the lake. Thus, while DOC and POC are inherently operationally defined (i.e. by the filter pore size used in the sampling procedure), it appears that the main sources of lake DOC and POC are strongly uncoupled (Fig. 12). The net DOC inputs to the lake are then likely the result of marshland vegetation inputs, which have been shown to be potentially important sources of DOC to open-water ecosystems (Lauster et al., 2006). Indeed, the δ13C-DOC values were close to δ13C-OC values in our marsh sediment core profiles (−24 ‰ to −18 ‰; Fig. 12) and to the values observed in marsh vegetation, taking into account their relative abundance (see above). Thus, different lines of evidence point towards marshland vegetation as the main source of the higher DOC concentrations in Lake Alaotra and its outflow. While δ13C-DOC values in the lake and its outflow were relatively constant throughout the year, DOC concentrations in lake waters were higher during the rainy season, when a higher flux of DOC from the OC-rich marshes can be anticipated. While microbial mineralization of DOC has been shown to lead to possible shifts in its δ13C values during the initial stages (Geeraert et al., 2016), such shifts are relatively modest (around 2 ‰ in Geeraert et al., 2016, although less in previous studies cited therein) and are not anticipated to bias our interpretation.
DOC concentrations in Lake Alaotra are relatively high compared to DOC concentrations measured in a range of East African lakes, such as Lake Kivu, Lake Edward, and Lake Albert (1.5–5 mg C L−1; Morana et al., 2014, 2015), and in Lake Victoria (1.2–3.6 mg C L−1; Deirmendjian et al., 2020). This difference could be explained by the fact that Lake Alaotra is a shallow system with a high relative area of surrounding wetland vegetation. A similar pattern has been observed in Lake George in Uganda (Morana et al., 2022), which is also a very shallow lake fringed by extensive Papyrus wetlands. Despite the high phytoplankton productivity Lake George, its surface waters showed DOC values of 10–20 mg C L−1, much higher than in rivers draining into the lake from savannah and rainforest (2–3 mg C L−1). Similarly to what we observed in Lake Alaotra, δ13C data on DOC and POC pools in Lake George demonstrate a strong decoupling of sources. In Lake George, δ13C-DOC values range from −27.5 ‰ to −25.0 ‰, reflecting inputs primarily derived from surrounding wetland vegetation, whereas δ13C-POC values range from −20.0 ‰ to −18.0 ‰, indicating the dominance of aquatic primary production (Morana et al., 2022). The potential importance of wetlands as a source of DOC in tropical lakes was also demonstrated for two shallow lakes in the Congo Basin, Lake Tumba (average depth 3–5 m) and Lake Mai-Ndombe (average depth of 5 m) (Borges et al., 2022). Wetlands (flooded forests) surround both of these lakes, leading to substantial DOC concentrations in both Lake Tumba (14.7 mg L−1) and Lake Mai-Ndombe (35.2 mg L−1) (Borges et al., 2022).
The strong imprint of the surrounding wetlands on DOC inputs to Lake Alaotra is not mirrored in the CO2 and CH4 concentrations, which do not show a marked increase between inflowing rivers and the lake proper (Figs. 4, 6). Here, outgassing (and/or oxidation in the case of CH4) could explain the absence of a clear wetland imprint on lake waters, yet some of the seasonality in CO2 and CH4 variations, in particular in the inflowing and outflowing rivers, also points towards a strong hydrological control modulating inputs from riparian wetlands. Indeed, the moderate correlation between pCO2 and dissolved CH4 concentrations (Fig. 5) suggests that the same processes or environmental conditions drive the pCO2 and CH4 variations. A strong increase in pCO2 and CH4 was observed during the rainy season in February (Fig. 5), when precipitation, water levels (Fig. 6), and freshwater discharge (Fig. 2) increased, thereby coinciding with an expected increased hydrological connectivity between wetlands and rivers and inputs of CO2 and CH4 from riparian wetlands to rivers. As the water level rises, the river floods riparian wetlands, where the decomposition of organic matter in wetland sediments enriches the water with dissolved CO2 and CH4. When the water flows back from the wetlands into the river further downstream, it increases CO2 and CH4 levels in the river, as observed in the Amazon (Richey et al., 2002), Zambezi (Teodoru et al., 2015), and Congo (Borges et al., 2019) rivers. Riparian wetland inputs seem to rapidly re-establish high CO2 and CH4 levels in the outflowing river, leading to values equivalent to the inflowing rivers and suggesting a very limited imprint of the lake on the CO2 and CH4 emissions in flowing waters. The relative importance of lentic CO2 and CH4 emissions compared to lotic CO2 and CH4 emissions is small based on extrapolation of field measurements with spatial datasets at the scale of the Amazon Basin (Chiriboga et al., 2024), as well as the continental scale of Africa (Borges et al., 2022). The lower CO2 and CH4 emissions from lentic systems compared to lotic ones resulted from lower areal flux densities as well as a lower total surface area (Chiriboga et al., 2024; Borges et al., 2022).
We present a comparative dataset of physicochemical and biogeochemical proxies measured in inflowing water, lacustrine water, and the outflow of Lake Alaotra, focussing on tracing the main sources of C along the aquatic continuum and how the lake and surrounding wetlands affect dissolved and particulate OC pools. Our results highlight the dominant role of riparian wetlands in controlling CO2 and CH4 dynamics, with hydrological connectivity driving seasonal variations in greenhouse gas inputs to the river system. The lake itself has a limited influence on CO2 and CH4 emissions, as wetland contributions rapidly re-establish high concentrations in outflowing waters. This pattern reflects the broader significance of wetland–river interactions in shaping carbon cycling and greenhouse gas fluxes in tropical river systems. Furthermore, our data show that (1) the suspended sediment load derived from the upstream catchment was largely lost before it entered Lake Alaotra and (2) the concentrations of DOC and POC in the lake and its outlet were much higher than in the inflowing waters. POC Chl a ratios of lacustrine water were low, and the POC PN ratios and δ13C-POC values of the lacustrine suspended organic matter were consistent with a strong contribution from phytoplankton production. In contrast, δ13C-DOC values within the lake and outflow were consistently higher than δ13C-POC, and the surrounding marshes appeared to be the primary source of the lacustrine DOC inputs. This study indicated that Lake Alaotra is highly dynamic in terms of organic C and that it acts as an active hot spot (sensu McClain et al., 2003) in terms of modifying C fluxes and sources along the aquatic flow path. In situ production and marshes are the primary sources of organic carbon in the lacustrine water column. The findings of this study are crucial for interpreting lake sediment archives and for tracing sediment mobilization from the eroded landscape in the Lake Alaotra region.
The full dataset generated in this study can be found in the Supplement.
The Supplement includes a number of ancillary measurements on proxies that are not discussed in this paper (stable hydrogen and oxygen isotope data of surface water samples and major element concentrations); however, we have maintained these measurements in the database so that potential users of our data have access to these additional parameters. The methodology for these measurements is also briefly described in the Supplement. The supplement related to this article is available online at https://doi.org/10.5194/bg-22-2403-2025-supplement.
GG and SB designed the study project with contributions from LB and VFR. TaR and ToR co-supervised the project and fieldwork in Madagascar. LB and VFR planned fieldwork and collected samples. VFR conducted the main sample analyses and led the manuscript writing with input from SB, CM, and AVB, who also contributed to CH4 and total alkalinity analyses. All authors contributed to data interpretation and manuscript revisions.
At least one of the (co-)authors is a member of the editorial board of Biogeosciences. The peer-review process was guided by an independent editor, and the authors also have no other competing interests to declare.
Publisher's note: Copernicus Publications remains neutral with regard to jurisdictional claims made in the text, published maps, institutional affiliations, or any other geographical representation in this paper. While Copernicus Publications makes every effort to include appropriate place names, the final responsibility lies with the authors.
We thank Zita Kelemen, Lore Fondu, Christophe Coeck, David Soto, Elvira Vassilieva, Jasper Verdonck, and Yannick Stroobandt (KU Leuven, Leuven, Belgium); Marc-Vincent Commarieu and Jean-Pierre Descy (Université de Liège, Liège, Belgium); and Marie Paul Razafimanantsoa (LRI, Antananarivo, Madagascar) for technical and analytical assistance. We thank ONG Durrell and the MEDD (Ministère de l'Environnement et de Development Durable) of Madagascar for authorizing sample collection in the protected area of Lake Alaotra. Alberto Vieira Borges is a research director at the Fonds National de la Recherche Scientifique (FNRS, Belgium). We are grateful to Peter Douglas and Dailson Bertasolli for providing constructive and insightful reviews on an earlier version of this paper.
This research is part of the MaLESA (Malagasy Lavaka, Environmental reconstruction and Sediment Archives) project, funded by KU Leuven (Special Research Fund). Travel and research grants were provided by YouReCa and FWO (grant nos. 11B6921N, 12Z6518N, and V436719N).
This paper was edited by Ji-Hyung Park and reviewed by Peter Douglas and Dailson Bertassoli.
An, S., Zheng, F., Zhang, F., Van Pelt, S., Hamer, U., and Makeschin, F.: Soil quality degradation processes along a deforestation chronosequence in the Ziwuling area, China, CATENA, 75, 248–256, https://doi.org/10.1016/j.catena.2008.07.003, 2008.
Andrianandrasana, H. T., Randriamahefasoa, J., Durbin, J., Lewis, R. E., and Ratsimbazafy, J. H.: Participatory ecological monitoring of the Alaotra wetlands in Madagascar, Biodivers. Conserv., 14, 2757–2774, https://doi.org/10.1007/s10531-005-8413-y, 2005.
Aufdenkampe, A. K., Mayorga, E., Raymond, P. A., Melack, J. M., Doney, S. C., Alin, S. R., Aalto, R. E., and Yoo, K.: Riverine coupling of biogeochemical cycles between land, oceans, and atmosphere, Front. Ecol. Environ., 9, 53–60, https://doi.org/10.1890/100014, 2011.
Bade, D. L., Pace, M. L., Cole, J. J., and Carpenter, S. R.: Can algal photosynthetic inorganic carbon isotope fractionation be predicted in lakes using existing models?, Aquat. Sci., 68, 142–153, https://doi.org/10.1007/s00027-006-0818-5, 2006.
Bakoariniaina, L. N., Kusky, T., and Raharimahefa, T.: Disappearing Lake Alaotra: Monitoring catastrophic erosion, waterway silting, and land degradation hazards in Madagascar using Landsat imagery, J. African Earth Sci., 44, 241–252, https://doi.org/10.1016/j.jafrearsci.2005.10.013, 2006.
Borges, A. V, Darchambeau, F., Teodoru, C. R., Marwick, T. R., Tamooh, F., Geeraert, N., Omengo, F. O., Guérin, F., Lambert, T., Morana, C., Okuku, E., and Bouillon, S.: Globally significant greenhouse-gas emissions from African inland waters, Nat. Geosci., 8, 637–642, https://doi.org/10.1038/ngeo2486, 2015.
Borges, A. V., Darchambeau, F., Lambert, T., Morana, C., Allen, G. H., Tambwe, E., Toengaho Sembaito, A., Mambo, T., Nlandu Wabakhangazi, J., Descy, J.-P., Teodoru, C. R., and Bouillon, S.: Variations in dissolved greenhouse gases (CO2, CH4, N2O) in the Congo River network overwhelmingly driven by fluvial-wetland connectivity, Biogeosciences, 16, 3801–3834, https://doi.org/10.5194/bg-16-3801-2019, 2019.
Borges, A. V., Deirmendjian, L., Bouillon, S., Okello, W., Lambert, T., Roland, F. A. E., Razanamahandry, V. F., Voarintsoa, N. R. G., Darchambeau, F., Kimirei, I. A., Descy, J. P., Allen, G. H., and Morana, C.: Greenhouse gas emissions from African lakes are no longer a blind spot, Sci. Adv., 8, eabi8716, https://doi.org/10.1126/sciadv.abi8716, 2022.
Bouchez, J., Galy, V., Hilton, R. G., Gaillardet, J., Moreira-Turcq, P., Pérez, M. A., France-Lanord, C., and Maurice, L.: Source, transport and fluxes of Amazon River particulate organic carbon: Insights from river sediment depth-profiles, Geochim. Cosmochim. Ac., 133, 280–298, 2014.
Broothaerts, N., Razanamahandry, V. F., Brosens, L., Campforts, B., Jacobs, L., Razafimbelo, T., Rafolisy, T., Verstraeten, G., Bouillon, S., and Govers, G.: Vegetation changes and sediment dynamics in the Lake Alaotra region, central Madagascar, Holocene, 33, 459–470, https://doi.org/10.1177/09596836221145376, 2022.
Brosens, L., Broothaerts, N., Campforts, B., Jacobs, L., Razanamahandry, V. F., Van Moerbeke, Q., Bouillon, S., Razafimbelo, T., Rafolisy, T., and Govers, G.: Under pressure: Rapid lavaka erosion and floodplain sedimentation in central Madagascar, Sci. Total Environ., 806, 150483, https://doi.org/10.1016/j.scitotenv.2021.150483, 2022.
Burkhardt, S., Riebesell, U., and Zondervan, I.: Effect of growth rate, CO2 concentration, and cell size on the stable carbon isotope fractionation in marine phytoplankton, Geochim. Cosmochim. Ac., 63, 3729–3741, 1999.
Chaperon, P., Danloux, J., and Ferry, L.: Fleuves et rivières de Madagascar, Editions d., ORSTOM, Paris, 1993.
Chiriboga, G., Bouillon, S., and Borges, A. V.: Dissolved greenhouse gas (CO2, CH4, N2O) emissions from highland lakes of the Andes cordillera in Northern Ecuador, Aquat. Sci., 86, 1–24, https://doi.org/10.1007/s00027-023-01039-6, 2024.
Cifuentes, L. A., Sharp, J. H., and Fogel, M. L.: Stable carbon and nitrogen isotope biogeochemistry in the Delaware estuary, Limnol. Oceanogr., 33, 1102–1115, https://doi.org/10.4319/lo.1988.33.5.1102, 1988.
Cole, J. J., Caraco, N. F., Kling, G. W., and Kratz, T. K.: Carbon dioxide supersaturation in the surface waters of lakes, Science, 265, 1568–1570, https://doi.org/10.1126/science.265.5178.1568, 1994.
Cole, J. J., Prairie, Y. T., Caraco, N. F., McDowell, W. H., Tranvik, L. J., Striegl, R. G., Duarte, C. M., Kortelainen, P., Downing, J. A., Middelburg, J. J., and Melack, J.: Plumbing the global carbon cycle: Integrating inland waters into the terrestrial carbon budget, Ecosystems, 10, 171–184, https://doi.org/10.1007/s10021-006-9013-8, 2007.
Copsey, J., Rajaonarison, L., Randriamihamina, R., and Rakotoniaina, L.: Voices from the marsh: Livelihood concerns of fishers and rice cultivators in the Alaotra wetland, Madagascar Conserv. Dev., 4, 25–30, https://doi.org/10.4314/mcd.v4i1.44008, 2009.
Cox, R., Bierman, P., Jungers, M. C., and Rakotondrazafy, A. F. M.: Erosion Rates and Sediment Sources in Madagascar Inferred from 10Be Analysis of Lavaka, Slope, and River Sediment, J. Geol., 117, 363–376, https://doi.org/10.1086/598945, 2009.
Cox, R., Zentner, D. B., Rakotondrazafy, A. F. M., and Rasoazanamparany, C. F.: Shakedown in Madagascar: Occurrence of lavakas (erosional gullies) associated with seismic activity, Geology, 38, 179–182, https://doi.org/10.1130/G30670.1, 2010.
Cox, R., Carrère, A., Rakotondrazafy, A. F. M., and Voarintsoa, N. R.: Lavaka (erosional gullies) provide productive patch environments for flora and farming in Madagascar's grassy highlands, Plants People Planet, 6 287–303, https://doi.org/10.1002/ppp3.10440, 2023.
CREAM (Centre de recherche, d'études et d'appui à l'analayse economique à Madagascar): Monographie – Région Alaotra Mangoro, 1–233, 2013.
Cuevas-Lara, D., Alcocer, J., Cortés-Guzmán, D., Soria-Reinoso, I. F., García-Oliva, F., Sánchez-Carrillo, S., and Oseguera, L. A.: Particulate organic carbon in the tropical Usumacinta river, southeast Mexico: concentration, flux, and sources, Water, 13, 1561, https://doi.org/10.3390/w13111561, 2021.
Darchambeau, F., Sarmento, H., and Descy, J.-P.: Primary production in a tropical large lake: The role of phytoplankton composition, Sci. Total Environ., 473–474, 178–188, https://doi.org/10.1016/j.scitotenv.2013.12.036, 2014.
Dauchez, S., Legendre, L., and Fortier, L.: Assessment of simultaneous uptake of nitrogenous nutrients (15N) and inorganic carbon (13C) by natural phytoplankton populations, Mar. Biol., 123, 651–666, https://doi.org/10.1007/BF00349108, 1995.
Deirmendjian, L., Lambert, T., Morana, C., Bouillon, S., William, J. D., and Alberto, O.: Dissolved organic matter composition and reactivity in Lake Victoria, the world's largest tropical lake, Biogeochemistry, 150, 61–83, https://doi.org/10.1007/s10533-020-00687-2, 2020.
de Kluijver, A., Schoon, P. L., Downing, J. A., Schouten, S., and Middelburg, J. J.: Stable carbon isotope biogeochemistry of lakes along a trophic gradient, Biogeosciences, 11, 6265–6276, https://doi.org/10.5194/bg-11-6265-2014, 2014.
Del Giorgio, P. A. and Peters, R. H.: Balance between Phytoplankton Production and Plankton Respiration in Lakes, Can. J. Fish. Aquat. Sci., 50, 282–289, https://doi.org/10.1139/f93-032, 1993.
Del Giorgio, P. A. and Peters, R. H.: Patterns in planktonic P:R ratios in lakes: Influence of lake trophy and dissolved organic carbon, Limnol. Oceanogr., 39, 772–787, https://doi.org/10.4319/lo.1994.39.4.0772, 1994.
Del Giorgio, P. A., Cole, J. J., Caraco, N. F., and Peters, R. H.: Linking planktonic biomass and metabolism to net gas fluxes in northern temperate lakes, Ecology, 80, 1422–1431, https://doi.org/10.2307/177085, 1999.
Dosseur, H. and Ibiza, D.: Etudes Hydrologiques sur l'Alaotra – Modélisation du bassin, ORSTOM, Paris, 1982.
Duarte, C. M. and Prairie, Y. T.: Prevalence of heterotrophy and atmospheric CO2 emissions from aquatic ecosystems, Ecosystems, 8, 862–870, https://doi.org/10.1007/s10021-005-0177-4, 2005.
Ferry, L., Mietton, M., Robison, L., and Erismann, J.: Alaotra Lake (Madagascar): past, present and future, Zeitschrift für Geomorphol., 53, 299–318, https://doi.org/10.1127/0372-8854/2009/0053-0299, 2009.
Ferry, L., Mietton, M., Touchart, L., and Hamerlynck, O.: Lake Alaotra (Madagascar) is not about to disappear. Hydrological and sediment dynamics of an environmentally and socio-economically vital wetland, Dynamiques environnementales-Journal Int. des Geosci. l'environnement, 32, 105–122, 2013.
Gawade, L., Krishna, M. S., Sarma, V. V. S. S., Hemalatha, K. P. J., and Venkateshwara Rao, Y.: Spatio-temporal variability in the sources of particulate organic carbon and nitrogen in a tropical Godavari estuary, Estuar. Coast. Shelf Sci., 215, 20–29, https://doi.org/10.1016/j.ecss.2018.10.004, 2018.
Geeraert, N., Omengo, F. O., Govers, G., and Bouillon, S.: Dissolved organic carbon lability and stable isotope shifts during microbial decomposition in a tropical river system, Biogeosciences, 13, 517–525, https://doi.org/10.5194/bg-13-517-2016, 2016.
Gillikin, D. P. and Bouillon, S.: Determination of δ18O of water and δ13C of dissolved inorganic carbon using a simple modification of an elemental analyser-isotope ratio mass spectrometer: an evaluation, Rapid Commun. Mass Spectrom., 21, 1475–1478, https://doi.org/10.1002/rcm.2968, 2007.
Gran, G.: Determination of the equivalence point in potentiometric titrations of seawater with hydrochloric acid, Oceanol. Acta, 5, 209–218, 1952.
Hanson, P. C., Hamilton, D. P., Stanley, E. H., Preston, N., Langman, O. C., and Kara, E. L.: Fate of Allochthonous Dissolved Organic Carbon in Lakes: A Quantitative Approach, edited by: Evens, T., PLOS One, 6, 1–12, https://doi.org/10.1371/journal.pone.0021884, 2011.
Jacoby, H. G. and Minten, B.: Is land titling in Sub-Saharan Africa cost-effective? Evidence from Madagascar, World Bank Econ. Rev., 21, 461–485, https://doi.org/10.1093/wber/lhm011, 2007.
Jenkins, A. P., Jupiter, S. D., Qauqau, I., and Atherton, J.: The importance of ecosystem-based management for conserving aquatic migratory pathways on tropical high islands: a case study from Fiji, Aquat. Conserv. Mar. Freshw. Ecosyst., 20, 224–238, https://doi.org/10.1002/aqc.1086, 2010.
Johnson, M. S., Matthews, E., Du, J., Genovese, V., and Bastviken, D., Methane emission from global lakes: new spatiotemporal data and observation-driven modeling of methane dynamics indicates lower emissions, J. Geophys. Res.-Biogeo., 127, e2022JG006793, https://doi.org/10.1029/2022JG006793, 2022.
Kirk, J. T. O.: Light and photosynthesis in aquatic ecosystems, Cambridge University Press, New York, 1994.
Kull, C. A.: Madagascar's Burning Issue: The Persistent Conflict over Fire, Environ. Sci. Policy Sustain. Dev., 44, 8–19, https://doi.org/10.1080/00139150209605604, 2002.
Lammers, J. M., Reichart, G. J., and Middelburg, J. J.: Seasonal variability in phytoplankton stable carbon isotope ratios and bacterial carbon sources in a shallow Dutch lake, Limnol. Oceanogr., 62, 2773–2787, https://doi.org/10.1002/lno.10605, 2017a.
Lammers, P. L., Richter, T., Waeber, P. O., and Mantilla-Contreras, J.: Lake Alaotra wetlands: how long can Madagascar's most important rice and fish production region withstand the anthropogenic pressure?, Madagascar Conserv. Dev., 10, 116–127, https://doi.org/10.4314/mcd.v10i3.4, 2015.
Lammers, P. L., Richter, T., Lux, M., Ratsimbazafy, J., and Mantilla-Contreras, J.: The challenges of community-based conservation in developing countries – A case study from Lake Alaotra, Madagascar, J. Nat. Conserv., 40, 100–112, https://doi.org/10.1016/j.jnc.2017.08.003, 2017b.
Lauster, G. H., Hanson, P. C., and Kratz, T. K.: Gross primary production and respiration differences among littoral and pelagic habitats in northern Wisconsin lakes, Can. J. Fish. Aquat. Sci., 63, 1130–1141, https://doi.org/10.1139/f06-018, 2006.
Legendre, L. and Gosselin, M.: Estimation of N or C uptake rates by phytoplankton using 15N or 13C: revisiting the usual computation formulae, J. Plankton Res., 19, 263–271, https://doi.org/10.1093/plankt/19.2.263, 1997.
Lewis, E. and Wallace, D.: Program developed for CO2 system calculations, Environmental System Science Data Infrastructure for a Virtual Ecosystem (ESS-DIVE), United States, 1998.
Lewis, W. M.: Biogeochemistry of tropical lakes, SIL Proceedings, 1922–2010, 30, 1595–1603, https://doi.org/10.1080/03680770.2009.11902383, 2010.
López-Sandoval, D. C., Rodríguez-Ramos, T., Cermeño, P., Sobrino, C., and Marañón, E.: Photosynthesis and respiration in marine phytoplankton: Relationship with cell size, taxonomic affiliation, and growth phase, J. Exp. Mar. Bio. Ecol., 457, 151–159, https://doi.org/10.1016/j.jembe.2014.04.013, 2014.
Marwick, T. R., Borges, A. V., Van Acker, K., Darchambeau, F., and Bouillon, S.: Disproportionate contribution of riparian inputs to organic carbon pools in freshwater systems, Ecosystems, 17, 974–989, https://doi.org/10.1007/s10021-014-9772-6, 2014.
McClain, M. E., Boyer, E. W., Dent, C. L., Gergel, S. E., Grimm, N. B., Groffman, P. M., Hart, S. C., Harvey, J. W., Johnston, C. A., Mayorga, E., McDowell, W. H., and Pinay, G.: Hot spots and hot moments at the interface of terrestrial and aquatic ecosystems, Ecosystems, 6, 301–312, 2003.
Mietton, M., Gunnell, Y., Nicoud, G., Ferry, L., Razafimahefa, R., and Grandjean, P.: Lake Alaotra, Madagascar: A late Quaternary wetland regulated by the tectonic regime, CATENA, 165, 22–41, https://doi.org/10.1016/j.catena.2018.01.021, 2018.
Montgomery, D. R.: Soil erosion and agricultural sustainability, P. Natl. Acad. Sci. USA, 104, 13268–13272, https://doi.org/10.1073/pnas.0611508104, 2007.
Morana, C., Sarmento, H., Descy, J. P., Gasol, J. M., Borges, A. V., Bouillon, S., and Darchambeau, F.: Production of dissolved organic matter by phytoplankton and its uptake by heterotrophic prokaryotes in large tropical lakes, Limnol. Oceanogr., 59, 1364–1375, https://doi.org/10.4319/lo.2014.59.4.1364, 2014.
Morana, C., Darchambeau, F., Roland, F. A. E., Borges, A. V., Muvundja, F., Kelemen, Z., Masilya, P., Descy, J.-P., and Bouillon, S.: Biogeochemistry of a large and deep tropical lake (Lake Kivu, East Africa: insights from a stable isotope study covering an annual cycle, Biogeosciences, 12, 4953–4963, https://doi.org/10.5194/bg-12-4953-2015, 2015.
Morana, C., Borges, A. V., Deirmendjian, L., Okello, W., Sarmento, H., Descy, J.-P., Kimerei, I. A., and Bouillon, S.: Prevalence of autotrophy in African tropical lakes, Ecosystems, 26, 627–642, https://doi.org/10.1007/s10021-022-00783-4, 2022.
Moreau, J.: Le Lac Alaotra à Madagascar: cinquante ans d'aménagement des pêches, OROSTOM, hydrobiol., XIII, 171–179, 1980.
Pattanayak, S. K. and Wendland, K. J.: Nature's care: diarrhea, watershed protection, and biodiversity conservation in Flores, Indonesia, Biodivers. Conserv., 16, 2801–2819, https://doi.org/10.1007/s10531-007-9215-1, 2007.
Penot, E., Rakotoarimanana, A., and Scopel, E.: Conservation agriculture adoption and local farmers' strategies in Lake Alaotra, Madagascar, 3rd International Conference on Conservation Agriculture in Southeast Asia, 10–15 December 2012, Hanoi, Vietnam, 2012.
Penot, E., Fevre, V., Flodrops, P., and Razafimahatratra, H. M.: Conservation Agriculture to buffer and alleviate the impact of climatic variations in Madagascar: farmers' perception, Cah. Agric., 27, 25003, https://doi.org/10.1051/cagri/2018009, 2018.
Peterson, B. J. and Fry, B.: Stable isotopes in ecosystem studies., Annu. Rev. Ecol. Syst., 18, 293–320, https://doi.org/10.1146/annurev.es.18.110187.001453, 1987.
Ralison, O. H., Borges, A. V., Dehairs, F., Middelburg, J. J., and Bouillon, S.: Carbon biogeochemistry of the Betsiboka estuary (north-western Madagascar), Org. Geochem., 39, 1649–1658, https://doi.org/10.1016/j.orggeochem.2008.01.010, 2008.
Ranarijaona, H.: Concept de Modèle Ecologique pour la Zone Humide Alaotra, Madagascar Conserv. Dev., 2, 2016–2020, https://doi.org/10.4314/mcd.v2i1.44128, 2009.
Razanamahandry, V. F., Dewaele, M., Govers, G., Brosens, L., Campforts, B., Jacobs, L., Razafimbelo, T., Rafolisy, T., and Bouillon, S.: Stable isotope profiles of soil organic carbon in forested and grassland landscapes in the Lake Alaotra basin (Madagascar): insights in past vegetation changes, Biogeosciences, 19, 3825–3841, https://doi.org/10.5194/bg-19-3825-2022, 2022.
Repasch, M., Scheingross, J. S., Hovius, N., Vieth-Hillebrandt, A., Mueller, C. W., Höschen, C., Szupiany, R. N., and Sachse, D.: River organic carbon fluxes modulated by hydrodynamic sorting of particulate organic matter, Geophys. Res. Lett., 49, e2021GL096343, https://doi.org/10.1029/2021GL096343, 2022.
Reynolds, C. S.: The Ecology of Phytoplankton, Cambridge University Press, Cambridge, https://doi.org/10.1017/CBO9780511542145, 2006.
Richey, J., Melack, J., Aufdenkampe, A., Ballester, V., and Hess, L.: Outgassing from Amazonian rivers and wetlands as a large tropical source of atmospheric CO2, Nature, 416, 617–620, https://doi.org/10.1038/416617a, 2002.
Richey, J. E., Spencer, R. G. M., Drake, T. W., and Ward, N. D.: Fluvial Carbon Dynamics across the Land to Ocean Continuum of Great Tropical Rivers: The Amazon and Congo, in: Congo Basin Hydrology, Climate, and Biogeochemistry: A Foundation for the Future, edited by: Tshimanga, R. M., Moukandi N'kaya, G. D., and Alsdorf, D., Geophysical Monograph Series, Wiley, 391–412, https://doi.org/10.1002/9781119657002.ch20, 2022.
Sobek, S., Söderbäck, B., Karlsson, S., Andersson, E., and Brunberg, A. K.: A carbon budget of a small humic lake: An example of the importance of lakes for organic matter cycling in boreal catchments, Ambio, 35, 469–475, https://doi.org/10.1579/0044-7447(2006)35[469:ACBOAS]2.0.CO;2, 2006.
Staehr, P. A., Baastrup-Spohr, L., Sand-Jensen, K., and Stedmon, C.: Lake metabolism scales with lake morphometry and catchment conditions, Aquat. Sci., 74, 155–169, https://doi.org/10.1007/s00027-011-0207-6, 2012.
Teodoru, C. R., Nyoni, F. C., Borges, A. V., Darchambeau, F., Nyambe, I., and Bouillon, S.: Dynamics of greenhouse gases (CO2, CH4, N2O) along the Zambezi River and major tributaries, and their importance in the riverine carbon budget, Biogeosciences, 12, 2431–2453, https://doi.org/10.5194/bg-12-2431-2015, 2015.
Toming, K., Kotta, J., Uuemaa, E., Sobek, S., Kutser, T., and Tranvik, L. J.: Predicting lake dissolved organic carbon at a global scale, Sci. Rep., 10, 8471, https://doi.org/10.1038/s41598-020-65010-3, 2020.
Tranvik, L. J., Downing, J. A., Cotner, J. B., Loiselle, S. A., Striegl, R. G., Ballatore, T. J., Dillon, P., Finlay, K., Fortino, K., Knoll, L. B., Kortelainen, P. L., Kutser, T., Larsen, S., Laurion, I., Leech, D. M., Leigh McCallister, S., McKnight, D. M., Melack, J. M., Overholt, E., Porter, J. A., Prairie, Y., Renwick, W. H., Roland, F., Sherman, B. S., Schindler, D. W., Sobek, S., Tremblay, A., Vanni, M. J., Verschoor, A. M., Von Wachenfeldt, E., and Weyhenmeyer, G. A.: Lakes and reservoirs as regulators of carbon cycling and climate, Limnol. Oceanogr., 54, 2298–2314, https://doi.org/10.4319/lo.2009.54.6_part_2.2298, 2009.
Tranvik, L. J., Cole, J. J., and Prairie, Y. T.: The study of carbon in inland waters – from isolated ecosystems to players in the global carbon cycle, Limnol. Oceanogr. Lett., 3, 41–48, https://doi.org/10.1002/lol2.10068, 2018.
Vollenweider, R. A.: Calculation models of photosynthesis-depth curves and some implications regarding day rate estimates in primary production measurements, in: Primary Productivity in Aquatic Environments, edited by: Goldman, C. R., 425–458, University of California Press, 1966.
Weiss, R. F.: Determinations of carbon dioxide and methane by dual catalyst flame ionization chromatography and nitrous oxide by electron capture chromatography, J. Chromatogr. Sci., 19, 611–616, https://doi.org/10.1093/chromsci/19.12.611, 1981.
Wetzel, R. G.: Dissolved organic carbon: detrital energetics, metabolic regulators, and drivers of ecosystem stability of aquatic ecosystems, 455–477, in: Aquatic ecosystems, interactivity of organic matter, edited by: Findlay, S. E. G. and Sinsabaugh, R. L., Academic Press, https://doi.org/10.1016/B978-012256371-3/50020-2, 2003.
Wright, S., Jeffrey, S., Mantoura, R., Llewellyn, C., Bjornland, T., Repeta, D., and Welschmeyer, N.: Improved HPLC method for the analysis of chlorophylls and carotenoids from marine phytoplankton, Mar. Ecol. Prog. Ser., 77, 183–196, https://doi.org/10.3354/meps077183, 1991.
Zheng, F., He, X., Gao, X., Zhang, C.-E., and Tang, K.: Effects of erosion patterns on nutrient loss following deforestation on the Loess Plateau of China, Agric. Ecosyst. Environ., 108, 85–97, https://doi.org/10.1016/j.agee.2004.12.009, 2005.