the Creative Commons Attribution 4.0 License.
the Creative Commons Attribution 4.0 License.
 | 03 Jun 2025
Measuring and modeling waterlogging tolerance to predict the future for threatened lowland ash forests
Eric J. Gustafson
Dustin R. Bronson
Marcella A. Windmuller-Campione
Robert A. Slesak
Deahn M. Donner
The emerald ash borer is an invasive pest causing widespread mortality of ash trees (Fraxinus spp.) across the USA. Broad-scale models can help identify management strategies to maintain lowland ash ecosystems. Simulating lowland forest dynamics in landscape models has been problematic because lowland hydrology is extremely complex, making most hydrology algorithms intractable at the landscape scale. A succession extension (PnET-Succession) of the LANDIS-II forest landscape model was recently updated to include simple algorithms to approximate lowland hydrology, but estimating parameters of tree species' waterlogging tolerance is difficult. We describe empirical experiments conducted to generate such estimates and illustrate their behavior in single-cell and landscape simulations. Simulated water stress mimicked two critical characteristics of the empirical experiment: (1) there was little difference in simulated stress variables between the well-drained and intermediate flooding treatments, and (2) simulated water stress of species aligned with empirical waterlogging tolerance. We used the landscape model to scale the empirical experiment to landscape scales of space and time. When the simulation experiment was extended to 90 years, species productivity plateaued or peaked at a level that could be supported by the precipitation inputs and rooting zone depth. In a virtual experiment testing the competition outcomes between two species, the more-waterlogging-tolerant species did much better under the flooding treatment, but also tended to do better under the drained treatment because it never produced droughty conditions. When the updated waterlogging parameters were applied at landscape scale under future climate change and assisted migration (AM) scenarios, the mean biomass density of native species declined, and the introduced AM species increased as the climate gradually changed and introduced cohorts thrived. Species that are waterlogging tolerant were able to persist under all assisted migration–climate change scenarios and to a limited extent were able to colonize (and ephemerally dominate) upland sites. Well-parameterized landscape models provide a powerful tool to conduct simulation experiments involving novel situations such as climate change, invasive (or intentionally migrated) tree species, invasive insects or diseases, and proposed management strategies.
- Article
(4980 KB) - Full-text XML
- BibTeX
- EndNote


Within the upper Great Lakes region (Michigan, Minnesota, and Wisconsin, USA, and Ontario, Canada), lowland and riparian hardwood forests can be dominated by black ash (Fraxinus nigra Marsh) and green ash (Fraxinus pennsylvanica Marshall); > 95 % of all stems can be ash species, creating a monoculture (Kolka et al., 2018). Lowland ash forests provide multiple ecological benefits, including cavities for nesting birds, subnivean habitat for mammals, shade for trout streams, carbon sequestration, and hydraulic buffering (Grinde et al., 2022; Flower et al., 2018; Fraver et al., 2022) as well as important cultural benefits to Native American tribes (Constanza et al., 2017).
These important ash forests are under threat from the emerald ash borer (EAB; Agrilus planipennis Fairmaire). EAB is a wood-boring beetle native to Asia that has caused widespread mortality of ash trees (genus Fraxinus; Anulewicz et al., 2014) across North America since its discovery in Michigan in 2002 (Cappaert et al., 2005; Flower et al., 2013). Once EAB reaches ash-dominated wet lowland forests, the entire ecosystem is expected to convert from lowland forest to wet meadow, thereby losing the structure and function that the trees provide (Youngquist et al., 2017, but see Windmuller-Campione et al., 2021, for the response to management of a variety of black ash ecosystems).
When lowland ash forests are killed by EAB, they lose their ability to transpire water, resulting in higher water tables (Slesak et al., 2014; Diamond et al., 2018). These changes, combined with more understory light following loss of the ash canopy, benefit the establishment of sedges and shrubs and inhibit establishment of a new cohort of trees (Looney et al., 2017). While lowland ash forest types can be seasonally inundated, the timing, seasonality, and impact of EAB varies among ash forest types. Additionally, climate change may enhance the spread of EAB to more northerly ash populations (Liang and Fei, 2014), but it also provides an opportunity for assisted migration (AM) of new tree species (Prasad et al., 2024) to provide similar ecosystem functions under future climate but without susceptibility to EAB. There have been recent efforts to collect foundational data on vegetation, hydrology, and soils from these lowland ash forest ecosystems (Benedict and Frelich, 2008; Telander et al., 2015; Looney et al., 2017), as well as testing of new tree species to artificially reforest lowland ash forests (Palik et al., 2021; Keller et al., 2023; Keller et al., 2024). Such new data can facilitate improvements in the simulation of forest response to management (including AM) in lowland hardwood ecosystems across the Great Lakes region to provide insight into the effectiveness of such management interventions at landscape scales of space (> 105 ha) and time (centuries) (e.g., Gustafson et al., 2023a).
Table 1PnET-Succession waterlogging parameters revised from a previous study (Gustafson et al., 2023a) based on the results of the empirical experiment. Species not included in the empirical experiment are not shown.
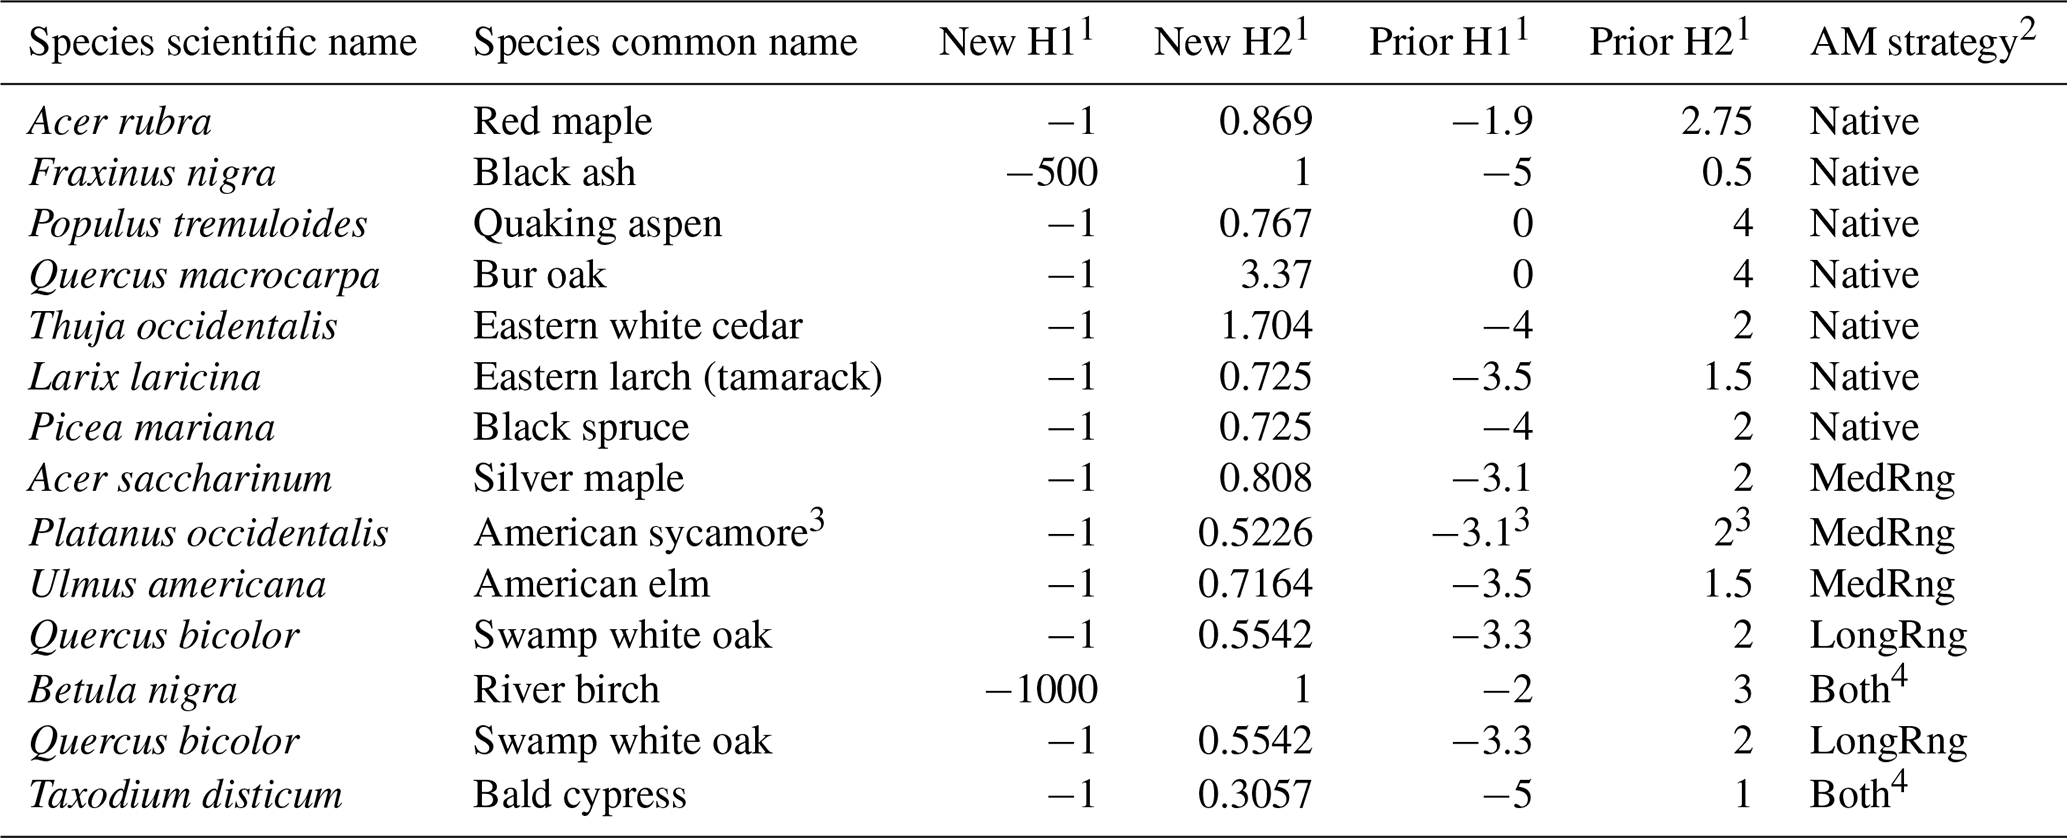
1 PnET-Succession waterlogging parameters. H1 is the soil water saturation (units of ABS(pressure head)) above which photosynthesis stops; H2 is the soil water saturation above which photosynthesis begins to slow (waterlogging stress begins). “New” indicates experimentally derived parameter values for this study; “prior” indicates parameters used by Gustafson et al. (2023b). 2 Assisted migration strategy (distance of source plantings from study area) in which species were planted in the case study. See text and Gustafson et al. (2023b) for details. 3 This species was not used in the previous study (Gustafson et al., 2023a). For this comparison, its prior H1/H2 values were assigned the same values as those of silver maple. 4 Atlantic white cedar (Chamaecyparis thyoides, not studied in empirical tests and given the waterlogging parameters of Thuja occidentalis) was always planted with bald cypress (both AM strategies) in the case study.
Simulation of lowland forest dynamics in landscape models has been problematic because the drivers of lowland hydrology have complex spatial (horizontal and vertical) components, making most algorithms that simulate such hydrology intractable at landscape scale (Sulman et al., 2013). The PnET-Succession extension of the LANDIS-II forest landscape model was recently updated (v.5.1, Gustafson et al., 2023b) to include simple algorithms to approximate lowland hydrology that are tractable but mimic lowland forest dynamics in a way that is appropriate for studies of landscape-scale (space and time) responses of lowland forests to climate, disturbance, and management drivers (e.g., Gustafson et al., 2020, 2024).
LANDIS-II (v7.0, Scheller et al., 2007, https://www.landis-ii.org, last access: 20 May 2025) simulates succession by accounting for forest generative processes (seed dispersal, tree establishment, growth) and degenerative processes (disturbance, competition, and senescence) over time. LANDIS is modular, where model extensions are “plugged in” to simulate specific ecological processes. Landscapes are represented as a grid of spatially interacting cells (typically 0.1–2.5 ha) where species composition and vertical structure are assumed to be homogeneous, and these cells are spatially aggregated into biophysical units (ecoregions) with homogeneous soils and climate. On each cell, forest composition is represented as the age cohorts of one or more tree species, each of which competes as a function of their vital attributes (e.g., growth capacity, shade tolerance, drought tolerance, longevity, seed dispersal, ability to sprout vegetatively) and conditions on the cell. This results in nondeterministic successional pathways driven by abiotic conditions, competition, and disturbance (Mladenoff, 2004). Independent disturbance extensions simulate processes that remove some or all of their biomass as a function of disturbance type and severity. The model user chooses which processes must be simulated to achieve study objectives and parameterizes (and calibrates) a model extension for each process.
The objectives of our study were to (1) conduct empirical experiments to allow estimation of waterlogging tolerance parameters (for PnET-Succession) of lowland tree species currently extant in the upper Midwest (USA) or that are potential candidates to replace extant species that are under threat from exotic pests or climate change, (2) parameterize and test the simulated growth and competition behavior of these species using LANDIS-II, and (3) simulate a case study of the effect of AM and climate change (using two different assisted migration strategies under two different climate change scenarios) on lowland forest dynamics in a northern Wisconsin landscape. Our focus was to explore the effects of improved waterlogging tolerance parameters in a heterogeneous landscape over an ecologically relevant time frame.
2.1 Empirical experiment
Controlled empirical experiments were designed to estimate the waterlogging tolerance of lowland tree species that might be candidates to replace ash trees following its extirpation by EAB (native and assisted migrants) (Poland and McCullough, 2006). Native tree species for the experiment were selected based on initial consultation with Wisconsin Department of Natural Resources (WDNR) silviculturists and from previous work of Keller et al. (2023) (see Table 1). Potential assisted migrant species were included in the testing; these species, such as river birch, bald cypress, and American sycamore, are typically found in more southerly states like Indiana, Illinois, and Iowa. Seedlings were provided by the WDNR state nursery (Boscobel, Wisconsin). Bare-root seedlings were planted in potting soil (Berger BM7) in seedling containers (10 cm × 10 cm × 30 cm) and then placed in 30 cm tall water tanks in which the water level (i.e., flood level) was controlled. The tanks were arranged outside in a split–split-plot randomized complete block design with three levels of soil saturation (water level maintained at 0, 14, or 27 cm below the soil surface), referred to as flooded, intermediate, and drained, respectively. Additionally, three levels of light availability were manipulated using shade cloth (full light, 40 % reduction, 70 % reduction). For the purposes of this study, we used only the full-light treatment. Flooding levels were checked weekly to ensure that the treatments were accurately applied throughout the experiment (i.e., 14 weeks). Each treatment block was replicated eight times. The details of the empirical experiment along with measurements of photosynthesis, soil water potential, and growth can be found in Keller et al. (2024).
Table 2Ecoregion parameter values used to mimic the three empirical soil water treatments (see text).
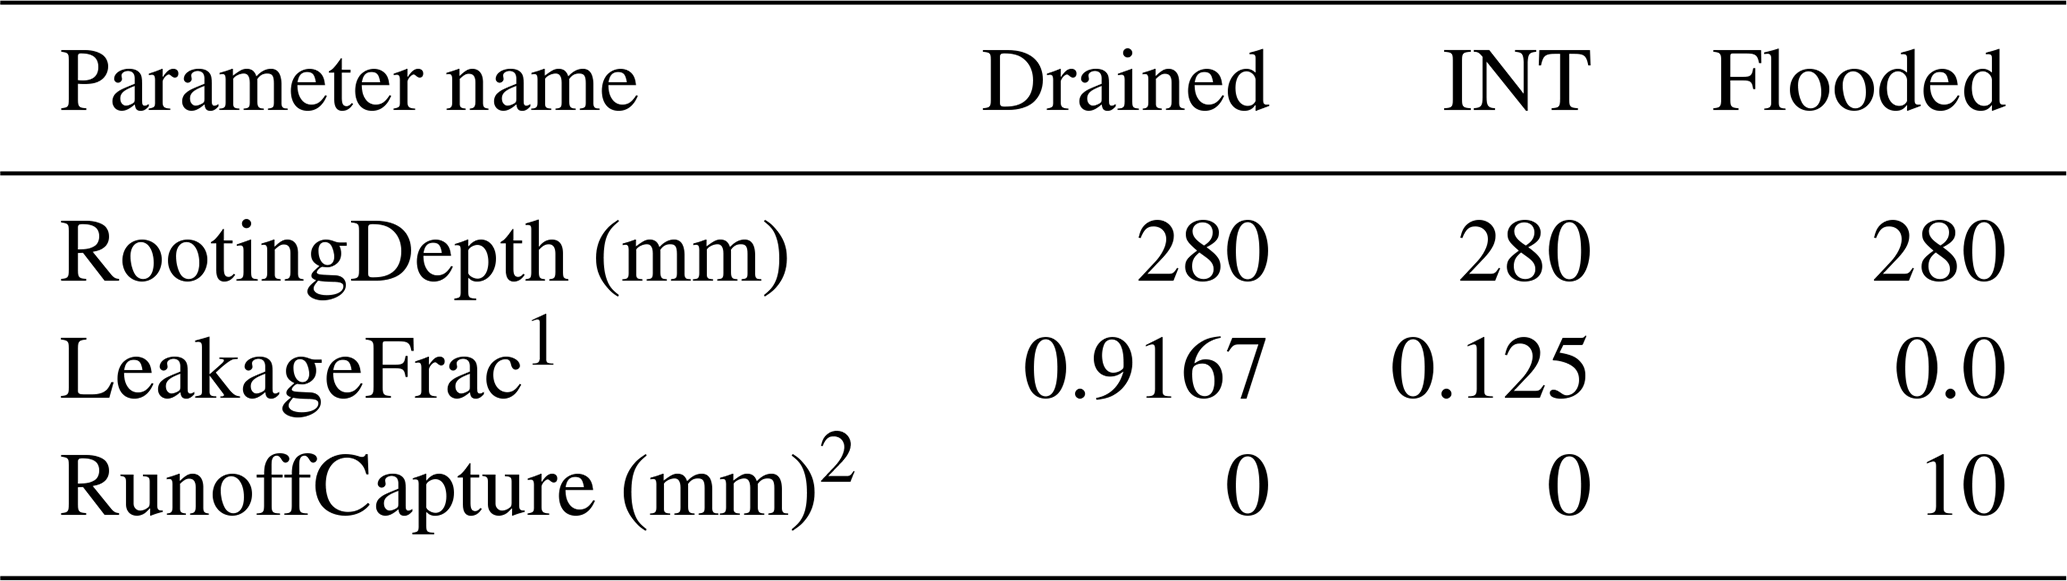
1 Leakage fraction, or the fraction of soil capacity water that percolates out of the rooting zone (i.e., slow leakage). 2 Height above ground surface of the basin outlet; this allows standing water on the cell up to this depth.
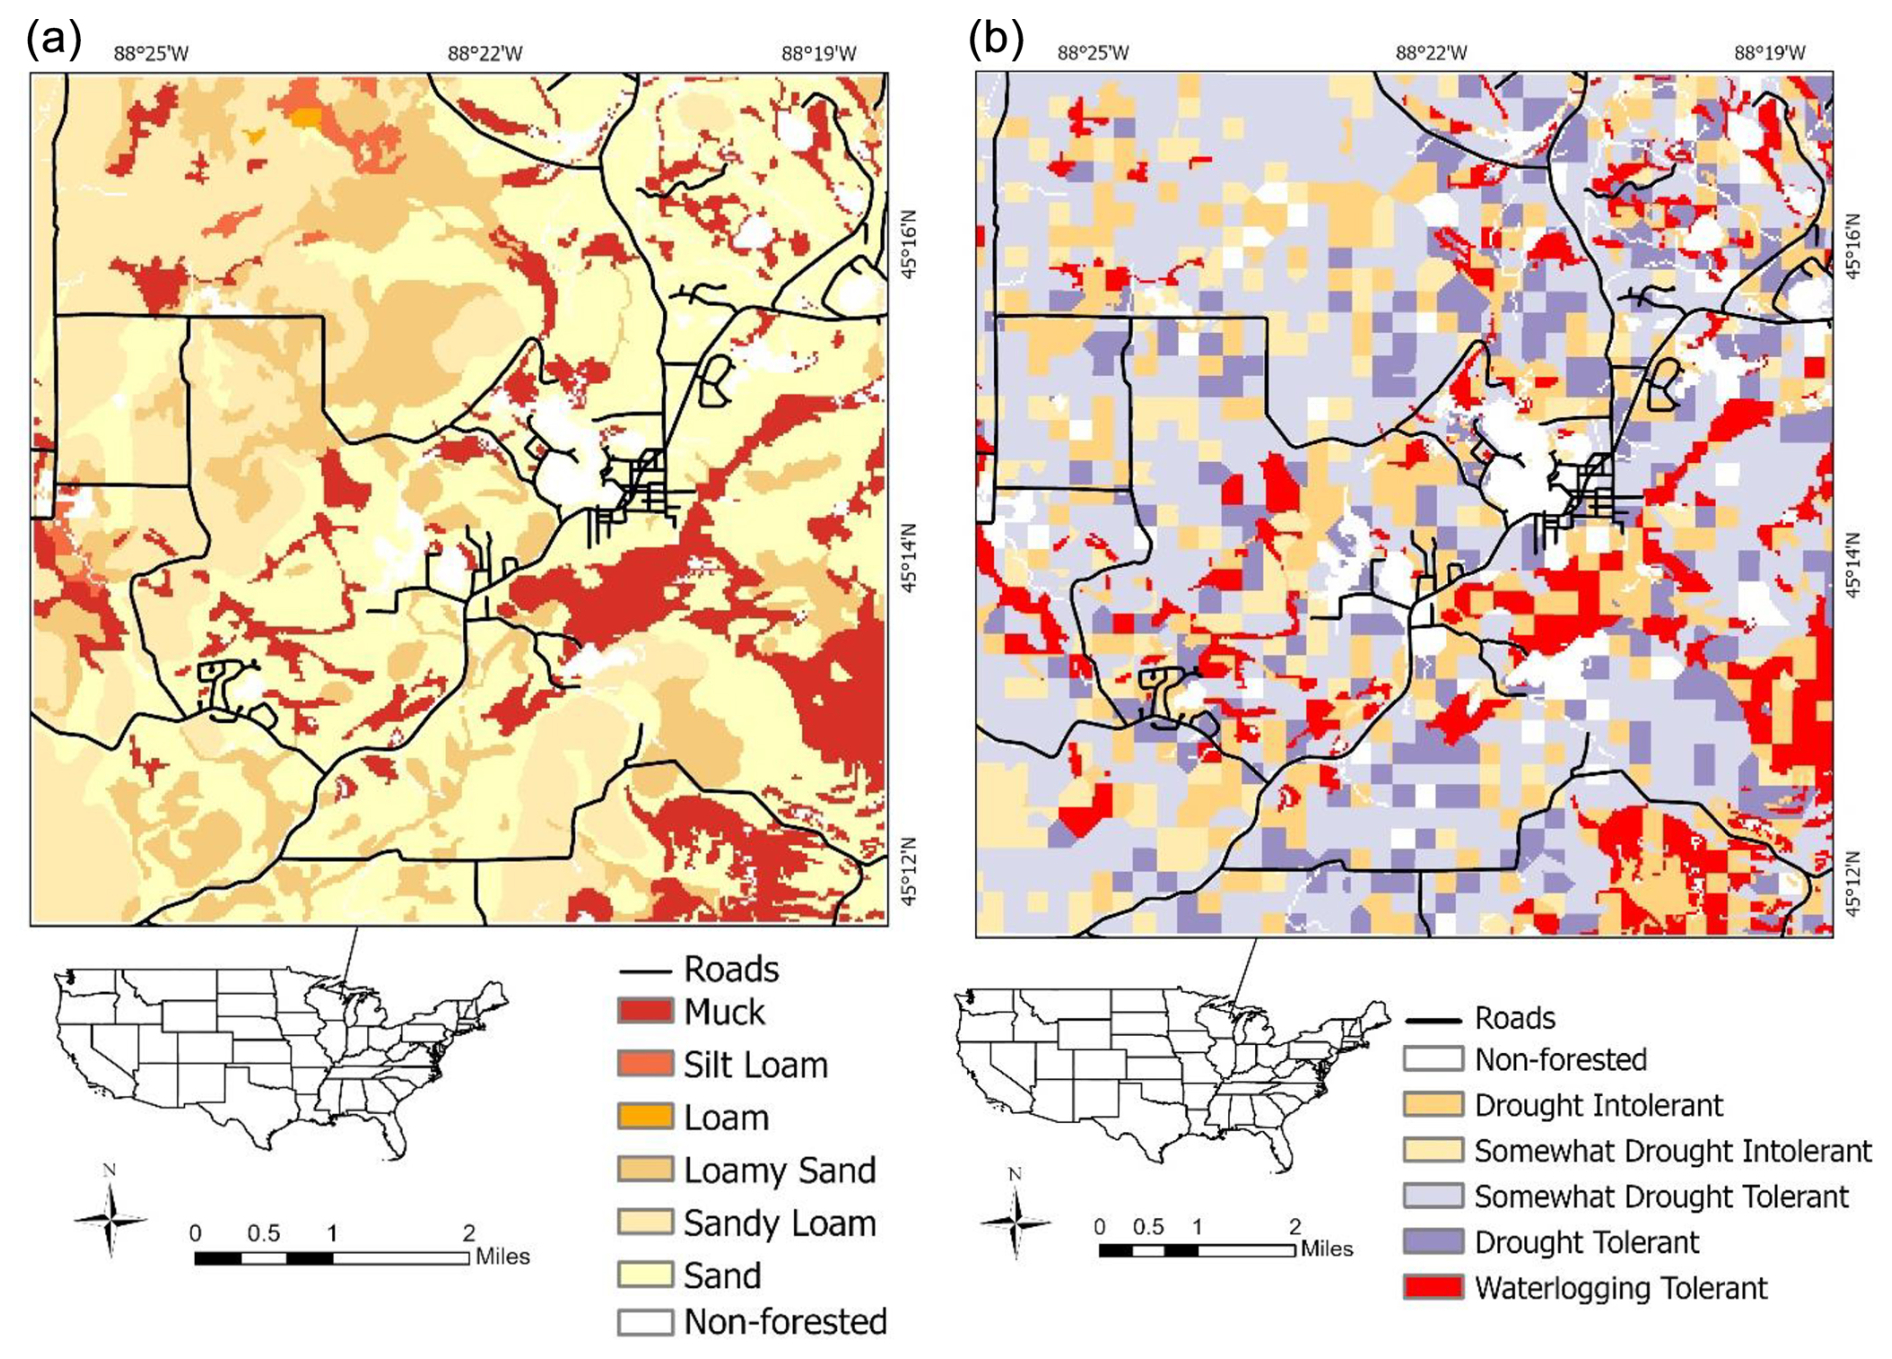
Figure 1Case study landscape (9608 ha) located in Oconto County (Wisconsin, USA), showing soil type (a) and time zero dominant tree species types (b) defined by tolerance of soil water stress. Waterlogging-tolerant tree species are currently dominant mostly on lowland (muck) sites.
Throughout the field experiment, soil moisture was recorded at a 10 cm depth for a subset of the potted tree species. However, for the purposes of mimicking the experiment with LANDIS, more specific measurements were needed to calculate mean soil water potential throughout the soil profile for a given flooding treatment. After the experiment, the water tanks used in the original experiment were each filled to one of the three water levels used during the original experiment (0, 14, and 27 cm below the soil surface). Twelve 10 × 10 × 30 cm pots were filled with the same Berger BM7 potting soil used in the experiment, and four pots were placed into each of the three water tanks to replicate the water level and corresponding soil moisture values. Soil moisture and soil water potential were collected in the saturated portions of the soil profile for all three treatments and also in the two unsaturated portions of the soil profile for the 14 and 27 cm treatments using Teros 12 and Teros 21 sensors, respectively, connected to a Z6 data logger (Meter Equipment Group). Weighted averages were calculated for soil moisture and soil water potential for each of the three treatments using the soil moisture data as a proportion of the soil profile that was either saturated or unsaturated.
Although photosynthesis was measured every 2 weeks throughout the 14-week experiment, we used only the two measurement cycles from August to parameterize PnET-Succession. We chose August because it represents peak growing season photosynthesis and allowed 8 weeks for the flooding treatments to produce an effect on the seedlings. To estimate PnET-Succession waterlogging tolerance parameters, we used the empirical photosynthesis measurements to estimate the reduction in photosynthesis caused by the flooded treatment (0 cm of aerated soil) compared to photosynthesis on the drained treatment (27 cm of aerated soil) for each species. This proportional reduction observed is equivalent to the fWater variable in PnET-Succession. In PnET-Succession, fWater is a water-stress cohort variable that functions as a reduction multiplier (one of several) that reduces the optimum net photosynthesis rate for the month. fWater is updated monthly from the soil water potential variable of the cell to reflect cohort water stress from either too little or too much water. A water-stress reduction (fWater) value of 1.0 produces no reduction in photosynthesis, and fWater = 0.0 reduces photosynthesis to zero. We used the means of these calculated fWater equivalent values to estimate the PnET-Succession waterlogging tolerance parameters (H1 and H2) for each species. H1 is the soil water saturation (water potential in units of ABS(pressure head)) beyond which photosynthesis completely shuts down (due to waterlogging), and H2 is the soil water saturation at which photosynthesis begins to decline. In the model, photosynthesis (i.e., fWater) declines linearly due to waterlogging as soil water saturation increases from H2 to H1. We arbitrarily set the H1 of all (most) species to −1.0 (to ensure that fWater can never reach zero) and then set the H2 of each species to cause an fWater value equal to its estimated fWater equivalent (between 0.0 and 1.0) when the soil water potential equals 0 (flooded) (Table 1).
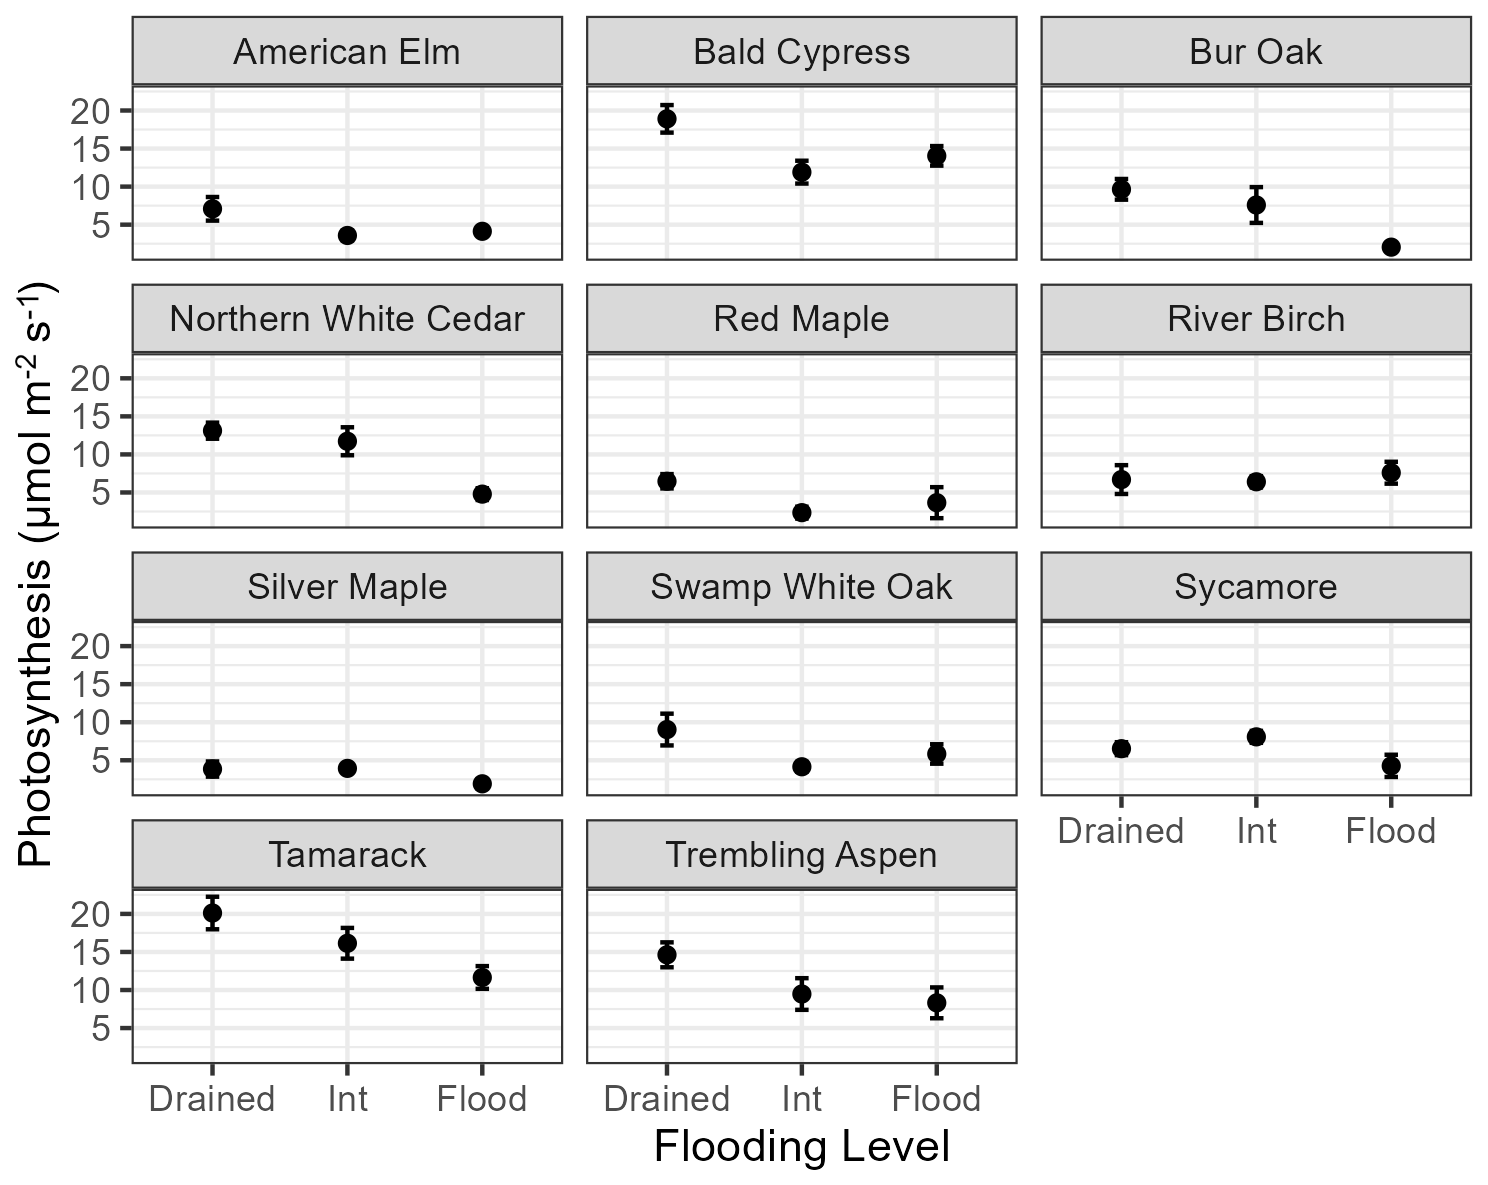
Figure 2Effects of flooding level on photosynthesis for potted seedlings grown in full sunlight in the empirical experiment. Error bars show the standard error.
The experimental treatments were thus used to estimate the waterlogging tolerance parameters of PnET-Succession. In turn, PnET-Succession was used to virtually scale the empirical experiment to longer time frames and more diverse species assemblages. PnET-Succession has direct links between climate drivers (CO2 concentration, temperature, and precipitation) and tree species cohort net primary productivity, using physiological first principles (Aber et al., 1995). PnET-Succession also accounts for life history traits that are necessary for this study (e.g., waterlogging, shade, and temperature tolerances). Such a mechanistic modeling approach is superior to phenomenological approaches that use the past to predict the future when the future is expected to be exceptionally novel (Gustafson, 2013). In PnET-Succession, tree cohorts (and their propagules) compete for light and water on each grid cell as their life history traits interact with the abiotic environment, and the outcome of competition interacts with disturbances to determine successional rates and trajectories. The model allows some runoff from landscape grid cells to be retained on site (as standing water), the maximum height of which (RunoffCapture) is typically specified only for lowland-specific ecoregions. Additionally, the leakage fraction parameter (default = 1.0) can be reduced for specific ecoregions to represent increasingly impermeable soil within or below the rooting zone, also encouraging waterlogged conditions to develop dynamically (monthly) as a function of inputs (precipitation) and outputs (runoff, leakage, evapotranspiration comprised of evaporation, interception, and transpiration). Thus, cohorts on a lowland cell may experience fluctuating water stress (either too dry or too wet) as precipitation and evapotranspiration (as influenced by all living cohorts) raise and lower the soil water potential on a monthly or annual basis. Complete details about the PnET-Succession algorithms can be found in Gustafson et al. (2023a).
2.2 Modeling experiments
We conducted a virtual (simulated) version of the empirical experiment, seeking to mimic as closely as possible the experimental empirical results. The purpose was to assess the difference in simulated outcomes between empirically estimated waterlogging tolerance parameters (H1, H2) and those estimated from other sources for previous studies. Prior to this study, H1 and H2 parameter values were given values with little empirical basis, and their relative settings were typically derived from synthetic meta-databases (e.g., Kattge et al., 2020; Niinemets and Valladares, 2006). Our modeling exercises tested and evaluated the parameter values estimated from the empirical experiment.
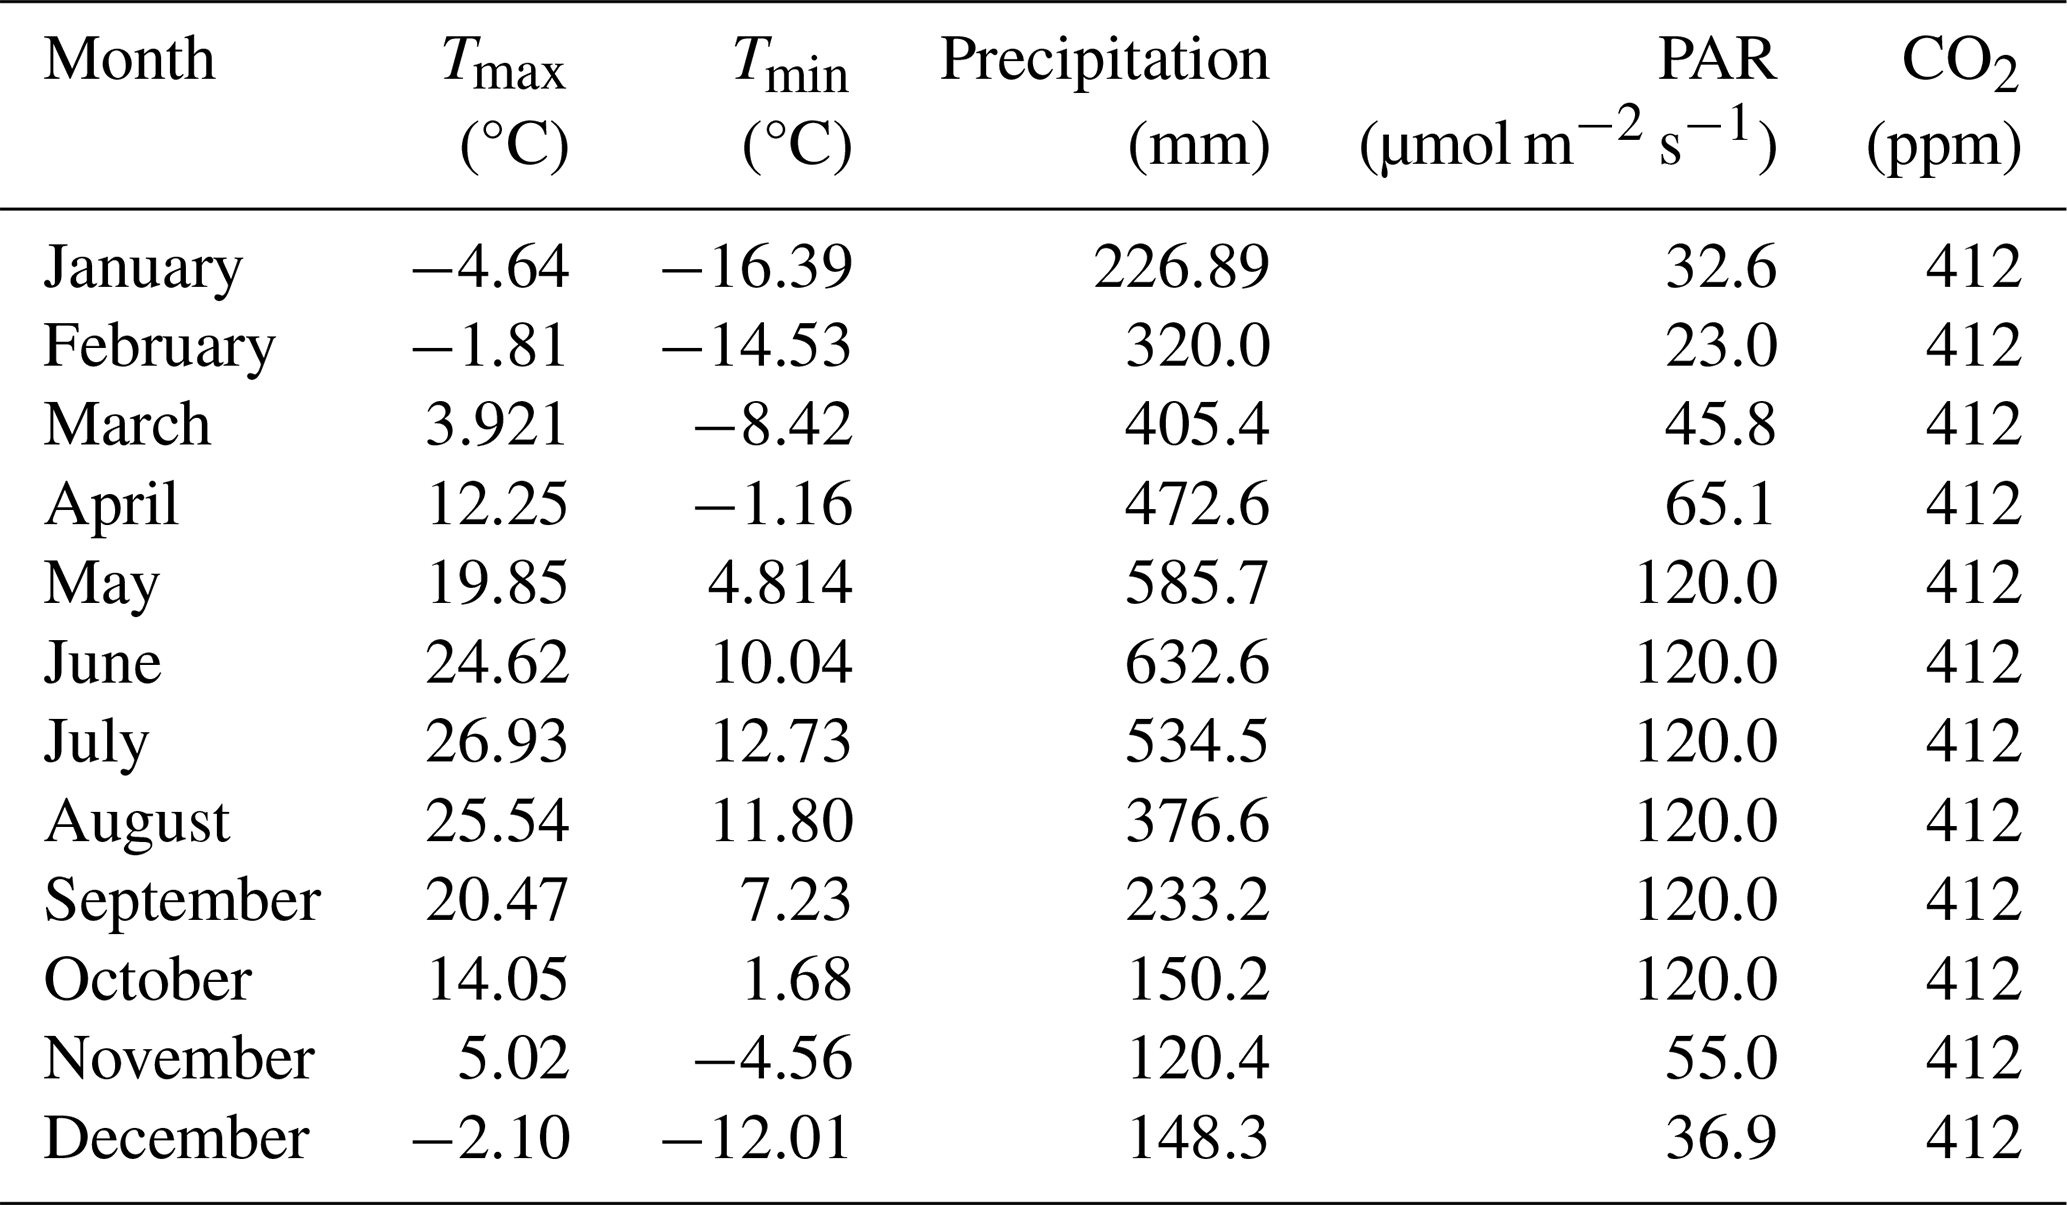
For these initial tests of the model, we constructed an artificial “landscape” where each individual grid cell represented a specific combination of water-level treatment and tree species of the empirical experiment. To maintain the isolation of these cells (experimental units in this context), seed dispersal and establishment were turned off. Tree seedlings from the empirical study were simulated by establishing a new cohort of the designated species on each given cell (MapCode), as specified in the initial condition input file. The soil- and water-level conditions were controlled by setting the ecoregion parameters assigned to the cell to mimic waterlogging treatment conditions from the empirical study. The ecoregion soil was a novel soil texture (PTNG) parameterized by us to represent the potting soil used in the experiment (Table A1). The model simulates soil water dynamics using a “leaky bucket” conceptual approach, where soil moisture in each month is modified from the previous month's moisture as a function of the current month's water inputs (precipitation and snowmelt) and outputs (runoff, leakage (drainage out of the rooting zone), and evapotranspiration). Because the model does not track (or control) the water table, the water-level treatments (drained, intermediate, and flooded) were tricky to implement. The precipitation inputs required by the model were made artificially high (and distributed equally across all days of the month) to ensure adequate water to maintain the “flooded” treatment. Each water-level treatment was implemented by varying LeakageFrac and RunoffCapture (Table 2) to produce appropriate soil water conditions. The rooting zone was constant across all treatments and was equal to the depth of the pots used in the empirical experiment (280 mm). Monthly temperature and other abiotic condition (photosynthetically active radiation, PAR, [CO2]) inputs were held constant year to year in the model and reflect the conditions observed at the site of the experiment (Table A2). Thus, our model did not explicitly mimic all the components of the empirical experiment (e.g., weather) but attempted to mimic the experimental factors explicitly held constant or manipulated.
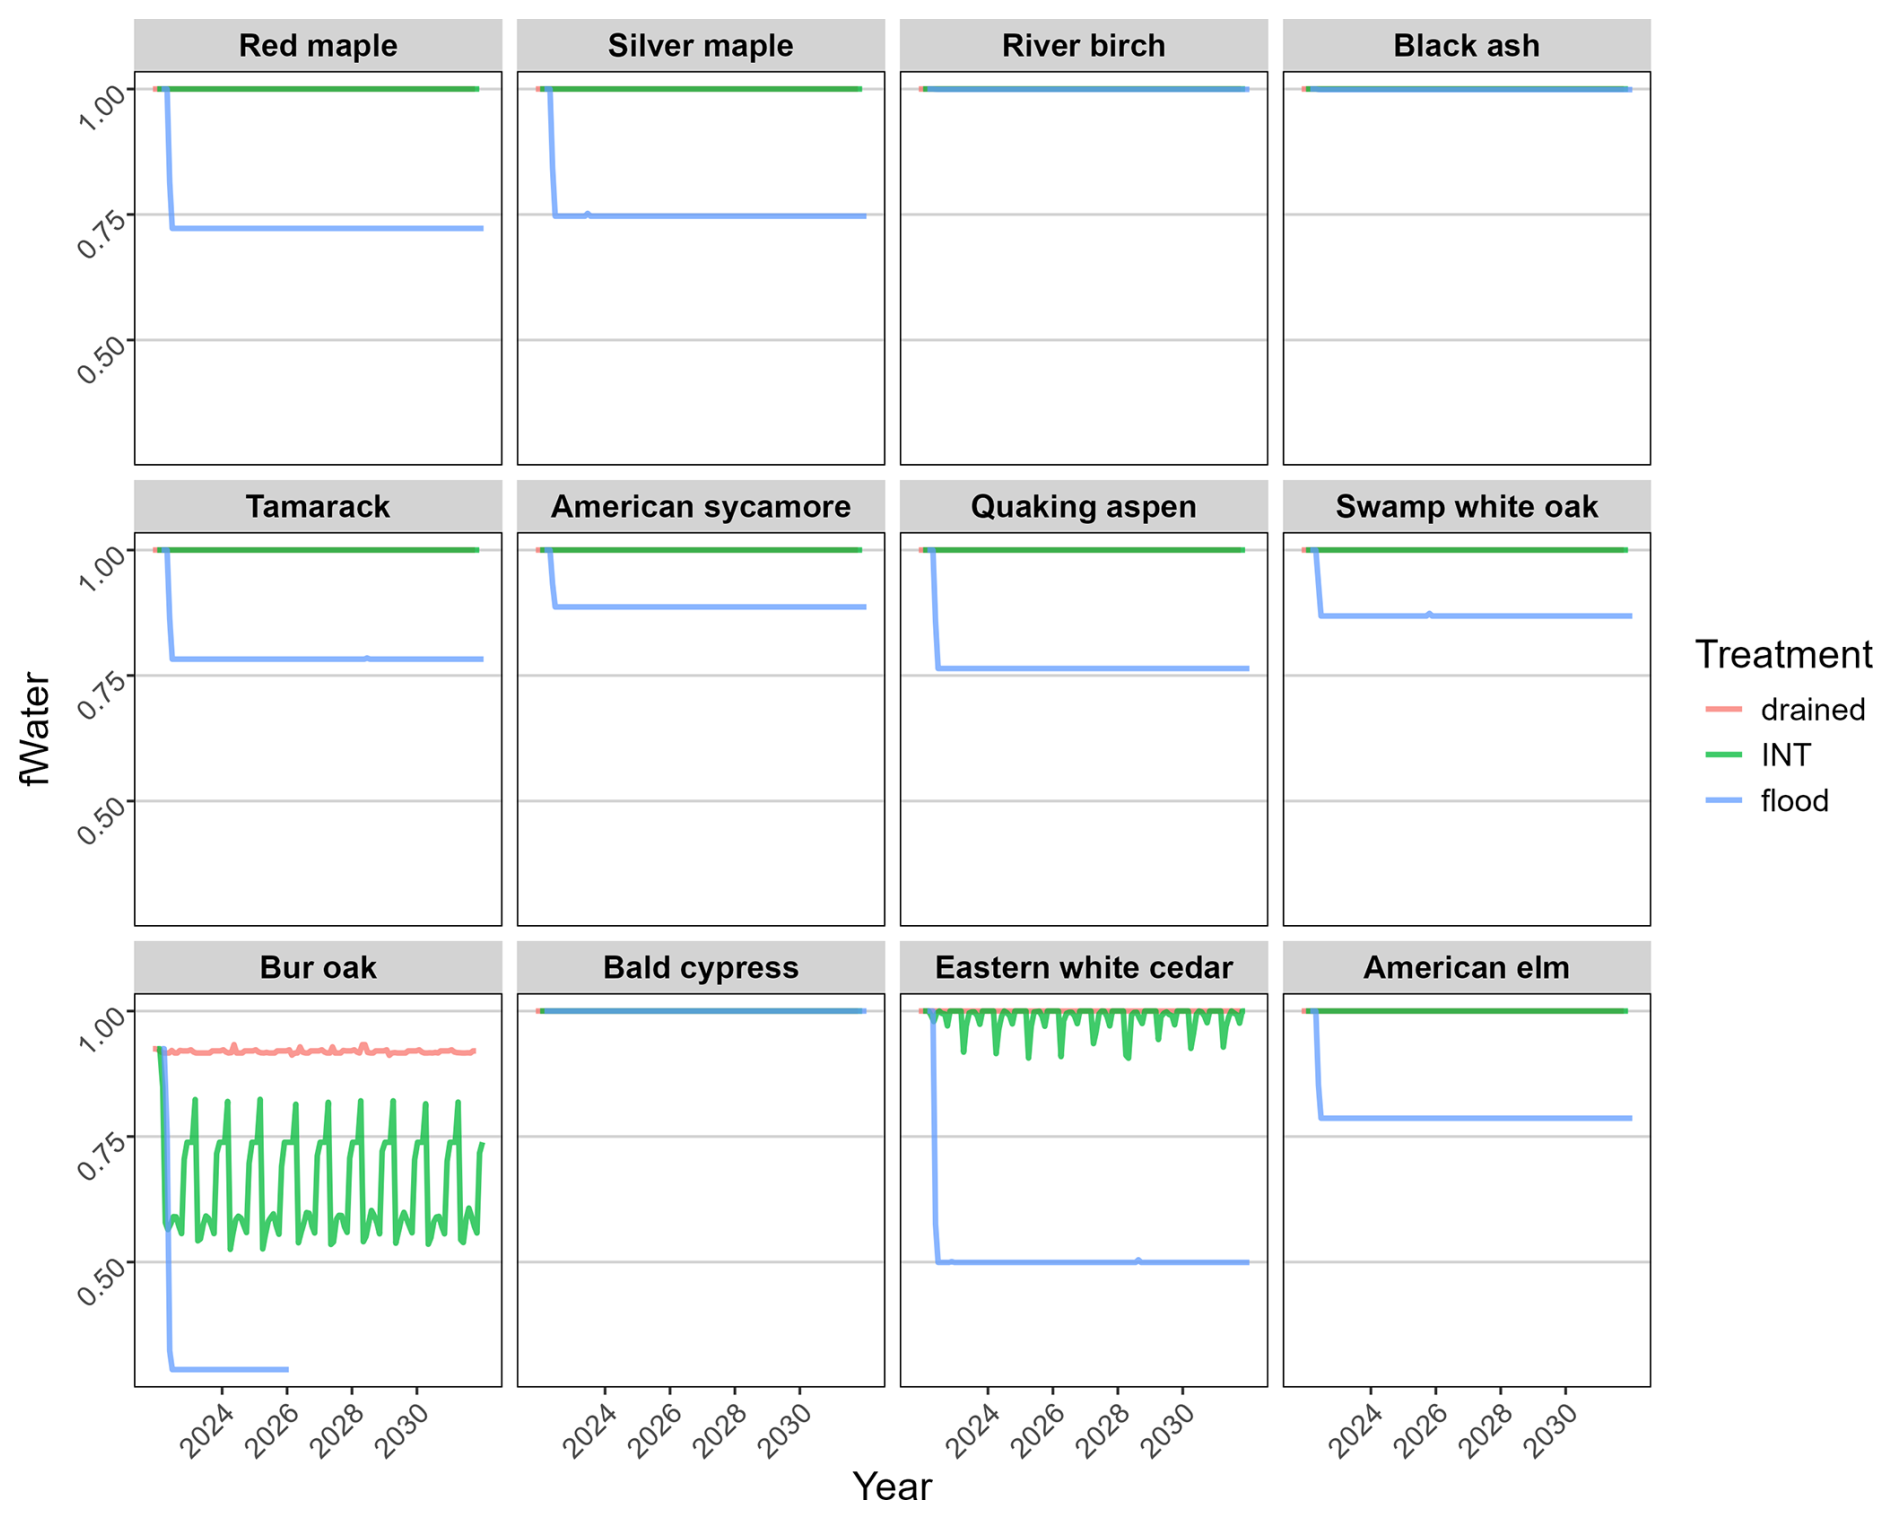
Figure 3Simulated monthly water stress (fWater) for each species under three water-level treatments. fWater = 1.0 indicates no stress; fWater = 0.0 causes photosynthesis to completely shut down. In most cases, the “INT” line obscures the “drained” line.
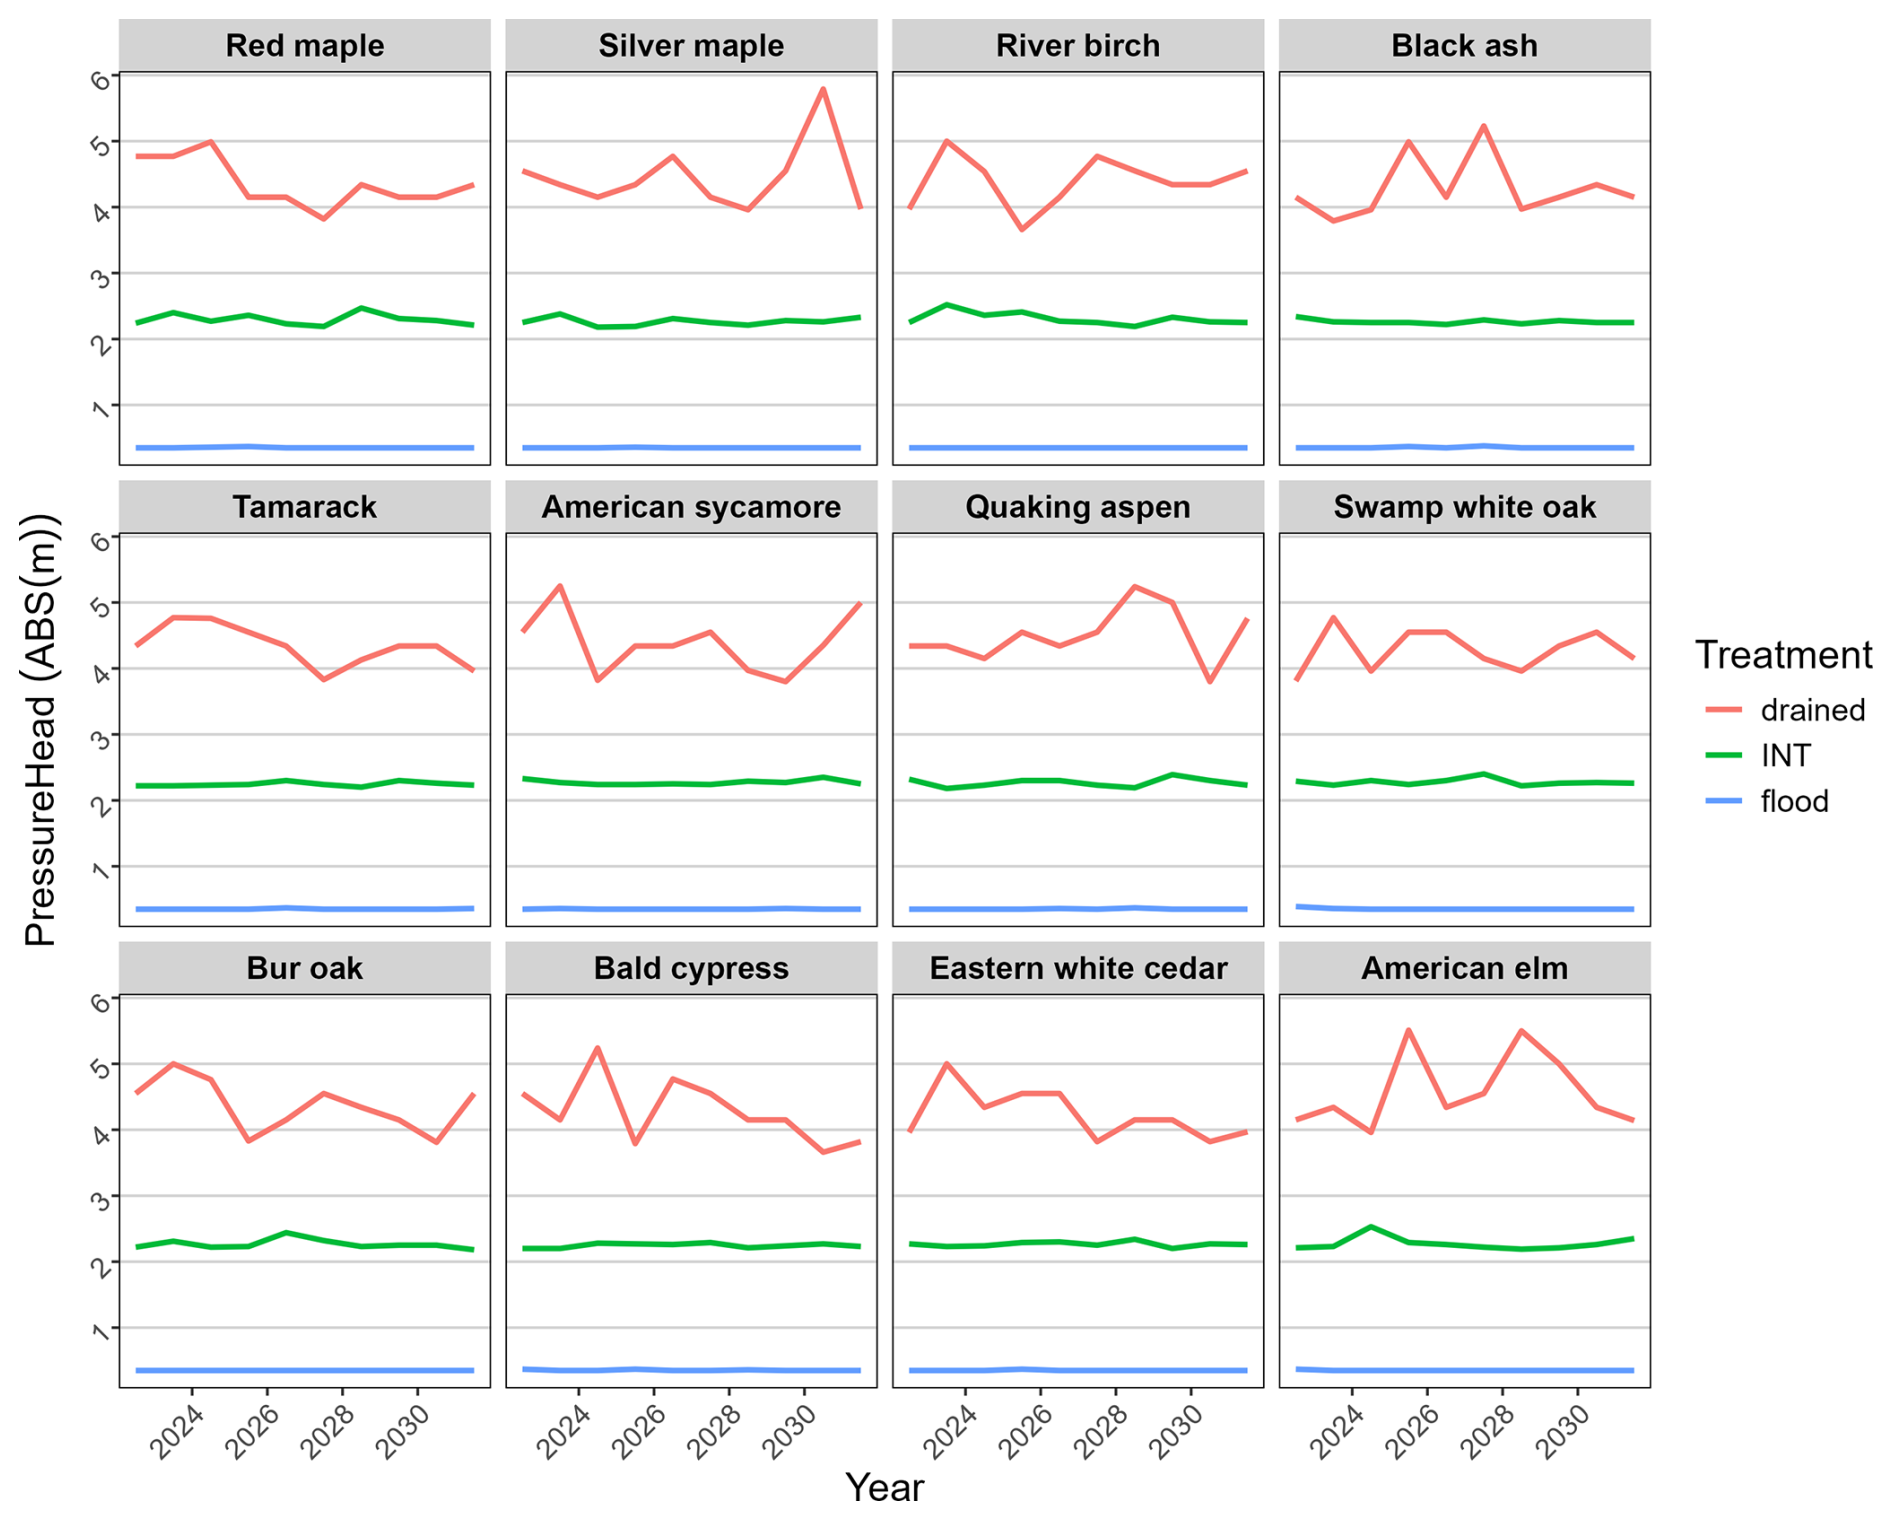
Figure 4Simulated mean July soil water potential (absolute value of m pressure head; higher values represent less moisture), accounting for transpiration by seedlings.
To mimic the empirical experiment, we used the PnET-Succession species parameters estimated from the empirical results (Table 1) and parameters representing the potting soil used in the empirical experiment (Table A1). Other LANDIS-II and PnET-Succession parameters took values used in other studies in northern Wisconsin (e.g., Gustafson et al., 2023a). We virtually extended the length of the empirical experiment using the calibrated and validated model parameters to provide insights into the likely long-term outcomes of such treatments. We ran these simulations for 90 years, matching the longevity of the shortest-lived species. We also conducted a virtual experiment to project the outcome of a hypothetical empirical experiment in which two competing species were grown together (for 90 years) under the experimental treatments.
We also evaluated a simple case study on a real landscape in northern Wisconsin (Fig. 1) to project the outcome of using AM species to replace keystone tree species that are expected to be lost from this landscape in the near future (both upland and lowland). We simulated the extirpation of black ash from lowland hardwood stands by EAB in the next decade (using the biological disturbance agent extension, Sturtevant et al., 2004) and ash replacement through AM. To this end, we simulated two AM scenarios (involving many tree species) under two climate futures (RCP6.0 and RCP8.5) for 300 years to allow the treatments time to respond to the climate signal and to overcome the ecological inertia of the initial conditions. The less aggressive AM strategy (MediumRange) planted species with ranges centered to the south of the range of endemic species on the study landscape, and the more aggressive strategy (LongRange) planted species having ranges centered even further south. We used the simulation methods of Gustafson et al. (2023b), using their initial landscape conditions and parameters for the disturbances (including their AM strategies) that shape successional dynamics in this landscape. We also used their ecoregion and species parameters, except we substituted the H1 and H2 parameters estimated for the species studied in the empirical experiments described above. Because lowland bogs exist in this landscape, we revised the black spruce H1 and H2 values to those of tamarack to make its waterlogging tolerance equal to its primary competitor on lowland bogs (Table 1). We compared the outcomes produced with revised waterlogging parameters (H1, H2) to those generated using the parameter values of Gustafson et al. (2023b) (i.e., prior H1 and prior H2 in Table 1). We simulated two replicates of each scenario combination for 300 years because variation in outcomes was low, and we were not testing hypotheses.
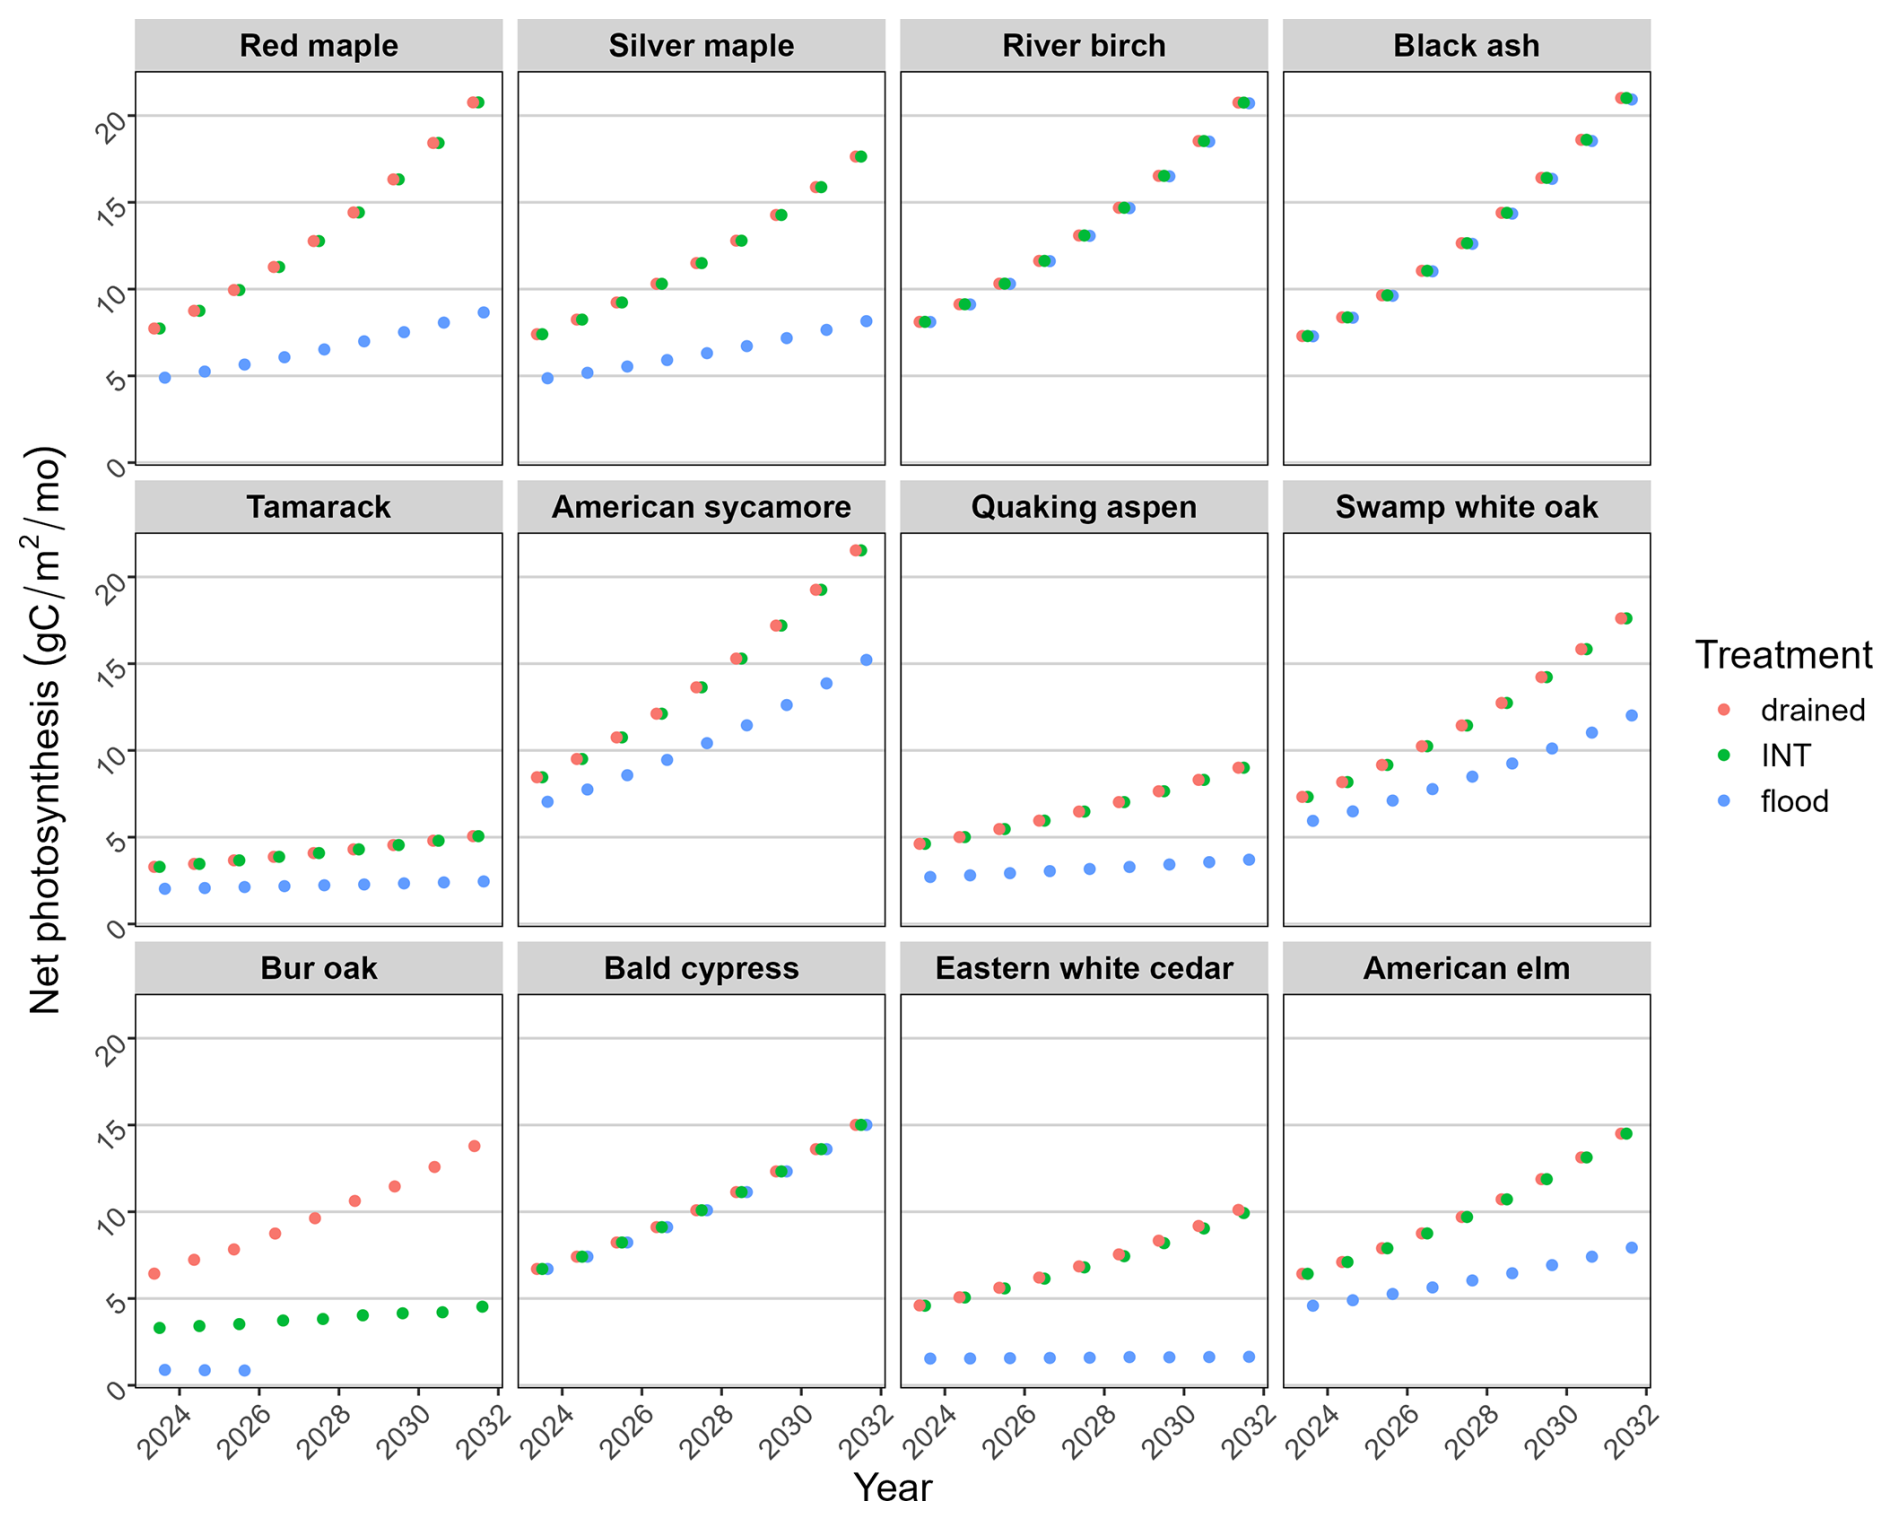
Figure 5Simulated mean July net photosynthesis for each species (beginning at age 1) under three water-level treatments. In most cases, the “INT” points obscure the “drained” points.
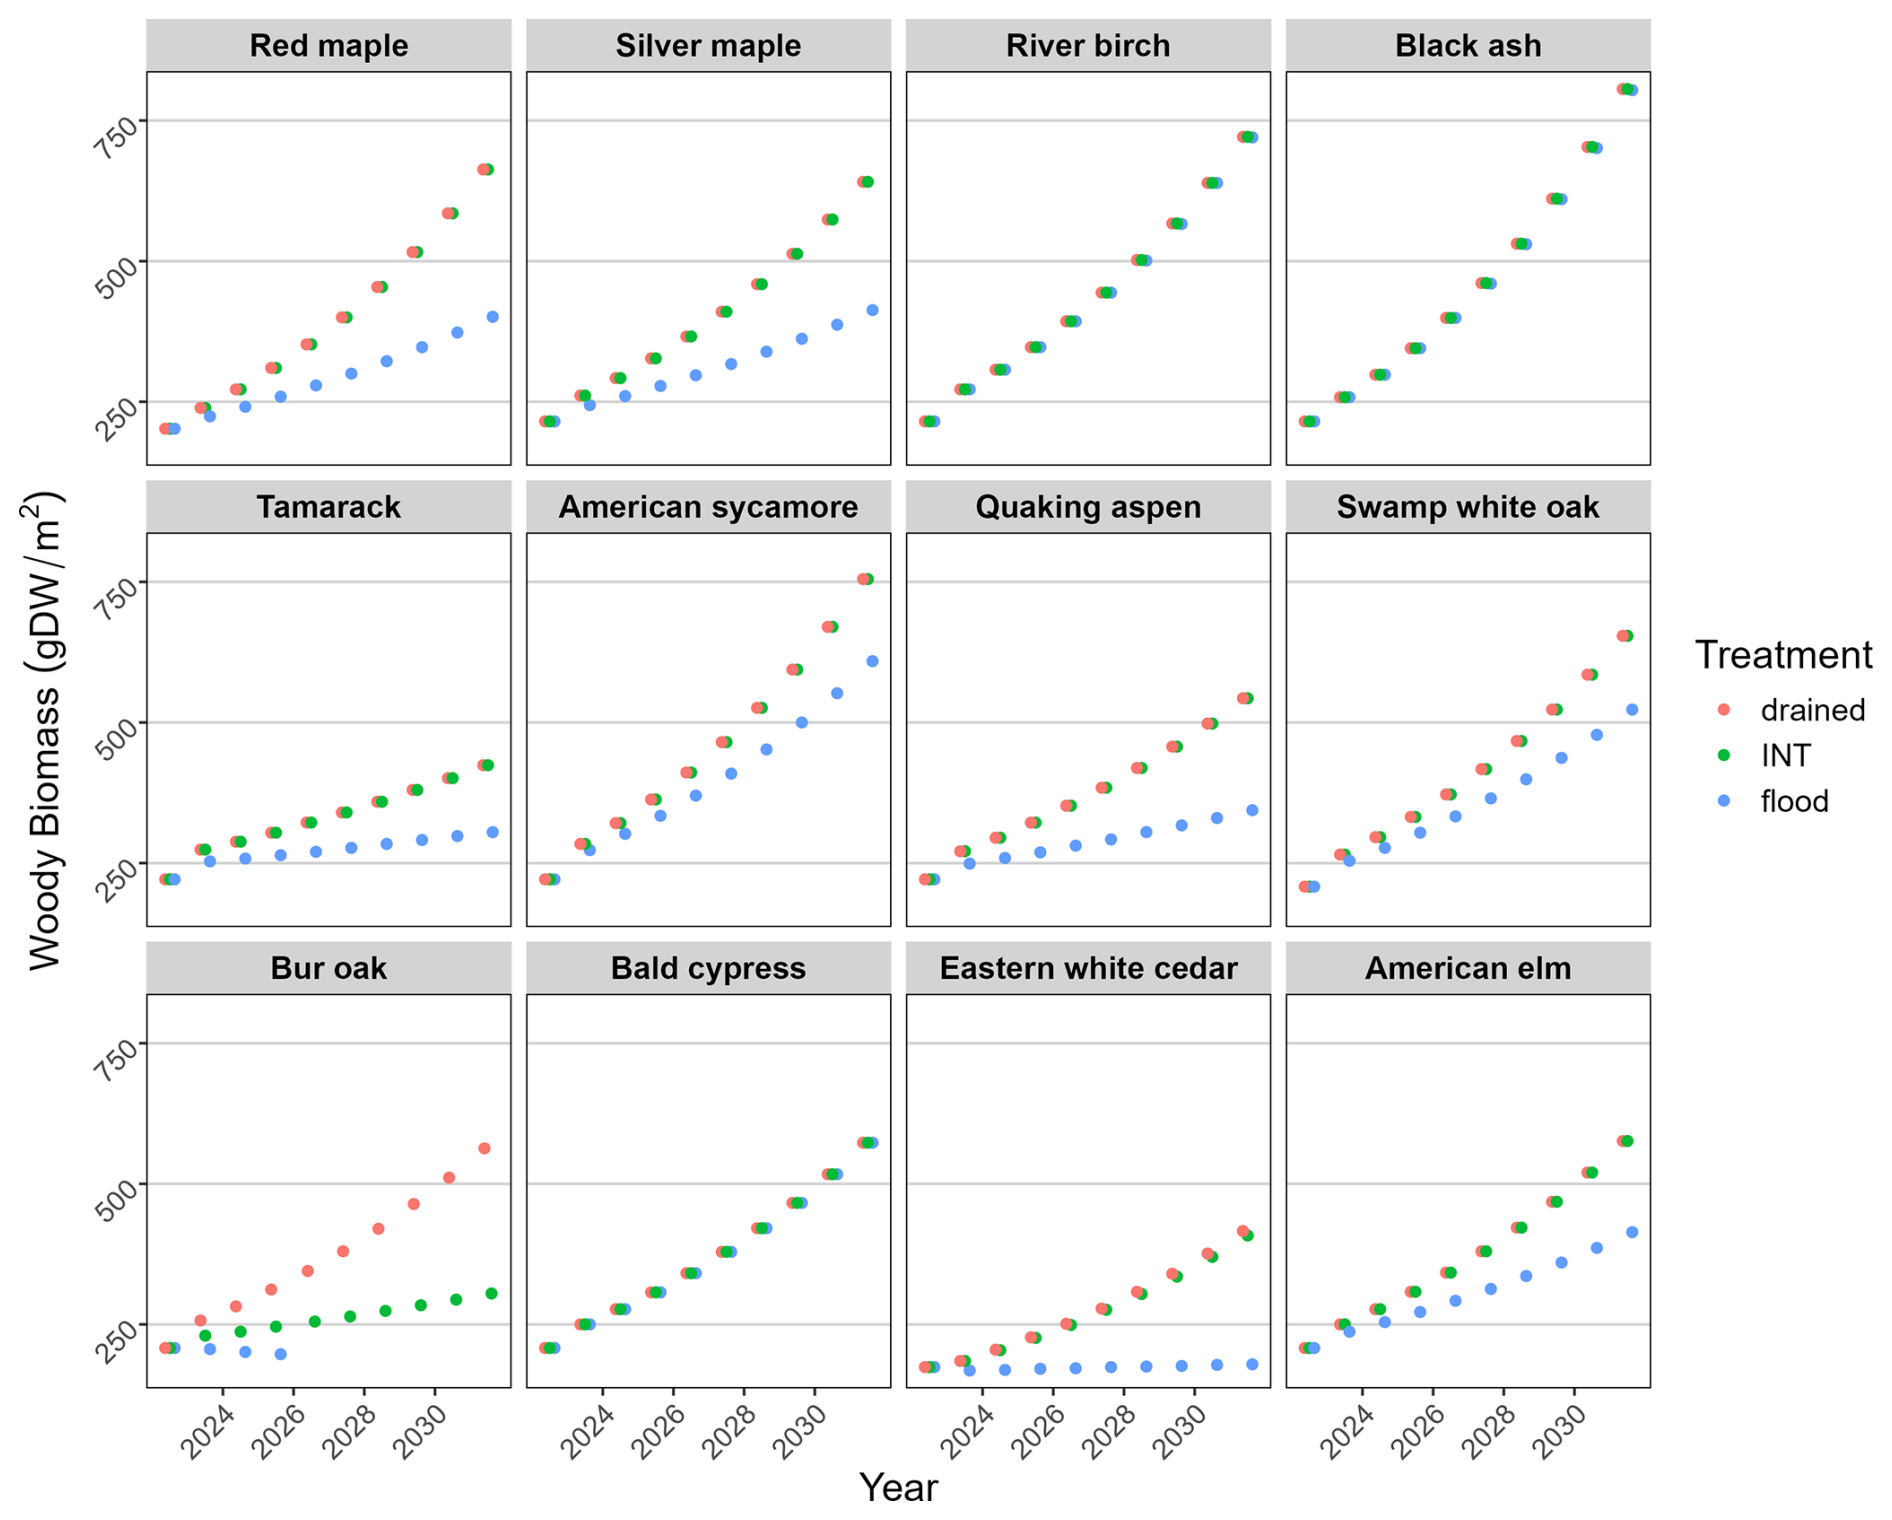
Figure 6Simulated biomass accumulation for each species (beginning at age 1) under three water-level treatments. Lines ending prematurely indicate the death of the cohort. In most cases, the “INT” points obscure the “drained” points, and in some cases, they obscure both other points.
3.1 Empirical experiment
The empirical measurements resulted in revised H1 and H2 parameter settings that in some cases varied considerably from previous settings (Table 1). The common setting of H1 = −1 caused H2 to be inversely related to waterlogging tolerance. H1 values < −1 produce very high waterlogging tolerance by ensuring fWater values near 1.0 when the pressure head = 0 (i.e., photosynthesis is reduced little by flooding).
In the empirical experiment, the waterlogging stress of seedlings of most species under the “drained” and “intermediate” treatments was quite similar because at least half of both soil profiles was well-drained. Species exhibited three general responses to the treatments (Fig. 2). Most species showed a response similar to bur oak, where the drained and intermediate treatments were relatively unstressed compared to the flooded treatment. Trembling aspen represents species that were relatively easily waterlogging stressed, but flooding was not dramatically worse. Bald cypress represents a highly water-tolerant species that responded equally well to both the intermediate and flooded treatments and performed very well under the drained treatment.
3.2 Modeling the empirical experiment
We were successful in parameterizing the model to mimic the soil water conditions of the empirical experiment. Simulated water stress (fWater) mimicked two critical characteristics of the experiment: (1) there was very little difference between the well-drained and intermediate flooding treatments, and (2) water stress of species (Fig. 3) aligned with the empirical waterlogging tolerance (Table 1). This was achieved with the average simulated soil water potential of the intermediate treatment (across the entire soil profile) falling midway between field capacity and flooded (Fig. 4), mimicking expectations for the intermediate flooding level.
In the empirical experiment, the growth of seedlings of most species under the drained and intermediate treatments was quite similar because at least half of the soil profile was well-drained (Fig. 2). Growth was reduced under flooded conditions, with the amount of reduction reflecting the species' waterlogging tolerance. Growth (NetPsn, biomass accumulation) was also simulated generally lower under flooded conditions by the model and was identical under drained and intermediate conditions (Figs. 5, 6).
3.3 Virtual experiments
When the model extended the empirical experiment for 90 years, species productivity and biomass accumulation plateaued or peaked at a level that could be supported by rooting zone depth and (the artificially high) precipitation (Fig. 7). Note that the units reported for biomass density are scaled up to a full square meter of area. Decline occurs when a cohort nears longevity age, and it may die before reaching longevity if it is stressed (e.g., quaking aspen).
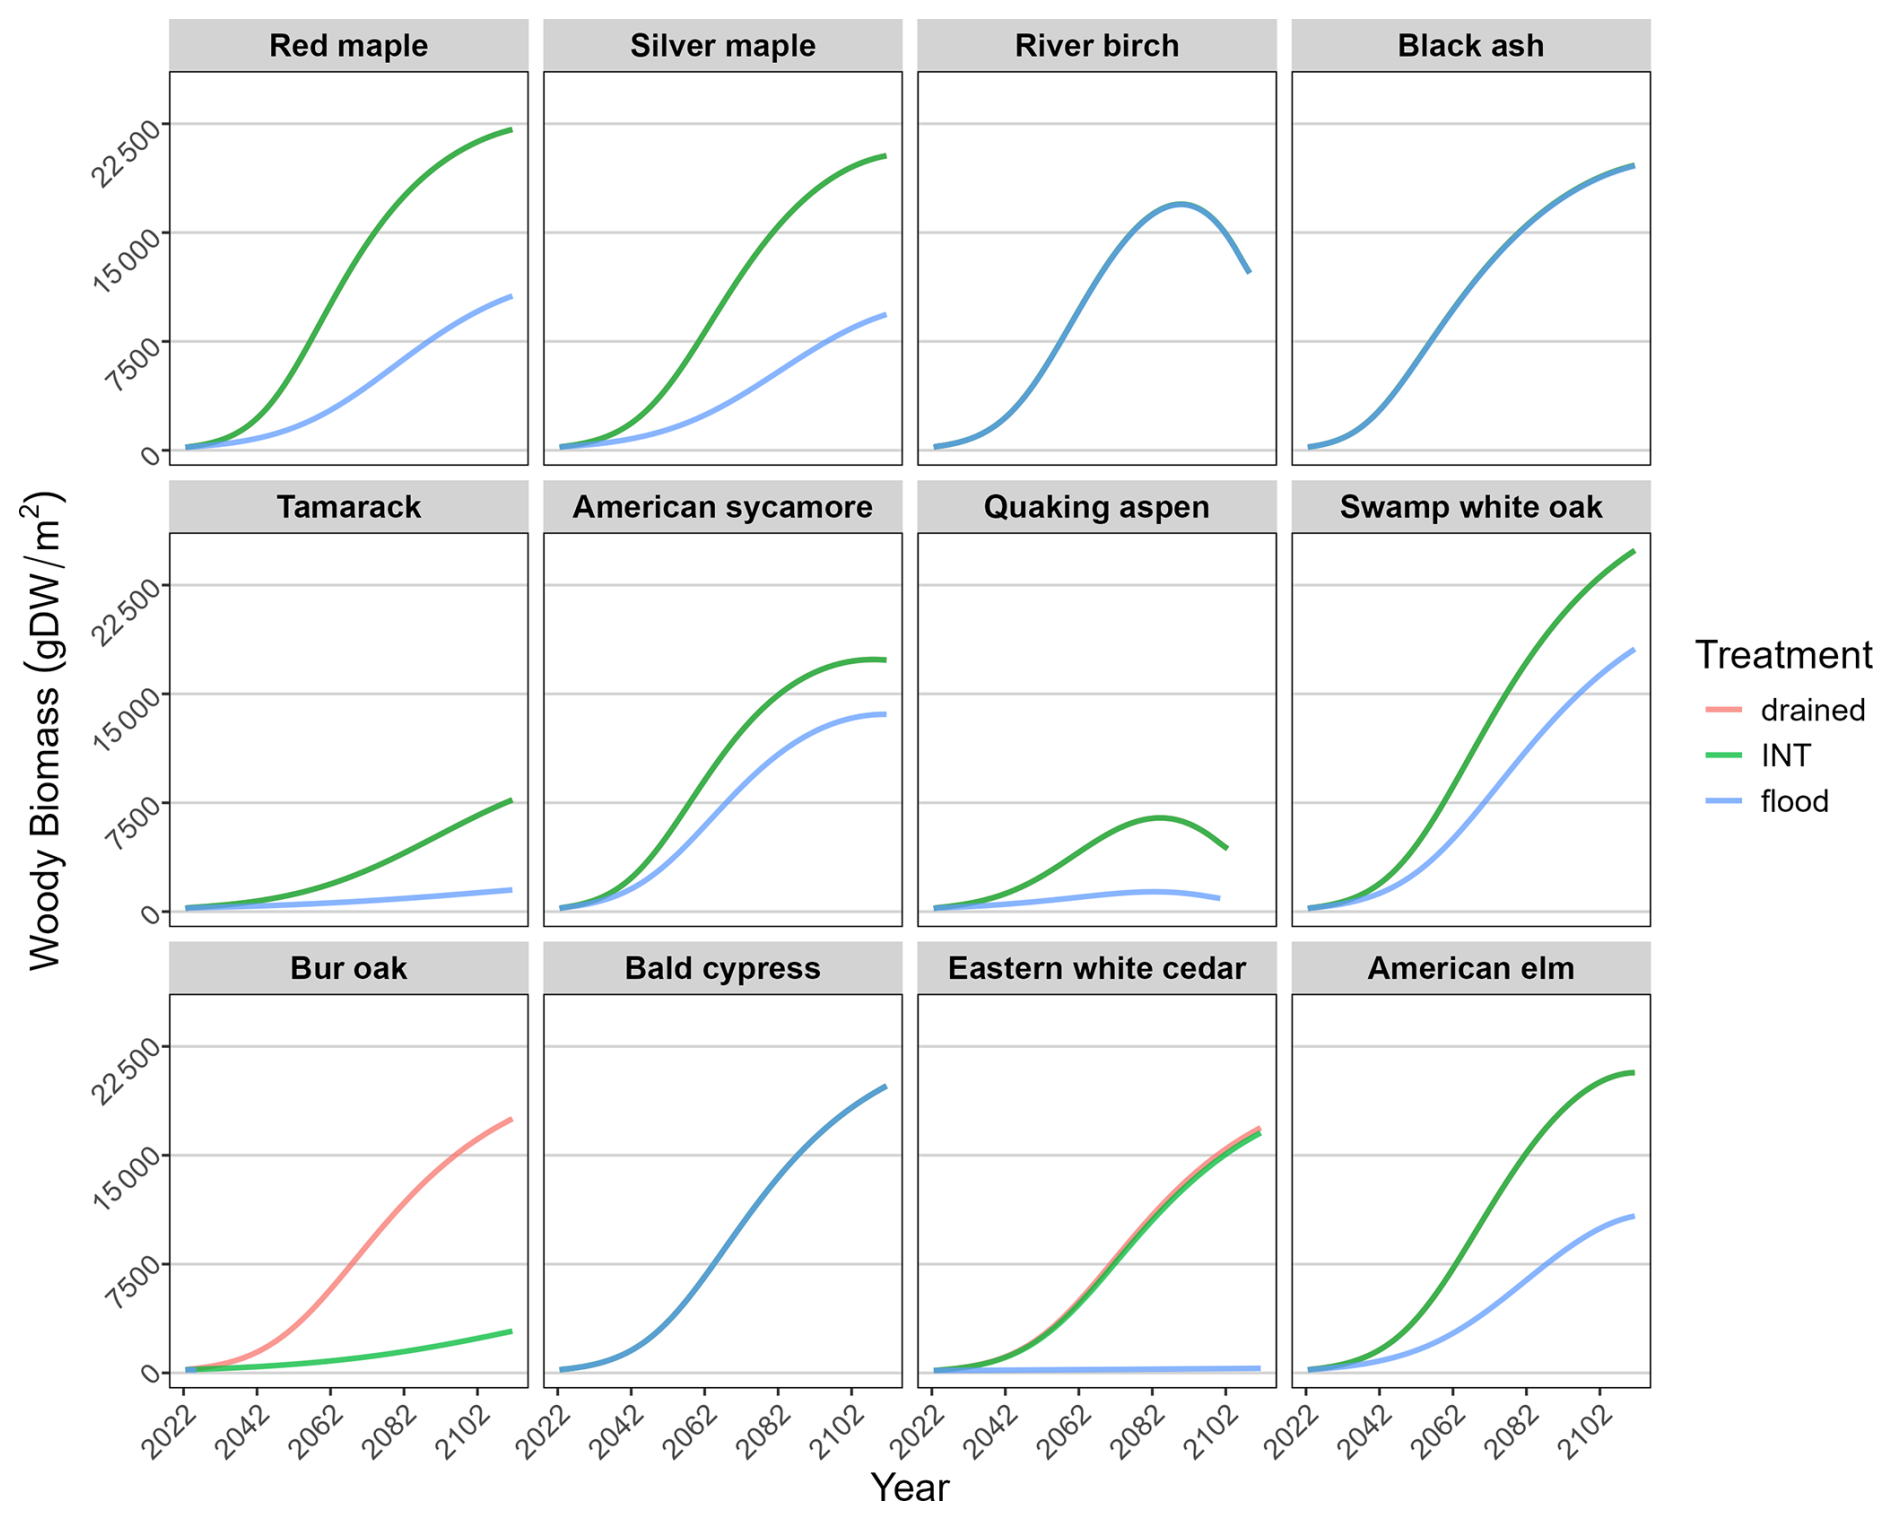
Figure 7A 90-year extension of the simulation showing simulated biomass accumulation through time for each species (beginning at age 1) under three water-level treatments. In most cases, the “INT” line obscures the “drained” line, and in some cases, it obscures both other lines.
In the virtual experiment testing competition outcomes between two species (Fig. 8), we expected more-waterlogging-tolerant species to be less productive than less-waterlogging-tolerant species because such species generally have less drought tolerance, suggesting more susceptibility to dry soil. While more-waterlogging-tolerant species did much better under the flooding treatment (as expected), they also tended to do well under the drained treatment. This is because the drained treatment did not produce dry soil but produced a very moist soil kept constantly near field capacity by the precipitation inputs (Fig. 4). No species combination tested resulted in the death of a species in the first 10 years, although bald cypress severely suppressed northern white cedar under flooded conditions. We note that even though American elm is slightly more waterlogging tolerant than red maple, red maple was more productive than American elm except perhaps under flooded conditions, likely because red maple is slightly more shade tolerant than American elm.
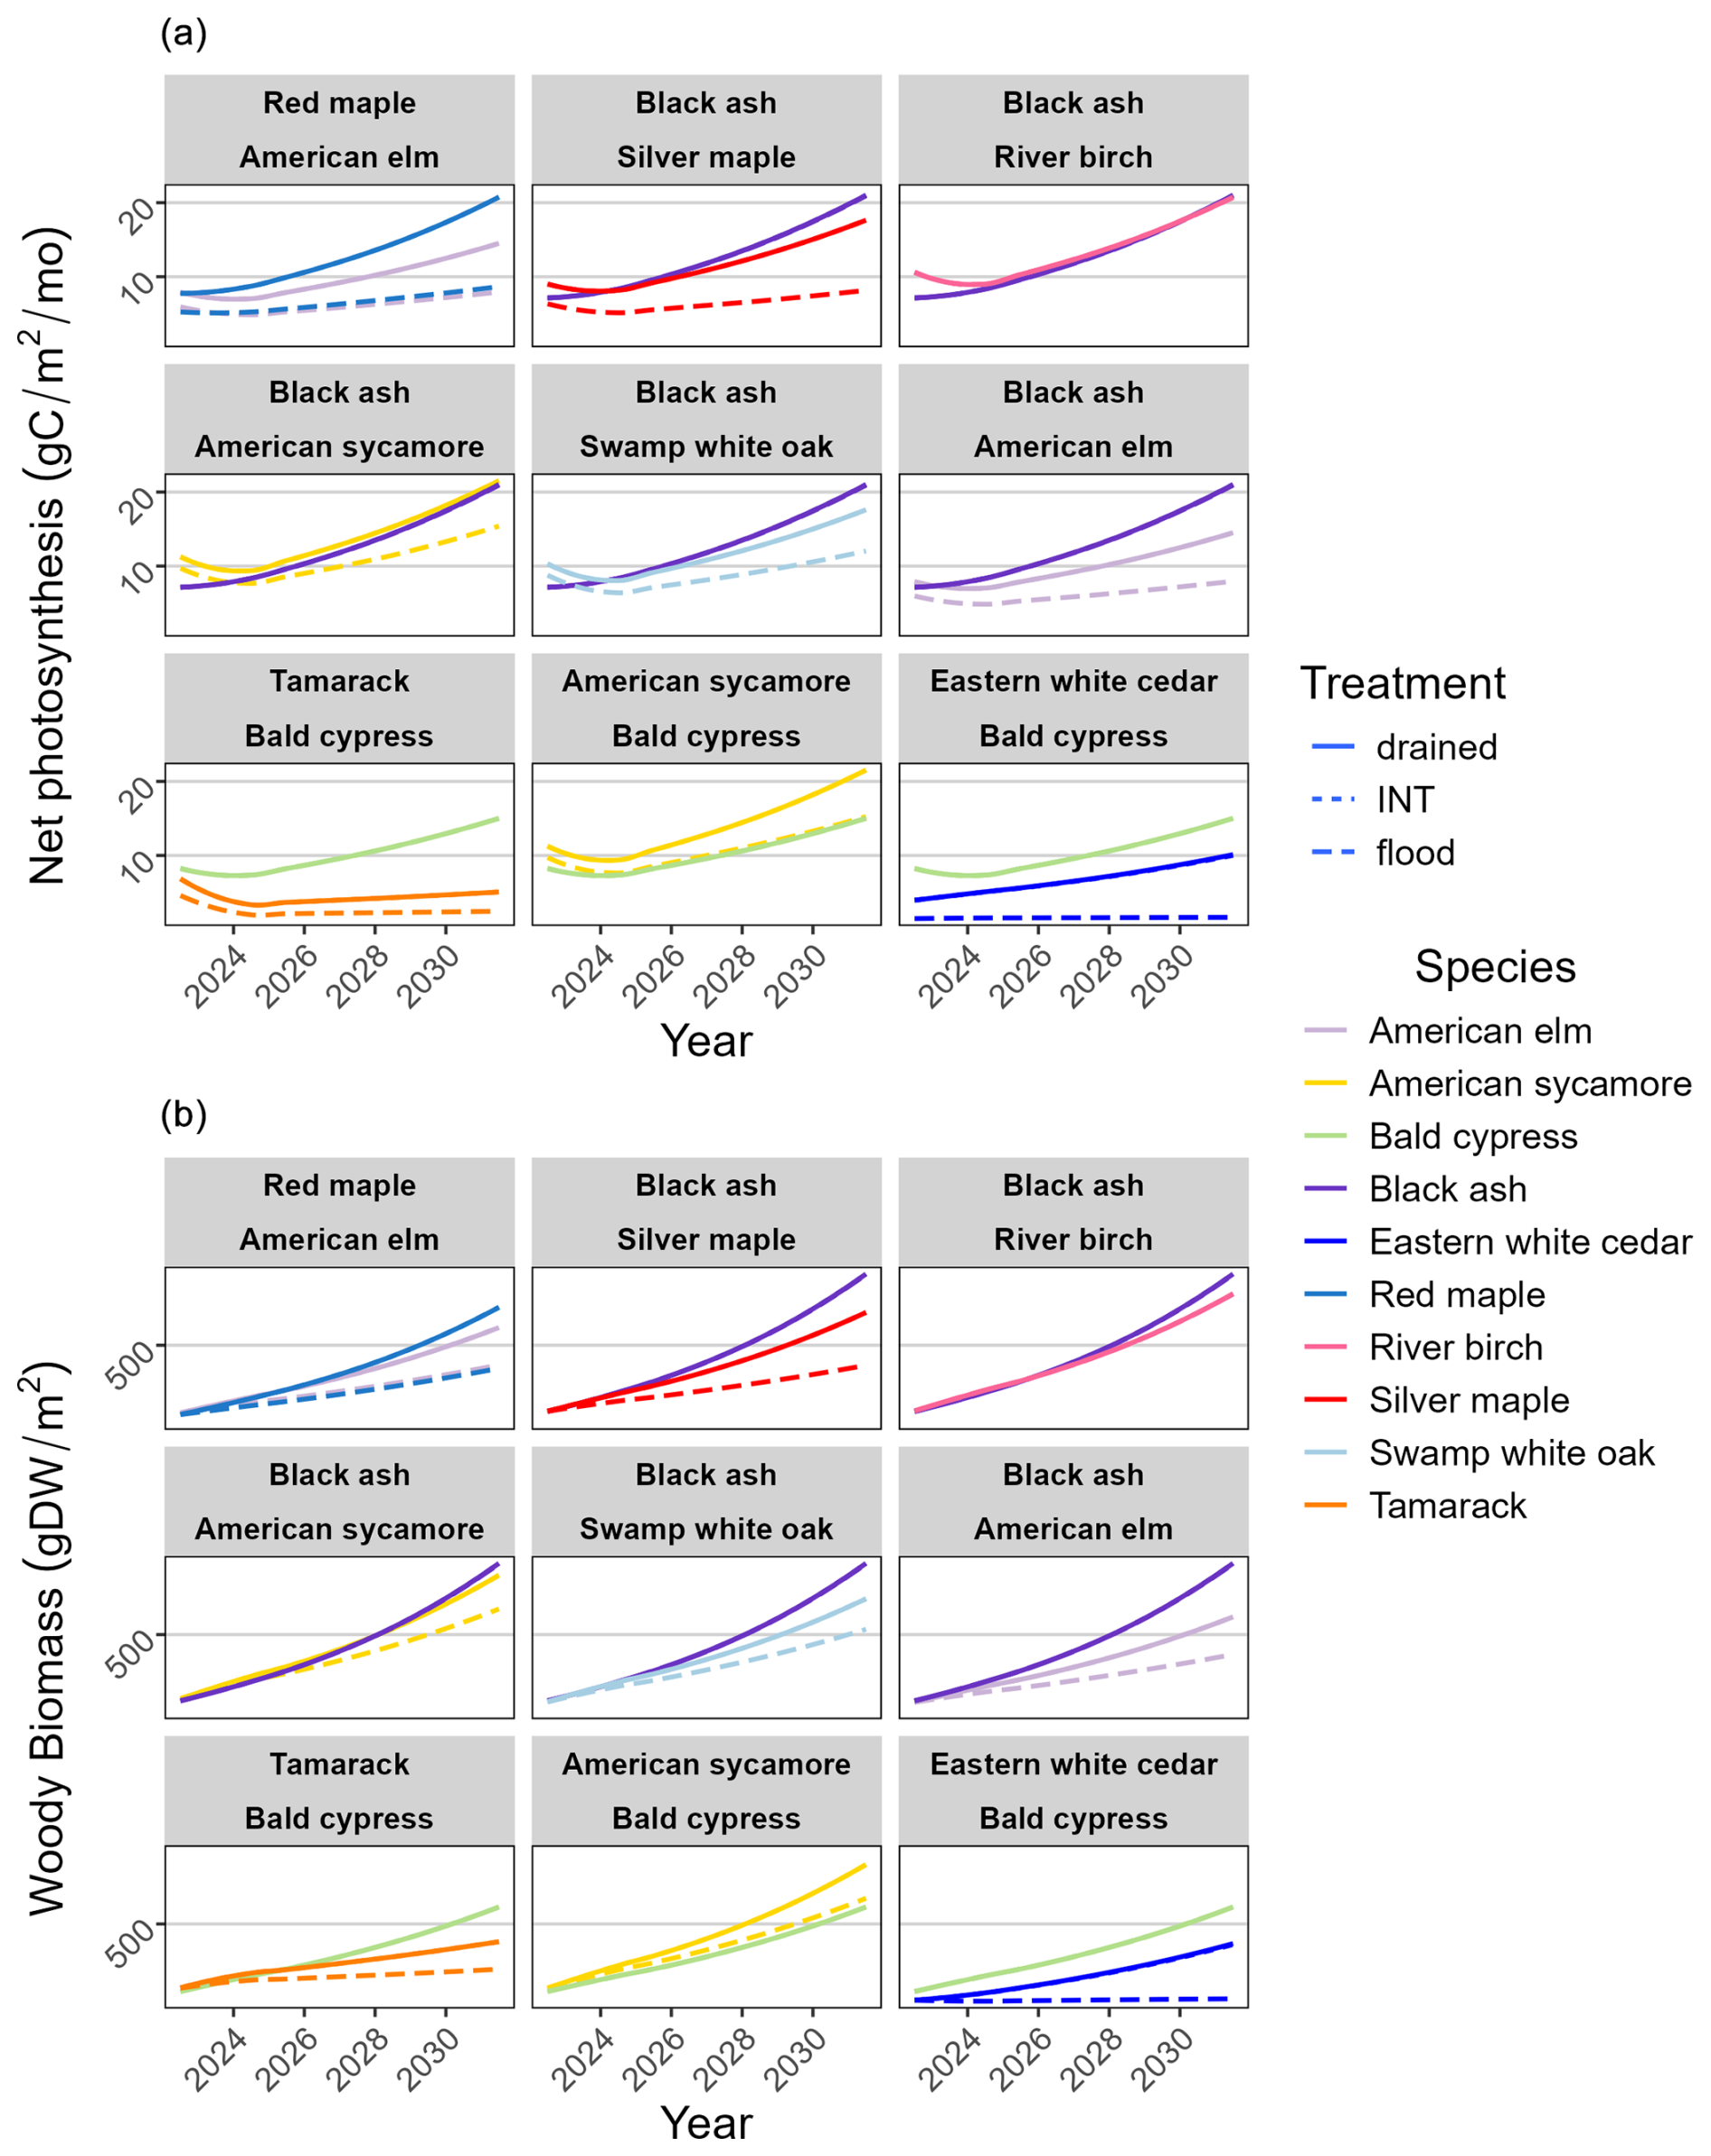
Figure 8Simulated 10-year trajectories of (a) net photosynthesis and (b) woody biomass when two cohorts are established in the same cell (planter pot). Cohorts are represented by color, and often the treatment lines overlap, consistent with empirical observations.
3.4 Landscape case study
When the updated waterlogging parameters were applied at landscape scale under climate change and AM, the landscape mean biomass density (g m−2) of native species generally declined, and the AM species increased as climate gradually changed and planted cohorts of the most-waterlogging-tolerant species thrived (Fig. 9). American elm and bald cypress thrived under the RCP6.0 climate, while river birch and the other MediumRange AM species merely established a presence. However, under the RCP8.5 climate, American elm, bald cypress, and river birch thrived, while the other LongRange AM species barely survived (Fig. 9).
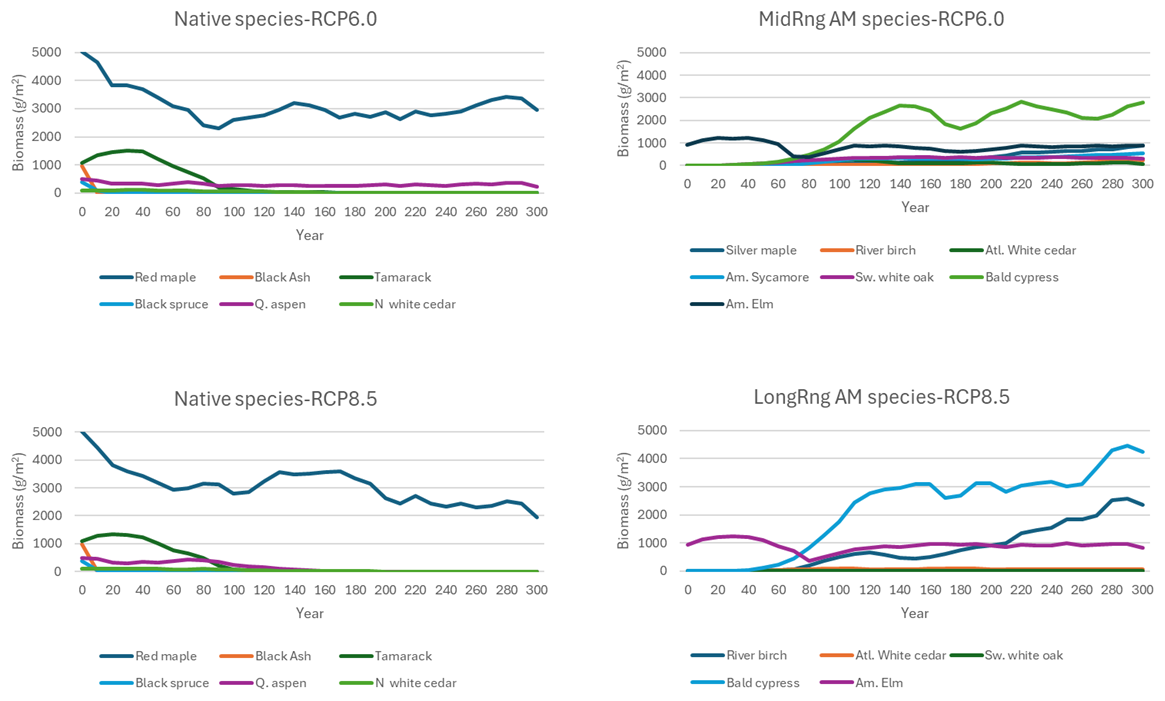
Figure 9Mean woody biomass (across active landscape cells and replicates) of lowland tree species under the AM–climate change scenarios on the case study landscape.
The revised waterlogging tolerance parameters (Table 1) resulted in some differences in the area of the landscape dominated by waterlogging-tolerant species, especially under severe climate change (Fig. 10). The most obvious effect of the (usually only slightly) revised waterlogging tolerance parameters was that a decline in abundance of waterlogging-tolerant species tended to mirror an increase in abundance of drought-intolerant species, which tend to have only slightly less waterlogging tolerance than hydrophilic species. Thus, the ability to thrive under waterlogging appears to be a step function with a very abrupt threshold (i.e., a very small difference in waterlogging tolerance may be the difference between living and dying). Lowland types (waterlogging-tolerant species) were able to persist under all AM–climate change scenarios and to a limited extent were able to colonize (and ephemerally dominate) upland sites (not shown). The long-range waterlogging-tolerant AM species thrived under both climates (especially severe climate change) and became more abundant than the medium-range waterlogging-tolerant species under both climates. The productivity of many species was overestimated with the prior waterlogging parameters, and some were grossly underestimated (Table 3).
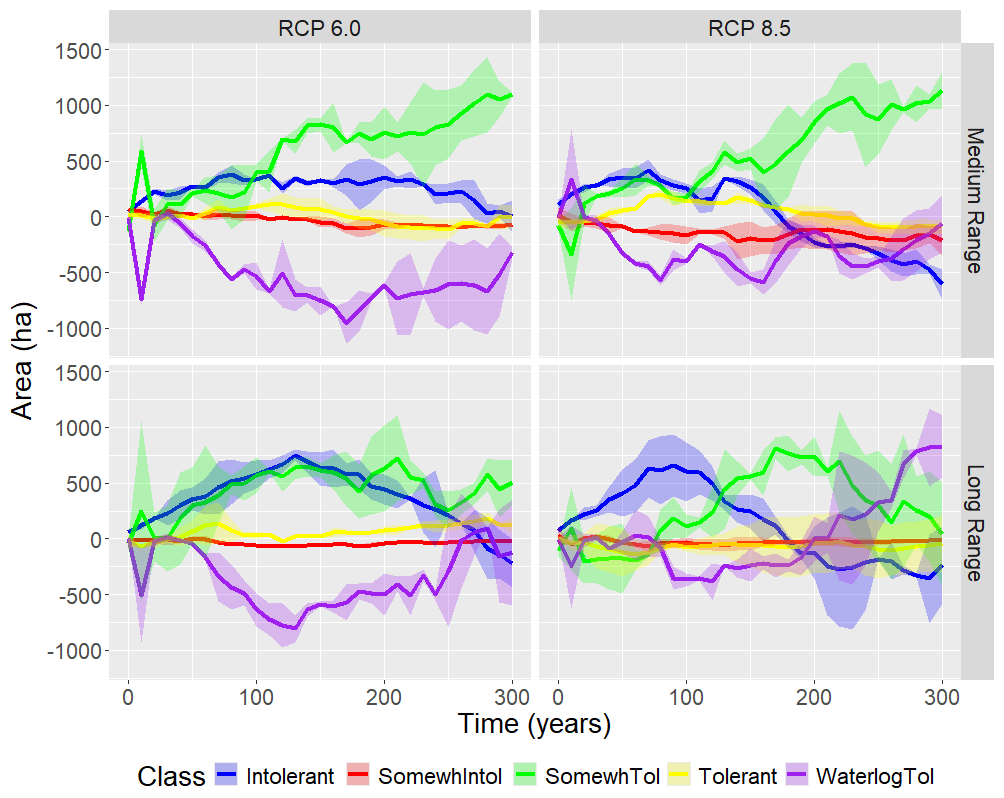
Figure 10Difference (revised minus (−) prior) through time in landscape area dominated by species in each (of four) drought tolerance class and (one) waterlogging tolerance class caused by differences in waterlogging tolerance parameters (Table 1) by climate scenario and AM strategy. The waterlogging tolerance class contains all species having at least some waterlogging tolerance (H2 < 3.37). Ribbons show 1 SD of two replicates.
Table 3Mean (active landscape cells, two replicates) biomass density at year 300 of the landscape case study of cohorts of selected species under selected AM and climate scenarios, comparing landscape outcomes when prior or revised waterlogging parameters were used.
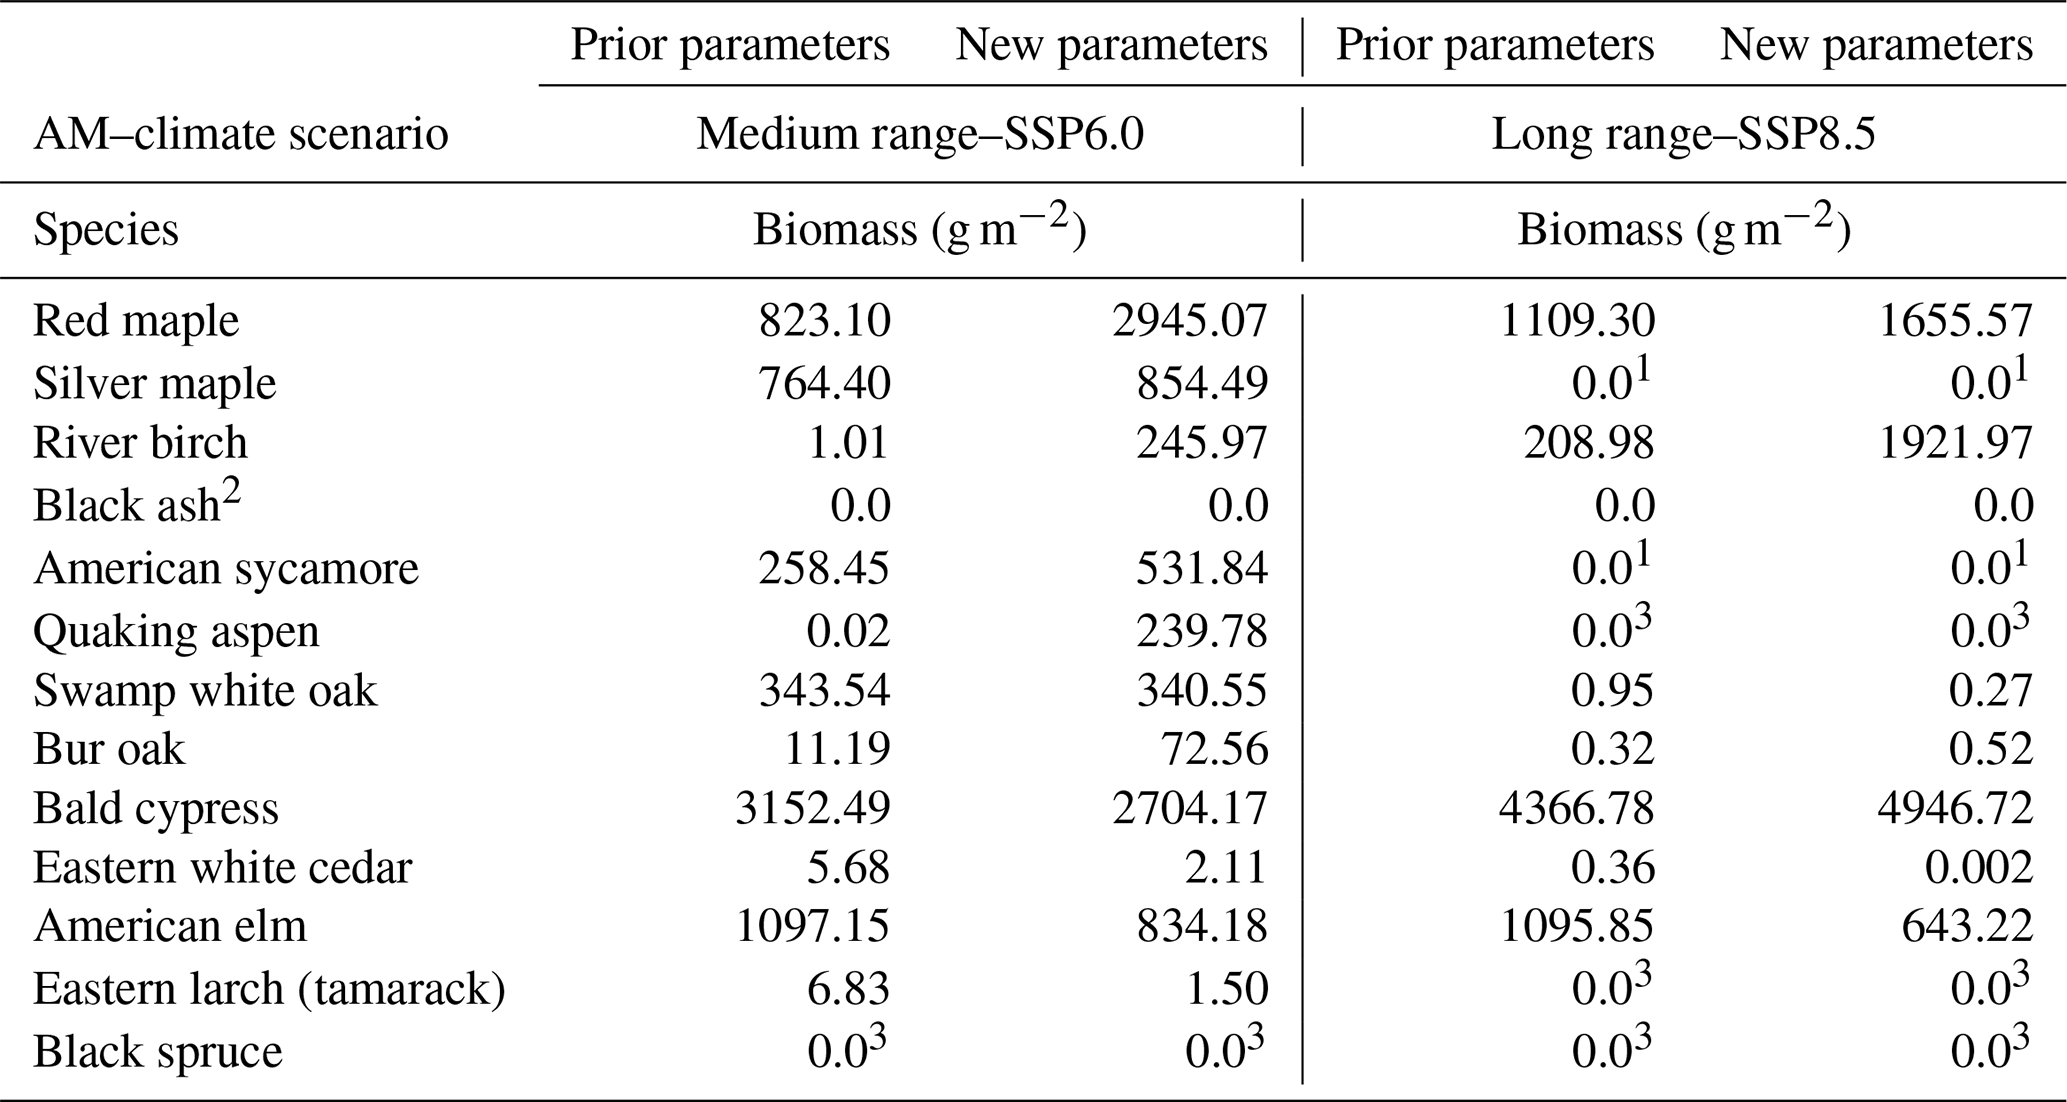
1 Not planted in this AM scenario. 2 Species extirpated by EAB in all scenarios. 3 Species unable to survive in this climate scenario.
Using empirical experiments, we were able to estimate the waterlogging tolerance parameters needed by the PnET-Succession forest landscape model for specific tree species being considered as replacements for species that are threatened by exotic pests and/or climate change in the upper Great Lakes region (Keller et al., 2024). These revised parameter values represented both absolute and relative waterlogging tolerance rather than just the relative tolerance given by other sources (e.g., Niinemets and Valladares, 2006; Kattge et al., 2020) and as used in other studies (e.g., Gustafson et al., 2023a). They allow for greater photosynthetic productivity to occur in model simulations for trees growing in lowland sites according to their waterlogging tolerance. Three species (river birch, black ash, bald cypress) tested were as productive in flooded conditions as in well-drained (field capacity) conditions (Fig. 5). The landscape model projected that many potential lowland forest replacement species can be expected to physiologically thrive under both future climates tested (Fig. 9), although we did not simulate every possible future disturbance or pest scenario. Pests can have considerable impacts on forest successional dynamics and carbon cycling (Flower and Gonzalez-Meler, 2015). Such model capabilities enable more robust evaluation of proposed lowland forest management strategies to mitigate forest stressors such as climate change and invasive pests, and model results can help forest managers to select which species should be tested first, given the unique site characteristics on their landscape.
A major impetus for our work is the impending loss of extant black ash stands to EAB in upper Great Lakes lowland forests. It is feared that the abrupt and catastrophic elimination of all pole- and larger-sized ash trees from such stands will cause chronically high water levels that will greatly reduce the regeneration potential and shift ecosystems towards open meadows (Flower and Gonzalez-Meler, 2015; Diamond et al., 2018; Kolka et al., 2018). While our results produce some indication that other species might be able to replace the water-transpiration function that black ash currently provides, there remain many uncertainties that must be resolved with tree- and stand-level empirical studies. For example, the model makes many simplifying assumptions about the establishment of cohorts via planting, and many of these have not yet been verified under lowland conditions at the stand scale. Furthermore, planting of new species before vs. after the mortality of black ash probably requires very different silviculture methods and likely will have very different outcomes. The development of methods for establishing new lowland tree species is a very new and difficult line of research because water levels can rapidly and unpredictably fluctuate. However, the results presented in this study show that a variety of different species have the ability to exist in poorly drained lowland forests under future climate conditions. Forest managers might consider including these species in future enrichment plantings to diversify lowland forests and create greater resilience to future pests and hydrologic changes. Our simulation results should not be viewed as definitive but at best, hopeful. That is, if the challenges surrounding regeneration and establishment (of productive lowland cohorts) can be addressed, the long-term prospects are promising.
Our case study simulations were conducted using the same model on a subset of the landscape studied by Gustafson et al. (2023a), allowing landscape-scale results obtained using their (prior) waterlogging parameter values to be compared to ours. Although we simulated one species (American sycamore) not simulated by Gustafson et al. (2023a), we found that lowland forest types were generally able to persist under either AM strategy (Fig. 10). Because the simulation of lowland forests has historically been a weakness of forest landscape models, there are few other studies that are directly comparable.
Our study illustrates the power of LANDIS-II, specifically PnET-Succession, as a scaling tool. PnET-Succession uses mechanistic algorithms based on physiological first principles to simulate cohort growth (photosynthesis), competition for limited resources, and response to stressors, making it robust to novel drivers (including climate and CO2), novel species assemblages, and novel management strategies. We were easily able to use the model to extrapolate the 1-year field experiment to 90 years and scale up the experiment from planting pots to a real landscape under different climate futures. Our landscape case study provides evidence that AM of lowland forest species may indeed be capable of conserving lowland forest function and services.
While data, scientific studies, and management within lowland hardwood forests are increasingly prevalent, the vast majority of such work has been done within the last 10 years. Black ash forest communities have typically been long-lived and are varied in age structure, so 10 years represents a very small window of data about stand development and stand dynamics (Erdmann, 1987). Additionally, climate change and the likely expansion of EAB into extensive black ash forest ecosystems will create novel conditions that have yet to be studied; EAB is a top concern among managers in Minnesota (Windmuller-Campione et al., 2020). It will be extremely important to monitor the expanding mortality from EAB to quantify how EAB impacts ash-dominated systems compared to ash in mixed hardwood systems across the eastern USA because ash-dominated stands are most likely to convert to wet meadows, and the overall hydrologic changes will be much greater than in mixed ash stands. Additionally, modelers and managers could partner around an adaptive management framework that uses model projections of proposed management strategies to either promote resilience to EAB impacts or actively restore stands after EAB impacts.
Our study allowed us to draw several conclusions. (1) Empirical studies can generate critical observational data that can be used to robustly estimate waterlogging tolerance parameters for simulation models, which improves their projections. Our results suggest that a very small difference in waterlogging tolerance parameters may determine whether a species lives or dies in simulated scenarios, underscoring the importance of our study. (2) Mechanistic forest landscape simulation models can be used to scale up such empirical studies to longer temporal scales and broader spatial scales. (3) AM may be an effective step toward maintaining the function of wetland hardwoods in the face of EAB. (4) The wetland AM species parameterized and tested demonstrated substantial survival and biomass accumulation in the virtual landscape experiment. (5) Landscape models thus parameterized provide a powerful tool to conduct simulation experiments involving highly novel situations such as climate change, invasive (or intentionally migrated) tree species, invasive pests, pioneering management strategies, or all of these combined.
Table A1Soil texture parameters (Saxton and Rawls, 2006) used in the simulations. PTNG represents the potting soil used in the empirical experiment, and MUCK is an ad hoc lowland soil type used in the landscape case study.
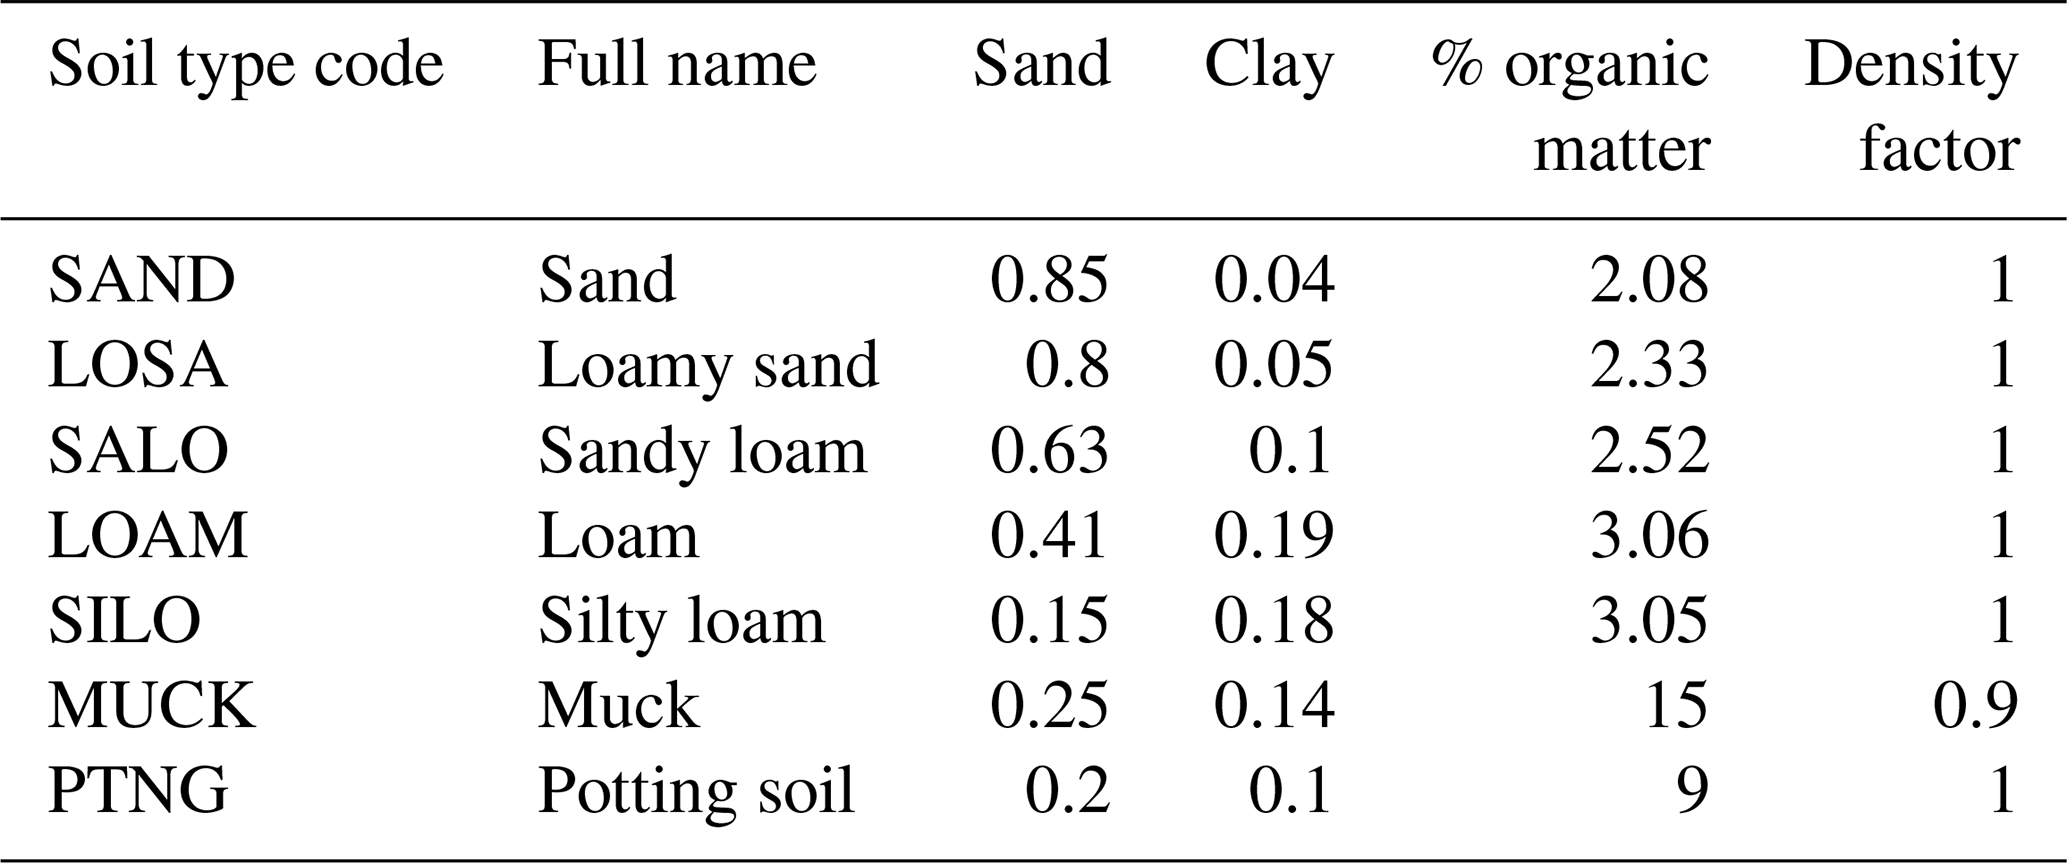
Table A2Mean monthly weather parameter values used. Each year was the same to avoid confounding annual weather variation with treatment effects.
The LANDIS-II code is freely available from https://www.landis-ii.org, last access: 20 May 2025 (Scheller et al., 2007).
Data are available from the authors upon request.
EJG: conceptualization, methodology, software, and writing (original draft). DRB: conceptualization, methodology, and writing (review and editing). MAWC: methodology and writing (review and editing). RAS: methodology and writing (review and editing). DMD: funding acquisition and writing (review and editing).
The contact author has declared that none of the authors has any competing interests.
Publisher’s note: Copernicus Publications remains neutral with regard to jurisdictional claims made in the text, published maps, institutional affiliations, or any other geographical representation in this paper. While Copernicus Publications makes every effort to include appropriate place names, the final responsibility lies with the authors.
We thank Jessica Fowler and Jeffrey Suvada for technical assistance in graphical data presentation. We thank Cornelia Wilson, Charlie Flower, and two anonymous reviewers for critical review of earlier versions of the manuscript. Funding was provided by the Northern Research Station.
This paper was edited by Paul Stoy and reviewed by two anonymous referees.
Aber, J. D., Ollinger, S. V., Federer, C. A., Reich, P. B., Goulden, M. L., Kicklighter, D. W., Melillo, J. M., and Lathrop Jr., R. G.: Predicting the effects of climate change on water yield and forest production in the northeastern United States, Clim. Res., 5, 207–222, 1995.
Anulewicz, A. C., Mccullough, D. G., Cappaert, D. L., and Poland, T. M.: Host range of the emerald ash borer (Agrilus planipennis Fairmaire) (Coleoptera: Buprestidae) in North America: results of multiple-choice field experiments, Environ. Ent., 37, 230–241, 2014.
Benedict, M. A. and Frelich, L. E.: Site factors affecting black ash ring growth in northern Minnesota, Forest Ecol. Manag., 255, 3489–3493, 2008.
Cappaert, D., McCullough, D. G., Poland, T. M., and Siegert, N. W.: Emerald ash borer in North America: a research and regulatory challenge, Am. Entomol., 51, 152–165, 2005.
Constanza, K. K., Livingston, W. H., Kashian, D. M., Slesak, R. A., Tardif, J. C., Dech, J. P., Diamond, A. K., Daigle, J. J., Ranco, D. J., Neptune, J. S., and Benedict, L.: The precarious state of a cultural keystone species: tribal and biological assessments of the role and future of black ash, J. Forest, 115, 435–446, 2017.
Diamond, J. S., McLaughlin, D. L., Slesak, R. A., D'Amato, A. W., and Palik, B. J.: Forested versus herbaceous wetlands: Can management mitigate ecohydrologic regime shifts from invasive emerald ash borer?, J. Environ. Manag., 222, 436–446, 2018.
Erdmann, G. G.: Managing black ash in the Lake States, US Department of Agriculture, Forest Service, North Central Forest Experiment Station, Vol. 115, https://doi.org/10.2737/NC-GTR-115, 1987.
Flower, C. E. and Gonzalez-Meler, M. A.: Responses of temperate forest productivity to insect and pathogen disturbances, Ann. Rev. Plant Biol., 66, 547–569, 2015.
Flower, C. E., Knight, K. S., and Gonzalez-Meler, M. A.: Impacts of the emerald ash borer (Agrilus planipennis Fairmaire) induced ash (Fraxinus spp.) mortality on forest carbon cycling and successional dynamics in the eastern United States, Biol. Invasions, 15, 931–944, https://doi.org/10.1007/s10530-012-0341-7, 2013.
Flower, C. E., Lynch, D. J., Knight, K. S., and Gonzalez-Meler, M. A.: Biotic and abiotic drivers of sap flux in mature green ash trees (Fraxinus pennsylvanica) experiencing varying levels of emerald ash borer (Agrilus planipennis) infestation, Forests, 9, 301, https://doi.org/10.3390/f9060301, 2018.
Fraver, S., D'Amato, A. W., Reinikainen, M., Gill, K. G., and Palik, B. J.: Stand dynamics and structure of old-growth Fraxinus nigra stands in northern Minnesota, USA, Can. J. Forest Res. 52, 910–919, 2022.
Grinde, A. R., Youngquist, M. B., Slesak, R. A., Kolbe, S. R., Bednar, J. D., Palik, B. J., and D'Amato, A. W.: Potential impacts of emerald ash borer and adaptation strategies on wildlife communities in black ash wetlands, Ecol. Appl., 32, e2567, https://doi.org/10.1002/eap.2567, 2022.
Gustafson, E. J.: When relationships estimated in the past cannot be used to predict the future: using mechanistic models to predict landscape ecological dynamics in a changing world, Landsc. Ecol., 28, 1429–1437, https://doi.org/10.1007/s10980-013-9927-4, 2013.
Gustafson, E. J., Miranda B. R., Shvidenko A. Z., and Sturtevant, B. R.: Simulating growth and competition on wet and waterlogged soils in a forest landscape model, Front. Ecol. Evol., 8, 598775, https://doi.org/10.3389/fevo.2020.598775, 2020.
Gustafson, E. J., Kern C. C., and Kabrick, J. M.: Can assisted tree migration today sustain forest ecosystem goods and services for the future?, Forest Ecol. Manag., 529, 120723, https://doi.org/10.1016/j.foreco.2022.120723, 2023a.
Gustafson, E. J., Sturtevant, B. R., Miranda, B, R., and Zhou, Z.: PnET-Succession v 5.1: Comprehensive description of an ecophysiological succession extension within the LANDIS-II forest landscape model, Published on the Internet by the LANDIS-II Foundation, https://github.com/LANDIS-II-Foundation/Foundation-Publications/blob/main/Description of PnET-Succession v5.1.pdf (last access: 20 May 2025), 2023b.
Gustafson, E. J., Lucash, M., Shvidenko, A. Z., Sturtevant, B. R., Miranda, B. R., Schepaschenko, D., and Matsumoto, H.: How do climate change and disturbance interact to alter landscape reflectivity (albedo) across a large latitudinal gradient in Siberia?, Sci. Total Environ., 956, 177043, https://doi.org/10.1016/j.scitotenv.2024.177043, 2024.
Kattge, J., Boenisch, G., Diaz, S., et al.: TRY plant trait database – enhanced coverage and open access, Glob. Change Biol., 26, 119–188, https://doi.org/10.1111/gcb.14904, 2020.
Keller, G. J., Slesak, R. A., Bronson, D., Windmuller-Campione, M. A., and McGraw, A.: Effects of flood duration on seedling survival and growth of potential replacement species in black ash (Fraxinus nigra Marshall) forests threatened by emerald ash borer, Trees, Forest. People, 11, 100367, https://doi.org/10.1016/j.tfp.2022.100367, 2023.
Keller, G. J., Bronson, D., Slesak, R. A., and Windmuller-Campione, M. A.: Effects of flooding and shade on survival, growth, and leaf gas exchange of bottomland tree species across the Great Lakes Region (USA), Forests, 15, 530, https://doi.org/10.3390/f15030530, 2024.
Kolka, R. K., D'Amato, A. W., Wagenbrenner, J. W., Slesak, R. A., Pypker, T. G., Youngquist, M. B., Grinde, A. R., and Palik, B. J.: Review of ecosystem level impacts of emerald ash borer on black ash wetlands: what does the future hold?, Forests, 9, 179, https://doi.org/10.3390/f9040179, 2018.
Liang, L. and Fei, S.: Divergence of the potential invasion range of emerald ash borer and its host distribution in North America under climate change, Climatic Change, 122, 735–746, 2014.
Looney, C. E., D'Amato, A. W., Palik, B. J., Slesak, R. A., and Slater, M. A.: The response of Fraxinus nigra forest ground-layer vegetation to emulated emerald ash borer mortality and management strategies in northern Minnesota, USA, Forest Ecol. Manag., 389, 352–363, 2017.
Mladenoff, D. J.: LANDIS and forest landscape models, Ecol. Model., 18, 7–19, 2004.
Niinemets, Ü. and Valladares F.: Tolerance to shade, drought, and waterlogging of temperate Northern Hemisphere trees and shrubs, Ecol. Monogr., 76, 521–547, 2006.
Palik, B. J., D'Amato, A. W., Slesak, R. A., Kastendick, D., Looney, C., and Kragthorpe, J.: Eighth-year survival and growth of planted replacement tree species in black ash (Fraxinus nigra) wetlands threatened by emerald ash borer in Minnesota, USA, Forest Ecol. Manag., 484, 118958, https://doi.org/10.1016/j.foreco.2021.118958, 2021.
Poland, T. M. and McCullough, D. G.: Emerald ash borer: invasion of the urban forest and the threat to North America's ash resource, J. Forest, 104, 118–124, 2006.
Prasad, A., Pedlar, J., Peters, M., Matthews, S., Iverson, L., McKenney, D., and Adams, B.: Understanding climate change dynamics of tree species: Implications for future forests, in: Future Forests, edited by: McNulty, S. G, Elsevier, 151–175, https://doi.org/10.1016/B978-0-323-90430-8.00002-2, 2024.
Saxton, K. E. and Rawls, W. J.: Soil water characteristics estimates by texture and organic matter for hydrologic solutions, Soil Sci. Soc. Am. J., 70, 1569–1578, 2006.
Scheller, R. M., Domingo, J. B., Sturtevant, B. R., Williams, J. S., Rudy, A., Gustafson, E. J., and Mladenoff, D. J.: Design, development, and application of LANDIS-II, a spatial landscape simulation model with flexible temporal and spatial resolution, Ecol. Model., 201, 409–419, 2007.
Slesak, R. A., Lenhart, C. F., Brooks, K. N., D'Amato, A. W., and Palik, B. J.: Water table response to harvesting and simulated emerald ash borer mortality in black ash wetlands in Minnesota, USA, Can. J. Forest Res., 44, 961–968, 2014.
Sturtevant, B. R., Gustafson, E. J., Li, W., and He, H. S.: Modeling biological disturbances in LANDIS: A module description and demonstration using spruce budworm, Ecol. Model., 180, 153–174, 2004.
Sulman, B. N., Desai, A. R., and Mladenoff, D. J.: Modeling soil and biomass carbon responses to declining water table in a wetland-rich landscape, Ecosystems, 16, 491–507, https://doi.org/10.1007/s10021-012-9624-1, 2013.
Telander, A. C, Slesak, R. A., D'Amato, A. W., Palik, B. J., Brooks, K. N., and Lenhart, C. F.: Sap flow of black ash in wetland forests of northern Minnesota, USA: Hydrologic implications of tree mortality due to emerald ash borer, Agr. Forest Meteorol., 206, 4–11, 2015.
Youngquist, M. B., Eggert, S. L., D'Amato, A. W., Palik, B. J., and Slesak, R. A.: Potential effects of foundation species loss on wetland communities: a case study of black ash wetlands threatened by emerald ash borer, Wetlands, 37, 787–799, 2017.
Windmuller-Campione, M. A., Russell, M. B., Sagor, E., D'Amato, A. W., Ek, A. R., Puettmann, K. J., and Rodman, M. G.: The decline of the clearcut: 26 years of change in silvicultural practices and implications in Minnesota, J. Forest, 118, 244–259, 2020.
Windmuller-Campione, M. A., Russell, M. B., Slesak, R. A., and Lochner, M.: Regeneration responses in black ash (Fraxinus nigra) wetlands: implications for forest diversification to address emerald ash borer (Agrilus planipennis), New Forests, 52, 537–558, 2021.