the Creative Commons Attribution 4.0 License.
the Creative Commons Attribution 4.0 License.
 | 06 Jun 2025
Variable organic matter stoichiometry enhances the biological drawdown of CO2 in the northwest European shelf seas
Kubilay Timur Demir
Moritz Mathis
Jan Kossack
Feifei Liu
Ute Daewel
Christoph Stegert
Helmuth Thomas
Corinna Schrum
Variations in the elemental ratios of carbon, nitrogen, and phosphorus in marine organic matter (OM) and their influence on the marine carbon cycle remain poorly understood for both the open and coastal oceans. Observations consistently show an enrichment of carbon and a depletion of phosphorus relative to elemental Redfield ratios. However, many biogeochemical models are constrained to Redfield stoichiometry, neglecting the effects of variable stoichiometry on carbon cycling and typically underestimating biological carbon fixation. This impedes the accurate representation of OM cycling and the resulting carbon fluxes, especially in productive temperate shelf seas such as the northwest European shelf seas (NWES). Here, the efficiency of oceanic CO2 uptake strongly depends on the biological uptake of inorganic carbon and its export to the North Atlantic, both of which are influenced by OM stoichiometry. In this study, we provide a first comprehensive and quantitative assessment of the effects of variable OM stoichiometry on carbon cycling in the NWES. For this purpose, we integrate two pathways for variable OM stoichiometry, motivated by observational and experimental results, into the regional high-resolution coupled 3D physical–biogeochemical modeling system SCHISM-ECOSMO-CO2 (Semi-implicit Cross-scale Hydroscience Integrated System Model – ECOSystem MOdel): first, the release of carbon-enriched dissolved OM under nutrient limitation and, second, the preferential remineralization of organic nitrogen and phosphorus. With these extensions we reproduce the observed OM stoichiometry and evaluate its impact on marine carbon cycling, with a focus on OM cycling and the resulting air–sea CO2 exchange. Compared to the reference simulation with fixed Redfield stoichiometry, the variable stoichiometry configurations show an increase in the annual net CO2 uptake of 10 %–33 % in the North Sea and 9 %–31 % in the entire NWES, depending on the relative contribution of the two new implementations. As the main driver of the additional CO2 uptake, we identify a corresponding intensification of annual and seasonal OM cycling, resulting in higher net autotrophy in surface waters and higher net heterotrophy in sub-surface layers. This enhanced gradient in net community production leads to an increased biological drawdown of inorganic carbon, most pronounced in the Norwegian Trench. By increasing the biological control on the surface partial pressure of CO2, this leads to higher summer and lower winter uptake. Our results highlight the importance of variable stoichiometry for an accurate representation of the shelf carbon pump mechanism in the NWES, as it significantly influences the efficiency of carbon sequestration. Since the response depends largely on regional physical conditions and pre-existing carbon export mechanisms, regional assessments are essential to understand the sensitivity of the carbon cycle to OM stoichiometry, which should be included in global models to accurately represent the coastal carbon cycle.
- Article
(13917 KB) - Full-text XML
-
Supplement
(6310 KB) - BibTeX
- EndNote


Marine organic matter (OM) is a major global reservoir of reduced carbon (Friedlingstein et al., 2023; Hansell et al., 2009) and plays a key role in sequestering atmospheric CO2 in the ocean (Carlson and Hansell, 2015; Falkowski et al., 1998; Hansell et al., 2009). The balance between OM production and decomposition controls the transformation and transports of both organic and inorganic carbon (del Giorgio and Duarte, 2002; Smith and Hollibaugh, 1993), especially in the shallow and highly productive temperate shelf seas (Barrón and Duarte, 2015; Bauer et al., 2013; Canuel et al., 2012; Dai et al., 2022; Gattuso et al., 1998). Through its chemical composition, OM further regulates the coupling between the elemental cycles of carbon, nitrogen, and phosphorus, with implications for the relative magnitudes of elemental fluxes, nutrient availability, and OM production (Hopkinson and Vallino, 2005). In this way, variations in OM composition may affect the biological carbon drawdown and thereby the air–sea CO2 exchange through both changes in carbon fixation and variations in the composition of the OM that is available for lateral and vertical transports (Hopkinson and Vallino, 2005; Loh and Bauer, 2000; Lønborg and Álvarez-Salgado, 2012; Tanioka et al., 2021; Williams, 1995; Zakem and Levine, 2019).
Despite observational evidence for large global and regional variations in elemental ratios in dissolved (DOM) and particulate (POM) organic matter (Hopkinson and Vallino, 2005; Liang et al., 2023; Loh and Bauer, 2000; Lønborg et al., 2024; Martiny et al., 2013; Tanioka et al., 2022b), many biogeochemical models assume a constant Redfield stoichiometry of or similar, originally derived as an average ratio for the entire global ocean (Redfield, 1963). As a consequence, these models tend to underestimate carbon fixation, especially during nutrient limitation in summer, which is indicated by their deficiency in representing the seasonality of the dissolved inorganic carbon (DIC) concentration and partial pressure of CO2 (pCO2) in surface waters (Bozec et al., 2006; Kähler and Koeve, 2001; Prowe et al., 2009). Hence, variable stoichiometry in OM production and decomposition is essential for the adequate representation of biogeochemical fluxes and especially their seasonality (Anderson and Pondaven, 2003; Bozec et al., 2006). Previous experiments using Earth system models suggest that the globally observed carbon enrichment in both DOM and POM significantly enhances global carbon and nitrogen fixation, drawdown of CO2, and export production when compared to Redfield-stoichiometry-based estimates (Letscher et al., 2015; Letscher and Moore, 2015; Tanioka et al., 2021). However, the regional impact on coastal seas and its spatiotemporal variability remain uncertain due to the scarcity of measurements and the resulting missing consideration in regional studies (Aricò et al., 2021).
The global coastal ocean disproportionately contributes to the sequestration of atmospheric CO2 in relation to its areal extent through carbon transport to the deep ocean and burial in sediments (Bauer et al., 2013; Dai et al., 2022; Laruelle et al., 2014). Its role is suggested to have changed from a weak pre-industrial net source to a significant contemporary net sink of CO2 due to both rising atmospheric CO2 concentrations and enhanced productivity driven by higher terrestrial nutrient inputs (Bauer et al., 2013; Lacroix et al., 2021; Laruelle et al., 2018; Mathis et al., 2024). With a regionally significant contribution (Frankignoulle and Borges, 2001), the northwest European shelf seas (NWES) efficiently export atmospheric CO2 to the North Atlantic Ocean through the shelf carbon pump mechanism (Tsunogai et al., 1999; Thomas et al., 2004; Bozec et al., 2005; Legge et al., 2020).
In the seasonally stratified parts of the central and northern North Sea, the spatial separation of production in the surface mixed layer and respiration in the sub-surface layer lead to a seasonally occurring drawdown of CO2, resulting in a vertical gradient of DIC. Subsequently, the DIC-enriched sub-surface waters are transported across the shelf edge, leading to a net export of DIC (Thomas et al., 2004). This DIC export is further driven by riverine and Baltic Sea discharge of DIC and net heterotrophy, where the net import of organic carbon, largely from cross-shelf transports, increases net respiration and thereby adds DIC to the system (Thomas et al., 2005). With a smaller contribution, particulate organic carbon (POC) is exported by net deposition and burial in sediments, mainly in the deep regions of the Norwegian Trench, the Skagerrak, and along the shelf edge (Legge et al., 2020; Thomas et al., 2005). The sedimentation of POC is associated with high uncertainties and may play a larger role on long timescales (Legge et al., 2020; Thomas et al., 2005).
This regional carbon export mechanism in the NWES may strongly depend on the observed variations in OM stoichiometry, which makes them essential for regional model-based carbon budget estimates (Chaichana et al., 2019; Davis et al., 2019). Reproducing the observed OM stoichiometry may account for the typically underestimated carbon fixation (Humphreys et al., 2019; Prowe et al., 2009) and consequently affect the estimated net air–sea CO2 exchange, cross-shelf transport of DIC, and vertical transport of organic carbon in the NWES through changes in the biological carbon pump and the resulting drawdown of DIC.
In this work, we assess the effects of observed variations in OM stoichiometry on carbon fixation, respiration, biological drawdown of inorganic carbon, and the implications for the air–sea CO2 exchange in the NWES. This serves as a first step in identifying the regional impact on marine carbon cycling, with a focus on the continental shelf carbon pump mechanism. For this, we integrate two pathways of variable OM stoichiometry, motivated by observational and experimental results, into a regional high-resolution coupled 3D physical–biogeochemical ocean model.
Firstly, we introduce an extracellular release of carbon-enriched DOM under nutrient limitation, modified from Neumann et al. (2022). While primary production at Redfield stoichiometry dominates biological carbon fixation under nutrient-replete conditions, the extracellular release allows for additional carbon fixation beyond nutrient limitation and, with variable OM stoichiometry, depending on nutrient availability. This release of carbon-enriched DOM has been observed as an extracellular release of carbohydrates under nutrient stress by phytoplankton cells in mesocosm experiments (Børsheim et al., 2005; Fajon et al., 1999; Søndergaard et al., 2000), as well as field measurements during bloom periods (Myklestad, 1995; Wear et al., 2015b; Williams, 1995). Estimates suggest that the extracellular release of DOC on average contributes 10 %–20 % but temporarily up to 80 % of primary productivity (Wear et al., 2015a). Accordingly, global observations suggest that stoichiometric variations depend on macronutrient availability, specifically nitrogen-versus-phosphorous stress, in addition to temperature (Tanioka et al., 2022b).
Secondly, we include the preferential remineralization of organic nitrogen and phosphorus with the sequence P>N>C for both DOM and POM. Both observations (Clark et al., 1998; Hopkinson et al., 1997, 2002; Loh and Bauer, 2000; Thomas et al., 1999; Williams et al., 1980) and experimental evidence (Hach et al., 2020; Lønborg et al., 2009; Lønborg and Álvarez-Salgado, 2012) suggest the preferential utilization of organic nitrogen and phosphorus over carbon due to higher bioavailability as a mechanism for variable OM stoichiometry. Assuming remineralization at Redfield ratios thus implies underestimating the recycling of nutrients, new production, and carbon export (Hach et al., 2020; Lønborg and Álvarez-Salgado, 2012). This process is thought to contribute to the slow formation of strongly nutrient-depleted and carbon-enriched refractory DOM from labile DOM (Cai and Jiao, 2023; Hach et al., 2020), with refractory DOM having an estimated average lifetime of approximately 6000 years (Bauer et al., 1992).
While previous studies have simulated OM cycling with variable OM stoichiometry for the North Sea (Butenschön et al., 2016; Lorkowski et al., 2012) and the Baltic Sea (Neumann et al., 2022), this work represents the first comprehensive and quantitative assessment of the effects of observed variations in OM stoichiometry on marine carbon cycling in the NWES. This study quantifies the regional impacts of two pathways for variable OM stoichiometry on OM cycling and the resulting air–sea CO2 exchange in the NWES. In doing so, it will improve our understanding of these implications for marine carbon cycling and the limitations of Redfield-stoichiometry-based estimates. To achieve an accurate representation of the magnitude of both mechanisms, we account for the observed range of POM and labile DOM stoichiometry. We assess the effects of the individual and combined mechanisms by comparing four hindcast simulations: a reference configuration using Redfield stoichiometry, separate configurations for each mechanism, and a final one that integrates both with a reduced contribution. These simulations are conducted using the SCHISM-ECOSMO-CO2 modeling system from Kossack et al. (2023, 2024) and span the period from 1995 to 2010, covering the NWES, the Baltic Sea, and parts of the northeastern Atlantic Ocean.
2.1 SCHISM-ECOSMO-CO2 modeling system
The SCHISM-ECOSMO-CO2 modeling system couples 3D hydrodynamic, biogeochemical, and carbonate system models through the Framework for Aquatic Biogeochemical Models (FABM; Bruggeman and Bolding, 2014). This one-way coupling allows us to consider the control of dynamic forcing conditions on ecosystem and carbon dynamics, as well as the effects of biological production, respiration, and the physical state on carbon cycling (Fig. 1). The Semi-implicit Cross-scale Hydroscience Integrated System Model (SCHISM; Zhang et al., 2016b) simulates the physical state and the resulting tracer transports over the ocean domain. Under these physical forcing conditions, the here-introduced variable stoichiometry version of the ecosystem model ECOSMO II (ECOSystem MOdel; Daewel and Schrum, 2013; Schrum et al., 2006) prognostically calculates tracer concentrations through local sources and sinks from biogeochemical processes. Based on simulated temperature, pressure, salinity, and two prognostic carbonate system variables provided by ECOSMO II, the carbonate system model by Blackford and Gilbert (2007) diagnostically computes the missing carbonate system variables and the air–sea CO2 exchange under equilibrium conditions. The carbonate system calculations follow the HALTAFALL algorithm (Ingri et al., 1967) for the composition of equilibrium mixtures.
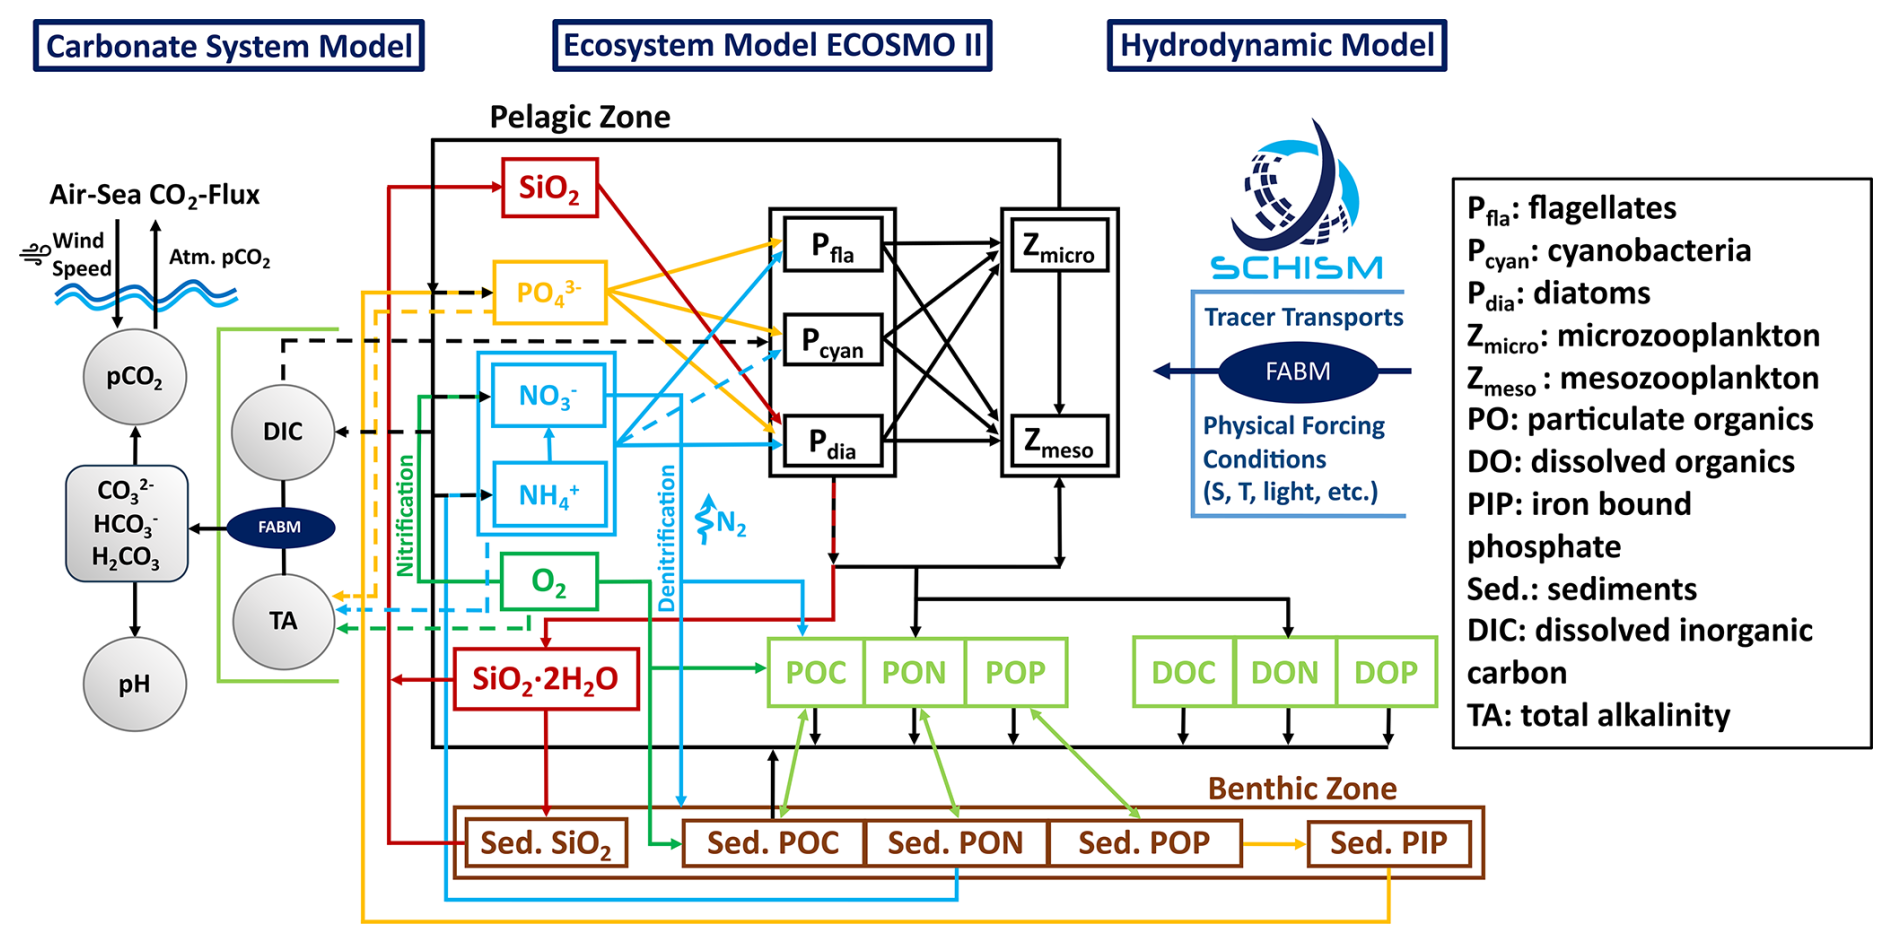
Figure 1Schematic diagram of the coupled physical–biogeochemical modeling system SCHISM-ECOSMO-CO2 based on the FABM framework. The modeling system couples the 3D baroclinic circulation model SCHISM, an extended version of the lower-trophic-level ecosystem model ECOSMO II, and a carbonate system model based on the HALTAFALL algorithm to calculate the composition of equilibrium mixtures.
2.1.1 Hydrodynamic model SCHISM
The hydrodynamical model component SCHISM is capable of efficiently resolving 3D baroclinic ocean circulation in the NWES and adjacent areas across a range of depths from the shallow southern North Sea to the deep waters of the northeastern Atlantic (Zhang et al., 2016a). This is achieved through the use of an unstructured triangular horizontal grid (Zhang et al., 2016b) in combination with localized sigma coordinates with shaved cells (LSC2) for the vertical grid structure (Zhang et al., 2015). Previous studies have demonstrated that SCHISM is able to accurately resolve transports across shelf slopes and canyons (Wang et al., 2022). This makes it particularly suitable for simulating cross-shelf transports and resolving the Norwegian Trench, the Skagerrak, and shelf slope areas in the NWES. The adaptive vertical resolution further enhances the representation of bottom and slope currents, with relevance for the resulting benthic pelagic coupling. By employing a third-order finite-volume transport scheme built upon the weighted essentially non-oscillatory (WENO) formalism, SCHISM is capable of simulating mesoscale eddies in the open ocean (Ye et al., 2019), thereby facilitating cross-scale applications.
The model simulations for this study employ the NWES-LR grid, initialization, and forcing configuration from Kossack et al. (2023, 2024) and Porz et al. (2024), which successfully reproduced temperature, nutrient, and carbonate system variability in the NWES. Our simulations cover the ocean domain from 40–66° N and 20° W–30° E, including the NWES, the Baltic Sea, and parts of the northeastern Atlantic Ocean for the years 1995 to 2010, with a time step of 200 s. For the purposes of this analysis, the initial 5 years are excluded as a spin-up period. With 140 152 triangular grid elements and a maximum of 53 vertical layers, the horizontal resolution ranges from about 4.5 to 10 km, with increasing depth on the continental shelf, and reaches up to 15 km in the Atlantic Ocean. While the Baltic Sea and parts of the northeast Atlantic are included for the explicit resolution of exchange fluxes, the focus of this study is on the North Sea and the entire NWES. In accordance with Kossack et al. (2023, 2024), we subdivide the NWES into sub-areas based on a combination of bathymetry and both physical and biogeochemical variability (Fig. 2). The boundary of the NWES along the shelf edge is defined by the 200 m isobath, with the exception of the Norwegian Trench, which is included because of its important role in cross-shelf exchange fluxes.
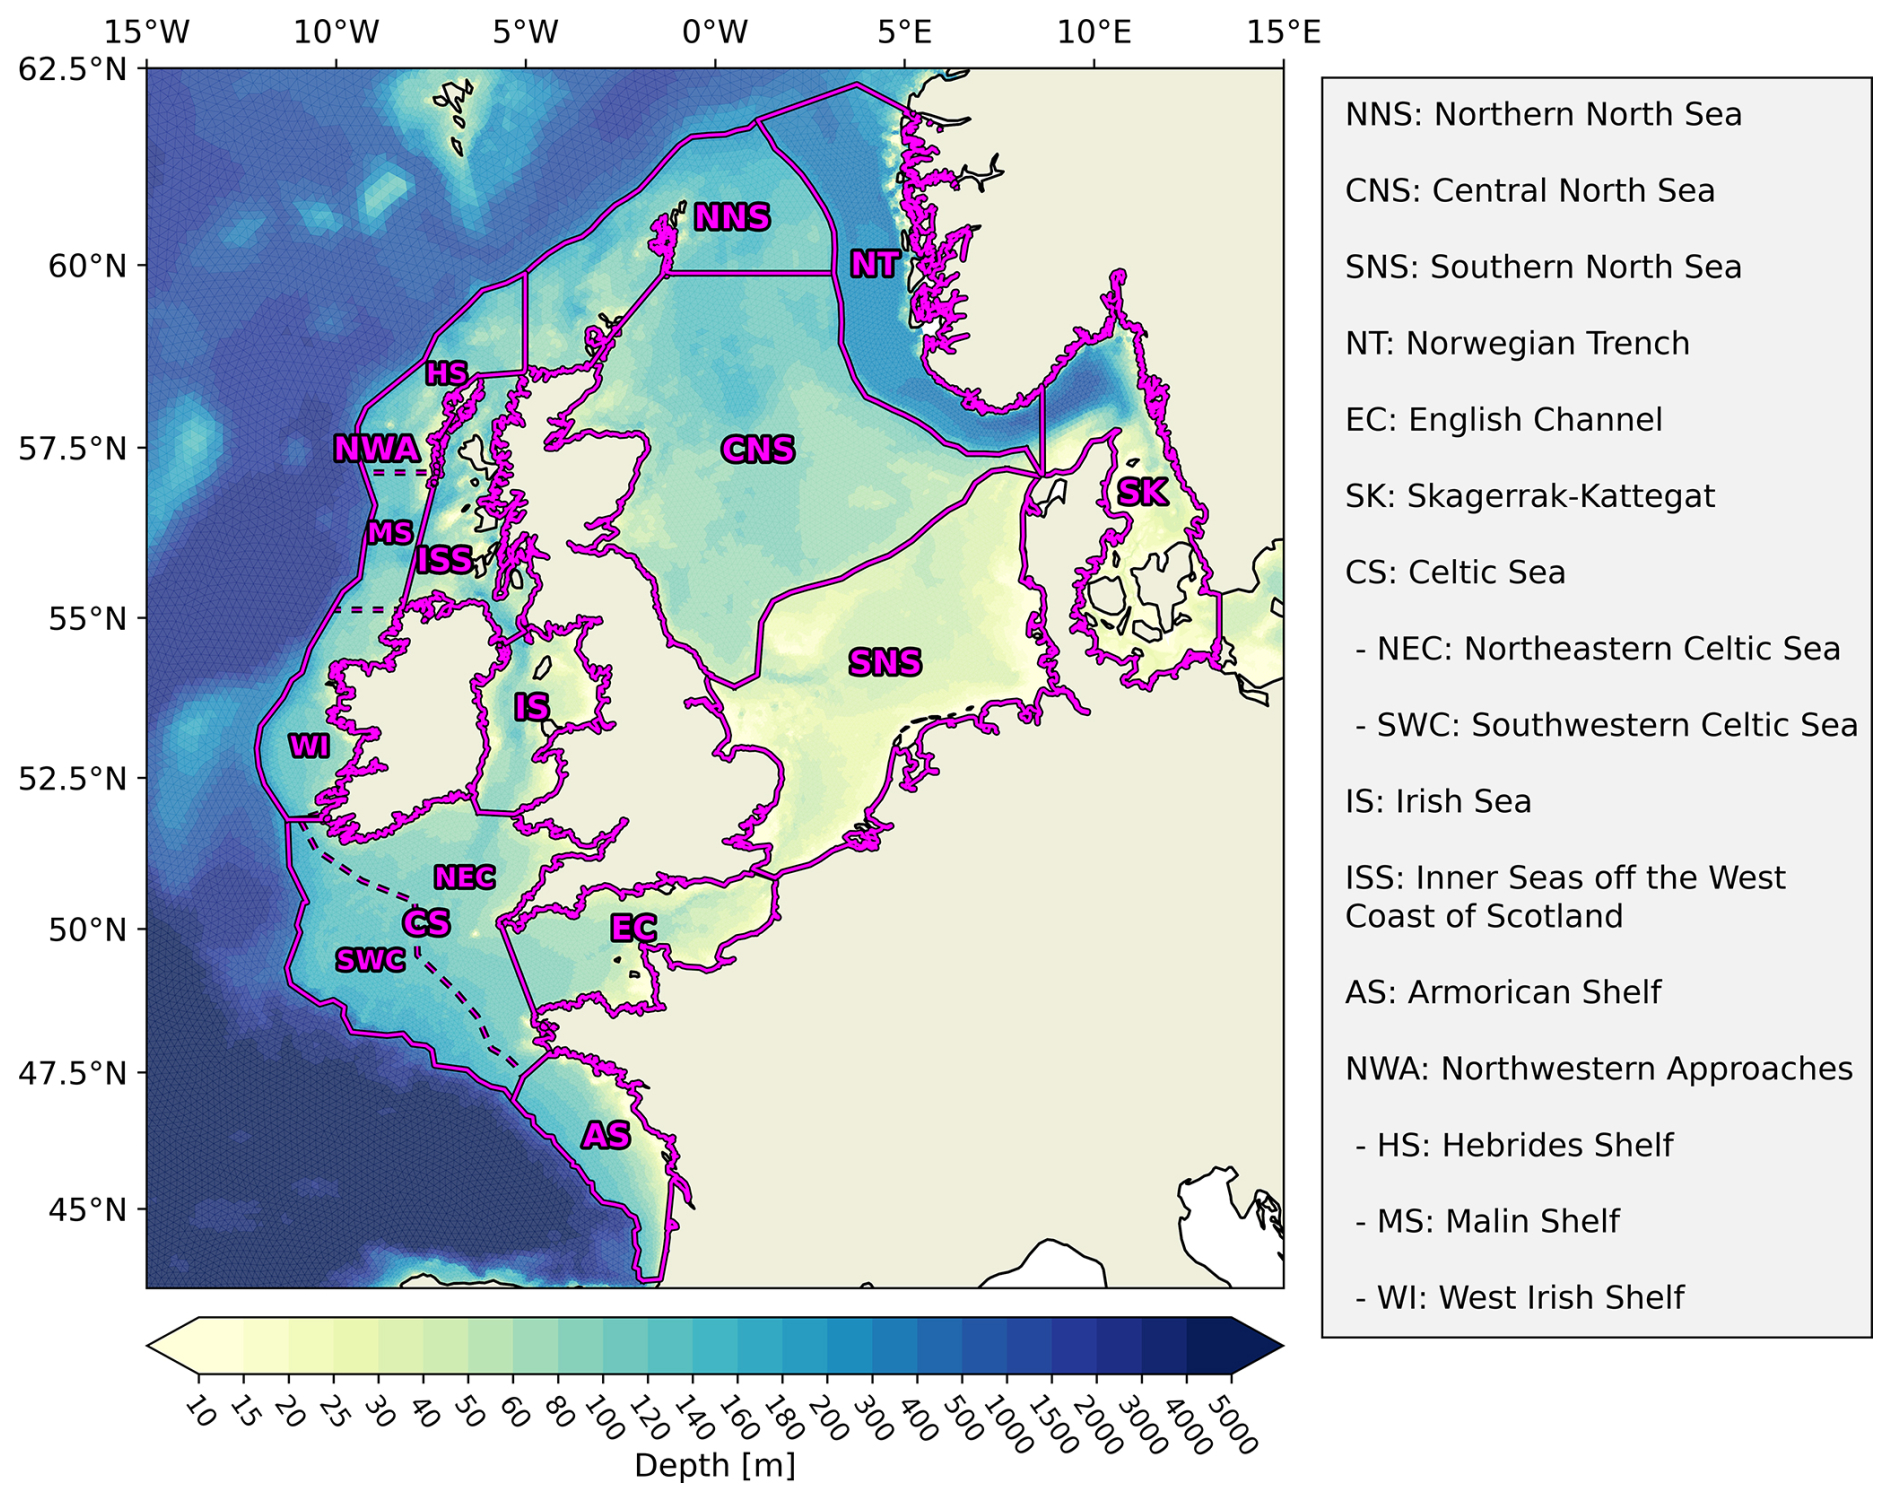
Figure 2Sub-regions and bathymetry of the northwest European shelf seas (NWES) based on a combination of bathymetric features and both physical and biogeochemical variability. The division of the NWES into sub-regions with relatively homogeneous physical and biogeochemical characteristics allows for the identification of consistent carbon cycle responses.
2.1.2 Ecosystem model ECOSMO II
The lower-trophic-level ecosystem model ECOSMO II describes the interactions of nutrient cycles and functional groups of phytoplankton, zooplankton, detritus, and surface sediments with 16 state variables (Daewel and Schrum, 2013). Here, nutrient cycles include phosphate (PO4), oxygen (O2), silicate (SiO2), and nitrogen as both ammonium (NH4) and nitrate (NO3). ECOSMO II represents three functional groups of phytoplankton: flagellates, limited by nitrogen and phosphate; diatoms, additionally limited by silicate; and cyanobacteria with the ability to fix nitrogen from the atmosphere at the water surface. Light limits primary production for all functional groups, with the consideration of self-shading by plankton and organic matter. Cyanobacteria production is additionally temperature-dependent and only possible under sufficient light and under low-salinity conditions in the Baltic Sea. The two zooplankton groups differ in their herbivorous and omnivorous feeding behavior.
Detritus is present in the form of POM, DOM, and biogenic opal (SiO2 × 2H2O), with different rates of temperature-dependent remineralization. POM and DOM contain carbon, nitrogen, and phosphorus at Redfield ratios of (Redfield, 1963). New detritus from assimilation losses and mortality separates into 60 % POM and 40 % DOM, with diatom losses further enriching biogenic opal. While POM and biogenic opal sink at constant velocities, DOM is only transported through advection and diffusion. Below a critical bottom-shear stress, both POM and opal accumulate by deposition in two corresponding sediment pools. Above this critical shear stress, they are resuspended back into the water column. Burial permanently removes both POM and silicate from the sediment pools at a constant percentage rate. Benthic remineralization releases DIC and silicate to the water column as a function of temperature only, whereas nitrogen and phosphorous release from sedimentary POM also depends on oxygen concentrations. Under oxic conditions, remineralization of particulate organic nitrogen (PON) from sediments releases ammonium. Under anoxic conditions, the release of ammonium doubles, and denitrification additionally converts nitrate as an oxidation agent into gaseous nitrogen, which becomes unavailable for photosynthesis. Remineralization converts particulate organic phosphorus (POP) into iron-bound particulate inorganic phosphorous (PIP), the third sediment pool. Dissolution of this PIP then releases phosphate back to the water column. This process increases with increasing temperature and decreasing oxygen concentrations, reaching its maximum under anoxic conditions.
2.1.3 Variable stoichiometry in ECOSMO II
We here extend the ECOSMO II formulation of pelagic and benthic OM, formerly constrained to elemental Redfield ratios, to represent variable OM stoichiometry and its consequences for carbon and nutrient cycling. For this, we introduce independent state variables for pelagic dissolved organic carbon (DOC), nitrogen (DON), and phosphorus (DOP), as well as pelagic and benthic particulate organic carbon (POC), nitrogen (PON), and phosphorus (POP). However, the internal stoichiometry of phyto- and zooplankton biomass remains at constant Redfield ratios. In accordance with Neumann et al. (2022), we assume that this provides a reasonable simplification, as healthy phytoplankton cells only marginally deviate from Redfield ratios compared to DOM and POM (Ho et al., 2003), while also limiting computational cost with reduced model complexity. However, regional variations and future trends in ecosystem stoichiometry may motivate further model developments (Finkel et al., 2010; Geider and La Roche, 2002; Sardans et al., 2021). Concentrations and rates continue to use units of grams of carbon equivalent according to Redfield ratios in conformity with the model implementation. Rates depending on OM concentrations now scale with the respective C, N, or P content. Based on these changes, we implement two pathways for variable OM stoichiometry in both carbon fixation and respiration, motivated by observational evidence.
Firstly, we include an extracellular release of carbon-enriched DOM adapted from Neumann et al. (2022). While primary and secondary production are still constrained to Redfield stoichiometry, the extracellular release allows for DOM production and hence carbon fixation beyond nutrient limitation, with variable stoichiometry depending on the nutrient conditions. The release of DOM results in a corresponding uptake of DIC and nutrients independent of phytoplankton biomass, which is described as part of the full set of ecosystem model equations in the Supplement (Sect. S2). The extracellular release base rate E defined in Eq. (1) is a function of phytoplankton biomass , the respective maximum uptake rates σj, an optional temperature dependence (here only relevant for cyanobacteria), and a constant scaling factor BER, which controls the range of stoichiometric variations and organic carbon concentrations to ensure an accurate representation. It is summed over all phytoplankton groups Pj and ensures that extracellular release only persists as long as phytoplankton biomass is present and remains on a comparable scale to primary production. As the extracellular release does not generate additional phytoplankton biomass, it will eventually decline in absence of primary production.
In contrast to primary production, the extracellular release is not co-limited by the nutrient availability of nitrogen and phosphorus. Instead, nutrient and light conditions control the balance between the release of DOC, DON, and DOP. The release rates EDON and EDOP defined in Eqs. (2) and (3) are limited by the respective nutrient limitations βN and βP of nitrogen and phosphorus but also by the inverse nutrient limitations 1−βP and 1.1−βN, such that the release is highest in the absence of the other nutrient source. Consequently, when primary production is limited only by one nutrient source, extracellular release increases for the less limiting nutrient source. In the absence of both nutrient sources, the extracellular release shifts to release only DOC at a rate EDOC, limited by both inverse nutrient limitations, as defined in Eq. (4). Any release of DON and DOP also releases DOC, such that the release of DOM is always carbon-rich relative to elemental Redfield ratios. As it is inherent to the implementation, all limiting terms and maximum uptake rates have been adapted to align with the existing terms for primary production in ECOSMO II.
To account for the formation of transparent exopolymer particles (Engel, 2002; Mari et al., 2017) from the released DOM, as proposed by Neumann et al. (2022), we include a flocculation rate from DOM to POM. The particle formation is thought to linearly depend on the resulting DIC uptake (Engel, 2002; Neumann et al., 2022), for which we adapt the formulation to be a function of the same limitations as the extracellular release itself. The base rate of flocculation F in Eq. (5) is defined by a constant rate FDOM2POM and the scaling factor BER, both of which are specified in the configuration. The resulting fluxes FDON2PON, FDOP2POP, and FDOC2POC as defined in Eqs. (6)–(8) are depended upon the base rate F and the respective tracer concentrations CDON, CDOP, and CDOC, as well as the same limiting factors as those that apply to the extracellular release itself. To account for the increased carbon contents in observed POM concentrations, we add the flocculation rate for nitrogen and phosphorus to the rate FDOC2POC for carbon. Consequently, the POC formation is the largest under any conditions, as is the release of DOC itself.
Under strongly nutrient-limited conditions, βN≤0.1 or βP≤0.1, the extracellular release and flocculation for DON or DOP are reduced to zero to prevent an excessive depletion of nutrients. Should 1−βP or 1.1−βN fall below zero, the respective terms are also set to zero, as the formulation would otherwise permit negative production. In practice, this state is, however, not reached since the limitations stay within these bounds.
As a second mechanism for variable OM stoichiometry, we incorporate the preferential remineralization of organic nitrogen and phosphorus expressed through higher relative remineralization rates. The remineralization rates ϵ for all of the OM variables are defined in Eqs. (9)–(14). All rates depend on the same temperature function, here expressed in Eq. (9) for POC with the constant reference temperature Tref and the simulated temperature T. The remineralization rate for DOC is defined relative to POC at a constant ratio, ϵDOC:POC. Similarly, the ratios between the percentage rates of PON, POP, DON, and DOP compared to POC and DOC are defined by the constant ratios ϵPOC:PON, ϵPOC:POP, ϵDOC:DON, and ϵDOC:DOP, all of which are specified in the configuration. In the model configurations for this study, we selected values between zero and 1 to reflect the greater bioavailability of nitrogen and phosphorus relative to carbon. The lower the ratio, the higher the respective bioavailability. This allows for the approximation of the observed mean DOM and POM stoichiometry through a faster recycling of nutrients compared to carbon.
A complementary schematic of the OM cycling in the variable stoichiometry version of ECOSMO II is shown in Fig. 3, which illustrates how these two additional parameterizations are incorporated into the existing model structure. The full model description is provided in the Supplement (Sect. S2). This model version includes the prognostic equations for dissolved inorganic carbon (DIC) and total alkalinity (TA) for the coupling to the carbonate system model described below. These were previously introduced in Kossack et al. (2024).
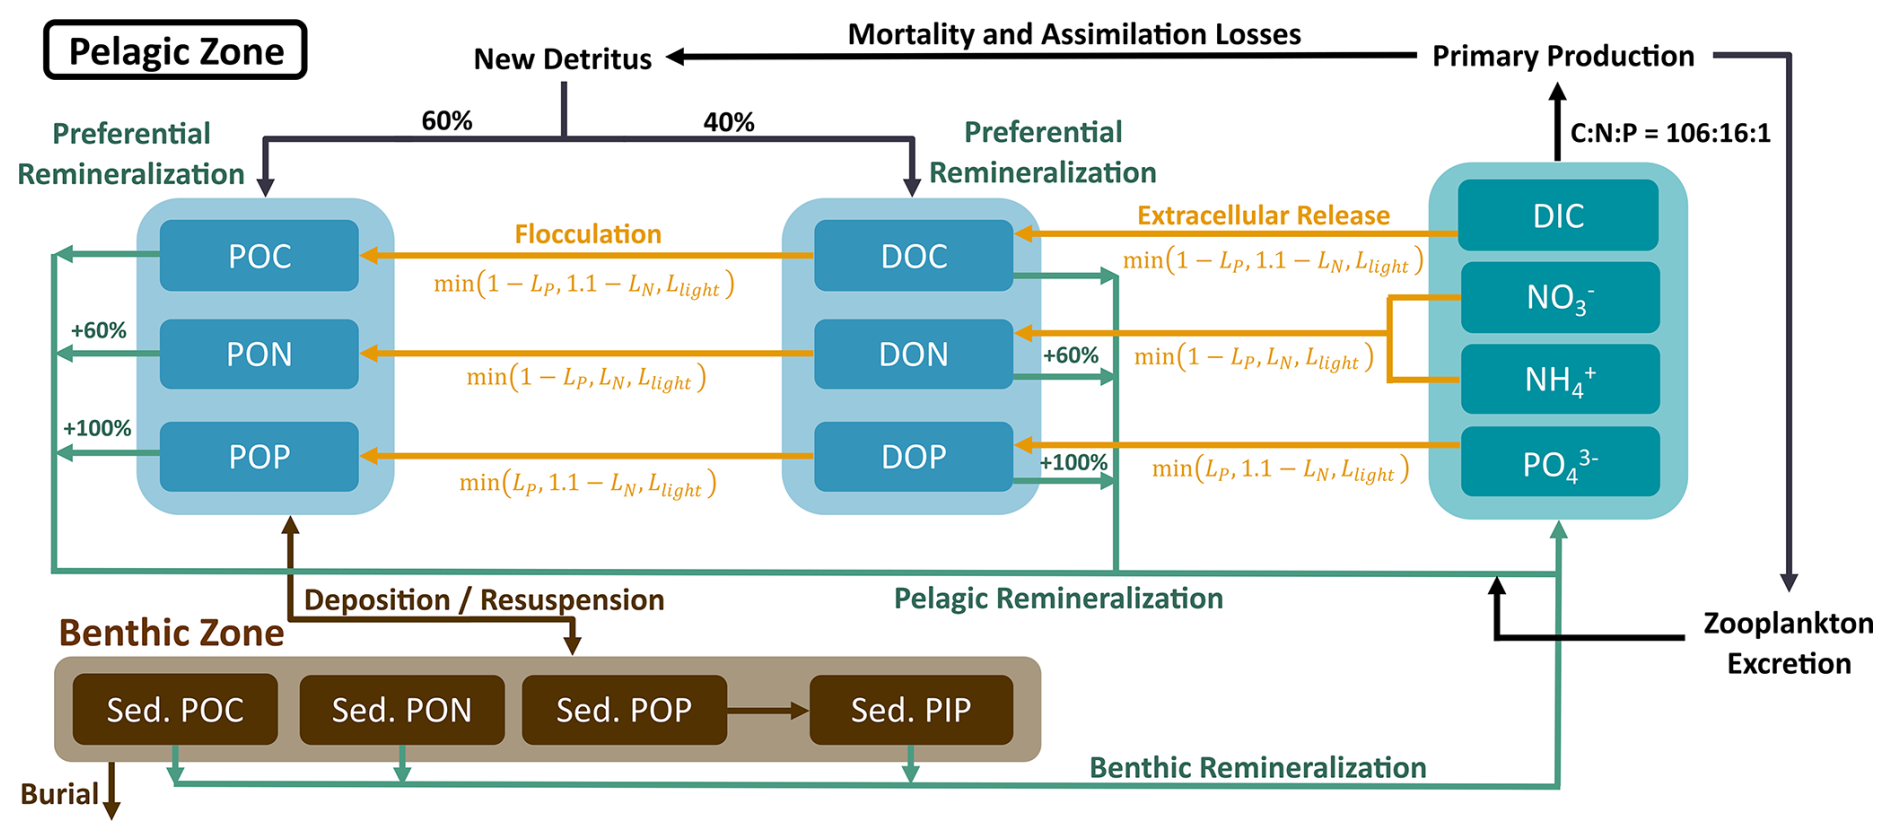
Figure 3Schematic diagram showing the organic matter (OM) cycling in the variable stoichiometry ECOSMO II including the preferential remineralization of organic nitrogen and phosphorous, as well as the extracellular release of carbon-enriched DOM with the associated particle formation.
2.1.4 Carbonate system model
The carbonate system model by Blackford and Gilbert (2007) describes marine carbonate chemistry based on four main state variables: DIC, TA, pH, and pCO2. Additionally, it provides the speciation of DIC into carbonic acid (H2CO3), bicarbonate (HCO), and carbonate ions (CO). Given two of the main state variables, the model estimates the remaining variables iteratively using the HALTAFALL algorithm (Ingri et al., 1967), a method for calculating the composition of equilibrium mixtures. Here, ECOSMO II prognostically simulates DIC and TA, thereby enabling the carbonate system model to diagnostically calculate pH, pCO2, and the carbonate speciation based on temperature, pressure, and salinity, as in Kossack et al. (2024). For the carbonate speciation, the necessary dissociation constants are based on Millero et al. (2006).
In ECOSMO II, DIC is released into the water column by two processes: pelagic and benthic remineralization of organic carbon and zooplankton excretion. Conversely, carbon fixation by net primary production and the extracellular release of DOC consume DIC. At the ocean surface, the exchange of CO2 with the atmosphere results in the addition or removal of DIC from the water column. The air–sea CO2 exchange depends on the difference between the simulated surface pCO2 and monthly prescribed atmospheric CO2 concentrations from the Mace Head station (Lan et al., 2023) and on wind speed as described by the gas transfer parametrization in Wanninkhof (2014). Changes in TA are caused by biological uptake and release of nitrate, ammonium, and phosphate, as described in the prognostic TA formulation by Wolf-Gladrow et al. (2007) and Gustafsson (2013). A complete description of the DIC and TA equations can also be found in the full model description in the Supplement (Sect. S2). A number of previous studies have already examined carbon dynamics in the North Sea and the NWES using versions of this carbonate system model in combination with different physical and ecosystem models (Artioli et al., 2012, 2014; Blackford et al., 2017; Blackford and Gilbert, 2007; Wakelin et al., 2012).
2.1.5 Model configuration and experiments
To assess the individual and combined effects of the release of carbon-enriched DOM and the preferential remineralization of organic nitrogen and phosphorus, we compare four model configurations with identical initial conditions and forcing. The first configuration (RS), which serves as a reference simulation, adheres to Redfield stoichiometry by considering equal remineralization rates for carbon, nitrogen, and phosphorus and by neglecting the extracellular release of DOM. The second configuration (known as ER) considers the DOM release with a scaling factor of BER=0.4 and equal remineralization rates. The third configuration (known as PR) includes the preferential remineralization of nitrogen and phosphorus with +60 % and +100 % higher bioavailability for POM and DOM, respectively. Lastly, the fourth configuration (ER&PR) combines the extracellular release and PR, both with a reduced contribution. This is expressed by a lower extracellular release scaling factor, BER=0.2, and a reduced increase in bioavailability of +30 % and +50 % for nitrogen and phosphorus, respectively. These configurations have been developed to represent the mean stoichiometry of labile DOM and POM within observational bounds (Sect. 2.2.2).
All relevant parameters for the four configurations are listed in the Supplement (Table S1). The initial conditions and river discharge, open-boundary, and atmospheric forcing conditions are identical to the NWES-LR configuration in Kossack et al. (2023, 2024), except for the surface deposition of ammonium and nitrate. The spatially resolved surface deposition is now prescribed monthly rather than by a climatological mean. The monthly means are derived from EMEP MSC-W data (Simpson et al., 2012). Additional variables for DON, DOP, PON, and POP are calculated from the DOM and POM concentrations assuming Redfield stoichiometry in the initial and forcing conditions. Accordingly, any discrepancies from elemental Redfield ratios can be attributed to the aforementioned parameterizations.
Initial fields and monthly climatological means for the open-boundary conditions of temperature, salinity, nutrients, and oxygen are interpolated from the World Ocean Atlas 2018 (WOA18) data products (Garcia et al., 2018a, b; Locarnini et al., 2018; Zweng et al., 2019). For DIC and TA, the initial and boundary conditions are based on interpolated climatological fields from NNGv2LDEO (Broullón et al., 2019, 2020), a neural network (NN) approach combining the Global Ocean Data Analysis Project version 2 (Gv2) and the Lamont–Doherty Earth Observatory (LDEO) datasets. For the Baltic Sea, the TA initial conditions are instead derived from the salinity relation in Hjalmarsson et al. (2008). To account for globally increasing atmospheric CO2 concentrations, an interannual trend from global ICON-Coast simulations (Mathis et al., 2022) is added to the DIC open-boundary conditions. Measurements from the Mace Head station (Lan et al., 2023) provide monthly mean atmospheric CO2 forcing for the air–sea CO2 exchange calculation. All initial sediment fields are based on ECOSMO simulations conducted by Fabian Werner (personal communication, 2023) and Samuelsen et al. (2022).
River loads of nutrients, DIC, and TA are prescribed along with river discharge for the 172 largest rivers in the model domain, while the remaining loads are set to zero. A regional dataset introduced by Daewel and Schrum (2013) and extended by Zhao et al. (2019) provides daily nutrient loads from a 21-year mean over 1995–2015. Annual mean concentrations from Pätsch and Lenhart (2004) and Neal and Davies (2003) additionally supply DIC, DOC, and TA river loads for the Scheldt, Meuse, Rhine, Ems, Elbe, Humber, Wear, Tweed, Great Ouse, and Thames. Where possible, missing TA loads are derived from the salinity relation in Hjalmarsson et al. (2008) and Artioli et al. (2012). For the remaining rivers, we use average DIC loads of 2700 µM from Pätsch and Lenhart (2004) and an average TA in the NWES of 2050 µM. Missing DOC loads are estimated to be 1/10 of the corresponding DIC concentration. Riverine DOC is assumed to be only 10 % bioavailable, as suggested by Kühn et al. (2010). This fraction is considered to be remineralized and hence is directly added to DIC.
2.2 Organic matter stoichiometry: representation and validation
2.2.1 Observed organic matter stoichiometry
The spatial and temporal variability of stoichiometry in DOM and POM remains poorly constrained. However, case studies and global observations permit the estimation of their range of variations. Due to scarcity of measurements within the NWES, we rely on a mixture of global and regional observations. For reference, a literature compilation of both concentrations and the stoichiometry of OM in the global open ocean and various marginal seas is provided in the Supplement (Tables S3–S10). These observations indicate globally consistent compositional differences between DOM and POM, as well as between different lability fractions of DOM (Hopkinson and Vallino, 2005; Liang et al., 2023). Furthermore, some latitudinal and vertical patterns and predictors have previously been identified, including temperature and nutrient availability (Liang et al., 2023; Martiny et al., 2013; Tanioka et al., 2022b). Ecosystem stoichiometry may also change under shifting environmental conditions such as temperature, stratification, and CO2 concentrations (Finkel et al., 2010; Moreno and Martiny, 2018; Sardans et al., 2012, 2021), which could contribute to future trends in DOM and POM composition.
In the surface layer of the global open ocean, the observed average stoichiometry of bulk DOM exhibits ranges of –1164:26–123:1 (Hopkinson and Vallino, 2005; Letscher and Moore, 2015; Liang et al., 2023; Lønborg and Álvarez-Salgado, 2012), which is more carbon-rich than POM, with an estimated average composition of –294:21–36:1 (Liang et al., 2023; Martiny et al., 2014; Singh et al., 2015; Tanioka et al., 2021, 2022a). For both DOM and POM, there is a persistent vertical trend that indicates increasing C:N, C:P, and N:P ratios with depth. This relation is thought to arise as organic nitrogen and phosphorus is preferentially respired, leaving older and deeper material more carbon-rich (Hopkinson and Vallino, 2005; Letscher and Moore, 2015; Painter et al., 2017; Tanioka et al., 2021).
In the case of DOM, this vertical gradient is more pronounced, which is linked to old and strongly nutrient-depleted refractory material. The continuous spectrum of lability in DOM is typically simplified into two or three pools of (semi-)labile (LDOM) and refractory DOM (RDOM) (Hansell et al., 2009). While the labile and semi-labile fractions have a life time of days to years, the refractory pool has an average age of approximately 6000 years (Bauer et al., 1992; Hansell et al., 2009). Over time, the bioavailable compounds are removed, leaving the remaining refractory material highly carbon-rich, with an observed average stoichiometry of –3511:10–202:1 (Aminot and Kérouel, 2004; Hopkinson and Vallino, 2005; Liang et al., 2023; Lønborg and Álvarez-Salgado, 2012).
Despite its high carbon content, RDOM only acts as a minor source of inorganic carbon and nutrients on sub-millennial timescales due to its slow formation and decomposition (Hopkinson and Vallino, 2005). In contrast, LDOM, with an observed average stoichiometry of – (Hopkinson and Vallino, 2005; Liang et al., 2023) in the global surface ocean, acts as the major control on the recycling of carbon and nutrients on shorter timescales. Consequently, the majority of OM cycling on the annual to decadal timescales considered here occurs at an intermediate stoichiometry between the composition of bulk DOM and elemental Redfield ratios (Hopkinson and Vallino, 2005). The balance between concentrations of RDOM and LDOM to a large extent determines the vertical gradient in bulk DOM stoichiometry (Aminot and Kérouel, 2004). High LDOM concentrations are only observed in surface waters, while RDOM concentrations are instead vertically homogeneous (Aminot and Kérouel, 2004; Hansell and Carlson, 1998). Hence, the fraction of RDOM, and with that the relative carbon content in bulk DOM, increase with depth (Aminot and Kérouel, 2004; Hopkinson and Vallino, 2005; Hung et al., 2003; Liang et al., 2023).
In marginal seas such as the North Sea and Baltic Sea, river discharge and water residence times may further control bulk DOM stoichiometry (Voss et al., 2021). Regions of freshwater influence exhibit higher carbon contents, with –3714:52–221:1 (Stepanauskas et al., 2002; Voss et al., 2021). This is attributed to the elevated C:N ratios of 30–60:1 observed in riverine OM (Bauer et al., 2013). Long residence times in the Baltic Sea facilitate the accumulation of riverine organic matter, in contrast to the relatively short residence times in the North Sea, which reduce the influence of riverine inputs on bulk OM stoichiometry. These factors contribute to the large regional variations, for which we provide an overview in the literature compilation.
2.2.2 Simulated organic matter stoichiometry
To ascertain a realistic magnitude of the preferential remineralization and the release of carbon-enriched DOM, we identified parameter settings for which the simulated stoichiometry adheres to observational bounds for LDOM and POM. Accordingly, we reduced the contribution of each mechanism in the ER&PR configuration to ensure consistency across all configurations. We found that using the parameter settings from the individual configurations in the combined ER&PR configuration resulted in C:N and C:P ratios significantly exceeding those that were observed and in the other configurations, making their comparison less meaningful.
It should be noted that the DOM simulated in ECOSMO is fully biodegradable, with the majority of DOM produced being respired within 1 year. Consequently, the simulated DOM represents a spectrum of only labile and semi-labile DOM but not RDOM. The latter is not currently considered, as its impact on the carbon and nutrient cycles is assumed to be negligible on the timescales in question. Therefore, we assess the simulated DOM concentrations and stoichiometry with respect to observations of LDOM. Given the large discrepancies in stoichiometry of bulk DOM, LDOM, and RDOM, we assume this to be the most reasonable approach.
As a representation of the simulated OM stoichiometry, we present the time-averaged horizontal distribution of column-integrated C:N, C:P, and N:P ratios, as well as vertical profiles of horizontally averaged ratios over the northern, central, and southern North Sea. Figures 4 and 5 show these distributions for the ER, PR, and ER&PR configurations for DOM and POM, respectively. Observations do not allow us to resolve regional vertical profiles. For this reason, we compare the simulated stoichiometry to observed ranges and, where available, the observed mean composition, independent of depth. In the NWES, observations of DOM stoichiometry are limited to bulk DOM, without a distinction between LDOM and RDOM (Chaichana et al., 2019; Davis et al., 2014, 2019; Painter et al., 2018; Suratman et al., 2009). Thus, we compare the vertical distribution of DOM stoichiometry to globally estimated ranges for LDOM from Hopkinson and Vallino (2005) and Liang et al. (2023). In contrast, for POM stoichiometry, we provide both global estimates from Liang et al. (2023), and regional estimates from the Hebrides Shelf (Painter et al., 2017) and the Celtic Sea (Davis et al., 2014, 2019). This is because direct observations for the North Sea are limited to C:N ratios and do not provide estimated mean compositions (Chaichana et al., 2019; Suratman et al., 2009).
Overall, the simulated DOM stoichiometry reproduces the observed range within reasonable limits (Fig. 4). The mean simulated DOC:DON ratios of 10.2–11.2 compare well with the observed means and ranges of 8.9 (5.4–12.0) and 10.7 (8.7–14.1). Similarly, simulated mean DOC:DOP ratios of 198–232 agree with the observational estimates of 179 (83–414) and 199 (154–245). In both cases, the ER&PR configuration is on the upper end of the range, with the ER and PR configurations being more central. In terms of the DON:DOP ratios, all configurations reproduce the observed means of 20 (15–49) and 20 (16–25), with mean simulated DON:DOP ratios of 19.5–20.7. For all three elemental ratios, the PR configuration shows the observed increase with depth as N and P are preferentially removed. This is not the case for the ER configuration, where the additional DOM is only released in the euphotic zone. In terms of the horizontal distribution, the carbon enrichment is highest for the ER configuration in the central and northern parts of the North Sea, as well as in the deep parts of the Atlantic Ocean. This shows a higher DOC accumulation in nutrient depleted areas, as expected from the implementation. For the PR configuration, instead, the carbon contents are highest in the Norwegian Trench and along the shelf edge, where OM respiration is generally high, which amplifies the difference in remineralization rates. The average composition is close to the surface DOM composition, as DOM concentrations rapidly decrease with depth below the euphotic zone.
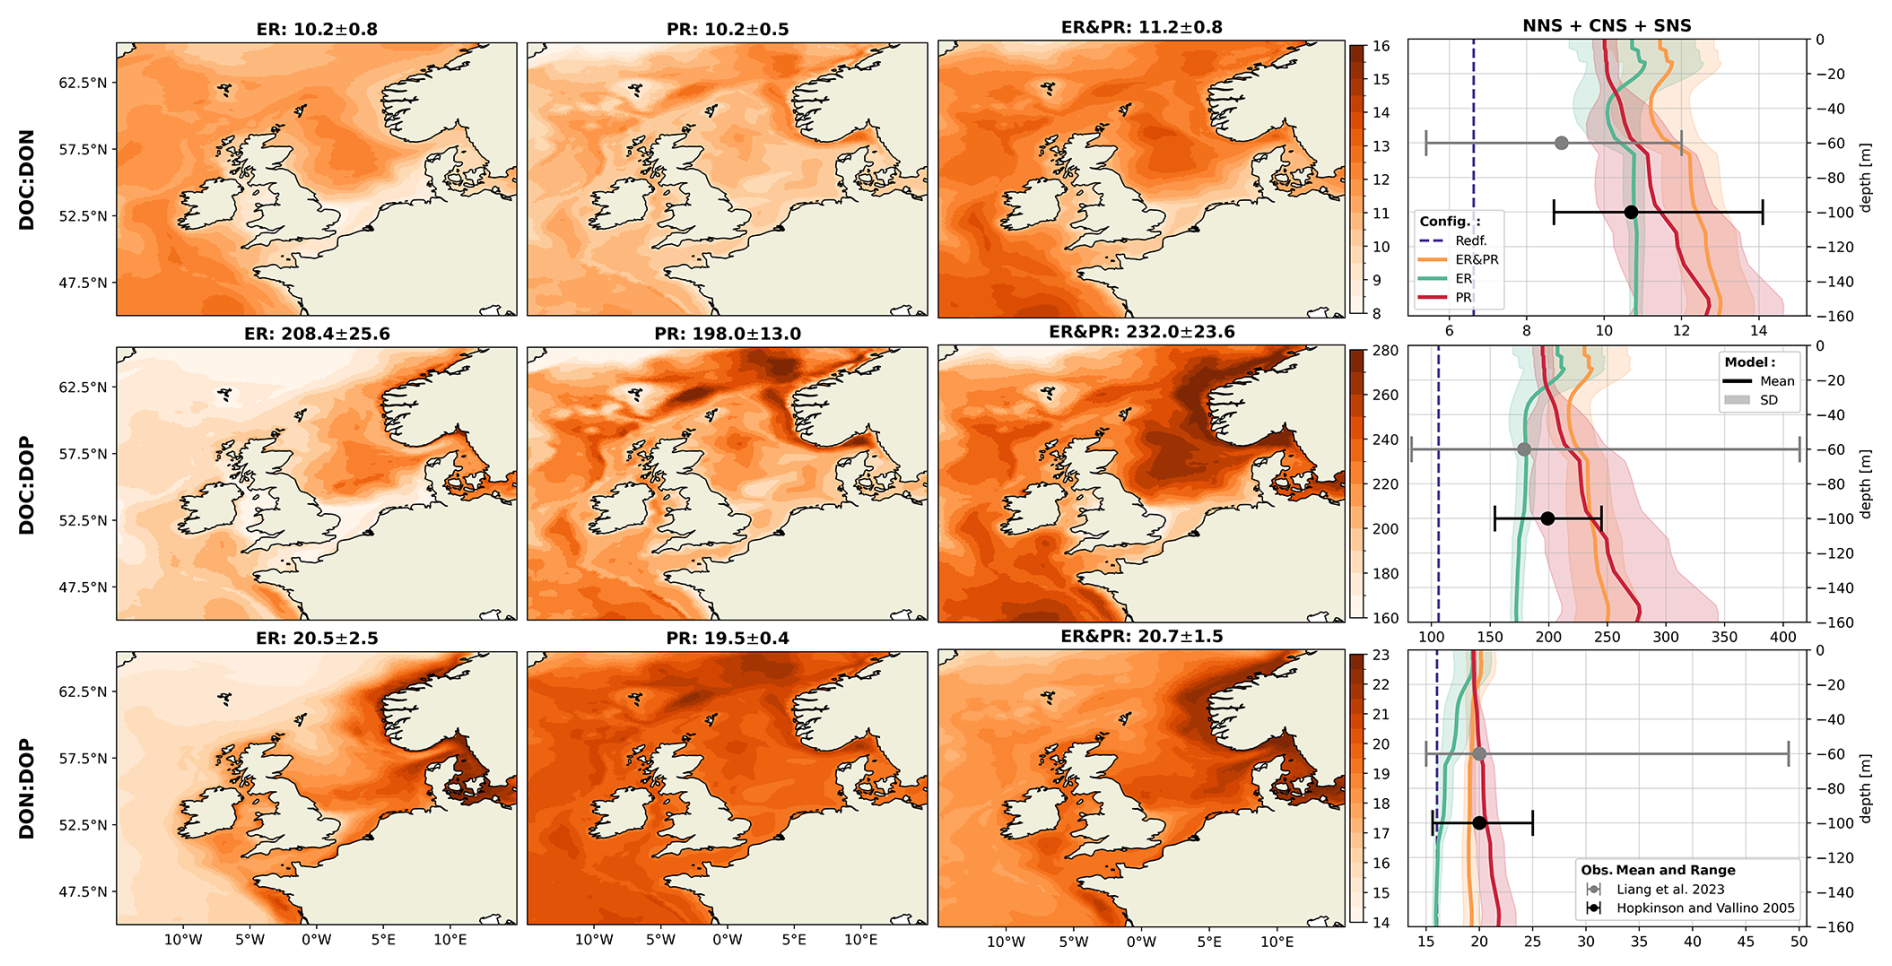
Figure 4Mean DOM stoichiometry for the ER, PR, and ER&PR configurations over the simulation period of 2000–2010. The first three columns show the vertically integrated horizontal distribution. For each elemental ratio and configuration, the titles display the mean values and the respective standard deviations over the NWES. The last column shows the vertical distribution of simulated horizontal mean stoichiometry and the corresponding standard deviation over the NNS, CNS, and SNS sub-areas. Observed depth-independent ranges in DOM stoichiometry and the estimated mean composition from Hopkinson and Vallino (2005) and Liang et al. (2023) are represented by the error bars. The corresponding Redfield ratios of C:N = 6.625, C:P = 106, and N:P = 16 are indicated by the dashed blue lines in the vertical profiles. The horizontal means and standard deviations over the entire NWES are listed above the horizontal distributions. For the vertical profiles, the horizontal standard deviation is represented by the shaded area around the solid lines.
The simulated POM stoichiometry is also consistent with the observed ranges but is more challenging for the observed mean ratios, as only one global study explicitly provides an average composition (Fig. 5). Simulated mean POC:PON ratios of 7.4–8.1 are consistent with the global mean of 7.7 (6.1–9.2) and the ranges of 8.3–13.7 and 4.3–11.6 for the Hebrides Shelf and the Celtic Sea. Likewise, the simulated POC:POP ratios of 139–158 are within the center of the observed mean and ranges of 160 (73–295), (142–260), and (63–283), with the PR configuration being closest to the estimated mean. The increased PON:POP ratios compared to Redfield stoichiometry are reproduced in all configurations. Simulated PON:POP ratios of 19.0–19.6 are comparable to the observational estimates, with a mean and ranges of 21 (10–37), (16–26), and (10–47). For all three elemental ratios, the PR configuration shows the highest and the ER configuration the lowest horizontal averages across all vertical levels. As for DOM, the increasing ratios with depth indicated by DOM and POM observations are reproduced by the PR but not the ER configuration. The horizontal distribution for the ER configuration shows the highest carbon enrichment in the central and northern North Sea, the same as for DOM. In contrast, the PR configuration instead shows homogeneous elemental ratios across the NWES but high carbon enrichment in the deep, open Atlantic. Altogether, simulated DOM and POM stoichiometry both reasonably represent the available observations.
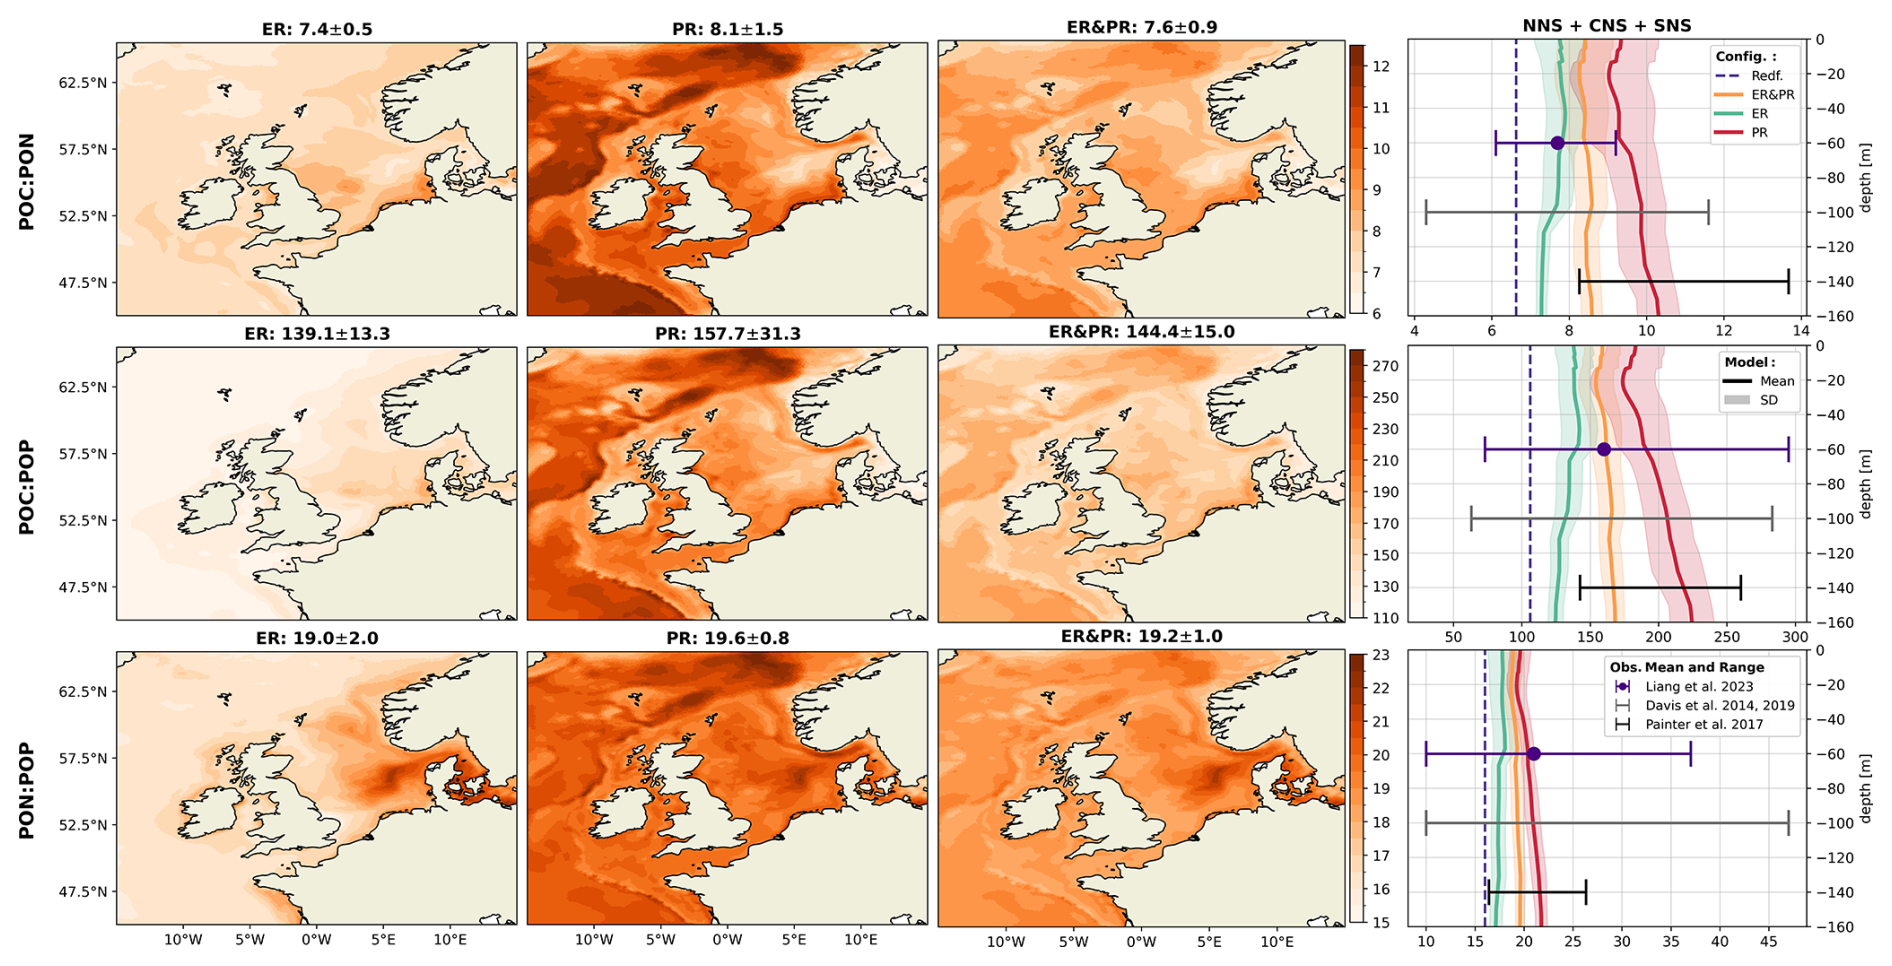
Figure 5Mean POM stoichiometry for the ER, PR, and ER&PR configurations over the simulation period of 2000–2010. The first three columns show the vertically integrated horizontal distribution. For each elemental ratio and configuration, the titles display the mean values and the respective standard deviation over the NWES. The last column shows the vertical distribution of simulated horizontal mean stoichiometry and the corresponding standard deviation over the NNS, CNS, and SNS sub-areas. Observed depth-independent ranges in POM stoichiometry and the estimated mean composition from Liang et al. (2023), Davis et al. (2014, 2019), and Painter et al. (2017) are represented by the error bars. The corresponding Redfield ratios of C:N = 6.625, C:P = 106, and N:P = 16 are indicated by the dashed blue lines in the vertical profiles. The horizontal means and standard deviations over the entire NWES are listed above the horizontal distributions. For the vertical profiles, the horizontal standard deviation is represented by the shaded area around the solid lines.
2.3 Impact on model performance
The ability of SCHISM-ECOSMO-CO2 to reproduce the observed variability in temperature, nutrients, and carbonate system variables in the NWES has already been established in Kossack et al. (2023, 2024). As the extended OM representation in the variable stoichiometry ECOSMO II version may have consequences for the model validation, we here describe the effects of the model extension on the model validation in the ER, PR, and ER&PR configurations compared to the RS reference configuration. With the primary objective being to investigate the consequences of the proposed modifications on marine carbon cycling, particularly with regard to the biological uptake of inorganic carbon, we provide a more comprehensive account of the carbonate system validation. Differences in the model representation compared to Kossack et al. (2023, 2024) may also be linked to the different data availability in the simulated time period, to the monthly resolved surface deposition, and to a reduced remineralization rate for DOM. The latter was adjusted for a better representation of DOC concentrations, which are essential for assessing the effects of variable stoichiometry. This is associated with a decrease in nutrient availability and hence productivity.
Based on surface, bottle, and pump data from the ocean hydrochemistry data collection of the International Council for the Exploration of the Sea (ICES), we find that there is no significant improvement or deterioration in the model representation of phosphate and nitrate for any of the three variable stoichiometry configurations with respect to the reference configuration. For these variables we provide the horizontal distribution of seasonal model biases at co-located data points and corresponding Taylor diagrams in the Supplement (Figs. S1–S6). The spatial distribution of regional and seasonal biases is persistent across all configurations, which results in overall negligible differences in the resulting model performance. We include temperature and salinity for the RS configuration, as it may have a relevant influence on the carbonate system calculations. All other configurations are excluded for the physical variables, as the physical simulations are equivalent.
In the validation for the carbonate system, we assess DIC, TA, and pCO2. While we do not discuss TA in the results of this study, it is used to derive the simulated pCO2 and, as such, is relevant to the model performance. We compare the simulated DIC and TA concentrations to a total of 5685 and 5110 observations from the Global Ocean Data Analysis Project (GLODAP). Additionally, we validate the simulated CO2 concentrations against 772 202 CO2 fugacity (fCO2) measurements from the Surface Ocean CO2 Atlas (SOCAT). For this, the observed fCO2 values are converted to pCO2 using the Python library PyCO2SYS (Humphreys et al., 2022, 2024). Simulated surface CO2 concentrations are converted to pCO2 according to Eqs. (15)–(16) from the guide to best practices by Dickson et al. (2007) and an updated water vapor pressure equation as a function of temperature from Huang (2018). Here, xCO2 is the simulated dry mole fraction, pair and are the air and water vapor pressure, and T is the simulated temperature.
In stark contrast to the nutrient validation, there is a significant discrepancy between the model configurations with respect to DIC and pCO2 related to changes in the inorganic carbon uptake. TA validation, however, does not differ significantly between configurations. This is demonstrated by the changes in the corresponding Taylor diagrams in Fig. 6. The Taylor diagrams represent the model performance in terms of the correlation, normalized standard deviation (NSD) with respect to the observations, and their normalized and centered root-mean-squared difference (RMSD). As complementary indicators of the model performance, we provide the seasonal co-located model biases and the mean percentage biases in the Supplement (Figs. S7–S9 and Table 2).
With regard to DIC, the RS configuration underestimates the observed variability in the NNS, CNS, SNS, and NT, with an NSD of 0.48–0.80 (Fig. 6). Compared to this, the configurations allowing for variable OM stoichiometry show a consistent improvement in the represented variability, with an NSD of 0.70–0.98, 0.55–0.85, and 0.63–0.90 for the ER, PR, and ER&PR configurations, respectively (Fig. 6). With an average increase in NSD of 0.07–0.21, these more closely reproduce the range of observed variability across all sub-regions. The improvement is consistently largest for the ER and smallest for the PR configuration. This range of improvement is proportional to the additional DIC uptake from biological carbon fixation, which is discussed below. Only in the SK sub-region does the NSD exceed 1 in the RS configuration, showing an increase from 1.17 to 1.21–1.32, which adds to the overestimation of the observed variability. Differences in the correlation between the configurations are negligible, with correlation coefficients of 0.81–0.88 for the NNS, CNS, and NT sub-regions (Fig. 6). For the SK and SNS, the correlation is weaker, with correlation coefficients of 0.71–0.72 and 0.60–0.66, respectively. Improvements in the correlation may be limited due to an expected mismatch between the small-scale variability captured in measurements and simulated average concentrations on much larger scales. The model's percentage bias in DIC is generally between 0.6 % and 1.3 % and does not show any conclusive differences between configurations (Table S2).
Differences in the model performance for TA are negligible and inconsistent across sub-regions, ranging from 0.002 to 0.013 in the NSD and 0.001 to 0.003 in the correlation coefficients (Fig. 6). The correlation is generally weaker for TA than for DIC, which can be attributed to both missing constituents in ECOSMO II that contribute to changes in TA (Wolf-Gladrow et al., 2007) and to uncertainties in terrestrial TA sources. In the SNS and NT sub-regions, the correlation coefficients of 0.60 and 0.82 are on the higher end. In comparison, the NNS and CNS have correlation coefficients of 0.29 and 0.40, which are more influenced by exchange with the Atlantic and less by river discharge. This may suggest that not only terrestrial sources contribute to the lower correlation but local alkalinity generation also contributes.
As pCO2 is largely dependent on DIC, improvements in the representation of DIC are expected to be reflected, to some extent, in the representation of pCO2. However, given the considerably greater data availability for pCO2, we provide a validation here explicitly. For the simulated surface pCO2, as for DIC, there is an improvement in the representation of the observed variability in most of the sub-regions. Additionally, several sub-regions show a significant increase in correlation in combination with a small but consistent decrease of approximately 0.2 %–3.3 % (Table S2) in the percentage bias across all sub-regions except from the SK and SWC regions. The correlation coefficients for the NNS, CNS, SNS, NT, SK, EC, and AS regions increase significantly from 0.66, 0.60, 0.36, 0.21, 0.34, 0.43, and −0.06 in the RS configuration to 0.78, 0.76, 0.53, 0.42, 0.44, 0.59, and 0.39 in the ER configuration (Fig. 6). This increase in correlation is similarly dependent on the increase in inorganic carbon uptake, the same as for the changes in standard deviation for DIC. The PR and ER&PR configurations yield intermediate results, with the lowest increase in correlation for the PR configuration. Only for the SWC does the correlation remain rather consistent. Likewise, the observed standard deviation is more closely represented in the NNS, CNS, SNS, EC, SWC, and AS sub-regions by variable OM stoichiometry. The corresponding NSD increases from 0.67, 0.81, 0.70, 0.65, 0.75, and 0.37 in the RS configuration up to 1.10, 1.08, 0.87, 0.74, 1.14, and 0.48 in the ER configuration (Fig. 6). Variability is generally overestimated in the NT and SK sub-regions, likely due to the representation of rivers as point sources rather than explicitly resolved estuaries.
In summary, the variable stoichiometry configurations consistently improve model performance in terms of the represented range of variability for DIC and pCO2, represented by the NSD, as well as the correlation with observations for pCO2. The magnitude of the improvement is lowest in the PR and highest in the ER configuration, which is related to the corresponding increase in biological uptake of inorganic carbon, as discussed below. This supports the need to account for carbon overconsumption compared to estimates based on Redfield stoichiometry. While variable OM stoichiometry here improves the representation in terms of the range of variability, some challenges remain in representing the timing of DIC release in autumn. This is further discussed below with respect to surface DIC concentrations. Overall, the changes in TA are negligible, indicating that the implementation has a minimal impact on TA.
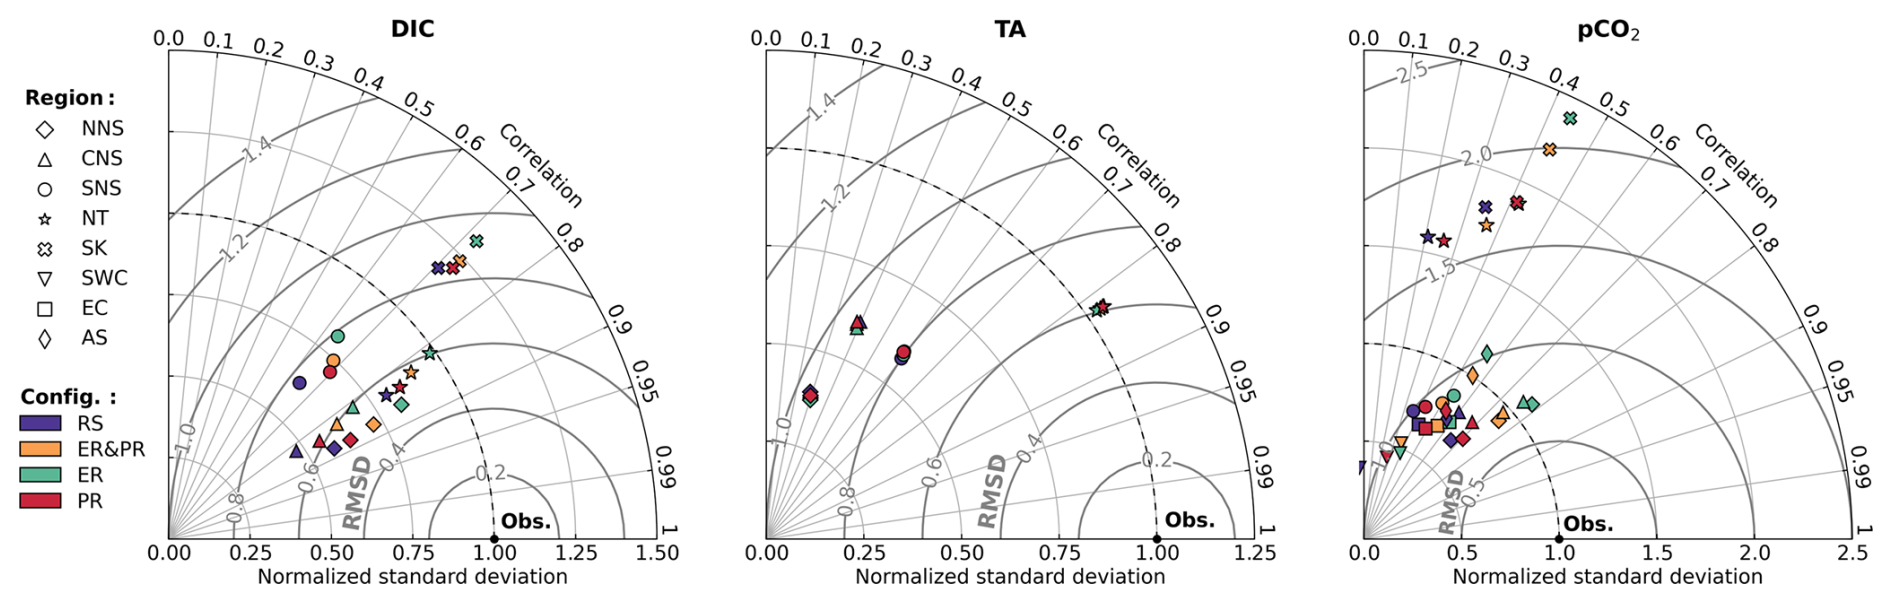
Figure 6Taylor diagrams for simulated dissolved inorganic carbon (DIC), total alkalinity (TA), and partial pressure of CO2 (pCO2) in comparison to the GLODAPv2022 and SOCATv2023 datasets, including all four model configurations. The model performance is represented in terms of correlation, normalized standard deviation, and normalized and centered root mean square difference (RMSD), with respect to the observations. Regions were selected based on sufficient data availability. The results are differentiated by configuration, as indicated by color, and sub-region, as indicated by shape.
2.4 Net community production
Net community production (NCP), defined as the difference between carbon fixation and respiration, is a metric used to assess whether a system is net autotrophic (NCP >0), with a net production of organic carbon, or net heterotrophic (NCP <0), with a net respiration of organic carbon (Smith and Hollibaugh, 1993). Net autotrophic regions typically act as a sink for inorganic carbon, while net heterotrophic regions increase the inorganic carbon content respired from additional imported organic carbon (Thomas et al., 2005). For this study we define NCP as carbon fixation through primary production and the extracellular release of DOC minus carbon respiration, which consists of pelagic and benthic remineralization as well as zooplankton excretion contributing to DIC release (Fig. 3).
3.1 Annual carbon fluxes
As a first step towards quantifying the large-scale effects of both pathways for variable OM stoichiometry on OM cycling and the resulting changes in the air–sea CO2 exchange, we assess their influence on key annual carbon fluxes and their seasonal variability. In particular, we examine the effects on vertically integrated carbon fixation, carbon respiration, NCP, and the air–sea CO2 exchange. We begin by assessing changes in the balance between organic carbon production and respiration to understand how the associated uptake and release of inorganic carbon contributes to resulting changes in the oceanic CO2 uptake.
3.1.1 Biological carbon fixation
Biological carbon fixation exhibits a consistent percentage increase between the North Sea and the entire NWES for each of the variable stoichiometry configurations (Fig. 7). However, the magnitude of this increase varies considerably, with the PR configuration showing the smallest and the ER configuration showing the largest increase. In comparison to the vertically integrated carbon fixation in the North Sea of 4.5 Tmol C yr−1 for the RS configuration, the PR, ER&PR, and ER configurations exhibit a notable increase, reaching 4.9 (+10 %), 6.0 (+34 %), and 6.9 Tmol C yr−1 (+55 %), respectively. For the entire NWES, the corresponding reference carbon fixation of 9.7 Tmol C yr−1 increases to 10.6 (+9 %), 12.8 (+32 %), and 14.8 Tmol C yr−1 (+52 %).
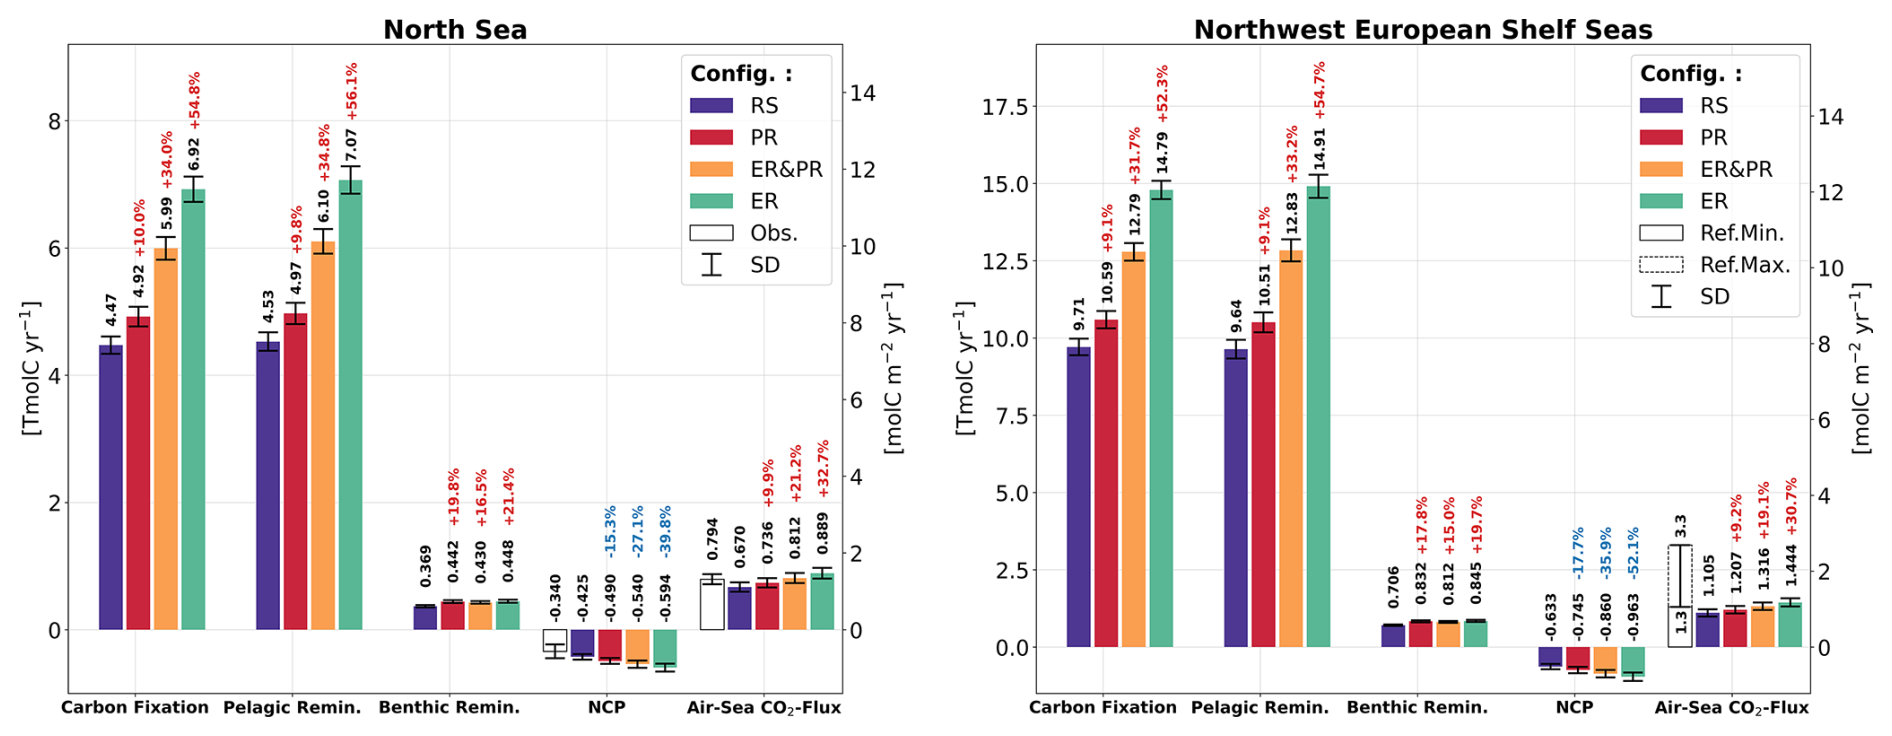
Figure 7Simulated annual vertically integrated carbon fixation, pelagic and benthic remineralization, net community production (NCP), and net air–sea CO2 exchange for all four model configurations, averaged over the simulated period of 2000–2010. The air–sea CO2 flux is defined downward such that positive values indicate an oceanic uptake and negative values an outgassing of CO2. The error bars show the corresponding standard deviation. White bars show the literature estimates and ranges for NCP and the air–sea CO2 exchange in the North Sea from Thomas et al. (2005) and the estimated range of the air–sea CO2 exchange in the NWES from Legge et al. (2020), with reference to both modeling and observational studies. The annual time series for selected sub-regions and the average fluxes for all sub-regions are provided in the Supplement (Figs. S10–S14 and Tables S11–S15).
In the RS reference configuration, carbon fixation is highest in the shallow and well-mixed shelf regions (Fig. 8a), including the SNS, EC, AS, CS, IS, ISS, and NWA sub-areas (Fig. 2). The highest annual sub-region mean is reached in the Celtic Sea, with a mean value of 9.1 mol C m−2 yr−1. In contrast, the lowest annual mean of carbon fixation is found in the deeper central North Sea, with a value of 7.2 mol C m−2 yr−1. This is due to the seasonal stratification, which promotes nutrient limitation. The spatial distribution of simulated carbon fixation is consistent with the established physical controls on primary production and its characteristic spatial pattern in the NWES (Holt et al., 2012).
Across the North Sea area, the carbon fixation response differs considerably between the PR and ER configurations. For the ER configuration, the largest increase in carbon fixation here is observed in the CNS, NNS, and NT sub-regions, with values ranging from 3.9 to 4.7 mol C m−2 yr−1 (Fig. 8a). In contrast, the SNS sub-region exhibits a smaller increase, with a value of 3.2 mol C m−2 yr−1. Conversely, the PR configuration exhibits the highest increase of 0.9 mol C m−2 yr−1 in the SNS and smaller increases of 0.4–0.7 mol C m−2 yr−1 in the CNS, NNS, and NT sub-regions. Consequently, the north–south gradient in productivity is weakened in the ER configuration but strengthened in the PR configuration. There is an evenly distributed positive response in the outer shelf regions, while some inner shelf regions, including the EC, IS, and ISS, show a much weaker response. All configurations further show a large increase in carbon fixation in the AS region, from 1.2 to 5.6 mol C m−2 yr−1. Consistent with the mean annual changes, the amplitude of these changes is largest in the ER and smallest in the PR configuration.
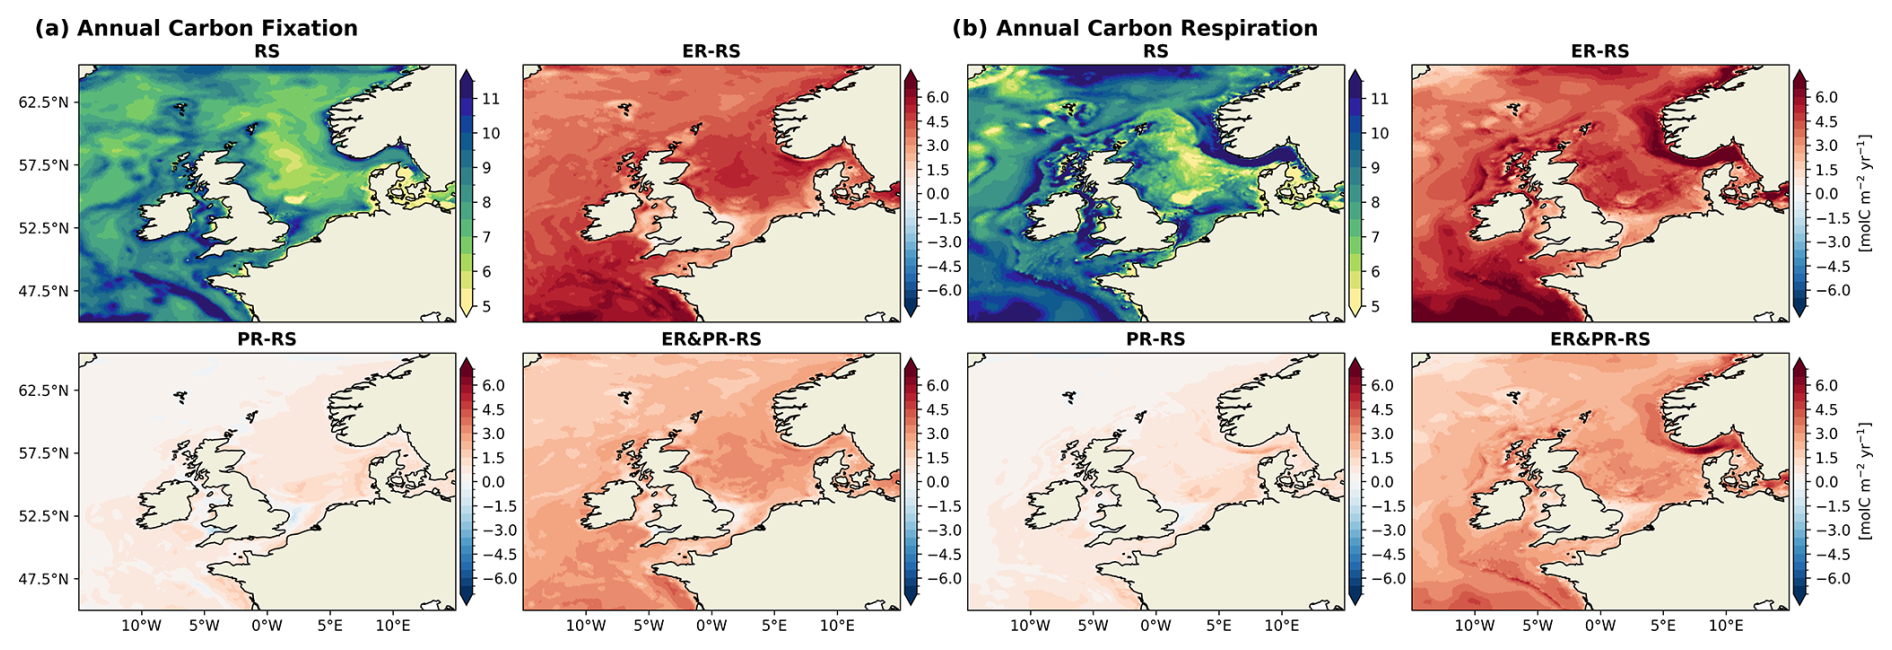
Figure 8Spatial distribution of annual mean vertically integrated (a) carbon fixation and (b) respiration, including pelagic and benthic remineralization, for the RS configuration and differences for the ER, PR, and ER&PR configurations over the simulation period of 2000–2010. The respective seasonal means for carbon fixation and respiration are provided in the Supplement (Figs. S15 and S16).
3.1.2 Carbon respiration
The rate of carbon respiration exceeds the rate of carbon fixation in the North Sea and the entire NWES in all configurations (Fig. 7). In the RS configuration, the magnitude of pelagic remineralization is comparable to that of carbon fixation, with annual means of 4.5 Tmol C yr−1 in the North Sea and 9.6 Tmol C yr−1 across the entire NWES. The additional benthic remineralization of 0.37 and 0.70 Tmol C yr−1, however, results in a total respiration that surpasses carbon fixation. In comparison, the variable stoichiometry configurations exhibit higher pelagic remineralization, reaching values of 5.0 (+10 %), 6.1 (+35 %), and 7.1 Tmol C yr−1 (+56 %) for the North Sea in the PR, ER&PR, and ER configurations, respectively. In the entire the NWES, the corresponding values are 10.5 (+9 %), 12.8 (+33 %), and 14.9 Tmol C yr−1 (+55 %). In contrast, the increases in benthic remineralization are equal across configurations and thus do not match this percentage increase. The annual means of benthic remineralization are 0.44 (+20 %), 0.43 (+17 %), and 0.45 Tmol C yr−1 (+21 %) in the North Sea and 0.83 (+18 %), 0.81 (+15 %), and 0.85 Tmol C yr−1 (+20 %) in the NWES. This is likely linked to a comparable increase in POC concentrations, which is further discussed below.
The pattern of the RS reference carbon respiration (Fig. 8b) resembles the distribution of carbon fixation, with the exception of the NT region. Similar to carbon fixation, respiration is particularly low in the CNS, 7.5 mol C m−2 yr−1, and particularly high in the western outer shelf regions, up to 9.3 mol C m−2 yr−1 in the SWC. However, respiration reaches its maximum in the NT, with an average rate of 11.1 mol C m−2 yr−1 despite only moderate carbon fixation. The north–south gradient in the impact of carbon respiration across the North Sea is positive in the PR configuration and negative in the ER and ER&PR configurations. The preferential remineralization thus increases the north–south gradient in production and respiration. Conversely, the extracellular release of DOC promotes production and respiration in the otherwise nutrient-depleted and less biologically productive areas. The strong respiration in the NT is further enhanced by 16.1 mol C m−2 yr−1 in the variable stoichiometry configurations. Otherwise, the differences are consistent with the increases in carbon fixation.
Shifts in the balance between carbon fixation and respiration rather than either process alone play a crucial role in air–sea CO2 exchange, influencing whether specific locations act as sources or sinks of DIC. Therefore, we will further assess the annual NCP, focusing on both vertically integrated values and the vertical gradient between the surface and sub-surface layers.
3.1.3 NCP
Overall, the North Sea and the entire NWES are net heterotrophic in all configurations, with a corresponding NCP of −0.43 and −0.63 Tmol C yr−1 in the RS configuration (Fig. 7). For the North Sea, this value is situated at the lower end of the uncertainty range from observations, with an estimated NCP of Tmol C yr−1 reported in Thomas et al. (2005). The PR, ER&PR, and ER configurations exhibit a stronger net heterotrophy (i.e., lower NCP), with NCP values of −0.49 (−15 %), −0.54 (−27 %), and −0.59 Tmol C yr−1 (−40 %) in the North Sea. In the NWES, the percentage decrease in NCP is even more pronounced, with an annual NCP of −0.75 (−18 %), −0.86 (−36 %), and −0.96 Tmol C yr−1 (−52 %).
In the RS configuration, net autotrophic regions are found in the shallow coastal areas of the SNS, EC, CS, IS, and NWA sub-regions; the shelf edge; and the Dogger Bank (Fig. 9a). The most pronounced net autotrophic region is a broad band in the North Sea along the Norwegian Trench. Conversely, beyond the 200 m isobath, the NT and the deep parts of the SK region are the most net heterotrophic regions across the entire shelf. This results in a large NCP gradient across the slope. Similarly, portions of the shelf slope and the deeper central IS, ISS, and NWA sub-regions exhibit comparatively elevated net heterotrophy, with net autotrophy observed in adjacent, shallower areas. The remaining shelf area is largely weakly net heterotrophic or nearly neutral.
The most notable NCP response is the intensification of the aforementioned gradient between net autotrophy along the edge of the NT region and the net heterotrophy inside the NT region. This feature indicates an increase in OM that is produced in the CNS, transported into the NT, and subsequently remineralized. The variable stoichiometry configurations demonstrate a reinforcement of the pre-existing pattern of NCP across the entire shelf area. This is expressed by an increase in NCP in net autotrophic and a decrease in NCP in net heterotrophic regions. The RS reference NCP is lowest in the NT and SK regions, with annual means of −3.2 and −1.0 mol C m−2 yr−1, respectively. These regions also exhibit the most pronounced NCP response, with decreases of −0.3 to −1.6 mol C m−2 yr−1 in the NT and −0.3 to −1.0 mol C m−2 yr−1 in the SK sub-region. In accordance with the response in carbon fixation and respiration, the PR configuration overall shows the weakest decrease, while the ER configuration shows the strongest decrease. Nevertheless, even in the PR configuration, the largest decrease in NCP is shown in the NT and SK regions, thereby amplifying the pre-existing NCP gradient. In the SNS, IS, and ISS, the impact is intermediate, with values ranging from −0.1 to −0.2 mol C m−2 yr−1, and it is less significant in the remaining regions. The ER configuration shows an increase in the CNS and AS, with a range of 3–0.05 mol C m−2 yr−1. A significant decrease can be seen in the NNS, SNS, SWC, IS, ISS, HS, and MS, with a range of −0.2 to −0.4 mol C m−2 yr−1.
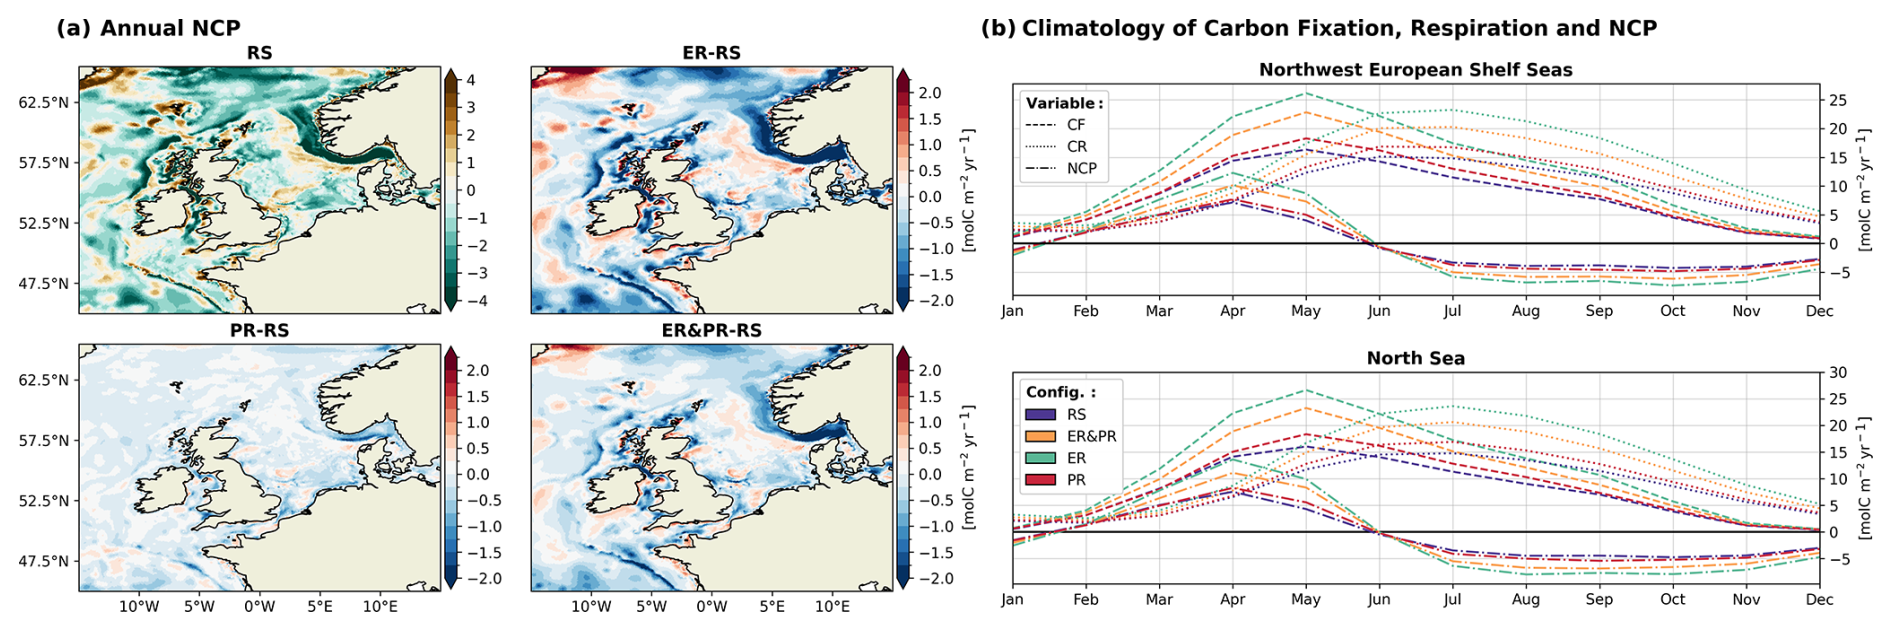
Figure 9(a) Spatial distribution of annual vertically integrated NCP for the RS configuration and differences for the ER, PR, and ER&PR configurations over the simulation period of 2000–2010. (b) Respective monthly 11-year mean of carbon fixation (CF, dashed); carbon respiration (CR, dotted), including benthic and pelagic remineralization; and NCP (dash–dot). The respective seasonal means of NCP are provided in the Supplement (Fig. S17).
While the increase in carbon fixation is limited to the euphotic zone, where sufficient light and nutrients are available, respiration increases in both the surface and sub-surface layers (Fig. 10). In the upper 50 m, pelagic remineralization is approximately 10 %–61 % higher in the variable stoichiometry configurations. Below 50 m, the remaining water column shows a smaller increase in pelagic remineralization of approximately 5 %–41 %. The separation into carbon fixation at the surface only and respiration across various depths leads to opposite changes in the pelagic NCP (i.e., excluding benthic remineralization) between the surface and sub-surface layers. The net autotrophic surface layer above 50 m becomes increasingly autotrophic, by 7 %–34 %, while the remaining water column becomes more net heterotrophic, by 6 %–41 %. This enhanced vertical gradient in NCP suggests a stronger depletion of DIC in surface waters and a stronger release of DIC at depth, implying a stronger biological control on surface pCO2 and an increase in the resulting oceanic CO2 uptake.
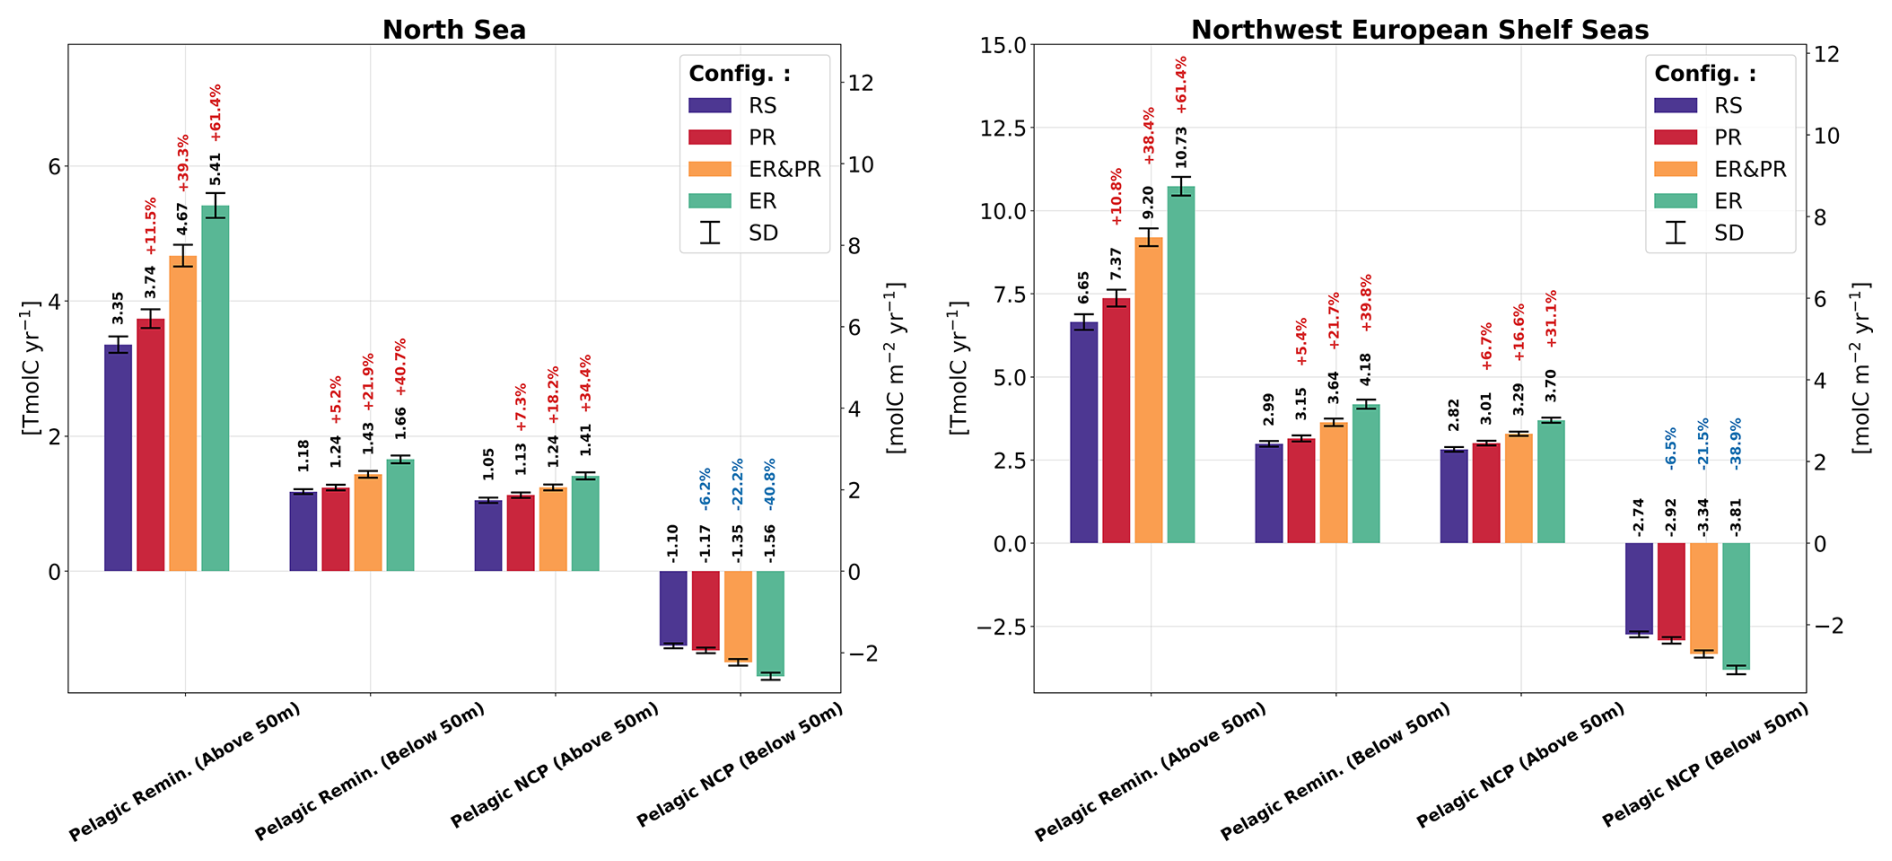
Figure 10Simulated annual vertically integrated pelagic remineralization and pelagic NCP, separated into above and below 50 m depth and averaged over the simulated period of 2000–2010 for all four model configurations. The error bars show the corresponding standard deviation. In contrast to the NCP shown with all vertically integrated fluxes in Fig. 9, pelagic NCP here does not include benthic remineralization.
3.1.4 Enhanced seasonal organic matter cycling
The impacts of variable stoichiometry on the annual means result from marked changes in the seasonality of carbon fixation and respiration. Across all configurations, carbon fixation in the North Sea and the NWES exceeds respiration between mid-January and the end of May, reaching its maximum at the beginning of May (Fig. 9b). Carbon respiration accordingly surpasses carbon fixation at the end of May and remains higher until mid-January, with the maximum reached in July. This results in a range of approximately 4.5 months of net autotrophy, with the maximum NCP in April, and 7.5 months of net heterotrophy, with minimum NCP in October.
Considering the observed OM stoichiometry in our simulations leads to an intensification of seasonal carbon fixation, respiration, and NCP. As with the annual mean fluxes, the intensification is lowest for the PR configuration and highest for the ER configuration. The maximum reference carbon fixation of 16.3 mol C m−2 yr−1 reached in May increases to a range of 18.3 (+12 %) to 26.2 mol C m−2 yr−1 (+60 %) in the NWES. Similarly, the maximum carbon respiration of 15.1 mol C m−2 yr−1 in July increases to values of 16.9 (+12 %) to 23.3 mol C m−2 yr−1 (+54 %). For NCP, both the maximum of 7.1 mol C m−2 yr−1 in April and the minimum of −4.3 mol C m−2 yr−1 in October are enhanced. The seasonal maximum in NCP increases to a range of 7.7 (+8 %) to 12.3 mol C m−2 yr−1 (+72 %) in the variable stoichiometry configurations. At the same time, the seasonal minimum decreases to an amplitude of −4.8 (−13 %) to −7.3 mol C m−2 yr−1 (−72 %). The response is nearly identical in the North Sea. In conclusion, these results indicate that variable OM stoichiometry intensifies both the seasonal biological production of organic carbon and its subsequent degradation. In combination with the lateral and vertical gradient in NCP, this finding suggests an increased biological control of the seasonal pCO2 and the resulting air–sea CO2 exchange.
3.1.5 Net air–sea CO2 exchange
In response to the enhanced OM cycling, all variable stoichiometry configurations result in an increased net oceanic CO2 uptake from the atmosphere. The magnitude of this increase in the CO2 uptake, compared across configurations, is proportional to the increase in carbon fixation and respiration (Figs. 7–9) and the resulting increase in the vertical gradient of NCP (Fig. 10). The reference simulation yields an average net CO2 uptake by the ocean of 0.67 Tmol C yr−1 for the North Sea and 1.11 Tmol C yr−1 for the entire NWES. These values are slightly below observational estimates of 0.79 Tmol C yr−1 for the North Sea (Thomas et al., 2005) and 1.3 to 3.3 Tmol C yr−1 for the NWES (Legge et al., 2020). In the variable stoichiometry configurations, the enhanced CO2 uptake is in good agreement with the literature estimates in the North Sea, with an annual CO2 uptake of 0.74 (+10 %) to 0.89 Tmol C yr−1 (+33 %). In the NWES, the annual CO2-uptake is on the lower end of the literature estimates, 1.21 (+9 %) to 1.44 Tmol C yr−1 (+31 %). Thus, considering the observed stoichiometry improves the representation of the annual net air–sea CO2 exchange both for the North Sea and the entire NWES.
In terms of the spatial distribution, the increase in CO2 uptake is not uniform across the shelf but instead amplifies existing regional differences (Fig. 11). The reference configuration reproduces the observed north–south gradient across the North Sea, with the annual CO2 uptake decreasing from the NNS and NT sub-regions towards the SNS sub-region (Kitidis et al., 2019; Schiettecatte et al., 2007; Thomas et al., 2004). All variable stoichiometry configurations consistently strengthen this latitudinal gradient in the air–sea CO2 exchange. However, the amplitude of this effect varies consistently with the magnitude of the increased annual uptake. The largest increase in CO2 uptake is consistently shown in the deeper central shelf areas and parts of the outer shelf regions including the NNS, CNS, NT, SWC, MS, AS, and WI. In the ER configuration, the mean CO2 uptake increases by 0.3 to 0.5 mol C m−2 yr−1 in these regions. Here, the CNS shows the greatest average increase, ranging from 0.1 mol C m−2 yr−1 in the PR to 0.5 mol C m−2 yr−1 in the ER configuration. Smaller but consistent increases are displayed for the southern and near-coastal regions including the SNS, SK, and SWC regions. A persistent increase in CO2 outgassing or decrease in CO2 uptake is only shown in a narrow band along the Norwegian coast, near the Elbe estuary, and in inner shelf regions including the EC and IS. In the Atlantic Ocean, the CO2 uptake consistently increases. Overall, the variable OM stoichiometry configurations demonstrate an increase in the annual net CO2 uptake, with an intensification of the north–south gradient across the North Sea. This is consistent with the enhanced NCP gradient across the slope of the Norwegian Trench (Fig. 9) and between surface and sub-surface NCP (Fig. 10). The latter suggest additional drawdown of DIC with potential for a stronger CO2 uptake, especially in but not limited to this region.
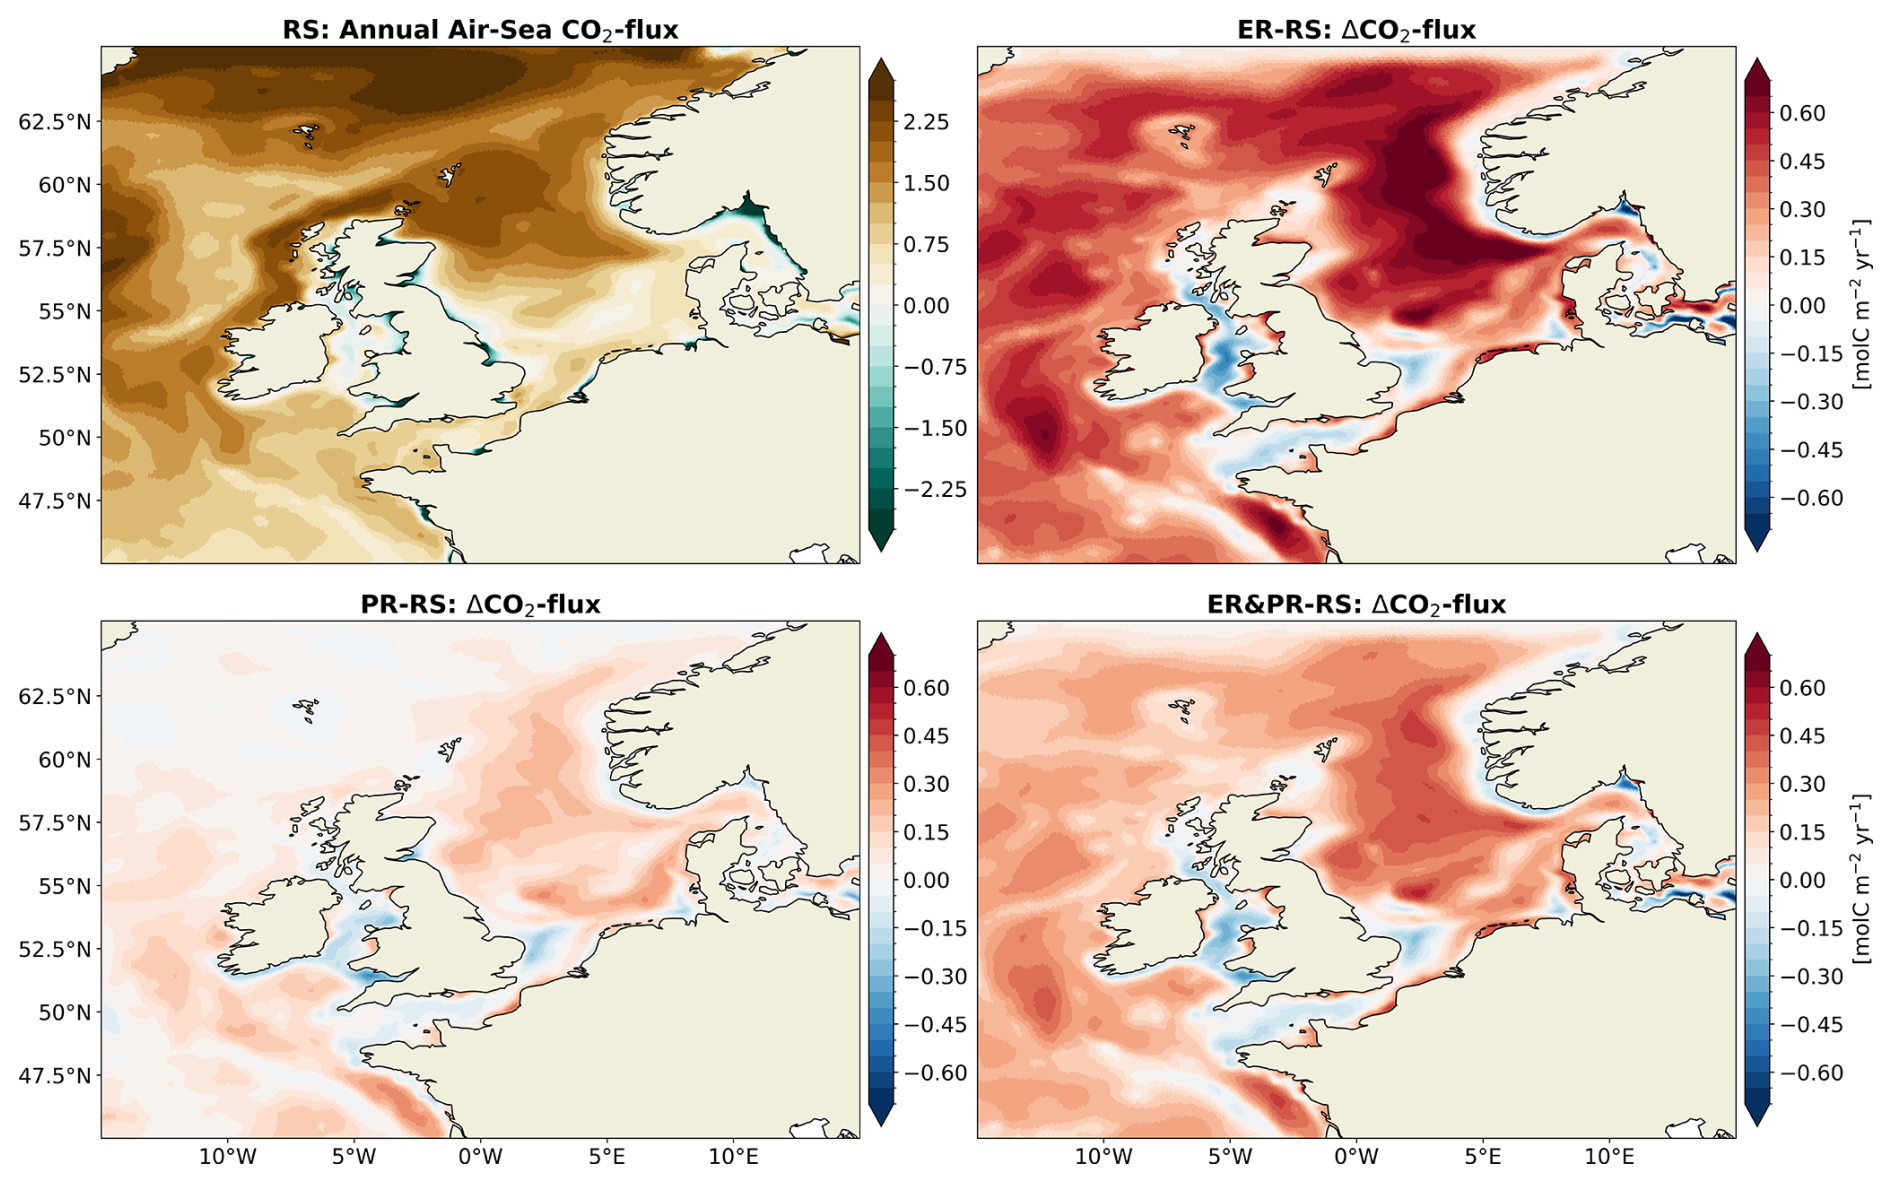
Figure 11Annual mean air–sea CO2 exchange for the RS configuration and differences for the ER, PR, and ER&PR configurations over the simulation period of 2000–2010. The direction of the flux is defined as downward, meaning a positive air–sea CO2 exchange indicates an oceanic uptake and a negative one an outgassing of CO2. Similarly, positive differences represent an increase in uptake or a decrease in outgassing and vice versa.
3.1.6 Seasonal air–sea CO2 exchange
In addition to the net annual changes, the seasonal intensification of OM cycling also results in a shifted seasonality of the air–sea CO2 exchange. This can be attributed to an intensification of the biological contribution to changes in pCO2 relative to the influence of temperature, which is further discussed below. The RS reference configuration shows the strongest CO2 uptake during winter and spring (Fig. 12), with averages of 1.7 and 2.4 mol C m−2 yr−1, respectively. In winter, the highest uptake occurs in the NNS and SNS, with the CNS exhibiting the lowest uptake. For the remaining year, there is a consistent north–south gradient, with the highest uptake rates shown in the northern half and weaker uptake or outgassing in the southern half. In summer and autumn, the southern parts and inner shelf areas of the NWES including the SNS, SK, EC, IS, and parts of the CNS display an outgassing of CO2. The extent of this outgassing is greatest in summer, while the intensity is greatest in autumn. On average, there is a net outgassing of −0.2 mol C m−2 yr−1 in summer and autumn. This qualitative pattern with a pronounced north–south gradient is overall in good agreement with previous monthly estimates from observations (Kitidis et al., 2019). However, the seasonality indicates that in the reference configuration, the effect of biological carbon fixation on the air–sea CO2 exchange is underestimated relative to the influence of temperature. This is demonstrated by the majority of uptake occurring during winter and spring, although observations also suggest that significant uptake continues during summer (Kitidis et al., 2019; Thomas et al., 2004).
The seasonal impact of variable stoichiometry is consistent across configurations, with differences in amplitude proportional to the annual changes. For each season, the smallest differences in uptake and outgassing are shown in the PR configuration, while the largest are seen in the ER configuration. In winter, the CO2 uptake is reduced by 0.2 to 0.8 mol C m−2 yr−1 across the entire NWES. The strongest reduction is shown in the central and outer shelf areas, as well as the Norwegian Trench. During the spring and summer months, the CO2 uptake is significantly stronger, with the most pronounced increases in the central North Sea and the Norwegian Trench. The average increase is 0.1 to 0.7 mol C m−2 yr−1 in spring and 0.4 to 1.3 mol C m−2 yr−1 in summer, resulting in a shift from net outgassing to net uptake in summer. In autumn, the gradient between uptake in the northern and outgassing in the southern parts is enhanced, with an average decrease in uptake or increase in outgassing of up to 0.2 mol C m−2 yr−1. This is consistent with the increased autotrophy in spring and summer and increased heterotrophy during autumn and winter. These shifts in the seasonal air–sea CO2 exchange indicate that the additional drawdown of DIC through increased carbon fixation enhances CO2 uptake and decreases outgassing during the productive season, while additional respiration reduces uptake and promotes outgassing in autumn and winter. This implies that the air–sea CO2 flux becomes less temperature controlled and more biologically controlled. This indication is supported by the intensified seasonal carbon fixation and respiration (Figs. 9 and S15–S17), as well as the increased vertical gradient in NCP (Fig. 10). In the absence of biological carbon fixation, seasonal temperature variations would lead to a high CO2 uptake due to the low temperatures in winter and a lower uptake or higher outgassing due to high temperatures in summer. By depleting the surface waters of DIC during the productive season, the biological pump drives the seasonality in the opposite direction. Thus, with the increased carbon fixation in the variable stoichiometry configurations, the CO2 uptake shifts towards the productive season.
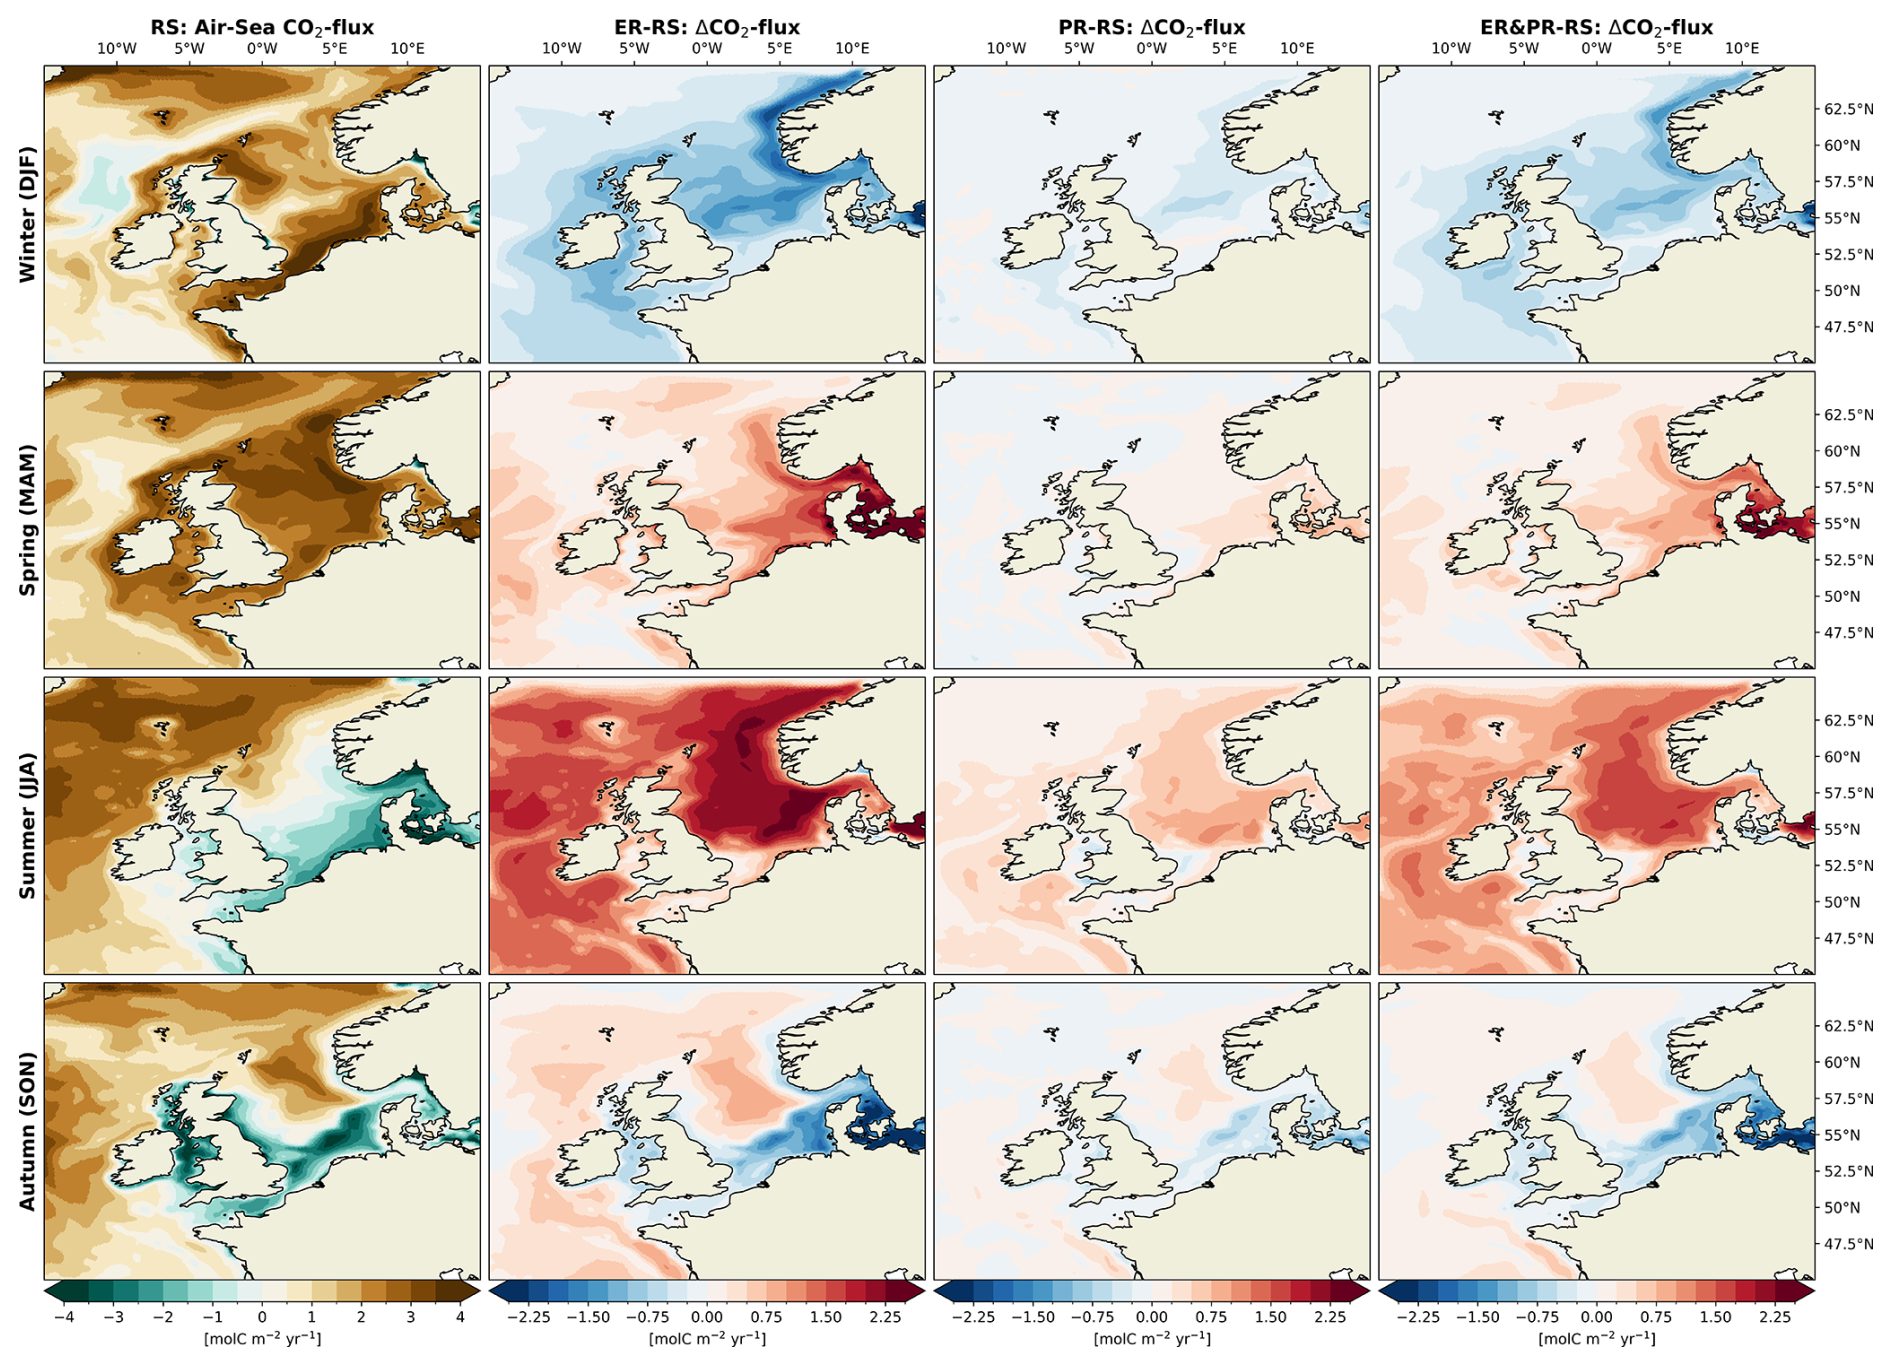
Figure 12Seasonal mean air–sea CO2 exchange for the RS configuration and differences for the ER, PR, and ER&PR configurations over the simulation period of 2000–2010. The CO2 exchange for each configuration is shown in the Supplement (Fig. S18).
3.2 Organic and inorganic carbon concentrations
The seasonal variations in organic and inorganic carbon concentrations are regulated by the balance between biological carbon fixation and respiration. Consequently, the intensification of the annual and seasonal OM cycling as described above has implications for the transformation and transport of both organic and inorganic carbon. In turn, these carbon pools determine carbon fluxes, which are of relevance for the regional carbon budget. Therefore, we assess the changes in organic and inorganic carbon contents in the context of the enhanced OM cycling and identify further potential consequences for marine carbon cycling in the NWES. Our analysis focuses on changes in the surface DIC and pCO2, which are relevant for the air–sea CO2 exchange, as well as seasonal vertical gradients in DIC, which influence cross-shelf exchanges of inorganic carbon. With regard to organic carbon contents, we assess the seasonal vertical distribution of both DOC and POC, which represent how long inorganic carbon uptake is seasonally retained in OM and control cross-shelf transports and sedimentation of organic carbon.
3.2.1 Surface inorganic carbon seasonality
Biogeochemical models constrained to elemental Redfield ratios tend to underestimate the seasonal uptake of DIC by biological carbon fixation in surface waters (Bozec et al., 2006; Kähler and Koeve, 2001; Prowe et al., 2009). Here, the RS reference configuration demonstrates this underestimation of seasonal variability in surface DIC concentrations and ΔpCO2 (Fig. 13). While ΔpCO2 in winter agrees well with observational estimates, the seasonal minimum between April and October is strongly underestimated in the RS configuration for both DIC and ΔpCO2.
The variable stoichiometry configurations demonstrate a higher reduction in surface DIC concentrations during summer in proportion to the increased seasonal carbon fixation described above. The decreased summer ΔpCO2 relative to the RS configuration increases the potential for CO2 uptake in summer, which is consistent with the abovementioned shift from the maximum CO2 uptake in winter and spring towards spring and summer, connected to a more pronounced biological contribution. The additional DIC uptake leads to a reduction in the RMSD of ΔpCO2 between simulated and observed monthly means, dropping from 57, 21, 41, and 66 µatm in the NT, NNS, CNS, and SNS regions to 37–50, 16–19, 21–32, and 47–58 µatm, respectively. This improvement is most significant in the ER configuration and least significant in the PR configuration. In contrast, the RMSD for DIC shows smaller, less consistent differences. This is likely due to a small general overestimation of surface DIC concentrations and an overestimation of DIC during the second half of the year.
Although reproducing the observed OM stoichiometry improves the representation of summer minima in ΔpCO2 and DIC, even with variable stoichiometry, simulated DIC increases more rapidly than observed levels do in the second half of the year. This DIC overestimation can be attributed to a lack of organic carbon retention, such that respiration exceeds production too early, thereby releasing DIC back into the water column. One factor limiting the retention of organic carbon may be the missing representation of higher trophic levels including pelagic fish stocks and macrobenthos. Incorporating these and explicitly representing the microbial loop instead of solely relying on bulk remineralization rates for DOM and POM may further improve the model's ability to capture the seasonal dynamics of inorganic carbon, particularly in late summer and autumn.
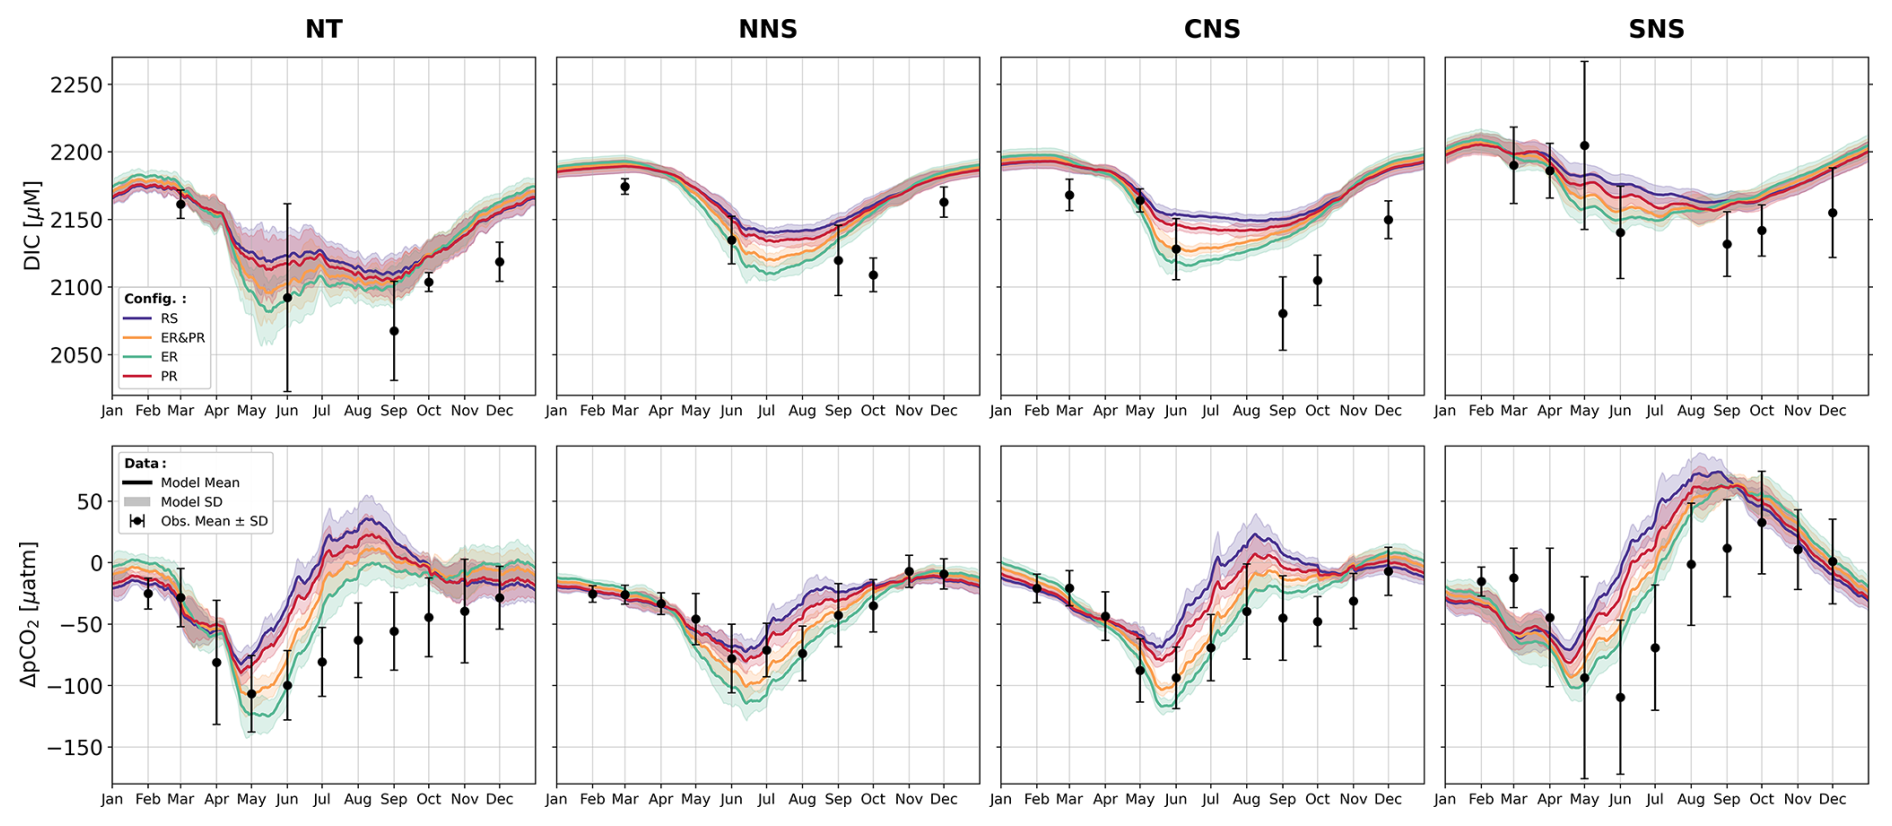
Figure 13Simulated daily 11-year mean of horizontal means and standard deviations of DIC concentrations and differences between simulated surface pCO2 and prescribed atmospheric concentrations from the Mace Head measurement station (Lan et al., 2023) for all four model configurations. The error bars indicate monthly means and standard deviations of corresponding GLODAP and SOCAT observations for DIC and pCO2. The conversion from simulated CO2 concentrations and observed fCO2 to pCO2 was conducted in accordance with the methodology described above for the carbonate system validation. For the derivation of the ΔpCO2 from observed pCO2, the same monthly atmospheric concentrations were subtracted as for the simulated ΔpCO2. Both variables are shown for the Norwegian Trench (NT) as well as the northern (NNS), central (CNS), and southern North Sea (SNS).
3.2.2 Seasonal vertical DIC gradient
In the deep and seasonally stratified central and northern parts of the North Sea, the separation of OM production in the euphotic zone and respiration in deeper layers leads to a seasonal vertical DIC gradient (Thomas et al., 2004). The high productivity in spring and summer reduce DIC in the surface waters, exporting OM to the sub-surface layer, where subsequent respiration increases DIC concentrations at depths. Vertical mixing in autumn and winter then reduces the gradient and finally restores the nearly homogeneous vertical distribution in winter. This qualitative pattern is reproduced in the RS reference configuration (Fig. 14) but with an underestimated seasonal inorganic carbon drawdown. Because observations are limited and represent only parts of each season, often covering a single month, direct comparisons of seasonally averaged gradients are of limited value. Therefore, we focus here on the representation of the maximum DIC drawdown in summer and the implications of variable stoichiometry for DIC drawdown to sub-surface layers.
In both sub-regions, the vertical DIC gradient in summer is more closely reproduced in the variable stoichiometry configurations, with the closest representation in the ER configuration. Compared to the RS configuration, the additional carbon fixation leads to a reduction in the vertically integrated DIC content in the upper 50 m during summer by 122 to 564 mmol m−2 in the NT and 169 to 820 mmol m−2 in the combined NNS and CNS sub-regions. Conversely, in autumn and winter, bottom DIC concentrations are significantly higher compared to those in the RS configuration due to additional respiration. This increase in bottom DIC concentrations is more pronounced in the NT region. The vertically integrated autumn DIC concentrations below 50 m in the NT show a large increase of 1367 to 3855 mmol m−2 compared to the reference configuration. In the NNS and CNS regions, this increase only ranges from 176 to 384 mmol m−2. The much larger increase in bottom DIC concentrations in the NT indicates additional external sources of DIC to this region from additional downwelling of organic carbon. An intensification of the vertical DIC gradient overall suggests a higher biological drawdown of DIC, with the potential for higher DIC concentrations in waters exported to the North Atlantic.
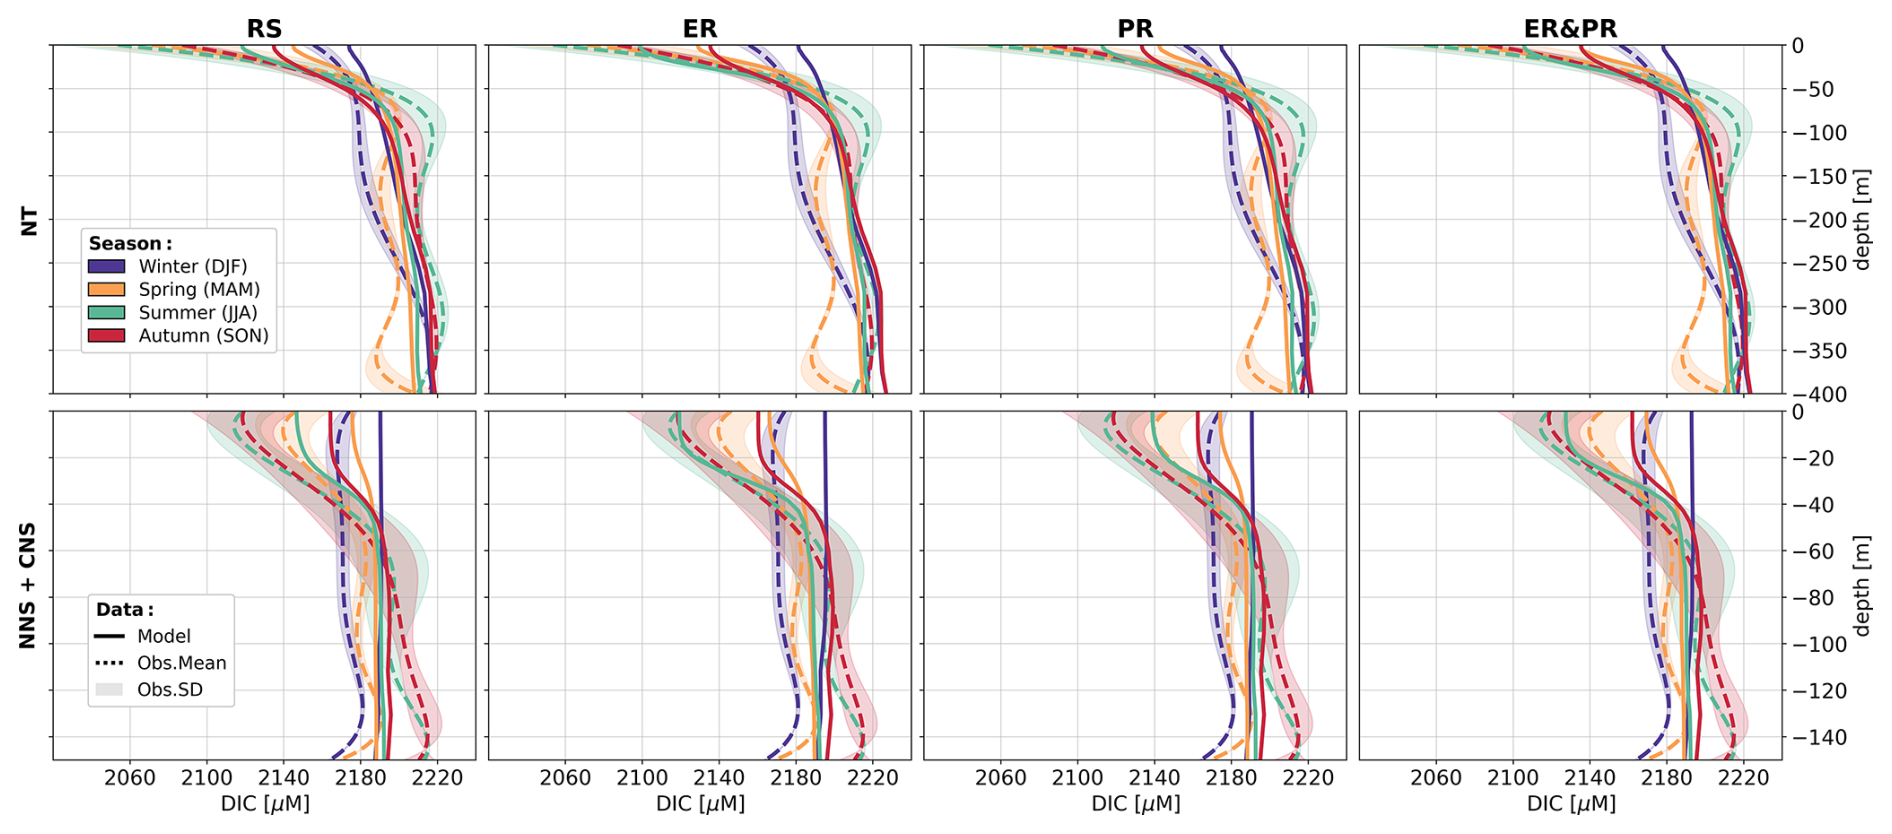
Figure 14Simulated and observed horizontally averaged seasonal DIC gradients in the Norwegian Trench (NT) and the combined northern (NNS) and central North Sea (CNS) sub-regions for all four model configurations. Solid lines represent the simulated concentrations, while dashed lines and the shaded area indicate observed concentrations and their corresponding standard deviation. The observed vertical profiles were generated by firstly calculating the mean concentrations and standard deviation within every meter of depth and, secondly, generating a fifth-order polynomial fit for the vertical profiles of means and standard deviations using numpy.polyfit for each season. The polynomial coefficients are listed in the Supplement (Table S16).
3.2.3 Seasonal organic carbon production
The enhanced seasonal carbon fixation in the variable stoichiometry configurations also results in an increased seasonal accumulation of DOC in both the well-mixed and seasonally stratified regions, with the greatest accumulation occurring in the euphotic zone (Fig. 15). For the purpose of comparison, we present the means and ranges of derived (semi-)labile DOC (LDOC) concentrations in surface and bottom waters in August from 2 consecutive years. These observational ranges demonstrate considerable interannual variability. The ranges from both years demonstrate that the simulated DOC concentrations are a reasonable representation of concentrations during the summer months. The RS stoichiometry is situated at the lower end of the estimated range, while the ER configuration is situated at the upper end.
In the combined NNS and CNS region, the water-column-integrated DOC content during summer exhibits a 68 % to 123 % increase in the ER&PR and ER configurations relative to the reference simulation. In contrast, the PR configuration exhibits a small decrease of 1.2 % in the total summer DOC content, with concentrations increasing in the surface layer but decreasing in the sub-surface layer. A consistent increase in the entire water column is observed in the variable stoichiometry configurations, resulting in a 4 %, 48 %, and 82 % increase in the vertically integrated DOC content in the SNS during summer for the PR, ER&PR, and ER configurations, respectively. The surface DOC content approximately doubles in the SNS and triples in the NNS and CNS during all seasons for the ER configuration, with a maximum increase of approximately 25 % in the PR and an intermediate increase in the combined configuration. The increased DOC concentrations are likely to contribute to carbon export from surface waters through downwelling transport. By retaining more organic carbon in the water column that can be redistributed and respired elsewhere, this likely contributes to the greater depletion of surface DIC concentrations and hence higher CO2 uptake.
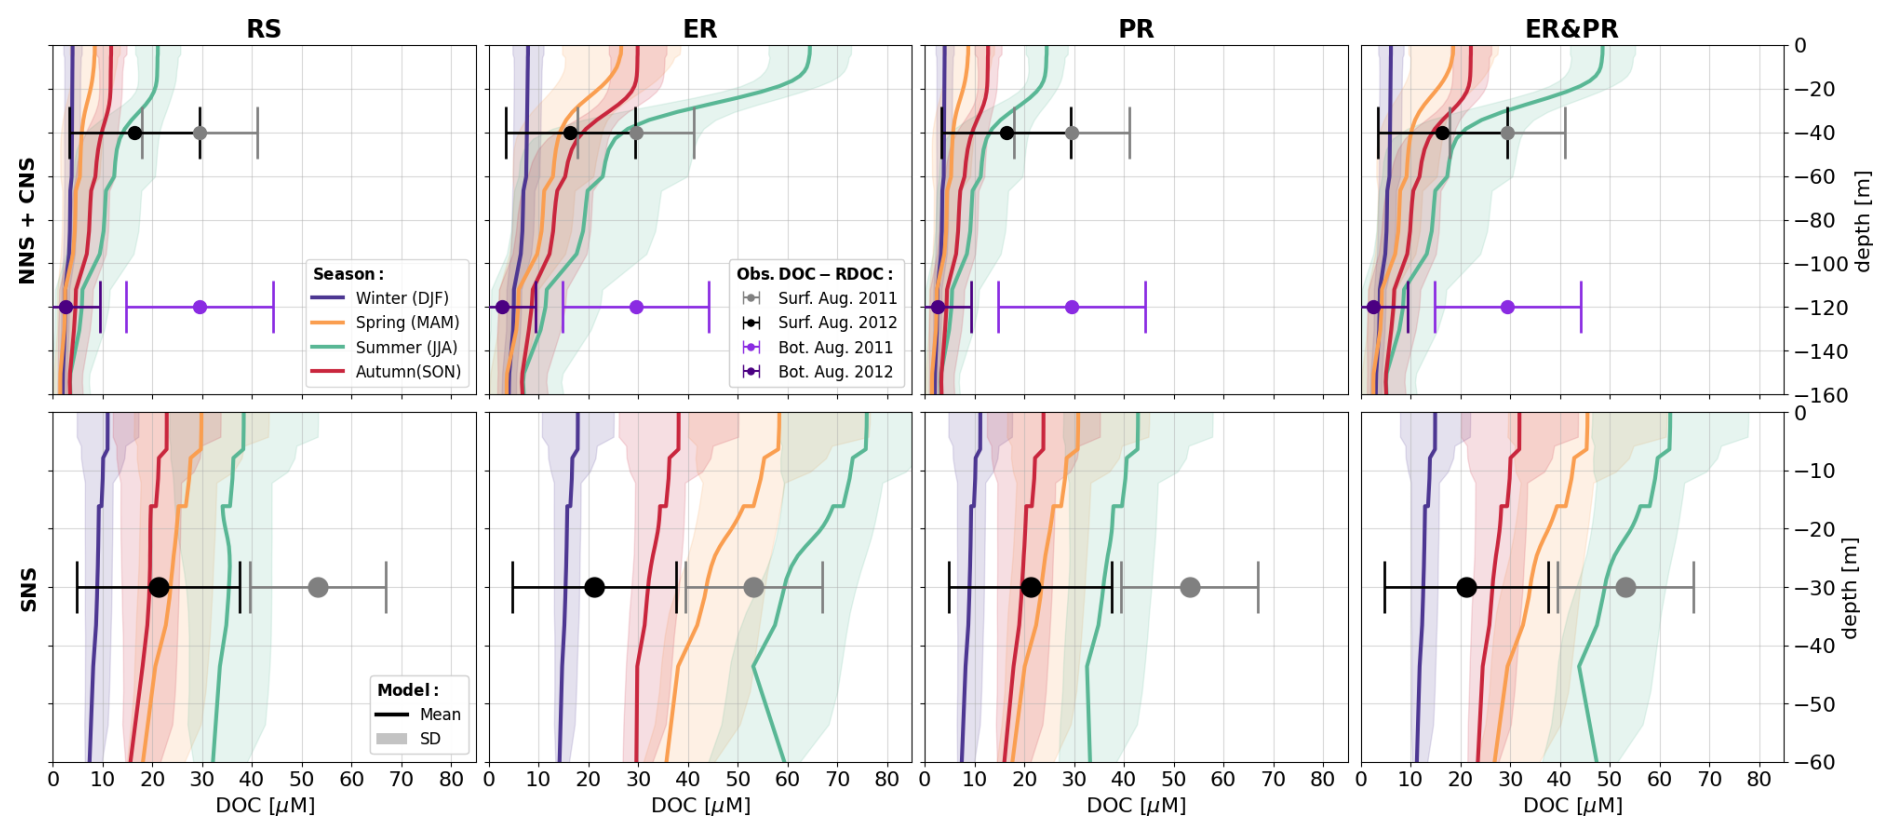
Figure 15Vertical distribution of the horizontally averaged seasonal mean (solid) and standard deviation (shaded) of DOC concentrations for all four model configurations over the simulation period from 2000 to 2010 in the southern North Sea (SNS) and over the combined northern (NNS) and central North Sea (CNS) sub-regions. The error bars indicate derived estimates of mean LDOC concentrations and observed ranges. These estimates were derived from observed seasonal bulk DOC concentrations in the seasonally stratified and well-mixed regions of the North Sea from Chaichana et al. (2019) by subtracting an average surface ocean refractory or recalcitrant DOC (RDOC) concentration of 44.3 µM from three observational estimates (Aminot and Kérouel, 2004; Hopkinson and Vallino, 2005; Liang et al., 2023).
The enhanced seasonal carbon fixation in the variable stoichiometry configurations further increases the POC content during spring and summer (Fig. 16). Simulated summer POC concentrations are consistent with observations across all configurations in the CNS. In the SNS, the reference configuration underestimates the mean POC concentrations, which are more closely represented in all variable stoichiometry configurations. The vertically integrated POC content is 22 % to 31 % higher in the CNS, with the largest increase in the PR and the smallest increase in the ER configuration. In the SNS, increases are larger and more consistent across configurations, with a range of 55 % to 66 %. The increases are smaller in spring and autumn and negligible in winter. The overall larger POC concentrations in the variable stoichiometry configurations suggest a higher availability of organic carbon for lateral and vertical transports, as well as sedimentation of POC. An increased export from surface waters and subsequent respiration of POC likely contribute to the abovementioned higher drawdown of DIC and the resulting increase in CO2 uptake. The comparable increase in POC concentrations for the variable stoichiometry configurations with a varying increase in CO2 uptake indicates that both POC and DOC production contribute to the drawdown of DIC, which is relevant for the enhanced CO2 uptake. This also corroborates the high additional accumulation of DIC from downwelling into and subsequent respiration of organic carbon from the Norwegian Trench.
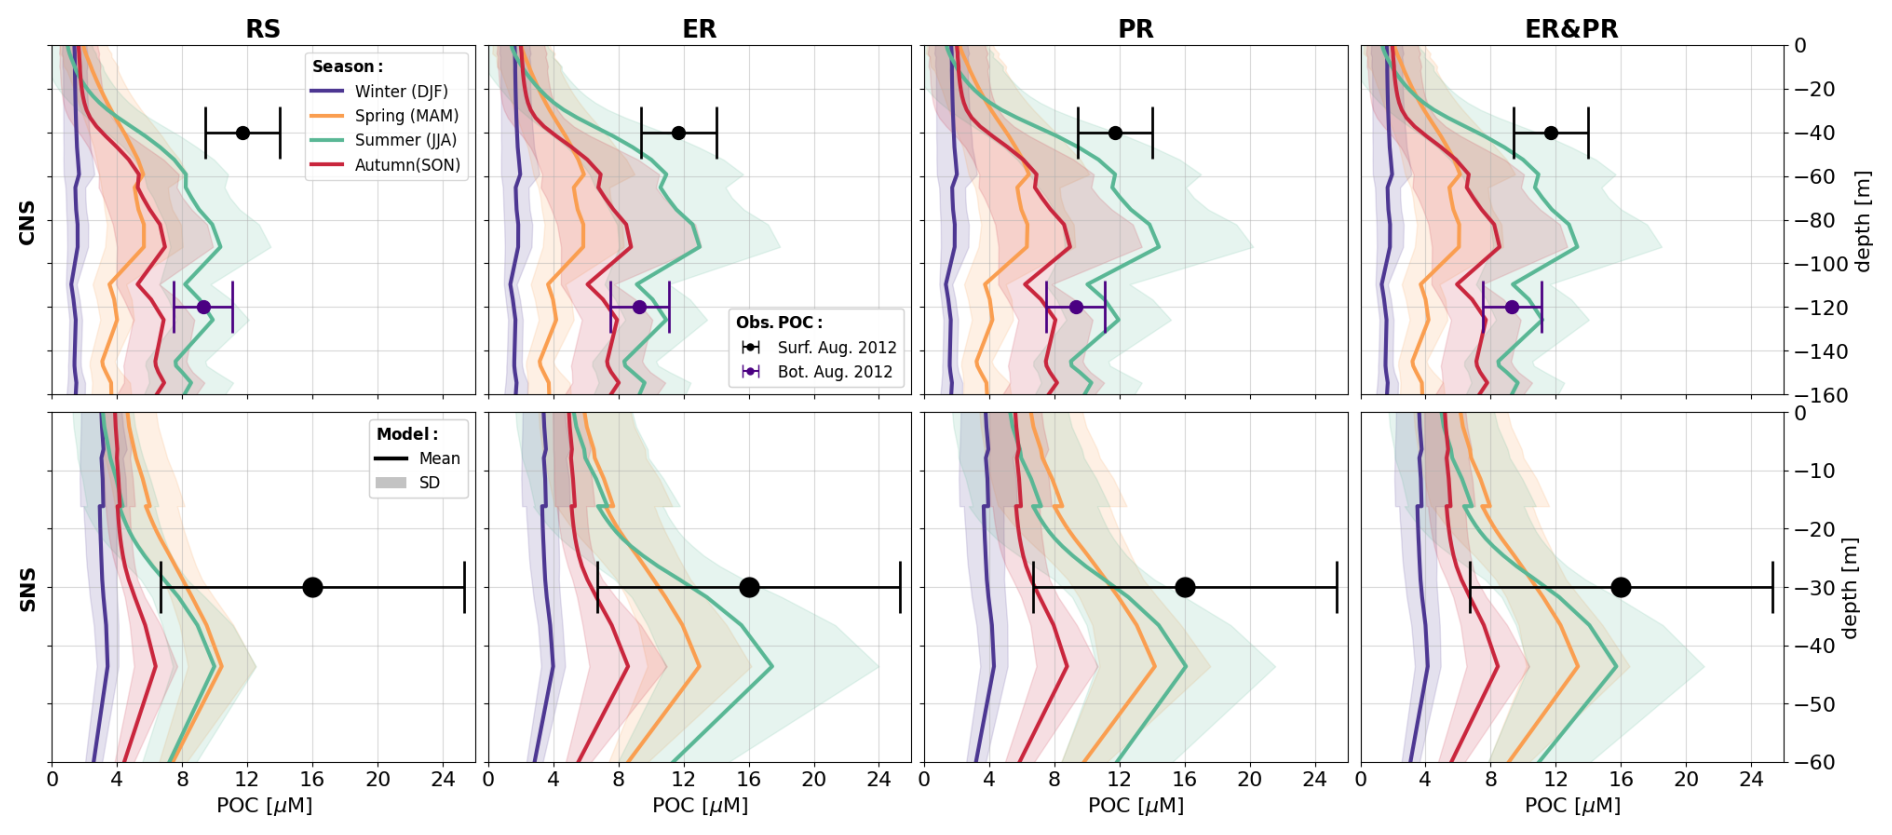
Figure 16Vertical distribution of horizontally averaged seasonal mean and standard deviation of POC concentrations in the central (CNS) and southern North Sea (SNS) for all four model configurations. The error bars indicate estimated mean POC concentrations and observed ranges from Chaichana et al. (2019).
For the first time, this study provides a comprehensive modeling assessment of how observed variations in the stoichiometry of OM impact model-based carbon cycle estimates in the NWES compared to OM cycling at fixed Redfield ratios. We focus on changes in OM cycling in terms of carbon fixation, respiration, NCP, the resulting export of DIC to sub-surface layers, and its consequences for the air–sea CO2 exchange.
By implementing two pathways for variable stoichiometry in the production and respiration of OM (Fig. 3), we demonstrate that variable stoichiometry consistently results in an increased oceanic CO2 uptake, with a range of 10 %–33 % in the North Sea and 9 %–31 % in the entire NWES. This additional CO2 uptake is driven by an enhanced biological drawdown of CO2 through intensified surface production and sub-surface respiration of organic carbon (Figs. 7–10). With the increase in OM cycling, both the North Sea and the entire NWES become more net heterotrophic (Figs. 7–9), with an increased NCP in net autotrophic regions and a decreased NCP in net heterotrophic regions (Fig. 9). This amplifies the pre-existing gradient in NCP, especially along the border between the central North Sea and the Norwegian Trench. Further, the vertical gradient between the net autotrophic surface layer and net heterotrophic sub-surface layer increases, leading to increased DIC uptake at the surface and increased DIC release at depth (Fig. 10). Seasonally, there is an increase in net autotrophy during spring and early summer, while net heterotrophy increases during the rest of the year. This increase in the seasonal amplitude in NCP appears without a notable shift in the timing of the transition from net autotrophy to net heterotrophy. The resulting changes in both organic and inorganic carbon concentrations (Figs. 13–16) have implications for marine carbon cycling in the NWES.
Firstly, the reduction in surface DIC concentrations and hence in ΔpCO2 enhances the annual net CO2 uptake (Figs. 7 and 11) and additionally shifts the seasonality to be more biologically controlled and therefore less dominated by temperature. This is expressed by an increased CO2 uptake in spring and summer and a reduced CO2 uptake in winter. Furthermore, there is a stronger north–south gradient, with the maximum uptake in the stratified northern regions where export of organic carbon to deeper layers is most efficient (Fig. 12). Secondly, a higher seasonal accumulation of both DOC and POC indicates greater availability of OM contents for lateral transport, the export from surface waters through sinking and downwelling, and the sedimentation of POC (Figs. 13–16). Since comparable simulated POC concentrations with different DOC concentrations show large differences in air–sea CO2 exchange, these results suggest that both additional POC and DOC production and the resulting carbon export from surface waters contribute significantly to seasonal DIC reduction in surface waters.
In particular, an increase in sub-surface DIC in seasonally stratified areas (Fig. 14) in combination with higher availability of organic carbon (Figs. 15–16) and a stronger vertical (Fig. 10) and lateral gradient in NCP across the slope of the Norwegian Trench (Fig. 9) indicate an intensification of the shelf carbon pump mechanism. This is likely due to additional degradation of OM in the Norwegian Trench imported from the North Atlantic and other parts of the North Sea, resulting in DIC enrichment of deeper shelf waters, which are subsequently exported to the North Atlantic. The increased export of DIC to the open ocean and potentially to sediments is likely responsible for the net uptake of atmospheric CO2.
The reason for the increased productivity varies between the two mechanisms. The preferential remineralization of organic nitrogen and phosphorus increases production through higher nutrient availability, while the extracellular release of DOM allows for additional carbon fixation beyond nutrient limitation, which additionally reduces surface nutrient concentrations (Supplement Fig. S19). For a comparable range in OM stoichiometry, which reflects the observed variations in the composition of LDOM and POM (Figs. 4 and 5), the impact described is of a higher amplitude for the extracellular release of DOM than for the preferential remineralization of organic nitrogen and phosphorus across all of these carbon fluxes (Fig. 7). As expected, the combined configuration, with a reduced contribution of each mechanism, consistently reproduces intermediate changes between the two individual configurations. While the extracellular release of DOM more effectively accounts for the underestimated reduction in DIC in surface waters, the preferential remineralization better reflects the vertical increase in C:N and C:P ratios with depth and, as such, age of the material. Since both mechanisms have been suggested by observational and experimental studies and reproduce relevant features of OM cycling, the consideration of variable stoichiometry in both production and decomposition of OM is likely necessary for an adequate model representation of marine carbon cycling.
While previous studies have considered carbon fixation beyond elemental Redfield ratios in the North Sea and Baltic Sea (Neumann et al., 2022; Prowe et al., 2009), here we explicitly quantify the impact on regional carbon cycling across the NWES and assess the individual and combined contributions of two contributing mechanisms. Our findings regarding the regional impact on marine carbon cycling are consistent with previous global Earth system model experiments considering the preferential remineralization of organic nitrogen and phosphorus, as well as with proposed consequences of higher C:N and C:P ratios in OM from observational studies. In particular, our results regionally support the suggestion that increased carbon content relative to elemental Redfield ratios would imply higher export production, an associated drawdown of inorganic carbon, and increased availability of organic carbon for lateral carbon transport (Hopkinson and Vallino, 2005; Letscher and Moore, 2015; Tanioka et al., 2021; Zakem and Levine, 2019). Beyond the large-scale effects, we highlight how the regional carbon export mechanism determines the response to variable OM stoichiometry in terms of spatial distribution and seasonality and, as such, needs to be considered regionally as well as globally.
Given the significant impact on major carbon fluxes, we show that estimates of regional carbon budgets are sensitive to a reasonable representation of OM stoichiometry. These findings not only underscore the importance of the elemental composition of OM in regional carbon cycling but also suggest that global carbon budget models may need to be re-evaluated to account for its accurate representation. The pronounced seasonal shifts in CO2 uptake driven by variable OM stoichiometry highlight the need for its consideration in carbon modeling in temperate shelf seas globally.
Future research efforts should focus on identifying the contribution of different processes to the observed OM stoichiometry and their spatiotemporal variability. Other effects on OM composition that are beyond the scope of this study include the quality of imported OM from land (Painter et al., 2018), the effect of variable stoichiometry in prey on higher trophic levels (Schindler and Eby, 1997), and pathways for variable stoichiometry in phyto- and zooplankton (Moreno and Martiny, 2018). The latter pathways include the direct uptake of DON and DOP by phytoplankton (Fitzsimons et al., 2020), as well as variable ratios in zooplankton grazing and excretion (Anderson et al., 2005; Elser and Urabe, 1999). Another important factor to consider is the role of community composition in shaping ecosystem stoichiometry (Kwiatkowski et al., 2018). All of these contributions may be subject to regional and interannual variability, as well as long-term trends imposed by climate change (Sardans et al., 2012). Additionally, spatiotemporal variations in ecosystem processes, such as the partitioning of new detritus into POM and DOM, grazing rates, and temperature-dependent remineralization rates, could introduce regional and interannual variability not explicitly accounted for in this study. While these processes contribute to organic matter cycling and could influence our findings, the model's accurate representation of OM concentrations and stoichiometry ensures that the broader conclusions regarding regional carbon fluxes remain robust.
While this study offers valuable insights into the drawdown of inorganic carbon and explores changes in both organic and inorganic carbon concentrations, it does not fully quantify the impact on the carbon budget of the NWES. Specifically, the study has not yet established key fluxes explicitly, such as lateral cross-shelf transports of dissolved organic carbon (DOC) and particulate organic carbon (POC), vertical POC sedimentation rates, and the export of dissolved inorganic carbon (DIC) to the open ocean. Future research should aim to quantify these fluxes to provide a more comprehensive understanding of the impact on the full carbon budget of the NWES. Setting these impacts in the context of multiple anthropogenic stressors including climate change impacts will be crucial for refining carbon budget estimates and predicting long-term carbon sequestration in this region and their significance for global carbon cycling.
This study highlights the significant impact of the observed variations in stoichiometry of OM on carbon cycling in the NWES. By incorporating two pathways for variable OM stoichiometry into the regional 3D physical–biogeochemical modeling system SCHISM-ECOSMO-CO2, we reproduce the observed stoichiometry of LDOM and POM. In comparison to fixed Redfield stoichiometry, our results show an enhanced biological drawdown of DIC and a resulting increase in the oceanic CO2 uptake. This additional CO2 uptake is driven by an intensification of OM cycling and the resulting increase in seasonal, lateral, and vertical NCP gradients, which enhances the seasonal DIC gradient. With an increased biological contribution to the seasonality of pCO2, CO2 uptake shifts from winter towards spring and summer. This is particularly evident in the deep and seasonally stratified regions of the North Sea. Despite the difference in the pathways for variable stoichiometry in the production and respiration of OM, the model response shows a consistent impact on OM cycling and the resulting air–sea CO2 exchange, with noticeable differences only in their magnitude. To determine the amplitude of these changes, a deeper understanding of the individual process contributions to variable stoichiometry is required.
Our findings underscore the limitations of using fixed Redfield stoichiometry for simulating OM cycling, revealing that the observed variations in OM stoichiometry have a profound influence on marine carbon cycling in the NWES. Incorporating variable OM stoichiometry into biogeochemical models will be essential for an accurate representation of carbon cycling, regional carbon budgets, and their spatiotemporal variations. This will be a crucial aspect when evaluating the impact of multiple anthropogenic stressors on the marine ecosystem and the role of OM stoichiometry in future carbon budgets under changing environmental conditions. As the results are largely determined by the pre-existing regional physical controls and the resulting structure of biogeochemical cycles, we emphasize that regional assessments are key to understanding the role of OM stoichiometry in regional carbon cycling and should be incorporated into the representation of the coastal ocean in global modeling studies.
All datasets used to generate the figures and results in this study are openly accessible via Zenodo at https://doi.org/10.5281/zenodo.14916290 (Demir, 2025). The code used for the model simulations and data analysis is available from the corresponding author upon reasonable request.
The supplement related to this article is available online at https://doi.org/10.5194/bg-22-2569-2025-supplement.
KTD was responsible for the conceptualization of the study, while the methodology was developed collaboratively by KTD, MM, JK, and CSc. Software development was undertaken by KTD, JK, FL, and CSt, with the validation carried out by KTD, JK, and FL. KTD performed the formal analysis, and the investigation was conducted by KTD, MM, CSc, and HT. MM and CSc provided the necessary resources, and data curation was managed by KTD. The original draft of the manuscript was prepared by KTD, and subsequent writing, review, and editing were contributed by KTD, MM, JK, FL, UD, CSt, HT, and CSc. KTD also took responsibility for visualization. Supervision of the project was provided by MM, UD, HT, and CSc. Finally, CSc handled the project administration and funding acquisition.
The contact author has declared that none of the authors has any competing interests.
Publisher's note: Copernicus Publications remains neutral with regard to jurisdictional claims made in the text, published maps, institutional affiliations, or any other geographical representation in this paper. While Copernicus Publications makes every effort to include appropriate place names, the final responsibility lies with the authors.
Computational resources for this work were made available by the German Climate Computing Center (DKRZ) through support from the German Federal Ministry of Education and Research (BMBF). We would like to thank ICDC, CEN, and the University of Hamburg for data support. This study has been conducted using data from the Global Ocean Data Analysis Project (GLODAP), the Surface Ocean CO2 Atlas (SOCAT), and the International Council for the Exploration of the Sea (ICES). The research was funded by the Deutsche Forschungsgemeinschaft (DFG, German Research Foundation) under Germany's Excellence Strategy – EXC 2037 “CLICCS – Climate, Climatic Change, and Society”, project number 390683824 and contributes to the CLICCS sub-project A5, The Land–Ocean Transition Zone. Feifei Liu received funding from the BMBF project RETAKE (grant no. 03F0895C).
This research has been supported by the Deutsche Forschungsgemeinschaft (grant no. 390683824) and the German Federal Ministry of Education and Research (BMBF) (grant no. 03F0895C).
The article processing charges for this open-access publication were covered by the Helmholtz-Zentrum Hereon.
This paper was edited by Liuqian Yu and reviewed by two anonymous referees.
Aminot, A. and Kérouel, R.: Dissolved organic carbon, nitrogen and phosphorus in the N-E Atlantic and the N-W Mediterranean with particular reference to non-refractory fractions and degradation, Deep-Sea Res. Pt. I, 51, 1975–1999, https://doi.org/10.1016/j.dsr.2004.07.016, 2004.
Anderson, T. R. and Pondaven, P.: Non-Redfield carbon and nitrogen cycling in the Sargasso Sea: Pelagic imbalances and export flux, Deep-Sea Res. Pt. I, 50, 573–591, https://doi.org/10.1016/S0967-0637(03)00034-7, 2003.
Anderson, T. R., Hessen, D. O., Elser, J. J., and Urabe, J.: Metabolic Stoichiometry and the Fate of Excess Carbon and Nutrients in Consumers, Am. Nat., 165, 1–15, https://doi.org/10.2307/3473193, 2005.
Aricò, S., Watson, A. J., Wanninkhof, R., Thomas, H., Shutler, J. D., Schuster, U., Schoo, K. L., Sanders, R., Sabine, C., Robinson, C., Monteiro, P., McKinley, G. A., Jiao, N., Ishii, M., Isensee, K., Gruber, N., Dai, M., Chai, F., Cotrim da Cunha, L., Boyd, P. W., Bakker, D. C. E., Arrieta, J. M., and Lauvset, S. K.: Integrated Ocean Carbon Research: A Summary of Ocean Carbon Research, and Vision of Coordinated Ocean Carbon Research and Observations for the Next Decade, UNESCO, https://unesdoc.unesco.org/ark:/48223/pf0000376708 (last access: 14 November 2023), 2021.
Artioli, Y., Blackford, J. C., Butenschön, M., Holt, J. T., Wakelin, S. L., Thomas, H., Borges, A. V., and Allen, J. I.: The carbonate system in the North Sea: Sensitivity and model validation, J. Marine Syst., 102–104, 1–13, https://doi.org/10.1016/j.jmarsys.2012.04.006, 2012.
Artioli, Y., Blackford, J. C., Nondal, G., Bellerby, R. G. J., Wakelin, S. L., Holt, J. T., Butenschön, M., and Allen, J. I.: Heterogeneity of impacts of high CO2 on the North Western European Shelf, Biogeosciences, 11, 601–612, https://doi.org/10.5194/bg-11-601-2014, 2014.
Barrón, C. and Duarte, C. M.: Dissolved organic carbon pools and export from the coastal ocean, Global Biogeochem. Cy., 29, 1725–1738, https://doi.org/10.1002/2014GB005056, 2015.
Bauer, J., Williams, P., and Druffel, E.: 14C activity of dissolved organic carbon fractions in the North Central Pacific and Sargasso Sea, Nature, 357, 667–670, https://doi.org/10.1038/357667a0, 1992.
Bauer, J. E., Cai, W.-J., Raymond, P. A., Bianchi, T. S., Hopkinson, C. S., and Regnier, P. A. G.: The changing carbon cycle of the coastal ocean, Nature, 504, 61–70, https://doi.org/10.1038/nature12857, 2013.
Blackford, J., Artioli, Y., Clark, J., and De Mora, L.: Monitoring of offshore geological carbon storage integrity: Implications of natural variability in the marine system and the assessment of anomaly detection criteria, Int. J. Greenh. Gas Con., 64, 99–112, https://doi.org/10.1016/j.ijggc.2017.06.020, 2017.
Blackford, J. C. and Gilbert, F. J.: pH variability and CO2 induced acidification in the North Sea, J. Marine Syst., 64, 229–241, https://doi.org/10.1016/j.jmarsys.2006.03.016, 2007.
Børsheim, K. Y., Vadstein, O., Myklestad, S. M., Reinertsen, H., Kirkvold, S., and Olsen, Y.: Photosynthetic algal production, accumulation and release of phytoplankton storage carbohydrates and bacterial production in a gradient in daily nutrient supply, J. Plankton Res., 27, 743–755, https://doi.org/10.1093/plankt/fbi047, 2005.
Bozec, Y., Thomas, H., Elkalay, K., and de Baar, H. J. W.: The continental shelf pump for CO2 in the North Sea – evidence from summer observation, Mar. Chem., 93, 131–147, https://doi.org/10.1016/j.marchem.2004.07.006, 2005.
Bozec, Y., Thomas, H., Schiettecatte, L.-S., Borges, A. V., Elkalay, K., and De Baar, H. J. W.: Assessment of the processes controlling the seasonal variations of dissolved inorganic carbon in the North Sea, Limnol. Oceanogr., 51, 2746–2762, https://doi.org/10.4319/lo.2006.51.6.2746, 2006.
Broullón, D., Pérez, F. F., Velo, A., Hoppema, M., Olsen, A., Takahashi, T., Key, R. M., Tanhua, T., González-Dávila, M., Jeansson, E., Kozyr, A., and van Heuven, S. M. A. C.: A global monthly climatology of total alkalinity: a neural network approach, Earth Syst. Sci. Data, 11, 1109–1127, https://doi.org/10.5194/essd-11-1109-2019, 2019.
Broullón, D., Pérez, F. F., Velo, A., Hoppema, M., Olsen, A., Takahashi, T., Key, R. M., Tanhua, T., Santana-Casiano, J. M., and Kozyr, A.: A global monthly climatology of oceanic total dissolved inorganic carbon: a neural network approach, Earth Syst. Sci. Data, 12, 1725–1743, https://doi.org/10.5194/essd-12-1725-2020, 2020.
Bruggeman, J. and Bolding, K.: A general framework for aquatic biogeochemical models, Environ. Modell. Softw., 61, 249–265, https://doi.org/10.1016/j.envsoft.2014.04.002, 2014.
Butenschön, M., Clark, J., Aldridge, J. N., Allen, J. I., Artioli, Y., Blackford, J., Bruggeman, J., Cazenave, P., Ciavatta, S., Kay, S., Lessin, G., van Leeuwen, S., van der Molen, J., de Mora, L., Polimene, L., Sailley, S., Stephens, N., and Torres, R.: ERSEM 15.06: a generic model for marine biogeochemistry and the ecosystem dynamics of the lower trophic levels, Geosci. Model Dev., 9, 1293–1339, https://doi.org/10.5194/gmd-9-1293-2016, 2016.
Cai, R. and Jiao, N.: Recalcitrant dissolved organic matter and its major production and removal processes in the ocean, Deep-Sea Res. Pt. I, 191, 103922, https://doi.org/10.1016/j.dsr.2022.103922, 2023.
Canuel, E. A., Cammer, S. S., McIntosh, H. A., and Pondell, C. R.: Climate change impacts on the organic carbon cycle at the land-ocean interface, Annu. Rev. Earth Pl. Sc., 40, 685–711, https://doi.org/10.1146/annurev-earth-042711-105511, 2012.
Carlson, C. A. and Hansell, D. A.: Chapter 3 – DOM Sources, Sinks, Reactivity, and Budgets, in: Biogeochemistry of Marine Dissolved Organic Matter (Second Edition), edited by: Hansell, D. A. and Carlson, C. A., Academic Press, Boston, 65–126, https://doi.org/10.1016/B978-0-12-405940-5.00003-0, 2015.
Chaichana, S., Jickells, T., and Johnson, M.: Interannual variability in the summer dissolved organic matter inventory of the North Sea: implications for the continental shelf pump, Biogeosciences, 16, 1073–1096, https://doi.org/10.5194/bg-16-1073-2019, 2019.
Clark, L. L., Ingall, E. D., and Benner, R.: Marine phosphorus is selectively remineralized, Nature, 393, 426–426, https://doi.org/10.1038/30881, 1998.
Daewel, U. and Schrum, C.: Simulating long-term dynamics of the coupled North Sea and Baltic Sea ecosystem with ECOSMO II: Model description and validation, J. Marine Syst., 119–120, 30–49, https://doi.org/10.1016/j.jmarsys.2013.03.008, 2013.
Dai, M., Su, J., Zhao, Y., Hofmann, E. E., Cao, Z., Cai, W.-J., Gan, J., Lacroix, F., Laruelle, G. G., Meng, F., Müller, J. D., Regnier, P. A. G., Wang, G., and Wang, Z.: Carbon Fluxes in the Coastal Ocean: Synthesis, Boundary Processes, and Future Trends, Annu. Rev. Earth Pl. Sc., 50, 593–626, https://doi.org/10.1146/annurev-earth-032320-090746, 2022.
Davis, C. E., Mahaffey, C., Wolff, G. A., and Sharples, J.: A storm in a shelf sea: Variation in phosphorus distribution and organic matter stoichiometry, Geophys. Res. Lett., 41, 8452–8459, https://doi.org/10.1002/2014GL061949, 2014.
Davis, C. E., Blackbird, S., Wolff, G., Woodward, M., and Mahaffey, C.: Seasonal organic matter dynamics in a temperate shelf sea, Prog. Oceanogr., 177, 101925, https://doi.org/10.1016/j.pocean.2018.02.021, 2019.
del Giorgio, P. A. and Duarte, C. M.: Respiration in the open ocean, Nature, 420, 379–384, https://doi.org/10.1038/nature01165, 2002.
Demir, K. T.: Dataset for the study: Variable organic matter stoichiometry enhances the biological drawdown of CO2 in the northwest European shelf seas, Zenodo [data set], https://doi.org/10.5281/zenodo.14916290, 2025.
Dickson, A. G., Sabine, C. L., and Christian, J. R.: Guide to Best Practices for Ocean CO2 Measurements, PICES Special Publication 3, 191 pp., https://www.ncei.noaa.gov/access/ocean-carbon-acidification-data-system/oceans/Handbook_2007.html (last access: 26 June 2024), 2007.
Elser, J. J. and Urabe, J.: The Stoichiometry of Consumer-Driven Nutrient Recycling: Theory, Observations, and Consequences, Ecology, 80, 735–751, https://doi.org/10.1890/0012-9658(1999)080[0735:TSOCDN]2.0.CO;2, 1999.
Engel, A.: Direct relationship between CO2 uptake and transparent exopolymer particles production in natural phytoplankton, J. Plankton Res., 24, 49–53, https://doi.org/10.1093/plankt/24.1.49, 2002.
Fajon, C., Cauwet, G., Lebaron, P., Terzic, S., Ahel, M., Malej, A., Mozetic, P., and Turk, V.: The accumulation and release of polysaccharides by planktonic cells and the subsequent bacterial response during a controlled experiment, FEMS Microbiol. Ecol., 29, 351–363, https://doi.org/10.1016/S0168-6496(99)00029-X, 1999.
Falkowski, P. G., Barber, R. T., and Smetacek, V.: Biogeochemical Controls and Feedbacks on Ocean Primary Production, Science, 281, 200–206, https://doi.org/10.1126/science.281.5374.200, 1998.
Finkel, Z. V., Beardall, J., Flynn, K. J., Quigg, A., Rees, T. A. V., and Raven, J. A.: Phytoplankton in a changing world: cell size and elemental stoichiometry, J. Plankton Res., 32, 119–137, https://doi.org/10.1093/plankt/fbp098, 2010.
Fitzsimons, M. F., Probert, I., Gaillard, F., and Rees, A. P.: Dissolved organic phosphorus uptake by marine phytoplankton is enhanced by the presence of dissolved organic nitrogen, J. Exp. Mar. Biol. Ecol., 530–531, 151434, https://doi.org/10.1016/j.jembe.2020.151434, 2020.
Frankignoulle, M. and Borges, A. V.: European continental shelf as a significant sink for atmospheric carbon dioxide, Global Biogeochem. Cy., 15, 569–576, https://doi.org/10.1029/2000GB001307, 2001.
Friedlingstein, P., O'Sullivan, M., Jones, M. W., Andrew, R. M., Bakker, D. C. E., Hauck, J., Landschützer, P., Le Quéré, C., Luijkx, I. T., Peters, G. P., Peters, W., Pongratz, J., Schwingshackl, C., Sitch, S., Canadell, J. G., Ciais, P., Jackson, R. B., Alin, S. R., Anthoni, P., Barbero, L., Bates, N. R., Becker, M., Bellouin, N., Decharme, B., Bopp, L., Brasika, I. B. M., Cadule, P., Chamberlain, M. A., Chandra, N., Chau, T.-T.-T., Chevallier, F., Chini, L. P., Cronin, M., Dou, X., Enyo, K., Evans, W., Falk, S., Feely, R. A., Feng, L., Ford, D. J., Gasser, T., Ghattas, J., Gkritzalis, T., Grassi, G., Gregor, L., Gruber, N., Gürses, Ö., Harris, I., Hefner, M., Heinke, J., Houghton, R. A., Hurtt, G. C., Iida, Y., Ilyina, T., Jacobson, A. R., Jain, A., Jarníková, T., Jersild, A., Jiang, F., Jin, Z., Joos, F., Kato, E., Keeling, R. F., Kennedy, D., Klein Goldewijk, K., Knauer, J., Korsbakken, J. I., Körtzinger, A., Lan, X., Lefèvre, N., Li, H., Liu, J., Liu, Z., Ma, L., Marland, G., Mayot, N., McGuire, P. C., McKinley, G. A., Meyer, G., Morgan, E. J., Munro, D. R., Nakaoka, S.-I., Niwa, Y., O'Brien, K. M., Olsen, A., Omar, A. M., Ono, T., Paulsen, M., Pierrot, D., Pocock, K., Poulter, B., Powis, C. M., Rehder, G., Resplandy, L., Robertson, E., Rödenbeck, C., Rosan, T. M., Schwinger, J., Séférian, R., Smallman, T. L., Smith, S. M., Sospedra-Alfonso, R., Sun, Q., Sutton, A. J., Sweeney, C., Takao, S., Tans, P. P., Tian, H., Tilbrook, B., Tsujino, H., Tubiello, F., van der Werf, G. R., van Ooijen, E., Wanninkhof, R., Watanabe, M., Wimart-Rousseau, C., Yang, D., Yang, X., Yuan, W., Yue, X., Zaehle, S., Zeng, J., and Zheng, B.: Global Carbon Budget 2023, Earth Syst. Sci. Data, 15, 5301–5369, https://doi.org/10.5194/essd-15-5301-2023, 2023.
Garcia, H., Weathers, K., Paver, C., Smolyar, I., Boyer, T., Locarnini, M., Zweng, M., Mishonov, A., Baranova, O., Seidov, D., and Reagan, J.: World Ocean Atlas 2018. Volume 4: Dissolved Inorganic Nutrients (phosphate, nitrate and nitrate+nitrite, silicate), Mishonov, A., Technical Ed., NOAA Atlas NESDIS 84, 35 pp., https://doi.org/10.25923/ng6j-ey81, 2018a.
Garcia, H., Weathers, K., Paver, C., Smolyar, I., Boyer, T., Locarnini, M., Zweng, M., Mishonov, A., Baranova, O., Seidov, D., and Reagan, J.: World Ocean Atlas 2018, Volume 3: Dissolved Oxygen, Apparent Oxygen Utilization, and Dissolved Oxygen Saturation, Mishonov, A., Technical Ed., NOAA Atlas NESDIS 83, 38 pp., https://doi.org/10.25923/qspr-pn52, 2018b.
Gattuso, J.-P., Frankignoulle, M., and Wollast, R.: Carbon and Carbonate Metabolism in Coastal Aquatic Ecosystems, Annu. Rev. Ecol. Evol. S., 29, 405–434, https://doi.org/10.1146/annurev.ecolsys.29.1.405, 1998.
Geider, R. and La Roche, J.: Redfield revisited: variability of in marine microalgae and its biochemical basis, Eur. J. Phycol., 37, 1–17, https://doi.org/10.1017/S0967026201003456, 2002.
Gustafsson, E.: Modelling the marine CO2 system in BALTSEM, Baltic Nest Institute Technical Report No. 9, Stockholm University, Stockholm, Sweden, ISBN 978-91-86655-08-2, https://su.diva-portal.org/smash/record.jsf?pid=diva2:1598412 (last access: 12 April 2022), 2013.
Hach, P. F., Marchant, H. K., Krupke, A., Riedel, T., Meier, D. V., Lavik, G., Holtappels, M., Dittmar, T., and Kuypers, M. M. M.: Rapid microbial diversification of dissolved organic matter in oceanic surface waters leads to carbon sequestration, Sci. Rep., 10, 13025, https://doi.org/10.1038/s41598-020-69930-y, 2020.
Hansell, D., Carlson, C., Repeta, D., and Schlitzer, R.: Dissolved Organic Matter in the Ocean: A Controversy Stimulates New Insights, Oceanography, 22, 202–211, https://doi.org/10.5670/oceanog.2009.109, 2009.
Hansell, D. A. and Carlson, C. A.: Deep-ocean gradients in the concentration of dissolved organic carbon, Nature, 395, 263–266, https://doi.org/10.1038/26200, 1998.
Hjalmarsson, S., Wesslander, K., Anderson, L. G., Omstedt, A., Perttilä, M., and Mintrop, L.: Distribution, long-term development and mass balance calculation of total alkalinity in the Baltic Sea, Cont. Shelf Res., 28, 593–601, https://doi.org/10.1016/j.csr.2007.11.010, 2008.
Ho, T.-Y., Quigg, A., Finkel, Z. V., Milligan, A. J., Wyman, K., Falkowski, P. G., and Morel, F. M. M.: The Elemental Composition of Some Marine Phytoplankton, J. Phycol., 39, 1145–1159, https://doi.org/10.1111/j.0022-3646.2003.03-090.x, 2003.
Holt, J., Butenschön, M., Wakelin, S. L., Artioli, Y., and Allen, J. I.: Oceanic controls on the primary production of the northwest European continental shelf: model experiments under recent past conditions and a potential future scenario, Biogeosciences, 9, 97–117, https://doi.org/10.5194/bg-9-97-2012, 2012.
Hopkinson, C. S. and Vallino, J. J.: Efficient export of carbon to the deep ocean through dissolved organic matter, Nature, 433, 142–145, https://doi.org/10.1038/nature03191, 2005.
Hopkinson, C. S., Fry, B., and Nolin, A. L.: Stoichiometry of dissolved organic matter dynamics on the continental shelf of the northeastern U.S.A., Cont. Shelf Res., 17, 473–489, https://doi.org/10.1016/S0278-4343(96)00046-5, 1997.
Hopkinson, C. S., Vallino, J. J., and Nolin, A.: Decomposition of dissolved organic matter from the continental margin, Deep-Sea Res. Pt. II, 49, 4461–4478, https://doi.org/10.1016/S0967-0645(02)00125-X, 2002.
Huang, J.: A Simple Accurate Formula for Calculating Saturation Vapor Pressure of Water and Ice, J. Appl. Meteorol. Clim., 57, 1265–1272, https://doi.org/10.1175/JAMC-D-17-0334.1, 2018.
Humphreys, M. P., Achterberg, E. P., Hopkins, J. E., Chowdhury, M. Z. H., Griffiths, A. M., Hartman, S. E., Hull, T., Smilenova, A., Wihsgott, J. U., Woodward, E. M. S., and Moore, C. M.: Mechanisms for a nutrient-conserving carbon pump in a seasonally stratified, temperate continental shelf sea, Prog. Oceanogr., 177, 101961, https://doi.org/10.1016/j.pocean.2018.05.001, 2019.
Humphreys, M. P., Lewis, E. R., Sharp, J. D., and Pierrot, D.: PyCO2SYS v1.8: marine carbonate system calculations in Python, Geosci. Model Dev., 15, 15–43, https://doi.org/10.5194/gmd-15-15-2022, 2022.
Humphreys, M. P., Schiller, A. J., Sandborn, D., Gregor, L., Pierrot, D., van Heuven, S. M. A. C., Lewis, E. R., and Wallace, D. W. R.: PyCO2SYS: marine carbonate system calculations in Python, Zenodo [code], https://doi.org/10.5281/zenodo.10671397, 2024.
Hung, J.-J., Chen, C.-H., Gong, G.-C., Sheu, D.-D., and Shiah, F.-K.: Distributions, stoichiometric patterns and cross-shelf exports of dissolved organic matter in the East China Sea, Deep-Sea Res. Pt. II, 50, 1127–1145, https://doi.org/10.1016/S0967-0645(03)00014-6, 2003.
Ingri, N., Kakolowicz, W., Sillén, L. G., and Warnqvist, B.: High-speed computers as a supplement to graphical methods – V1Haltafall, a general program for calculating the composition of equilibrium mixtures, Talanta, 14, 1261–1286, https://doi.org/10.1016/0039-9140(67)80203-0, 1967.
Kähler, P. and Koeve, W.: Marine dissolved organic matter: can its C:N ratio explain carbon overconsumption?, Deep-Sea Res. Pt. I, 48, 49–62, https://doi.org/10.1016/S0967-0637(00)00034-0, 2001.
Kitidis, V., Shutler, J. D., Ashton, I., Warren, M., Brown, I., Findlay, H., Hartman, S. E., Sanders, R., Humphreys, M., Kivimäe, C., Greenwood, N., Hull, T., Pearce, D., McGrath, T., Stewart, B. M., Walsham, P., McGovern, E., Bozec, Y., Gac, J.-P., van Heuven, S. M. A. C., Hoppema, M., Schuster, U., Johannessen, T., Omar, A., Lauvset, S. K., Skjelvan, I., Olsen, A., Steinhoff, T., Körtzinger, A., Becker, M., Lefevre, N., Diverrès, D., Gkritzalis, T., Cattrijsse, A., Petersen, W., Voynova, Y. G., Chapron, B., Grouazel, A., Land, P. E., Sharples, J., and Nightingale, P. D.: Winter weather controls net influx of atmospheric CO2 on the north-west European shelf, Sci. Rep., 9, 20153, https://doi.org/10.1038/s41598-019-56363-5, 2019.
Kossack, J., Mathis, M., Daewel, U., Zhang, Y., and Schrum, C.: Barotropic and baroclinic tides increase primary production on the Northwest European Shelf, Front. Mar. Sci., 10, 1206062, https://doi.org/10.3389/fmars.2023.1206062, 2023.
Kossack, J., Mathis, M., Daewel, U., Liu, F., Demir, K. T., Thomas, H., and Schrum, C.: Tidal impacts on air-sea CO2 exchange on the North-West European shelf, Front. Mar. Sci., 11, 1406896, https://doi.org/10.3389/fmars.2024.1406896, 2024.
Kühn, W., Pätsch, J., Thomas, H., Borges, A. V., Schiettecatte, L. S., Bozec, Y., and Prowe, A. E. F.: Nitrogen and carbon cycling in the North Sea and exchange with the North Atlantic-A model study, Part II: Carbon budget and fluxes, Cont. Shelf Res., 30, 1701–1716, https://doi.org/10.1016/j.csr.2010.07.001, 2010.
Kwiatkowski, L., Aumont, O., Bopp, L., and Ciais, P.: The Impact of Variable Phytoplankton Stoichiometry on Projections of Primary Production, Food Quality, and Carbon Uptake in the Global Ocean, Global Biogeochem. Cy., 32, 516–528, https://doi.org/10.1002/2017GB005799, 2018.
Lacroix, F., Ilyina, T., Mathis, M., Laruelle, G. G., and Regnier, P.: Historical increases in land-derived nutrient inputs may alleviate effects of a changing physical climate on the oceanic carbon cycle, Glob. Change Biol., 27, 5491–5513, https://doi.org/10.1111/gcb.15822, 2021.
Lan, X., Mund, J., Crotwell, A., Crotwell, M., Moglia, E., Madronich, M., Neff, D., and Thoning, K.: Atmospheric Carbon Dioxide Dry Air Mole Fractions from the NOAA GML Carbon Cycle Cooperative Global Air Sampling Network, 1968–2022, Version: 2023-08-28, NOAA [data set], https://doi.org/10.15138/wkgj-f215, 2023.
Laruelle, G. G., Lauerwald, R., Pfeil, B., and Regnier, P.: Regionalized global budget of the CO2 exchange at the air-water interface in continental shelf seas, Global Biogeochem. Cy., 28, 1199–1214, https://doi.org/10.1002/2014GB004832, 2014.
Laruelle, G. G., Cai, W.-J., Hu, X., Gruber, N., Mackenzie, F. T., and Regnier, P.: Continental shelves as a variable but increasing global sink for atmospheric carbon dioxide, Nat. Commun., 9, 454, https://doi.org/10.1038/s41467-017-02738-z, 2018.
Legge, O., Johnson, M., Hicks, N., Jickells, T., Diesing, M., Aldridge, J., Andrews, J., Artioli, Y., Bakker, D. C. E., Burrows, M. T., Carr, N., Cripps, G., Felgate, S. L., Fernand, L., Greenwood, N., Hartman, S., Kröger, S., Lessin, G., Mahaffey, C., Mayor, D. J., Parker, R., Queirós, A. M., Shutler, J. D., Silva, T., Stahl, H., Tinker, J., Underwood, G. J. C., Molen, J. V. D., Wakelin, S., Weston, K., and Williamson, P.: Carbon on the Northwest European Shelf: Contemporary Budget and Future Influences, Frontiers in Marine Science, 7, 143, https://doi.org/10.3389/fmars.2020.00143, 2020.
Letscher, R. T. and Moore, J. K.: Preferential remineralization of dissolved organic phosphorus and non-Redfield DOM dynamics in the global ocean: Impacts on marine productivity, nitrogen fixation, and carbon export, Global Biogeochem. Cy., 29, 325–340, https://doi.org/10.1002/2014GB004904, 2015.
Letscher, R. T., Moore, J. K., Teng, Y.-C., and Primeau, F.: Variable stoichiometry of dissolved organic matter cycling in the Community Earth System Model, Biogeosciences, 12, 209–221, https://doi.org/10.5194/bg-12-209-2015, 2015.
Liang, Z., Letscher, R. T., and Knapp, A. N.: Global Patterns of Surface Ocean Dissolved Organic Matter Stoichiometry, Global Biogeochem. Cy., 37, e2023GB007788, https://doi.org/10.1029/2023GB007788, 2023.
Locarnini, M., Mishonov, A., Baranova, O., Boyer, T., Zweng, M., Garcia, H., Reagan, J., Seidov, D., Weathers, K., Paver, C., and Smolyar, I.: World Ocean Atlas 2018, Volume 1: Temperature, NOAA Atlas NESDIS 81, 52 pp., https://doi.org/10.25923/e5rn-9711, 2018.
Loh, A. N. and Bauer, J. E.: Distribution, partitioning and fluxes of dissolved and particulate organic C, N and P in the eastern North Pacific and Southern Oceans, Deep-Sea Res. Pt. I, 47, 2287–2316, https://doi.org/10.1016/S0967-0637(00)00027-3, 2000.
Lønborg, C. and Álvarez-Salgado, X. A.: Recycling versus export of bioavailable dissolved organic matter in the coastal ocean and efficiency of the continental shelf pump, Global Biogeochem. Cy., 26, GB3018, https://doi.org/10.1029/2012GB004353, 2012.
Lønborg, C., Álvarez-Salgado, X. A., Davidson, K., and Miller, A. E. J.: Production of bioavailable and refractory dissolved organic matter by coastal heterotrophic microbial populations, Estuar. Coast. Shelf S., 82, 682–688, https://doi.org/10.1016/j.ecss.2009.02.026, 2009.
Lønborg, C., Carreira, C., Abril, G., Agustí, S., Amaral, V., Andersson, A., Arístegui, J., Bhadury, P., Bif, M. B., Borges, A. V., Bouillon, S., Calleja, M. Ll., Cotovicz Jr., L. C., Cozzi, S., Doval, M., Duarte, C. M., Eyre, B., Fichot, C. G., García-Martín, E. E., Garzon-Garcia, A., Giani, M., Gonçalves-Araujo, R., Gruber, R., Hansell, D. A., Hashihama, F., He, D., Holding, J. M., Hunter, W. R., Ibánhez, J. S. P., Ibello, V., Jiang, S., Kim, G., Klun, K., Kowalczuk, P., Kubo, A., Lee, C.-W., Lopes, C. B., Maggioni, F., Magni, P., Marrase, C., Martin, P., McCallister, S. L., McCallum, R., Medeiros, P. M., Morán, X. A. G., Muller-Karger, F. E., Myers-Pigg, A., Norli, M., Oakes, J. M., Osterholz, H., Park, H., Lund Paulsen, M., Rosentreter, J. A., Ross, J. D., Rueda-Roa, D., Santinelli, C., Shen, Y., Teira, E., Tinta, T., Uher, G., Wakita, M., Ward, N., Watanabe, K., Xin, Y., Yamashita, Y., Yang, L., Yeo, J., Yuan, H., Zheng, Q., and Álvarez-Salgado, X. A.: A global database of dissolved organic matter (DOM) concentration measurements in coastal waters (CoastDOM v1), Earth Syst. Sci. Data, 16, 1107–1119, https://doi.org/10.5194/essd-16-1107-2024, 2024.
Lorkowski, I., Pätsch, J., Moll, A., and Kühn, W.: Interannual variability of carbon fluxes in the North Sea from 1970 to 2006 – Competing effects of abiotic and biotic drivers on the gas-exchange of CO2, Estuar. Coast. Shelf S., 100, 38–57, https://doi.org/10.1016/j.ecss.2011.11.037, 2012.
Mari, X., Passow, U., Migon, C., Burd, A. B., and Legendre, L.: Transparent exopolymer particles: Effects on carbon cycling in the ocean, Prog. Oceanogr., 151, 13–37, https://doi.org/10.1016/j.pocean.2016.11.002, 2017.
Martiny, A. C., Pham, C. T. A., Primeau, F. W., Vrugt, J. A., Moore, J. K., Levin, S. A., and Lomas, M. W.: Strong latitudinal patterns in the elemental ratios of marine plankton and organic matter, Nat. Geosci., 6, 279–283, https://doi.org/10.1038/ngeo1757, 2013.
Martiny, A. C., Vrugt, J. A., and Lomas, M. W.: Concentrations and ratios of particulate organic carbon, nitrogen, and phosphorus in the global ocean, Sci. Data, 1, 140048, https://doi.org/10.1038/sdata.2014.48, 2014.
Mathis, M., Logemann, K., Maerz, J., Lacroix, F., Hagemann, S., Chegini, F., Ramme, L., Ilyina, T., Korn, P., and Schrum, C.: Seamless Integration of the Coastal Ocean in Global Marine Carbon Cycle Modeling, J. Adv. Model. Earth Sy., 14, e2021MS002789, https://doi.org/10.1029/2021MS002789, 2022.
Mathis, M., Lacroix, F., Hagemann, S., Nielsen, D. M., Ilyina, T., and Schrum, C.: Enhanced CO2 uptake of the coastal ocean is dominated by biological carbon fixation, Nat. Clim. Change, 14, 373–379, https://doi.org/10.1038/s41558-024-01956-w, 2024.
Millero, F. J., Graham, T. B., Huang, F., Bustos-Serrano, H., and Pierrot, D.: Dissociation constants of carbonic acid in seawater as a function of salinity and temperature, Mar. Chem., 100, 80–94, https://doi.org/10.1016/j.marchem.2005.12.001, 2006.
Moreno, A. R. and Martiny, A. C.: Ecological Stoichiometry of Ocean Plankton, Annu. Rev. Mar. Sci., 10, 43–69, https://doi.org/10.1146/annurev-marine-121916-063126, 2018.
Myklestad, S. M.: Release of extracellular products by phytoplankton with special emphasis on polysaccharides, Sci. Total Environ., 165, 155–164, https://doi.org/10.1016/0048-9697(95)04549-G, 1995.
Neal, C. and Davies, H.: Water quality fluxes for eastern UK rivers entering the North Sea: a summary of information from the Land Ocean Interaction Study (LOIS), Sci. Total Environ., 314–316, 821–882, https://doi.org/10.1016/S0048-9697(03)00086-X, 2003.
Neumann, T., Radtke, H., Cahill, B., Schmidt, M., and Rehder, G.: Non-Redfieldian carbon model for the Baltic Sea (ERGOM version 1.2) – implementation and budget estimates, Geosci. Model Dev., 15, 8473–8540, https://doi.org/10.5194/gmd-15-8473-2022, 2022.
Painter, S. C., Hartman, S. E., Kivimäe, C., Salt, L. A., Clargo, N. M., Daniels, C. J., Bozec, Y., Daniels, L., Allen, S., Hemsley, V. S., Moschonas, G., and Davidson, K.: The elemental stoichiometry (C, Si, N, P) of the Hebrides Shelf and its role in carbon export, Prog. Oceanogr., 159, 154–177, https://doi.org/10.1016/j.pocean.2017.10.001, 2017.
Painter, S. C., Lapworth, D. J., Woodward, E. M. S., Kroeger, S., Evans, C. D., Mayor, D. J., and Sanders, R. J.: Terrestrial dissolved organic matter distribution in the North Sea, Sci. Total Environ., 630, 630–647, https://doi.org/10.1016/j.scitotenv.2018.02.237, 2018.
Pätsch, J. and Lenhart, H.: Daily Loads of Nutrients, Total Alkalinity, Dissolved Inorganic Carbon and Dissolved Organic Carbon of the European Continental Rivers for the Years 1977-2002, Berichte aus dem Zentrum für Meeres- und Klimaforschung, Reihe B, Ozeanographie, 2004.
Porz, L., Zhang, W., Christiansen, N., Kossack, J., Daewel, U., and Schrum, C.: Quantification and mitigation of bottom-trawling impacts on sedimentary organic carbon stocks in the North Sea, Biogeosciences, 21, 2547–2570, https://doi.org/10.5194/bg-21-2547-2024, 2024.
Prowe, A. E. F., Thomas, H., Pätsch, J., Kühn, W., Bozec, Y., Schiettecatte, L. S., Borges, A. V., and Baar, H. J. W. de: Mechanisms controlling the air-sea CO2 flux in the North Sea, Cont. Shelf Res., 29, 1801–1808, https://doi.org/10.1016/j.csr.2009.06.003, 2009.
Redfield, A. C.: The influence of organisms on the composition of seawater, The Sea, 2, 26–77, 1963.
Samuelsen, A., Schrum, C., Yumruktepe, V. Ç., Daewel, U., and Roberts, E. M.: Environmental Change at Deep-Sea Sponge Habitats Over the Last Half Century: A Model Hindcast Study for the Age of Anthropogenic Climate Change, Front. Mar. Sci., 9, 737164, https://doi.org/10.3389/fmars.2022.737164, 2022.
Sardans, J., Rivas-Ubach, A., and Peñuelas, J.: The stoichiometry of organisms and ecosystems in a changing world: A review and perspectives, Perspect. Plant Ecol., 14, 33–47, https://doi.org/10.1016/j.ppees.2011.08.002, 2012.
Sardans, J., Janssens, I. A., Ciais, P., Obersteiner, M., and Peñuelas, J.: Recent advances and future research in ecological stoichiometry, Perspectives in Plant Ecology, Evolution and Systematics, 50, 125611, https://doi.org/10.1016/j.ppees.2021.125611, 2021.
Schiettecatte, L.-S., Thomas, H., Bozec, Y., and Borges, A. V.: High temporal coverage of carbon dioxide measurements in the Southern Bight of the North Sea, Mar. Chem., 106, 161–173, https://doi.org/10.1016/j.marchem.2007.01.001, 2007.
Schindler, D. E. and Eby, L. A.: Stoichiometry of Fishes and Their Prey: Implications for Nutrient Recycling, Ecology, 78, 1816–1831, https://doi.org/10.1890/0012-9658(1997)078[1816:SOFATP]2.0.CO;2, 1997.
Schrum, C., Alekseeva, I., and John, M. S.: Development of a coupled physical-biological ecosystem model ECOSMO. Part I: Model description and validation for the North Sea, J. Marine Syst., 61, 79–99, https://doi.org/10.1016/j.jmarsys.2006.01.005, 2006.
Simpson, D., Benedictow, A., Berge, H., Bergström, R., Emberson, L. D., Fagerli, H., Flechard, C. R., Hayman, G. D., Gauss, M., Jonson, J. E., Jenkin, M. E., Nyíri, A., Richter, C., Semeena, V. S., Tsyro, S., Tuovinen, J.-P., Valdebenito, Á., and Wind, P.: The EMEP MSC-W chemical transport model – technical description, Atmos. Chem. Phys., 12, 7825–7865, https://doi.org/10.5194/acp-12-7825-2012, 2012.
Singh, A., Baer, S. E., Riebesell, U., Martiny, A. C., and Lomas, M. W.: stoichiometry at the Bermuda Atlantic Time-series Study station in the North Atlantic Ocean, Biogeosciences, 12, 6389–6403, https://doi.org/10.5194/bg-12-6389-2015, 2015.
Smith, S. V. and Hollibaugh, J. T.: Coastal metabolism and the oceanic organic carbon balance, Rev. Geophys., 31, 75–89, https://doi.org/10.1029/92RG02584, 1993.
Søndergaard, M., Williams, P. J. le B., Cauwet, G., Riemann, B., Robinson, C., Terzic, S., Woodward, E. M. S., and Worm, J.: Net accumulation and flux of dissolved organic carbon and dissolved organic nitrogen in marine plankton communities, Limnol. Oceanogr., 45, 1097–1111, https://doi.org/10.4319/lo.2000.45.5.1097, 2000.
Stepanauskas, R., JØrgensen, N. O. G., Eigaard, O. R., Žvikas, A., Tranvik, L. J., and Leonardson, L.: Summer Inputs of Riverine Nutrients to the Baltic Sea: Bioavailability and Eutrophication Relevance, Ecol. Monogr., 72, 579–597, https://doi.org/10.1890/0012-9615(2002)072[0579:SIORNT]2.0.CO;2, 2002.
Suratman, S., Weston, K., Jickells, T., and Fernand, L.: Spatial and seasonal changes of dissolved and particulate organic C in the North Sea, Hydrobiologia, 628, 13–25, https://doi.org/10.1007/s10750-009-9730-z, 2009.
Tanioka, T., Matsumoto, K., and Lomas, M. W.: Drawdown of Atmospheric pCO2 Via Variable Particle Flux Stoichiometry in the Ocean Twilight Zone, Geophys. Res. Lett., 48, e2021GL094924, https://doi.org/10.1029/2021GL094924, 2021.
Tanioka, T., Larkin, A. A., Moreno, A. R., Brock, M. L., Fagan, A. J., Garcia, C. A., Garcia, N. S., Gerace, S. D., Lee, J. A., Lomas, M. W., and Martiny, A. C.: Global Ocean Particulate Organic Phosphorus, Carbon, Oxygen for Respiration, and Nitrogen (GO-POPCORN), Sci. Data, 9, 688, https://doi.org/10.1038/s41597-022-01809-1, 2022a.
Tanioka, T., Garcia, C. A., Larkin, A. A., Garcia, N. S., Fagan, A. J., and Martiny, A. C.: Global patterns and predictors of in marine ecosystems, Communications Earth & Environment, 3, 271, https://doi.org/10.1038/s43247-022-00603-6, 2022b.
Thomas, H., Ittekkot, V., Osterroht, C., and Schneider, B.: Preferential recycling of nutrients – the ocean's way to increase new production and to pass nutrient limitation?, Limnol. Oceanogr., 44, 1999–2004, https://doi.org/10.4319/lo.1999.44.8.1999, 1999.
Thomas, H., Bozec, Y., Elkalay, K., and Baar, H. J. W. D.: Enhanced Open Ocean Storage of CO2 from Shelf Sea Pumping, Science, 304, 1005–1008, https://doi.org/10.1126/science.1095491, 2004.
Thomas, H., Bozec, Y., de Baar, H. J. W., Elkalay, K., Frankignoulle, M., Schiettecatte, L.-S., Kattner, G., and Borges, A. V.: The carbon budget of the North Sea, Biogeosciences, 2, 87–96, https://doi.org/10.5194/bg-2-87-2005, 2005.
Tsunogai, S., Watanabe, S., and Sato, T.: Is there a “continental shelf pump” for the absorption of atmospheric CO2?, Tellus B, 51, 701–712, https://doi.org/10.3402/tellusb.v51i3.16468, 1999.
Voss, M., Asmala, E., Bartl, I., Carstensen, J., Conley, D. J., Dippner, J. W., Humborg, C., Lukkari, K., Petkuviene, J., Reader, H., Stedmon, C., Vybernaite-Lubiene, I., Wannicke, N., and Zilius, M.: Origin and fate of dissolved organic matter in four shallow Baltic Sea estuaries, Biogeochemistry, 154, 385–403, https://doi.org/10.1007/s10533-020-00703-5, 2021.
Wakelin, S. L., Holt, J. T., Blackford, J. C., Allen, J. I., Butenschön, M., and Artioli, Y.: Modeling the carbon fluxes of the northwest European continental shelf: Validation and budgets, J. Geophys. Res., 117, 2011JC007402, https://doi.org/10.1029/2011JC007402, 2012.
Wang, H., Gong, D., Friedrichs, M. A. M., Harris, C. K., Miles, T., Yu, H.-C., and Zhang, Y.: A Cycle of Wind-Driven Canyon Upwelling and Downwelling at Wilmington Canyon and the Evolution of Canyon-Upwelled Dense Water on the MAB Shelf, Front. Mar. Sci., 9, 866075, https://doi.org/10.3389/fmars.2022.866075, 2022.
Wanninkhof, R.: Relationship between wind speed and gas exchange over the ocean revisited, Limnology & Ocean Methods, 12, 351–362, https://doi.org/10.4319/lom.2014.12.351, 2014.
Wear, E. K., Carlson, C. A., Windecker, L. A., and Brzezinski, M. A.: Roles of diatom nutrient stress and species identity in determining the short- and long-term bioavailability of diatom exudates to bacterioplankton, Mar. Chem., 177, 335–348, https://doi.org/10.1016/j.marchem.2015.09.001, 2015a.
Wear, E. K., Carlson, C. A., James, A. K., Brzezinski, M. A., Windecker, L. A., and Nelson, C. E.: Synchronous shifts in dissolved organic carbon bioavailability and bacterial community responses over the course of an upwelling-driven phytoplankton bloom, Limnol. Oceanogr., 60, 657–677, https://doi.org/10.1002/lno.10042, 2015b.
Williams, P., Carlucci, A., and Olson, R.: A deep profile of some biologically important properties in the central North Pacific gyre, Oceanol. Acta, 3, 471–476, 1980.
Williams, P. J. leB.: Evidence for the seasonal accumulation of carbon-rich dissolved organic material, its scale in comparison with changes in particulate material and the consequential effect on net CN assimilation ratios, Mar. Chem., 51, 17–29, https://doi.org/10.1016/0304-4203(95)00046-T, 1995.
Wolf-Gladrow, D. A., Zeebe, R. E., Klaas, C., Körtzinger, A., and Dickson, A. G.: Total alkalinity: The explicit conservative expression and its application to biogeochemical processes, Mar. Chem., 106, 287–300, https://doi.org/10.1016/j.marchem.2007.01.006, 2007.
Ye, F., Zhang, Y. J., He, R., Wang, Z., Wang, H. V., and Du, J.: Third-order WENO transport scheme for simulating the baroclinic eddying ocean on an unstructured grid, Ocean Model., 143, 101466, https://doi.org/10.1016/j.ocemod.2019.101466, 2019.
Zakem, E. J. and Levine, N. M.: Systematic Variation in Marine Dissolved Organic Matter Stoichiometry and Remineralization Ratios as a Function of Lability, Global Biogeochem. Cy., 33, 1389–1407, https://doi.org/10.1029/2019GB006375, 2019.
Zhang, Y. J., Ateljevich, E., Yu, H.-C., Wu, C. H., and Yu, J. C. S.: A new vertical coordinate system for a 3D unstructured-grid model, Ocean Model., 85, 16–31, https://doi.org/10.1016/j.ocemod.2014.10.003, 2015.
Zhang, Y. J., Ye, F., Stanev, E. V., and Grashorn, S.: Seamless cross-scale modeling with SCHISM, Ocean Model., 102, 64–81, https://doi.org/10.1016/j.ocemod.2016.05.002, 2016a.
Zhang, Y. J., Stanev, E. V., and Grashorn, S.: Unstructured-grid model for the North Sea and Baltic Sea: Validation against observations, Ocean Model., 97, 91–108, https://doi.org/10.1016/j.ocemod.2015.11.009, 2016b.
Zhao, C., Daewel, U., and Schrum, C.: Tidal impacts on primary production in the North Sea, Earth Syst. Dynam., 10, 287–317, https://doi.org/10.5194/esd-10-287-2019, 2019.
Zweng, M. M., Reagan, J. R., Seidov, D., Boyer, T. P., Locarnini, R. A., Garcia, H. E., Mishonov, A. V., Baranova, O. K., Weathers, K., Paver, C. R., and Smolyar, I.: World Ocean Atlas 2018, Volume 2: Salinity, NOAA Atlas NESDIS 82, 50 pp., https://doi.org/10.25923/9pgv-1224, 2019.