the Creative Commons Attribution 4.0 License.
the Creative Commons Attribution 4.0 License.
 | 13 Jun 2025
Validating laboratory predictions of soil rewetting respiration pulses using field data
Marleen Pallandt
Dilip Naidu
Johannes Rousk
Gustaf Hugelius
Stefano Manzoni
Improved understanding of the mechanisms driving heterotrophic CO2 emissions after rewetting of a dry soil may improve projections of future soil carbon fate. While drying and rewetting (DRW) under laboratory conditions have demonstrated that heterotrophic CO2 emissions depend on DRW features and soil and environmental conditions, these laboratory insights have not been validated in field conditions. To this aim, we collated mean respiration rates over 48 h after rewetting from two data sources: 37 laboratory studies reporting data for more than 3 DRW cycles (laboratory respiration, LR) and 6 field datasets recording hourly heterotrophic respiration and soil moisture (field respiration, FR). LR and FR were explained by six predictors using random forest algorithms and partial dependence plots. Results indicated that the most important drivers of LR and FR were SOC and temperature, respectively. Both LR and FR increased with increasing SOC and temperature. LR increased with soil dryness before rewetting, but this trend was less clear in FR. LR decreased with soil moisture increments at rewetting, while FR increased with soil moisture increments. LR was higher in soils from humid climates than from arid climates, but this effect was not observed in FR. We concluded that laboratory insights could be partly validated with current datasets. Caution should be taken when extending laboratory insights for predicting fluxes in ecosystems.
- Article
(4008 KB) - Full-text XML
-
Supplement
(389 KB) - BibTeX
- EndNote


Drought intensity and frequency are increasing, exposing ecosystems to more frequent and intense soil drying and rewetting (DRW) events (IPCC, 2023). These DRW events can influence the size and turnover of soil carbon pools. During soil drying, less soil carbon is released because microbial metabolic activity and substrate availability decrease, and physiological stress at low matric potential ensues (Brangarí et al., 2021; Manzoni et al., 2012; Schimel, 2018). Upon rewetting, large amounts of CO2 are released as microbial activity resumes (Barnard et al., 2020; Birch, 1958; Meisner et al., 2013), significantly contributing to the annual carbon emissions (Manzoni et al., 2020). Understanding the drivers of CO2 emissions after rewetting is therefore important to quantify soil carbon balances and predict their variations under changing climate.
With the rigor offered by laboratory conditions, controlled DRW experiments have helped to isolate several drivers of respiration rates after rewetting. For example, rewetting induces higher rates of respiration following exposure to more intense (Fischer, 2009; Lado-Monserrat et al., 2014; Li et al., 2023a), extended (longer) (Miller et al., 2005; Tiemann and Billings, 2011; Meisner et al., 2017), and more pronounced (larger differences in water content between dry and moist samples) drought treatments (Fischer, 2009; Lado-Monserrat et al., 2014; Miller et al., 2005; Tiemann and Billings, 2011). In contrast, repeated DRW cycles result in progressively smaller pulses of respiration (Miller and Berry, 2005). Moreover, the respiration rates measured in laboratory incubations increase with soil organic carbon content (SOC) (Harrison-Kirk et al., 2013) and incubation temperature (15 to 45 °C) (Andrews et al., 2023), and they vary with climate background (Sawada et al., 2017) and soil sampling depth (Brangarí et al., 2022). However, this knowledge is based on laboratory studies, and extending insights derived from these laboratory DRW experiments to predict heterotrophic respiration rates after rewetting in field conditions (i.e., in trenched plots without roots) is challenging (Canarini et al., 2017; Rousk and Brangari, 2022).
It remains nearly untested whether laboratory studies of respiration responses to DRW can capture patterns occurring in the field. Soils for laboratory incubations are usually air dried and sieved, which may alter conditions in situ, such as soil structure – in particular soil aggregates and soil porosity – which in turn affects substrate availability to microbes and microbial abundance (Kainiemi et al., 2016; Kaiser et al., 2015; Kan et al., 2022; Meyer et al., 2019). These soil preparations before laboratory incubations might have altered the microbial communities (Blaud et al., 2017) and thus the links between community composition and local climate. As a result, climate legacy effects on respiration might not emerge. Laboratory studies could also overestimate the effects of SOC on respiration due to the fact that soil-sieving can release SOC protected in aggregates, thereby increasing the proportion of bioavailable SOC compared to soils in the field. Also, laboratory studies cannot mimic field conditions, where vegetation provides carbon to soils through rhizodeposition and influences microbial activity, thus possibly overestimating the role of SOC effects on respiration. Laboratory studies may reduce the temperature effects of respiration. This is because temperature sensitivity of the respiration of SOC in macro-aggregates is larger than in micro-aggregates, and micro-aggregates in sieved soils are more abundant compared to field soils (Kan et al., 2022). As laboratory studies usually keep incubation temperature constant and centered around 20 to 25 °C, the effects of drying and rewetting intensity in the field may not be fully captured. In fact, field soil moisture usually co-varies with soil temperature, and soil temperature affects the respiration response to moisture (Moyano et al., 2013). Moreover, soil-sieving for laboratory studies reduces the heterogenous distribution of microbial hotspots and carbon resource that characterizes undisturbed soils in the field, which could alter the respiration response to DRW. Given the above concerns, there is a need to validate if insights from laboratory experiments can be extended to field conditions (Rousk and Brangari, 2022).
To fill this knowledge gap, we first collated data on mean respiration rates during the 2 d after rewetting from both laboratory DRW experiments and field studies. We investigated the dependence of respiration rates after rewetting on SOC content, incubation temperature (in situ soil temperature for field respiration), soil dryness, rewetting intensity, aridity index (ratio of precipitation to potential evapotranspiration), and soil sampling depth for laboratory respiration or soil moisture sensor depth for field respiration. Next, we compared the respiration rate responses to changes in these six drivers in laboratory and field conditions using partial dependence plots. These analyses were used to address our overarching question: are the drivers of respiration rates at rewetting the same in laboratory and field conditions?
2.1 Data from laboratory incubations
To obtain data from laboratory DRW experiments, we selected studies from previous meta-analyses and data syntheses (Canarini et al., 2017; Jin et al., 2023; Li et al., 2023b; Sang et al., 2022; Zhang et al., 2020) and added recently published studies (later than May 2019) using the same search term as in Zhang et al. (2020). To calculate respiration rates over 2 d (see below), we only included studies that reported daily or hourly resolution time series of respiration rates – or total respiration over the 2 d after rewetting from both DRW and moist control laboratory incubations – and that included at least three DRW cycles. These criteria led us to select 37 studies (Supplement S2) which span diverse climatic zones and soil conditions (Fig. A1).
To standardize soil moisture changes during DRW events across the laboratory studies, they were all scaled to the percentage of water holding capacity (WHC) – the most common soil moisture metric in this group of studies. Soil moisture values reported as field capacity or soil water potential at −0.33 bar were regarded as 100 % WHC. Soil moisture values reported in percent water-filled pore space (WFPS) were multiplied by 1.4 to convert to a value expressed as % WHC (Franzluebbers, 2020). Soil moisture values reported as soil water potentials were converted to WHC using water retention curves parameterized according to soil texture (Clapp and Hornberger, 1978; Dingman, 2015).
The respiration rate values were obtained from tables or digitized figures (the software Engauge Digitizer 12.1, https://engauge-digitizer.software.informer.com/, last access: August 2024) from the 37 studies. Next, the mean respiration rate was calculated from the integrated respiration rates over 48 h after each rewetting event of each soil or treatment considered in a given study (denoted as laboratory respiration, LR). The chosen mean respiration rate offers a comparable response metric between lab and field datasets. This choice also avoids the issues of using response ratios (the ratio of absolute CO2 emissions after rewetting to absolute CO2 emissions at constant control) for interpreting respiration rate patterns, as conclusions can vary with the soil moisture levels of the constant control (Zhang et al., 2020). The 48 h time frame was chosen to ensure a sufficient number of datasets. Very few studies reported high-resolution respiration rates after rewetting during three DRW cycles, and in most of the studies respiration was averaged over 1 or 2 d. Six predictors were recorded, including soil dryness (the soil moisture at the end of drying (expressed as % WHC): the lower the value, the drier the soil), rewetting intensity (RI: soil moisture increments at rewetting, % WHC), incubation temperature (TMP, °C), soil organic carbon content (SOC, g kg−1), soil sampling depth (cm), and the aridity index (AI: ratio of mean annual precipitation to potential evapotranspiration). The soil sampling depth refers to the bottom of the sampled soil core and can serve as a proxy for organic matter composition, with deeper layers containing more microbially processed material. The AI was obtained from Zomer et al. (2022) for the period 1970 to 2000 based on the coordinates of soil sampling. Larger values of AI indicate wetter climate. The obtained dataset is available in Supplement S1.
2.2 Data from field sites
To obtain respiration rates after DRW in field conditions (FR), we retrieved data from the COSORE database (Bond-Lamberty et al., 2020), which reports continuous high-resolution CO2 emission (), volumetric soil moisture (cubic meters of water per cubic meter of soil, expressed as %), and soil temperature (°C) data from chambers located in trenched plots. Trenching separates the roots from the nearby vegetation, ensuring that only heterotrophic respiration is included in the measured rates. By halting the flow of carbon from the plants to the rhizosphere, trenching also reduces microbial respiration fueled by root exudates, but it also increases the contribution of decaying roots to the respiration rate. The choice to only consider trenched plots limits the scope of our analysis to soils without live plants but allows comparing field and laboratory data. We included observations where soil moisture and temperature were measured in the soil surface layer (≤10 cm) because soil moisture fluctuations in deep layers are less correlated with respiration rates at the surface due to the delayed transport of CO2 to the surface (Chu et al., 2023). After applying these criteria, six studies were left, which were located in North America (see Fig. A1). SOC content, depth of soil moisture and temperature sensors, and AI values were obtained from the COSORE datasets or other relevant articles on the same sites (Supplement S1).
2.3 Comparability of laboratory and field data
Both soil moisture and respiration rates are measured in different ways and expressed in different units in laboratory and field studies. Soil moisture was reported as the percent of WHC in most laboratory studies and as percent of volumetric soil moisture in the field studies. In loamy and fine-textured soils, the soil moisture values expressed as % WHC are approximately 4 times larger than those expressed as percent volumetric soil moisture because the water holding capacity is at about half of the soil saturation, which in turn corresponds to a volumetric soil moisture of around 50 % (Clapp and Hornberger, 1978; Laio et al., 2001) (e.g., 50 % WHC corresponds to a volumetric soil moisture of 12.5 % if soil moisture at saturation is 50 % and the WHC is at 50 % of soil saturation). However, the conversion factor from % WHC and percent volumetric soil moisture is not constant, and lacking specific data on water holding capacity (or of texture from which WHC can be estimated) we did not attempt to harmonize the units.
Respiration rates were normalized by dry soil mass in the laboratory studies and by ground area in the field studies. Respiration per unit soil mass can be converted to respiration per unit ground area by multiplying by the soil bulk density and the soil depth contributing to the measured respiration rate. Bulk density was not reported in some of the field studies, and the depth contributing to respiration is not known. Therefore, we performed a sensitivity analysis by extracting the contributing depth and bulk density from distributions centered around the estimated values at the six sites. This approach allows us to test the robustness of the driver importance ranking (Sect. 2.5). We conducted this analysis by randomly sampling the values of contributing depth from a uniform distribution ranging from 5 to 15 cm and those of bulk density from a uniform distribution ranging from 0.5 to 1.5 times the bulk density for each site. Bulk density was estimated from soil texture at sites where it was not directly measured. The random forest models were then run for all conversion factors obtained from the random sampling, as explained in Sect. 2.5.
2.4 Defining rewetting events in field studies
To obtain the FR values and the characteristics of rewetting events in the field, the hourly soil moisture time series were progressively scanned to define drying and rewetting periods (Fig. 1). We first defined the end of drying periods preceding rewetting and then the rewetting event itself. During the drying periods, soil moisture declines or varies little, so the difference Δθ− between the minimum soil moisture in the previous 24 h () and soil moisture of the current time point (θ) is positive or zero. In contrast, a negative value of indicates a moisture increment. At the very end of a drying period, the difference Δθ+ between the maximum soil moisture in the subsequent 24 h () and the current θ is positive because soil moisture starts increasing.
As soil moisture time series exhibit short-term fluctuations not associated with rainfall events, a tolerance must be allowed when defining a drying period. In fact, small soil moisture increments might still be part of the drying period if due to daily fluctuations, as long as the fluctuations are lower than an increment tolerance threshold (Δθtolerance). Time points when both Δθ− was larger than −Δθtolerance and Δθ+ was larger than a rewetting threshold (Δθrewet) were defined as points at the end of a drying period (Fig. 1). The end of the drying period before rewetting was then defined as a continuous sequence of those points fulfilling these criteria. To ensure sufficient pre-context for those drying periods, we only included drying periods that followed at least five data points and covered at least 18 h of continuous data. The thresholds to include time points as the end of drying periods were calculated as percentages of the 5th to 95th percentile range of soil moisture in a given respiration chamber, to avoid the influence of extreme values. The increment tolerance threshold (Δθtolerance) was set to 2 % of the soil moisture range – if there is no soil moisture increase larger than Δθtolerance in the previous 24 h, the point is retained as part of the drying period. The rewetting threshold (Δθrewet) was defined as 10 % of the soil moisture range – if soil moisture increases by more than Δθrewet, we assume that a rewetting event is occurring and the point is a part of a drying period. For datasets with strong daily fluctuations (named “d20190517_MAURITZ” and “d20190617_SCOTT_WKG” in the COSORE datasets as well as in Supplement S1), we set Δθrewet=25 % of the soil moisture range and Δθtolerance=12.5 % of the soil moisture range. This choice allows a balance to be reached in these two datasets between the number of rewetting events retained in the analysis and their quality (i.e., how clearly they can be identified). Based on these definitions, both Δθrewet and Δθtolerance differ between sites, reflecting their different soil moisture regimes.
The last points of each drying period were regarded as the start of 48 h long candidate rewetting events. Candidate rewetting events were considered rewetting events if datasets covered a period longer than 36 h after the end of drying and included at least five respiration measurements. In some cases, multiple rewetting events occurred within 48 h after one end of the drying period. If such rewetting events occurred within 24 h of the end of the drying period, we regarded them as a single rewetting event (Fig. 1, second peak). In these cases, soil moisture remains high due to the subsequent rain events. If the second rewetting occurred after 24 h, the whole rewetting event was excluded. These criteria restricted the selected rewetting events to those with a clear soil moisture increase within 24 h, followed by drying. In this way, we ensured that all rewetting events were comparable.
The soil moisture values at the end of each drying period were defined as soil dryness (fraction, %) (Fig. 1), and the largest soil moisture increments within the next 48 h were defined as rewetting intensities (fraction, %) (Fig. 1). The mean temperature and the mean respiration rates during the 48 h rewetting events were obtained from the measured time series of temperature and respiration.
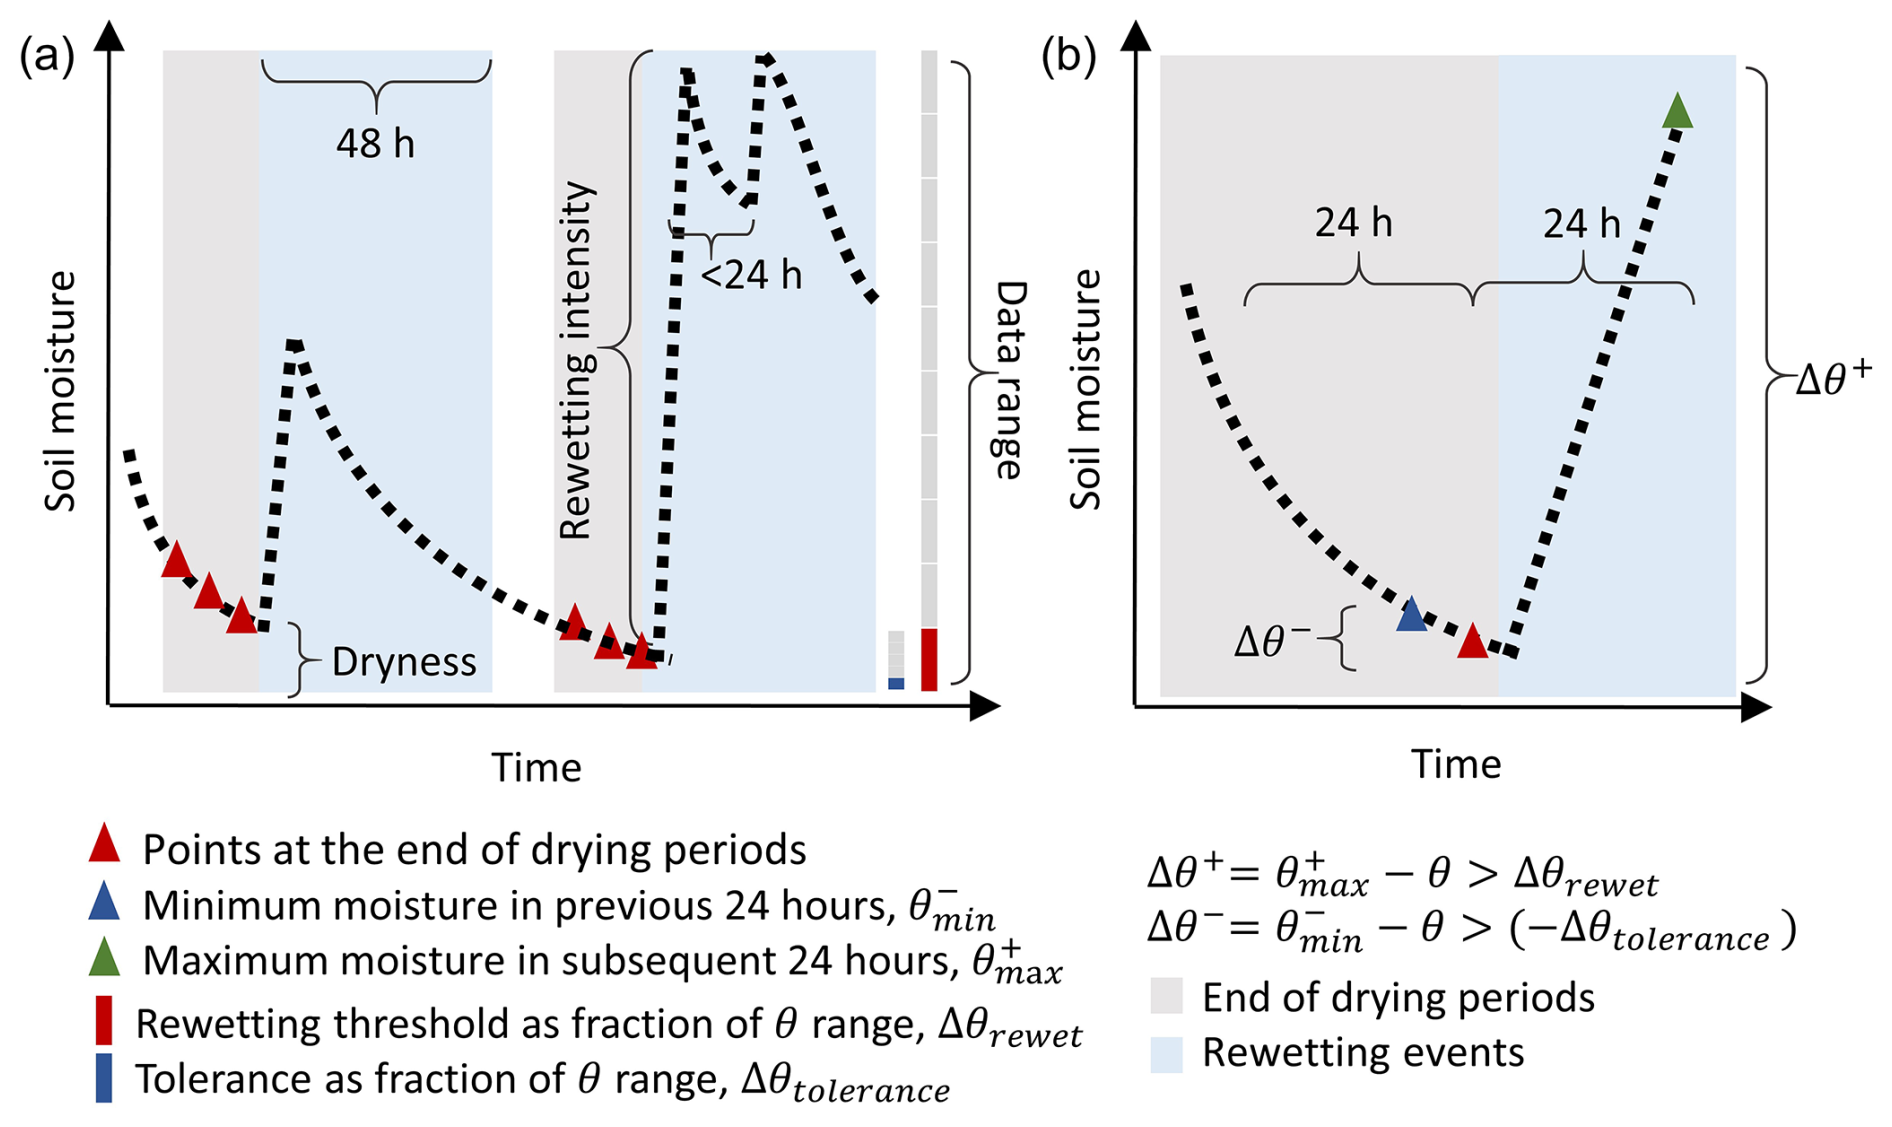
Figure 1(a) Examples of the end of drying periods (in grey) and rewetting events (in light blue) for time series of soil moisture data in the field datasets. (b) An example of the points to be selected within the end of the drying period.
2.5 Data analysis
Random forest is an ensemble of decision trees. By averaging over the prediction made by each decision tree, random forest models are able to provide robust predictions for both classification and regression problems. Random forest regressions often perform remarkably well for ecological prediction as they can account for nonlinear and complex relationships (Huntingford et al., 2019), so we adopted this approach to evaluate insights into the drivers of respiration during DRW events.
Random forest regressions (randomForest package in R) were used to predict the two response variables – mean respiration rates over 2 d after rewetting in the laboratory (LR measured in ) and the field (FR measured in ) – by six candidate predictor variables: soil dryness (soil moisture at the end of drying, expressed as % WHC for LR and as volumetric soil moisture (%) for FR), rewetting intensity (% WHC for LR; volumetric soil moisture (%) for FR), temperature (incubation temperature for LR; soil temperature in the field for FR), SOC content, and AI, as well as soil sampling depth for LR and soil moisture sensor depth for FR. The ranges and distributions of the values of these drivers for LR and FR are shown in Fig. 2. FR, LR, and SOC were log transformed to ensure a better normality of the residuals.
To obtain the best random forest regression model, we built 500 decision trees for each model. To build individual trees, random forest uses a bootstrapping approach where a subset of data (bootstrap sample) is obtained from the training data by resampling with replacement. The “mtry” parameter controls the number of predictors used at each split of decision trees and induces randomness (Scornet, 2017). In our case, the number of predictors in each subset varies from two to six.
We compared the performance of models with “mtry” settings ranging from 2 to 6. For each “mtry” setting, we trained the models on 80 % of the data individually for LR (n=303) and FR (n=592). We evaluated the models' performance by estimating the variance explained (R2) and root mean squared error (RMSE) obtained between test data (remaining 20 %) and predicted values of test data from the trained random forest models. This training was repeated 50 times, and the mean values of R2 and RMSE from these 50 iterations were used to measure the performance of models for a specific value of “mtry”. The best performance was obtained when “mtry” was set to 3, so this value was selected for the analyses shown in Sect. 3.
To assess the importance of the chosen six predictor variables, we used two different goodness of fit metrics: the percentage increase in mean square error (% IncMSE) and the increase in node purity (IncNodePurity) (Fox et al., 2017). For each predictor variable % IncMSE measures the increase in the model mean square error (MSE) when the predictor variable is removed while keeping the values of other variables intact. IncNodePurity measures how much the splitting based on a predictor improves the homogeneity of the nodes in decision trees. The larger the values of % IncMSE and/or IncNodePurity are, the more important that particular predictor variable is (Breiman, 2001). When performing the sensitivity analysis on the respiration unit conversion factors, % IncMSE and IncNodePurity were calculated for each of the 1000 randomly extracted values of contributing depth and bulk density. We then calculated averages and standard deviations of these metrics to evaluate the uncertainty of the importance ranking for each driver.
Finally, we used partial dependence plots to understand the response of individual explanatory variables on respiration rates after DRW events for both field and lab conditions. The partial dependence plots depict the effect of one explanatory variable on the response variable (LR or FR) with the other variables held constant. The partial dependence plots were obtained using the pdp package in R (Greenwell, 2017).
To test if the results were sensitive to our selection of the rewetting events, we increased Δθrewet to 15 % of the soil moisture range for the four datasets without strong daily fluctuation. The results were similar to the results obtained by setting Δθrewet=10 % of the moisture range (not shown). All statistical analysis was performed using R statistical software (version R 4.1.3) (R Core Team, 2022).
The median respiration rates within 48 h after rewetting in the laboratory (LR) and field (FR) were 1.2 and 591.3 , respectively. The 10th and 90th percentiles were 0.3 and 4.1 for LR and 185.4 and 3174.6 for FR (Fig. 2a, b). Among the different drivers we considered, temperature in laboratory incubations was generally higher than that experienced in the field (Fig. 2e, f), soil moisture at the end of drying was lower in the laboratory than in the field (Fig. 2g, h), and field sites did not differ in AI as much as sites sampled for laboratory incubations (Fig. 2k, l). The ranges of SOC and rewetting intensity were instead similar between laboratory and field datasets (Fig. 2c, d, i, j).
The random forest regressions explained 85 % and 79 % of the variance of log-transformed LR (RMSE = 0.35) and FR (RMSE = 0.36), respectively. The two most important predictors of LR were SOC and AI (Fig. 3), followed by incubation temperature, dryness, and rewetting intensity. The most important predictors of FR were soil temperature and aridity index, with soil dryness, SOC, and rewetting intensity following in the importance ranking. Moreover, soil sampling depth for LR and soil moisture sensor depth for FR had the lowest importance (Fig. 3).
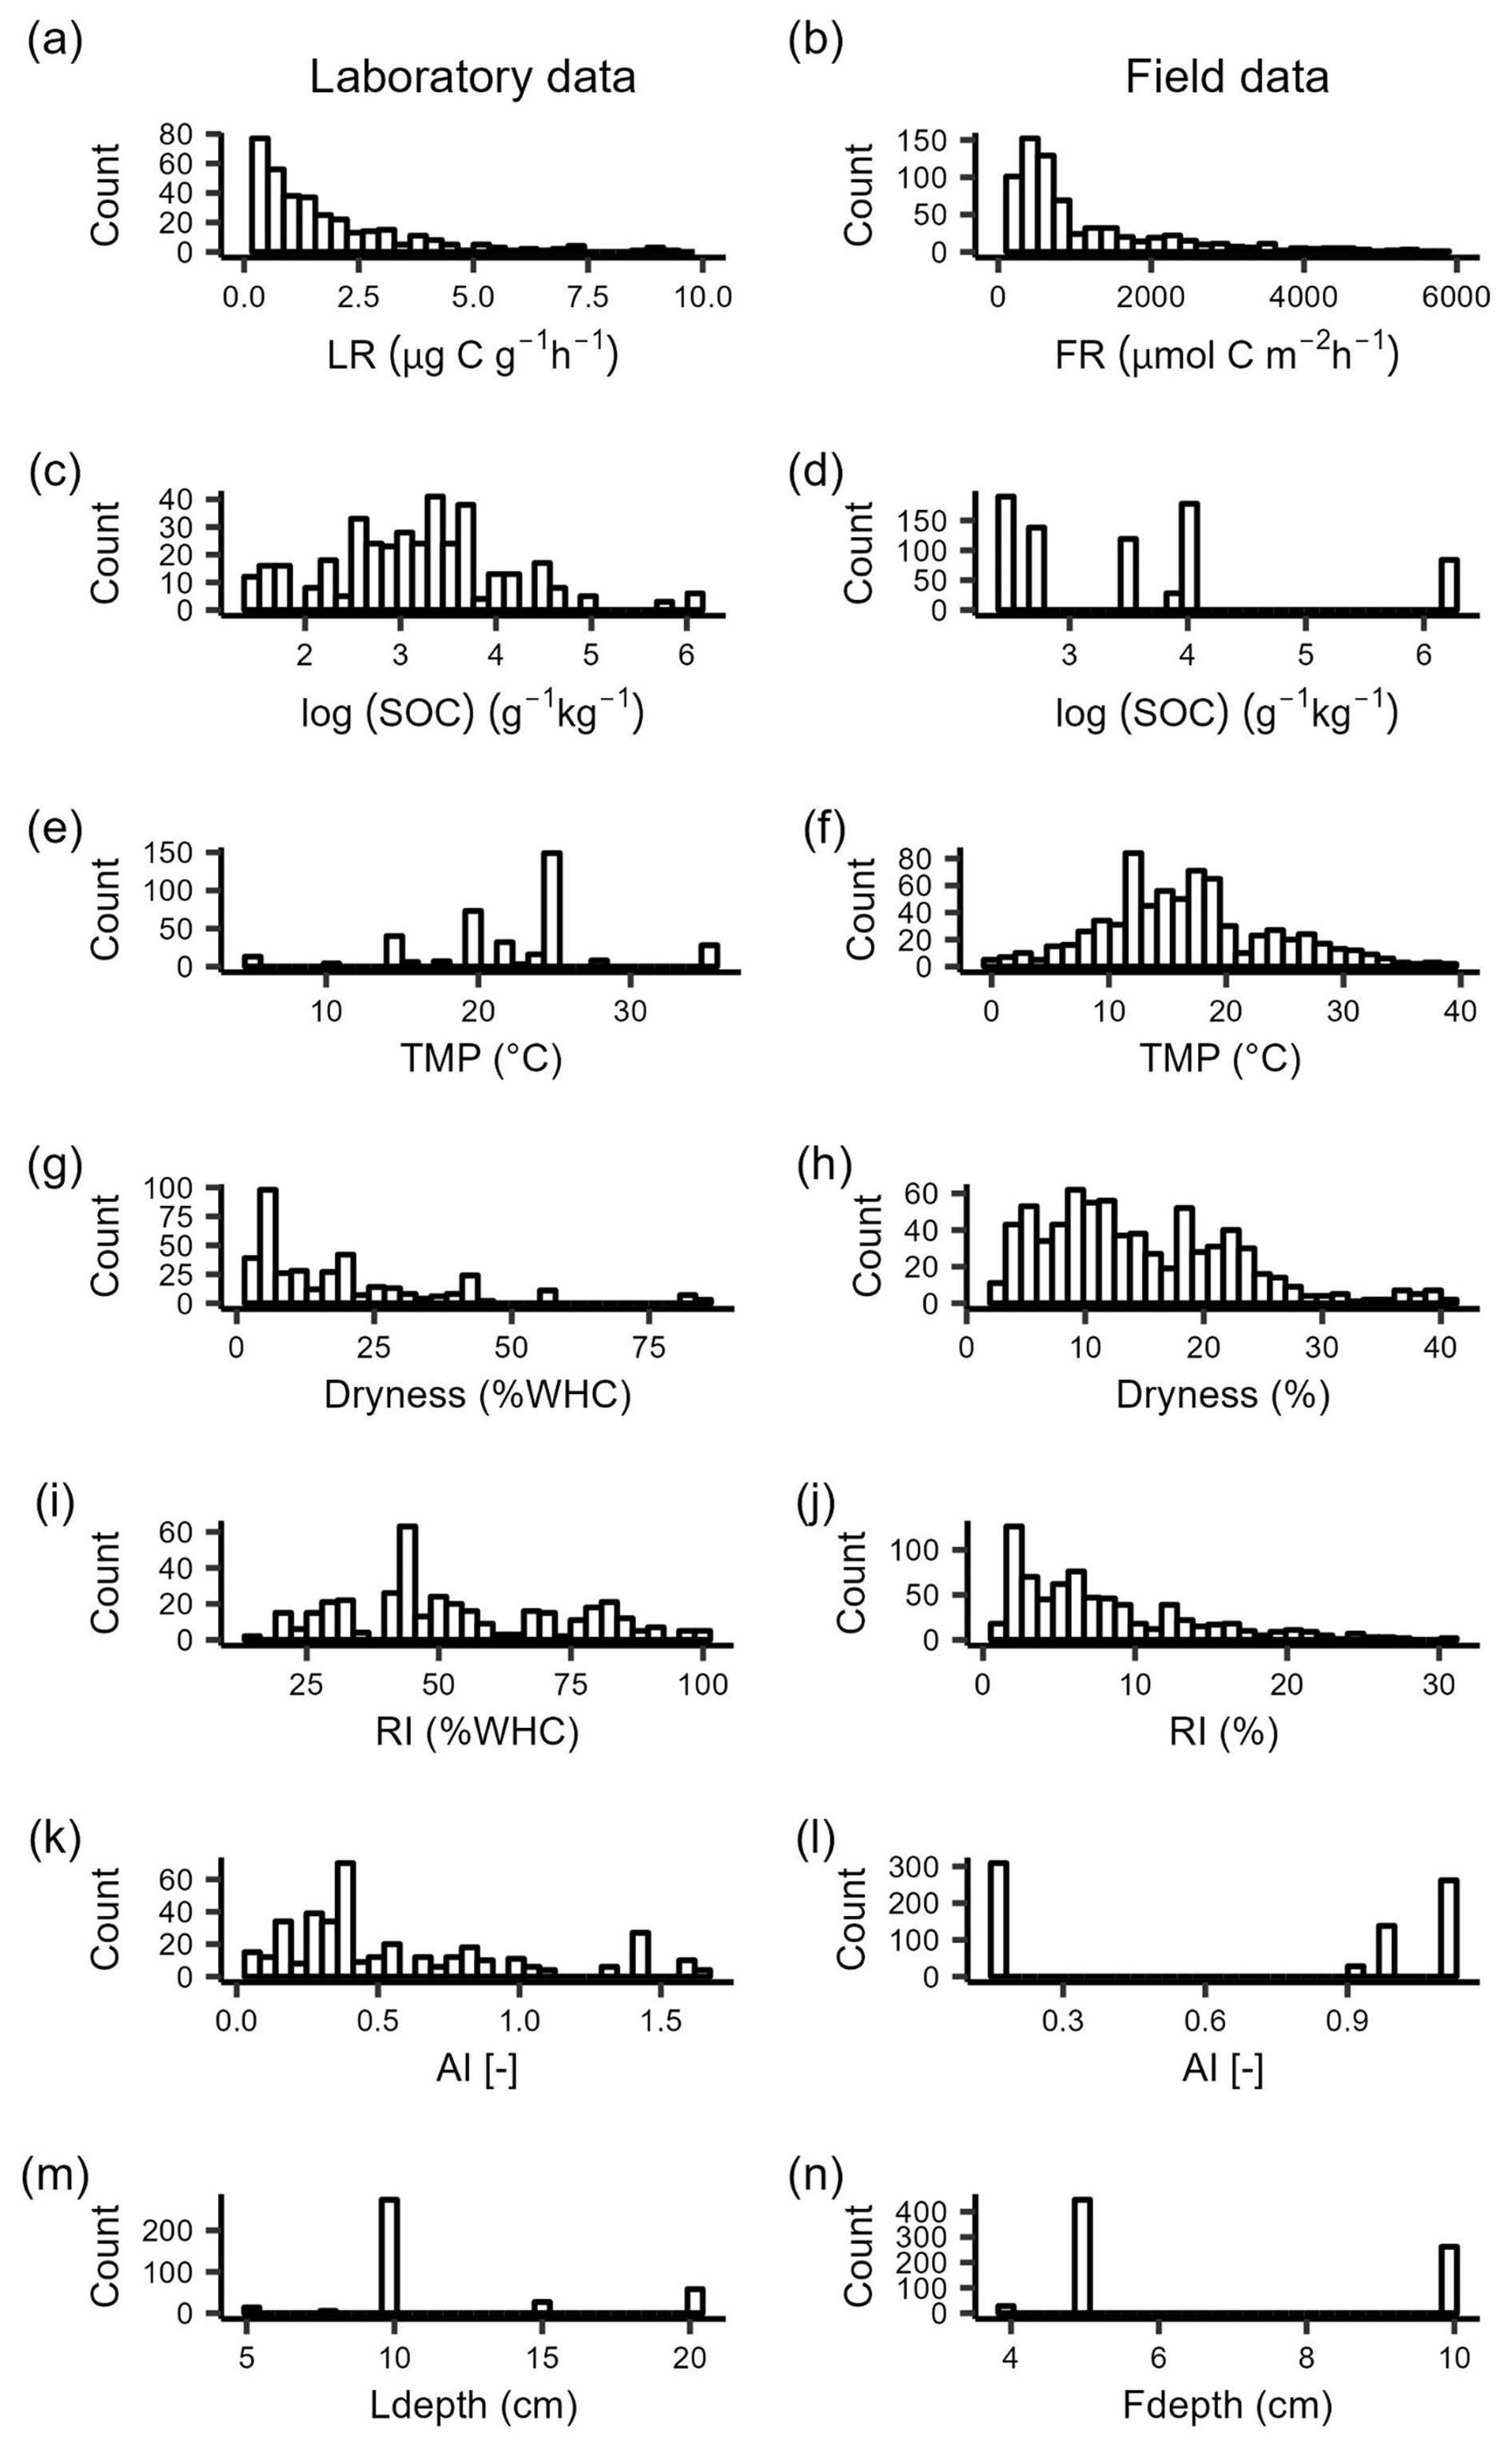
Figure 2Data distribution of respiration rates over 48 h after rewetting in (a) laboratory rewetting events (LR, ) and (b) field rewetting events (FR, ). LR values larger than 10 and FR values larger than 100 are not shown. Data distribution of candidate drivers of respiration rates after rewetting in the laboratory and in the field: (c, d) SOC, soil organic carbon content; (e, f) TMP, incubation temperature for laboratory data and soil temperature in the field for field data; (g, h) dryness (soil moisture at the end of the experimental drying); (f, l) RI, rewetting intensity (soil moisture increment at rewetting); (g, m) AI, aridity index; (h, n) Ldepth, soil sampling depth for laboratory data, and Fdepth, soil moisture probe depth for field data.
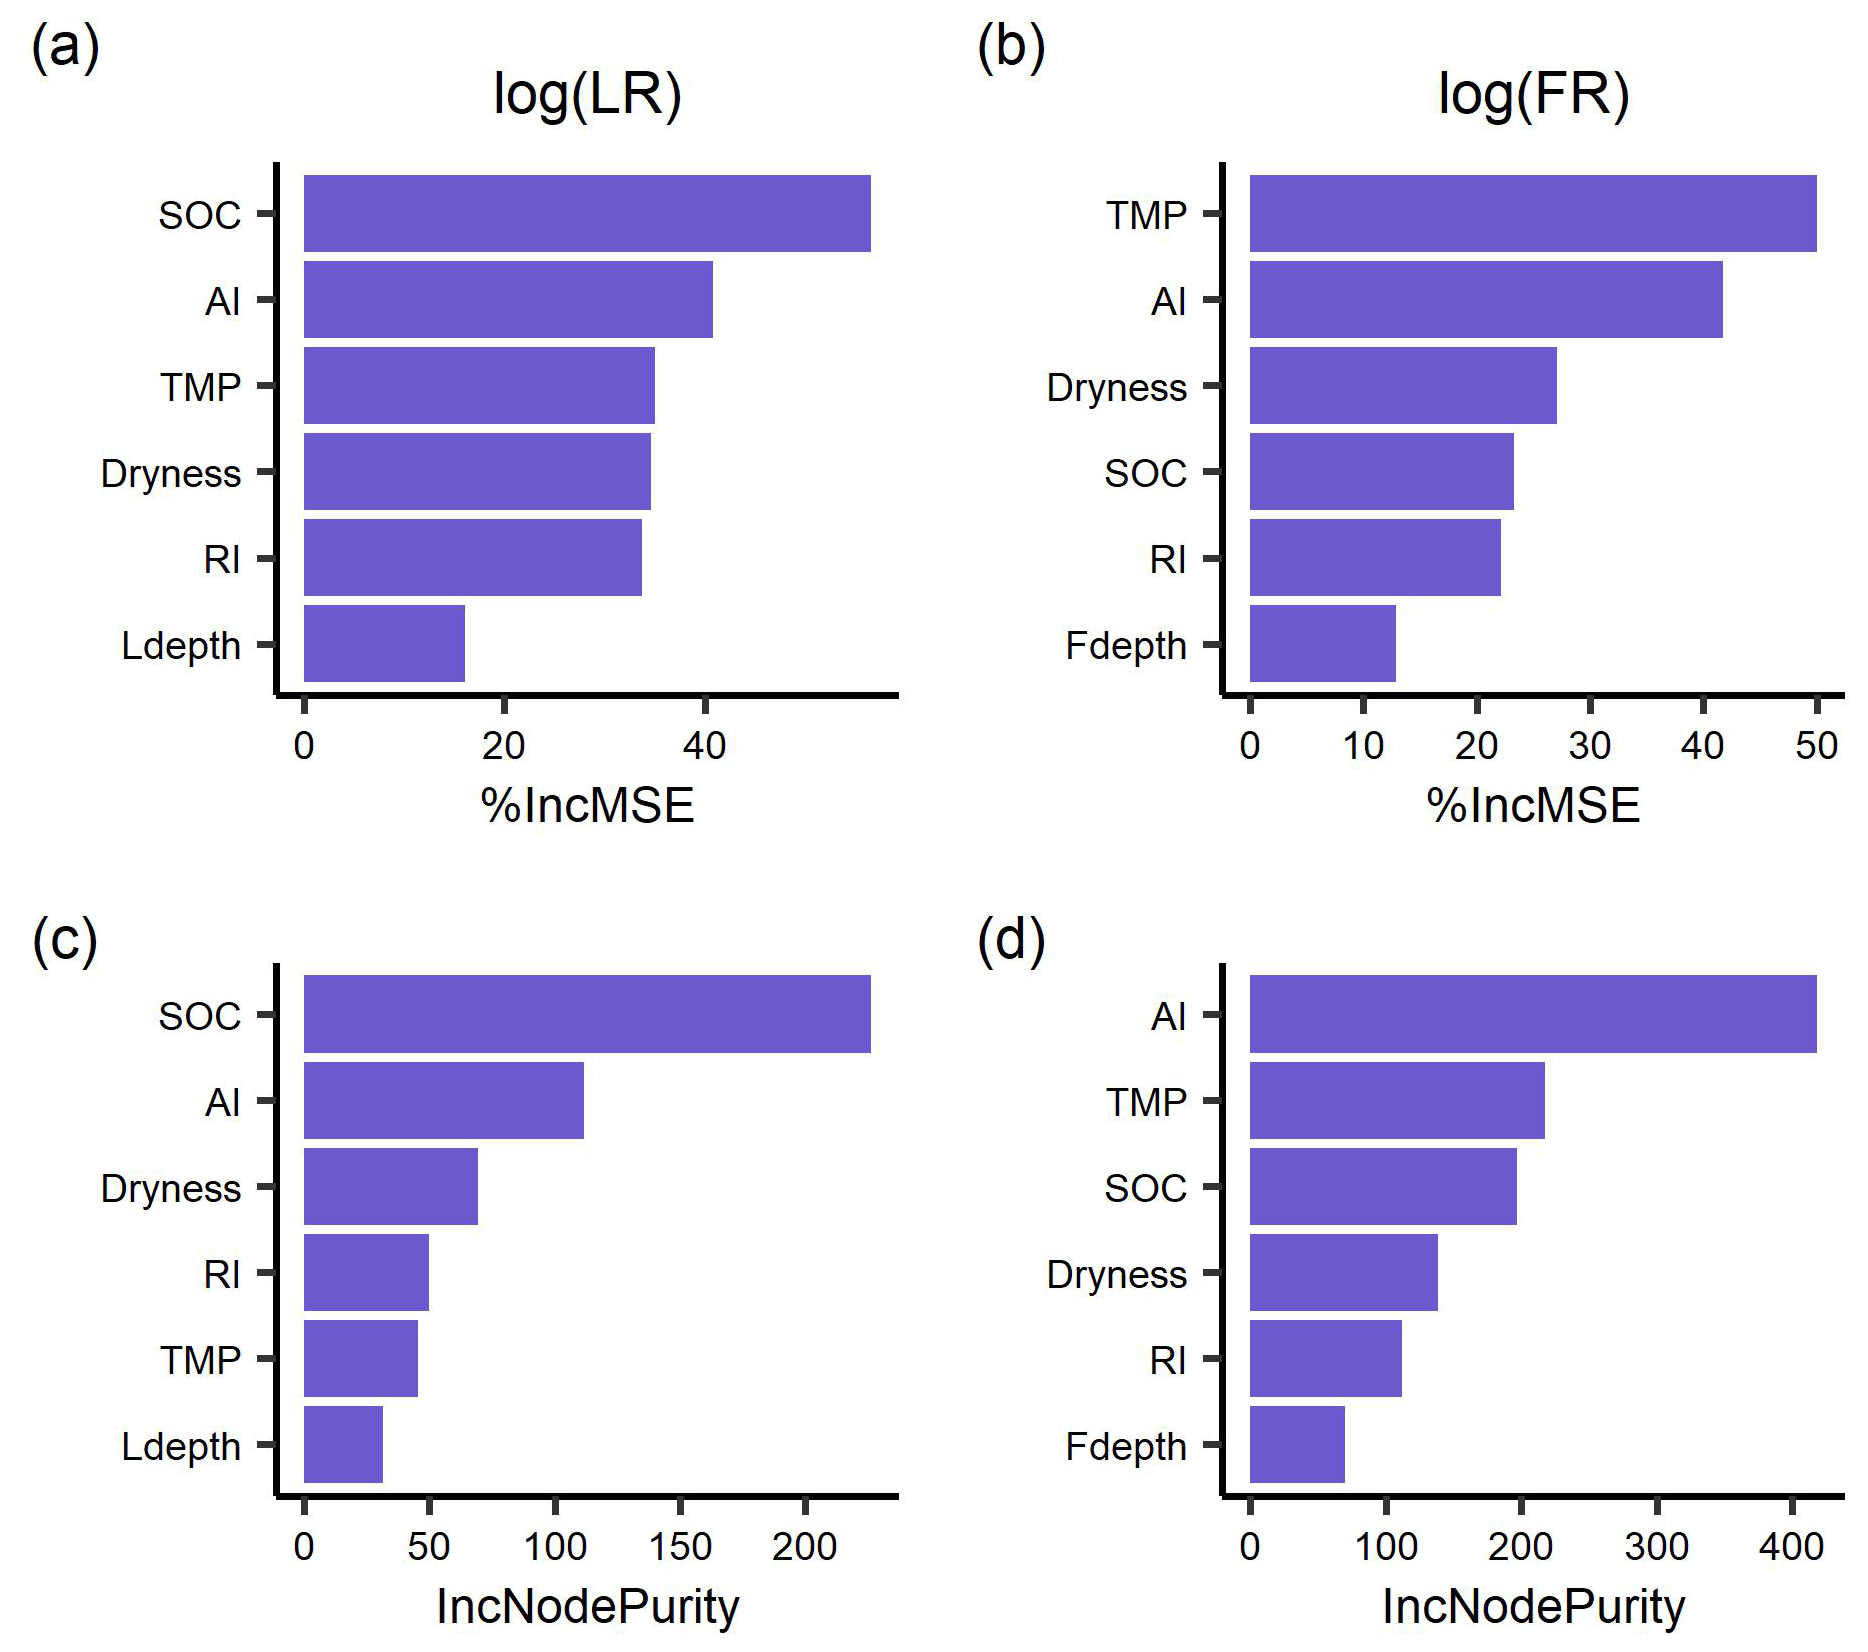
Figure 3The importance ranking of predictors for mean respiration rates during 48 h after rewetting, from laboratory (LR) and field (FR) measurements, based on random forest models using % IncMSE (a, b) and IncNodePurity (c, d). Predictors include soil organic content (SOC), aridity index (AI), soil dryness, rewetting intensity (RI), incubation temperature for LR and soil temperature for FR (TMP), and soil sampling depth for LR (Ldepth) and soil moisture sensor depth for FR (Fdepth).
Both LR and FR increased with SOC where SOC contents were low (Fig. 4a, b). While LR stabilized when SOC was larger than 90 g kg−1, FR continued increasing afterward (Fig. 4a). LR increased with temperature and then stabilized around 25 °C, and FR closely followed the same trend and stabilized around 20 °C (Fig. 4b). FR first increased with soil dryness up to 10 % and then declined for drier conditions, which is inconsistent with the observed monotonic decline in LR (up to 45 % WHC) (Fig. 4c). FR increased with rewetting intensity, while LR decreased with rewetting intensity (Fig. 4d). LR increased with increasing aridity index (i.e., in wetter climates), but differences between LR and FR trends with aridity index are difficult to assess mostly because of the narrow range of aridity index values at the field sites (Fig. 4e). FR declined with increasing depth at which the soil moisture probe was positioned (within the 0–10 cm soil layer), and LR first increased and then declined with soil sampling depth (Fig. 4f).
To summarize, the increasing effects of SOC and TMP on respiration were consistent in laboratory and field conditions, and the effect of soil dryness was similar only when drying was not severe or very mild. Rewetting intensity had opposite effects in laboratory and field conditions, and we were not able to draw solid conclusions for climate legacy effects (using AI as a climate index) due to the limited data range in the field datasets. The similarities between respiration rate responses to at least some drivers found between laboratory data and field data partly support our hypothesis that the laboratory insights could be validated under field conditions.
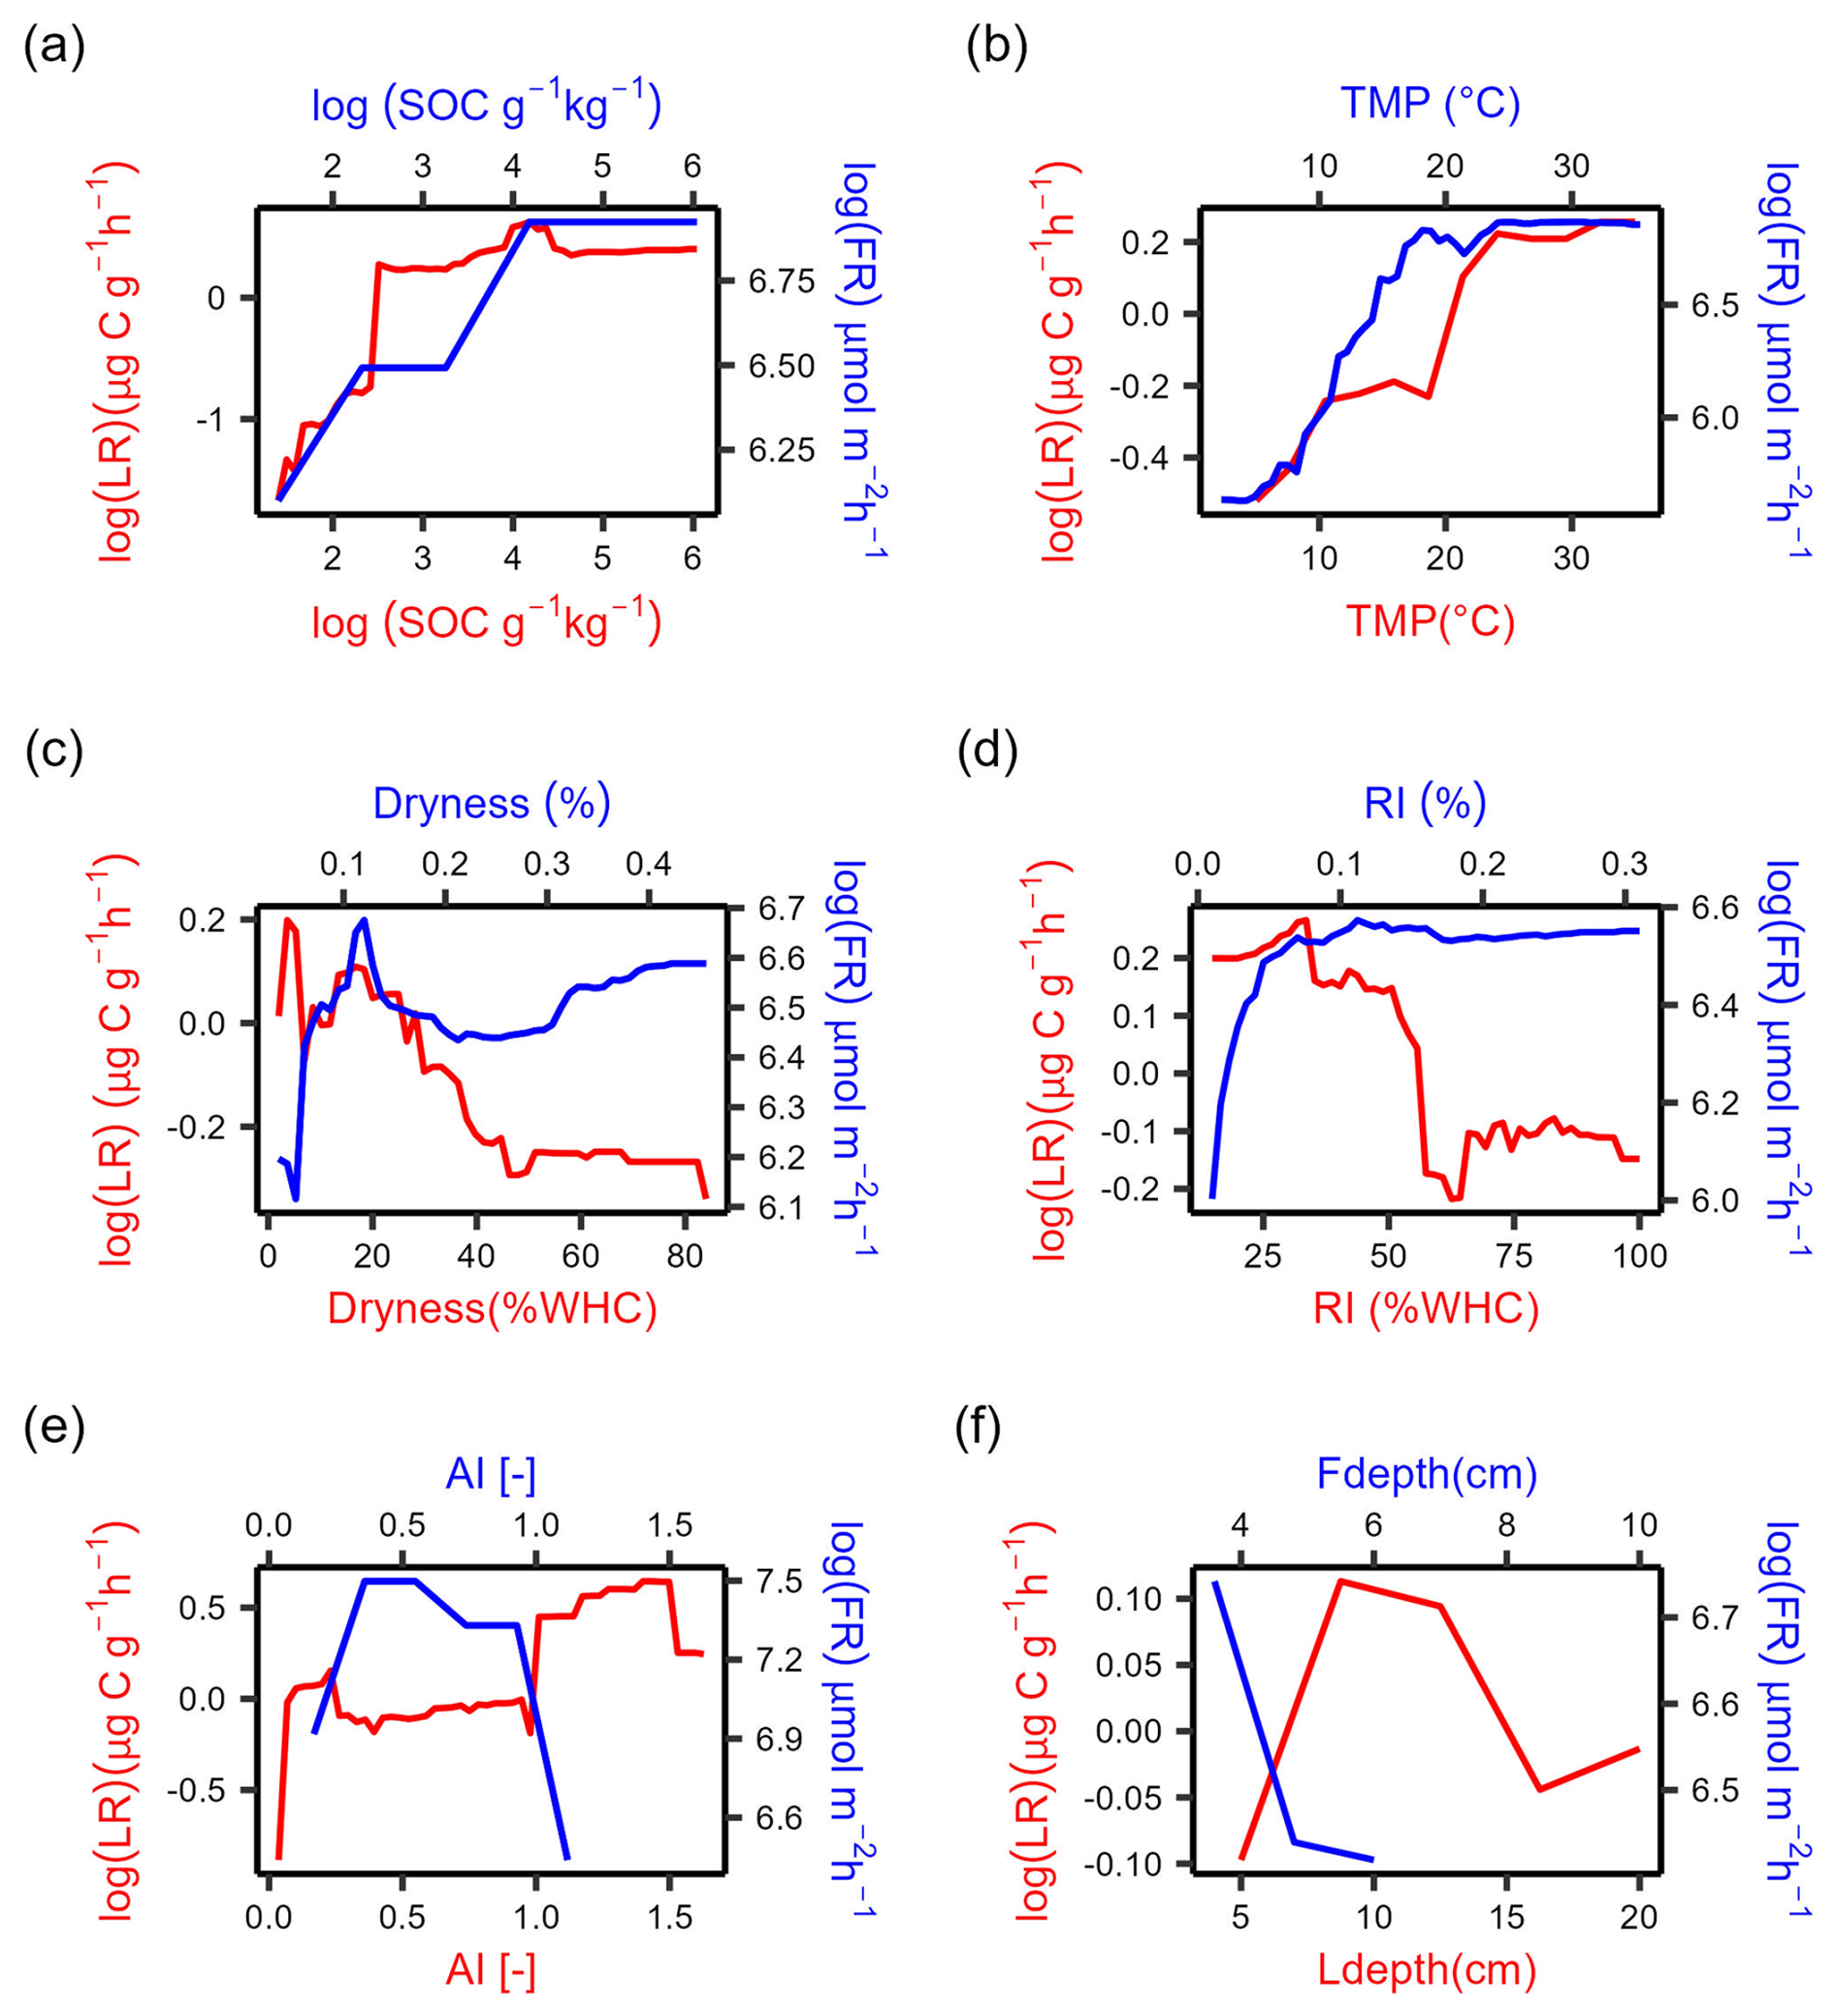
Figure 4Partial dependence plots for the selected predictors of absolute respiration rate over 48 h after laboratory rewetting (LR, red curve) and field rewetting (FR, blue curve) based on the random forest model. Abbreviations: SOC, soil organic carbon content; dryness (soil moisture at dry condition); RI, rewetting intensity (soil moisture increment at rewetting); TMP, incubation temperature for LR and soil temperature for FR; AI, aridity index; Ldepth, soil sampling depth for LR; Fdepth, soil moisture sensor depth for FR. The y axes represent the marginal effect of each predictor on LR and FR while holding all other predictors constant.
4.1 Validation of insights from laboratory soil drying–rewetting experiments using field data
Applying knowledge gained from laboratory studies conducted in controlled conditions to predict CO2 emissions under field conditions is challenging because laboratory incubations require some degree of soil sample disturbance and the imposed environmental conditions do not match those experienced in the field. This difference between undisturbed soil conditions in the field and homogenized soil in the laboratory motivated us to attempt a validation of laboratory insights into the drivers of microbial respiration pulses at rewetting using respiration data from trenched plots in the field. To this aim, we compared the importance rankings and respiration responses to several drivers using laboratory and field datasets. This comparison relies primarily on the qualitative shapes of the respiration responses to soil and climatic drivers rather than a direct quantitative comparison of the drivers' effects on respiration. This approach is due to concerns that differing driver distributions (especially for temperature and soil moisture at the end of drying; Fig. 2) and varying units of respiration rate and moisture may complicate direct quantitative comparisons between laboratory and field datasets. In general, our results are consistent with our hypothesis that laboratory insights could be partly validated using field datasets.
Soil heterotrophic respiration rate at rewetting increased with increasing SOC in both lab and field datasets (Fig. 4a). The positive relation between SOC and respiration is consistent with previous studies (Canarini et al., 2017; Harrison-Kirk et al., 2013) and is probably due to the increased substrate availability with increasing SOC content. In addition, the SOC sensitivity of respiration was higher in the laboratory dataset than in the field (respiration reaches a plateau at SOC ≈90 g kg−1; Fig. 4a), suggesting that the sensitivity of respiration to SOC in the laboratory might be overestimated. One reason to explain the overestimation is that soil-sieving may have helped to release substrates physically protected by micro-aggregates compared to intact aggregates in the field (Kpemoua et al., 2022; Zhang et al., 2022b), resulting in proportionally more bioavailable SOC for a given level of SOC content. Another reason may be that dissolved organic carbon can be lost via leaching in the field (Liu et al., 2018; Rupp et al., 2021), but this does not necessarily happen in the laboratory, where samples are contained in closed jars. As a result, there can be more bioavailable carbon in the laboratory experiments to fuel the respiration pulse at rewetting. If this overestimation of SOC effects on respiration obtained from laboratory studies could be further quantitatively confirmed, then we would expect lower sensitivity of respiration to intensified DRW cycles compared to the emissions measured in the laboratory. It should also be noted that the SOC effects on heterotrophic respiration after rewetting in natural field conditions are related to labile carbon input from plants. In contrast, no labile carbon was added in the laboratory studies we considered. To allow comparing laboratory and field data, we used field respiration rates from trenched plots in the absence of plants. A more complete assessment of SOC effects on respiration rates should consider in both laboratory incubations and field studies the contribution of labile carbon from plants. To conclude, the positive effects of SOC on respiration after rewetting in the laboratory could be confirmed using field data even though laboratory studies may quantitatively overestimate the sensitivity of respiration to changes in SOC.
Soil heterotrophic respiration rate at rewetting increased in warmer soil in both laboratory and field conditions. The observed increases were generally consistent with previous studies (Nissan et al., 2023), but the patterns can vary between studies. The observed plateaus above 20 °C (Fig. 4b) might suggest the presence of a peak of the temperature response (Niu et al., 2024), with possible declines outside the range of temperatures in our data. This concave downward trend differs from the exponential increase (Andrews et al., 2023) (15 to 45 °C) and linear increase (Cruz-Paredes et al., 2023) (0 to 50 °C) found in other studies. These inconsistencies could be explained by the relatively low substrate availability in our datasets compared to other studies, as we considered both laboratory and field respiration during multiple DRW cycles and substrate availability declines with the number of DRW cycles (Zhang et al., 2020). In addition, temperature sensitivity (Q10, estimated here as the ratio of respiration rate at 20 °C over respiration rate at 10 °C) was lower in laboratory data (Q10=1.2) than in field data (Q10=2.3). This indicates that temperature sensitivity might be underestimated in the laboratory dataset. However, the Q10 value for the laboratory studies was estimated based on the results from the random forest model, which were derived from temperature data that mostly ranged between 15 and 25 °C (Fig. 2f), so this value could be low because of inaccurate predictions by the random forest model. This comparison would benefit from a more accurate estimation of Q10 from laboratory studies, which would be possible if more datasets were covering the temperature range within 10 to 20 °C. This lower sensitivity could also be explained by the sieving of soils used in the laboratory incubations. In fact, sieving breaks down macro-aggregates into micro-aggregates (Qin et al., 2019), which exhibit lower temperature sensitivity (Kan et al., 2022). Based on this evidence, we further speculate that in the field, temperature affects carbon release from physically protected pools (aggregates and mineral-associated carbon) and thus has a more important role than bulk SOC, but this role could be weaker in the laboratory due to soil-sieving. This could explain why SOC was the most important driver of LR, while TMP was either most important or ranked second for FR (Fig. 3). Taken together, the positive effects of temperature on respiration after rewetting in the laboratory could be confirmed using field data. However, correcting the bias of the temperature sensitivity of respiration due to the changed aggregate distribution after sieving may help to integrate insights from laboratory and field conditions.
Drier soils before rewetting drive higher soil heterotrophic respiration after rewetting in laboratory experiments but not always in field conditions. The drier the soil before rewetting, the larger the LR. This trend is consistent with previous studies (Cable et al., 2008; Fischer, 2009; Manzoni et al., 2020; Patel et al., 2021; Xu et al., 2004; Yan et al., 2014) and can be explained by the greater amount of substrate accumulated in drier soils before rewetting (longer dry periods) (Schimel, 2018; Warren, 2020). It should be noted that this pattern emerges probably because soils were dried to a larger extent in laboratory conditions than they would in the field (Fig. 2g, h), resulting in large respiration pulses with a strong dependence on dryness before rewetting. In contrast, respiration in the field showed the same pattern only at intermediate values of soil moisture before rewetting (10 % to 30 % of volumetric soil moisture) (Fig. 4c), while it was lowest after rewetting very dry soils and relatively high after rewetting already wet soils – this pattern was not expected. In field conditions, dry soils can be rewetted slowly unless a large rainfall event occurs, which could explain why very dry soils do not always cause a large respiration pulse. Moreover, in the field, shrinking dry soils can make substrates less accessible for microbial decomposition (Beare et al., 2009) and reduce O2 dissolution and diffusion (Zhang et al., 2022a). The high respiration after rewetting of wet soil could instead be potentially related to anaerobic reaction pathways releasing carbon (Fairbairn et al., 2023). In addition, we speculate that soil physical properties during the dry period could control the respiration rate after rewetting (Navarro-García et al., 2012), but such properties are modified in the laboratory due to soil-sieving before the incubations. Thus, respiration increased with prior soil dryness in laboratory conditions but only in a narrow moisture range in the field conditions. To ensure that the effects of dryness on rewetting respiration from laboratory studies are comparable to those in the field, we suggest to conduct DRW experiments using intact soil cores (Muhr et al., 2010).
The effects of rewetting intensity on soil heterotrophic respiration differed between laboratory and field conditions. Field respiration increased with increasing rewetting intensity (larger soil moisture increments after rewetting; Fig. 4d), whereas laboratory respiration decreased with rewetting intensity (Fig. 4d). The increasing trend from the field data is consistent with the idea that a larger soil moisture increment after rewetting can release more substrates that had been previously inaccessible and thus a larger respiration pulse (Homyak et al., 2018; Lado-Monserrat et al., 2014; Navarro-García et al., 2012). The decreasing trend from the laboratory data could be explained by the delayed peak respiration rates due to microbial stress after large rewetting events (Li et al., 2023a; Meisner et al., 2017). For example, air-dried soils in some laboratory studies were rewetted to 50 % WHC (Li et al., 2023a), which is a very large change from the perspective of soil microbes trying to regulate turgor pressure. As the delay time for respiration can exceed 2 d for such large moisture increments (Li et al., 2023b), it is possible that averaging respiration rates over 2 d might underestimate the actual respiration pulse. Moreover, soil pores may become saturated in large rewetting events, resulting in oxygen limitation and thus lower respiration (Erinle et al., 2021; Keiluweit et al., 2016; Maier et al., 2011; Silver et al., 1999). Because soil moisture typically declines in the field immediately after it peaks, the period of limited oxygen availability coupled with high soil moisture may be shorter in the field than in the laboratory, so the soil moisture increment in the field may not be as important a driver of carbon emissions in the field as it is in the laboratory. In addition, soil rewetting is not always characterized by a uniform soil moisture increment – the wetting front propagates vertically downwards and from the macropores laterally into the bulk soil, resulting in heterogeneous conditions at least during the initial rewetting phase. As laboratory soils are more uniform than soils in natural conditions, laboratory rewetting can lead to homogenous moisture faster compared to rewetting in the field. This difference in water redistribution might be a reason for the different effects of rewetting intensity on respiration in laboratory vs. field conditions. However, we argue that averaging respiration over 48 h has helped to reduce this issue. To summarize, laboratory insights about rewetting intensity were not validated by field datasets and more laboratory experiments are needed to test the effect of a range of soil moisture increments at rewetting and to mimic the soil moisture declines after rewetting that often occur in field conditions.
Aridity index was positively correlated with heterotrophic respiration in the laboratory, but the relation was not clear in the field (Fig. 4e). We considered a low aridity index as a proxy for climatic conditions characterized by frequent dry periods that might trigger the adaptation of microbial communities to drought. Climate legacy effects might then emerge in our data analysis if respiration after rewetting varied with aridity index. However, with field datasets clustered in a narrow range of climate zones, we cannot confidently validate laboratory insights about climate legacy effects on respiration. In contrast, thanks to the wide spatial variation in soils in laboratory studies, climate legacy effects on respiration emerged in the laboratory dataset. These legacy effects were consistent with the expected lower microbial adaptation to drought in wetter climates (large values of aridity index) causing larger respiration pulses at rewetting (Tang et al., 2023; Winterfeldt et al., 2024). Moreover, climate legacy effects in the laboratory would not be easily observed if soil samples were obtained from areas with limited climatic variations (Leizeaga et al., 2021). In addition, we speculate that the closer soil structure, substrate availability, and microbial characteristics are to the field conditions, the easier it would be to detect climate legacy effects (Kaiser et al., 2015). This might explain why some experiments have shown climate legacy effects (Broderick et al., 2022; Hawkes et al., 2017, 2020) while others have not (Leizeaga et al., 2021). Moreover, it is possible that climate legacy effects might emerge in laboratory incubations because soil moisture is maintained at high values after rewetting, while in the field moisture values decline rapidly in dry areas with high evaporation rates, limiting the chances to detect legacy effects. The validation of climate legacy effects on respiration will need more laboratory experiments on intact soils and more globally distributed field datasets.
We initially expected that respiration pulses induced by rewetting could depend on soil sampling depth. This is because respiration sensitivity to changes in soil moisture varies with depth (Berg et al., 2017; Pallandt et al., 2022) due to the vertical difference in soil properties (Hicks Pries et al., 2023; Kirschbaum et al., 2021; Slessarev et al., 2020), soil moisture memory, and microbial acclimation to DRW (Brangarí et al., 2022; Engelhardt et al., 2018; Hicks, 2023). However, soil sampling depth was not a strong predictor of the respiration pulses (Fig. 3). This may be due to the soil-sieving in the laboratory mixing the entire sampled profile and thus reducing soil differences across depths. In addition, we expected an important role for soil moisture sensor depth in predicting field respiration, as deep sensors report more buffered soil moisture variations than surface sensors, causing longer time lags of soil moisture changes and respiration changes – yet, we found negligible effects of sensor depth on the respiration pulses compared to the other drivers we considered (Fig. 3).
4.2 Uncertainties
We would expect that the results obtained by averaging respiration over 48 h may differ from those obtained using a shorter averaging time interval. This is because intense drying and rewetting events in the laboratory can cause a delay in the respiration pulse (Li et al., 2023a; Meisner et al., 2017), and sometimes the delay time can even exceed 2 d (Li et al., 2023b). To test if the results were sensitive to our choice of the respiration averaging time interval, we reduced the time interval in the field datasets, where measurements were at sufficiently high frequency. The ranking of the drivers of the mean respiration rates over 24 h was the same as that for the mean respiration rates over 48 h, suggesting that our choice of the time frame might have limited impacts on the results (Fig. A2). This test is not feasible for the laboratory datasets because only about half of the selected laboratory studies allow calculating respiration rates during the first 24 h after rewetting. Using only this subset of studies to test the consistency of the results is not ideal because the distribution of the drivers of respiration for this subset differs from that of the whole dataset. Therefore, we did not proceed further with the laboratory data. To test whether the results were sensitive to the difference in respiration units between the laboratory and field data, we performed a sensitivity analysis. The results showed that temperature and aridity index were still ranked as important drivers (Fig. A3), which confirms the robustness of our results. Also soil moisture units were different between laboratory and field studies, but the conversion of soil moisture units from percent water holding capacity to volumetric water content depends on the soil water holding capacity, which varies among sites. Without site-specific estimates of water holding capacity, harmonizing the soil moisture units could introduce more uncertainty, so we preferred not to perform any conversion. While we confirmed that harmonizing the respiration units does not change the ranking of the respiration drivers, we cannot exclude that some of the differences between laboratory and field respiration could change after expressing soil moisture with the same units.
Some potentially important drivers of respiration after rewetting were not included in our analysis, so we could not compare their effects between laboratory and field conditions. For example, the duration of the drying period and the number of DRW cycles are expected to increase and decrease respiration rates, respectively (Miller et al., 2005; Tiemann and Billings, 2011). In a test run, adding both to predict respiration in the laboratory did not increase the explained variance. Moreover, the duration of soil drying and the number of DRW cycles are not fixed in the field, where soil moisture fluctuations are driven by stochastic rain events, making the comparison with laboratory conditions difficult. Moreover, soil properties like soil texture and soil pH (Harrison-Kirk et al., 2014; Li et al., 2020; Singh et al., 2023) were not included due to lack of site-specific data. Therefore, whether or not the effects of soil texture and soil pH on respiration pulses are similar in the laboratory and in the field remains an open question. We did not include vegetation types in the data analysis, although plants affect microbial processes and thus the respiration pulses. However, laboratory incubations to study DRW responses are conducted in the absence of vegetation, which forced us to only use field data from trenched plots where roots were not connected to any living plant. Lacking data from incubations with plants, we can only acknowledge that the absence of vegetation limits the generality of our results.
To improve the comparison between laboratory and field conditions, a more accurate prediction of the effects of respiration drivers is needed. This requires that both laboratory and field studies cover more diverse climatic conditions and report more comprehensive information about soil properties. This need arises because the ability of random forest models (also other statistical methods) to explain variation in response variables is limited by low variation in the explanatory variables. Even among the selected drivers, some exhibit low variation in both laboratory and field studies (Fig. 2). With greater variation, the response curves of these drivers – specifically, when and how they increase, decrease, or stabilize – could be more thoroughly verified. To improve our understanding of DRW responses and comparability with field data, laboratory studies should extend to longer periods after rewetting, include more frequent measurements, and cover a wider range of soil moisture at the end of the drying period and of rewetting intensities. Data from these extended experiments would help enhance the robustness of statistical analysis on the compound role of DRW characteristics and pedo-climatic conditions on respiration after rewetting.
4.3 Implications
The validation of laboratory findings on the drivers of the rewetting pulses with field measurements is necessary because laboratory data are often used for the prediction of soil carbon stocks with mathematical models. Incorporating these results into model simulations could help improve the accuracy of soil organic carbon predictions, especially for models that neglect rewetting pulses. In fact, most models of soil carbon cycling assume that respiration is a function of soil moisture (Bauer et al., 2008) but not of moisture changes. Therefore, such models describe how respiration varies when gradual variations in soil moisture occur, such as during drying, while neglecting the large respiration pulses occurring at rewetting. To model rewetting pulses, models need to include processes causing the accumulation of bioavailable carbon during drying or release of labile substrates at rewetting (e.g., Brangarí et al., 2021), but these processes are not easy to represent in a mechanistic way. One could argue that an empirical approach based on data such as those analyzed here could offer an alternative to roughly estimate the amount of carbon emitted at rewetting as a function of SOC, temperature, or other drivers.
The testing and validation of hypotheses emerging from laboratory simulation of soil drying and rewetting are necessary for predicting respiration pulses after rewetting in field conditions. In this study, we compared the respiration response to rewetting using both laboratory datasets and field datasets in the absence of vegetation. Respiration pulses increased with SOC and temperature in both these datasets, but the temperature sensitivity could not be reliably estimated due to the limited range of temperatures explored in laboratory studies. Respiration in the laboratory (but not in the field) also increased with the aridity index, suggesting climate legacy effects but possibly also highlighting possible artifacts induced by how soil moisture is manipulated in the laboratory after the rewetting. Both soil moisture at the end of drying and the rewetting intensity affected respiration differently across datasets. Our comparison is based on nearly 40 laboratory studies but only 6 field studies, so the sample size of the data differs between laboratory and field datasets, and the overlap of the drivers we selected is not complete. Higher-resolution respiration data measured over a longer period and under more varied climatic and soil conditions in both laboratory and field settings would help to enhance the robustness of the outcome of this study. This could further help us to validate laboratory insights and further understand and predict the CO2 emissions in drying and rewetting events.
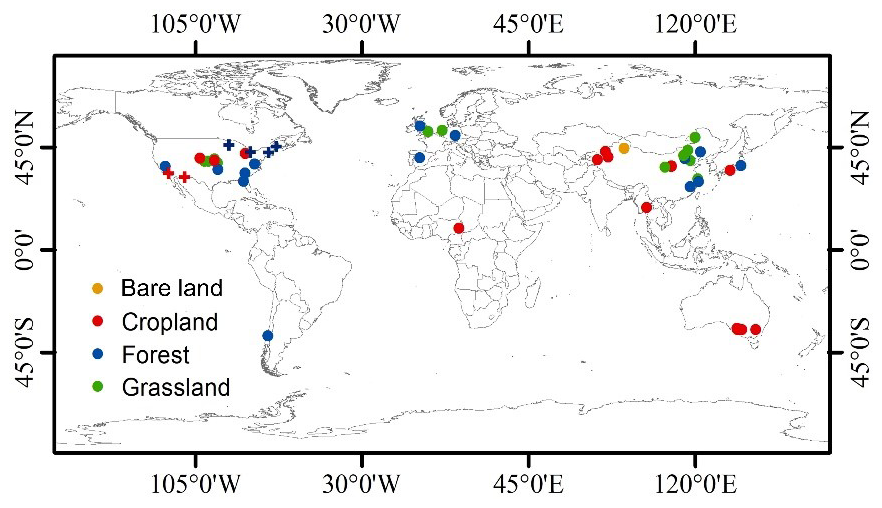
Figure A1The data source distribution: point color shows the land-use/land cover types, and point type shows data from laboratory drying and rewetting experiments (circle) or from the field (cross).
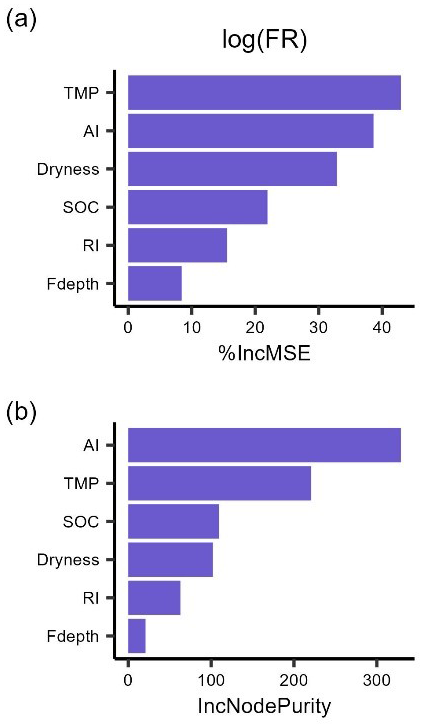
Figure A2The importance ranking of predictors for mean respiration rates during 24 h after rewetting from field (FR) measurements based on random forest models using % IncMSE (a) and IncNodePurity (b). Predictors include soil organic content (SOC), aridity index (AI), soil dryness, rewetting intensity (RI), soil temperature for FR (TMP), and soil moisture sensor depth for FR (Fdepth). This ranking is the same as that obtained when considering a 48 h time interval to average respiration rate after rewetting.
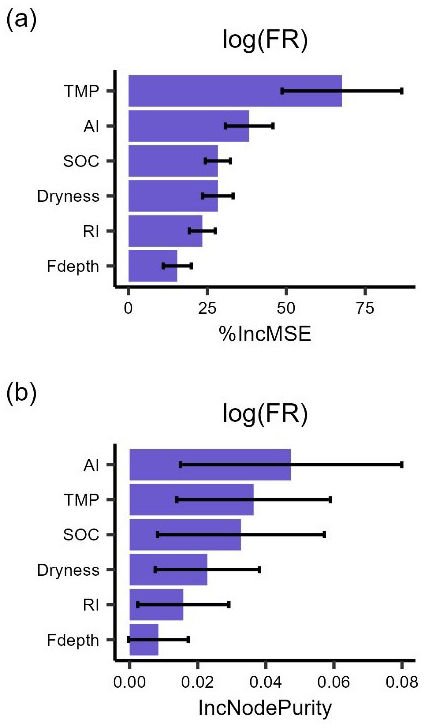
Figure A3The importance ranking of predictors for mean respiration rates () during 48 h after rewetting from field (FR) measurements, based on random forest models using % IncMSE (a) and IncNodePurity (b). Predictors include soil organic content (SOC), aridity index (AI), soil dryness, rewetting intensity (RI), soil temperature for FR (TMP), and soil moisture sensor depth (Fdepth). This ranking is obtained by averaging 1000 importance rankings, where each ranking was obtained by extracting contributing soil depth and bulk density from distributions centered around the estimated values at the six sites. Error bars are the standard deviations of each driver. This result is similar to that obtained when considering field respiration rates with the original units ().
The data that support the findings of this study are reported in Supplement S1.
The supplement related to this article is available online at https://doi.org/10.5194/bg-22-2691-2025-supplement.
XL: conceptualization, formal analysis, investigation, methodology, software, validation, visualization, writing (original draft), writing (review and editing). MP: writing (review and editing), investigation, methodology. DN: methodology, writing (review and editing). JR: funding acquisition, resources, writing (review and editing). GH: supervision, writing (review and editing). SM: conceptualization, funding acquisition, methodology, project administration, supervision, writing (original draft), writing (review and editing).
The contact author has declared that none of the authors has any competing interests.
Publisher's note: Copernicus Publications remains neutral with regard to jurisdictional claims made in the text, published maps, institutional affiliations, or any other geographical representation in this paper. While Copernicus Publications makes every effort to include appropriate place names, the final responsibility lies with the authors.
We thank Jab Olov Persson for discussions on the statistical analysis.
This project has received support from the European Union's Horizon 2020 research and innovation program (European Research Council, grant no. 101001608 and H2020, grant no. 101000289), the Knut and Alice Wallenberg Foundation (grants nos. KAW 2022.0175 and KAW 2023.0384), and Schmidt Sciences, LLC.
The publication of this article was funded by the Swedish Research Council, Forte, Formas, and Vinnova.
This paper was edited by Erika Buscardo and reviewed by three anonymous referees.
Andrews, H. M., Krichels, A. H., Homyak, P. M., Piper, S., Aronson, E. L., Botthoff, J., Greene, A. C., and Jenerette, G. D.: Wetting-induced soil CO2 emission pulses are driven by interactions among soil temperature, carbon, and nitrogen limitation in the Colorado Desert, Glob. Chang. Biol., 29, 3205–3220, https://doi.org/10.1111/gcb.16669, 2023.
Barnard, R. L., Blazewicz, S. J., and Firestone, M. K.: Rewetting of soil: Revisiting the origin of soil CO2 emissions, Soil Biol. Biochem., 147, 107819, https://doi.org/10.1016/j.soilbio.2020.107819, 2020.
Bauer, J., Herbst, M., Huisman, J. A., Weihermüller, L., and Vereecken, H.: Sensitivity of simulated soil heterotrophic respiration to temperature and moisture reduction functions, Geoderma, 145, 17–27, https://doi.org/10.1016/j.geoderma.2008.01.026, 2008.
Beare, M. H., Gregorich, E. G., and St-Georges, P.: Compaction effects on CO2 and N2O production during drying and rewetting of soil, Soil Biol. Biochem., 41, 611–621, https://doi.org/10.1016/j.soilbio.2008.12.024, 2009.
Berg, A., Sheffield, J., and Milly, P. C. D.: Divergent surface and total soil moisture projections under global warming, Geophys. Res. Lett., 44, 236–244, https://doi.org/10.1002/2016GL071921, 2017.
Birch, H. F.: The effect of soil drying on humus decomposition and nitrogen availability, Plant Soil., 10, 9–31, https://doi.org/10.1007/BF01343734, 1958.
Blaud, A., Menon, M., van der Zaan, B., Lair, G. J., and Banwart, S. A.: Effects of Dry and Wet Sieving of Soil on Identification and Interpretation of Microbial Community Composition, in: Advances in Agronomy, vol. 142, Elsevier, 119–142, https://doi.org/10.1016/bs.agron.2016.10.006, 2017.
Bond-Lamberty, B., Christianson, D. S., Malhotra, A., Pennington, S. C., Sihi, D., AghaKouchak, A., Anjileli, H., Altaf Arain, M., Armesto, J. J., Ashraf, S., Ataka, M., Baldocchi, D., Andrew Black, T., Buchmann, N., Carbone, M. S., Chang, S. C., Crill, P., Curtis, P. S., Davidson, E. A., Desai, A. R., Drake, J. E., El-Madany, T. S., Gavazzi, M., Gorres, C. M., Gough, C. M., Goulden, M., Gregg, J., Gutierrez Del Arroyo, O., He, J. S., Hirano, T., Hopple, A., Hughes, H., Jarveoja, J., Jassal, R., Jian, J., Kan, H., Kaye, J., Kominami, Y., Liang, N., Lipson, D., Macdonald, C. A., Maseyk, K., Mathes, K., Mauritz, M., Mayes, M. A., McNulty, S., Miao, G., Migliavacca, M., Miller, S., Miniat, C. F., Nietz, J. G., Nilsson, M. B., Noormets, A., Norouzi, H., O'Connell, C. S., Osborne, B., Oyonarte, C., Pang, Z., Peichl, M., Pendall, E., Perez-Quezada, J. F., Phillips, C. L., Phillips, R. P., Raich, J. W., Renchon, A. A., Ruehr, N. K., Sanchez-Canete, E. P., Saunders, M., Savage, K. E., Schrumpf, M., Scott, R. L., Seibt, U., Silver, W. L., Sun, W., Szutu, D., Takagi, K., Takagi, M., Teramoto, M., Tjoelker, M. G., Trumbore, S., Ueyama, M., Vargas, R., Varner, R. K., Verfaillie, J., Vogel, C., Wang, J., Winston, G., Wood, T. E., Wu, J., Wutzler, T., Zeng, J., Zha, T., Zhang, Q., and Zou, J.: COSORE: A community database for continuous soil respiration and other soil-atmosphere greenhouse gas flux data, Glob. Chang. Biol., 26, 7268–7283, https://doi.org/10.1111/gcb.15353, 2020.
Brangarí, A. C., Manzoni, S., and Rousk, J.: The mechanisms underpinning microbial resilience to drying and rewetting – A model analysis, Soil Biol. Biochem., 162, 108400, https://doi.org/10.1016/j.soilbio.2021.108400, 2021.
Brangarí, A. C., Lyonnard, B., and Rousk, J.: Soil depth and tillage can characterize the soil microbial responses to drying-rewetting, Soil Biol. Biochem., 173, 108806, https://doi.org/10.1016/j.soilbio.2022.108806, 2022.
Breiman, L.: Random Forests, Mach. Learn., 45, 5–32, https://doi.org/10.1023/A:1010933404324, 2001.
Broderick, C. M., Wilkins, K., Smith, M. D., and Blair, J. M.: Climate legacies determine grassland responses to future rainfall regimes, Glob. Chang. Biol., 28, 2639–2656, https://doi.org/10.1111/gcb.16084, 2022.
Cable, J. M., Ogle, K., Williams, D. G., Weltzin, J. F., and Huxman, T. E.: Soil Texture Drives Responses of Soil Respiration to Precipitation Pulses in the Sonoran Desert: Implications for Climate Change, Ecosystems, 11, 961–979, https://doi.org/10.1007/s10021-008-9172-x, 2008.
Canarini, A., Kiær, L. P., and Dijkstra, F. A.: Soil carbon loss regulated by drought intensity and available substrate: A meta-analysis, Soil Biol. Biochem., 112, 90–99, https://doi.org/10.1016/j.soilbio.2017.04.020, 2017.
Chu, H., Ni, H., Ma, J., and Shen, Y.: What is the pathway that determines the diurnal lag time between soil respiration and soil temperature?, Geoderma, 431, 116344, https://doi.org/10.1016/j.geoderma.2023.116344, 2023.
Clapp, R. B. and Hornberger, G. M.: Empirical equations for some soil hydraulic properties, Water Resour. Res., 14, 601–604, https://doi.org/10.1029/WR014i004p00601, 1978.
Cruz-Paredes, C., Tájmel, D., and Rousk, J.: Variation in temperature dependences across Europe reveals the climate sensitivity of soil microbial decomposers, Appl. Environ. Microb., 89, e02090-22, https://doi.org/10.1128/aem.02090-22, 2023.
Dingman, S. L.: Physical Hydrology, 3rd Edn., Waveland Press, Long Grove, IL, 643 pp., ISBN 978-1-4786-1118-9, 2015.
Engelhardt, I. C., Welty, A., Blazewicz, S. J., Bru, D., Rouard, N., Breuil, M.-C., Gessler, A., Galiano, L., Miranda, J. C., Spor, A., and Barnard, R. L.: Depth matters: effects of precipitation regime on soil microbial activity upon rewetting of a plant-soil system, ISME J., 12, 1061–1071, https://doi.org/10.1038/s41396-018-0079-z, 2018.
Erinle, K. O., Bengtson, P., and Marschner, P.: Rewetting Intensity Influences Soil Respiration and Nitrogen Availability, J. Soil Sci. Plant. Nut., 21, 2137–2144, https://doi.org/10.1007/s42729-021-00509-w, 2021.
Fairbairn, L., Rezanezhad, F., Gharasoo, M., Parsons, C. T., Macrae, M. L., Slowinski, S., and Van Cappellen, P.: Relationship between soil CO2 fluxes and soil moisture: Anaerobic sources explain fluxes at high water content, Geoderma, 434, 116493, https://doi.org/10.1016/j.geoderma.2023.116493, 2023.
Fischer, T.: Substantial rewetting phenomena on soil respiration can be observed at low water availability, Soil Biol. Biochem., 41, 1577–1579, https://doi.org/10.1016/j.soilbio.2009.04.009, 2009.
Fox, E. W., Hill, R. A., Leibowitz, S. G., Olsen, A. R., Thornbrugh, D. J., and Weber, M. H.: Assessing the accuracy and stability of variable selection methods for random forest modeling in ecology, Environ. Monit. Assess., 189, 316, https://doi.org/10.1007/s10661-017-6025-0, 2017.
Franzluebbers, A. J.: Holding water with capacity to target porosity, Agric. Environ. Lett., 5, e20029, https://doi.org/10.1002/ael2.20029, 2020.
Greenwell, B. M.: pdp: An R package for constructing partial dependence plots, R J., 9, 421–436, https://doi.org/10.32614/RJ-2017-016, 2017.
Harrison-Kirk, T., Beare, M. H., Meenken, E. D., and Condron, L. M.: Soil organic matter and texture affect responses to dry/wet cycles: Effects on carbon dioxide and nitrous oxide emissions, Soil Biol. Biochem., 57, 43–55, https://doi.org/10.1016/j.soilbio.2012.10.008, 2013.
Harrison-Kirk, T., Beare, M. H., Meenken, E. D., and Condron, L. M.: Soil organic matter and texture affect responses to dry/wet cycles: Changes in soil organic matter fractions and relationships with C and N mineralisation, Soil Biol. Biochem., 74, 50–60, https://doi.org/10.1016/j.soilbio.2014.02.021, 2014.
Hawkes, C. V., Waring, B. G., Rocca, J. D., and Kivlin, S. N.: Historical climate controls soil respiration responses to current soil moisture, P. Natl. Acad. Sci. USA, 114, 6322, https://doi.org/10.1073/pnas.1620811114, 2017.
Hawkes, C. V., Shinada, M., and Kivlin, S. N.: Historical climate legacies on soil respiration persist despite extreme changes in rainfall, Soil Biol. Biochem., 143, 107752, https://doi.org/10.1016/j.soilbio.2020.107752, 2020.
Hicks, L. C.: Drying-rewetting of permanent pasture and agricultural soils induces a shift towards microbial use of more C-rich organic matter, Soil Biol. Biochem., 178, 108928, https://doi.org/10.1016/j.soilbio.2022.108928, 2023.
Hicks Pries, C. E., Ryals, R., Zhu, B., Min, K., Cooper, A., Goldsmith, S., Pett-Ridge, J., Torn, M., and Berhe, A. A.: The Deep Soil Organic Carbon Response to Global Change, Annu. Rev. Ecol. Evol. Syst., 54, 375–401, https://doi.org/10.1146/annurev-ecolsys-102320-085332, 2023.
Homyak, P. M., Blankinship, J. C., Slessarev, E. W., Schaeffer, S. M., Manzoni, S., and Schimel, J. P.: Effects of altered dry season length and plant inputs on soluble soil carbon, Ecology, 99, 2348–2362, https://doi.org/10.1002/ecy.2473, 2018.
Huntingford, C., Jeffers, E. S., Bonsall, M. B., Christensen, H. M., Lees, T., and Yang, H.: Machine learning and artificial intelligence to aid climate change research and preparedness, Environ. Res. Lett., 14, 124007, https://doi.org/10.1088/1748-9326/ab4e55, 2019.
Intergovernmental Panel on Climate Change (IPCC): Climate Change 2022 – Impacts, Adaptation and Vulnerability: Working Group II Contribution to the Sixth Assessment Report of the Intergovernmental Panel on Climate Change, 1st edn., Cambridge University Press, https://doi.org/10.1017/9781009325844, 2023.
Jin, X., Wu, F. Z., Wu, Q. Q., Hedenec, P., Peng, Y., Wang, Z., and Yue, K.: Effects of drying-rewetting cycles on the fluxes of soil greenhouse gases, Heliyon, 9, e12984, https://doi.org/10.1016/j.heliyon.2023.e12984, 2023.
Kainiemi, V., Kirchmann, H., and Kätterer, T.: Structural disruption of arable soils under laboratory conditions causes minor respiration increases, J. Plant Nutr. Soil Sci., 179, 88–93, https://doi.org/10.1002/jpln.201500139, 2016.
Kaiser, M., Kleber, M., and Berhe, A. A.: How air-drying and rewetting modify soil organic matter characteristics: An assessment to improve data interpretation and inference, Soil Biol. Biochem., 80, 324–340, https://doi.org/10.1016/j.soilbio.2014.10.018, 2015.
Kan, Z.-R., Liu, W.-X., Liu, W.-S., He, C., Bohoussou, N. Y., Dang, Y. P., Zhao, X., and Zhang, H.-L.: Sieving soil before incubation experiments overestimates carbon mineralization but underestimates temperature sensitivity, Sci. Total Environ., 806, 150962, https://doi.org/10.1016/j.scitotenv.2021.150962, 2022.
Keiluweit, M., Nico, P. S., Kleber, M., and Fendorf, S.: Are oxygen limitations under recognized regulators of organic carbon turnover in upland soils?, Biogeochemistry, 127, 157–171, https://doi.org/10.1007/s10533-015-0180-6, 2016.
Kirschbaum, M. U. F., Don, A., Beare, M. H., Hedley, M. J., Pereira, R. C., Curtin, D., McNally, S. R., and Lawrence-Smith, E. J.: Sequestration of soil carbon by burying it deeper within the profile: A theoretical exploration of three possible mechanisms, Soil Biol. Biochem., 163, 108432, https://doi.org/10.1016/j.soilbio.2021.108432, 2021.
Kpemoua, T. P. I., Barré, P., Chevallier, T., Houot, S., and Chenu, C.: Drivers of the amount of organic carbon protected inside soil aggregates estimated by crushing: A meta-analysis, Geoderma, 427, 116089, https://doi.org/10.1016/j.geoderma.2022.116089, 2022.
Lado-Monserrat, L., Lull, C., Bautista, I., Lidón, A., and Herrera, R.: Soil moisture increment as a controlling variable of the “Birch effect”. Interactions with the pre-wetting soil moisture and litter addition, Plant Soil., 379, 21–34, https://doi.org/10.1007/s11104-014-2037-5, 2014.
Laio, F., Porporato, A., Ridolfi, L., and Rodriguez-Iturbe, I.: Plants in water-controlled ecosystems: active role in hydrologic processes and response to water stress: II. Probabilistic soil moisture dynamics, Adv. Water Resour., 24, 707–723, https://doi.org/10.1016/S0309-1708(01)00005-7, 2001.
Leizeaga, A., Hicks, L. C., Manoharan, L., Hawkes, C. V., and Rousk, J.: Drought legacy affects microbial community trait distributions related to moisture along a savannah grassland precipitation gradient, J. Ecol., 109, 3195–3210, https://doi.org/10.1111/1365-2745.13550, 2021.
Li, H. C., Van den Bulcke, J., Wang, X. L., Gebremikael, M. T., Hagan, J., De Neve, S., and Sleutel, S.: Soil texture strongly controls exogenous organic matter mineralization indirectly via moisture upon progressive drying – Evidence from incubation experiments, Soil Biol. Biochem., 151, 108051, https://doi.org/10.1016/j.soilbio.2020.108051, 2020.
Li, X., Leizeaga, A., Rousk, J., Hugelius, G., and Manzoni, S.: Drying intensity and acidity slow down microbial growth recovery after rewetting dry soils, Soil Biol. Biochem., 184, 109115, https://doi.org/10.1016/j.soilbio.2023.109115, 2023a.
Li, X., Wu, J., Yang, Y., and Zou, J.: Effects of drying–rewetting on soil CO2 emissions and the regulatory factors involved: a meta-analysis, Plant Soil, 499, 349–361, https://doi.org/10.1007/s11104-023-06210-4, 2023b.
Liu, T., Wang, L., Feng, X., Zhang, J., Ma, T., Wang, X., and Liu, Z.: Comparing soil carbon loss through respiration and leaching under extreme precipitation events in arid and semiarid grasslands, Biogeosciences, 15, 1627–1641, https://doi.org/10.5194/bg-15-1627-2018, 2018.
Maier, M., Schack-Kirchner, H., Hildebrand, E. E., and Schindler, D.: Soil CO2 efflux vs. soil respiration: Implications for flux models, Agric. Forest Meteorol., 151, 1723–1730, https://doi.org/10.1016/j.agrformet.2011.07.006, 2011.
Manzoni, S., Schimel, J. P., and Porporato, A.: Responses of soil microbial communities to water stress: results from a meta-analysis, Ecology, 93, 930–938, https://doi.org/10.1890/11-0026.1, 2012.
Manzoni, S., Chakrawal, A., Fischer, T., Schimel, J. P., Porporato, A., and Vico, G.: Rainfall intensification increases the contribution of rewetting pulses to soil heterotrophic respiration, Biogeosciences, 17, 4007–4023, https://doi.org/10.5194/bg-17-4007-2020, 2020.
Meisner, A., Bååth, E., and Rousk, J.: Microbial growth responses upon rewetting soil dried for four days or one year, Soil Biol. Biochem., 66, 188–192, https://doi.org/10.1016/j.soilbio.2013.07.014, 2013.
Meisner, A., Leizeaga, A., Rousk, J., and Bååth, E.: Partial drying accelerates bacterial growth recovery to rewetting, Soil Biol. Biochem., 112, 269–276, https://doi.org/10.1016/j.soilbio.2017.05.016, 2017.
Meyer, N., Welp, G., and Amelung, W.: Effect of sieving and sample storage on soil respiration and its temperature sensitivity (Q10) in mineral soils from Germany, Biol Fertil Soils, 55, 825–832, https://doi.org/10.1007/s00374-019-01374-7, 2019.
Miller, A., Schimel, J., Meixner, T., Sickman, J., and Melack, J.: Episodic rewetting enhances carbon and nitrogen release from chaparral soils, Soil Biol. Biochem., 37, 2195–2204, https://doi.org/10.1016/j.soilbio.2005.03.021, 2005.
Miller, D. N. and Berry, E. D.: Cattle feedlot soil moisture and manure content: 1. Impacts on greenhouse gases, odor compounds, nitrogen losses, and dust, J. Environ. Qual., 34, 644–655, https://doi.org/10.2134/jeq2005.0644, 2005.
Moyano, F. E., Manzoni, S., and Chenu, C.: Responses of soil heterotrophic respiration to moisture availability: An exploration of processes and models, Soil Biol. Biochem., 59, 72–85, https://doi.org/10.1016/j.soilbio.2013.01.002, 2013.
Muhr, J., Franke, J., and Borken, W.: Drying–rewetting events reduce C and N losses from a Norway spruce forest floor, Soil Biol. Biochem., 42, 1303–1312, https://doi.org/10.1016/j.soilbio.2010.03.024, 2010.
Navarro-García, F., Casermeiro, M. Á., and Schimel, J. P.: When structure means conservation: Effect of aggregate structure in controlling microbial responses to rewetting events, Soil Biol. Biochem., 44, 1–8, https://doi.org/10.1016/j.soilbio.2011.09.019, 2012.
Nissan, A., Alcolombri, U., Peleg, N., Galili, N., Jimenez-Martinez, J., Molnar, P., and Holzner, M.: Global warming accelerates soil heterotrophic respiration, Nat Commun., 14, 3452, https://doi.org/10.1038/s41467-023-38981-w, 2023.
Niu, S., Chen, W., Liáng, L. L., Sierra, C. A., Xia, J., Wang, S., Heskel, M., Patel, K. F., Bond-Lamberty, B., Wang, J., Yvon-Durocher, G., Kirschbaum, M. U. F., Atkin, O. K., Huang, Y., Yu, G., and Luo, Y.: Temperature responses of ecosystem respiration, Nat. Rev. Earth Environ., 5, 559–571, https://doi.org/10.1038/s43017-024-00569-3, 2024.
Pallandt, M., Ahrens, B., Koirala, S., Lange, H., Reichstein, M., Schrumpf, M., and Zaehle, S.: Vertically Divergent Responses of SOC Decomposition to Soil Moisture in a Changing Climate, J. Geophys. Res.-Biogeo., 127, e2021JG006684, https://doi.org/10.1029/2021JG006684, 2022.
Patel, K. F., Myers-Pigg, A., Bond-Lamberty, B., Fansler, S. J., Norris, C. G., McKever, S. A., Zheng, J., Rod, K. A., and Bailey, V. L.: Soil carbon dynamics during drying vs. rewetting: Importance of antecedent moisture conditions, Soil Biol. Biochem., 156, 108165, https://doi.org/10.1016/j.soilbio.2021.108165, 2021.
Qin, S., Chen, L., Fang, K., Zhang, Q., Wang, J., Liu, F., Yu, J., and Yang, Y.: Temperature sensitivity of SOM decomposition governed by aggregate protection and microbial communities, Sci. Adv., 5, eaau1218, https://doi.org/10.1126/sciadv.aau1218, 2019.
R Core Team: R: A Language and Environment for Statistical Computing, R Foundation for Statistical Computing, Vienna, Austria, https://www.R-project.org/ (last access: March 2025), 2022.
Rousk, J. and Brangari, C. A.: Do the respiration pulses induced by drying-rewetting matter for the soil-atmosphere carbon balance?, Glob. Chang. Biol., 28, 3486–3488, https://doi.org/10.1111/gcb.16163, 2022.
Rupp, H., Tauchnitz, N., and Meissner, R.: The Effects of Soil Drying Out and Rewetting on Nitrogen and Carbon Leaching – Results of a Long-Term Lysimeter Experiment, Water, 13, 2601, https://doi.org/10.3390/w13182601, 2021.
Sang, J. H., Lakshani, M. M. T., Deepagoda, T., Shen, Y. Y., and Li, Y.: Drying and rewetting cycles increased soil carbon dioxide rather than nitrous oxide emissions: A meta-analysis, J. Environ. Manage., 324, 116391, https://doi.org/10.1016/j.jenvman.2022.116391, 2022.
Sawada, K., Funakawa, S., and Kosaki, T.: Effect of repeated drying–rewetting cycles on microbial biomass carbon in soils with different climatic histories, Appl. Soil Ecol., 120, 1–7, https://doi.org/10.1016/j.apsoil.2017.07.023, 2017.
Schimel, J. P.: Life in Dry Soils: Effects of Drought on Soil Microbial Communities and Processes, Annu. Rev. Ecol. Evol. S., 49, 409–432, https://doi.org/10.1146/annurev-ecolsys-110617-062614, 2018.
Scornet, E.: Tuning parameters in random forests, ESAIM: Procs, 60, 144–162, https://doi.org/10.1051/proc/201760144, 2017.
Silver, W. L., Lugo, A. E., and Keller, M.: Soil oxygen availability and biogeochemistry along rainfall and topographic gradients in upland wet tropical forest soils, Biogeochemistry, 44, 301–328, https://doi.org/10.1007/BF00996995, 1999.
Singh, S., Mayes, M. A., Kivlin, S. N., and Jagadamma, S.: How the Birch effect differs in mechanisms and magnitudes due to soil texture, Soil Biol. Biochem., 179, 108973, https://doi.org/10.1016/j.soilbio.2023.108973, 2023.
Slessarev, E. W., Lin, Y., Jiménez, B. Y., Homyak, P. M., Chadwick, O. A., D'Antonio, C. M., and Schimel, J. P.: Cellular and extracellular C contributions to respiration after wetting dry soil, Biogeochemistry, 147, 307–324, https://doi.org/10.1007/s10533-020-00645-y, 2020.
Tang, Y., Winterfeldt, S., Brangarí, A. C., Hicks, L. C., and Rousk, J.: Higher resistance and resilience of bacterial growth to drought in grasslands with historically lower precipitation, Soil Biol. Biochem., 177, 108889, https://doi.org/10.1016/j.soilbio.2022.108889, 2023.
Tiemann, L. K. and Billings, S. A.: Changes in variability of soil moisture alter microbial community C and N resource use, Soil Biol. Biochem., 43, 1837–1847, https://doi.org/10.1016/j.soilbio.2011.04.020, 2011.
Warren, C. R.: Pools and fluxes of osmolytes in moist soil and dry soil that has been re-wet, Soil Biol. Biochem., 150, 108012, https://doi.org/10.1016/j.soilbio.2020.108012, 2020.
Winterfeldt, S., Cruz-Paredes, C., Rousk, J., and Leizeaga, A.: Microbial resistance and resilience to drought across a European climate gradient, Soil Biol. Biochem., 199, 109574, https://doi.org/10.1016/j.soilbio.2024.109574, 2024.
Xu, L., Baldocchi, D. D., and Tang, J.: How soil moisture, rain pulses, and growth alter the response of ecosystem respiration to temperature, Global Biogeochem. Cy., 18, GB4002, https://doi.org/10.1029/2004gb002281, 2004.
Yan, L., Chen, S., Xia, J., and Luo, Y.: Precipitation regime shift enhanced the rain pulse effect on soil respiration in a semi-arid steppe, PLOS ONE, 9, e104217, https://doi.org/10.1371/journal.pone.0104217, 2014.
Zhang, S., Yu, Z., Lin, J., and Zhu, B.: Responses of soil carbon decomposition to drying-rewetting cycles: A meta-analysis, Geoderma, 361, 114069, https://doi.org/10.1016/j.geoderma.2019.114069, 2020.
Zhang, X., Whalley, P. A., Gregory, A. S., Whalley, W. R., Coleman, K., Neal, A. L., Mooney, S. J., Soga, K., and Illangasekare, T. H.: An overlooked mechanism underlying the attenuated temperature response of soil heterotrophic respiration, J. R. Soc. Interface., 19, 20220276, https://doi.org/10.1098/rsif.2022.0276, 2022a.
Zhang, Z., Wang, D., and Li, M.: Soil respiration, aggregate stability and nutrient availability affected by drying duration and drying-rewetting frequency, Geoderma, 413, 115743, https://doi.org/10.1016/j.geoderma.2022.115743, 2022b.
Zomer, R. J., Xu, J., and Trabucco, A.: Version 3 of the Global Aridity Index and Potential Evapotranspiration Database, Sci. Data, 9, 409, https://doi.org/10.1038/s41597-022-01493-1, 2022.