the Creative Commons Attribution 4.0 License.
the Creative Commons Attribution 4.0 License.
 | 30 Jun 2025
Aquatic and soil CO2 emissions from forested wetlands of Congo's Cuvette Centrale
Antoine de Clippele
Astrid C. H. Jaeger
Simon Baumgartner
Marijn Bauters
Pascal Boeckx
Clement Botefa
Glenn Bush
Jessica Carilli
Travis W. Drake
Christian Ekamba
Gode Lompoko
Nivens Bey Mukwiele
Kristof Van Oost
Roland A. Werner
Joseph Zambo
Johan Six
Matti Barthel
Within tropical forest ecosystems, wetlands such as swamp forests are an important interface between the terrestrial and aquatic landscape. Despite this assumed importance, there is a paucity of carbon flux data from wetlands in tropical Africa. Therefore, the magnitude and source of carbon dioxide (CO2) fluxes, carbon isotopic ratios, and environmental conditions were measured for 3 years between 2019 and 2022 in a seasonally flooded forest and a perennially flooded forest in the Cuvette Centrale of the Congo Basin. The mean surface fluxes for the seasonally flooded site and the perennially flooded site were 2.36±0.51 and 4.38±0.64 , respectively. The time series data revealed no marked seasonal pattern in CO2 fluxes. As for the environmental drivers, the fluxes at the seasonally flooded site exhibited a positive correlation with soil temperature and soil moisture. Additionally, the water level appeared to be a significant factor, demonstrating a quadratic relationship with the soil fluxes at the seasonally flooded site. δ13C values showed a progressive increase across the carbon pools, from aboveground biomass to leaf litter and then to soil organic carbon (SOC). However, there was no significant difference in δ13C enrichment between SOC and soil-respired CO2. This lack of enrichment can be attributed to either a significant contribution from the autotrophic component of soil respiration or closed system dynamics.
An in-situ-derived gas transfer velocity (k600=2.95 cm h−1) was used to calculate the aquatic CO2 fluxes at the perennially flooded site. Despite the low k600, relatively high CO2 surface fluxes were found due to very high partial pressure of CO2 (pCO2) values measured in the flooding waters. Overall, these results offer a quantification of the CO2 fluxes from forested wetlands and provide insights into the temporal variability of these fluxes and their sensitivity to environmental drivers.
- Article
(2780 KB) - Full-text XML
-
Supplement
(888 KB) - BibTeX
- EndNote


Along with the oceans and Northern Hemisphere forests, tropical forests represent one of the three main components of the global carbon sink (Mitchard, 2018). However, due to relatively high gross primary productivity, temperature, and soil moisture, tropical forest soils also constitute a large terrestrial source of carbon dioxide (CO2). Indeed, tropical regions are estimated to contribute up to 64 % of global soil respiration, rendering it the largest flux of CO2 from terrestrial ecosystems to the atmosphere (Hashimoto et al., 2015; Huang et al., 2020).
Wetland cover in the tropical Congo Basin is estimated to range between 332 620 and 359 556 km2 (Bwangoy et al., 2010; Fatras et al., 2021). This area includes the Cuvette Centrale, which spans approximately 167 600 km2 and hosts lowland and swamp forests, including the largest peatland complex across the tropics (Crezee et al., 2022). With catchment drainage from north to south of the Equator, as well as sustained rainfall at the centre of the basin (Breitengroß, 1972; Runge, 2007), the Cuvette Centrale shows near-permanent inundation. Characterizing CO2 fluxes in this extensive region is especially important since inland waters are increasingly recognized as significant sources of greenhouse gases (GHGs) within the terrestrial landscape (Bastviken et al., 2011; Drake et al., 2018; Borges et al., 2015b; Rosentreter et al., 2021) and notably in global carbon dioxide emissions (Raymond et al., 2013). Recent data additionally suggest that the Congo Basin's inland waters might emit more carbon (C) per area than their counterparts in the Amazon Basin (Alsdorf et al., 2016). Profound hydrological (Alsdorf et al., 2016), structural (Lewis et al., 2013), ecological (Parmentier et al., 2007; Slik et al., 2015), aquatic biogeochemical (Borges et al., 2015a), and terrestrial biogeochemical (Hubau et al., 2020) differences indicate that GHG flux estimates cannot simply be transferred from the Neotropics to the Afrotropics. However, while recent research on GHG emission from the Congo Basin has focused on either riverine (Borges et al., 2019; Bouillon et al., 2012; Mann et al., 2014; Upstill-Goddard et al., 2017) or terrestrial fluxes (Barthel et al., 2022; Baumgartner et al., 2020; Daelman et al., 2025; Gallarotti et al., 2021), direct measurements from forested wetlands are still lacking. Despite its immense global importance, only two studies, to the best of our knowledge, have looked into GHG emissions from Congo's wetlands (Tathy et al., 1992; Barthel et al., 2022).
Forested wetlands/swamp forests are located at the transition zone between the terrestrial and the aquatic realm. The duration and seasonality of flooding in the forests will constrain the contribution from and to the river system. While flooded, the swamp forests are connected to the river system and receive and/or discharge materials from and to the river network (Aufdenkampe et al., 2011). Variations in riverine greenhouse gas concentrations have been shown to be driven by fluvial–wetland connectivity for the Cuvette Centrale based on data from 10 expeditions across the Congo River network (Borges et al., 2019). Furthermore, streams and rivers draining Congo's flooded forests were found to have the highest dissolved concentrations of CO2 among different land cover types in the basin, indicating the substantial contribution of forested wetlands to the overall inland water GHG budget (Mann et al., 2014).
Here, we report 3 years of carbon dioxide (CO2) fluxes measured from two sites situated within the Cuvette Centrale: a seasonally flooded forest site and a perennially flooded forest site. During the observation period, surface CO2 fluxes – whether soil or aquatic – were measured fortnightly to capture seasonal and interannual variation in the fluxes. Hence, these results provide insights into the temporal dynamics of CO2 fluxes in forested wetlands across two different flooding regimes.
2.1 Study sites
The study sites are located near the city of Mbandaka (Democratic Republic of the Congo, Équateur Province), which is located at the Ruki–Congo confluence within the Cuvette Centrale (Fig. 2). The mean annual precipitation and mean annual temperature of the sampling area are 1588 mm and 25 °C, respectively (see the measurements detailed below). The long dry season in Mbandaka typically lasts from July to August, while the short dry season occurs between January and February. Here, surface CO2 fluxes were measured at two different sites across two different hydrological regimes, one in a seasonally flooded forest (0.06335° N, 18.31054° E; 300 m a.s.l.) – referred to as the SFF site – and the other in a perennially flooded forest (0.03135° S, 18.3102° E; 305 m a.s.l.) – referred to as the PFF site (Fig. 1).
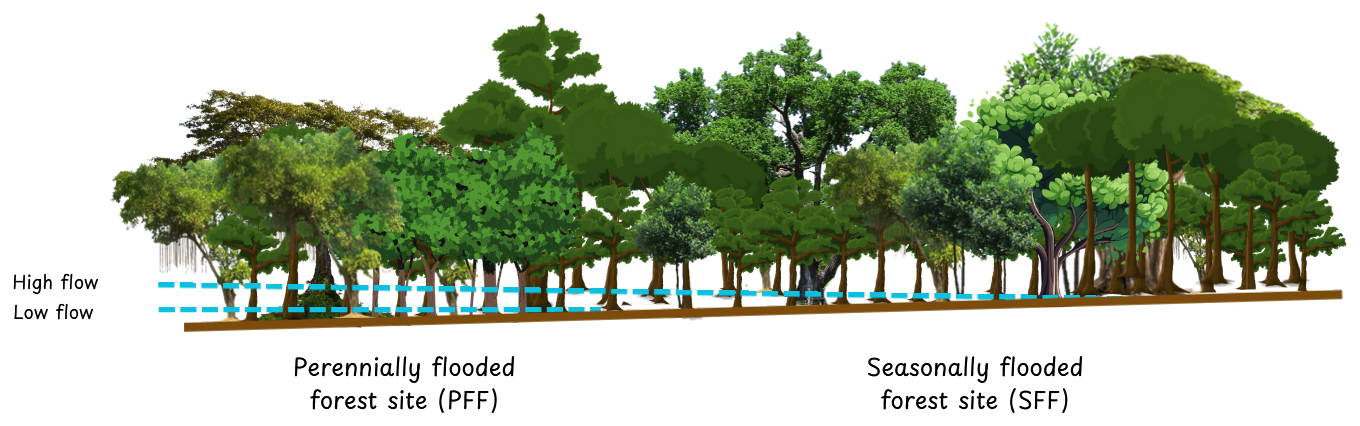
Figure 1Diagram showing the location of the two experimental sites (PFF and SFF) relative to the hydrological gradient.
The SFF site investigated is located within a botanical garden 7 km from the centre of Mbandaka (Jardin Botanique d'Eala, operated by the Institut Congolais pour la Conservation de la Nature (ICCN)). The botanical garden comprises 371 ha of land consisting of 35 % dense swamp forest, 14 % forest on firm ground, and 32 % open forest, with the remaining area consisting of secondary forest, grassland, and deforested land, of which 189 ha is protected forest area. There are 3500 different trees and herbaceous plant species, with the main tree species being Hevea brasiliensis, Ouratea arnoldiana, Pentaclethra eetveldeana, Strombosia tetrandra, and Daniella pynaertii. The soil at the site, covered by a thick litter layer, is characterized as Eutric Gleysols (texture: , sand silt clay in percent; bulk density: 1.27 g cm−3). The litter layer harbours a dense mesh of fine roots, whereas almost no roots are found to penetrate the upper mineral soil layer (0–30 cm). The SFF site is seasonally flooded from about December to January (∼2 months).
At the SFF site, combined soil moisture and temperature sensors (ECH2O 5TM, Meter Group, Inc. USA) connected to loggers (Em50, Meter Group, Inc., USA) were installed at 10 and 30 cm depths, respectively. The data were recorded every 6 h. Unfortunately, one logger was stolen and the other logger stopped working during deployment; thus, data are only available from November 2019 to July 2020 (Fig. 3). Afterward, TMS-4 data loggers (TOMST, Czechia) were installed in December 2020 to record surface volumetric soil water content (0–14 cm) and soil temperature at 8 cm depth in 15 min intervals. Raw data (soil moisture count) retrieved from TMS-4 data loggers were converted into volumetric soil water content with calibration curves, following Wild et al. (2019), using site-specific soil properties (soil texture: , sand silt clay in percent; bulk density: 1.27 g cm−3) and measured soil temperatures. The volumetric soil water content values from the ECH2O 5TM sensors showed a systematic offset compared to those obtained from the TMS-4 data loggers. This was attributed to instrument artefact and corrected by using the difference between maximum values. Furthermore, precipitation, air temperature, relative humidity, solar radiation, and wind speed data were retrieved for the observation period from the Trans-African Hydro-Meteorological Observatory (TAHMO) monitoring station located in close vicinity to the forest site (ATMOS 41, Meter Group, Inc., USA).
The PFF site is located about 8 km upstream of the Congo–Ruki confluence, following a small side tributary named Lolifa. The headwater stream area is completely flooded for most of the year, making the streambed channel indistinguishable. This creates a continuous wetland area where the PFF site is located. While the water is mostly stagnant at the site, a small drainage flow appears during the dry season (late June to early September). The site was accessed with a motorized dugout canoe, and sampling was done fortnightly from the side of the canoe. The main tree species at the PFF site are Uapaca sp., Irvingia smithii, and Daniella pynaertii De Wild. In addition to the surface CO2 fluxes, water samples were collected on the same day to measure pH, dissolved organic carbon (DOC), and total dissolved nitrogen (TDN). The presented C:N ratio was thus calculated using TDN rather than dissolved organic nitrogen (DON). Previous analyses (Drake et al., 2023) have shown that TDN consistently comprised an average of 90 % of DON and thus reflected the relative changes in DON concentrations well. The specific methods used for sample processing and analysis, as well as the calculations, are described in Drake et al. (2023).
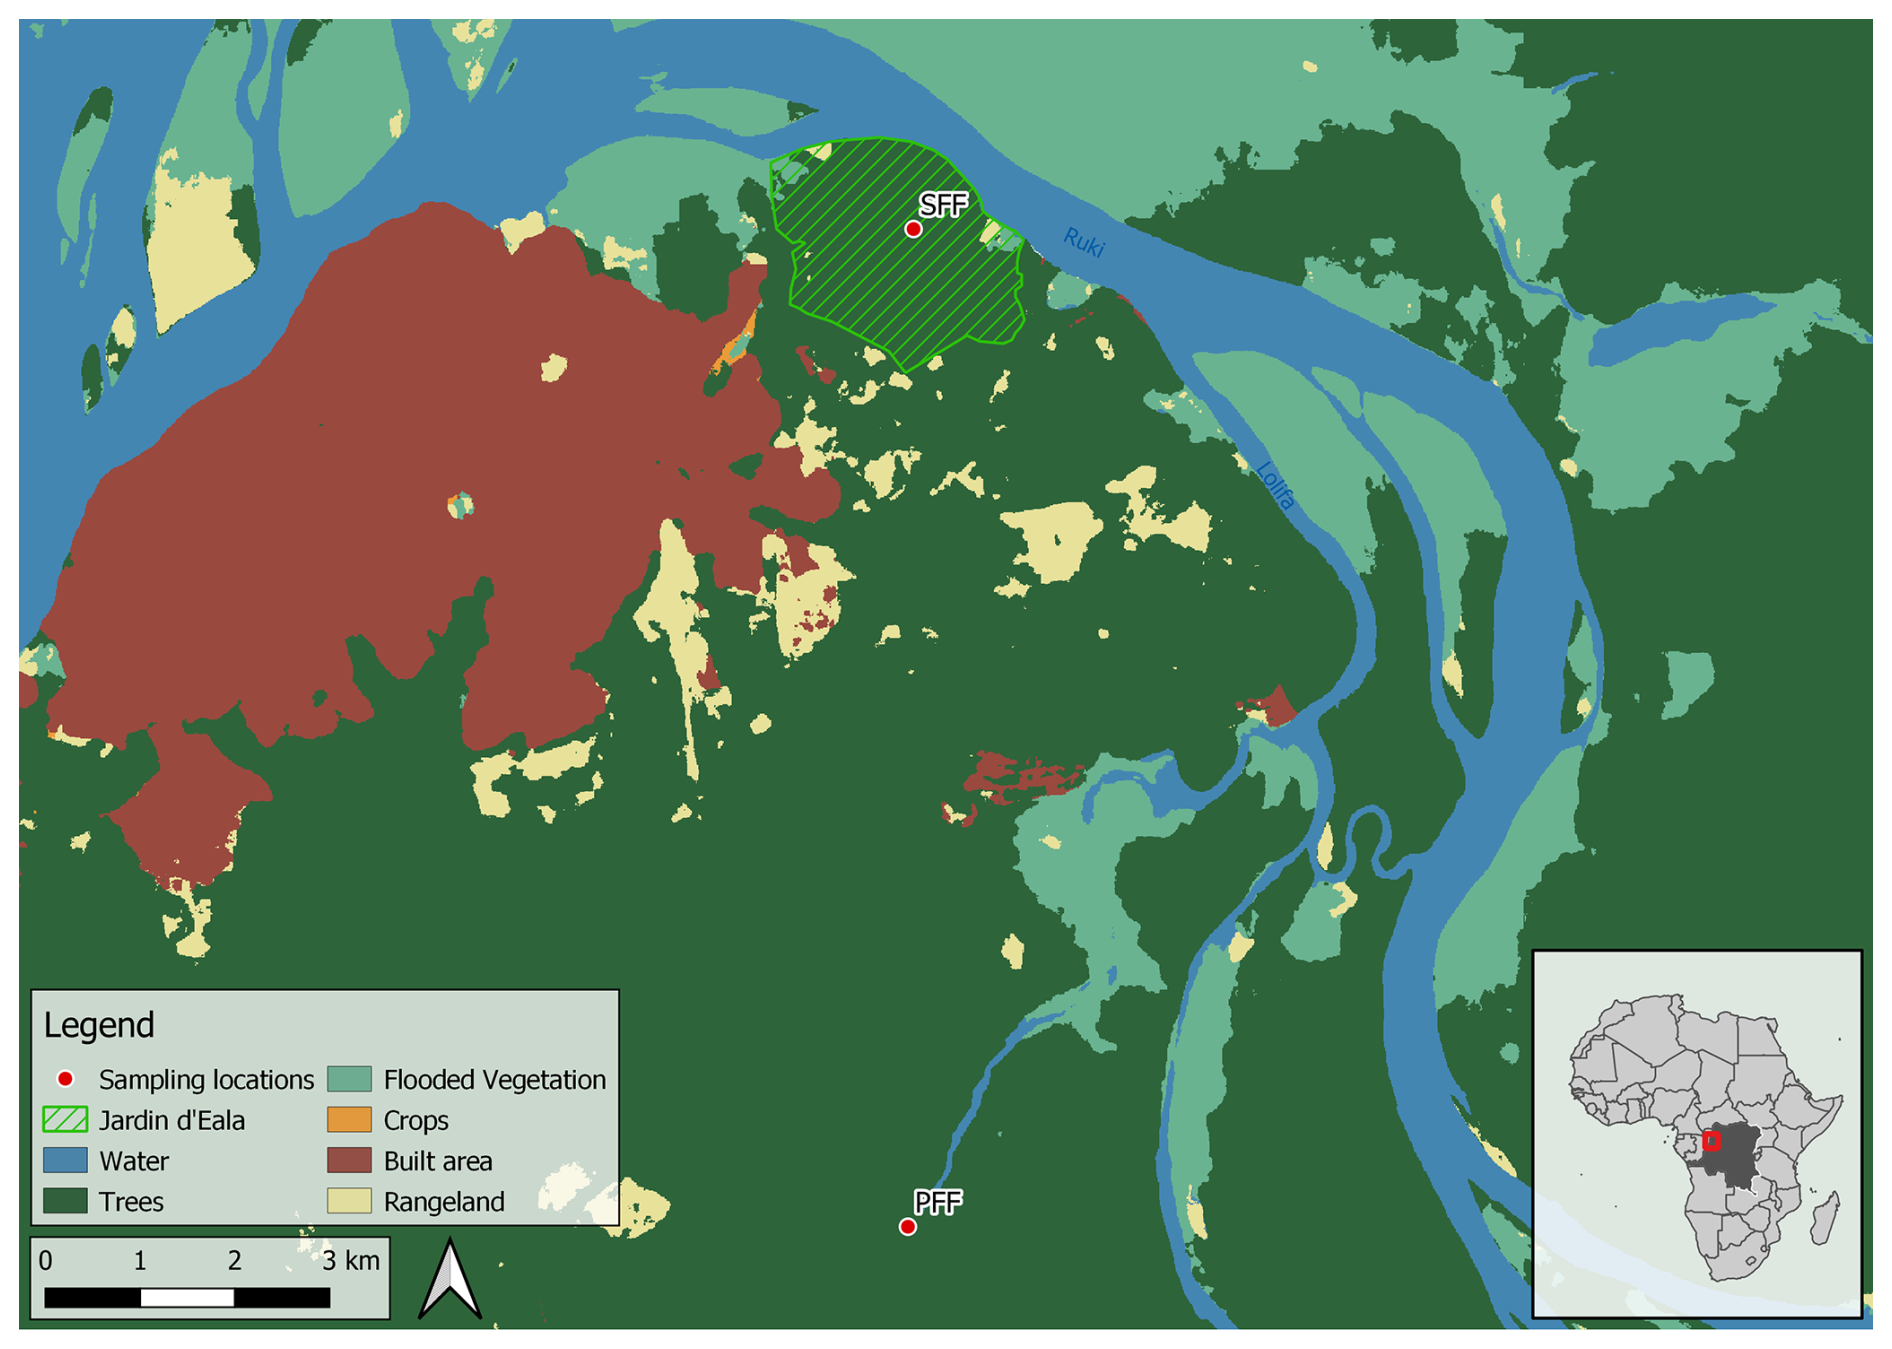
Figure 2Map presenting the two sampling sites in the vicinity of Mbandaka (Democratic Republic of the Congo). The boundaries of the Jardin Botanique d'Eala are highlighted. Map data: © 2020–2023 Impact Observatory Inc. and GADM.
2.2 CO2 fluxes
2.2.1 CO2 surface fluxes at the SFF site
A total of six polyvinyl chloride soil flux chambers (height: 0.3 m, diameter: 0.3 m) were installed in November 2019 at the SFF site. The SFF site was chosen as representative of the surrounding forest. The six chambers were spaced about 20 m apart, randomly distributed across the site but accounting for variations in local microtopography. The chamber bases were inserted approximately 5 cm into the ground and remained in place throughout the measurement period, with the chambers left open except during sampling. Chambers affected by seasonal flooding were measured until they were completely submerged, at which point floating chambers (V=17 L) were used instead. Sampling with the soil chambers was conducted fortnightly for 3 consecutive years (November 2019–December 2022), totalling 403 flux measurements. Sampling was interrupted once for about 6 months due to logistical constraints (first half of 2022).
Each chamber lid was equipped with a thermocouple to measure headspace temperature, a vent tube to avoid pressure changes, and a sampling port. The sampling port had a three-way luer valve attached to it, connecting the syringe, needle, and chamber. Before withdrawing each gas sample from the headspace, chamber air was mixed by moving the syringe plunger several times; for soil GHG flux determination, gas samples were taken at time steps of 20 min throughout 1 h (t1=0 min, t2=20 min, t3=40 min, t4=60 min). A longer chamber closure time than recommended (Pavelka et al., 2018) was used to obtain robust Keeling plots along with the flux measurements. At each time step, 20 mL of gas sample was stored in 12 mL pre-evacuated vials (Labco, UK) using a gas-tight disposable plastic syringe (20 mL). The resulting vial overpressure prevents air ingress due to temperature and pressure changes potentially occurring during transport and is required for sample withdrawal by the gas chromatograph (GC) autosampler. To aid vacuum and sample preservation, each evacuated vial was sealed with an additional silicone layer (Dow Corning 734, Dow Silicones Corporation, USA). Soil CO2 fluxes were calculated via linear concentration increase over time using the ideal gas law PV=nRT:
and
where n is the moles of gas [mol], P is the partial pressure of trace gas [atm µmol mol−1], R is the gas constant of 0.08206 [L atm K−1 mol−1], T is the headspace temperature [K], F is the flux of gas [], is the rate of change in concentration [mol s−1], V is the chamber volume [L], and S is the surface area enclosed by a chamber [m2]. The coefficient of determination (r2) for the linear regression of CO2 yielded r2>0.95 for 95 % of the data (Fig. S1). All data with r2>0.1 were kept for the statistical analyses. Such a low r2 threshold was maintained because fluxes with low r2 values are typically the result of low flux rates rather than due to methodological or technical issues. Increasing the threshold would introduce a bias toward higher fluxes in the data.
2.2.2 Aquatic surface fluxes at the PFF site
The aquatic surface flux to the atmosphere (, ) from the PFF site was estimated according to a simple gas transfer model (Mann et al., 2014):
where kx is the freshwater gas transfer velocity of CO2 [m s−1]; KH is Henry's constant for CO2 [mol m−3 atm−1]; and pCO2w,a is the partial pressure of CO2 in water and the atmosphere, respectively [µatm].
Since the magnitude of the gas transfer velocity is governed by numerous factors (e.g. wind speed, water current velocity, slope), an in situ gas transfer velocity k was calculated as 3.5 cm h−1 using the aquatic fluxes from the SFF site sampled between July 2022 and December 2022 with the above-mentioned floating chamber (V=17 L) and the corresponding dissolved CO2 concentrations of the inundation water at the same site. The value of 3.5 cm h−1 was then applied to the perennially flooded forest dataset where no floating chamber measurements existed. Hence, fluxes from the PFF site were derived using the measured gas transfer velocity from the SFF site (3.5 cm h−1).
In order to compare the in-situ-derived velocity kx with the temperature-normalized transfer velocity (k600) for tropical wetlands of 2.4 cm h−1 (Aufdenkampe et al., 2011), we used the equation from Pelletier et al. (2014) to convert kx to k600:
where Sc is the gas-specific Schmid number, and b is derived from the literature (0.66 for wind speed ≤3 m s−1; Pelletier et al., 2014).
The gas-specific Schmid number is a function of water temperature (T in °C), as defined by Wanninkhof (2014):
For pCO2a, the tropospheric mean value from the year 2020 (400 µatm) was used, while pCO2w was determined using the headspace equilibration technique. That is, 6 mL of a bubble-free water sample was injected with a syringe into a 12 mL N2-pre-flushed vial (Exetainer®, Labco, UK) pre-poisoned with 50 µL of 50 % ZnCl2 to stop microbial activity. After sufficient equilibration time, the remaining headspace was analysed for CO2 concentrations using a gas chromatograph (see section below), and total dissolved concentrations were calculated based on Henry's law (for a detailed method, see the Supplement).
For each date, pCO2w samples were taken in triplicate with an average coefficient of variation (CV) of 8 %.
2.3 Gas chromatography
Gas samples were analysed at ETH Zurich using a gas chromatograph (GC; Bruker, 456-GC, Scion Instruments, Livingston, UK) separating CO2 from residual air. After separation, the concentration of CO2 was measured on a thermal conductivity detector. GC calibration was done with a suite of three standards (Carbagas AG, Switzerland; PanGas AG, Switzerland) across a concentration range from 249 to 3040 ppm CO2. Each standard was analysed 10 times at the start, middle, and end of each set of 140–180 samples. Moreover, because of occasional high CO2 sample concentrations, an entire system flush was done between each sample measurement to avoid any carry-over effects. The same GC setup was used for both flux samples and dissolved CO2 samples.
2.4 δ13C of soil-derived CO2 fluxes and dissolved CO2
The carbon isotopic composition of the CO2 samples was analysed for one SFF CO2 flux sample set of each month. That is, after CO2 concentration measurement with the GC, the same samples were analysed for δ13C of CO2 with a modified Gasbench II periphery (Finnigan MAT, Bremen, Germany) coupled to an isotope ratio mass spectrometer (IRMS; DeltaplusXP, Finnigan MAT), as described in Baumgartner et al. (2020). Post-run offline calculation and drift correction for assigning the final δ13C values on the Vienna Pee Dee Belemnite (V-PDB) scale were done following the “IT principle” (Werner and Brand, 2001). The δ13C values of the laboratory air standards were determined at the Max Planck Institute for Biogeochemistry (Jena, Germany), according to Werner et al. (2001). The final soil CO2 δ13C values were calculated using the Keeling plot approach (Keeling, 1958) (Fig. S2).
δ13C of dissolved riverine CO2 was determined using the headspace equilibration technique, as described in Sect. 2.2.2. Instead of concentration, δ13C of the headspace was analysed via IRMS, as described above. Samples were taken each month from the Ruki between October 2022 and June 2023 with two to three replicates per sampling (Fig. S4).
2.5 δ13C of leaves, litter, and soils
Fresh leaf samples were taken from a range of the most representative tree species at two different time points (November 2019 and November 2023). In addition, litter samples were collected at the same time, and both were used to analyse the carbon isotopic composition (δ13C). Before analysis, samples were dried, homogenized, and ground. Soil samples were taken in November 2019, February 2020, and November 2023 at 0–30 cm depth and air dried, sieved, and milled. All samples were analysed using an elemental analyser (Flash EA 1112 Series, Thermo Italy, formerly CE Instruments, Rodano, Italy), interfaced with an IRMS (Finnigan MAT Deltaplus XP, Bremen, Germany) via a six-port valve (Brooks et al., 2003) and the ConFlo III (Werner et al., 1999). Soil samples are subsequently referred to as soil organic carbon (SOC) samples. Calibration of laboratory standards (acetanilide, caffeine, tyrosine) was done by comparison to the corresponding international reference materials provided by the IAEA (Vienna, Austria).
2.6 Water level
Direct measurements of the water level were not available for the whole observation period. Previous work has shown a linear relationship between the water level of the Congo River and the Ruki (unpublished, Fig. S3). Additionally, the rainfall and/or the hydrological dynamics of the river influence the water levels in the wetlands. In the Cuvette Centrale, Georgiou et al. (2023) determined that the water levels of riverine locations in the Democratic Republic of the Congo (DRC) correlate more with the hydrological dynamics of the river system than with the rainfall input. Hence, available daily measurements of the water level of the Congo River in Mbandaka were used as a proxy of the water level below- and aboveground at the SFF site (Fig. S6). These data were extracted from an almost-continuous record of water gauge readings, collected in the vicinity of the SFF site (∼4 km) by the Congolese public institution Régie des Voies Fluviales since 1913.
2.7 Statistical analyses
Daily environmental conditions were used to explain variability in the measured soil CO2 fluxes (n=403) at the SFF site. For this, a linear mixed-effects model was fitted using soil temperature, volumetric soil water content, and river level as fixed effects. River level showed a non-linear relationship with surface fluxes. Hence, a quadratic term was added to account for the non-linear effect. The predictor variables were standardized before fitting the models. All models were controlled for repeated measurements in the same chambers by adding chamber ID as a random intercept. Models were fitted by the restricted maximum likelihood method using lme4 (Bates et al., 2015). Full and reduced models were compared using a likelihood ratio test and adjusted r2 values using the MuMin package (Bartoń, 2023). Furthermore, a backward stepwise regression analysis was conducted on the full model, incorporating all effects and interaction terms, to identify the most cost-effective model with the highest explanatory power (Kuznetsova et al., 2017). The resulting model included an additional interaction term between soil moisture and river level. However, this term was subsequently removed due to multicollinearity and its lack of practical significance. Marginal and conditional r2 values for mixed effects were calculated following Nakagawa et al. (2017), with inclusive r2 estimated with the partR2 package (Stoffel et al., 2021) and p values using Satterthwaite's approximation with the lmerTest package (Kuznetsova et al., 2017). Additionally, confidence intervals for the effect estimates were computed to confirm the interpretation of the estimated parameters. The assumptions of the model were validated by verifying the linearity, normality, and homoscedasticity of the residuals. Multicollinearity between the predictor variables was also estimated (variance inflation factor (VIF) inferior to 3). Statistical differences between δ13C values measured across the different carbon pools were tested with the Kruskal–Wallis test, followed by a pairwise Wilcoxon comparison. Significance was established when the Bonferroni-adjusted p values were inferior to 0.05. Statistical and graphical data analyses were done in R v.4.3.2 (R Core Team, 2023) via RStudio v.2023.12.0 (Posit team, 2025), using the packages tidyverse v.2.0.0, tydr v1.3.0, dplyr v.1.1.4 (Wickham et al., 2023), ggplot2 v. 3.4.4 (Wickham, 2009), sjPlot (Lüdecke, 2013), and lubridate v.1.9.3 (Grolemund and Wickham, 2011). QGIS v.3.16 was used to compile the map of the sampling locations.
3.1 Environmental conditions
The long dry season in Mbandaka is considered from July to August, whereas the short dry season spans January and February. However, frequent rainfall, as shown in Fig. 3, causes the region to be relatively wet throughout the entire year. Annual precipitation was the highest in 2020, with 1855 mm, and the lowest in 2022, with 1417 mm (self-measured; Fig. 3). The flooding period at the study site is typically centred around December and January. The highest weekly precipitation occurred in July and September of each year, with 120–182 mm (Fig. 3a). Overall, the weekly precipitation ranged from 0–182 mm, with a monthly average of 31 mm (Fig. 3a).
Volumetric soil water content, hereinafter referred to as soil moisture, averaged 0.60±0.09 m3 m−3, ranging between 0.35 and 0.76 m3 m−3 for the observation period (Fig. 3a). In general, soil moisture showed strong seasonality, with an increase observed in November and peak values seen in January. Thereafter, soil moisture decreased before stabilizing until the following wet season. This pattern was less pronounced over the 2021–2022 season (Fig. 3a).
Soil and air temperatures were stable throughout the observation period (Fig. 3b). During the observation period, the recorded mean air temperature at the weather station was 25.0 °C (±0.7 °C), and mean soil temperature at the SFF site was 24.7 °C (±0.3 °C).
3.2 Soil and aquatic CO2 fluxes
Over the observation period, CO2 fluxes from the PFF site were higher than those from the SFF site (Fig. 3f). At both sites, CO2 fluxes exhibited intra-annual variability. However, distinct seasonal patterns were not clear. Notably, at the SFF site, the onset of flooding appeared to induce a decline in fluxes. Furthermore, among the environmental variables, CO2 fluxes exhibited significant correlations with soil moisture, soil temperature, and river level (Table 1). At the PFF site, the highest fluxes were recorded in June and August of 2020, with 5.71 and 5.76 , whereas the lowest values were observed in September and October 2020, with 3.35 and 3.42 . Mean weekly surface fluxes () from the PFF site ranged from 3.35 to 5.76 with an average flux of 4.38±0.64 , using the in-situ-derived gas transfer velocity of 3.5 cm h−1 (Fig. 3e). Mean weekly surface fluxes () from the SFF site ranged from 0.87 to 3.64 with an average of 2.36±0.51 . Here, the lowest flux was observed in July 2022 with 0.87 , a period corresponding to the lowest soil moisture recorded (0.35 m3 m−3), while the flux peaked in May 2020 with 3.64 (Fig. 3e).
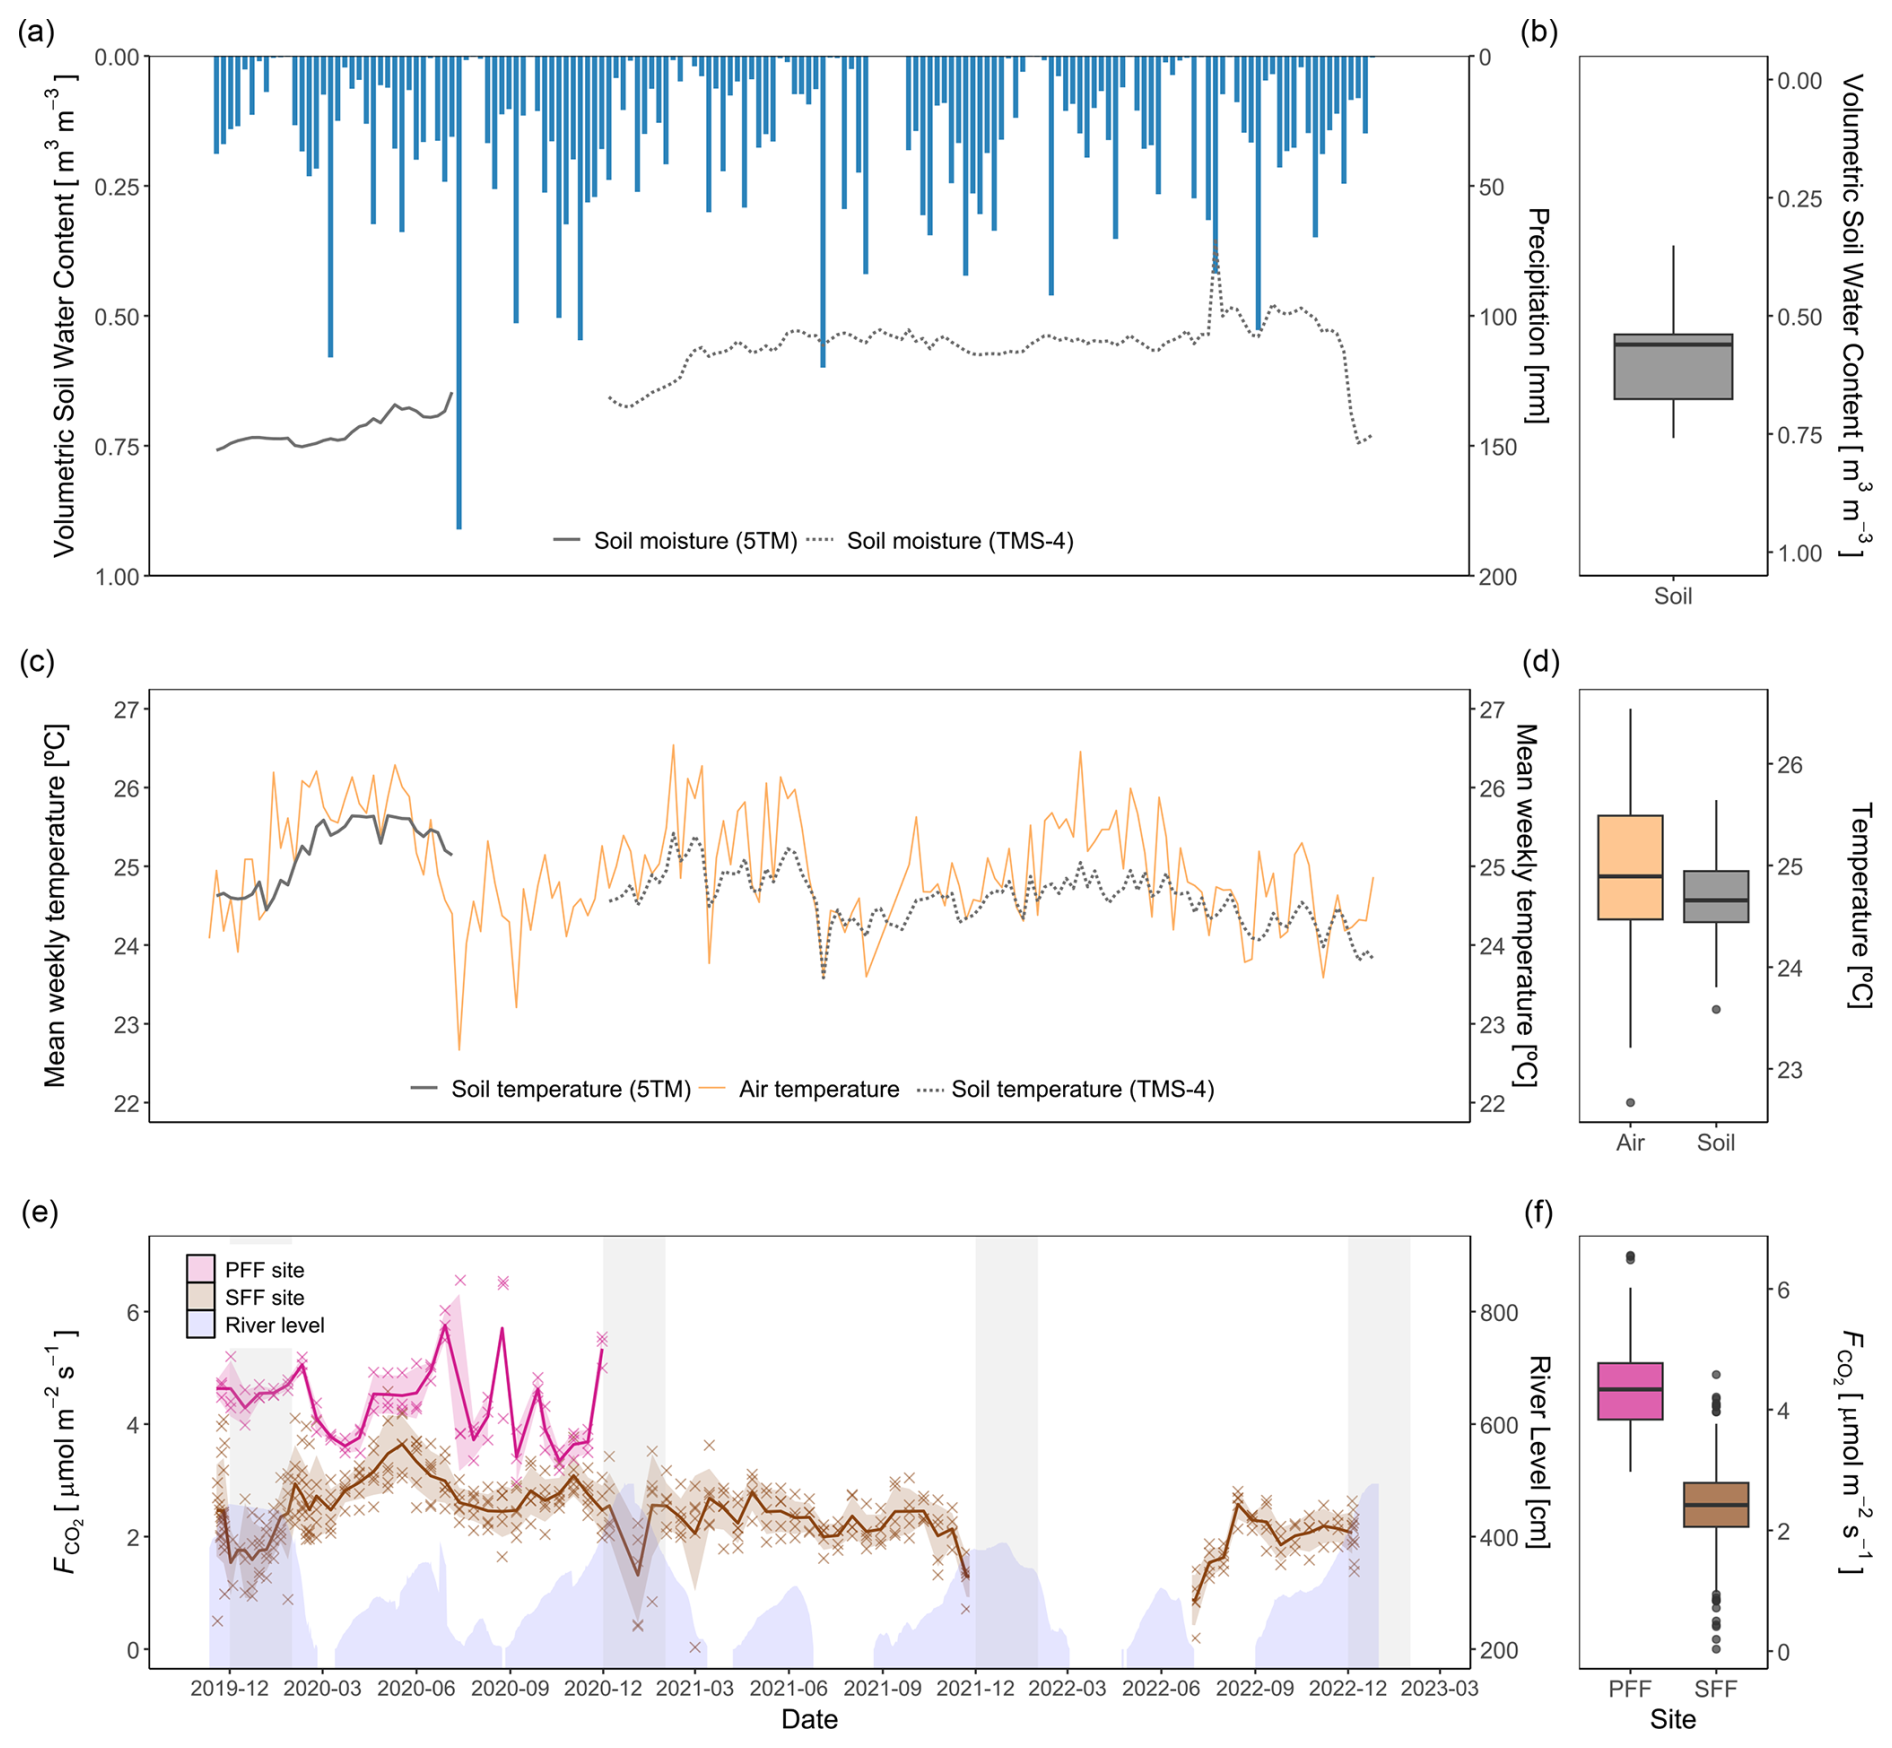
Figure 3Weekly precipitation, volumetric soil water content, temperature, and CO2 fluxes. (a) The sum of the weekly precipitation [mm] (blue) obtained from the Trans-African Hydro-Meteorological Observatory and mean volumetric soil water content [m3 m−3] measured with soil moisture sensors (ECH2O 5TM: solid line, TMS-4 data loggers: dotted line). (b) Distribution of volumetric soil water content [m3 m−3], with both sensor types combined. (c) Mean weekly air temperature [°C] (gold) was obtained from the Trans-African Hydro-Meteorological Observatory. The mean weekly soil temperature [°C] was measured with soil temperature sensors (ECH2O 5TM: solid grey line, TMS-4 data loggers: dotted grey line). (d) Distribution of air and soil temperatures [°C], with both sensor types combined. (e) Measured surface CO2 fluxes (cross) [] from the SFF site (brown) and calculated CO2 fluxes from the PFF site with a K of 3.5 cm h−1 (pink). The calculated weekly means (line) and the standard error of the mean are displayed. Blue shading represents river levels (see Sect. 2.6), while grey bands indicate flooding periods (December–January) at the SFF site. The displayed time series are discontinuous due to fieldwork constraints (see Sect. 2.2). (f) Distribution of surface CO2 fluxes at the PFF and SFF sites.
3.2.1 Controls on surface CO2 fluxes at the SFF site
The linear mixed-effects model (n=324) explained 43.0 % of the total variability, of which 35.4 % is allocated to fixed effects (river level, soil moisture, and soil temperature; Table 1). Soil temperature and soil moisture are positively correlated with surface CO2 fluxes. The river level, used as a proxy for the water level, exhibited a quadratic relationship with the CO2 fluxes measured at the SFF site (Table 1; Fig. 4c). The non-linear component exhibited a negative sign, describing an inverse U-shaped curve (Fig. 4c). Initially, the relationship had a positive slope at lower river levels, reaching a maximum point before transitioning to a negative slope. As the river level is used as a proxy for the on-site water level, a short-term campaign was conducted during the wet season (2023–2024) to confirm the influence of the water level with direct measurements (unpublished; Fig. S7). Finally, the significant positive interaction term between temperature and river level suggests a synergistic effect where the combined influence of these two variables on surface fluxes is greater than the addition of their respective individual effects (Fig. 4d).
Table 1Fixed-effect estimates for surface CO2 fluxes at the SFF site, including river level, soil temperature, and soil moisture as standardized predictors, allowing for comparison of their relative importance. For each effect, standard error and p values (Sattherhwaite's method) are estimated, as well as the marginal (m) and conditional (c) (Nakagawa et al., 2017).
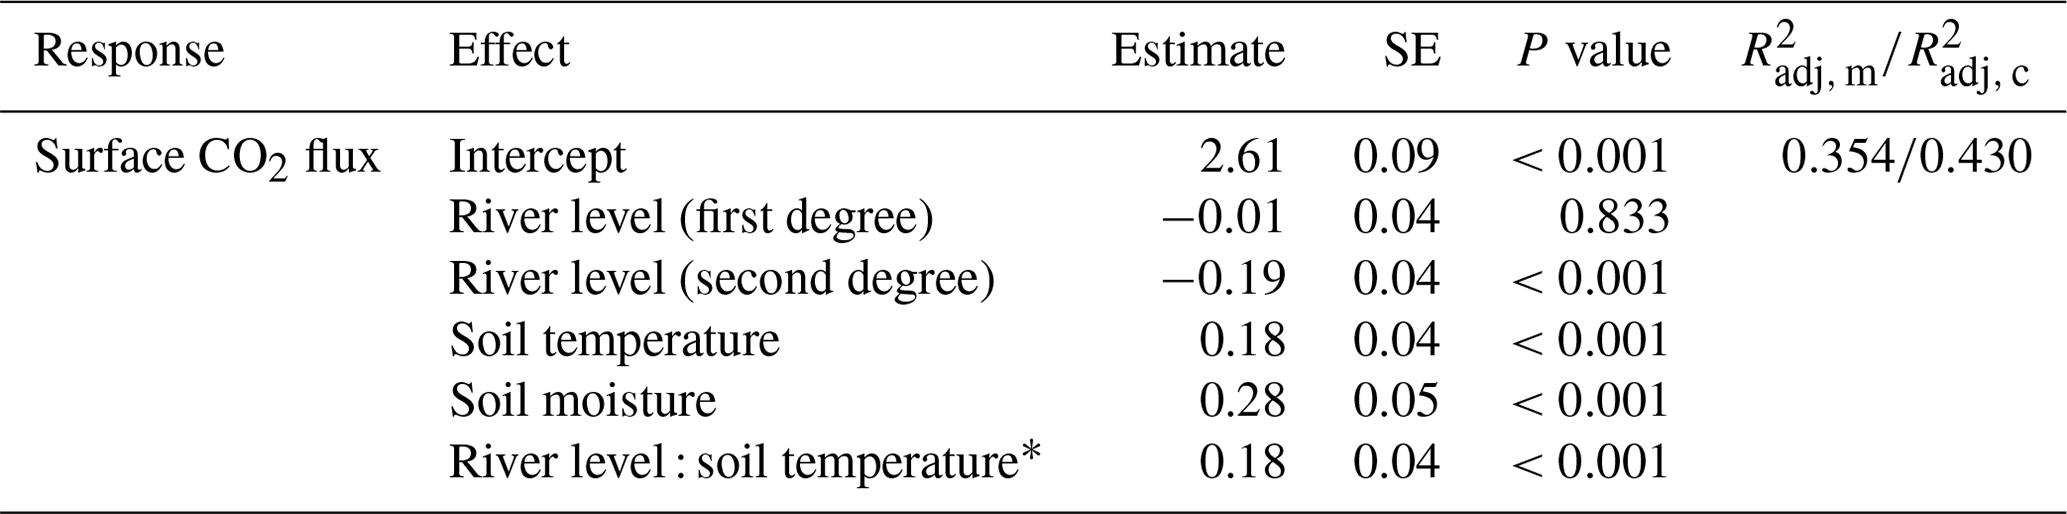
* Interaction term between soil temperature and river level.
For a deeper understanding of the LMER outputs (Table 1), the individual relationships between surface CO2 fluxes and the different predictors (soil temperature, river level, and soil moisture), as well as the effect of the interaction between the soil temperature and river level, are visualized in Fig. 4. The inclusive r2 (IR2) of each predictor is also presented, offering a measure of the proportion of variance explained by each predictor, including both its direct effects and its interactions with other predictors (Stoffel et al., 2021). In this context, the soil temperature (IR2=0.225), the soil moisture (IR2=0.126), and the quadratic component of the river level (IR2=0.097) appear to be the primary factors explaining the variance of surface CO2 fluxes, whereas the interaction between soil temperature and river level (IR2<0.001), along with the linear component of the river level (IR2=0.001), makes no meaningful contribution (Fig. 4).
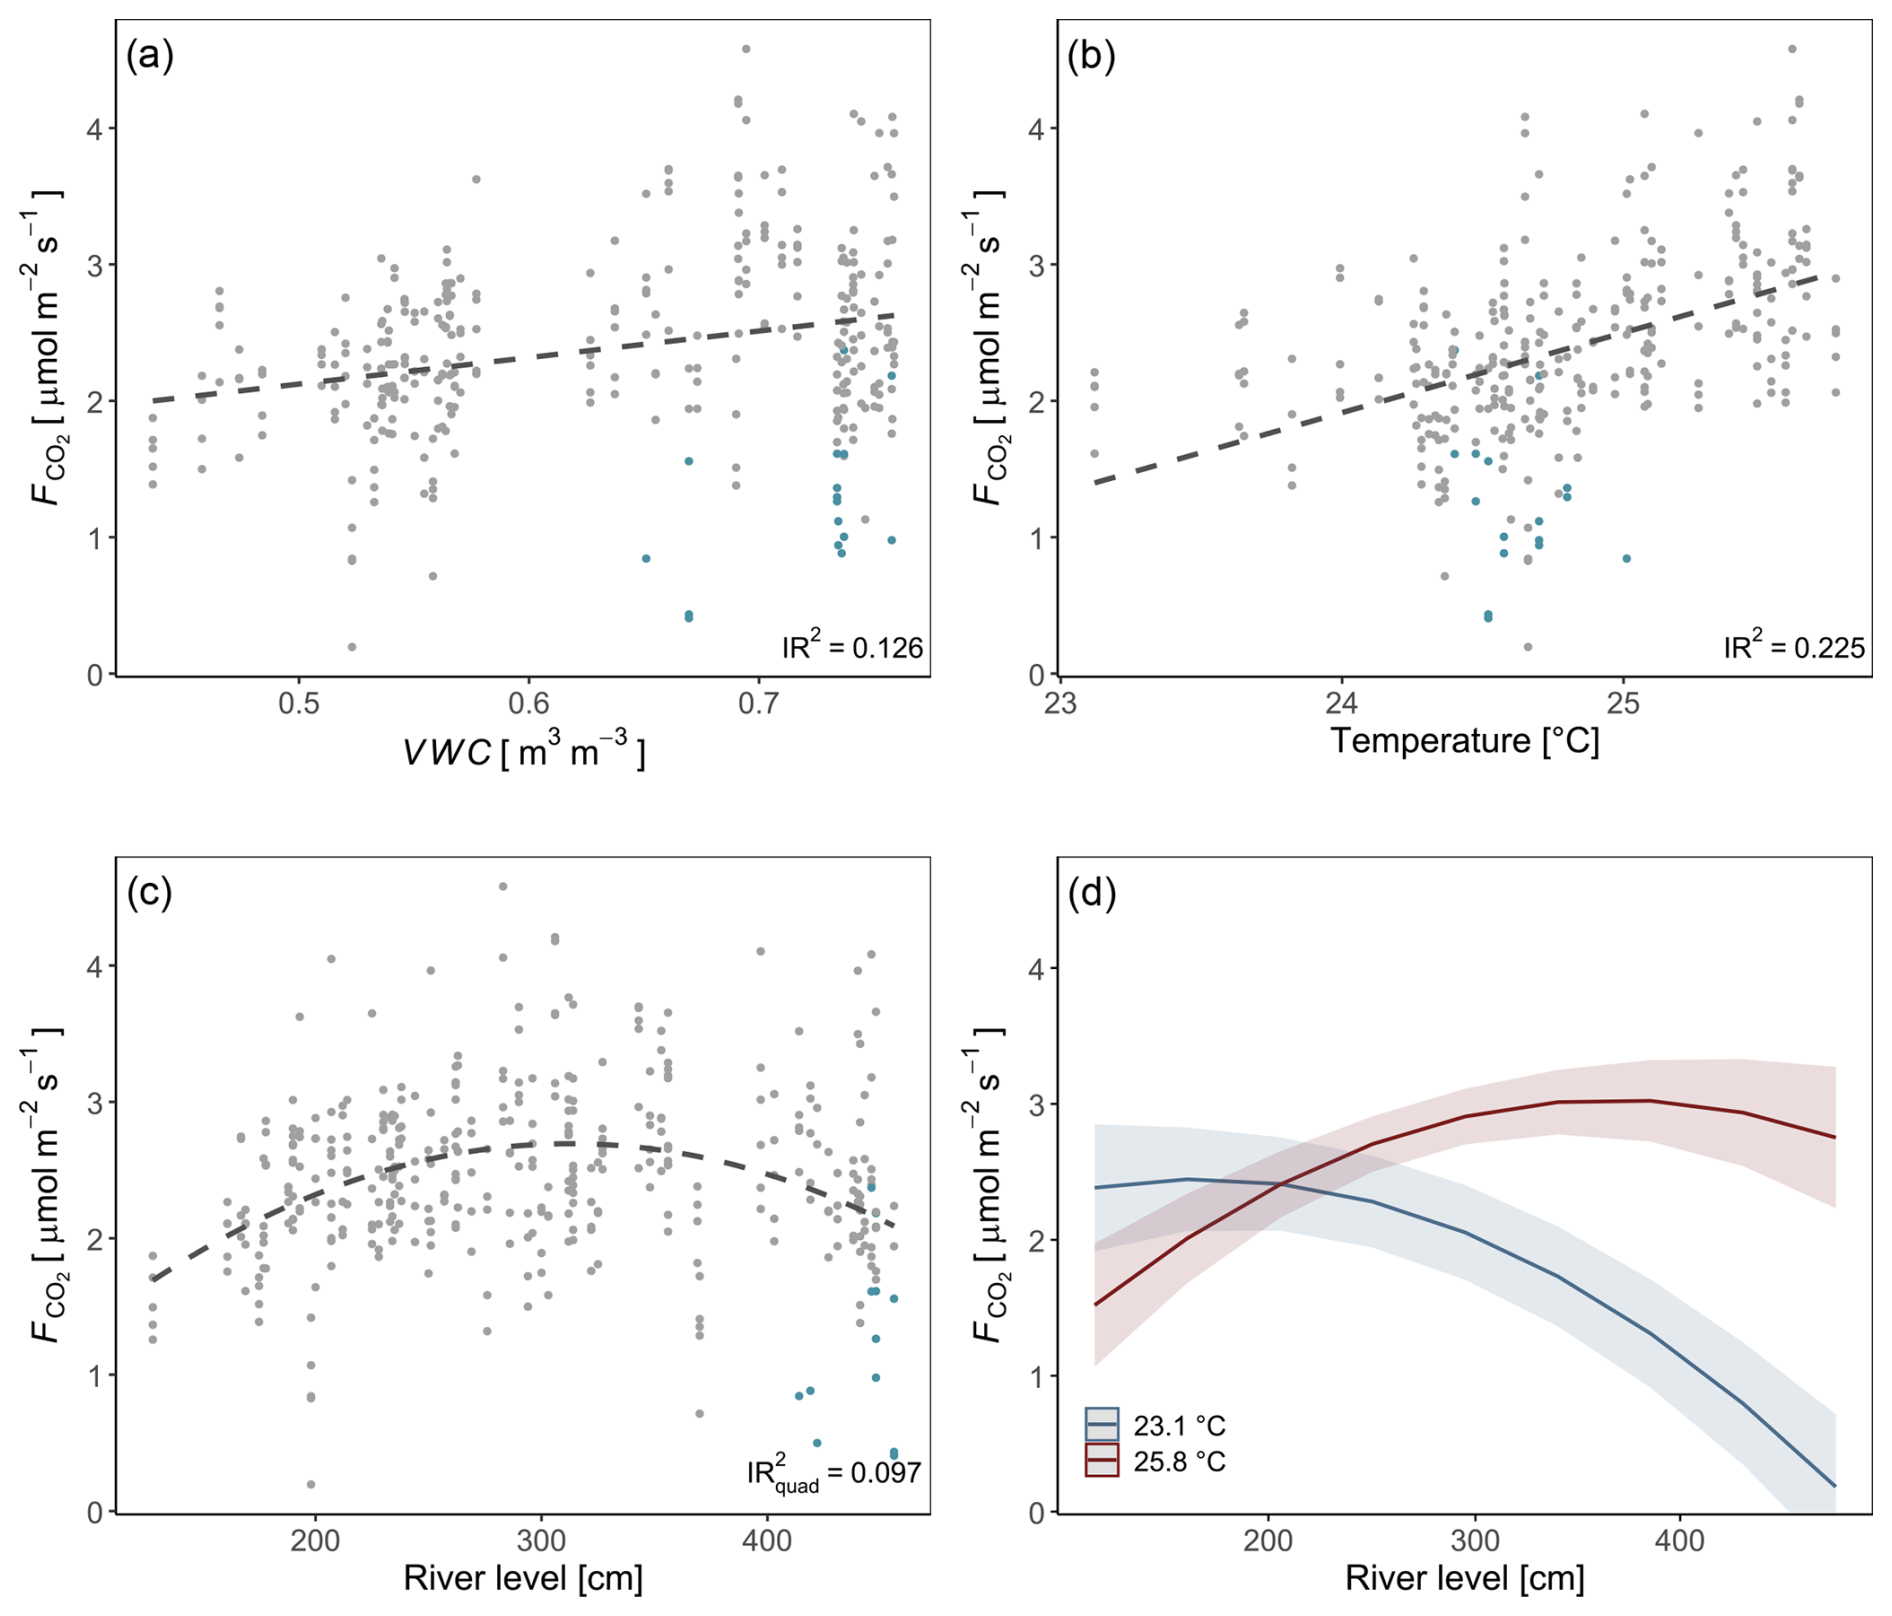
Figure 4Individual relationships between soil CO2 fluxes and environmental parameters (soil moisture (VWC) (a), soil temperature (b), and river level (c)). Measurements taken while the soil chamber was partially flooded are represented in blue. Regression lines are displayed as dashed black lines. The interaction between soil temperature and river level is illustrated. Values were predicted based on the LMER model (Table 1) (d). Inclusive r2 values (a, b, c) were estimated based on the LMER model (Table 1; Stoffel et al., 2021).
3.2.2 Controls on surface CO2 fluxes at the PFF site
At the PFF site, surface CO2 fluxes did not exhibit statistically significant relationships with pH, the river level, the carbon to nitrogen ratio (C:N), dissolved organic carbon, and biodegradable dissolved organic carbon. Trends were observed, such as an increase in CO2 fluxes with rising river levels and a decrease in CO2 fluxes with increasing pH (Fig. S7). However, these are just visual tendencies and not statistically significant findings.
3.3 δ13C of leaves, litter, soils, soil CO2 flux, and riverine dissolved CO2
The measured δ13C values increased from leaves and litter to SOC and soil CO2 fluxes and became more positive along this cascade of organic matter transformation (p values <0.05; Fig. 5). δ13C of leaves ranged from −37.1 ‰ to −28.9 ‰ with a mean of ‰. The δ13C signature of litter was between −32.6 ‰ and −28.7 ‰ with an average of ‰. SOC had δ13C values of −30.1 ‰ to −22.3 ‰, while the mean was ‰. The δ13C of soil-derived CO2 () was in the range of SOC values for the SFF site (Fig. 5) and very stable throughout the measurement period (Fig. S4). Here, measured δ13C values were −30.2 ‰ to −26.5 ‰ with a mean of ‰. In contrast, the carbon isotopic composition of CO2 fluxes from the SFF site during flooding was strongly 13C enriched with −24.8 ‰ to −13.3 ‰ and an average of ‰ (p values <0.01). The δ13C of the inundated soil CO2 fluxes was higher throughout the whole measurement period (Fig. S4). The δ13C value of dissolved CO2 from the adjacent Ruki was highly stable throughout the measurement period from October 2022 to June 2023, ranging from −24.9 ‰ to −23.3 ‰ with a mean of ‰ (Fig. S4).
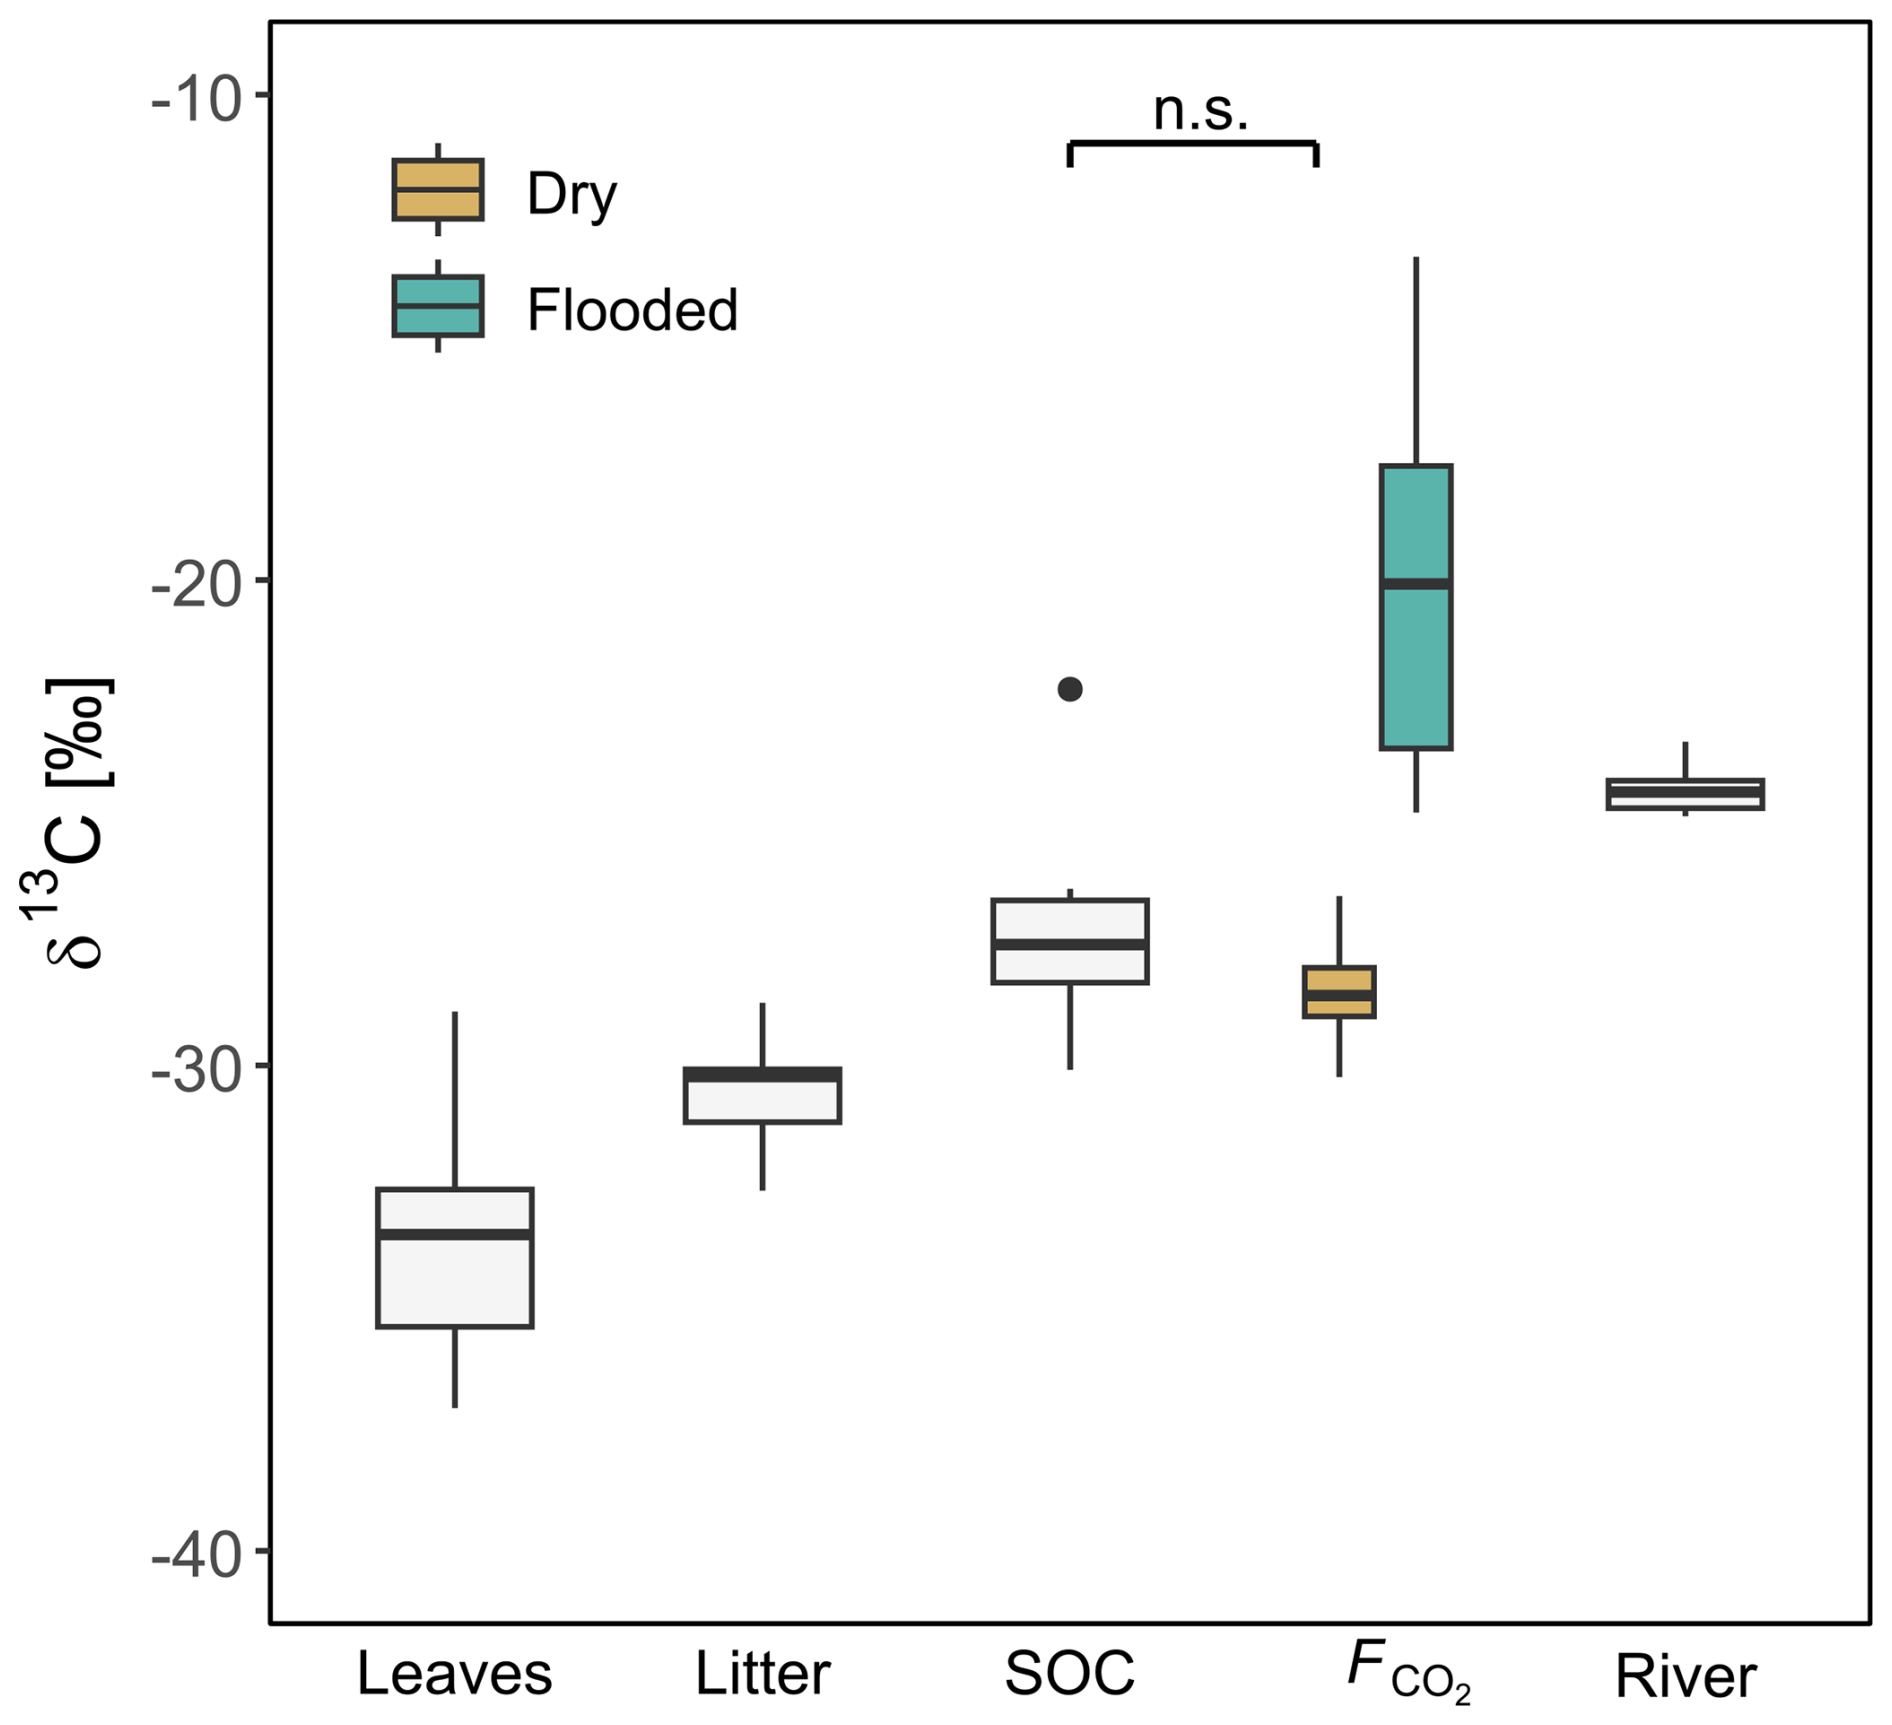
Figure 5δ13C values of leaves, litter, soil organic carbon (SOC), and soil CO2 flux (F) at the SFF site, as well as riverine dissolved CO2 (Ruki). Surface CO2 flux (F) is further separated into dry and inundated based on the chamber type (floating, static). The non-significant difference between SOC and dry is indicated by n.s.
4.1 CO2 fluxes
The surface CO2 flux dataset from the SFF site, measured for 3 consecutive years, showed intra-seasonal and interannual variability. However, no clear seasonal patterns were observed (Fig. 3e). Baumgartner et al. (2020) showed a similarly low seasonality in lowland forests of the Congo Basin, attributing it to the limited rainfall variation between dry and wet seasons. The unclear seasonal pattern of the CO2 fluxes at the SFF site could be attributed to a lasting effect of the flooding on soil moisture (Docherty and Thomas, 2021) and/or consistent rain events during the whole year (Fig. 3a–b). These factors, along with the brief duration of both dry seasons, may lead to soil moisture contents remaining near optimal conditions for vegetation and soil microbes to thrive. Such uniform environmental conditions may maintain autotrophic and heterotrophic respiration at a steady level, despite undergoing a discernible dry and wet season cycle. The reported mean flux of 2.36±0.51 from the SFF site was lower compared to that in previous studies in the Congo Basin. These studies found mean values of 3.13±1.22 and 3.45±1.14 in montane and lowland forests, respectively (Baumgartner et al., 2020), and 4.07±0.90 in a lowland secondary forest of Cameroon bordering the Congo Basin (Verchot et al., 2020). Compared to similar tropical forest studies, our values are at the low end of the range reported across the pantropical forest realm (Table 2).
The perennially flooded forest (PFF) site, located at the interface between terrestrial (forest) and aquatic (stream) ecosystems, showed relatively high emissions (4.38±0.64 ) compared to other tropical flooded forests (Scofield et al., 2016; Table 2) or streams draining catchments dominated by seasonally or continually inundated swamp forests (Mann et al., 2014; Alin et al., 2011; Table 2). The elevated CO2 fluxes at the PFF site resulted in higher fluxes relative to the SFF site. Further research is needed to determine whether greater water-depth-integrated respiration (Amaral et al., 2020), a positive correlation with a larger inundated area (Amaral et al., 2020), prolonged river interactions, or other factors explain such differences. In contrast, the SFF site presented reduced CO2 fluxes during the onset of flooding, speculatively due to the inhibitory effect of excessive soil moisture on soil respiration (Courtois et al., 2018; Nissan et al., 2023). A non-significant positive trend between water level and the aquatic CO2 fluxes was visually discernible (Fig. S7), which is in line with a positive relationship between pCO2 and discharge measured on the adjacent Ruki (Drake et al., 2023). As a constant gas transfer velocity was used in the present study, short-term changes in aquatic CO2 fluxes reflect the variations in carbon dioxide concentrations (pCO2) in the water. Moreover, the generally low gas transfer velocity (3.5 cm h−1) further reflects the very high pCO2 concentrations (10 197–17 260 ppm) measured at the PFF site. These values are significantly higher than the range (3069–9088 ppm) found by Drake et al. (2023). However, the adjacent Ruki water has a long transit time compared to a swamp and a stronger current, which in turn results in higher CO2 outgassing. Generally, the pCO2 concentration itself is driven by factors such as terrestrial inputs, gas exchange with the atmosphere, water temperature (gas solubility), water chemistry (pH, alkalinity), and in-stream metabolism (Battin et al., 2023; Hotchkiss et al., 2015; Rocher-Ros et al., 2019).
Finally, the in-situ-derived gas transfer velocity (kx) expressed as normalized k600 (2.95 cm h−1) was higher than the global normalized estimate (k600) for tropical wetlands (2.4 cm h−1; Aufdenkampe et al., 2011). The gas transfer velocity itself changes by factors influencing the near-surface water turbulence (wind speed, water current velocity). Generally, assuming a constant gas transfer velocity (kx), as applied in this study, has its limitations since it likely varies throughout the year, with increased values during the dry season when the water flows in the streambed channel (Alin et al., 2011).
Table 2Reported mean values of surface CO2 fluxes across various tropical forested environments.
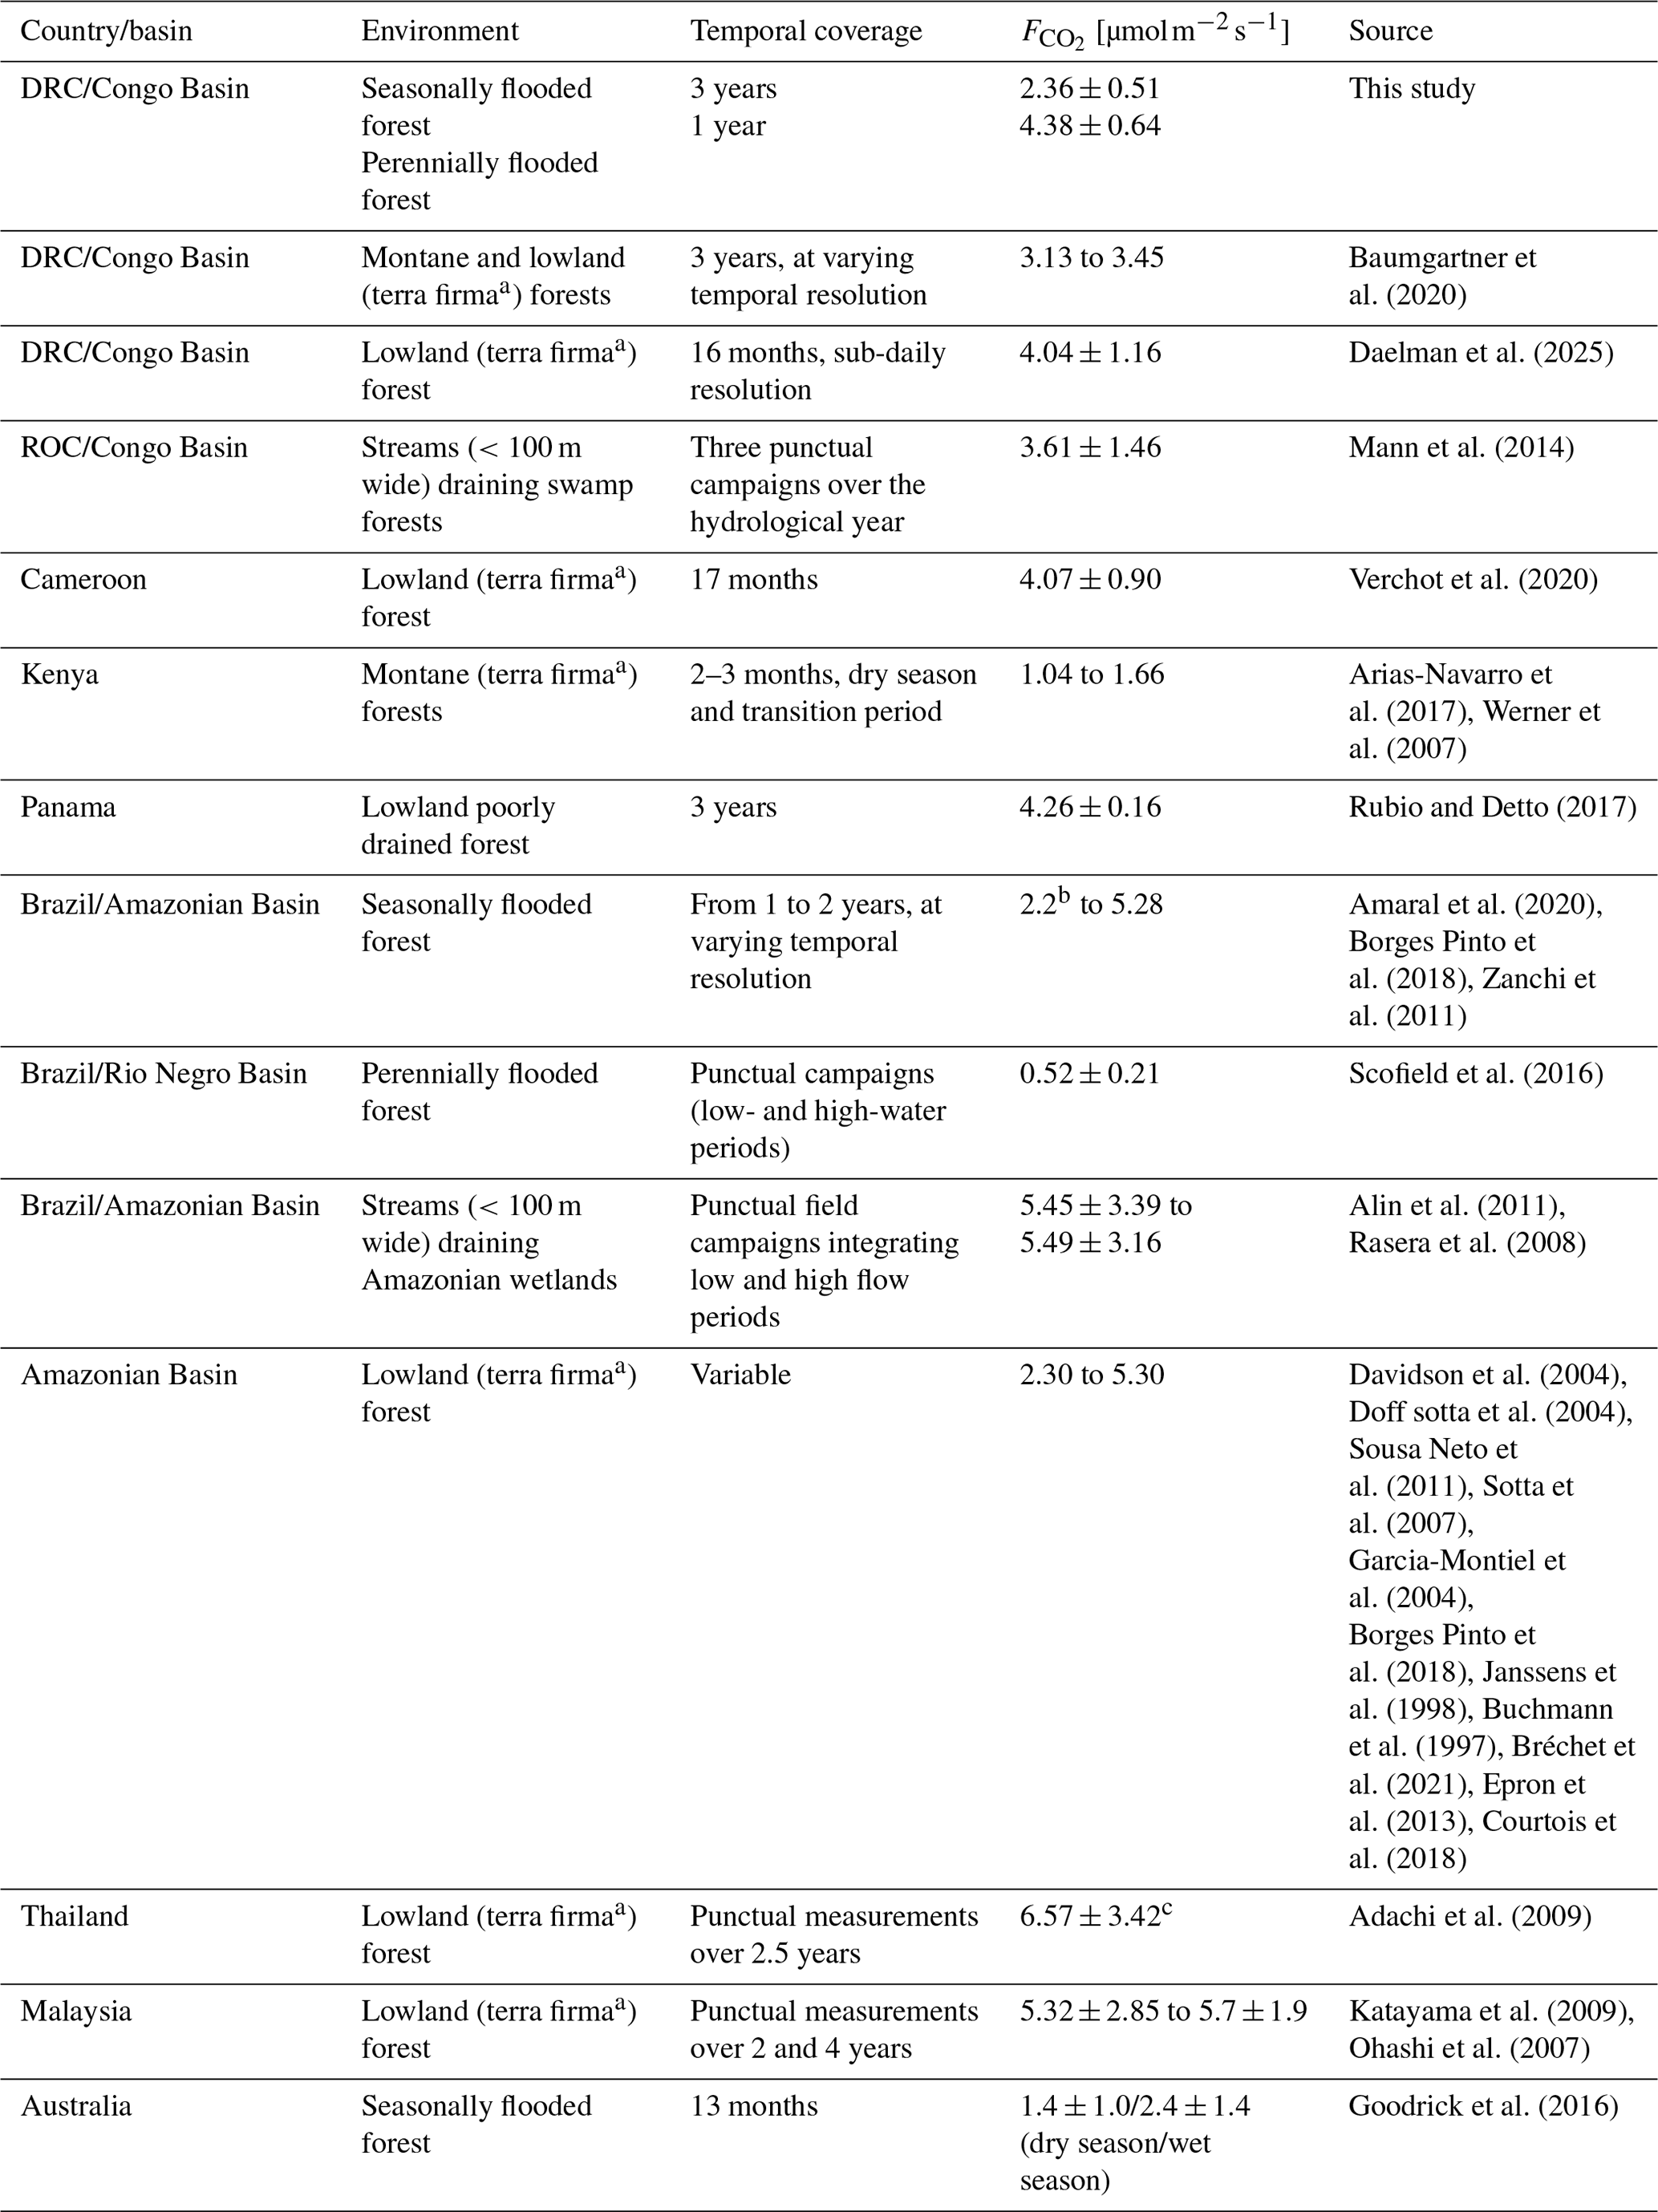
a Here, terra firma forests refer to non-flooding forests. b Measurements done only during the inundated period. c Mean soil respiration for the wet season.
4.2 Temperature, soil moisture, and water level controls
While the observed CO2 fluxes at the SFF site showed no clear seasonal pattern, soil temperature, soil moisture, and the river level as a proxy for the water level emerged as significant controls. While the positive effect of temperature and soil moisture on soil CO2 fluxes is well known and used to model soil CO2 fluxes (Nissan et al., 2023), the effect of the water level is less well understood. The observed quadratic relationship with the water level suggests an optimal water level beyond which further increases lead to reduced CO2 fluxes. This optimal point speculatively corresponds to the shift to water-saturated conditions in the organic-rich surface soil transitioning from oxic to anoxic conditions. A negative effect of the water level beyond a critical threshold aligns well with the results of Goodrick et al. (2016), who found maximal soil CO2 fluxes associated with a water level between 1.5 and 2 m below the ground and minimal fluxes when the water level was within 0.15 m of the surface for a tropical riparian swamp forest in Australia. Similarly, Rubio and Detto (2017) found a quadratic relationship between CO2 fluxes and soil water content in the Amazonian Basin. CO2 fluxes can be reduced in both high and low soil water content, and fluctuations in water level introduce additional factors beyond its influence on soil saturation. Both heterotrophic soil respiration and autotrophic soil respiration are reduced under dry conditions due to limited microbial activity and reduced photosynthetic activity through stomatal closure (Baumgartner et al., 2020). In our study, the lowest-flux event recorded in July 2022 coincided with a marked decrease in soil moisture. This suggests that, during this event, the reduced soil moisture levels became a limiting factor for supporting soil respiration. Conversely, increased soil moisture generally enhances respiration. This was generally the case during our study period, as evidenced by the positive correlation between soil moisture and surface CO2 fluxes (p value <0.05; Table 1). However, excessively high moisture conditions (due to strong-rain events or high water levels during flooding) can also hinder substrate decomposition by physically impeding the diffusion of atmospheric oxygen and respired CO2 through the soil pores, thereby limiting both the production and the diffusion of CO2 (Courtois et al., 2018; Nissan et al., 2023). This could explain the temporary decrease in CO2 fluxes observed at the onset of the flooding period (Fig. 3). Furthermore, fluctuations in the water level can influence soil respiration through physical processes, like flushing out soil CO2 during rising phases, enhanced lateral movement of dissolved CO2, air ingress, and redistribution of organic material during receding phases (Dalmagro et al., 2018; Goodrick et al., 2016). Finally, the positive interaction between soil temperature and water level (p value <0.05; Table 1) suggests that higher temperatures will reinforce the effect of the water level and shift the maximum soil flux towards higher water levels, delaying its inhibitive effect (Fig. 4).
Nevertheless, it is important to note that both the water level and the soil moisture measurements exhibit seasonal patterns but do not effectively capture the short-term changes in surface CO2 fluxes at the SFF site. Furthermore, the CO2 fluxes exhibit unclear seasonal patterns (Fig. S5b). This suggests that other factors, such as aboveground inputs from vegetation, river sediment deposition, and rain-induced events, may significantly influence surface CO2 fluxes, both in the short term and at seasonal timescales. Additionally, it is important to stress that using river level as a proxy for water level at the SFF site presents limitations, such as neglecting local topography or soil characteristics. Thus, fortnightly variations in soil CO2 fluxes may not be fully captured by this proxy, as local hydrological dynamics might differ from those of the broader river system. Hence, this method may not fully capture the dynamics of the water level and its influence on surface CO2 fluxes.
Overall, while soil moisture content and temperature are often considered primary drivers of soil CO2 fluxes (Courtois et al., 2018; Nissan et al., 2023; Oertel et al., 2016), our findings also indicate that incorporating water level can help to unravel the variability of the fluxes for lowland forests with shallow water tables.
At the PFF site, on the other hand, we did not find any statistically significant relationships between potential drivers (DOC, BDOC, river level, pH, C:N) and pCO2w. This suggests that the chemical composition of the water is relatively homogenous throughout the year and that allochthonous rather than autochthonous processes determine pCO2w concentrations.
4.3 Isotopic indicators
The general carbon isotopic composition of plant tissue is determined by the degree of 13C discrimination at the leaf level (Brüggemann et al., 2011). Due to the high photosynthetic activity of tropical plants, 13C discrimination is also high, resulting in very negative δ13C values at the leaf level, as observed in this study (−37.06 ‰ to −28.89 ‰). As C moves across the various ecosystem C pools, the substrate becomes gradually enriched in 13C due to kinetic isotope fractionation. In the case of the studied SFF site, a total 13C enrichment of 5.27 ‰ was observed when moving down the cascade from leaves and litter to SOC and respired CO2 under dry conditions (p values <0.05; Fig. 5). Particularly interesting here is the absence of 13C fractionation between SOC and soil-respired CO2, which might initially be interpreted as a result of closed-system dynamics where the substrate is limited and organic decomposition tends to be complete. However, soil-respired CO2 is a two-component flux, comprised of heterotrophic and autotrophic respiration. In other words, SOC is not the sole factor governing soil-respired CO2. Indeed, autotrophic respiration is to a large degree fuelled by recently photosynthesized 13C-depleted carbon (Ottosson-Löfvenius and Read, 2001; Barthel et al., 2011), which in turn can decrease the overall soil-respired δ13C value relative to SOC (depending on the relative contribution of autotrophic vs. heterotrophic soil respiration). Transport rates from above to below the ground can reach up to 0.5 m h−1 (Kuzyakov and Gavrichkova, 2010). Thus, whether the similar δ13C values between SOC and respired CO2 are driven by substrate limitation or a strong influence of autotrophic respiration requires further investigation.
The highest 13C enrichment observed was from CO2 emitted during flooding at the SFF site (−20.4 ‰; p values <0.05). These δ13C values were even higher than the δ13C values measured in the adjacent Ruki (−24.30 ‰; p value <0.05). The reason for such highly 13C-enriched CO2 outgassing during inundation remains unclear, but given that the water in the inundated forest likely experiences relatively long residence times compared to the river, the outgassed CO2 might become this heavily 13C enriched due to extensive outgassing. Moreover, the standing water allows for the growth of methanogenic archaea, which use simple carbon compounds, such as acetate, as electron donors (Conrad et al., 2021). The CO2 molecules obtained from acetate cleavage is another fractionation process that potentially influences the overall isotopic composition of outgassed CO2. Lastly, as the inundation of the SFF site is mainly driven by backflow from the river system, the dissolved CO2 in the inundated water could be a mix of riverine and locally soil-respired CO2 that undergoes further in situ 13C enrichment.
This study presents a multi-year dataset of CO2 fluxes from two forested wetland sites along a flooding gradient: a seasonally flooded forest (SFF) and a perennially flooded forest (PFF). While exhibiting short-term and interannual fluctuations, CO2 fluxes showed limited seasonal patterns. At the SFF site, surface emissions increased with rising soil moisture and temperature, while the water level demonstrated a significant quadratic relationship. Despite the significant sensitivity to environmental conditions over the observation period, the short-term variability observed at both sites and the interannual variability at the SFF site were incompletely explained, suggesting the influence of additional factors in regulating emissions.
Our results emphasize that water level, alongside soil temperature and soil moisture, significantly affects surface CO2 fluxes in lowland areas with shallow, fluctuating water tables. Future research should include direct measurements of the water level over the entire hydrological year to elucidate the temporal dynamics of this relationship. Overall, the reported measurements contribute to filling the data gap for soil respiration rates of tropical forests in the Congo Basin and provide baseline fluxes for parameterizing Earth system models.
The datasets generated in this study have been deposited in the Zenodo repository (https://doi.org/10.5281/zenodo.15051088; De Clippele and Barthel, 2025) and are available from the corresponding author upon request. Additionally, the data used in this study have been made available through the Soil Respiration Database (SRDB; https://doi.org/10.3334/ORNLDAAC/1827; Jian et al., 2021).
The supplement related to this article is available online at https://doi.org/10.5194/bg-22-3011-2025-supplement.
Mbar, MBau, TWD, KVO, and JS were responsible for conceiving and designing the study. Fieldwork was conducted by Mbar, Mbau, TWD, SB, NBM, JC, AdC, and CE. Lab work was conducted by Mbar, RAW, SB, and JC. Data analyses and interpretation were performed by ACHJ, AdC, Mbau, and Mbar. AdC and ACHJ wrote the paper with contributions from all co-authors.
At least one of the (co-)authors is a member of the editorial board of Biogeosciences. The peer-review process was guided by an independent editor, and the authors also have no other competing interests to declare.
Publisher's note: Copernicus Publications remains neutral with regard to jurisdictional claims made in the text, published maps, institutional affiliations, or any other geographical representation in this paper. While Copernicus Publications makes every effort to include appropriate place names, the final responsibility lies with the authors.
The authors would like to thank the Trans-African Hydro-Meteorological Observatory (TAHMO) for providing meteorological data from the investigated site and the ICCN park guards for assistance in the field. The authors would like to further thank Annika Ackermann from the Grassland Science group (Nina Buchmann) at ETH Zurich for stable isotope analysis of plant and soil materials.
The core funding of ETH Zurich financed this study. Matti Barthel received funding from the Swiss National Science Foundation (grant no. IZSEZ0_186376/1).
This paper was edited by Paul Stoy and reviewed by Joseph Tamale and one anonymous referee.
Adachi, M., Ishida, A., Bunyavejchewin, S., Okuda, T., and Koizumi, H.: Spatial and temporal variation in soil respiration in a seasonally dry tropical forest, Thailand, J. Trop. Ecol., 25, 531–539, https://doi.org/10.1017/S026646740999006X, 2009.
Alin, S. R., de Fátima F. L. Rasera, M., Salimon, C. I., Richey, J. E., Holtgrieve, G. W., Krusche, A. V., and Snidvongs, A.: Physical controls on carbon dioxide transfer velocity and flux in low-gradient river systems and implications for regional carbon budgets, J. Geophys. Res.-Biogeo., 116, https://doi.org/10.1029/2010JG001398, 2011.
Alsdorf, D., Beighley, E., Laraque, A., Lee, H., Tshimanga, R., O'Loughlin, F., Mahé, G., Dinga, B., Moukandi, G., and Spencer, R. G. M.: Opportunities for hydrologic research in the Congo Basin, Rev. Geophys., 54, 378–409, https://doi.org/10.1002/2016RG000517, 2016.
Amaral, J. H. F., Melack, J. M., Barbosa, P. M., MacIntyre, S., Kasper, D., Cortés, A., Silva, T. S. F., Nunes de Sousa, R., and Forsberg, B. R.: Carbon Dioxide Fluxes to the Atmosphere From Waters Within Flooded Forests in the Amazon Basin, J. Geophys. Res.-Biogeo., 125, e2019JG005293, https://doi.org/10.1029/2019JG005293, 2020.
Arias-Navarro, C., Díaz-Pinés, E., Klatt, S., Brandt, P., Rufino, M. C., Butterbach-Bahl, K., and Verchot, L. V.: Spatial variability of soil N2O and CO2 fluxes in different topographic positions in a tropical montane forest in Kenya, J. Geophys. Res.-Biogeo., 122, 514–527, https://doi.org/10.1002/2016JG003667, 2017.
Aufdenkampe, A. K., Mayorga, E., Raymond, P. A., Melack, J. M., Doney, S. C., Alin, S. R., Aalto, R. E., and Yoo, K.: Riverine coupling of biogeochemical cycles between land, oceans, and atmosphere, Front. Ecol. Environ., 9, 53–60, https://doi.org/10.1890/100014, 2011.
Barthel, M., Hammerle, A., Sturm, P., Baur, T., Gentsch, L., and Knohl, A.: The diel imprint of leaf metabolism on the δ13C signal of soil respiration under control and drought conditions, New Phytol., 192, 925–938, https://doi.org/10.1111/j.1469-8137.2011.03848.x, 2011.
Barthel, M., Bauters, M., Baumgartner, S., Drake, T. W., Bey, N. M., Bush, G., Boeckx, P., Botefa, C. I., Dériaz, N., Ekamba, G. L., Gallarotti, N., Mbayu, F. M., Mugula, J. K., Makelele, I. A., Mbongo, C. E., Mohn, J., Mandea, J. Z., Mpambi, D. M., Ntaboba, L. C., Rukeza, M. B., Spencer, R. G. M., Summerauer, L., Vanlauwe, B., Van Oost, K., Wolf, B., and Six, J.: Low N2O and variable CH4 fluxes from tropical forest soils of the Congo Basin, Nat. Commun., 13, 330, https://doi.org/10.1038/s41467-022-27978-6, 2022.
Bartoń, K.: _MuMIn: Multi-Model Inference_, R package version 1.45.5, CRAN [code], https://doi.org/10.32614/CRAN.package.MuMIn, 2023.
Bastviken, D., Tranvik, L. J., Downing, J. A., Crill, P. M., and Enrich-Prast, A.: Freshwater Methane Emissions Offset the Continental Carbon Sink, Science, 331, 50–50, https://doi.org/10.1126/science.1196808, 2011.
Bates, D., Mächler, M., Bolker, B., and Walker, S.: Fitting Linear Mixed-Effects Models Using lme4, J. Stat. Softw., 67, 1–48, https://doi.org/10.18637/jss.v067.i01, 2015.
Battin, T. J., Lauerwald, R., Bernhardt, E. S., Bertuzzo, E., Gener, L. G., Hall, R. O., Hotchkiss, E. R., Maavara, T., Pavelsky, T. M., Ran, L., Raymond, P., Rosentreter, J. A., and Regnier, P.: River ecosystem metabolism and carbon biogeochemistry in a changing world, Nature, 613, 449–459, https://doi.org/10.1038/s41586-022-05500-8, 2023.
Baumgartner, S., Barthel, M., Drake, T. W., Bauters, M., Makelele, I. A., Mugula, J. K., Summerauer, L., Gallarotti, N., Cizungu Ntaboba, L., Van Oost, K., Boeckx, P., Doetterl, S., Werner, R. A., and Six, J.: Seasonality, drivers, and isotopic composition of soil CO2 fluxes from tropical forests of the Congo Basin, Biogeosciences, 17, 6207–6218, https://doi.org/10.5194/bg-17-6207-2020, 2020.
Borges, A. V., Abril, G., Darchambeau, F., Teodoru, C. R., Deborde, J., Vidal, L. O., Lambert, T., and Bouillon, S.: Divergent biophysical controls of aquatic CO2 and CH4 in the World's two largest rivers, Sci. Rep., 5, 1–10, https://doi.org/10.1038/srep15614, 2015a.
Borges, A. V., Darchambeau, F., Teodoru, C. R., Marwick, T. R., Tamooh, F., Geeraert, N., Omengo, F. O., Guérin, F., Lambert, T., Morana, C., Okuku, E., and Bouillon, S.: Globally significant greenhouse-gas emissions from African inland waters, Nat. Geosci., 8, 637–642, https://doi.org/10.1038/ngeo2486, 2015b.
Borges, A. V., Darchambeau, F., Lambert, T., Morana, C., Allen, G. H., Tambwe, E., Toengaho Sembaito, A., Mambo, T., Nlandu Wabakhangazi, J., Descy, J.-P., Teodoru, C. R., and Bouillon, S.: Variations in dissolved greenhouse gases (CO2, CH4, N2O) in the Congo River network overwhelmingly driven by fluvial-wetland connectivity, Biogeosciences, 16, 3801–3834, https://doi.org/10.5194/bg-16-3801-2019, 2019.
Borges Pinto, O., Vourlitis, G. L., De Souza Carneiro, E. M., De França Dias, M., Hentz, C., and De Souza Nogueira, J.: Interactions between Vegetation, Hydrology, and Litter Inputs on Decomposition and Soil CO2 Efflux of Tropical Forests in the Brazilian Pantanal, Forests, 9, 281, https://doi.org/10.3390/f9050281, 2018.
Bouillon, S., Yambélé, A., Spencer, R. G. M., Gillikin, D. P., Hernes, P. J., Six, J., Merckx, R., and Borges, A. V.: Organic matter sources, fluxes and greenhouse gas exchange in the Oubangui River (Congo River basin), Biogeosciences, 9, 2045–2062, https://doi.org/10.5194/bg-9-2045-2012, 2012.
Bréchet, L. M., Daniel, W., Stahl, C., Burban, B., Goret, J.-Y., Salomn, R. L., and Janssens, I. A.: Simultaneous tree stem and soil greenhouse gas (CO2, CH4, N2O) flux measurements: a novel design for continuous monitoring towards improving flux estimates and temporal resolution, New Phytol., 230, 2487–2500, https://doi.org/10.1111/nph.17352, 2021.
Breitengroß, J. P.: Saisonales Fließverhalten in großflächigen Flußsystemen. Methoden zur Erfassung und Darstellung am Beispiel des Kongo (Zaire), Mitteilungen Geogr. Ges. Hambg., 60, 1–92, 1972.
Brooks, P. D., Geilmann, H., Werner, R. A., and Brand, W. A.: Improved precision of coupled δ13C and δ15N measurements from single samples using an elemental analyzer/isotope ratio mass spectrometer combination with a post-column six-port valve and selective CO2 trapping; improved halide robustness of the combustion reactor using CeO2, Rapid Commun. Mass Spectrom., 17, 1924–1926, https://doi.org/10.1002/rcm.1134, 2003.
Brüggemann, N., Gessler, A., Kayler, Z., Keel, S. G., Badeck, F., Barthel, M., Boeckx, P., Buchmann, N., Brugnoli, E., Esperschütz, J., Gavrichkova, O., Ghashghaie, J., Gomez-Casanovas, N., Keitel, C., Knohl, A., Kuptz, D., Palacio, S., Salmon, Y., Uchida, Y., and Bahn, M.: Carbon allocation and carbon isotope fluxes in the plant-soil-atmosphere continuum: a review, Biogeosciences, 8, 3457–3489, https://doi.org/10.5194/bg-8-3457-2011, 2011.
Buchmann, N., Guehl, J.-M., Barigah, T. S., and Ehleringer, J. R.: Interseasonal comparison of CO2 concentrations, isotopic composition, and carbon dynamics in an Amazonian rainforest (French Guiana), Oecologia, 110, 120–131, https://doi.org/10.1007/s004420050140, 1997.
Bwangoy, J.-R. B., Hansen, M. C., Roy, D. P., De Grandi, G., Justice, C. O.: Wetland mapping in the Congo Basin using optical and radar remotely sensed data and derived topographical indices, Remote Sens. Environ., 114, 73–86, https://doi.org/10.1016/j.rse.2009.08.004, 2010.
Conrad, R., Liu, P., and Claus, P.: Fractionation of stable carbon isotopes during acetate consumption by methanogenic and sulfidogenic microbial communities in rice paddy soils and lake sediments, Biogeosciences, 18, 6533–6546, https://doi.org/10.5194/bg-18-6533-2021, 2021.
Courtois, E. A., Stahl, C., Van den Berge, J., Bréchet, L., Van Langenhove, L., Richter, A., Urbina, I., Soong, J. L., Peñuelas, J., and Janssens, I. A.: Spatial Variation of Soil CO2, CH4 and N2O Fluxes Across Topographical Positions in Tropical Forests of the Guiana Shield, Ecosystems, 21, 1445–1458, https://doi.org/10.1007/s10021-018-0232-6, 2018.
Crezee, B., Dargie, G. C., Ewango, C. E. N., Mitchard, E. T. A., Emba B., O., Kanyama T., J., Bola, P., Ndjango, J.-B. N., Girkin, N. T., Bocko, Y. E., Ifo, S. A., Hubau, W., Seidensticker, D., Batumike, R., Imani, G., Cuní-Sanchez, A., Kiahtipes, C. A., Lebamba, J., Wotzka, H.-P., Bean, H., Baker, T. R., Baird, A. J., Boom, A., Morris, P. J., Page, S. E., Lawson, I. T., and Lewis, S. L.: Mapping peat thickness and carbon stocks of the central Congo Basin using field data, Nat. Geosci., 15, 639–644, https://doi.org/10.1038/s41561-022-00966-7, 2022.
Daelman, R., Bauters, M., Barthel, M., Bulonza, E., Lefevre, L., Mbifo, J., Six, J., Butterbach-Bahl, K., Wolf, B., Kiese, R., and Boeckx, P.: Spatiotemporal variability of CO2, N2O and CH4 fluxes from a semi-deciduous tropical forest soil in the Congo Basin, Biogeosciences, 22, 1529–1542, https://doi.org/10.5194/bg-22-1529-2025, 2025.
Dalmagro, H. J., Lathuillière, M. J., Hawthorne, I., Morais, D. D., Pinto Jr., O. B., Couto, E. G., and Johnson, M. S.: Carbon biogeochemistry of a flooded Pantanal forest over three annual flood cycles, Biogeochemistry, 139, 1–18, https://doi.org/10.1007/s10533-018-0450-1, 2018.
Davidson, E. A., Ishida, F. Y., and Nepstad, D. C.: Effects of an experimental drought on soil emissions of carbon dioxide, methane, nitrous oxide, and nitric oxide in a moist tropical forest, Glob. Change Biol., 10, 718–730, https://doi.org/10.1111/j.1365-2486.2004.00762.x, 2004.
De Clippele, A. and Barthel, M.: Dataset of aquatic and Soil CO2 Emissions from forested wetlands of Congo's Cuvette Centrale (Version 1), Zenodo [data set], https://doi.org/10.5281/zenodo.15051088, 2025.
Docherty, E. M. and Thomas, A. D.: Larger floods reduce soil CO2 efflux during the post-flooding phase in seasonally-flooded forests of Western Amazonia, Pedosphere, 31, 342–352, https://doi.org/10.1016/S1002-0160(20)60073-X, 2021.
Doff sotta, E., Meir, P., Malhi, Y., Donato nobre, A., Hodnett, M., and Grace, J.: Soil CO2 efflux in a tropical forest in the central Amazon, Glob. Change Biol., 10, 601–617, https://doi.org/10.1111/j.1529-8817.2003.00761.x, 2004.
Drake, T. W., Raymond, P. A., and Spencer, R. G. M.: Terrestrial carbon inputs to inland waters: A current synthesis of estimates and uncertainty, Limnol. Oceanogr. Lett., 3, 132–142, https://doi.org/10.1002/lol2.10055, 2018.
Drake, T. W., Barthel, M., Mbongo, C. E., Mpambi, D. M., Baumgartner, S., Botefa, C. I., Bauters, M., Kurek, M. R., Spencer, R. G. M., McKenna, A. M., Haghipour, N., Ekamba, G. L., Wabakanghanzi, J. N., Eglinton, T. I., Van Oost, K., and Six, J.: Hydrology drives export and composition of carbon in a pristine tropical river, Limnol. Oceanogr., 68, 2476–2491, https://doi.org/10.1002/lno.12436, 2023.
Epron, D., Nouvellon, Y., Mareschal, L., Moreira, R. M. e, Koutika, L.-S., Geneste, B., Delgado-Rojas, J. S., Laclau, J.-P., Sola, G., Gonçalves, J. L. de M., and Bouillet, J.-P.: Partitioning of net primary production in Eucalyptus and Acacia stands and in mixed-species plantations: Two case-studies in contrasting tropical environments, For. Ecol. Manag., 301, 102–111, https://doi.org/10.1016/j.foreco.2012.10.034, 2013.
Fatras, C., Parrens, M., Peña Luque, S., and Al Bitar, A.: Hydrological dynamics of the Congo basin from water surfaces based on L-band microwave, Water Resour. Res., 56, e2020WR027259, https://doi.org/10.1029/2020WR027259, 2021.
Gallarotti, N., Barthel, M., Verhoeven, E., Pereira, E. I. P., Bauters, M., Baumgartner, S., Drake, T. W., Boeckx, P., Mohn, J., Longepierre, M., Mugula, J. K., Makelele, I. A., Ntaboba, L. C., and Six, J.: In-depth analysis of N2O fluxes in tropical forest soils of the Congo Basin combining isotope and functional gene analysis, ISME J., 15, 3357–3374, https://doi.org/10.1038/s41396-021-01004-x, 2021.
Garcia-Montiel, D. C., Melillo, J. M., Steudler, P. A., Tian, H., Neill, C., Kicklighter, D. W., Feigl, B., Piccolo, M., and Cerri, C. C.: Emissions of N2O and CO2 from Terra Firme Forests in Rondônia, Brazil, Ecol. Appl., 14, 214–220, https://doi.org/10.1890/01-6023, 2004.
Georgiou, S., Mitchard, E. T. A., Crezee, B., Dargie, G. C., Young, D. M., Jovani-Sancho, A. J., Kitambo, B., Papa, F., Bocko, Y. E., Bola, P., Crabtree, D. E., Emba, O. B., Ewango, C. E. N., Girkin, N. T., Ifo, S. A., Kanyama, J. T., Mampouya, Y. E. W., Mbemba, M., Ndjango, J.-B. N., Palmer, P. I., Sjögersten, S., and Lewis, S. L.: Mapping Water Levels across a Region of the Cuvette Centrale Peatland Complex, Remote Sens., 15, 3099, https://doi.org/10.3390/rs15123099, 2023.
Goodrick, I., Connor, S., Bird, M. I., and Nelson, P. N.: Emission of CO2 from tropical riparian forest soil is controlled by soil temperature, soil water content and depth to water table, Soil Res., 54, 311, https://doi.org/10.1071/SR15040, 2016.
Grolemund, G. and Wickham, H.: Dates and times made easy with lubridate, J. Stat. Softw., 40, 1–25, https://doi.org/10.18637/jss.v040.i03, 2011.
Hashimoto, S., Carvalhais, N., Ito, A., Migliavacca, M., Nishina, K., and Reichstein, M.: Global spatiotemporal distribution of soil respiration modeled using a global database, Biogeosciences, 12, 4121–4132, https://doi.org/10.5194/bg-12-4121-2015, 2015.
Hotchkiss, E. R., Hall Jr., R. O., Sponseller, R. A., Butman, D., Klaminder, J., Laudon, H., Rosvall, M., and Karlsson, J.: Sources of and processes controlling CO2 emissions change with the size of streams and rivers, Nat. Geosci., 8, 696–699, https://doi.org/10.1038/ngeo2507, 2015.
Huang, N., Wang, L., Song, X.-P., Black, T. A., Jassal, R. S., Myneni, R. B., Wu, C., Wang, L., Song, W., Ji, D., Yu, S., and Niu, Z.: Spatial and temporal variations in global soil respiration and their relationships with climate and land cover, Sci. Adv., 6, eabb8508, https://doi.org/10.1126/sciadv.abb8508, 2020.
Hubau, W., Lewis, S. L., Phillips, O. L., Affum-Baffoe, K., Beeckman, H., Cuní-Sanchez, A., Daniels, A. K., Ewango, C. E. N., Fauset, S., Mukinzi, J. M., Sheil, D., Sonké, B., Sullivan, M. J. P., Sunderland, T. C. H., Taedoumg, H., Thomas, S. C., White, L. J. T., Abernethy, K. A., Adu-Bredu, S., Amani, C. A., Baker, T. R., Banin, L. F., Baya, F., Begne, S. K., Bennett, A. C., Benedet, F., Bitariho, R., Bocko, Y. E., Boeckx, P., Boundja, P., Brienen, R. J. W., Brncic, T., Chezeaux, E., Chuyong, G. B., Clark, C. J., Collins, M., Comiskey, J. A., Coomes, D. A., Dargie, G. C., de Haulleville, T., Kamdem, M. N. D., Doucet, J. L., Esquivel-Muelbert, A., Feldpausch, T. R., Fofanah, A., Foli, E. G., Gilpin, M., Gloor, E., Gonmadje, C., Gourlet-Fleury, S., Hall, J. S., Hamilton, A. C., Harris, D. J., Hart, T. B., Hockemba, M. B. N., Hladik, A., Ifo, S. A., Jeffery, K. J., Jucker, T., Yakusu, E. K., Kearsley, E., Kenfack, D., Koch, A., Leal, M. E., Levesley, A., Lindsell, J. A., Lisingo, J., Lopez-Gonzalez, G., Lovett, J. C., Makana, J. R., Malhi, Y., Marshall, A. R., Martin, J., Martin, E. H., Mbayu, F. M., Medjibe, V. P., Mihindou, V., Mitchard, E. T. A., Moore, S., Munishi, P. K. T., Bengone, N. N., Ojo, L., Ondo, F. E., Peh, K. S. H., Pickavance, G. C., Poulsen, A. D., Poulsen, J. R., Qie, L., Reitsma, J., Rovero, F., Swaine, M. D., Talbot, J., Taplin, J., Taylor, D. M., Thomas, D. W., Toirambe, B., Mukendi, J. T., Tuagben, D., Umunay, P. M., Geertje, M. F., van der Heijden, Verbeeck, H., Vleminckx, J., Willcock, S., Wöll, H., Woods, J. T., and Zemagho, L.: Asynchronous carbon sink saturation in African and Amazonian tropical forests, Nature, 579, 80–87, https://doi.org/10.1038/s41586-020-2035-0, 2020.
Janssens, I. A., Têtè Barigah, S., and Ceulemans, R.: Soil CO2 efflux rates in different tropical vegetation types in French Guiana, Ann. Sci. For., 55, 671–680, https://doi.org/10.1051/forest:19980603, 1998.
Jian, J., Vargas, R., Anderson-Teixeira, K. J., Stell, E., Herrmann, V., Horn, M., Kholod, N., Manzon, J., Marchesi, R., Paredes, D., and Bond-Lamberty, B. P.: A Global Database of Soil Respiration Data, Version 5.0, ORNL DAAC, Oak Ridge, Tennessee, USA [data set], https://doi.org/10.3334/ORNLDAAC/1827, 2021.
Katayama, A., Kume, T., Komatsu, H., Ohashi, M., Nakagawa, M., Yamashita, M., Otsuki, K., Suzuki, M., and Kumagai, T.: Effect of forest structure on the spatial variation in soil respiration in a Bornean tropical rainforest, Agric. For. Meteorol., 149, 1666–1673, https://doi.org/10.1016/j.agrformet.2009.05.007, 2009.
Keeling, D.: The concentration and isotopic abundances of atmospheric carbon dioxide in rural areas, Geochim. Cosmochim. Ac., 13, 322–334, 1958.
Kuznetsova, A., Brockhoff, P. B., and Christensen, R. H. B.: lmerTest Package: Tests in Linear Mixed Effects Models, J. Stat. Softw., 82, 1–26, https://doi.org/10.18637/jss.v082.i13, 2017.
Kuzyakov, Y. and Gavrichkova, O.: REVIEW: Time lag between photosynthesis and carbon dioxide efflux from soil: a review of mechanisms and controls, Glob. Change Biol., 16, 3386–3406, https://doi.org/10.1111/j.1365-2486.2010.02179.x, 2010.
Lewis, S. L., Sonké, B., Sunderland, T., Begne, S. K., Lopez-Gonzalez, G., van der Heijden, G. M. F., Phillips, O. L., Affum-Baffoe, K., Baker, T. R., Banin, L., Bastin, J.-F., Beeckman, H., Boeckx, P., Bogaert, J., De Cannière, C., Chezeaux, E., Clark, C. J., Collins, M., Djagbletey, G., Djuikouo, M. N. K., Droissart, V., Doucet, J.-L., Ewango, C. E. N., Fauset, S., Feldpausch, T. R., Foli, E. G., Gillet, J.-F., Hamilton, A. C., Harris, D. J., Hart, T. B., de Haulleville, T., Hladik, A., Hufkens, K., Huygens, D., Jeanmart, P., Jeffery, K. J., Kearsley, E., Leal, M. E., Lloyd, J., Lovett, J. C., Makana, J.-R., Malhi, Y., Marshall, A. R., Ojo, L., Peh, K. S. H., Pickavance, G., Poulsen, J. R., Reitsma, J. M., Sheil, D., Simo, M., Steppe, K., Taedoumg, H. E., Talbot, J., Taplin, J. R. D., Taylor, D., Thomas, S. C., Toirambe, B., Verbeeck, H., Vleminckx, J., White, L. J. T., Willcock, S., Woell, H., and Zemagho, L.: Above-ground biomass and structure of 260 African tropical forests, Philos. Trans. R. Soc. B, 368, 20120295, https://doi.org/10.1098/rstb.2012.0295, 2013.
Lüdecke, D.: sjPlot: Data Visualization for Statistics in Social Science, cran, https://doi.org/10.32614/CRAN.package.sjPlot, 2013.
Mann, P. J., Spencer, R. G. M., Dinga, B. J., Poulsen, J. R., Hernes, P. J., Fiske, G., Salter, M. E., Wang, Z. A., Hoering, K. A., Six, J., and Holmes, R. M.: The biogeochemistry of carbon across a gradient of streams and rivers within the Congo Basin, J. Geophys. Res.-Biogeo., 119, 687–702, https://doi.org/10.1002/2013JG002442, 2014.
Mitchard, E. T. A.: The tropical forest carbon cycle and climate change, Nature, 559, 527–534, https://doi.org/10.1038/s41586-018-0300-2, 2018.
Nakagawa, S., Johnson, P. C. D., and Schielzeth, H.: The coefficient of determination R2 and intra-class correlation coefficient from generalized linear mixed-effects models revisited and expanded, J. R. Soc. Interface, 14, 20170213, https://doi.org/10.1098/rsif.2017.0213, 2017.
Nissan, A., Alcolombri, U., Peleg, N., Galili, N., Jimenez-Martinez, J., Molnar, P., and Holzner, M.: Global warming accelerates soil heterotrophic respiration, Nat. Commun., 14, 3452, https://doi.org/10.1038/s41467-023-38981-w, 2023.
Oertel, C., Matschullat, J., Zurba, K., Zimmermann, F., and Erasmi, S.: Greenhouse gas emissions from soils – A review, Chem. Erde – Geochem., 76, 327–352, https://doi.org/10.1016/j.chemer.2016.04.002, 2016.
Ohashi, M., Kume, T., Yamane, S., and Suzuki, M.: Hot spots of soil respiration in an Asian tropical rainforest, Geophys. Res. Lett., 34, L08705, https://doi.org/10.1029/2007GL029587, 2007.
Ottosson-Löfvenius, M. and Read, D. J.: Large-scale forest girdling shows that current photosynthesis drives soil respiration, Nature, 411, 789–792, https://doi.org/10.1038/35081058, 2001.
Parmentier, I., Malhi, Y., Senterre, B., Whittaker, R. J., and ALONSO, A., Balinga, M. P. B., Bakayoko, A., Bongers, F., Cha?ain, C., Comiskey, J. A., Cortay, R., Kamdem, M.-N. D., Doucet, J.-L., Gautier, L., Hawthorne, W. D., Issembe, Y. A., Kouamé, F. N., Kouka, L. A., Leal, M. E., Lejoly, J., Lewis, S. L., Nusbaumer, L., Parren, M. P. E., Peh, K. S.-H., Phillips, O. L., Sheil, D., Sonké, B., Sosef, M. S. M., Sunderland, T. C. H., Stropp, J., Ter Steege, H., Swaine, M. D., Tchouto, M. G. P., Gemerden, B. S. V., Van Valkenburg, J. L. C. H., and Wöll, H.: The odd man out? Might climate explain the lower tree α-diversity of African rain forests relative to Amazonian rain forests?, J. Ecol., 95, 1058–1071, https://doi.org/10.1111/j.1365-2745.2007.01273.x, 2007.
Pavelka, M., Acosta, M., Kiese, R., Altimir, N., Brümmer, C., Crill, P., Darenova, E., Fuß, R., Gielen, B., Graf, A., Klemedtsson, L., Lohila, A., Longdoz, B., Lindroth, A., Nilsson, M., Jiménez, S. M., Merbold, L., Montagnani, L., Peichl, M., Pihlatie, M., Pumpanen, J., Ortiz, P. S., Silvennoinen, H., Skiba, U., Vestin, P., Weslien, P., Janous, D., and Kutsch, W.: Standardisation of chamber technique for CO2, N2O and CH4 fluxes measurements from terrestrial ecosystems, Int. Agrophysics, 32, 569–587, https://doi.org/10.1515/intag-2017-0045, 2018.
Pelletier, L., Strachan, I. B., Garneau, M., and Roulet, N. T.: Carbon release from boreal peatland open water pools: Implication for the contemporary C exchange, J. Geophys. Res.-Biogeo., 119, 207–222, https://doi.org/10.1002/2013JG002423, 2014.
Posit team (2025): RStudio: Integrated Development Environment for R, Posit Software, PBC, Boston, MA, http://www.posit.co/ (last access: 17 March 2025), 2025.
Rasera, M. de F. F. L., Ballester, M. V. R., Krusche, A. V., Salimon, C., Montebelo, L. A., Alin, S. R., Victoria, R. L., and Richey, J. E.: Estimating the Surface Area of Small Rivers in the Southwestern Amazon and Their Role in CO2 Outgassing, Earth Interact., 12, 1–16, https://doi.org/10.1175/2008EI257.1, 2008.
Raymond, P. A., Hartmann, J., Lauerwald, R., Sobek, S., McDonald, C., Hoover, M., Butman, D., Striegl, R., Mayorga, E., Humborg, C., Kortelainen, P., Dürr, H., Meybeck, M., Ciais, P., and Guth, P.: Global carbon dioxide emissions from inland waters, Nature, 503, 355–359, https://doi.org/10.1038/nature12760, 2013.
R Core Team: R: _R: A Language and Environment for Statistical Computing_, R Foundation for Statistical Computing, Vienna, Austria, https://www.R-project.org/ (last access: 17 March 2025), 2023.
Rocher-Ros, G., Sponseller, R. A., Lidberg, W., Mörth, C.-M., and Giesler, R.: Landscape process domains drive patterns of CO2 evasion from river networks, Limnol. Oceanogr. Lett., 4, 87–95, https://doi.org/10.1002/lol2.10108, 2019.
Rosentreter, J. A., Borges, A. V., Deemer, B. R., Holgerson, M. A., Liu, S., Song, C., Melack, J., Raymond, P. A., Duarte, C. M., Allen, G. H., Olefeldt, D., Poulter, B., Battin, T. I., and Eyre, B. D.: Half of global methane emissions come from highly variable aquatic ecosystem sources, Nat. Geosci., 14, 225–230, https://doi.org/10.1038/s41561-021-00715-2, 2021.
Rubio, V. E. and Detto, M.: Spatiotemporal variability of soil respiration in a seasonal tropical forest, Ecol. Evol., 7, 7104–7116, https://doi.org/10.1002/ece3.3267, 2017.
Runge, J.: The Congo River, Central Africa, in: Large Rivers: Geomorphology and Management, edited by: Gupta, A., John Wiley & Sons, Ltd, West Sussex, 293–308, 2007.
Scofield, V., Melack, J. M., Barbosa, P. M., Amaral, J. H. F., Forsberg, B. R., and Farjalla, V. F.: Carbon dioxide outgassing from Amazonian aquatic ecosystems in the Negro River basin, Biogeochemistry, 129, 77–91, https://doi.org/10.1007/s10533-016-0220-x, 2016.
Slik, J. W. F., Arroyo-Rodríguez, V., Aiba, S.-I., Alvarez-Loayza, P., Alves, L. F., Ashton, P., Balvanera, P., Bastian, M. L., Bellingham, P. J., van den Berg, E., Bernacci, L., da Conceição Bispo, P., Blanc, L., Böhning-Gaese, K., Boeckx, P., Bongers, F., Boyle, B., Bradford, M., Brearley, F. Q., Breuer-Ndoundou Hockemba, M., Bunyavejchewin, S., Calderado Leal Matos, D., Castillo-Santiago, M., Catharino, E. L. M., Chai, S.-L., Chen, Y., Colwell, R. K., Chazdon, R. L., Clark, C., Clark, D. B., Clark, D. A., Culmsee, H., Damas, K., Dattaraja, H. S., Dauby, G., Davidar, P., DeWalt, S. J., Doucet, J.-L., Duque, A., Durigan, G., Eichhorn, K. A. O., Eisenlohr, P. V., Eler, E., Ewango, C., Farwig, N., Feeley, K. J., Ferreira, L., Field, R., de Oliveira Filho, A. T., Fletcher, C., Forshed, O., Franco, G., Fredriksson, G., Gillespie, T., Gillet, J.-F., Amarnath, G., Griffith, D. M., Grogan, J., Gunatilleke, N., Harris, D., Harrison, R., Hector, A., Homeier, J., Imai, N., Itoh, A., Jansen, P. A., Joly, C. A., de Jong, B. H. J., Kartawinata, K., Kearsley, E., Kelly, D. L., Kenfack, D., Kessler, M., Kitayama, K., Kooyman, R., Larney, E., Laumonier, Y., Laurance, S., Laurance, W. F., Lawes, M. J., Amaral, I. L. do, Letcher, S. G., Lindsell, J., Lu, X., Mansor, A., Marjokorpi, A., Martin, E. H., Meilby, H., Melo, F. P. L., Metcalfe, D. J., Medjibe, V. P., Metzger, J. P., Millet, J., Mohandass, D., Montero, J. C., de Morisson Valeriano, M., Mugerwa, B., Nagamasu, H., Nilus, R., Ochoa-Gaona, S., Onrizal, N. P., Parolin, P., Parren, M., Parthasarathy, N., Paudel, E., Permana, A., Piedade, M. T. F., Pitman, N. C. A., Poorter, L., Poulsen, A. D., Poulsen, J., Powers, J., Prasad, R. C., Puyravaud, J.-P., Razafimahaimodison, J.-C., Reitsma, J., dos Santos, J. R., Spironello, W. R., Romero-Saltos, H., Rovero, F., Rozak, A. H., Ruokolainen, K., Rutishauser, E., Saiter, F., Saner, P., Santos, B. A., Santos, F., Sarker, S. K., Satdichanh, M., Schmitt, C. B., Schöngart, J., Schulze, M., Suganuma, M. S., Sheil, D., da Silva Pinheiro, E., Sist, P., Stevart, T., Sukumar, R., Sun, I.-F., Sunderland, T., Suresh, H. S.,Suzuki, E., Tabarelli, M., Tang, J., Targhetta, N., Theilade, I., Thomas, D. W., Tchouto, P., Hurtado, J., Valencia, R., van Valkenburg, J. L. C. H., Van Do, T., Vasquez, R., Verbeeck, H., Adekunle, V., Vieira, S. A., Webb, C. O., Whitfeld, T., Wich, S. A., Williams, J., Wittmann, F., Wöll, H., Yang, X., Yao, C. Y. A., Yap, S. L., Yoneda, T., Zahawi, R. A., Zakaria, R., Zang, R., de Assis, R. L., Luize, B. G., and Venticinque, E. M.: An estimate of the number of tropical tree species, P. Natl. Acad. Sci. USA, 112, 7472–7477, https://doi.org/10.1073/pnas.1423147112, 2015.
Sotta, E. D., Veldkamp, E., Schwendenmann, L., Guimarães, B. R., Paixão, R. K., Ruivo, M. de L. P., Lola da Costa, A. C., and Meir, P.: Effects of an induced drought on soil carbon dioxide (CO2) efflux and soil CO2 production in an Eastern Amazonian rainforest, Brazil, Global Change Biol., 13, 2218–2229, https://doi.org/10.1111/j.1365-2486.2007.01416.x, 2007.
Sousa Neto, E., Carmo, J. B., Keller, M., Martins, S. C., Alves, L. F., Vieira, S. A., Piccolo, M. C., Camargo, P., Couto, H. T. Z., Joly, C. A., and Martinelli, L. A.: Soil-atmosphere exchange of nitrous oxide, methane and carbon dioxide in a gradient of elevation in the coastal Brazilian Atlantic forest, Biogeosciences, 8, 733–742, https://doi.org/10.5194/bg-8-733-2011, 2011.
Stoffel, M. A., Nakagawa, S., and Schielzeth, H.: partR2: partitioning R2 in generalized linear mixed models, PeerJ, 9, e11414, https://doi.org/10.7717/peerj.11414, 2021.
Tathy, J. P., Cros, B., Delmas, R. A., Marenco, A., Servant, J., and Labat, M.: Methane emission from flooded forest in central Africa, J. Geophys. Res.-Atmos., 97, 6159–6168, https://doi.org/10.1029/90JD02555, 1992.
Upstill-Goddard, R. C., Salter, M. E., Mann, P. J., Barnes, J., Poulsen, J., Dinga, B., Fiske, G. J., and Holmes, R. M.: The riverine source of CH4 and N2O from the Republic of Congo, western Congo Basin, Biogeosciences, 14, 2267–2281, https://doi.org/10.5194/bg-14-2267-2017, 2017.
Verchot, L. V., Dannenmann, M., Kengdo, S. Kwatcho, N.-B., Baudouin, C., Rufino, M. C., Sonwa, D. J., and Tejedor, J.: Land-use change and Biogeochemical controls of soil CO2, N2O and CH4 fluxes in Cameroonian forest landscapes, J. Integr. Environ. Sci., 17, 45–67, https://doi.org/10.1080/1943815X.2020.1779092, 2020.
Wanninkhof, R.: Relationship between wind speed and gas exchange over the ocean revisited, Limnol. Oceanogr. Methods, 12, 351–362, https://doi.org/10.4319/lom.2014.12.351, 2014.
Werner, C., Kiese, R., and Butterbach-Bahl, K.: Soil-atmosphere exchange of N2O, CH4, and CO2 and controlling environmental factors for tropical rain forest sites in western Kenya, J. Geophys. Res., 112, D03308, https://doi.org/10.1029/2006JD007388, 2007.
Werner, R. A. and Brand, W. A.: Referencing strategies and techniques in stable isotope ratio analysis, Rapid Commun. Mass Spectrom., 15, 501–519, https://doi.org/10.1002/rcm.258, 2001.
Werner, R. A., Bruch, B. A., and Brand, W. A.: ConFlo III – an interface for high precision δ13C and δ15N analysis with an extended dynamic range, Rapid Commun. Mass Spectrom., 13, 1237–1241, https://doi.org/10.1002/(SICI)1097-0231(19990715)13:13<1237::AID-RCM633>3.0.CO;2-C, 1999.
Werner, R. A., Rothe, M., and Brand, W. A.: Extraction of CO2 from air samples for isotopic analysis and limits to ultra high precision δ18O determination in CO2 gas, Rapid Commun. Mass Spectrom., 15, 2152–2167, https://doi.org/10.1002/rcm.487, 2001.
Wickham, H.: ggplot2, Springer New York, New York, NY, https://doi.org/10.1007/978-0-387-98141-3, 2009.
Wickham, H, François, R., Henry, L., Müller, K., and Vaughan, D.: _dplyr: A Grammar of Data Manipulation_, R package version 1.1.4,, CRAN [code], https://doi.org/10.32614/CRAN.package.dplyr, 2023.
Wild, J., Kopecký, M., Macek, M., Šanda, M., Jankovec, J., and Haase, T.: Climate at ecologically relevant scales: A new temperature and soil moisture logger for long-term microclimate measurement, Agric. For. Meteorol., 268, 40–47, https://doi.org/10.1016/j.agrformet.2018.12.018, 2019.
Zanchi, F. B., Waterloo, M. J., Dolman, A. J., Groenendijk, M., Kesselmeier, J., Kruijt, B., Bolson, M. A., Luizão, F. J., and Manzi, A. O.: Influence of drainage status on soil and water chemistry, litter decomposition and soil respiration in central Amazonian forests on sandy soils, Ambiente E Agua – Interdiscip. J. Appl. Sci., 6, 6–29, https://doi.org/10.4136/ambi-agua.170, 2011.