the Creative Commons Attribution 4.0 License.
the Creative Commons Attribution 4.0 License.
 | 18 Jul 2025
Marine snow morphology drives sinking and attenuation in the ocean interior
Yawouvi Dodji Soviadan
Miriam Beck
Joelle Habib
Alberto Baudena
Laetitia Drago
Alexandre Accardo
Remi Laxenaire
Sabrina Speich
Peter Brandt
Rainer Kiko
Simultaneous measurements of marine snow (particles larger than 600 µm) morphologies, estimates of their in situ sinking speeds, and midwater attenuation in export plumes were performed for the first time using a biogeochemical (BGC)-Argo float equipped with optical and imaging sensors. The float was deployed and recovered after drifting for 1 year in the sluggish-flow regime of the Angola Basin. Six consecutive chlorophyll a and particulate matter accumulation events were recorded at the surface, each followed by an export plume of sinking aggregates. Objects larger than 600 µm were classified using machine learning recognition and clustered into four morphological categories of marine aggregates. Plankton images were validated by an expert in a few broad categories. Results show that different types of aggregates were produced and exported from the different blooms. The different morphological categories of marine snow had different sinking speeds and attenuation for a similar size, indicating the effect of morphology on sinking speed. However, a typical size-to-sinking relationship for two of the categories and over the larger observed size range (100 µm to a few millimeters) was also observed, indicating the importance of size for sinking. Surprisingly, in situ-calculated sinking speeds were constantly in the lower range of known values usually assessed ex situ, suggesting a methodological effect, which is discussed. Moving away from purely size-based velocity relationships and incorporating these additional morphological aggregate properties will help to improve the mechanistic understanding of particle sinking and provide more accurate flux estimates. When used from autonomous platforms at high frequency, they will also provide increased spatio-temporal resolution for the observation of intermittent export events naturally occurring or induced by human activities.
- Article
(6775 KB) - Full-text XML
-
Supplement
(1688 KB) - BibTeX
- EndNote


Production, transfer to depth, and remineralization of organic particles provide a major pathway for the export of carbon from the ocean's surface to the ocean interior (Volk and Hoffert, 1985). Phytoplankton photosynthesis and zooplankton trophic activities produce, in the sunlit ocean, particulate matter at the basis of marine food webs. Among the different physical and biological processes determining the fate of particular matter production, gravitational sinking is responsible for 90 % of the carbon vertical flux (Boyd et al., 2019). The mesopelagic, here taken as the 100–1000 m layer, is also the starting depth for a myriad of processes, such as particle fragmentation, packaging, and/or respiration by the mesopelagic fauna that impact (mostly reduce) the flux as particle sink (Burd et al., 2010; Giering et al., 2014; Stemmann et al., 2004). The faster the sinking, the more carbon is carried to a depth where it can be stored for a long time (Boyd et al., 2019; Siegel et al., 2023).
In the common paradigm, large (> a few hundred micrometers in size) marine particles were thought to be the main vector of the carbon flux (Alldredge and Silver, 1988; Honjo et al., 1982; Stemmann et al., 2002). However, more recently, particles' characteristics other than size (e.g., porosity, ballasting, geometry) were assessed to be important in setting the flux (Cael et al., 2021; Iversen and Lampitt, 2020; Stemmann and Boss, 2012; Williams and Giering, 2022). Particles are often found in the form of aggregates composed of various lithogenic or biogenic elements (Alldredge and Silver, 1988), and their sinking speed depends on the morphological properties of the individual aggregates (size, density, geometry), which, in turn, depend on the nature of the producers and the aggregation/disaggregation processes (Alldredge and Gotschalk, 1988; Alldredge and Silver, 1988; Iversen and Lampitt, 2020; Ploug et al., 2008a). The efficiency of the deep carbon sequestration depends not only on the aggregate sinking speed but also on their attenuation by various mesopelagic processes as they penetrate into the twilight zone of the ocean. A strong vertical flux attenuation in the mesopelagic is usually observed as a result of respiration and particle fragmentation by organisms (Burd et al., 2010; Giering et al., 2014; Stemmann et al., 2004). On one hand, export of quickly sinking particles may be less attenuated than that of slowly sinking ones as they spend less time in this layer, but on the other hand, they may be more prone to flux feeding by gatekeeper zooplankton at the base of the mixed layer (Jackson and Checkley, 2011). However, this remains an open question as sinking speed is not only dependent on size (Iversen and Lampitt, 2020) but also varies with ballasting (Ploug et al., 2008a, b) and aggregate morphology (Trudnowska et al., 2021), which are barely known.
Because the size of particles is easy to measure in situ with imaging systems (Gorsky et al., 2000; Picheral et al., 2010, 2022; Stemmann and Boss, 2012) or ex situ in experimental design after production or collection (Iversen et al., 2010; Ploug et al., 2010), the majority of previous studies have calculated sinking speeds, from observations or in models, using a power law relationship between sinking and size (Burd, 2023; Forest et al., 2013; Guidi et al., 2008; Iversen et al., 2010; Kiko et al., 2020; Kriest and Evans, 2000; Soviadan et al., 2022; Stemmann et al., 2004). However, the parameters of this size-to-sinking relationship vary widely as a function of plankton community composition and aggregation processes (Cael et al., 2021; Forest et al., 2013; Laurenceau-Cornec et al., 2015; Stemmann et al., 2004; Williams and Giering, 2022). In some cases, the relationship was not observed (Diercks and Asper, 1997; Iversen and Lampitt, 2020) or showed an opposite pattern (McDonnell and Buesseler, 2010), bringing the nature of the relationship between size and sinking speed into question or suggesting possible bias due to the experimental methods used (Williams and Giering, 2022).
For decades, sinking speeds have generally been estimated experimentally, ex situ on collected (or produced) material in 81 % of cases, in situ in specific chambers in 14 % of cases, and in situ by divers in 5 % of cases (Cael et al., 2021; Williams and Giering, 2022). More recently, sinking speeds have been calculated by analyzing in situ time series of the export plume using optical or camera systems (Briggs et al., 2020; Giering et al., 2020; Stemmann et al., 2002; Trudnowska et al., 2021). There is debate about whether in situ or ex situ methods provide accurate estimates of sinking speed because in situ estimates tend to be lower (Williams and Giering, 2022). Potential bias in ex situ experimental design exists due to physical alteration during collection or production or because the selected particles for experiments do not represent in situ particle assemblages (Williams and Giering, 2022). Conversely, in situ methods provide an estimate of the bulk particle assemblage, possibly sorted as a function of size. The latest advancements in optical and imaging sensor technology have enabled their integration onto autonomous floats (Accardo et al., 2025; Briggs et al., 2020; Lacour et al., 2024; Picheral et al., 2022). Additionally, recent progress in unsupervised image classification now facilitates the classification of individual aggregates into categories (Accardo et al., 2025; Irisson et al., 2022; Trudnowska et al., 2021). When applied to the study of phytoplankton bloom in the Arctic Ocean, the image classification of the different types of detritus obtained using the Underwater Vision Profiler 5 deployed from a ship, showed, for the first time, a clear relationship between phytoplankton community structure and aggregate morphology, with an impact on the sinking aggregate (Trudnowska et al., 2021). Networks of biogeochemical (BGC)-Argo floats are now deployed with optical sensors to better estimate and understand processes of carbon flux and attenuation (Accardo et al., 2025; Henson et al., 2024; Lacour et al., 2024). Imaging sensors, by providing more qualitative data, will bring a substantial increase in our knowledge of mesopelagic dynamics and the interplay between particles and plankton at scales varying from local to global (Biard et al., 2016; Drago et al., 2022; Laget et al., 2024; Panaiotis et al., 2023; Stemmann et al., 2002, 2008).
In this study, we analyze the results of image analysis of a recovered Underwater Vision Profiler 6 (UVP6) camera mounted on a BGC-Argo float from May 2021 to April 2022 drifting in the sluggish-flow regime of the Angola Basin. During the 1-year deployment, the float drifted slowly in a region with weak currents and low mesoscale activity. Seven consecutive marine snow production events were recorded at the surface, and six of them led to an export plume of sinking aggregates. Unsupervised classification of all the marine snow aggregates was performed to identify the different types of particles. The objectives of this work are (i) to automatically classify in situ images of marine snow, (ii) to describe the assemblage of marine snow particles at the surface and in the mesopelagic during the six intermittent production and export events, and (iii) to infer marine snow morphotype sinking velocities and vertical attenuation in the export plume. To the best of our knowledge, this work provides the first estimates of sinking speeds and export attenuation for different types of particulate materials recorded from a BGC-Argo float.
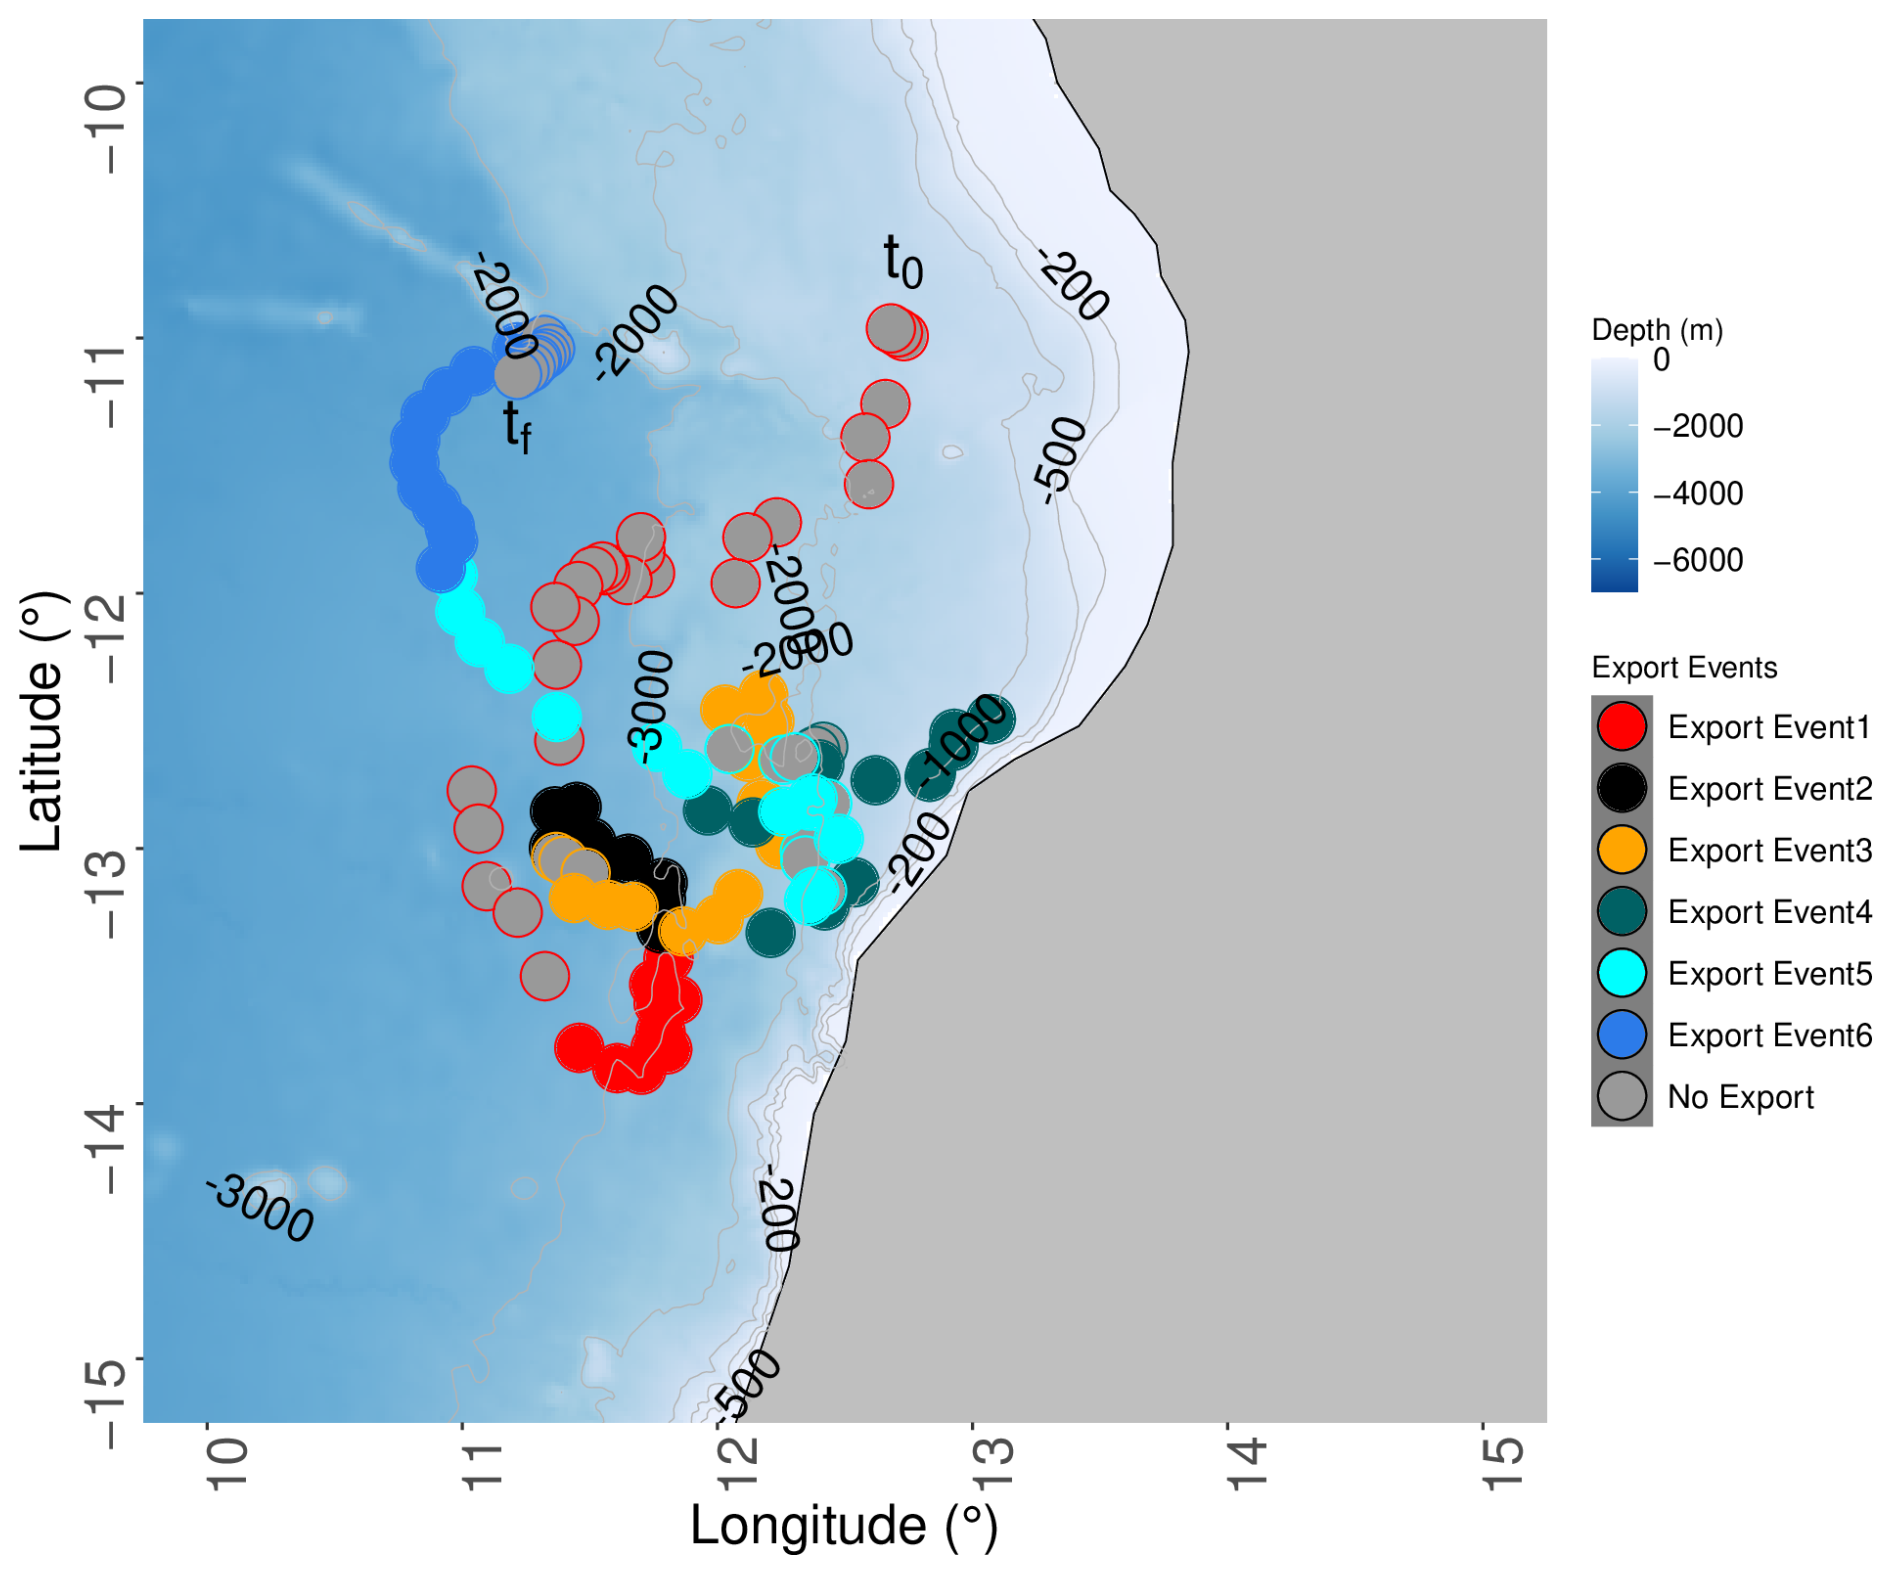
Figure 1Angola region of the BGC-Argo float deployment with the trajectory during the 1-year drift. The filled dots correspond to the six export events, and the colors of the unfilled dots indicate the period before each export event in the same color except for the last period, for which it indicates the period after the export. The beginning (11° S, 12°45′ E; noted t0) of the period before export event 1 indicates the float position at its deployment, and the end (11°10′ S, 11°13′ E; noted tf) of the period after export event 6 indicates the position at its recovery.
2.1 BGC-Argo float deployment
The BGC-Argo float (WMO 6903096) was deployed on 4 May 2021 at 11° S, 12°45′ E during the RV Sonne cruise SO283 and was retrieved on 26 April 2022 at 11°10′ S, 11°13′ E during the RV Meteor cruise M181. The distance between surfacing every 3 d was on average 16 km ± 11.73, with four periods (May 2021, June 2021, December 2021, February 2022) during which the drift could reach 40 km in 3 d. In general, the float was programmed to reach a maximum depth at 1000 m and, when possible, to reach 2000 m every fourth profile (Fig. 1). When the bottom depth was shallower than 1000 m, the float maximum depth was set to be 20 m above seabed. The general pattern of the drifting was southward, almost reaching 14° S in August 2021, and then northeastward toward the isobath of 700 m depth, which was reached in early December 2021. Thereafter, the float drifted toward the southwest along the 700 m isobath until the end of December 2021. The float drifted away from the coast toward the north, up to a latitude of 11° N, at which it was recovered.
2.2 Environmental and satellite data
2.2.1 Float data (CTD, Chl a, Bbp POC)
The float was equipped with several sensors to characterize the properties of the water column. First, to measure hydrological parameters, the float was fitted with pressure (DRUCK_2900PSIA), temperature, and salinity sensors (SBE41CP_V7.2.5). Second, to measure biogeochemical properties, it was equipped with oxygen (AANDERAA_OPTODE_4330), fluorescence (proxy for Chl a), and backscattering (700 nm, referred to as Bbp particulate organic carbon (POC), taken as a proxy for all suspended particles of approximately < 10 µm) sensors (ECO_FLBB_2K). Fluorescence and backscatter were converted to units of Chl a (mg m−3) and POC (mgC m−3), as in Accardo et al. (2025). The UVP6 was mounted on the float. All data (CTD, optical, and UVP6 particle size distribution) were recorded during the ascent of the float and are made freely available by the International Argo Program https://doi.org/10.17882/42182{#}117069 (Argo, 2025b) (float with WMO 6903096, last access: 25 March 2025). We did not apply additional quality control (QC) procedures beyond those already implemented in the standard Argo QC protocols, and derived data were calculated as in Accardo et al. (2025).
2.2.2 Satellite data (SSH, Lagrangian diagnostic)
Several Lagrangian diagnostics were computed at each profile location using velocity data and environmental satellite products. First, for each station (i.e., profile location), a region considered representative of the water column sampled by the float was defined. In this study, this region is a circular neighborhood with a radius r of 0.1° around each exact profile location. Then, the circular shape was filled with virtual particles at the surface separated by 0.01° (resulting in ∼ 300 particles). Following this, the next step was to compute several Lagrangian diagnostics for each virtual particle. This led to about 300 values for each sampling station, which were averaged together, providing a given diagnostic around each profile location. The choice of using a circle around the float profiling location is done to smooth the errors associated with the velocity field uncertainty, as shown in previous studies (Baudena et al., 2021; Chambault et al., 2019; Ser-Giacomi et al., 2021). The velocity field used was derived from both altimetry and assimilation model delayed-time data and includes the geostrophic and the Ekman components (Copernicus Marine Environment Monitoring Service (CMEMS) product MULTIOBS GLO PHY REP 015 004-TDS). It was used to advect each virtual particle (within the representative water parcel) from the profile day until an advective time (τ) was reached, ranging between 5 and 45 d backward in time. For each advective time, a diagnostic mean value was available for each profile. Diagnostics were numerous, so only those which provided significant results are developed here. The first one used was the finite-time Lyapunov exponent (FTLE; d−1). This metric is useful for identifying frontal features (Baudena et al., 2021). In this study, a front is defined as a physical barrier at the surface that separates two water volumes with different hydrographic properties, which were likely very far from each other in the previous days. FTLEs were calculated as in Shadden et al. (2005), and the main parameter that was considered was the initial separation between two virtual particles. The second diagnostic used was the Lagrangian chlorophyll a (mg m−3), i.e., the mean chlorophyll content along the backward particle trajectory. These metric estimations were computed thanks to satellite data of surface chlorophyll a concentrations, which were provided by CMEMS on the Copernicus website (delayed-time satellite product OCEANCOLOUR GLO BGC L4 MY 009 104-TDS).
2.3 Particle data taken by UVP6
2.3.1 A broad size classification of all particles into two size categories
A broad size classification was applied on raw size particle spectrum data (> 100 µm up to a few millimeters) provided by the UVP6 (without any plankton identification). In this case, the assumption was made that zooplankton represent only a small fraction of objects sampled by the UVP6 compared to particles. Size range was then divided into two sub-classes: micrometric particles (MiPs), integrating the concentrations over all size classes between 0.1 and 0.5 mm, and macroscopic particles (MaPs), integrating the concentrations of size classes between 0.5 and 16 mm. This lower threshold was used because it corresponds to the definition of marine snow (Alldredge and Silver, 1988). The vertical flux of these two categories was calculated assuming an empirical relationship: one to convert particle size to POC and another one to obtain sinking speed from size (Kriest, 2002). These relationships, referenced as 2a in Table 1 (for mass) and 9 in Table 2 (for sinking speed), were previously used in studies of the intertropical Atlantic Ocean (Kiko et al., 2017, 2020).
2.3.2 Unsupervised morphological classification of marine snow in four categories
All images were retrieved from the Ecotaxa website (https://ecotaxa.obs-vlfr.fr/gui/prj/7608, last access: 25 March 2025). An unsupervised classification method was applied, following an approach previously used to study marine snow in the Arctic Ocean (Trudnowska et al., 2021) and in the Southern Ocean (Accardo et al., 2025).
Prior to the analysis, zooplankton and particle images were separated by supervised classification and treated independently. The first step consists of summarizing the 27 morphological features that were derived from the individual particle images. These features (Table S1) describe their size (e.g., area, perimeter), shade intensity (e.g., mean/median gray level), shape (e.g., symmetry, elongation), and structure (e.g., homogeneity or heterogeneity, mostly based on the variability in gray level). To reach a normal distribution of each variable, extreme values (below or above the 5th and 95th percentiles) were flagged as NA – which is interpreted as being neutral by the following methods – before applying the Yeo–Johnson transformation (Yeo and Johnson, 2000). These traits were then summarized via dimensionality reduction using principal component analysis (PCA). The PCA function scales the features to unit variance prior to the analysis and creates a multi-dimensional “morphospace” in which each particle is positioned based on its morphological features. As in the work of Trudnowska et al. (2021), size turned out to be the main morphological trait. Therefore, we repeated the same procedure, removing all size-related features (“area”, “perim.”, “major”, “feret”, “convperim”, “skeleton_area”, “convarea_area”, “symetrieh_area”, “symetriev_area”, “elongation”) to hopefully better distinguish the particles based on their other morphological traits. To assess the sensitivity of this classification, we also tested alternative algorithms within this approach (see “Sensitivity of aggregate classification to the method” in the Supplement). In particular, we tested UMAP (McInnes et al., 2018), a method of dimensional reduction, to define the morphospace. In contrast to PCA, which creates a linear projection, UMAP is a non-linear dimensional reduction method that has previously been used in similar contexts (Stolarek et al., 2022; Teixeira et al., 2022). To ensure comparability with the PCA, data were scaled prior to the application, and four axes were retained to define the morphospace. All other parameters were kept with the same default values (n_neighbors = 15, min_dist = 0.1) since the resulting morphospace separated the particles as expected.
The second step, classification, was the same for all options (PCA/ UMAP, with/without size-related features). A k-means clustering was performed on the particles' coordinates on the first four principal components of the morphospace. The number of clusters (“k”) was set to four, a value which provided the best trade-off in several simulations between partitioning particles into visually clearly distinct groups of particle morphology and maintaining simplicity in the following analysis. See “Marine snow classification” in the Supplement for a test of k=5 and 10 to assess the impact of this choice on the result. Finally, the concentration (nb m−3) of each morphotype was computed by dividing the number of particles found in each depth bin by the volume sampled by the UVP6. To study their spatio-temporal distributions, group concentrations were interpolated according to depth and time with a resolution of 5 m and 1 d respectively.
2.4 Data analysis
2.4.1 Sinking speed and particle vertical attenuation
We calculated the sinking speed for six export plumes that were detected by successive peaks at different depths (Fig. 2). Assuming a constant sinking velocity in the upper 1000 m and a Lagrangian drift in a weak-vertical-shear environment during the short marine snow production events (on average < 1 month), we followed the published method developed to survey the evolution of export plumes developed for optical and imaging systems (Briggs et al., 2020; Lacour et al., 2024). In this vertical binning approach, more appropriate for large particles, a Gaussian fit is applied to the median concentration of different aggregate size classes per 100 m depth bin. For each size class and type of marine snow, a linear regression was performed on the coordinates in the depth and time of each of the Gaussian fits' maximums. The value of the slope and the concentrations of the particles at the different depths were stored if the Gaussian fit was successful for at least three depth layers. The slope is an indicator of the sinking speed, while the particle vertical gradients were modeled using a power law model () with a reference depth at 100 m to retrieve the b exponent as an indicator of particle attenuation. This method was initially proposed for POC flux measured in sediment traps (Martin et al., 1987) and vertical flux obtained with profiling cameras (Guidi et al., 2008, 2015), but here it was applied to aggregate concentrations in export plumes, as in Trudnowska et al. (2021). Due to the non-sinking behavior or because of the low signal-to-noise ratio in the upper size range where particles are rare, this approach did not work for all size classes in all categories.
Finally, sinking speeds as a function of size and aggregate types were also calculated over the whole deployment with lagged correlation between time series in two different depth layers (0–100 and 300–400 m). The lag with the maximum correlation indicates the time required for the different particle communities to sink from the upper layer to the deeper layer (over an average distance of 300 m).
2.4.2 Canonical redundancy analysis (RDA) of particle assemblage
For each depth layer, a canonical redundancy analysis (RDA) was performed based on the abundances of the four marine snow morphotypes and the above-mentioned environmental variables to explore the explanatory power of these variables in structuring marine snow. The RDA is an extension of multiple regression analysis applied to multivariate data (Legendre and Legendre, 2012). It allows for the representation of the response variables (abundances of the four categories) in a “constrained” reduced space, i.e., constructed from the explanatory variables (the environmental variables). For each RDA, the following variables were used as “supplementary variables” of the analysis to visualize their correlation with the environmental structuring of marine snow assemblage (i.e., to visualize their position in the RDA space). Beforehand, a Hellinger transformation was performed on the abundances in order to reduce the impact of large concentration values. Significant axes were identified using the Kaiser–Guttman criterion (Legendre and Legendre, 1998).
2.4.3 Identification of intermittent production and export events in a marine snow time series
We determined marine snow production and export events using their time series in five depth layers (Fig. 2). Major peaks were found in the different layers at intervals of a few months. Except for the first surface peak (0–100 m) in May 2021, the subsequent six surface particle peaks were followed by peaks in the mesopelagic layer (noted 1 to 6 in Fig. 2). The beginning of each period was set at the start of marine snow accumulation in the first layer, and the end was set at the time of the subsequent minimum in the deeper layers. Throughout the paper, we refer to these six events as “plumes” or “events”. Apart from these six main peaks, we observed two small peaks in surface concentrations between periods 2 and 3 and periods 4 and 5, which translated into weak peaks in the deeper layer for the first peak. When converted to biovolume (Fig. S8), these small events became more visible, suggesting that they were mainly composed of rare large particles. They were not included in further analysis because they did not meet the quality criteria for estimating sinking speeds (see Sect. 2.4.1) due to the more noisy time series of rare large objects.
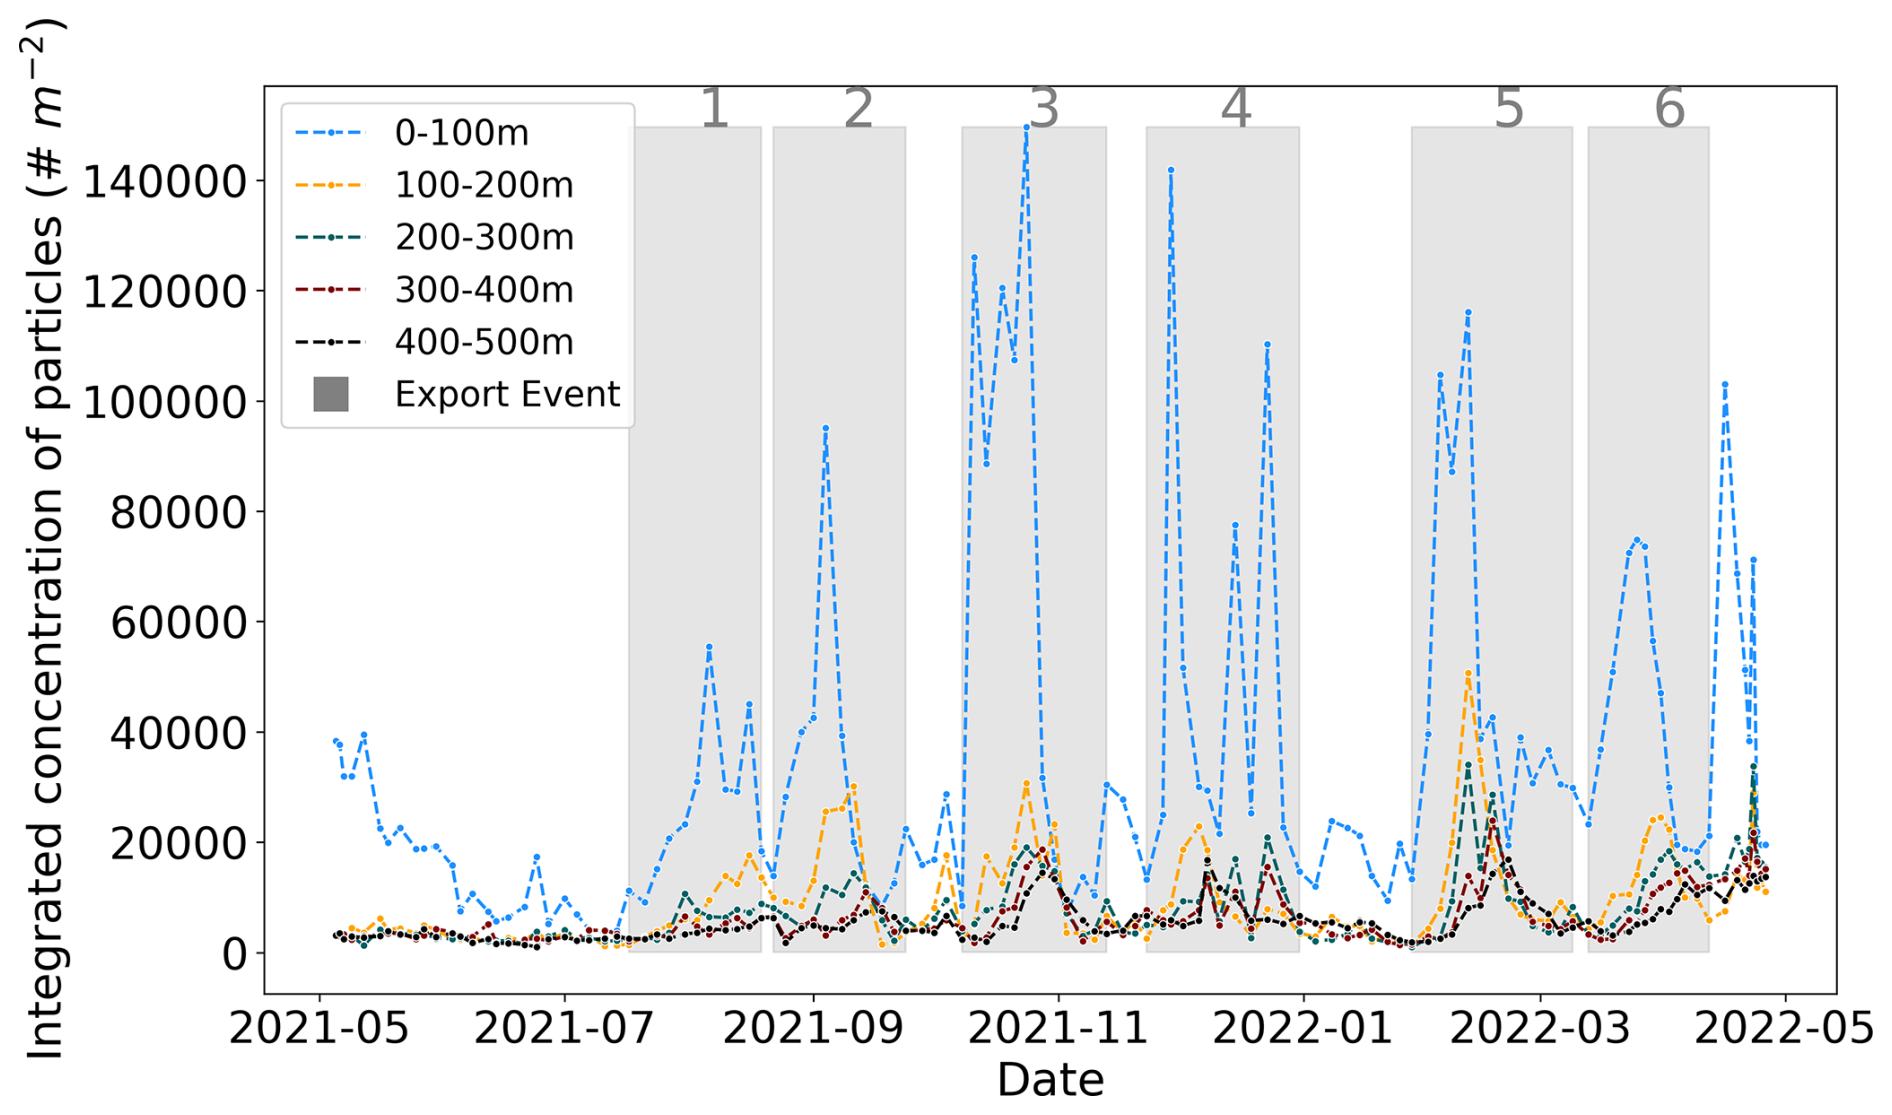
Figure 2Time series of vertically integrated marine snow (MaP; all particles > 600 µm) concentrations (number m−2) in five layers in the upper 1000 m depth. The six bloom periods shaded in gray correspond to six export events that are marked by delayed peaks in the mesopelagic. The periods are defined for the events in 2021 as 17 July–19 August, 22 August–24 September, 10 August–13 November, and 23 November–31 December and in 2022 as 28 January–9 March and 13 March–12 April.
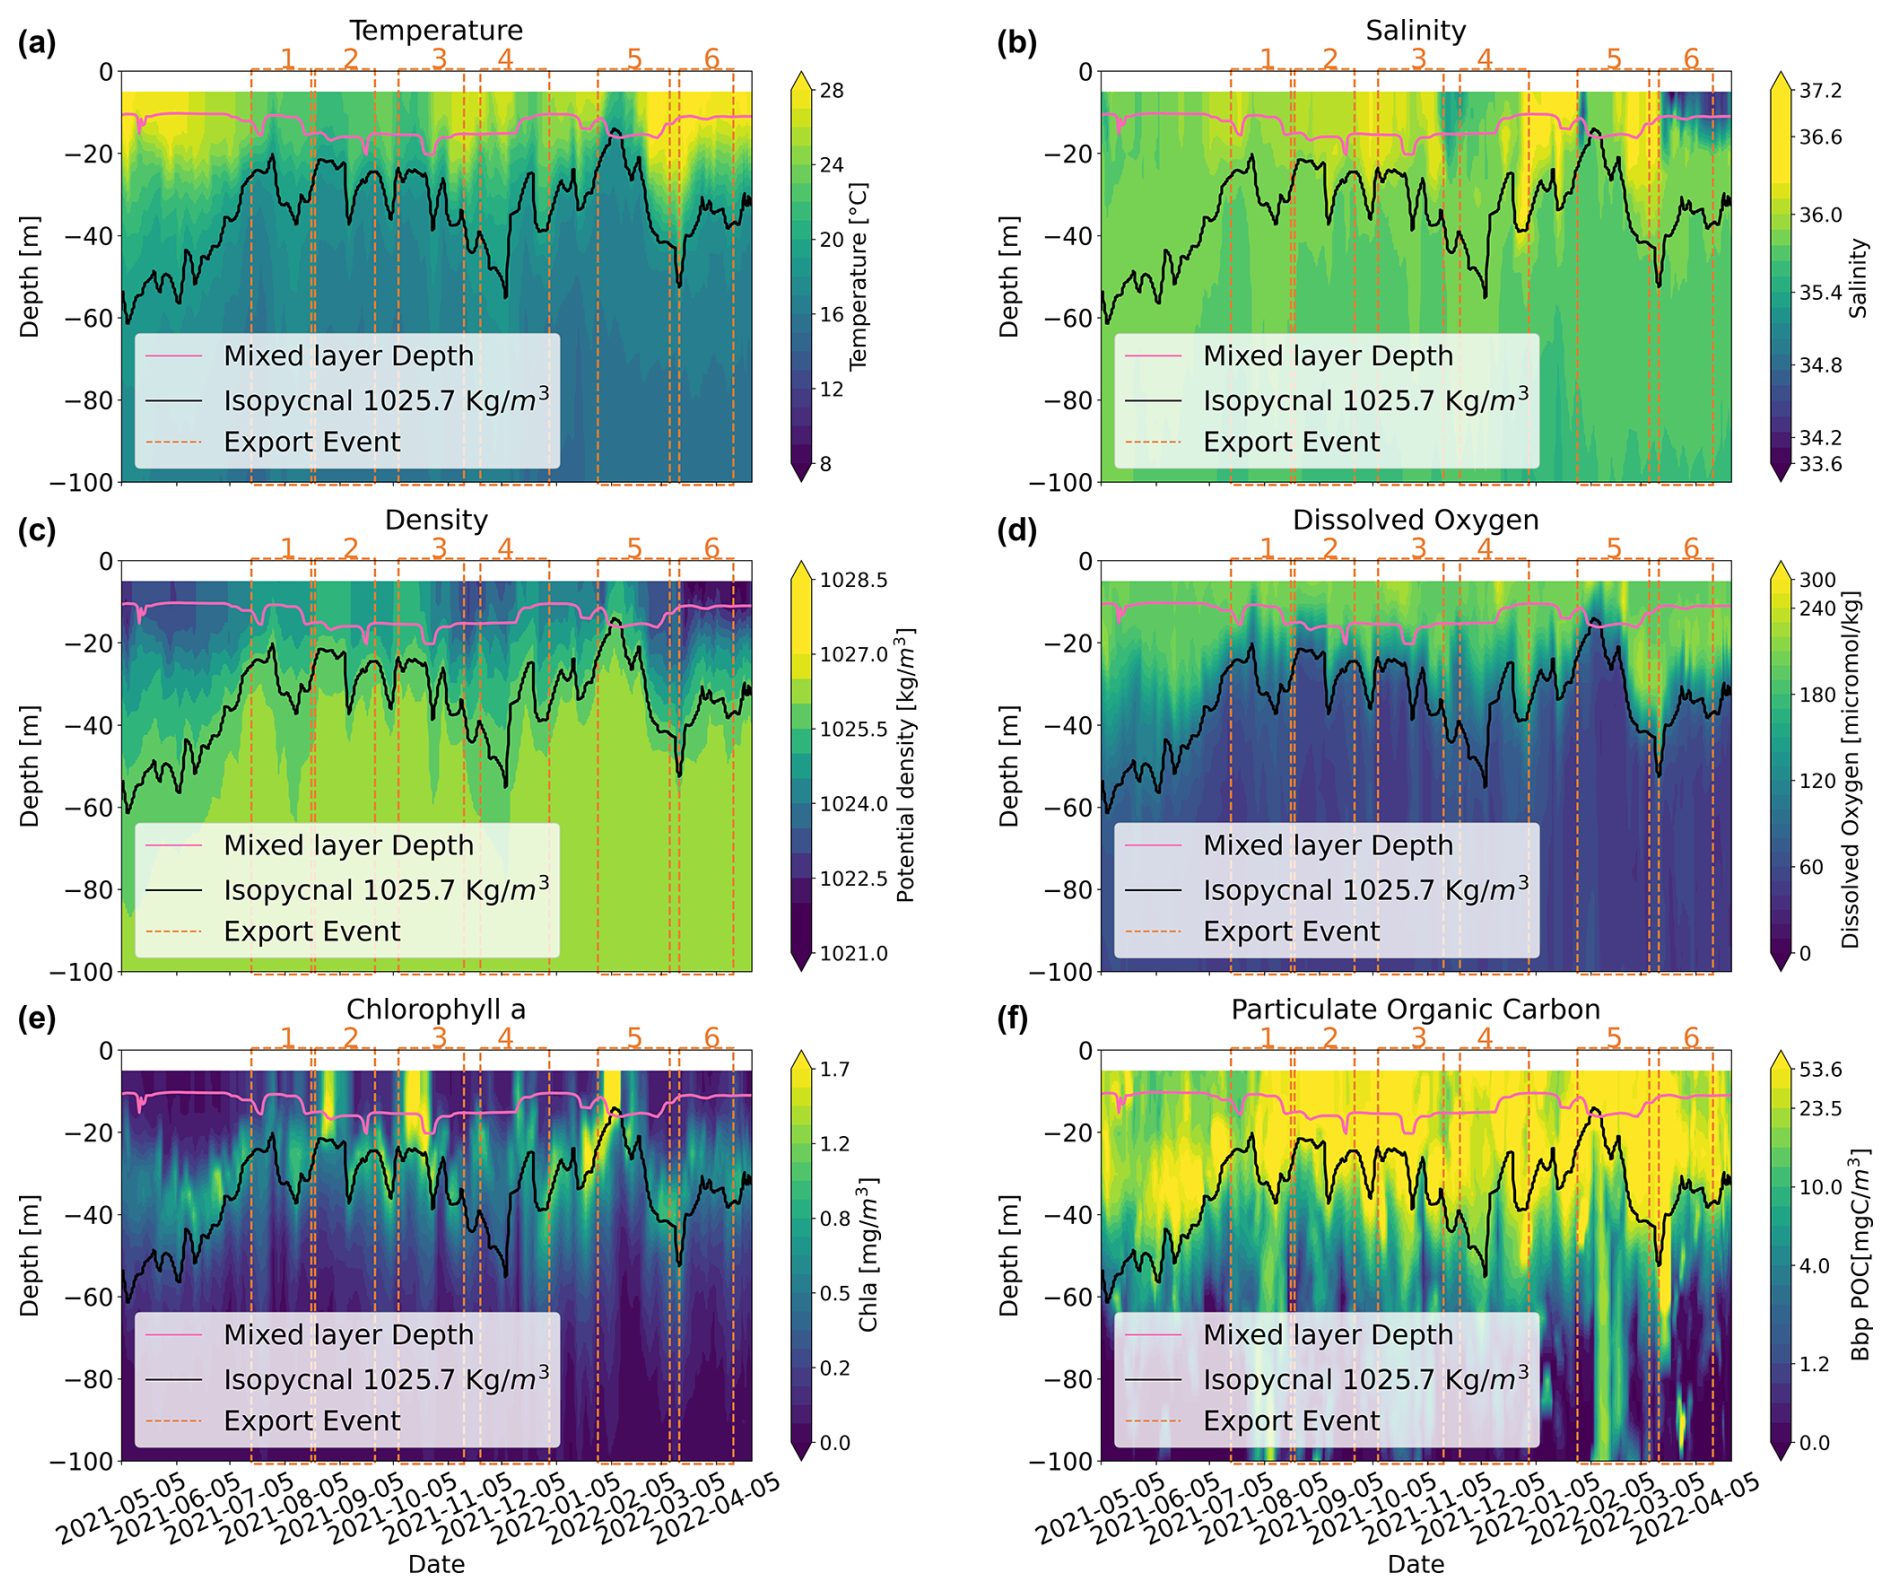
Figure 3The 0–100 m 2D time series of (a) temperature, (b) salinity, (c) density, (d) dissolved oxygen, (e) chlorophyll a concentration, and (f) Bbp POC. The black line depicts the 1025.7 kg m−3 isopycnal. The red line represents the mixed-layer depth.
3.1 Epipelagic time series of hydrological and biogeochemical properties
Sea surface temperature showed the lowest temperatures (21–23 °C) from July to September 2021, with the highest temperatures recorded in March and April 2021 (up to 28 °C) (Fig. 3). Sea surface salinity exhibited low values in November 2021 (< 35), with particularly low levels from March to April 2022 (< 34.2). Densities within the upper 30 m depth showed their lowest values from May to June, from mid-October to December 2022, and after February 2022. The 1025.7 kg m−3 isopycnal, used as an indicator of upwelling (Körner et al., 2024), was shallow (20–30 m) between July and October 2021 and from December 2021 to mid-February 2022. It reached its maximum depth in May–June, December 2021, and early March 2022. The highest Chl a concentrations were always found in the upper 30 m, with an important deep chlorophyll maximum (DCM) around 30–40 m depth. The DCM oscillated within this depth range following the increase in the 1025.7 kg m−3 isopycnal, displaying periods of intensification along with an upward movement towards the surface (notably in August 2021, October 2021, and February 2022, concomitantly to export periods 2, 3, and 5). From May to July 2021, the peak of small particles (or Bbp POC) followed the DCM; thereafter, until the end of the deployment (May 2022), it extended from the surface down to the 1025.7 kg m−3 isopycnal. During three periods of strong export (periods 1, 3, and 5), elevated Bbp POC (> 3 mgC m−3) was observed extending down to a depth of 100 m.
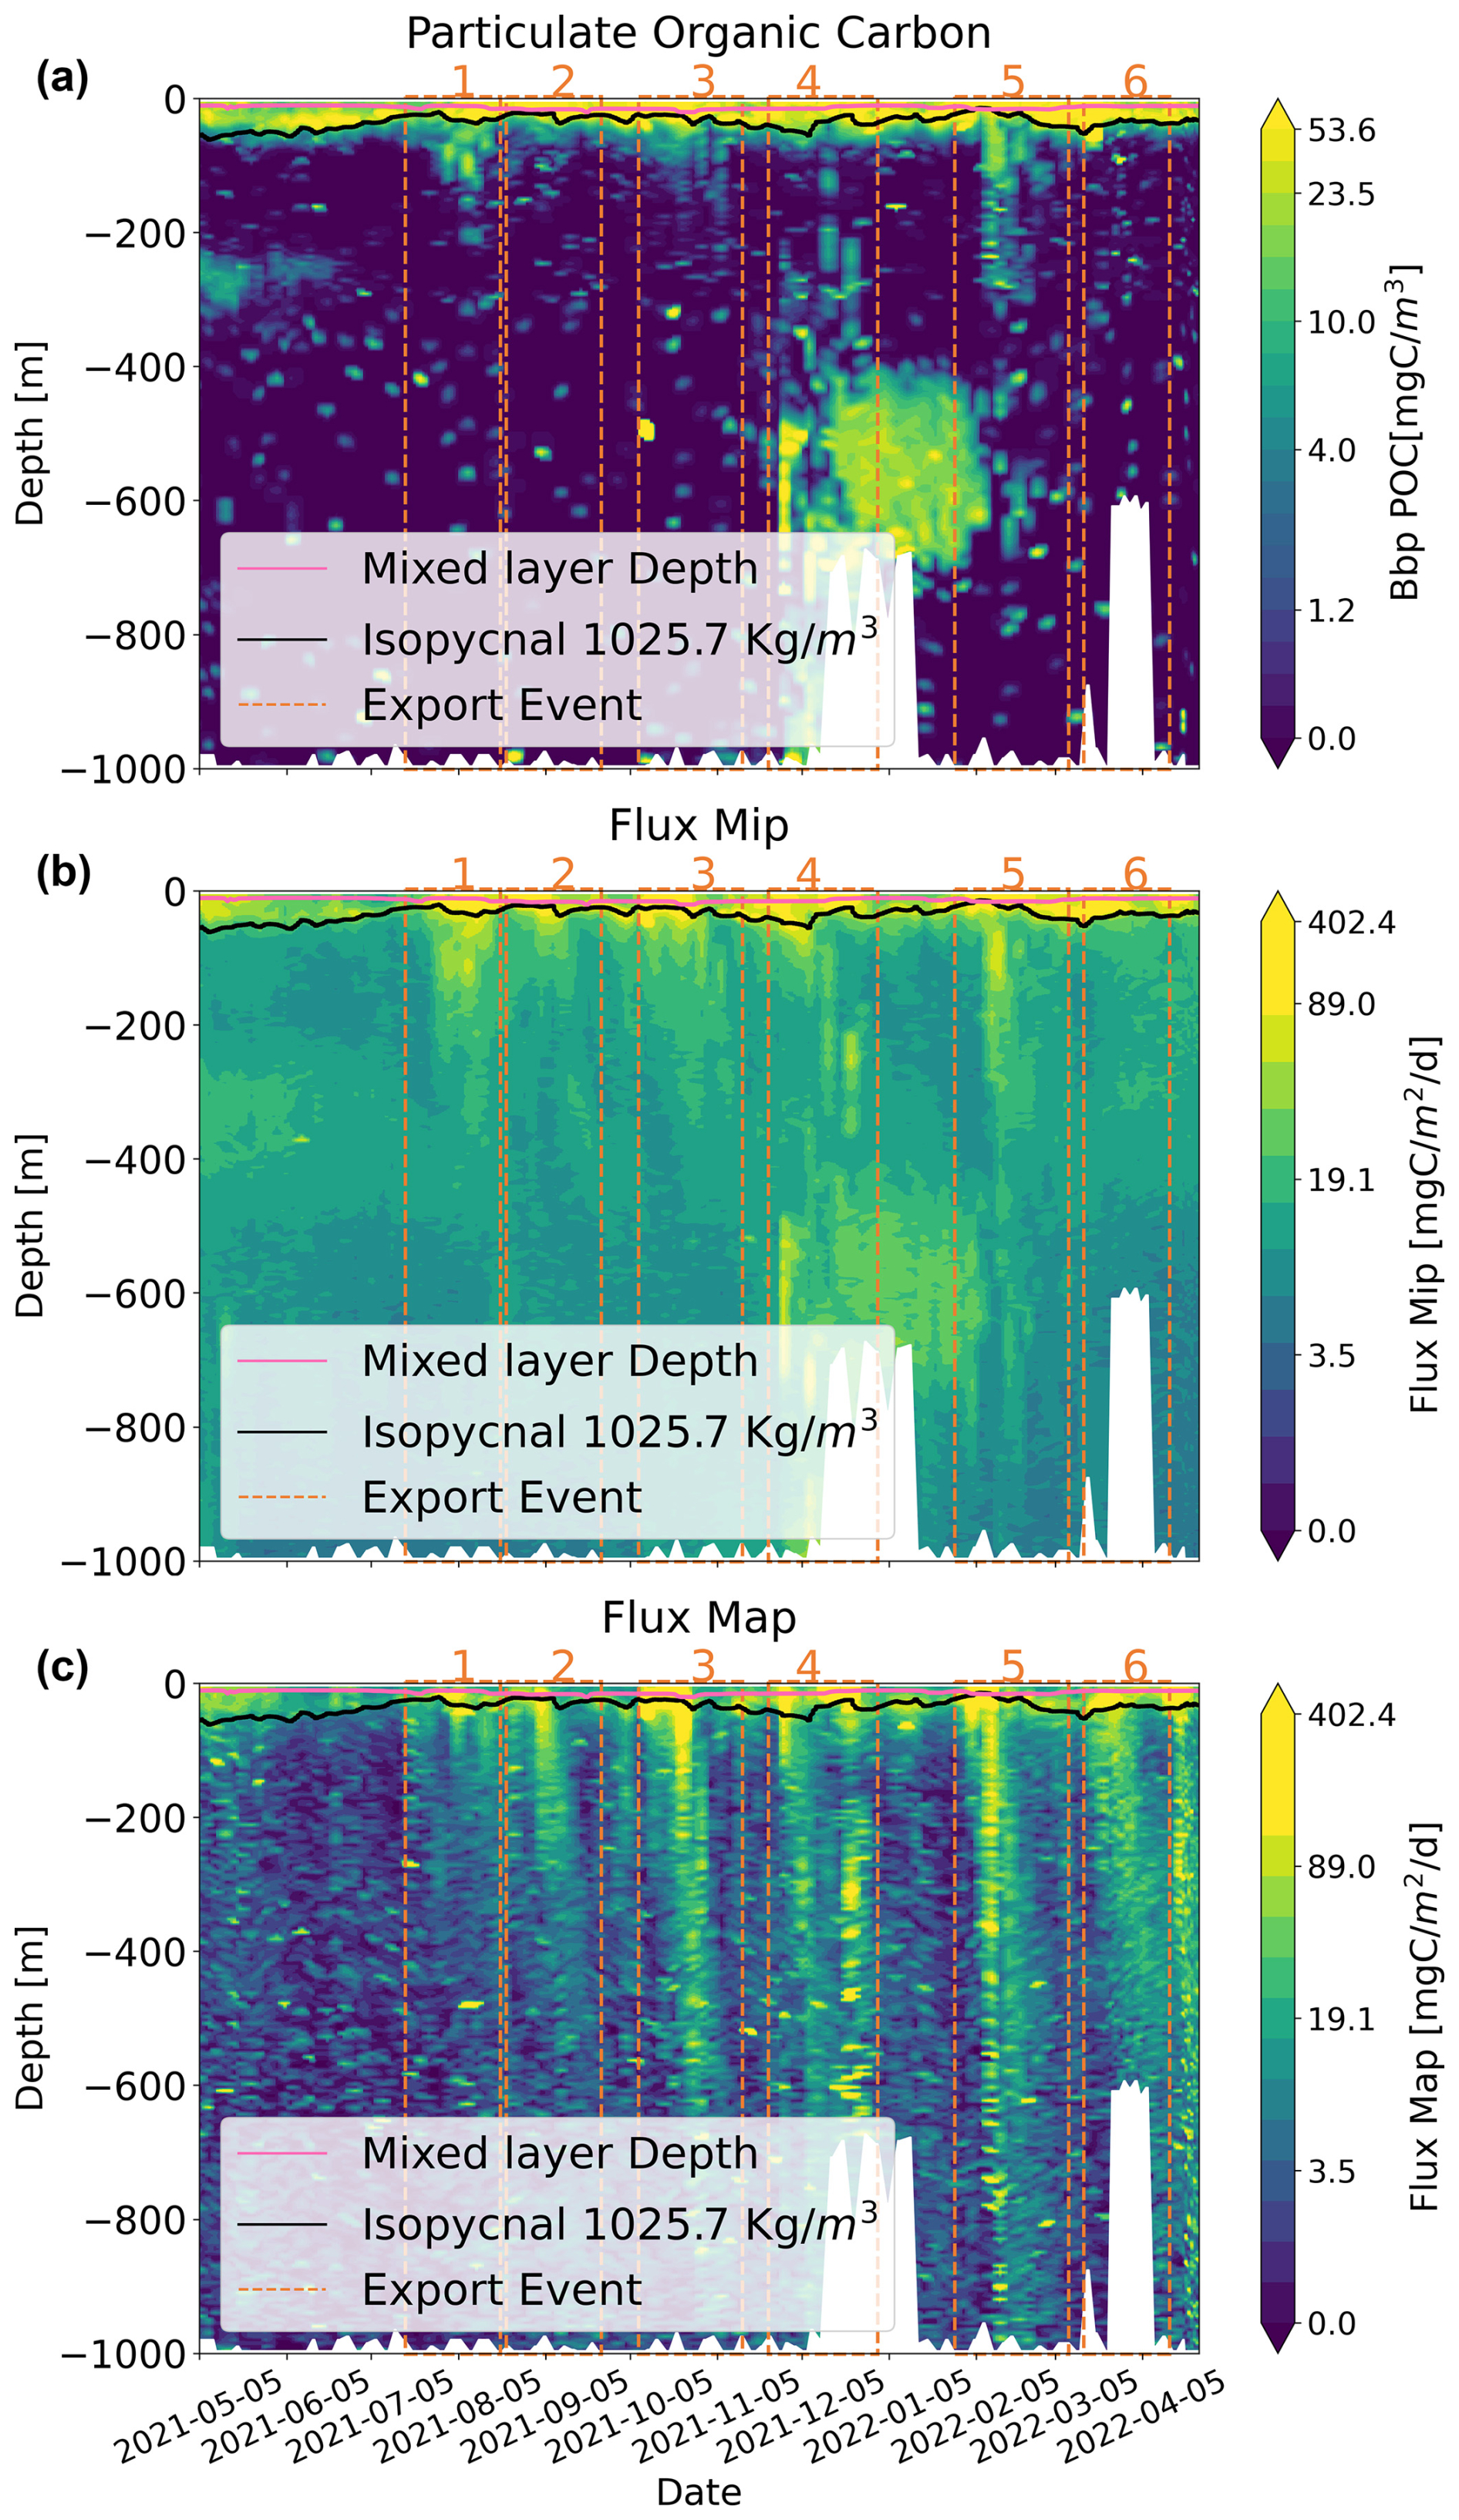
Figure 4Time–depth profiles determined from the BGC-Argo float for (a) Bbp POC, (b) the MiP flux, and (c) the MaP flux (at a logarithmic scale) as a function of time and depth, with the six export periods being illustrated by the vertical dashed red lines. The black line depicts the 1025.7 kg m−3 isopycnal. The maximum depth of the float corresponds to the bottom depth, marked by a white mask. The red line represents the mixed-layer depth.
3.2 Full-depth (0–1000 m) time series of Bbp POC, MiP, and MaP
Small particles detected by the Bbp sensor (a few micrometers) and the MiP flux detected by the UVP6 (0.1 < ESD < 0.5 mm) showed remarkably similar temporal patterns with different vertical extensions, notably during the export events. Throughout the deployment they showed the highest values in the upper 100 m depth (Fig. 4a–b). A distinct midwater peak was observed from May to June 2021 between 250 and 300 m depth for Bbp POC and from 300 to 400 m for MiP. Very high Bbp POC (> 20 mgC m−3) and MiP (> 20 mgC m−2 d−1) were observed from 400 to 600 m depth at the time when the float was in a shallow region in December 2021. Apart from this deep occurrence, the Bbp POC vertical extent reached 250 m at maximum during periods 1, 3, and 5. The MiP penetrated deeper into the water column down to 300 m depth during all export periods (although more in periods 1, 2, 3, and 5 during August 2021, October 2021, December 2021, and February 2022 respectively).
In contrast, large particles, as indicated by the MaP (> 500 µm) flux, showed a distinct spatio-temporal pattern, with the highest values occurring in the upper 100 m depth (100–400 mgC m−2 d−1), differently from the Bbp POC and MiP, which showed maximum concentrations in midwater layers. Following July 2021, the MaP flux exhibited six intermittent events (> 100 mgC m−2 d−1, Fig. 4c), during which export plumes showed oblique patterns extending from the surface down to the mesopelagic, particularly in August (period 1), September (period 2), October (period 3), and December (period 4) 2021 and February (period 5) and April (period 6) 2022. These occurrences, notably in October 2021 and February 2022, reached depths down to 1000 m, leading to a 2-fold increase in the computed flux during the export compared to the situation before and after.
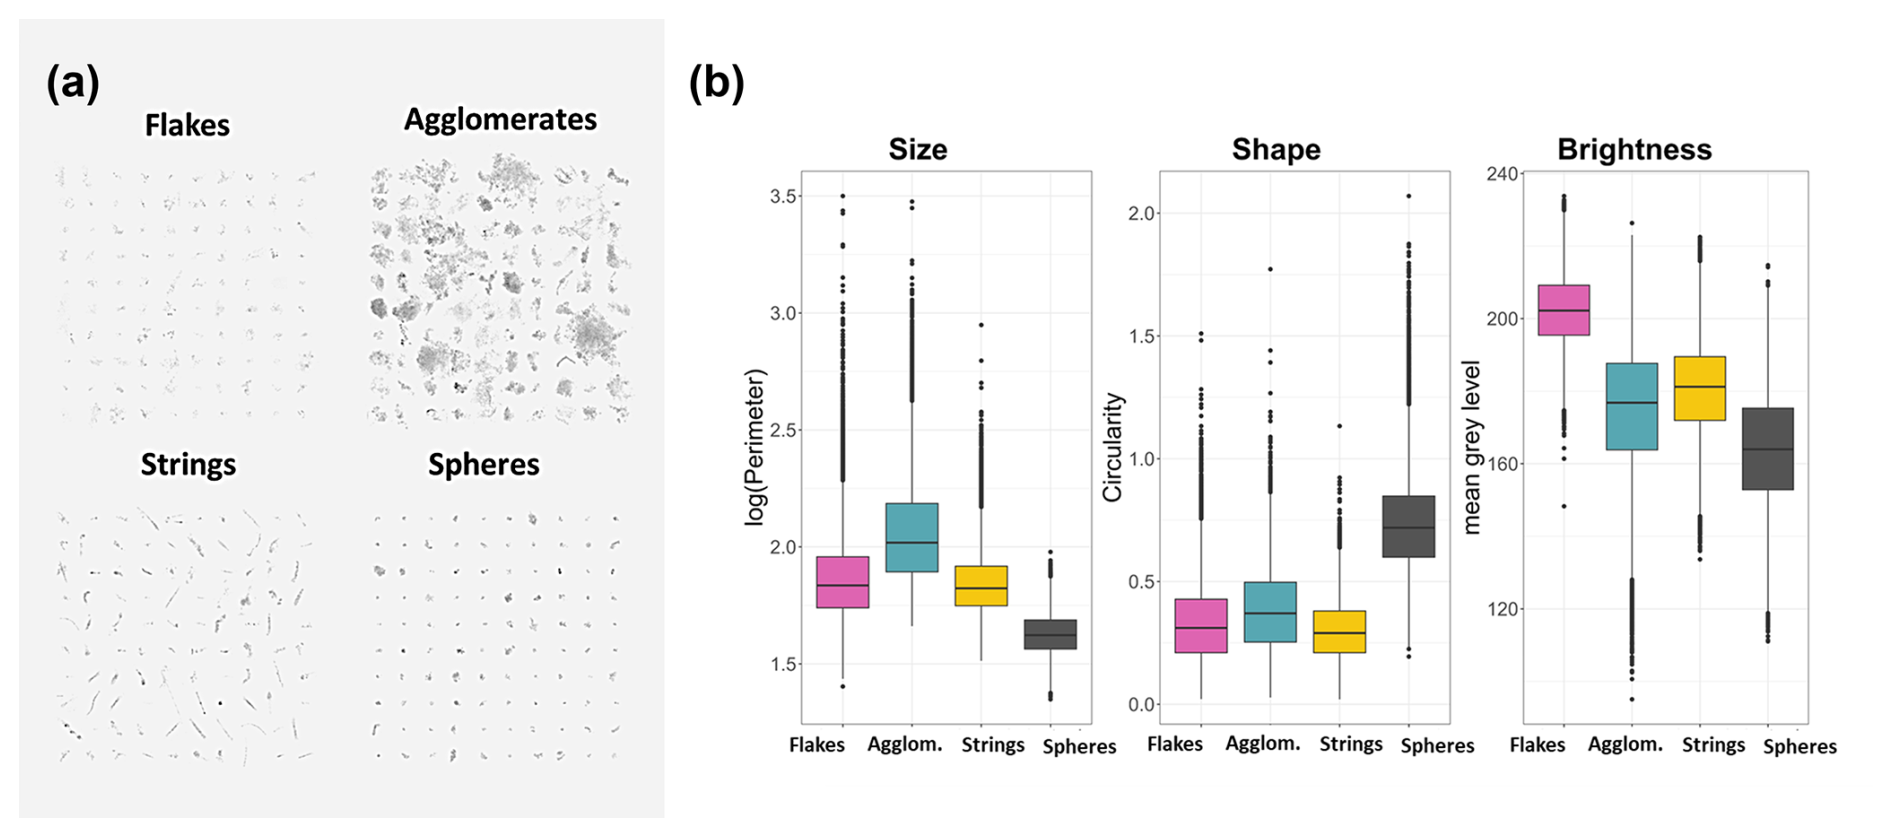
Figure 5(a) Example of the four defined morphotypes (flakes, agglomerates, strings. and spheres). We applied Microsoft Windows photo software changes to the illustration, with a contrast of −40 %, brightness of −8 %, and sharpness of 100 %. (b) Their mean morphological traits, describing the main aspects of size (via perimeter (µm)), shape (via circularity, dimensionless), and brightness (via mean gray level, dimensionless range from 0 (black) to 256 (white) pixels).
3.3 Image classification of marine snow > 600 µm into four morphotypes
To depict the nature of the sinking aggregates, we classified them by performing k-means clustering on the coordinates of particles along the four retained PCA axes. Within this continuous morphospace, we identified four morphotypes (shown in Fig. 5a), selected as a suitable compromise between contrasted groups and contextual knowledge, to explain their nature. Cluster 1 corresponds to medium-sized and bright aggregates named flakes (mean perimeter, 1.86 µm; mean circularity, 0.33; mean brightness, 202.46; Fig. 5). Cluster 2 contains large and dark particles named agglomerates (mean perimeter, 2.06 µm; mean circularity, 0.38; mean brightness, 174.91). Cluster 3 contains medium-sized and elongated aggregates named strings (mean perimeter, 1.84 µm; mean circularity, 0.30; mean brightness, 180.69). Cluster 4 is composed of small and circular aggregates named spheres (mean perimeter, 1.63 µm; mean circularity, 0.73; mean brightness, 163.87). More results on marine snow classification and the sensitivity of aggregate classification to the method is provided in the Supplement.
3.4 Spatio-temporal distribution of marine snow morphotypes (> 600 µm)
The different marine snow types showed concentrations of similar magnitudes varying from 0 to 20 000 particles m−3. Surface concentrations were 2- to 3-fold higher than in the mesopelagic. From May to July 2021, all particle types showed reduced concentrations (in particular in the mesopelagic) compared to the rest of the period, which showed an intermittent pattern (Fig. 6). The different particle types shared similar overall spatio-temporal dynamics, mainly at the surface, but also exhibited distinct features in the deep layers. At the surface layer and the upper mesopelagic (200–400 m), they all showed concomitant peaks during the bloom periods. In the deeper mesopelagic, only agglomerates and spheres showed an increase, with a time delay increasing with depth.
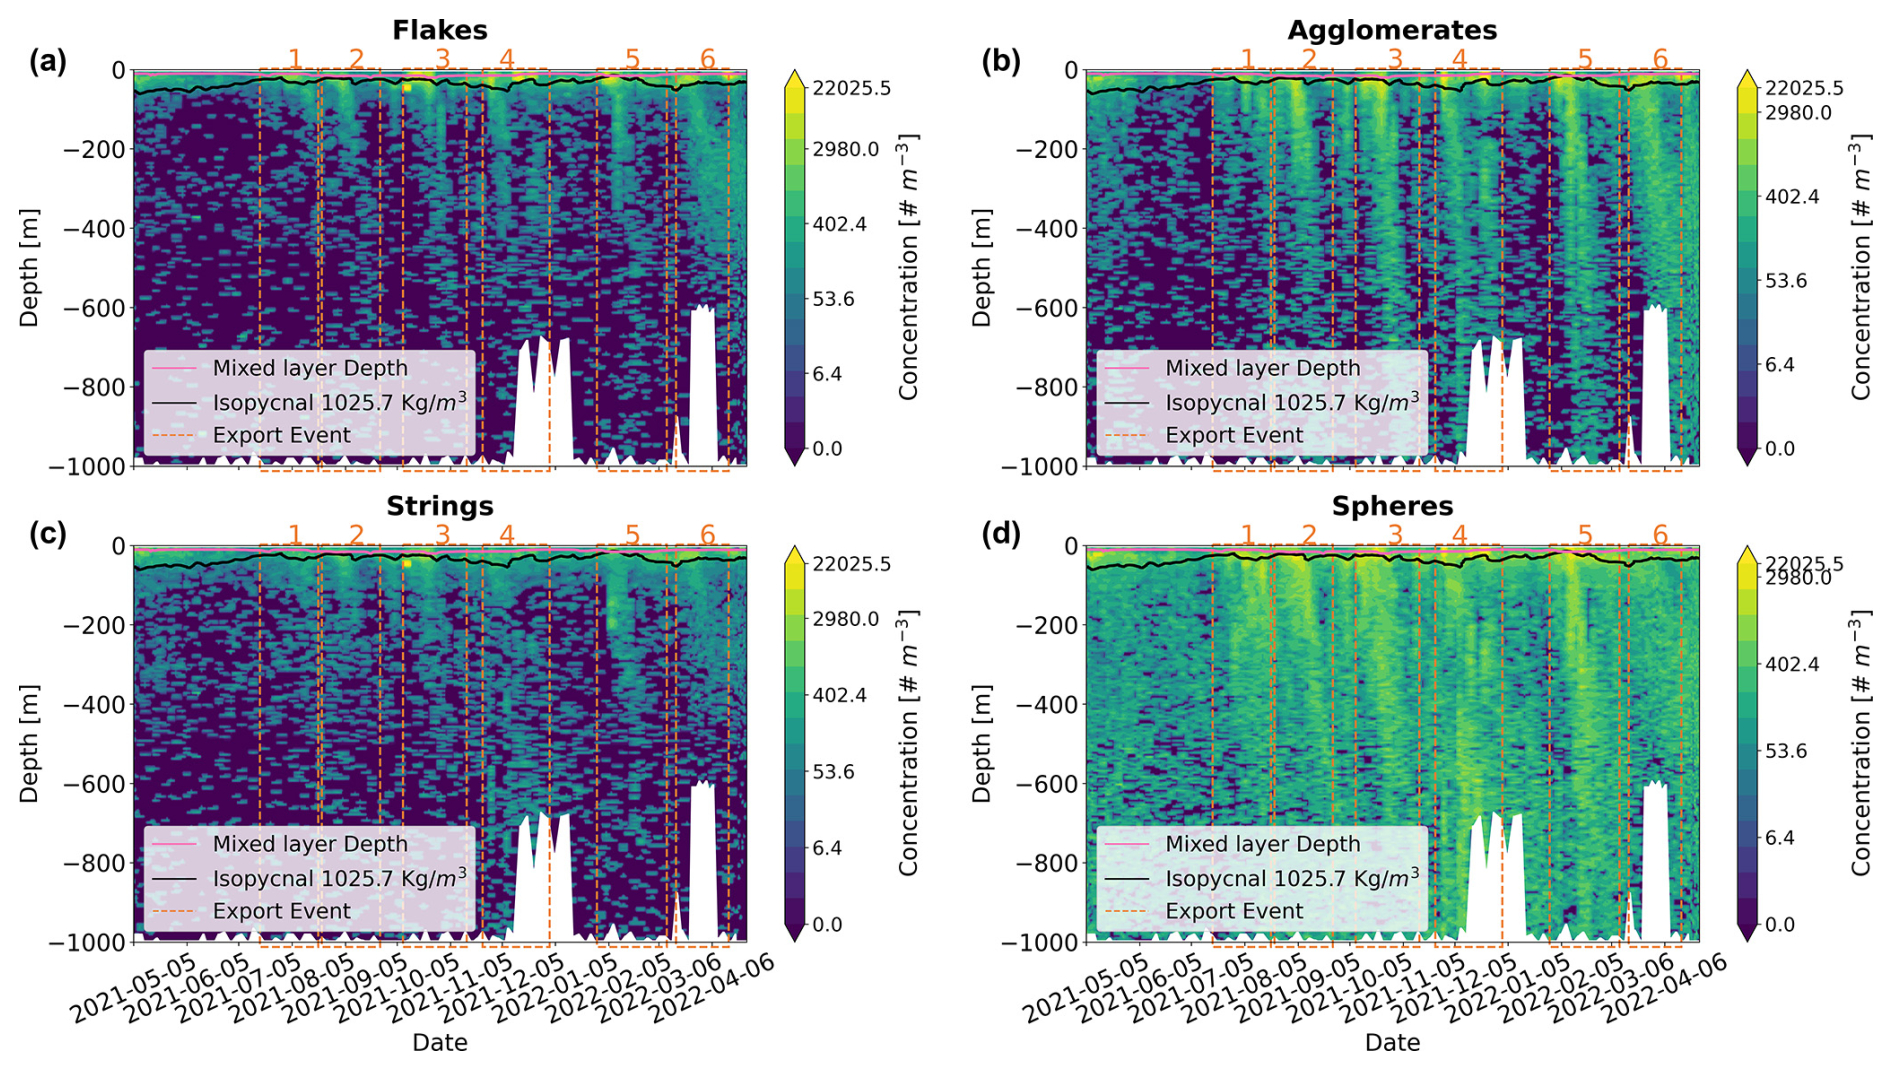
Figure 6Contour plot of the four marine snow types – (a) flakes, (b) agglomerates, (c) strings, and (d) spheres – as a function of time and depth. The six export events are depicted by the vertical dashed red lines. The black line depicts the 1025.7 kg m−3 isopycnal. The maximum depth of the float corresponds to the bottom depth, marked by a white mask.
3.5 Spatio-temporal dynamics of marine snow assemblage
As illustrated in the RDA composite spaces, marine snow assemblages in the surface layer varied with seasons and also between the surface and mesopelagic layer (Fig. 7). In the surface layer, contributions to axis 1 reveal the opposite dynamics between spheres and strings compared to those between flakes and agglomerates. Strings dominate from May to July (before export event 1), spheres from May to October (from export event 1 to export event 3), and agglomerates after February (after export event 5). The first two export events had consistent and homogeneous assemblages dominated by spheres. Subsequent export periods (3, 4, and 5) exhibited varying assemblages, mainly dominated by strings and spheres. The last period (after February), which includes export event 6, differed greatly in the assemblage, with a dominance of agglomerates. When comparing periods before and during an export event in the surface layer, the assemblage did not change, except during the first event. In the deeper layer, the evolution of assemblage composition was consistent with that at the surface but more contrasted, with less balanced assemblages, as indicated by the higher contribution of the first axis (86.9 %) compared to the surface (51.6 %) (Fig. 7). In the mesopelagic, contributions to this axis reveal the opposite dynamics between spheres compared to those between flakes and agglomerates. Apart from export event 6, all export events were dominated by spheres. A more pronounced difference between export events 2 (higher proportion of strings) and 3 (higher proportions of agglomerates and spheres), relative to the surface evolution, is also notable. A dominance of flakes was not observed.
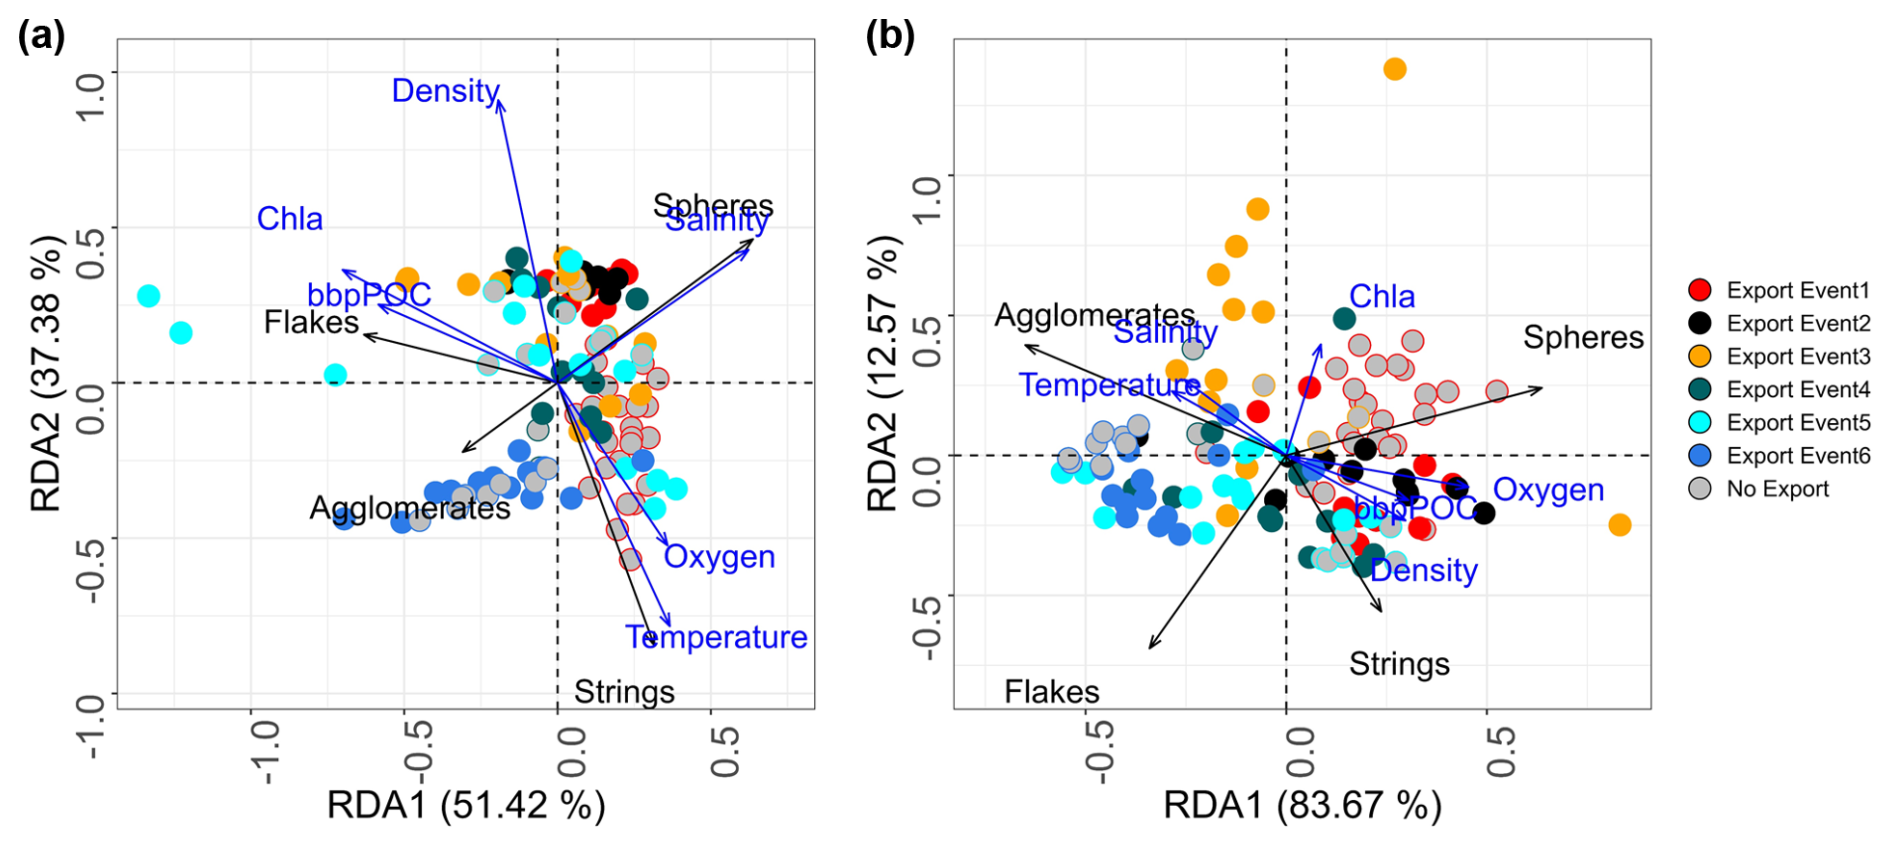
Figure 7RDA of marine snow assemblages at each station (dots) between (a) 0–100 m and (b) 400–500 m depth, identifying the six periods of export with different colors. Stations observed prior (in gray) to the export event are encircled according to the color of the event. The black arrows show the dominant type of marine snow, while the blue arrows show the correlation with environmental variables.
3.6 Sinking speed and vertical attenuation of the plume
Sinking speeds, inferred from the lagged correlation between surface and mesopelagic (400–500 m) particle time series, for all types of particles (MiP, MaP, morphotypes 1 to 4) were 30 m d−1 (Supplement Table S2). By separating the six events, and with more size-related classification, more details can be obtained to break apart this constant estimate. However, sinking speeds and attenuation in a plume can only be determined for a given size range if the abundance variability in the time series is consistent. This was not the case for each size class and category among the 60 possible cases (6 plumes × 10 size ranges from 100 µm to 5 mm). Sinking speeds could be estimated 6 times for flakes, 19 times for agglomerates, 5 times for strings, and 12 times for spheres. When averaging the results from the six export events, a unique size-based relationship is not visible for the different morphotypes (Fig. 8a), but agglomerates and spheres showed the highest sinking speeds. Within the size range for which sinking estimates were possible for all morphotypes (ESD from 1.02–1.29 mm), spheres (46 ± 24 m d−1) and agglomerates (35 ± 9 m d−1) also showed higher sinking speeds compared to flakes (16.29 ± 4 m d−1) and strings (18.33 ± 6 m d−1) (Table S3). When considering the abundance of all particles > 100 µm (MiP+MaP), sinking speed estimates could be performed in 16 cases (mostly for particles larger than 500 µm). Sinking speed increased with size from a minimum of 10 m d−1 to a maximum of 150 m d−1. It is noticeable that sinking speed estimation for the largest size classes (> 1.02 mm) was not possible when considering all particles, but it was possible for agglomerates.
The strength of particle abundance attenuation in the plume increased on average with particle size and showed a remarkable difference between the different morphological types. Spheres had the lowest attenuation, while flakes and strings had the strongest. For spheres, the attenuation decreased as a function of size. For size class 3 (1.02–1.29 mm), spheres (0.27 ± 0.23) and agglomerates (0.88 ± 0.3) had the lowest attenuation compared to flakes (1.86 ± 0.21) and strings (1.76 ± 0.1) (see Table S3). Apart from spheres, for which attenuation decreased significantly with size, no relationship between attenuation and size was found. Extending the size range by pooling all particles does not evidence an allometric relationship.
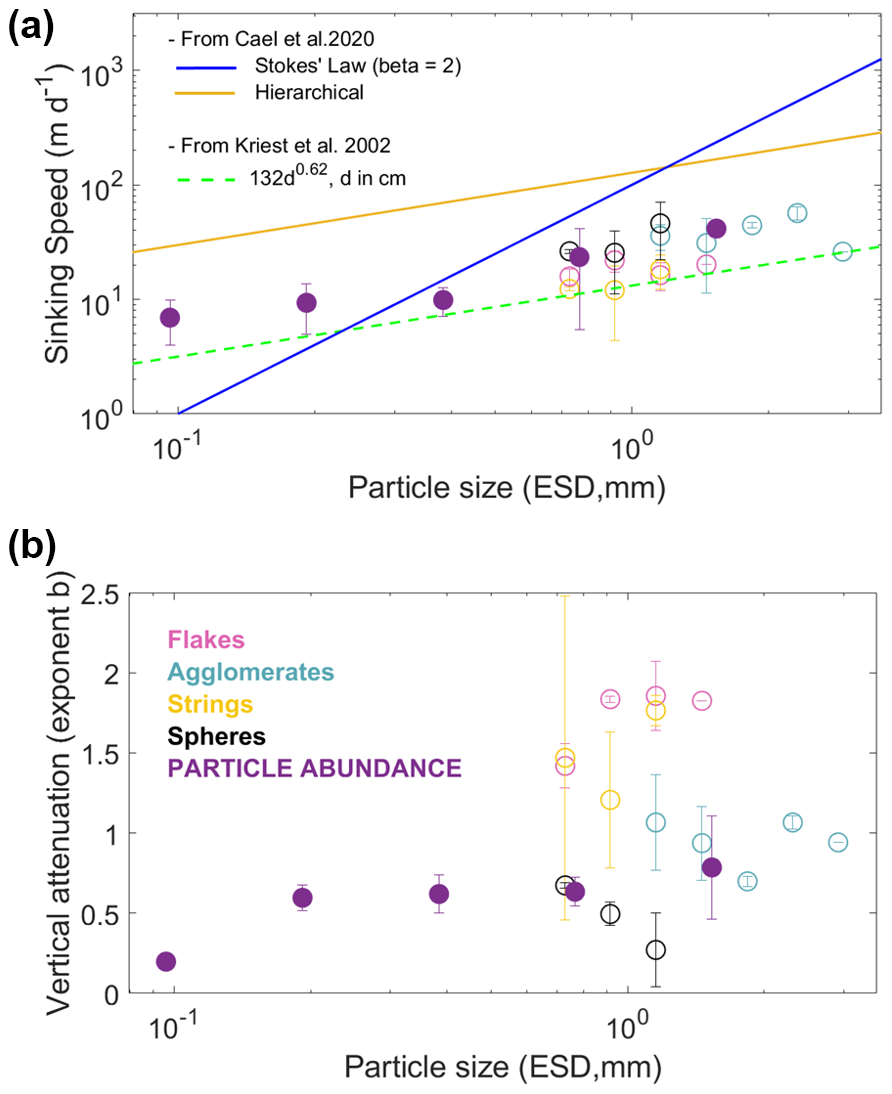
Figure 8Sinking speed versus size (a) and attenuation exponent b versus size (b) for different types of particles averaged for the six different export events. The solid blue line is Stokes' law relationship, valid for spherical smooth particles with a constant excess density with increasing size, and the orange line is the hierarchical regression on the data compilation in Cael et al. (2021). The dashed green line represents the model parameterizations of the size–sinking relationship by Kriest (2002).
4.1 Hydrological context and ocean circulation during the drift
The observed hydrographic characteristics are in general agreement with the seasonal variability of the region. Sea surface temperature, primarily driven by surface heat fluxes, showed the lowest values from July to September and the highest values in March and April (Körner et al., 2023; Scannell and McPhaden, 2018). Sea surface salinity, as measured by the float, was the lowest in November and from March to April. The timing of freshening is in agreement with the seasonal advection of low-salinity waters with the southward-flowing Angola Current (Awo et al., 2022; Kopte et al., 2017). While sea surface temperature shows a dominant annual cycle, upwelling and downwelling near the continental slope are characterized by both an annual and a semiannual cycle. Consistent with previous studies, the main upwelling season happens during the cold period from July to September, while the secondary upwelling season occurs during January to February (Körner et al., 2024). During these periods, float data indicate denser water with minimum oxygen concentrations close to the surface. As there is, in general, good anti-correlation between oxygen and nitrate (Körner et al., 2024), it is possible that during upwelling periods, low-oxygen and high-nitrate water enters into the euphotic zone, fueling the six observed production and export events identified in the float data. Periods 1 and 2 are within the main upwelling season, and period 5 is during the secondary upwelling season. While period 3 might be during the transition from upwelling to downwelling, periods 4 and 6 are clearly during the secondary and main downwelling seasons respectively. Note that between April and August 2021, an extremely warm event was present in the Angola Basin, which was associated with record-low productivity between June and August, partly covering the main upwelling season (Imbol Koungue et al., 2024).
During the deployment, the float drifted slowly, with an average distance between surfacing of 16 km in 3 d. The highest drift (40 km in 3 d) was observed during periods 3 and 5. ADT shows weak horizontal variability, suggesting that the eddy field is present but with low intensity (Fig. 4 in the Supplement). FTLE values generally less than 0.1 d−1 indicate weak eddy activity, as generally reported in the region (Aguedjou et al., 2019). The negative correlation between all types of particles and FTLE indicates that the bloom events followed by particle accumulation were more intense at low horizontal mixing. The intermittent exports are associated with bloom events that are connected to coastal blooms during periods 4, 5, and – to a lesser extent – 6. In order to identify the marine snow export plumes (and thus calculate the sinking speeds and vertical attenuation), we hypothesized that the water parcel encompassing each plume did not change considerably while the float profiled them. While this Lagrangian assumption cannot be demonstrated with the available data set, different supplementary analyses suggest (Fig. S5, Table S2) that this approximation seems reasonable. The hydrological properties of the mesopelagic, as well as the oxygen concentrations, showed a weak variability during the study period. Low turbulence was observed in the region, as shown by relatively low FTLE values and by the fact that the float did not get trapped in any mesoscale eddy. In addition, previous studies have shown a weak-vertical-shear environment in this region (Kopte et al., 2017). The delayed occurrence of large-particle peaks with depth supports this 1D hypothesis, as seen in previous studies (Briggs et al., 2020; Lacour et al., 2024; Stemmann et al., 2002; Trudnowska et al., 2021), which is not observed in the case of strong mesoscale activities (Accardo et al., 2025). A typical mesopelagic nepheloid layer (visible on Bbp POC and MiP), presumably extending from the seafloor, was observed as the float was drifting along the 700 m depth bathymetry. This feature was also observed in the MiP but not in the larger particles (Figs. 4c and 5). Such a size-differentiated distribution across continental shelves has already been observed elsewhere with combined optical and imaging methods (Durrieu de Madron et al., 1990, 2017). This observation suggests that the nepheloid layers did not contain any large aggregates and therefore did not interfere with our sinking estimates for the large fractions (MaP and the four morphotypes) but may have for the MiP.
4.2 Dynamics of the six marine snow events
The four marine snow morphotypes were correlated to in situ or remotely sensed Chl a, suggesting that most of the marine snow was of phytoplanktonic origin (Supplement Fig. S5). Additional material (i.e., phytoplankton in bottles and zooplankton in nets), as available in a previous study (Trudnowska et al., 2021), is needed to unambiguously attribute a morphotype to a specific phytoplankton or zooplankton community. However, correlation with environmental variables and the shape of particles suggest possible sources of the four types of marine snow. Typical dense fecal pellets, compared to loose marine snow, were not detected by the unsupervised classification, but they were probably mostly contained in spheres, which contained the most opaque and small particles. Given the observed lower 0–100 m integrated concentration of zooplankton organisms (observed range 103–104 ind. m−2) compared to that of marine snow (observed range 103–20 104 ind. m−2), as has generally been found in other studies (Checkley et al., 2008; Forest et al., 2012; Gonzalez-Quiros and Checkley, 2006; Stemmann and Boss, 2012; Trudnowska et al., 2021), it is possible that the contribution of fecal pellets to the total detritus was low. A lower abundance of pellets relative to marine snow was also observed in sediment traps (Durkin et al., 2021), and episodic export of phytodetritus to the deep layer is a common feature at many sites (Turner, 2015). The other three categories are probably mostly phytodetritus. It is likely that the cluster strings (also named filaments) contained living phytoplankton colonies as they were mostly abundant in the surface water at the time when Trichodesmium colonies were detected before the first export event (Supplement Fig. S4). While we acknowledge that the classification into four morphotypes may not represent all existing morphological variability, it seems appropriate for our case study. Four to five categories were also useful in other studies (Accardo et al., 2025; Trudnowska et al., 2021). Using four instead of five categories increased the concentration within each category, yielding more confidence in estimations of the dynamics of marine snow assemblages, their sinking speeds, and their attenuation while still differentiating the main morphological features of particles. In the future, a global compilation of such images together with other phytoplankton and zooplankton variables will allow for the refinement of the number of existing morphotypes.
According to the float and satellite observations, the blooms seem to be triggered by different dynamics. Blooms 1, 2, and 3 seem to be associated with typical open ocean upwelling events, as suggested by decreased temperature and oxygen associated with higher Chl a and Bbp POC. Conversely, the other three events (particularly 4 and 6) were associated with less salty water. Low salinity is possibly an indicator of coastal input from particle-enriched water stemming as far as the Congo River (Brandt et al., 2023). The float was closest to the coast and drifted along it (along the 700 m depth isobath) during period 4. During periods 5 and 6, the float drifted offshore, and surface Chl a showed filaments extending from the coast (Fig. S2), corroborating the hypothesis of coastal inputs. The bloom in period 5 was probably associated with more nutrients, as suggested by the increase in the 1025.7 kg m−3 isopycnal. The sequence of events leading to marine snow accumulation for periods 4 and 6 is less clear, as the 1025.7 kg m−3 isopycnal was deep and Chl a biomass was not as high. However, overall significant correlations between temperature, oxygen, density, and all biogeochemical variables (Chl a, suspended Bbp POC particles, MiP, MaP, and all zooplankton taxa; Supplement Fig. S5) suggest that upwelled water triggered an increase in planktonic production.
Apart from the first export event, the different marine snow morphotypes did not change in their relative contribution before and during the export events. The main changes in marine snow assemblages were associated with depth during all events and at all times (the last event being dominated by agglomerates). The increase with depth in the proportion of spheres is related to a clear reduction in filaments and flakes, as previously observed in other systems (Accardo et al., 2025; Trudnowska et al., 2021). These changes suggest that flakes and filaments are less efficiently exported than dense particles, even if they are larger in size. Although there were differences between export events in their intensity, the general pattern of marine snow community composition, sinking, and attenuation during the first five events was the same (Supplement Figs. S6 and S7). Such consistency suggests their production by phytoplankton with a constant community composition, unlike the Arctic bloom, which showed a succession in primary producer types and marine snow morphotypes (Trudnowska et al., 2021). Contrasting with the first five export events, the last export event showed an increased contribution of agglomerates, possibly due to the coastal origin from the Congo River, due to the most northern location with a different phytoplankton community composition, or because aggregation mechanisms may have been different during this event (Supplement Fig. S3). The surface change in the community composition was mirrored in the mesopelagic layer, probably resulting from sedimentation. However, neither sinking speeds nor attenuation was different from those of the other events.
4.3 Sinking speed and vertical attenuation of different marine snow categories
Our sinking speed estimates for 500 µm–1 mm size range particles (10–50 m d−1) are in the same range as the few other estimates obtained with time series of export plumes (Briggs et al., 2020; Lacour et al., 2024; Stemmann et al., 2002; Trudnowska et al., 2021) and with in situ devices (Diercks and Asper, 1997; Iversen and Lampitt, 2020; Jouandet et al., 2011; Nowald et al., 2009). However, we calculate slower sinking speeds relative to other ex situ estimates compiled in previous syntheses, as illustrated by the difference between our estimates and the hierarchical regression in the data compilation of Cael et al. (2021) (Fig. 8). Our sinking estimates are in good agreement with the previous model (Kriest, 2002), which was developed for miscellaneous aggregates. Thus, our results confirm that sinking speeds of natural assemblages of marine snow differ from ex situ estimates, suggesting that the composition of the particles used in the experiments is biased toward quickly sinking particles (Williams and Giering, 2022).
Not surprisingly, dense (darker appearances, implying denser and more compact structures) marine snow particles (> 500 µm) have faster sinking speeds than more porous particles, a property measured and modeled from experimental works (Giering et al., 2020) but never reported for in situ measurement in export plumes. The sinking-to-size positive relationship was less obvious for a given aggregate morphotype because of its limited size range. The full size range was covered only for flakes, whose sinking speed remained constant with size. However, strings and spheres had increasing sinking speeds with size. Taken together, these two results confirm that the sinking-speed-to-size relationship may exist for certain types of particles but is not universal (Iversen and Lampitt, 2020; Williams and Giering, 2022) as other morphological factors (here density) are at play. Among the different factors (phyto- and zooplankton community composition, inorganic ballasting) leading to denser particles (Francois et al., 2002; Guidi et al., 2016; Trudnowska et al., 2021; Turner, 2015), our study indicates phytoplankton aggregates to be principally responsible for the observed stronger export. Extending the size range to 100 µm and pooling all particles together confirm the size-to-sinking relationship but with strong variability between export plumes for the small particles and a limited size range up to the size class of 1.0–1.63 mm. For the larger size range, sinking can only be estimated after classification because non-sinking aggregates (flakes and fibers) are dominant at the surface, blurring the time series of all particles.
Carbon fluxes and their vertical attenuation for the different morphotypes were not calculated because the four categories did not match the limited available size-to-POC conversion factors (Alldredge, 1998; Durkin et al., 2021). Instead, export efficiency was addressed from the vertical attenuation of the concentration of the four different categories in the plume. Abundance attenuation for the four morphotypes in the plume did not increase on average with particle size and showed that attenuation varied more with morphotypes than with size. For a given size class (1.02–1.29 mm), dense morphotypes (agglomerates and spheres) had the lowest attenuation, suggesting more efficient transfer to the deep ocean. The exponent cannot be directly compared to the literature because of the units but also because previous flux attenuation exponents were calculated in a vertical frame, in which depth layers are temporarily disconnected (i.e., at the time of sampling, the surface layer is decoupled from the deep layers), while here we consider the number of particles in the sinking plume as they are consumed by different mesopelagic processes (Giering et al., 2014; Stemmann et al., 2004). We believe that following export plumes provides a more accurate estimation of the attenuation than calculating them from vertical profiles, as is commonly done.
Apart from events 4 and 5, we believe that particle spatial gradients in the mesopelagic were low and that the large variability in the sinking speed estimates arose from other methodological factors that are important to discuss to improve further studies. First, the quality of the sinking estimates depends on the abundance of particles in situ. Compared to conditions with massive seasonal blooms over a long period of several months (Lacour et al., 2024), the production and export events in the Angola Basin were less than 1.5 months, with on average 10 times lower concentrations. Both factors yielded a patchy spatial distribution that was smoothed by using a depth bin of 100 m instead of varying depth bins (20 to 200 m) (Lacour et al., 2024). This high variability was amplified as large particles were subdivided into four morphotypes. Second, the deployment in the Angola Basin took place close to coastal upwelling systems. Offshore-propagating filaments may have had effects on particle vertical distribution, mainly influencing small particles (here Bbp POC and MiP). Third, the clustering method is not sufficiently selective to obtain homogeneous groups among the aggregates as the overlaps can be seen on the PCA space (Supplement Fig. S1). This non-perfect classification has the effect of smoothing the derived estimates of sinking speed and attenuation.
We describe seven bloom events leading to surface accumulation of marine snow based on data obtained from a UVP6 camera mounted on a BGC-Argo float and recovered after 1 year of deployment. Six of them led to an export event with different types of aggregates and different penetration depths. For the first time, two core parameters for carbon sequestration, sinking speeds and vertical attenuation, were calculated in situ for different sizes and morphotypes. Not all detected marine snow aggregates are sinking aggregates, despite them being larger than 1 mm. Within a given size range, we show that sinking speeds of porous marine snow are slower than those of dense marine snow, indicating the strong impact of density on sinking speed. However, we show that size is still an important property for determining the sinking speed when considering a larger size range or a specific type of marine snow. Compared to earlier studies, which could not distinguish aggregate morphology, the proposed classification allowed us to calculate sinking speeds of millimetric marine snow categories, even in cases where the largest fraction of marine snow was not sinking. Compared to published syntheses on marine particle sinking speeds, our in situ estimates are consistent with empirical allometric models parameterized for marine aggregates and lower than most ex situ estimates, raising the question of the impact of the methodology. This study demonstrates the high potential of using cameras on autonomous floats to monitor planktonic ecosystems and assess intermittent export following episodic bloom events or events induced by marine carbon dioxide removal during large-scale operations. To better understand particle dynamics and better assess carbon flux, future work should improve upon the following key methodological aspects: (1) develop a global library of marine snow images to provide classification algorithms adapted for regional and global applications; (2) establish a size-to-POC conversion factor for the different types of aggregates; (3) couple BGC-Argo floats with ship surveys to provide more comprehensive contextual data than float and satellite data alone, as done in this study; (4) increase acquisition frequency to detect rare larger particles; and (5) implement embedded recognition of plankton and embedded classification of marine snow in cameras since most floats are not recovered.
The software code is available publicly and can be accessed via the GitHub repository at https://github.com/dodjisoviadan/angolafloat_mopga1/tree/main (last access: 9 July 2025).
The BGC‐Argo float dataset used in this study (WMO6903096) can be downloaded from the Argo Global Data Assembly Center https://doi.org/10.17882/42182#117069 (Argo, 2025b) (float with WMO 6903096, last access: 25 March 2025). These data were collected and made freely available by the International Argo Program and the national programs that contribute to it: (http://www.argo.ucsd.edu, last access: 9 July 2025, https://www.ocean-ops.org, last access: 9 July 2025). The Argo Program is part of the Global Ocean. Observing System. UVP6 data can be downloaded from the EcoPart platform (project name: uvp6_sn000113lp_2021_WMO6903096_recovery (647); http://ecopart.obs-vlfr.fr), last access: 9 July 2025
The supplement related to this article is available online at https://doi.org/10.5194/bg-22-3485-2025-supplement.
YDS, LS, and RK, designed the study. YDS, MB, JH, AB, RL, LS, AA, PB, and LD worked on the different components of the data analysis. AB calculated the Lagrangian metrics. YDS and LS drafted the paper. All authors reviewed the paper.
The contact author has declared that none of the authors has any competing interests.
Publisher’s note: Copernicus Publications remains neutral with regard to jurisdictional claims made in the text, published maps, institutional affiliations, or any other geographical representation in this paper. While Copernicus Publications makes every effort to include appropriate place names, the final responsibility lies with the authors.
The authors acknowledge the support of the crew of RV Sonne during cruise SO283 and RV Meteor during cruise M181 in the deployment and recovery of the BGC-Argo float. We are thankful to Marc Picheral, Camille Catalano, and the Plateforme d'Imagerie Quantitative de Villefranche (PIQv) for making the UVP6 data available. Argo data were collected and made freely available by the International Argo Program and the national programs that contribute to the project (https://argo.ucsd.edu, https://www.ocean-ops.org, last access: 9 July 2025). The Argo Program is part of the Global Ocean Observing System. Argo float data and metadata are from the Global Data Assembly Centre (Argo GDAC; SEANOE https://doi.org/10.17882/42182, Argo, 2025a).
Rainer Kiko received funding from the Heisenberg Programme of the German Science Foundation (no. KI 1387/5-1). Rainer Kiko and Alberto Baudena were supported via a Make Our Planet Great Again grant of the French National Research Agency within the Programme d'Investissements d'Avenir (reference ANR-19-MPGA-0012). Alberto Baudena, Rainer Kiko, Lars Stemmann, Sabrina Speich, Laetitia Drago, and Peter Brandt were supported via an EU H2020 grant (agreement 817578 TRIATLAS project). Alberto Baudena was supported via the SEASONS project of the French National Center of Spatial Studies (CNES). Laetitia Drago was supported via Sorbonne Université through the Ecole doctorale 129. Yawouvi Dodji Soviadan was supported via the Make Our Planet Great Again visiting fellowship program for early-career researchers, granted by the French Ministry for Europe and Foreign Affairs, in collaboration with the French Ministry for Higher Education and Research and implemented by Campus France (grant no. mopga-postdoc-2022-1819106044, dossier 127481V).
This paper was edited by Tina Treude and reviewed by two anonymous referees.
Accardo, A., Laxenaire, R., Baudena, A., Speich, S., Kiko, R., and Stemmann, L.: Intense and localized export of selected marine snow types at eddy edges in the South Atlantic Ocean, Biogeosciences, 22, 1183–1201, https://doi.org/10.5194/bg-22-1183-2025, 2025.
Aguedjou, H., Dadou, I., Chaigneau, A., Morel, Y., and Alory, G.: Eddies in the Tropical Atlantic Ocean and their seasonal variability, Geophys. Res. Lett., 46, 12156–12164, 2019.
Alldredge, A.: The carbon, nitrogen and mass content of marine snow as a function of aggregate size, Deep-Sea Res. Pt. I, 45, 529–541, 1998.
Alldredge, A. L. and Gotschalk, C.: In situ settling behavior of marine snow, Limnol. Oceanogr., 33, 339–351, 1988.
Alldredge, A. L. and Silver, M. W.: Characteristics, dynamics and significance of marine snow, Prog. Oceanogr., 20, 41–82, 1988.
Argo: Argo float data and metadata from Global Data Assembly Centre (Argo GDAC), SEANOE, https://doi.org/10.17882/42182, 2025.
Argo: Angola: Argo float Angola data and metadata from Global Data Assembly Centre (Argo GDAC), SEANOE [data set], https://doi.org/10.17882/42182#117069, 2025.
Awo, F. M., Rouault, M., Ostrowski, M., Tomety, F. S., Da-Allada, C. Y., and Jouanno, J.: Seasonal cycle of sea surface salinity in the Angola Upwelling System, J. Geophys. Res.-Ocean., 127, e2022JC018518, https://doi.org/10.1029/2022JC018518, 2022.
Baudena, A., Ser-Giacomi, E., D'Onofrio, D., Capet, X., Cotté, C., Cherel, Y., and D'Ovidio, F.: Fine-scale structures as spots of increased fish concentration in the open ocean, Sci. Rep., 11, 15805, https://doi.org/10.1038/s41598-021-94368-1, 2021.
Biard, T., Stemmann, L., Picheral, M., Mayot, N., Vandromme, P., Hauss, H., Gorsky, G., Guidi, L., Kiko, R., and Not, F.: In situ imaging reveals the biomass of giant protists in the global ocean, Nature, 532, 504–507, https://doi.org/10.1038/nature17652, 2016.
Boyd, P. W., Claustre, H., Levy, M., Siegel, D. A., and Weber, T.: Multi-faceted particle pumps drive carbon sequestration in the ocean, Nature, 568, 327–335, 2019.
Brandt, P., Alory, G., Awo, F. M., Dengler, M., Djakouré, S., Imbol Koungue, R. A., Jouanno, J., Körner, M., Roch, M., and Rouault, M.: Physical processes and biological productivity in the upwelling regions of the tropical Atlantic, Ocean Sci., 19, 581–601, https://doi.org/10.5194/os-19-581-2023, 2023.
Briggs, N., Dall'Olmo, G., and Claustre, H.: Major role of particle fragmentation in regulating biological sequestration of CO2 by the oceans, Science, 367, 791–793, https://doi.org/10.1126/science.aay1790, 2020.
Burd, A. B.: Modeling the Vertical Flux of Organic Carbon in the Global Ocean, Annu. Rev. Mar. Sci., 16, 135–161, https://doi.org/10.1146/annurev-marine-022123-102516, 2023.
Burd, A. B., Hansell, D. A., Steinberg, D. K., Anderson, T. R., Aristegui, J., Baltar, F., Beaupre, S. R., Buesseler, K. O., DeHairs, F., Jackson, G. A., Kadko, D. C., Koppelmann, R., Lampitt, R. S., Nagata, T., Reinthaler, T., Robinson, C., Robison, B. H., Tamburini, C., and Tanaka, T.: Assessing the apparent imbalance between geochemical and biochemical indicators of meso- and bathypelagic biological activity: What the @$#! is wrong with present calculations of carbon budgets?, Deep-Sea Res. Pt. II, 57, 1557–1571, https://doi.org/10.1016/j.dsr2.2010.02.022, 2010.
Cael, B., Cavan, E. L., and Britten, G. L.: Reconciling the size-dependence of marine particle sinking speed, Geophys. Res. Lett., 48, e2020GL091771, https://doi.org/10.1029/2020GL091771, 2021.
Chambault, P., Baudena, A., Bjorndal, K. A., Santos, M. A., Bolten, A. B., and Vandeperre, F.: Swirling in the ocean: Immature loggerhead turtles seasonally target old anticyclonic eddies at the fringe of the North Atlantic gyre, Prog. Oceanogr., 175, 345–358, 2019.
Checkley, D. M., Davis, R. E., Herman, A. W., Jackson, G. A., Beanlands, B., and Regier, L. A.: Assessing plankton and other particles in situ with the SOLOPC, Limnol. Oceanogr., 53, 2123–2136, 2008.
Diercks, A. R. and Asper, V. L.: In situ settling speeds of marine snow aggregates below the mixed layer: Black Sea and Gulf of Mexico, Deep-Sea Res. Pt. I, 44, 385–398, 1997.
Drago, L., Panaiotis, T., Irisson, J.-O., Babin, M., Biard, T., Carlotti, F., Coppola, L., Guidi, L., Hauss, H., Karp-Boss, L., Lombard, F., McDonnell, A. M. P., Picheral, M., Rogge, A., Waite, A. M., Stemmann, L., and Kiko, R.: Global Distribution of Zooplankton Biomass Estimated by In Situ Imaging and Machine Learning, Front. Mar. Sci., 9, 894372, https://doi.org/10.3389/fmars.2022.894372, 2022.
Durkin, C. A., Buesseler, K. O., Cetinić, I., Estapa, M. L., Kelly, R. P., and Omand, M.: A visual tour of carbon export by sinking particles, Global Biogeochem. Cy., 35, e2021GB006985, https://doi.org/10.1029/2021GB006985, 2021.
Durrieu de Madron, X., Nyffeler, F., and Godet, C. H.: Hydrographic structure and nepheloid spatial distribution in the Gulf of Lions continental margin, Cont. Shelf Res., 10, 915–929, 1990.
Durrieu de Madron, X., Ramondenc, S., Berline, L., Houpert, L., Bosse, A., Martini, S., Guidi, L., Conan, P., Curtil, C., and Delsaut, N.: Deep sediment resuspension and thick nepheloid layer generation by open-ocean convection, J. Geophys. Res.-Ocean., 122, 2291–2318, 2017.
Forest, A., Stemmann, L., Picheral, M., Burdorf, L., Robert, D., Fortier, L., and Babin, M.: Size distribution of particles and zooplankton across the shelf-basin system in southeast Beaufort Sea: combined results from an Underwater Vision Profiler and vertical net tows, Biogeosciences, 9, 1301–1320, https://doi.org/10.5194/bg-9-1301-2012, 2012. Forest, A., Babin, M., Stemmann, L., Picheral, M., Sampei, M., Fortier, L., Gratton, Y., Belanger, S., Devred, E., Sahlin, J., Doxaran, D., Joux, F., Ortega-Retuerta, E., Martin, J., Jeffrey, W. H., Gasser, B., and Miquel, J. C.: Ecosystem function and particle flux dynamics across the Mackenzie Shelf (Beaufort Sea, Arctic Ocean): an integrative analysis of spatial variability and biophysical forcings, Biogeosciences, 10, 2833–2866, https://doi.org/10.5194/bg-10-2833-2013, 2013.
Francois, R., Honjo, S., Krishfield, R., and Manganini, S.: Factors controlling the flux of organic carbon to the bathypelagic zone of the ocean, Global Biogeochem. Cy., 16, 34-1–34-20, https://doi.org/10.1029/2001GB001722, 2002.
Giering, S. L. C., Sanders, R., Lampitt, R. S., Anderson, T. R., Tamburini, C., Boutrif, M., Zubkov, M. V., Marsay, C. M., Henson, S. A., Saw, K., Cook, K., and Mayor, D. J.: Reconciliation of the carbon budget in the ocean's twilight zone, Nature, 507, 480–483, https://doi.org/10.1038/nature13123, 2014.
Giering, S. L. C., Cavan, E. L., Basedow, S. L., Briggs, N., Burd, A. B., Darroch, L. J., Guidi, L., Irisson, J. O., Iversen, M. H., Kiko, R., Lindsay, D., Marcolin, C. R., McDonnell, A. M. P., Moller, K. O., Passow, U., Thomalla, S., Trull, T. W., and Waite, A. M.: Sinking Organic Particles in the Ocean-Flux Estimates From in situ Optical Devices, Front. Mar. Sci., 6, 834, https://doi.org/10.3389/fmars.2019.00834, 2020.
Gonzalez-Quiros, R. and Checkley, D. M.: Occurrence of fragile particles inferred from optical plankton counters used in situ and to analyze net samples collected simultaneously, J. Geophys. Res.-Ocean., 111, C05S06, https://doi.org/10.1029/2005JC003084, 2006.
Gorsky, G., Picheral, M., and Stemmann, L.: Use of the Underwater Video Profiler for the study of aggregate dynamics in the North Mediterranean, Estuar. Coast. Shelf Sci., 50, 121–128, 2000.
Guidi, L., Jackson, G. A., Stemmann, L., Miquel, J. C., Picheral, M., and Gorsky, G.: Relationship between particle size distribution and flux in the mesopelagic zone, Deep-Sea Res. Pt. I, 55, 1364–1374, https://doi.org/10.1016/j.dsr.2008.05.014, 2008.
Guidi, L., Legendre, L., Reygondeau, G., Uitz, J., Stemmann, L., and Henson, S. A.: A new look at ocean carbon remineralization for estimating deepwater sequestration, Global Biogeochem. Cy., 29, 1044–1059, https://doi.org/10.1002/2014gb005063, 2015.
Guidi, L., Chaffron, S., Bittner, L., Eveillard, D., Larhlimi, A., Roux, S., Darzi, Y., Audic, S., Berline, L., Brum, J. R., Coelho, L. P., Espinoza, J. C. I., Malviya, S., Sunagawa, S., Dimier, C., Kandels-Lewis, S., Picheral, M., Poulain, J., Searson, S., Stemmann, L., Not, F., Hingamp, P., Speich, S., Follows, M., Karp-Boss, L., Boss, E., Ogata, H., Pesant, S., Weissenbach, J., Wincker, P., Acinas, S. G., Bork, P., de Vargas, C., Iudicone, D., Sullivan, M. B., Raes, J., Karsenti, E., Bowler, C., Gorsky, G., and Tara Oceans Consortium Coordinator: Plankton networks driving carbon export in the oligotrophic ocean, Nature, 532, 465–470, 2016.
Henson, S., Bisson, K., Hammond, M., Martin, A., Mouw, C., and Yool, A.: Effect of sampling bias on global estimates of ocean carbon export, Environ. Res. Lett., 19, 024009, https://doi.org/10.1088/1748-9326/ad1e7f, 2024.
Honjo, S., Manganini, S. J., and Cole, J. J.: Sedimentation of biogenic matter in the deep ocean, Deep-Sea Res., 29, 609–625, 1982.
Imbol Koungue, R. A., Brandt, P., Prigent, A., Aroucha, L. C., Lübbecke, J., Imbol Nkwinkwa, A. S. N., Dengler, M., and Keenlyside, N.: Drivers and impact of the 2021 extreme warm event in the tropical Angolan upwelling system, Sci. Rep., 14, 16824, https://doi.org/10.1038/s41598-024-67569-7, 2024.
Irisson, J.-O., Ayata, S.-D., Lindsay, D. J., Karp-Boss, L., and Stemmann, L.: Machine Learning for the Study of Plankton and Marine Snow from Images, Annu. Rev. Mar. Sci., 14, 277–301, https://doi.org/10.1146/annurev-marine-041921-013023, 2022.
Iversen, M. H. and Lampitt, R. S.: Size does not matter after all: no evidence for a size-sinking relationship for marine snow, Prog. Oceanogr., 189, 102445, https://doi.org/10.1016/j.pocean.2020.102445, 2020.
Iversen, M. H., Nowald, N., Ploug, H., Jackson, G. A., and Fischer, G.: High resolution profiles of vertical particulate organic matter export off Cape Blanc, Mauritania: Degradation processes and ballasting effects, Deep-Sea Res. Pt. I, 57, 771–784, https://doi.org/10.1016/j.dsr.2010.03.007, 2010.
Jackson, G. A. and Checkley, D. M.: Particle size distributions in the upper 100 m water column and their implications for animal feeding in the plankton, Deep-Sea Res. Pt. I, 58, 283–297, https://doi.org/10.1016/j.dsr.2010.12.008, 2011.
Jouandet, M.-P., Trull, T. W., Guidi, L., Picheral, M., Ebersbach, F., Stemmann, L., and Blain, S.: Optical imaging of mesopelagic particles indicates deep carbon flux beneath a natural iron-fertilized bloom in the Southern Ocean, Limnol. Oceanogr., 56, 1130–1140, https://doi.org/10.4319/lo.2011.56.3.1130, 2011.
Kiko, R., Biastoch, A., Brandt, P., Cravatte, S., Hauss, H., Hummels, R., Kriest, I., Marin, F., McDonnell, A. M. P., Oschlies, A., Picheral, M., Schwarzkopf, F. U., Thurnherr, A. M., and Stemmann, L.: Biological and physical influences on marine snowfall at the equator, Nat. Geosci., 10, 852–858, https://doi.org/10.1038/ngeo3042, 2017.
Kiko, R., Brandt, P., Christiansen, S., Faustmann, J., Kriest, I., Rodrigues, E., Schütte, F., and Hauss, H.: Zooplankton-mediated fluxes in the eastern tropical North Atlantic, Front. Mar. Sci., 7, 358, https://doi.org/10.3389/fmars.2020.00358, 2020.
Kopte, R., Brandt, P., Dengler, M., Tchipalanga, P., Macuéria, M., and Ostrowski, M.: The A ngola C urrent: Flow and hydrographic characteristics as observed at 11° S, J. Geophys. Res.-Ocean., 122, 1177–1189, 2017.
Körner, M., Brandt, P., and Dengler, M.: Seasonal cycle of sea surface temperature in the tropical Angolan Upwelling System, Ocean Sci., 19, 121–139, https://doi.org/10.5194/os-19-121-2023, 2023.
Körner, M., Brandt, P., Illig, S., Dengler, M., Subramaniam, A., Bachèlery, M.-L., and Krahmann, G.: Coastal trapped waves and tidal mixing control primary production in the tropical Angolan upwelling system, Sci. Adv., 10, eadj6686, https://doi.org/10.1126/sciadv.adj6686, 2024.
Kriest, I.: Different parameterizations of marine snow in a 1D-model and their influence on representation of marine snow, nitrogen budget and sedimentation, Deep-Sea Res. Pt. I, 49, 2133–2162, 2002.
Kriest, I. and Evans, G. T.: A vertically resolved model for phytoplankton aggregation, P. Indian AS-Earth, 109, 453–469, 2000.
Lacour, L., Briggs, N., Petiteau, L., Bressac, M., Guidi, L., Castro, B. F., Picheral, M., Catalano, C., Schmechtig, C., and Leymarie, E.: Particle size sets the carbon penetration depth during ocean bloom export events, https://doi.org/10.21203/rs.3.rs-4474302/v1, 2024.
Laget, M., Drago, L., Panaïotis, T., Kiko, R., Stemmann, L., Rogge, A., Llopis-Monferrer, N., Leynaert, A., Irisson, J.-O., and Biard, T.: Global census of the significance of giant mesopelagic protists to the marine carbon and silicon cycles, Nat. Commun., 15, 3341, https://doi.org/10.1038/s41467-024-47651-4, 2024.
Laurenceau-Cornec, E. C., Trull, T. W., Davies, D. M., Christina, L., and Blain, S.: Phytoplankton morphology controls on marine snow sinking velocity, Mar. Ecol. Prog. Ser., 520, 35–56, 2015.
Legendre, P. and Legendre, L.: Numerical Ecology, Numerical Ecology, 2nd Edn., Chapitre 9, “Ordination in reduced space”, Elsevier, Amsterdam, ISBN: 978-0080537870, 1998.
Legendre, P. and Legendre, L.: Canonical analysis, in: Developments in Environmental Modelling, Chap. 11, Vol. 24, edited by: Legendre, P. and Legendre, L., Elsevier, 625–710, https://doi.org/10.1016/B978-0-444-53868-0.50011-3, 2012.
Martin, J. H., Knauer, G. A., Karl, D. M., and Broenkow, W. W.: VERTEX: carbon cycling in the northeast Pacific, Deep-Sea Res. Pt. A, 34, 267–285, 1987.
McDonnell, A. M. P. and Buesseler, K. O.: Variability in the average sinking velocity of marine particles, Limnol. Oceanogr., 55, 2085–2096, https://doi.org/10.4319/lo.2010.55.5.2085, 2010.
McInnes, L., Healy, J., Saul, N., and Großberger, L.: UMAP: Uniform Manifold Approximation and Projection, Journal of Open Source Software, 3, 861, https://doi.org/10.21105/joss.00861, 2018.
Nowald, N., Fischer, G., Ratmeyer, V., Iversen, M., Reuter, C., Wefer, G., and Ieee: In-situ sinking speed measurements of marine snow aggregates acquired with a settling chamber mounted to the Cherokee ROV, 1 pp., https://doi.org/10.1109/OCEANSE.2009.5278186, 2009.
Panaiotis, T., Babin, M., Biard, T., Carlotti, F., Coppola, L., Guidi, L., Hauss, H., Karp-Boss, L., Kiko, R., Lombard, F., McDonnell, A. M. P., Picheral, M., Rogge, A., Waite, A. M., Stemmann, L., and Irisson, J.-O.: Three major mesoplanktonic communities resolved by in situ imaging in the upper 500 m of the global ocean, Glob. Ecol. Biogeogr., 32, 1991–2005, https://doi.org/10.1111/geb.13741, 2023.
Picheral, M., Guidi, L., Stemmann, L., Karl, D. M., Iddaoud, G., and Gorsky, G.: The Underwater Vision Profiler 5: An advanced instrument for high spatial resolution studies of particle size spectra and zooplankton, Limnol. Oceanogr.-Method., 8, 462–473, https://doi.org/10.4319/lom.2010.8.462, 2010.
Picheral, M., Catalano, C., Brousseau, D., Claustre, H., Coppola, L., Leymarie, E., Coindat, J., Dias, F., Fevre, S., Guidi, L., Irisson, J. O., Legendre, L., Lombard, F., Mortier, L., Penkerch, C., Rogge, A., Schmechtig, C., Thibault, S., Tixier, T., Waite, A., and Stemmann, L.: The Underwater Vision Profiler 6: an imaging sensor of particle size spectra and plankton, for autonomous and cabled platforms, Limnol. Oceanogr.-Method., 20, 115–129, https://doi.org/10.1002/lom3.10475, 2022.
Ploug, H., Iversen, M. H., and Fischer, G.: Ballast, sinking velocity, and apparent diffusivity within marine snow and zooplankton fecal pellets: Implications for substrate turnover by attached bacteria, Limnol. Oceanogr., 53, 1878–1886, 2008a.
Ploug, H., Iversen, M. H., Koski, M., and Buitenhuis, E. T.: Production, oxygen respiration rates, and sinking velocity of copepod fecal pellets: Direct measurements of ballasting by opal and calcite, Limnol. Oceanogr., 53, 469–476, 2008b.
Ploug, H., Terbruggen, A., Kaufmann, A., Wolf-Gladrow, D., and Passow, U.: A novel method to measure particle sinking velocity in vitro, and its comparison to three other in vitro methods, Limnol. Oceanogr.-Method., 8, 386–393, https://doi.org/10.4319/lom.2010.8.386, 2010.
Scannell, H. A. and McPhaden, M. J.: Seasonal mixed layer temperature balance in the southeastern tropical Atlantic, J. Geophys. Res.-Ocean., 123, 5557–5570, 2018.
Ser-Giacomi, E., Baudena, A., Rossi, V., Follows, M., Clayton, S., Vasile, R., López, C., and Hernández-García, E.: Lagrangian betweenness as a measure of bottlenecks in dynamical systems with oceanographic examples, Nat. Commun., 12, 4935, https://doi.org/10.1038/s41467-021-25155-9, 2021.
Shadden, S. C., Lekien, F., and Marsden, J. E.: Definition and properties of Lagrangian coherent structures from finite-time Lyapunov exponents in two-dimensional aperiodic flows, Physica D, 212, 271–304, 2005.
Siegel, D. A., DeVries, T., Cetinić, I., and Bisson, K. M.: Quantifying the Ocean's Biological Pump and Its Carbon Cycle Impacts on Global Scales, Annu. Rev. Mar. Sci., 15, 329–356, 2023.
Soviadan, Y. D., Benedetti, F., Brandão, M. C., Ayata, S.-D., Irisson, J.-O., Jamet, J. L., Kiko, R., Lombard, F., Gnandi, K., and Stemmann, L.: Patterns of mesozooplankton community composition and vertical fluxes in the global ocean, Prog. Oceanogr., 200, 102717, https://doi.org/10.1016/j.pocean.2021.102717, 2022.
Stemmann, L. and Boss, E.: Plankton and Particle Size and Packaging: From Determining Optical Properties to Driving the Biological Pump, Annu. Rev. Mar. Sci., 4, 263–290, https://doi.org/Doi 10.1146/Annurev-Marine-120710-100853, 2012.
Stemmann, L., Gorsky, G., Marty, J. C., Picheral, M., and Miquel, J. C.: Four-year study of large-particle vertical distribution (0–1000 m) in the NW Mediterranean in relation to hydrology, phytoplankton, and vertical flux, Deep-Sea Res. Pt. II, 49, 2143–2162, 2002.
Stemmann, L., Jackson, G. A., and Gorsky, G.: A vertical model of particle size distributions and fluxes in the midwater column that includes biological and physical processes – Part II: application to a three year survey in the NW Mediterranean Sea, Deep-Sea Res. Pt. I, 51, 885–908, https://doi.org/10.1016/j.dsr.2004.03.002, 2004.
Stemmann, L., Youngbluth, M., Robert, K., Hosia, A., Picheral, M., Paterson, H., Ibanez, F., Guidi, L., Lombard, F., and Gorsky, G.: Global zoogeography of fragile macrozooplankton in the upper 100–1000 m inferred from the underwater video profiler, Ices J. Mar. Sci., 65, 433–442, https://doi.org/10.1093/icesjms/fsn010, 2008.
Stolarek, I., Samelak-Czajka, A., Figlerowicz, M., and Jackowiak, P.: Dimensionality reduction by UMAP for visualizing and aiding in classification of imaging flow cytometry data, iScience, 25, 105142, https://doi.org/10.1016/j.isci.2022.105142, 2022.
Teixeira, J., Rocha, V., Oliveira, J., Jorge, P. A. S., and Silva, N. A.: Towards real-time identification of trapped particles with UMAP-based classifiers, J. Phys. Conf. Ser., 2407, 012043, https://doi.org/10.1088/1742-6596/2407/1/012043, 2022.
Trudnowska, E., Lacour, L., Ardyna, M., Rogge, A., Irisson, J. O., Waite, A. M., Babin, M., and Stemmann, L.: Marine snow morphology illuminates the evolution of phytoplankton blooms and determines their subsequent vertical export, Nat. Commun., 12, 2816–2816, https://doi.org/10.1038/s41467-021-22994-4, 2021.
Turner, J. T.: Zooplankton fecal pellets, marine snow, phytodetritus and the ocean's biological pump, Prog. Oceanogr., 130, 205–248, 2015.
Volk, T. and Hoffert, M. I.: Ocean carbon pumps: analysis of relative strengths and efficiencies in ocean-driven atmospheric CO2 changes, in: The Carbon Cycle and Atmospheric CO2: Natural Variations Archean to Present, Vol. 32, edited by: Sundquist, E. T. and Broecker, W. S., American Geophysical Union (AGU), Washington, DC, 99–110, https://doi.org/10.1029/GM032p0099, 1985.
Williams, J. and Giering, S.: In situ particle measurements deemphasize the role of size in governing the sinking velocity of marine particles, Geophys. Res. Lett., 49, e2022GL099563, https://doi.org/10.1029/2022GL099563, 2022.
Yeo, I. and Johnson, R. A.: A new family of power transformations to improve normality or symmetry, Biometrika, 87, 954–959, https://doi.org/10.1093/biomet/87.4.954, 2000.