the Creative Commons Attribution 4.0 License.
the Creative Commons Attribution 4.0 License.
 | 23 Jul 2025
A time series analysis of transparent exopolymer particle distributions and C : N stoichiometry in the subtropical North Pacific: a key process in net community production and preformed nitrate anomalies?
Kieran Curran
Tracy A. Villareal
Robert T. Letscher
Within the oligotrophic subtropical oceans, summertime dissolved inorganic carbon drawdown despite nutrient limitation in surface waters and subsurface oxygen consumption in the absence of Redfieldian stoichiometric nitrate release are two phenomena still awaiting a full mechanistic characterization. Many processes may contribute to these anomalies, including N2 fixation, non-Redfieldian DOM (dissolved organic matter) cycling, vertically migrating phytoplankton, heterotrophic NO uptake, and vertical-NO-injection events. While these processes have been measured or modelled, they generally cannot fully account for the magnitudes of oxygen nitrate anomalies and the excess dissolved inorganic drawdown observed in many oligotrophic subtropical bodies of water. One other candidate process that may contribute to both phenomena is the formation of carbon-rich transparent exopolymer particles (TEPs) and Coomassie-stainable particles (CSPs) from dissolved organic precursors in surface waters and their subsequent export and remineralization below; however, few TEP and CSP data exist from the oligotrophic ocean. Here we present a multiyear time series (January 2020–September 2022) analysis of TEP, CSP, and total dissolved carbohydrate concentrations at station ALOHA (22°45′° N, 158° W) and along a meridional transect from 22°45′ to 31° N within the North Pacific subtropical gyre during June 2021. Exopolymer C : N stoichiometry at station ALOHA varied between 16.4 and 34.3, with values being more carbon rich in summer (26–34); ratios were higher (33–38) toward the gyre centre at 31° N. TEP concentrations were consistently elevated in surface waters through spring–autumn (4–8 µM C after carbon conversion) at station ALOHA, with lower concentrations (∼ 1.5–3 µM C) and a more uniform vertical distribution during winter, indicating that the TEPs that accumulate in surface waters may sink vertically and be exported with winter mixing. The accumulation of exopolymers in surface waters through spring–autumn and its subsequent vertical export may account for 6.5 %–20 % of net community production, helping to reduce the estimated imbalance of N supply and demand at this site to < 10 %. The upper-ocean exopolymer cycle may explain 22 %–67 % of the observed oxygen nitrate anomalies, helping to close the C, N, and O2 budgets at station ALOHA, while leaving room for significant contributions from other processes such as vertically migrating phytoplankton and heterotrophic nitrate uptake. These results suggest that exopolymer production and cycling may be more important to open-ocean carbon biogeochemistry and the biological pump than previously expected.
- Article
(5531 KB) - Full-text XML
- BibTeX
- EndNote


Subtropical oceans constitute one of Earth's largest biomes, where the euphotic water column exhibits sustained macronutrient limitation due to strong thermal stratification (Reygondeau et al., 2013). Consistently low euphotic zone chlorophyll concentrations observed in these regions lead to depressed primary production estimates using ocean-colour satellite and bio-optical float profile data (Longhurst et al., 1995; Long et al., 2021; Westberry et al., 2023). Despite this assumption of low productivity, various measured rates of annual net community production (NCP) and total annual carbon export from the ocean subtropics suggest a biological pump strength that is maintained at levels consistent with those of mesotrophic oceanic regions receiving a higher vertical nutrient injection flux (Gruber et al., 1998; Emerson, 2014; Teng et al., 2014; Roshan and DeVries, 2017; Quay et al., 2020; Karl et al., 2021; Quay and Stephens, 2025).
Moderate rates of summertime surface dissolved inorganic carbon (DIC) drawdown are observed in low-chlorophyll Atlantic and Pacific subtropical oceans (2–3 mol C m−2 yr−1) despite limiting nitrate and phosphate concentrations and stratification that would seem to limit diapycnal supply of nutrients to the euphotic zone for most of the year (Sambrotto et al., 1993; Michaels et al., 1994; Dave and Lozier, 2010; Williams et al., 2013; Emerson, 2014). Processes of nutrient enrichment such as N2 fixation, episodic mixing events, and iron-rich dust deposition are unable to fully provide a sufficient nutrient supply to sustain this persistent summertime anomaly (Johnson et al., 2010; Chow et al., 2017; Fawcett et al., 2018; Letscher and Villareal, 2018; Letelier et al., 2019; Karl et al., 2021). In addition, most subtropical regions exhibit subsurface respiration without concomitant nitrate release expected from the remineralization of Redfieldian organic matter. This produces a widespread negative preformed nitrate (preNO) anomaly between ∼ 120 and 180 m (Emerson and Hayward, 1995; Abell et al., 2005; Ascani et al., 2013; Letscher and Villareal, 2018; Smyth and Letscher, 2023) and stoichiometrically balanced positive preNO anomalies found within the upper 100 m where O2 is produced without stoichiometric NO drawdown (Letscher and Villareal, 2018). The introduction of allochthonous macronutrient supply to the surface mixed layer by vertically migrating phytoplankton or the production and export of non-Redfieldian organic matter (high elemental carbon : nitrogen ratio) are two potential processes that may couple these three phenomena and help explain the elevated surface DIC drawdown and positive preNO, as well as negative preNO, below the subsurface chlorophyll maximum in these regions (Letscher and Villareal, 2018).
Transparent exopolymer particles (TEPs), mostly comprised of acidic polysaccharides, are ubiquitous throughout the oceans, where they tend to accumulate in surface waters due to their low density (Azetsu-Scott and Passow, 2004). Exopolymers are typically observed to be carbon rich, with C : N ratios of > 20:1 (Mari et al., 2001; Engel and Passow, 2001; Passow, 2002b; Guo et al., 2022), which makes them a candidate for surface mixed layer DIC drawdown with minimal nitrogen requirement, particularly if composed of pure carbohydrate (e.g. 1 C : 1 O2 : 0 N). While most abundant during large blooms of phytoplankton in eutrophic waters, TEPs and their precursors are produced by a wide variety of phytoplankton and bacteria across different marine and aquatic environments (Passow et al., 1994; Nosaka et al., 2017; Zamanillo et al., 2019). Exopolymers act as a bridge between the dissolved and particulate fractions of marine organic matter, with dynamic assembly and disassembly of marine gels helping to fill the size continuum of particles in the ocean (Verdugo et al., 2004; Verdugo, 2012). The related but distinct Coomassie-stainable particles (CSPs) are thought to track the more protein-rich component of the marine exopolymer/gel pool, which likely impacts the fate of these particles differently than it impacts the polysaccharide-rich TEP pool (Cisternas-Novoa et al., 2015; Zamanillo et al., 2021). TEPs contribute to sinking exopolymer aggregates, which in turn constitute a significant flux of particulate organic carbon (POC) to the upper mesopelagic zone, where much of this organic matter may be consumed by aggregate-associated bacteria (Wurl et al., 2011b; Nagata et al., 2021) and zooplankton (Ling and Alldredge, 2003).
TEP production from phytoplankton exudates is associated with excess DIC drawdown even in nutrient-replete water. In these regions, carbon overconsumption can be as high as 30 %–40 % with respect to nitrate and phosphate removal and particulate organic matter (POM) C : N : P stoichiometry (Toggweiler, 1993). Surface mixed layer exopolymer production may increase as cells are stressed by the nutrient limitation or photo-oxidative stresses (Berman-Frank et al., 2007; Ortega-Retuerta et al., 2009a; Iuculano et al., 2017) persistent in many subtropical surface waters. Therefore, despite lower phytoplankton biomass in these oligotrophic regions, significant TEP production and seasonal variability may still occur.
Given that different oligotrophic regions exhibit significant variability in the elemental stoichiometry of organic matter, including biomass (Martiny et al., 2013), detrital POM, and dissolved organic matter (DOM) (Letscher and Moore, 2015; Liang et al., 2023), across depth and time, region-specific measurements are needed to quantify the importance of exopolymer particles to pelagic biogeochemistry of different regions (McCarthy et al., 1996; Mari et al., 2001; Passow, 2002b; Beauvais et al., 2003).
In this study, we assess whether significant depth, temporal, and latitudinal gradients exist in (1) exopolymer abundance and its associated C : N content that may help to explain the seasonal excess DIC drawdown in the absence of known nutrient supply pathways (e.g. Johnson et al., 2010) and (2) potentially related subsurface preNO anomalies present within the North Pacific subtropical gyre (NPSG). To do this, we sampled two classes of exopolymers: carbohydrate-rich TEPs and protein-containing CSPs, as well as dissolved carbohydrates (precursor molecules of larger exopolymer particles; Passow, 2000; Ortega-Retuerta et al., 2009b; Arnosti et al., 2021), for nearly 3 years to quantify their concentrations, vertical distributions, and seasonal and latitudinal variability.
In order to produce quantitative estimates of TEP and CSP concentrations, we also directly estimated the organic C and N content of exopolymers spontaneously assembled under controlled conditions in the field to convert TEP and CSP values to carbon and nitrogen equivalents. With these quantitative estimates of TEP-C and CSP-N concentrations, we then discuss the potential contributions of the exopolymer cycle to explain surface mixed layer excess DIC drawdown and subsurface preNOanomalies. This contribution helps to close the C, N, and O2 budgets at station ALOHA and may apply to the carbon and nutrient biogeochemistry of the subtropical oceans more generally.
2.1 Sample collection
Water samples for measurements of TEPs, CSPs, and dissolved polysaccharides were collected using a Niskin rosette on board the RV Kilo Moana from 15 cruises between January 2020 and September 2022. 14 cruises were part of the Hawaiian Ocean time series (HOT) sampling programme at station ALOHA (22°45′ N 158° W), with 1 cruise sampling 10 stations in the North Pacific gyre along a nominal 158° W transect from station ALOHA to 31° N during June 2021, also on RV Kilo Moana (Fig. 1). Vertical profiles of salinity (Sea-Bird SBE-09), temperature (Sea-Bird SBE-3 Plus), and oxygen (Sea-Bird SBE-43) were also collected by the rosette conductivity, temperature, and depth (CTD) instrument package. Primary productivity, chlorophyll a, particulate carbon, and particulate nitrogen data measured as part of the HOT programme for the period of 1988–2022 were obtained from https://hahana.soest.hawaii.edu/hot/hot-dogs/, last access: 15 January 2024.
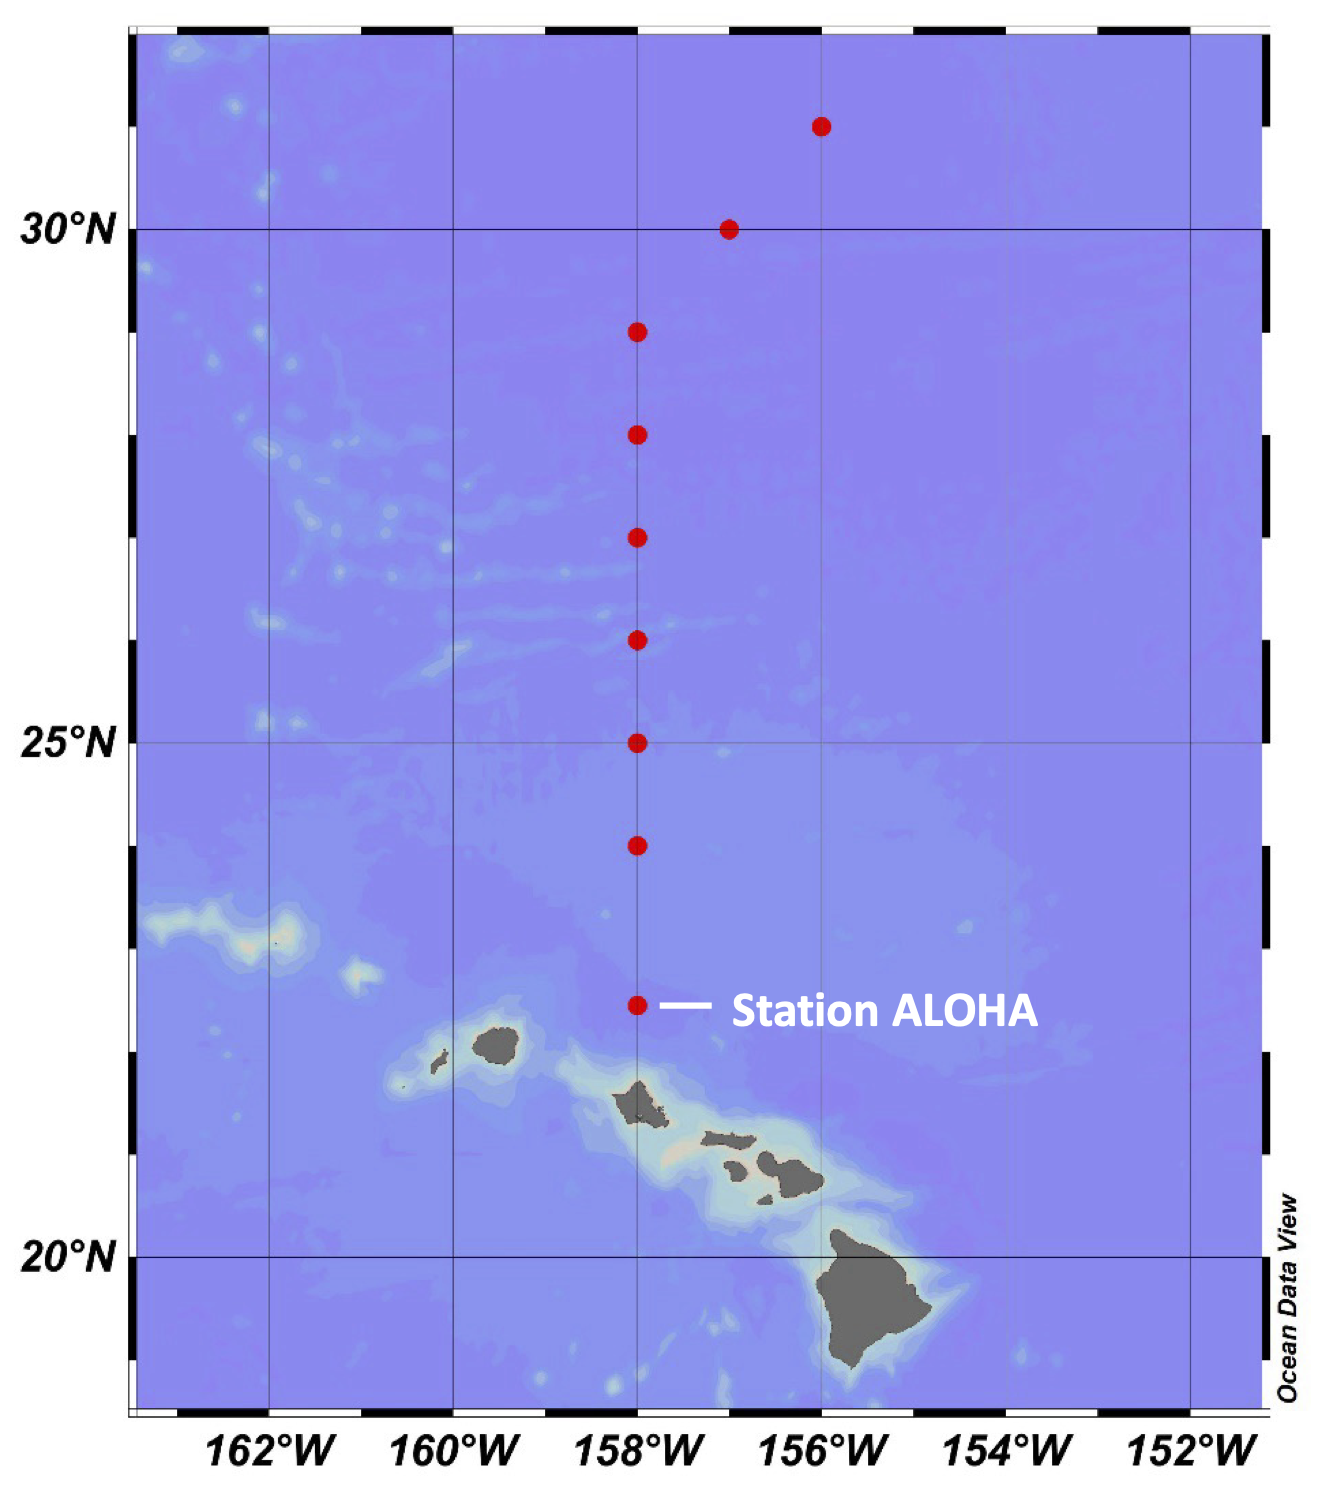
Figure 1Map showing the location of station ALOHA, where time series measurements were collected, and the stations along the June 2021 transect between ALOHA and 31° N (Schlitzer, 2025, Ocean Data View, https://odv.awi.de, last access: 20 November 2023).
2.2 Quantification of transparent exopolymer particles (TEPs) and Coomassie-stainable particles (CSPs)
Water samples for TEPs and CSPs (0.5–2.0 L) were taken from five to eight depths and stored in polycarbonate bottles (Corning) in blacked-out carriers until filtration. Samples were processed from deepest to shallowest to minimize any effects of small temperature changes on exopolymer formation dynamics. Water samples for TEPs and CSPs were filtered using 0.4 µm pore-size, 25 mm diameter polycarbonate filters (Whatman) using a peristaltic pump (Cole-Parmer) and silicone tubing (Masterflex). Filters were then placed onto a vacuum filtration rig and dyed with acidified (pH 2.5) 0.02 % Alcian Blue (AB) solution (Alcian Blue 8X, Sigma Aldrich) for TEP samples, following Bittar et al. (2015), and 0.04 % Coomassie brilliant blue (CBB) (SERVA) solution (pH 7.4) for CSP samples, following Cisternas-Novoa et al. (2015). Dyed filters were placed in polypropylene vials (Falcon) and frozen at −20 °C and then shipped back to the shore-based laboratory in ice-packed coolers (Pelican) over 2 d. TEP samples were extracted in 6 mL 80 % sulfuric acid solution for 2 h and were absorbance read at 787 nm. CSP samples were extracted in 4 mL 3 % sodium dodecyl sulfate (SDS) in 50 % isopropyl alcohol solution for 2 h at 37 °C under ultrasonication and were read at 615 nm. Absorbance values were blanked against the same type of polycarbonate filters after filtration of 500 mL ultrapure water. Blanks were also taken with 500 mL 0.2 µm filtered seawater to check that there was no bias resulting from sub-0.2 µm organic material from seawater retained on the filters. These blanks were not significantly different and had a combined coefficient of variation of 0.039. Absorbance values were calibrated against a dilution series of xanthan gum (XG) (Sigma) and bovine serum albumin (BSA) (Sigma) for TEPs and CSPs, respectively. Concentration units are therefore expressed as µg XG equiv. L−1 and µg BSA equiv. L−1 following the literature convention (e.g. Cisternas-Novoa et al., 2015), using the spectrophotometric method for TEP and CSP quantification in Fig. 2. TEP sample replicates had a mean coefficient of variation of 0.04 µg XG equiv. L−1 and CSP samples 0.14 µg BSA equiv. L−1 (n=24) from eight sets of triplicate measurements.
2.3 Dissolved carbohydrates
Water samples for dissolved carbohydrate analysis were gravity filtered from the Niskin rosette using a 47 mm combusted GF/F filter (Whatman; 0.7 µm nominal pore size) into acid-cleaned and furnaced glass vials. Vials were frozen at −20 °C and transported similar to above for lab analysis. Using the approach of Myklestad et al. (1997), total HCl-hydrolysable carbohydrates (TCHOs) were measured against a glucose calibration standard and expressed in µM carbon. The method uses the alkaline ferricyanide reaction with 2,4,6-tripyridyl-s-triazine (TPTZ) that produces a deep-violet colour with reduced iron, allowing sensitive measurement of low carbohydrate concentrations with spectrophotometry. Reagents were made fresh for each run of samples and kept in blacked-out glassware. Coefficients of variation averaged 2.5 % on triplicate analyses of dissolved carbohydrate.
2.4 Carbon and nitrogen conversion factors
During field sampling at station ALOHA (22.75° N, 158° W) and at 31° N, 156° W in June 2021 and in October 2021 from station ALOHA alone, 3×10 L volumes of seawater from two depths (5, 125 m) were filtered through a 0.2 µm capsule filter (Pall) into opaque high-density polyethylene (HDPE) plastic bottles and stored in the dark while at sea at sample depth temperature ± 1 °C. Bottles were left for 80–100 h to allow sufficient time for exopolymers to spontaneously reform from the dissolved fraction. From these bottles, duplicate filtrations (1.5 L) were performed for TEP and CSP concentrations as above, and duplicate filtrations for particulate carbon and nitrogen were taken on 47 mm GF filters (Whatman) for carbon, hydrogen and nitrogen (CHN) analysis of the exopolymer particles collected.
Particulate carbon and nitrogen data (in µM C and µM N) were then used with the measurements of TEPs and CSPs (in µg XG equiv. L−1 and µg BSA equiv. L−1) to convert the latter exopolymer concentration units to µM C and µM N using carbon and nitrogen conversion factors (CCFs and NCFs).
TEP carbon (TEP-C) and CSP nitrogen (CSP-N) concentrations are thereafter converted and expressed in µM units of carbon and nitrogen, respectively.
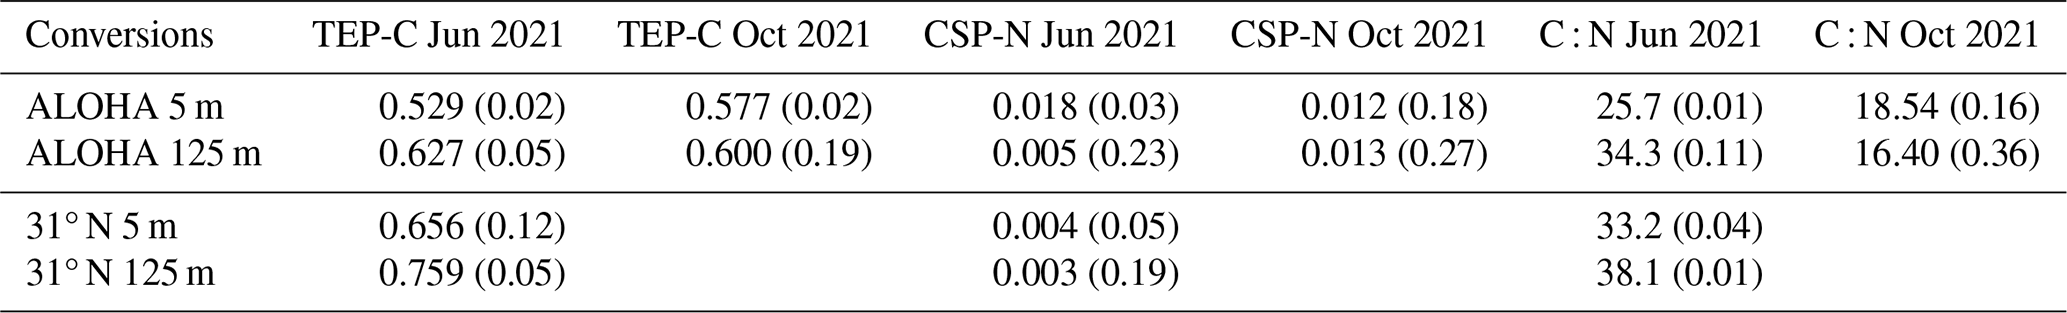
Table 1TEP-C and CSP-N conversion factors and exopolymer C : N ratios measured from exopolymer ingrowth incubations of 0.2 µm filtered seawater conducted in June and October 2021 at station ALOHA and at the northern end of the June 2021 transect (31° N, 156° W); values in parentheses are the coefficients of variation.
3.1 Carbon and nitrogen conversion factors
Carbon conversion factors for TEP-C at station ALOHA varied between 0.529 and 0.627 µM C µg−1 XG equiv. L−1, with mean surface values being lower than at 125 m (p=0.07, Welch's t test) (Table 1). These values are consistent with the frequently used conversion factor of 0.6 from Engel and Passow (2001). Nitrogen conversion factors for CSP-N varied by a factor of ∼ 6 between 0.003 and 0.018, with lower organic nitrogen content found at 31° N than at station ALOHA (p=0.04, Welch's t test) (Table 1.). The C : N ratio (16.4–34.3) at ALOHA varied more than carbon conversion factors (0.529–0.627), e.g. by a factor of ∼ 2 and ∼ 1.2, respectively, with summertime samples from 125 m being the most carbon rich and samples from October at 125 m having the lowest C : N ratios (p=0.007, Welch's t test). All samples were carbon rich with respect to the canonical Redfield ratio, with exopolymer C : N ratios at station ALOHA being significantly higher in summer than in autumn at 5 m (p=0.025, Welch's t test) and at 125 m (p=0.007, Welch's t test), consistent with the observations of Michaels et al. (1994). Summertime C : N ratios were significantly higher in northern-gyre-associated waters (31° N) than at station ALOHA, e.g. 33–38 vs. 26–34, at both 5 m (p=0.0001, Welch's t test) and 125 m (p=0.01, Welch's t test).
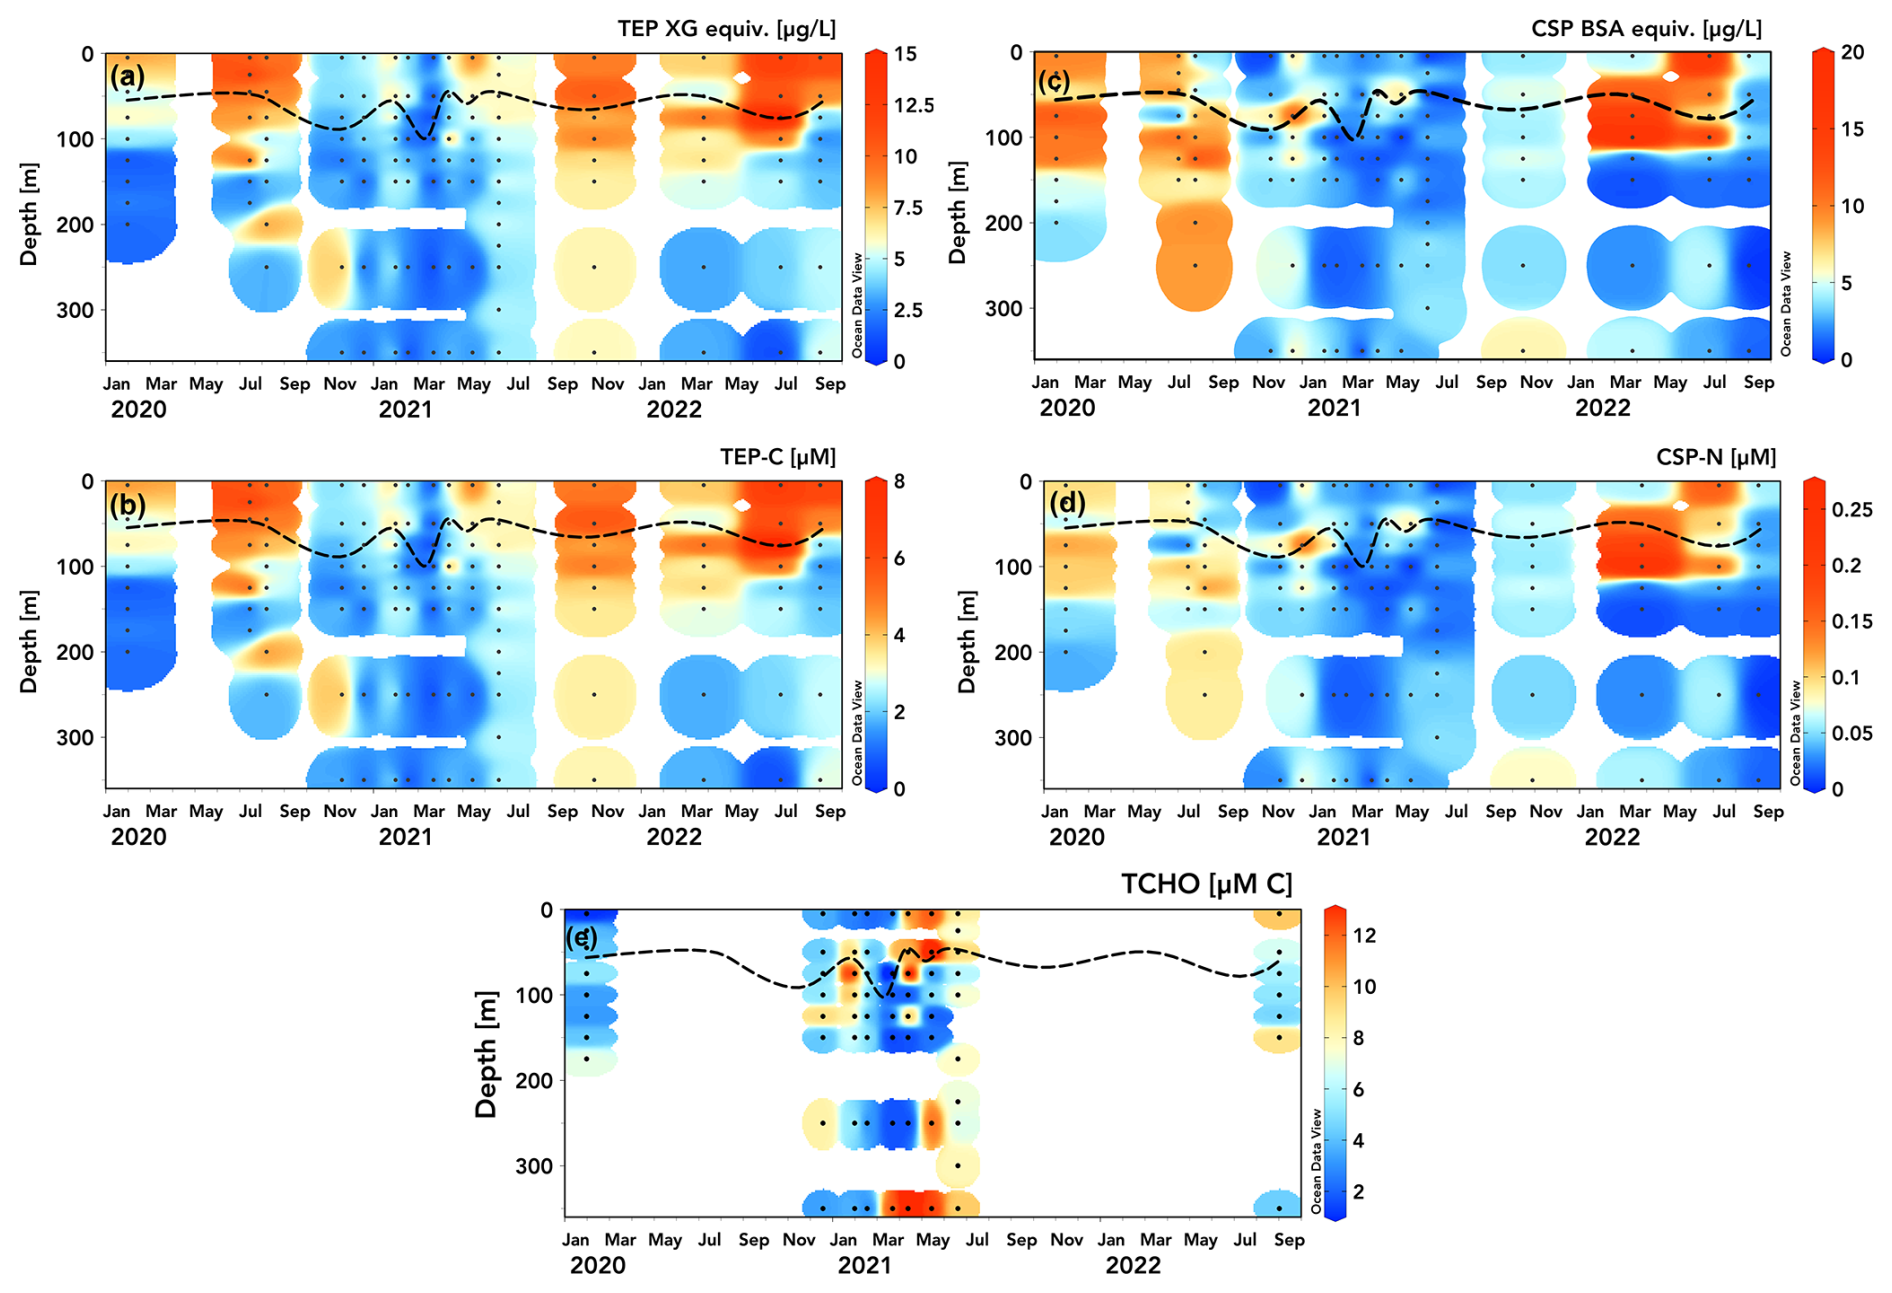
Figure 2Station ALOHA time series (2020–2022) of TEP and CSP concentrations measured in xanthan gum (XG) (a) and bovine serum albumin (BSA) µg equiv. L−1 (c) and converted to µM C (b) and µM N (d). Dissolved total carbohydrate (TCHO) concentrations [µM C] measured on select cruises are presented in panel (e). The dashed line shows mixed layer depth calculated from HOT CTD data as a 0.125 °C decrease in temperature from the 10 m value (Schlitzer, 2025, Ocean Data View, https://odv.awi.de, last access: 15 April 2025).
3.2 Interannual variation in TEPs, CSPs, and TCHOs at station ALOHA
At station ALOHA, TEP concentrations were highest during the summer months where values peaked within the surface mixed layer (8–15 XG equiv. µg L−1 (Fig. 2a); 4–8 µM C (Fig. 2b)), with decreasing TEP concentrations down to the underlying mesopelagic waters (1–5 XG equiv. µg L−1 (Fig. 2a); 0.5–3 µM C (Fig. 2b). TEP concentrations were generally lower (2–7 XG equiv. µg L−1; 1–4 µM C), with less pronounced vertical gradients during winter months, suggesting either the export of accumulated TEPs from surface waters or a background of nonseasonal production or abiotic formation in deeper waters. Interannual variation in TEP concentrations in the upper 300 m is approximately 15 %–40 % (coefficient of variation), with May–July 2021 having lower concentrations than similar periods in 2020 and 2022. March 2021 exhibited the lowest upper-100 m concentrations (coinciding with the deepening of the surface mixed layer to 110 m after a series of storms and heavy rainfall).
The CSP distribution at station ALOHA exhibited a less observable seasonal pattern and less distinct vertical gradients compared to those of TEPs (Fig. 2c, d). Elevated CSP concentrations appear to be distributed differently than those of TEPs, with high concentrations (6–18 BSA equiv. µg L−1 (Fig. 2c); 0.1–0.2 µM N (Fig. 2d)) were found below the surface mixed layer (50–100 m) and around the top of the subsurface chlorophyll max (100–125 m), consistent with the general distributions measured by Cisternas-Novoa et al. (2015) for the Sargasso Sea. CSPs in 2021 were 2–8 BSA equiv. µg L−1; 0.01–0.07 µM N throughout the upper 300 m, similar to the subsurface chlorophyll max and mesopelagic (> 125 m) CSP concentrations in 2020 and 2022, lacking an upper-ocean seasonal peak (Fig. 2c, d). As with those of TEPs, CSP concentrations were observed to be greater in March 2022 than after storms in March 2021.
TCHO samples were taken on fewer HOT cruises than TEP and CSP samples during 2020–2022 due to logistical constraints. Total dissolved carbohydrates serve as a precursor substrate for the abiotic assembly of exopolymer particles in situ (Verdugo et al., 2004). TCHO concentrations varied between ∼ 2 and 12 µM C across depths and seasons (Fig. 2e). There is a marked difference in the distribution of TCHO concentrations between winter samples in 2020 and 2021, where surface concentrations were low (2–6 µM), and data from spring 2021, where concentrations are consistently high at 350 m and in the upper 50 m from April through June (> 10 µM). Compared to DOC measurements taken at station ALOHA, this spring maximum at 350 m seems erroneous but falls within the intra-annual variability in DOC at 350 m at ALOHA (± 6 µM C) and monthly variation in particulate export (Karl et al., 2021). It may be possible that some hydrolysable particulate polysaccharides are drawn through combusted GF/F filters (Nagata et al., 2021). Another potential explanation is the degradation and/or solubilization of exopolymers below the subsurface chlorophyll max where polysaccharide-specific enzyme activity is elevated (Reintjes et al., 2020).
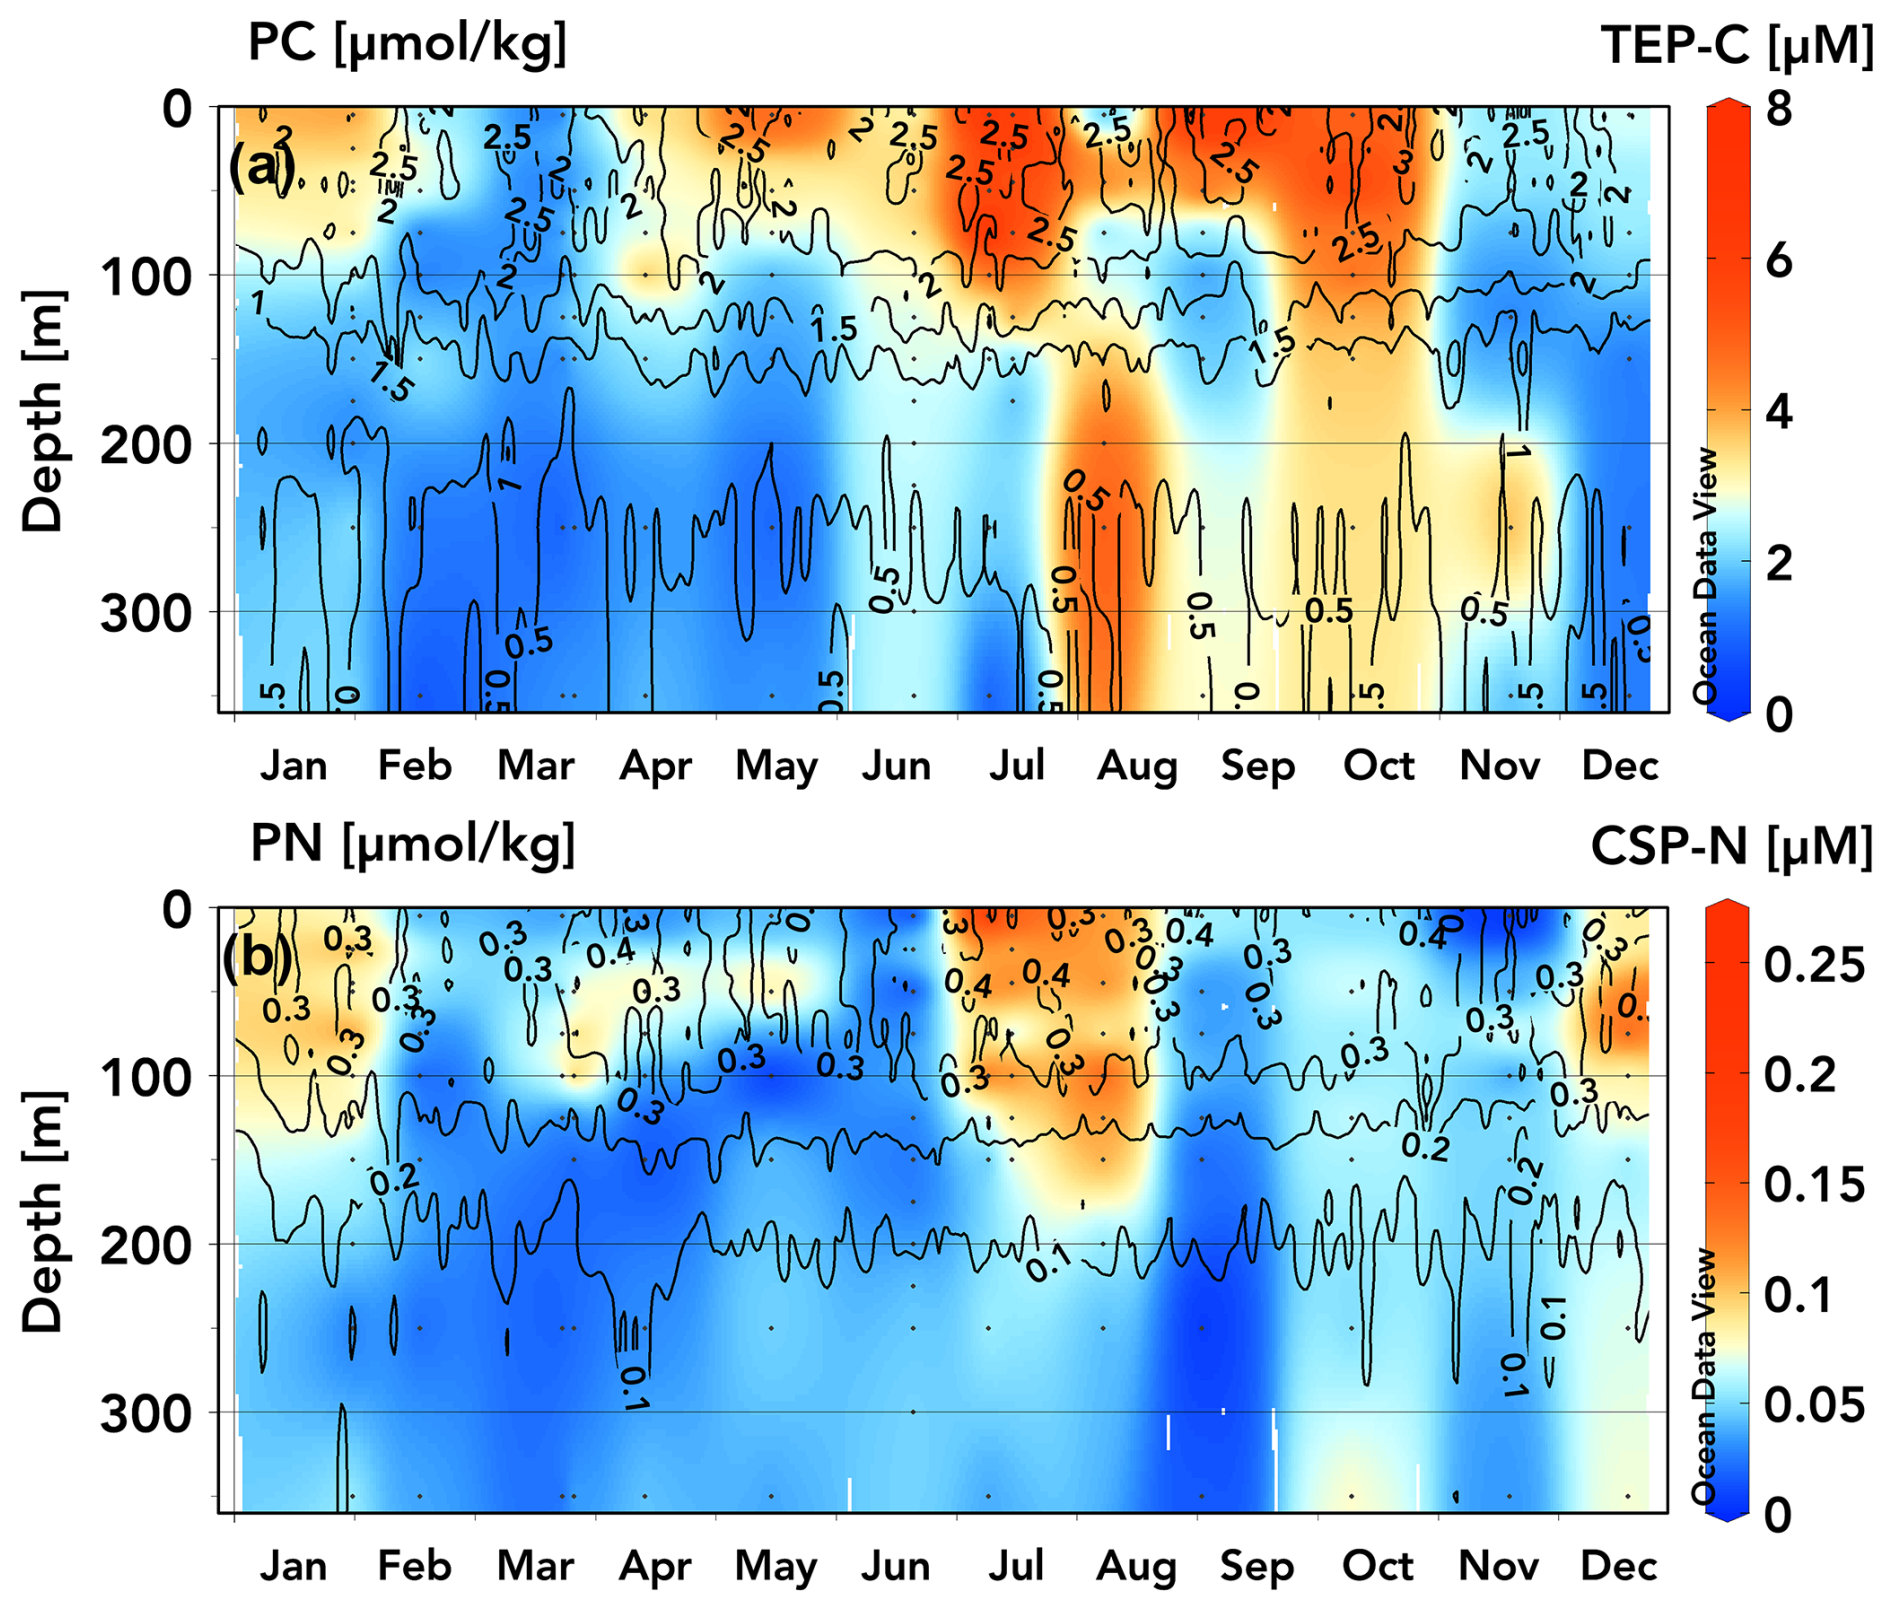
Figure 3TEP-C (a) and CSP-N (b) (µM) concentration climatologies for 2020–2022 data measured at station ALOHA overlaid with contours from climatologies of particulate carbon (a) and particulate nitrogen (b) (µmol kg−1) from the Hawaiian Ocean time series dataset (1989–2020 data) (Schlitzer, 2025, Ocean Data View, https://odv.awi.de, last access: 15 April 2025).
3.3 Climatologies of TEP-C and CSP-N with particulate carbon and nitrogen
Previous analyses of the climatology of upper-ocean positive-preNO-anomaly and subsurface negative-preNO-anomaly generation at station ALOHA have revealed repeatable seasonal ingrowths of the respective anomalies during the months of April through November (Letscher and Villareal, 2018). These seasonal ingrowths are a common feature of these anomaly generation patterns across the Northern Hemisphere subtropics observed in the BGC-Argo float record (Smyth and Letscher, 2023). To explore exopolymer accumulation and vertical export as an explanation for these seasonal preNO anomaly generation patterns, we converted the 2020–2022 TEP and CSP data to a monthly averaged climatology for station ALOHA (Fig. 3), with the caveat that some months were only sampled once over the observational period. TEPs exhibit a seasonal pattern, with elevated concentrations found in the upper 100 m beginning in April/May (3–4 µM) increasing to an annual maximum in late June through early October (5–8 µM), followed by a decrease towards an annual minimum in February/March (1–2 µM) (Fig. 3a). TEP concentrations below 100 m are ∼ 1–2 µM from December through June, increasing to 2–4 µM from June through November, concurrent with the seasonal maxima in upper-100 m TEPs. We speculate that these moderate concentrations of TEPs below 100 m that are present during summer/autumn may be due to slowly sinking aggregates as TEPs accumulate in the upper 100 m through spring–summer and form aggregates before sinking, consistent with the contemporaneous peak in particulate export rates of ∼ 30–55 mg C m−2 d−1 at station ALOHA (Emerson et al., 1997; Karl et al., 2012; Böttjer et al., 2017; Karl et al., 2021). The CSP climatology suggests two seasonal concentration maxima in the upper 100–130 m, occurring in July/August and in December/January (0.07–0.13 µM) (Fig. 3b). CSP concentrations in other months and below these depths are < 0.06 µM.
3.4 Patterns of TEPs and CSPs with respect to particulate C and N at station ALOHA
Comparing TEP and CSP concentrations to climatologies of particulate carbon (PC) and nitrogen (PN), respectively, at station ALOHA (1989–2020; isolines in Fig. 3a, b), it is apparent that measured TEP concentrations reflect variation in euphotic PC more closely than CSPs do PN, particularly for samples taken in May–October. Elevated CSP-N concentrations during summer months (0.12–0.24 µM N) correspond with PN maxima, but during winter and spring, CSP-N comprises a smaller proportion of PN.
While CSP-N concentrations are lower in magnitude than PN concentrations, TEP-C is frequently observed to exceed background PC concentrations at station ALOHA, which may be an artefact of filtration for PC and PN analysis losing exopolymers during GF/F filtration or excess dye binding to particles when using the colorimetric method of measuring TEPs and CSPs (Passow, 2002b; Bar-Zeev et al., 2011; Annane et al., 2015; Ortega-Retuerta et al., 2019; Nagata et al., 2021). The difference in nominal pore size between the GF/F filters used to sample PC (0.7 µm) and the 0.4 µm pore-size polycarbonate filters used for TEPs may also lead to sampling errors when comparing TEP-C and PC/POC, as most of these particles are small (< 3 µm diameter), particularly in the upper 200 m, with particles tending to be larger as they age or sink and aggregate through the mesopelagic zone (Engel et al., 2020). It is therefore likely that TEP-C to PC ratios vary with depth and are more accurate for samples containing larger particles. Strands of microgels and larger particles may be easily pulled through GF/F filters under vacuum pressure and may be disaggregated when sampled in standard sediment-catching methodology due to turbulence, break up at the saline density layer, solubilization or rapid remineralization, or preferential consumption by motile organisms (Smith et al., 1992; Buesseler et al., 2007; Fawcett et al., 2018). In addition to the variable size spectrum of TEPs, the electrochemistry that allows the aggregation of polymers into micro- and macroscopic gels (principally the divalent cations Ca2+ and Mg2+) may be affected during filtration and to a different degree by various polycarbonate and GF/F filters (Chin et al., 1998; Meers et al., 2006). If this is the case, then gels > 0.4 µm that would otherwise be retained may be broken apart into constituent polymers or smaller nanogels that can pass through the filter. This would lead to TEPs being quantified in the DOM fraction and would lead to an overestimate of dissolved to particulate fractions of organic matter.
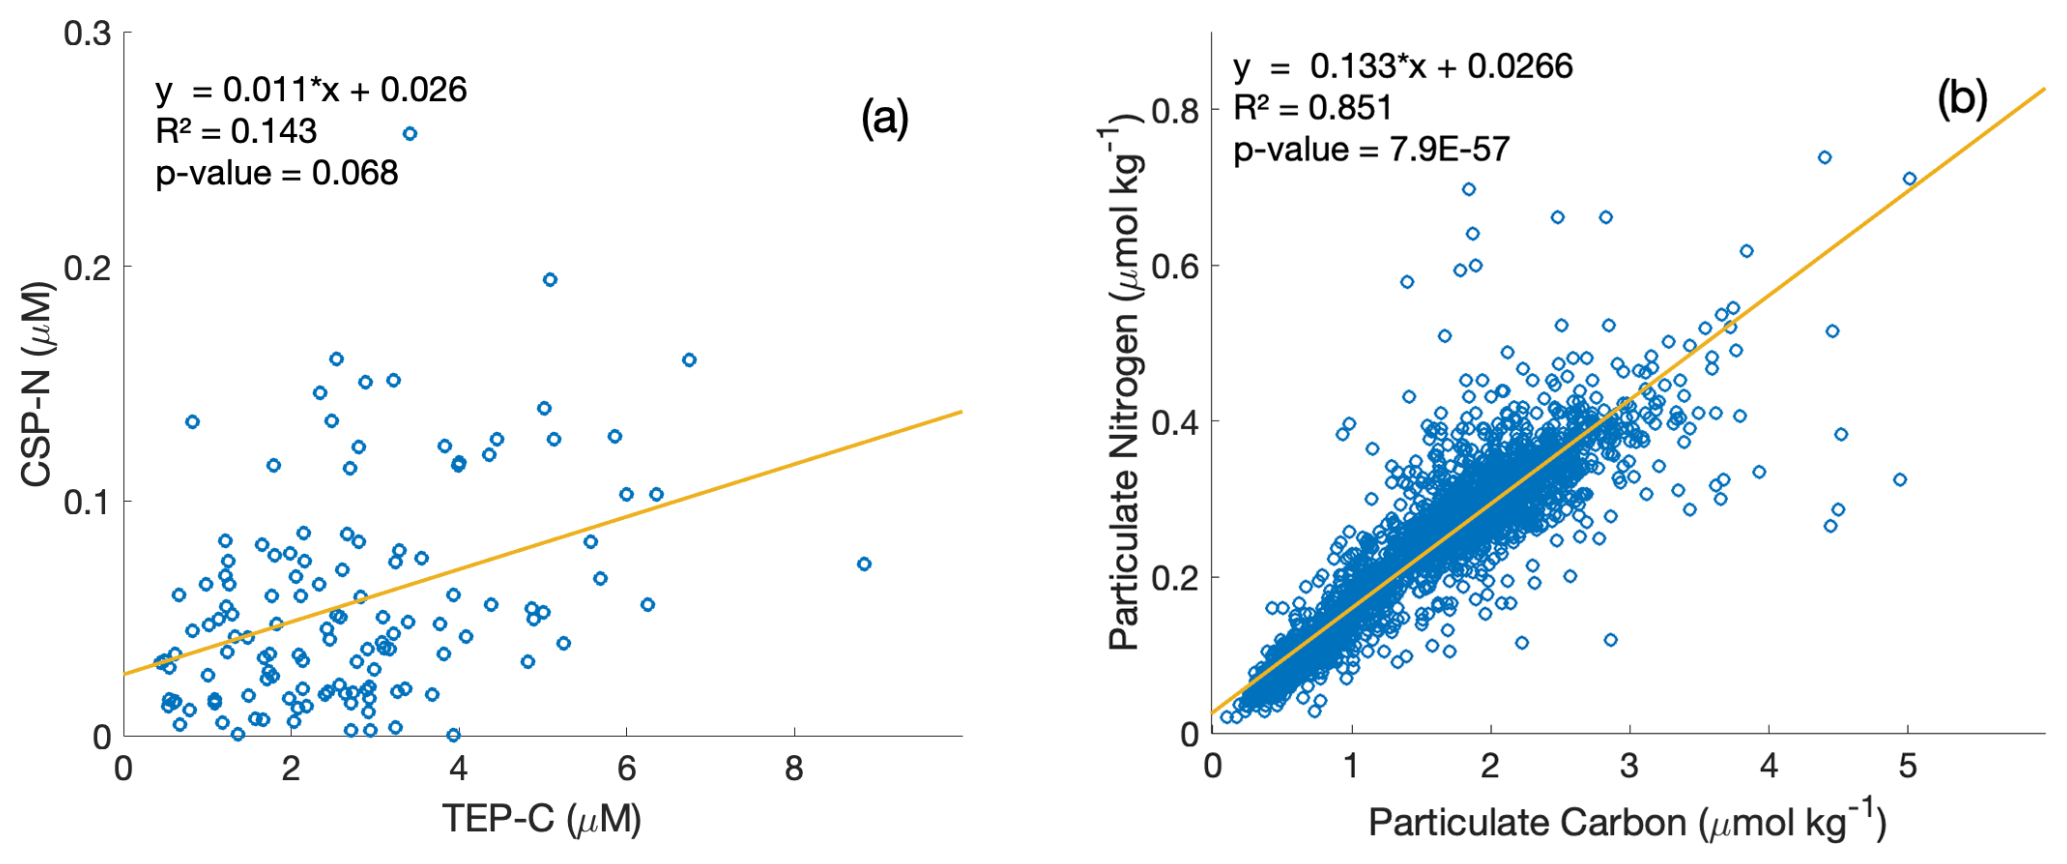
Figure 4Property–property plots of measured CSP-N and TEP-C concentrations [µM] within the upper 350 m at station ALOHA from this study (a) and particulate nitrogen to particulate carbon [µmol kg−1] from the HOT dataset (1989–2020 data) (b), including model-II linear regression lines and correlation statistics.
We further explore the relationships between the exopolymer particle fraction, PC, and PN, and their respective stoichiometries with property–property plots (Fig. 4). PN and PC concentrations are correlated well (R2=0.851, Model-II regression) at station ALOHA (Fig. 4b), and the mean C : N ratio computed from the inverse of the slope (7.55) is slightly higher than the canonical Redfield ratio (6.63). In contrast, TEP-C and CSP-N concentrations show a weaker correlation (R2=0.143, Model-II regression), with an empirical estimate of the exopolymer particle C : N stoichiometry of 90.9 or 37.3 when the regression slope is forced through zero, the latter similar to the C : N stoichiometry determined directly on collected exopolymers (Table 1). The weaker correlation of TEP-C with CSP-N concentrations due to the larger variability in the data suggests different formation, consumption, and/or export dynamics for each group of exopolymers, consistent with the observations of Cisternas-Novoa et al. (2015) and Zamanillo et al. (2021).
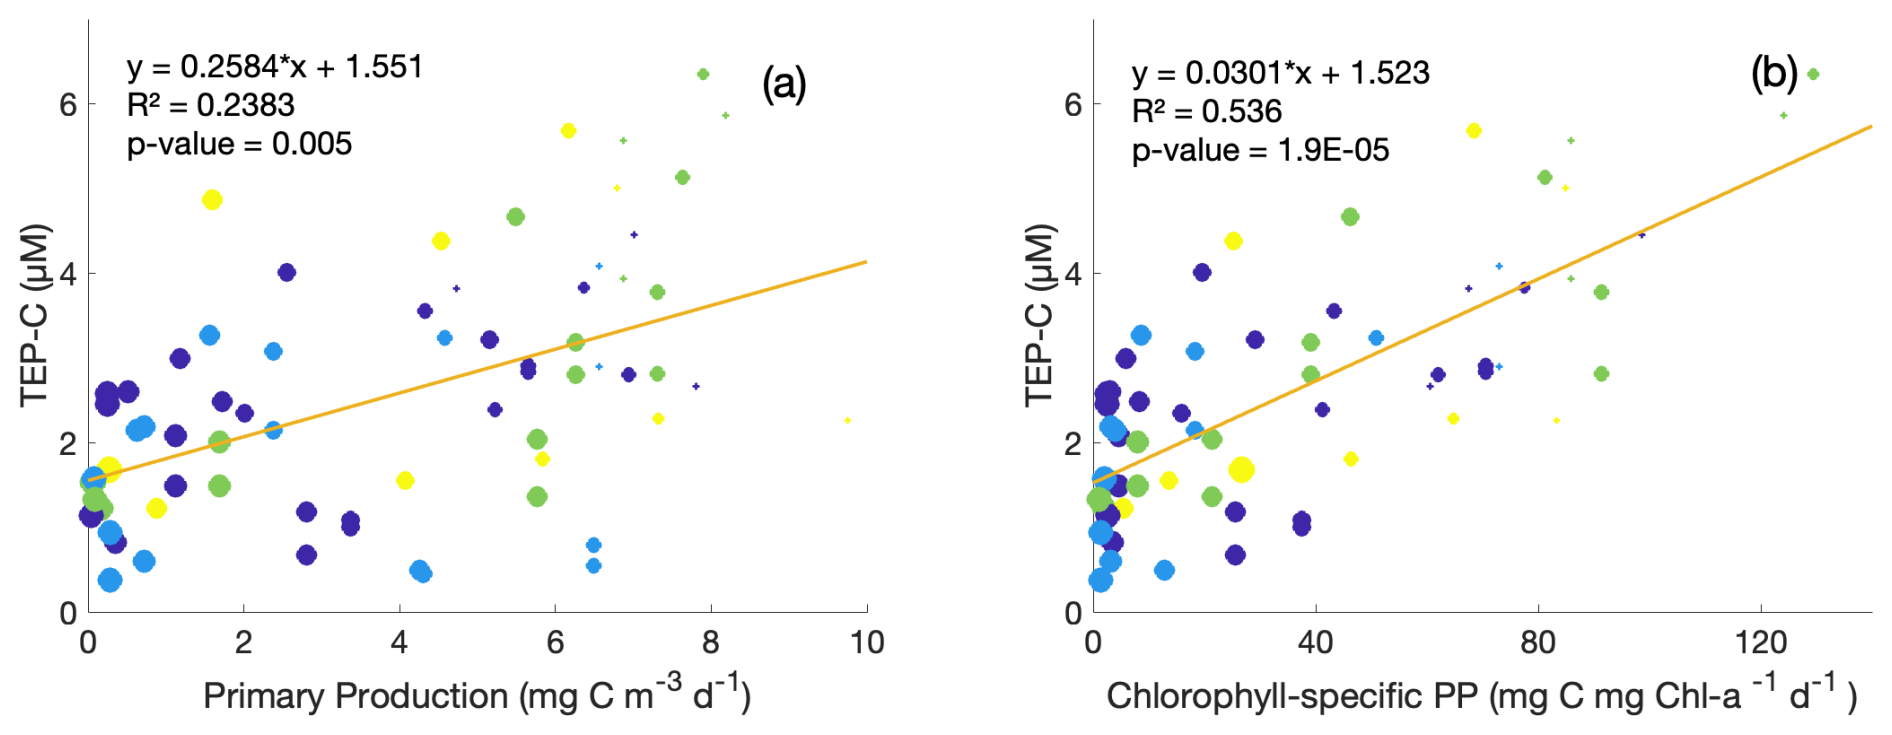
Figure 5Property–property plots of measured TEP-C concentrations [µM C] within the upper 350 m from this study against same-depth daily primary production (a) and chlorophyll-specific primary production (b) measured at station ALOHA. Circle size indicates depth: larger circles are deeper samples. Colour denotes season: purple = winter, blue = spring, green = summer, and yellow = autumn. Model-II linear regression lines and correlation statistics are provided.
3.5 TEPs and rates of primary production
As TEP production, abiotic formation, and consumption/degradation dynamics are often attributed to phytoplankton community structure and downwelling irradiance intensity (Zamanillo et al., 2019; Bar-Zeev et al., 2011; Ortega-Retuerta et al., 2009a; Berman-Frank et al., 2007; Passow, 2002a), daily primary production (PP) measurements taken during HOT cruises were compared with TEP concentrations, indicating a weak positive correlation for overall PP (R2=0.24, Fig. 5a) and a stronger correlation for chlorophyll-normalized PP (R2 = 0.54, Fig. 5b). The co-occurrence of higher TEP-C concentrations and high chlorophyll-specific primary production values despite nutrient limitation in surface waters may be indicative of enhanced release of TEP carbohydrate precursors in addition to downregulation of photosynthetic pigment synthesis in light-saturated surface waters (Rabouille et al., 2017; Thompson et al., 2018). The highest values of primary productivity and TEP concentration (> 4 µM) were observed in summer and fall samples. There are too few data to determine whether the TEP-C to PP ratios vary by season (coloured circles, Fig. 5). CSP-N showed no such correlations with primary production within this dataset. Although these results may be expected simply from the vertical gradients observed in TEPs at station ALOHA, chlorophyll-normalized PP gives some information on whether TEP concentrations are only associated with surface accumulation or are around the peak in chlorophyll at the subsurface chlorophyll max. While this small dataset of TEP and PP matchups may indicate that TEP production is occurring around the subsurface chlorophyll max owing to moderate chlorophyll-normalized PP and TEP concentrations at these depths, there are too few data at present to draw firm conclusions, particularly for near-surface water. Wurl et al. (2011a) found a similar disconnect between microbial activity and exopolymer distributions: variations in measured TEP production rates across different Pacific waters (including late-summer samples from station ALOHA) were not associated with phytoplankton blooms, changes in chlorophyll concentrations, or fluorescence, with abiotic formation of TEPs easily maintaining observed concentrations in the surface mixed layer (8–12 µM C L−1 d−1).
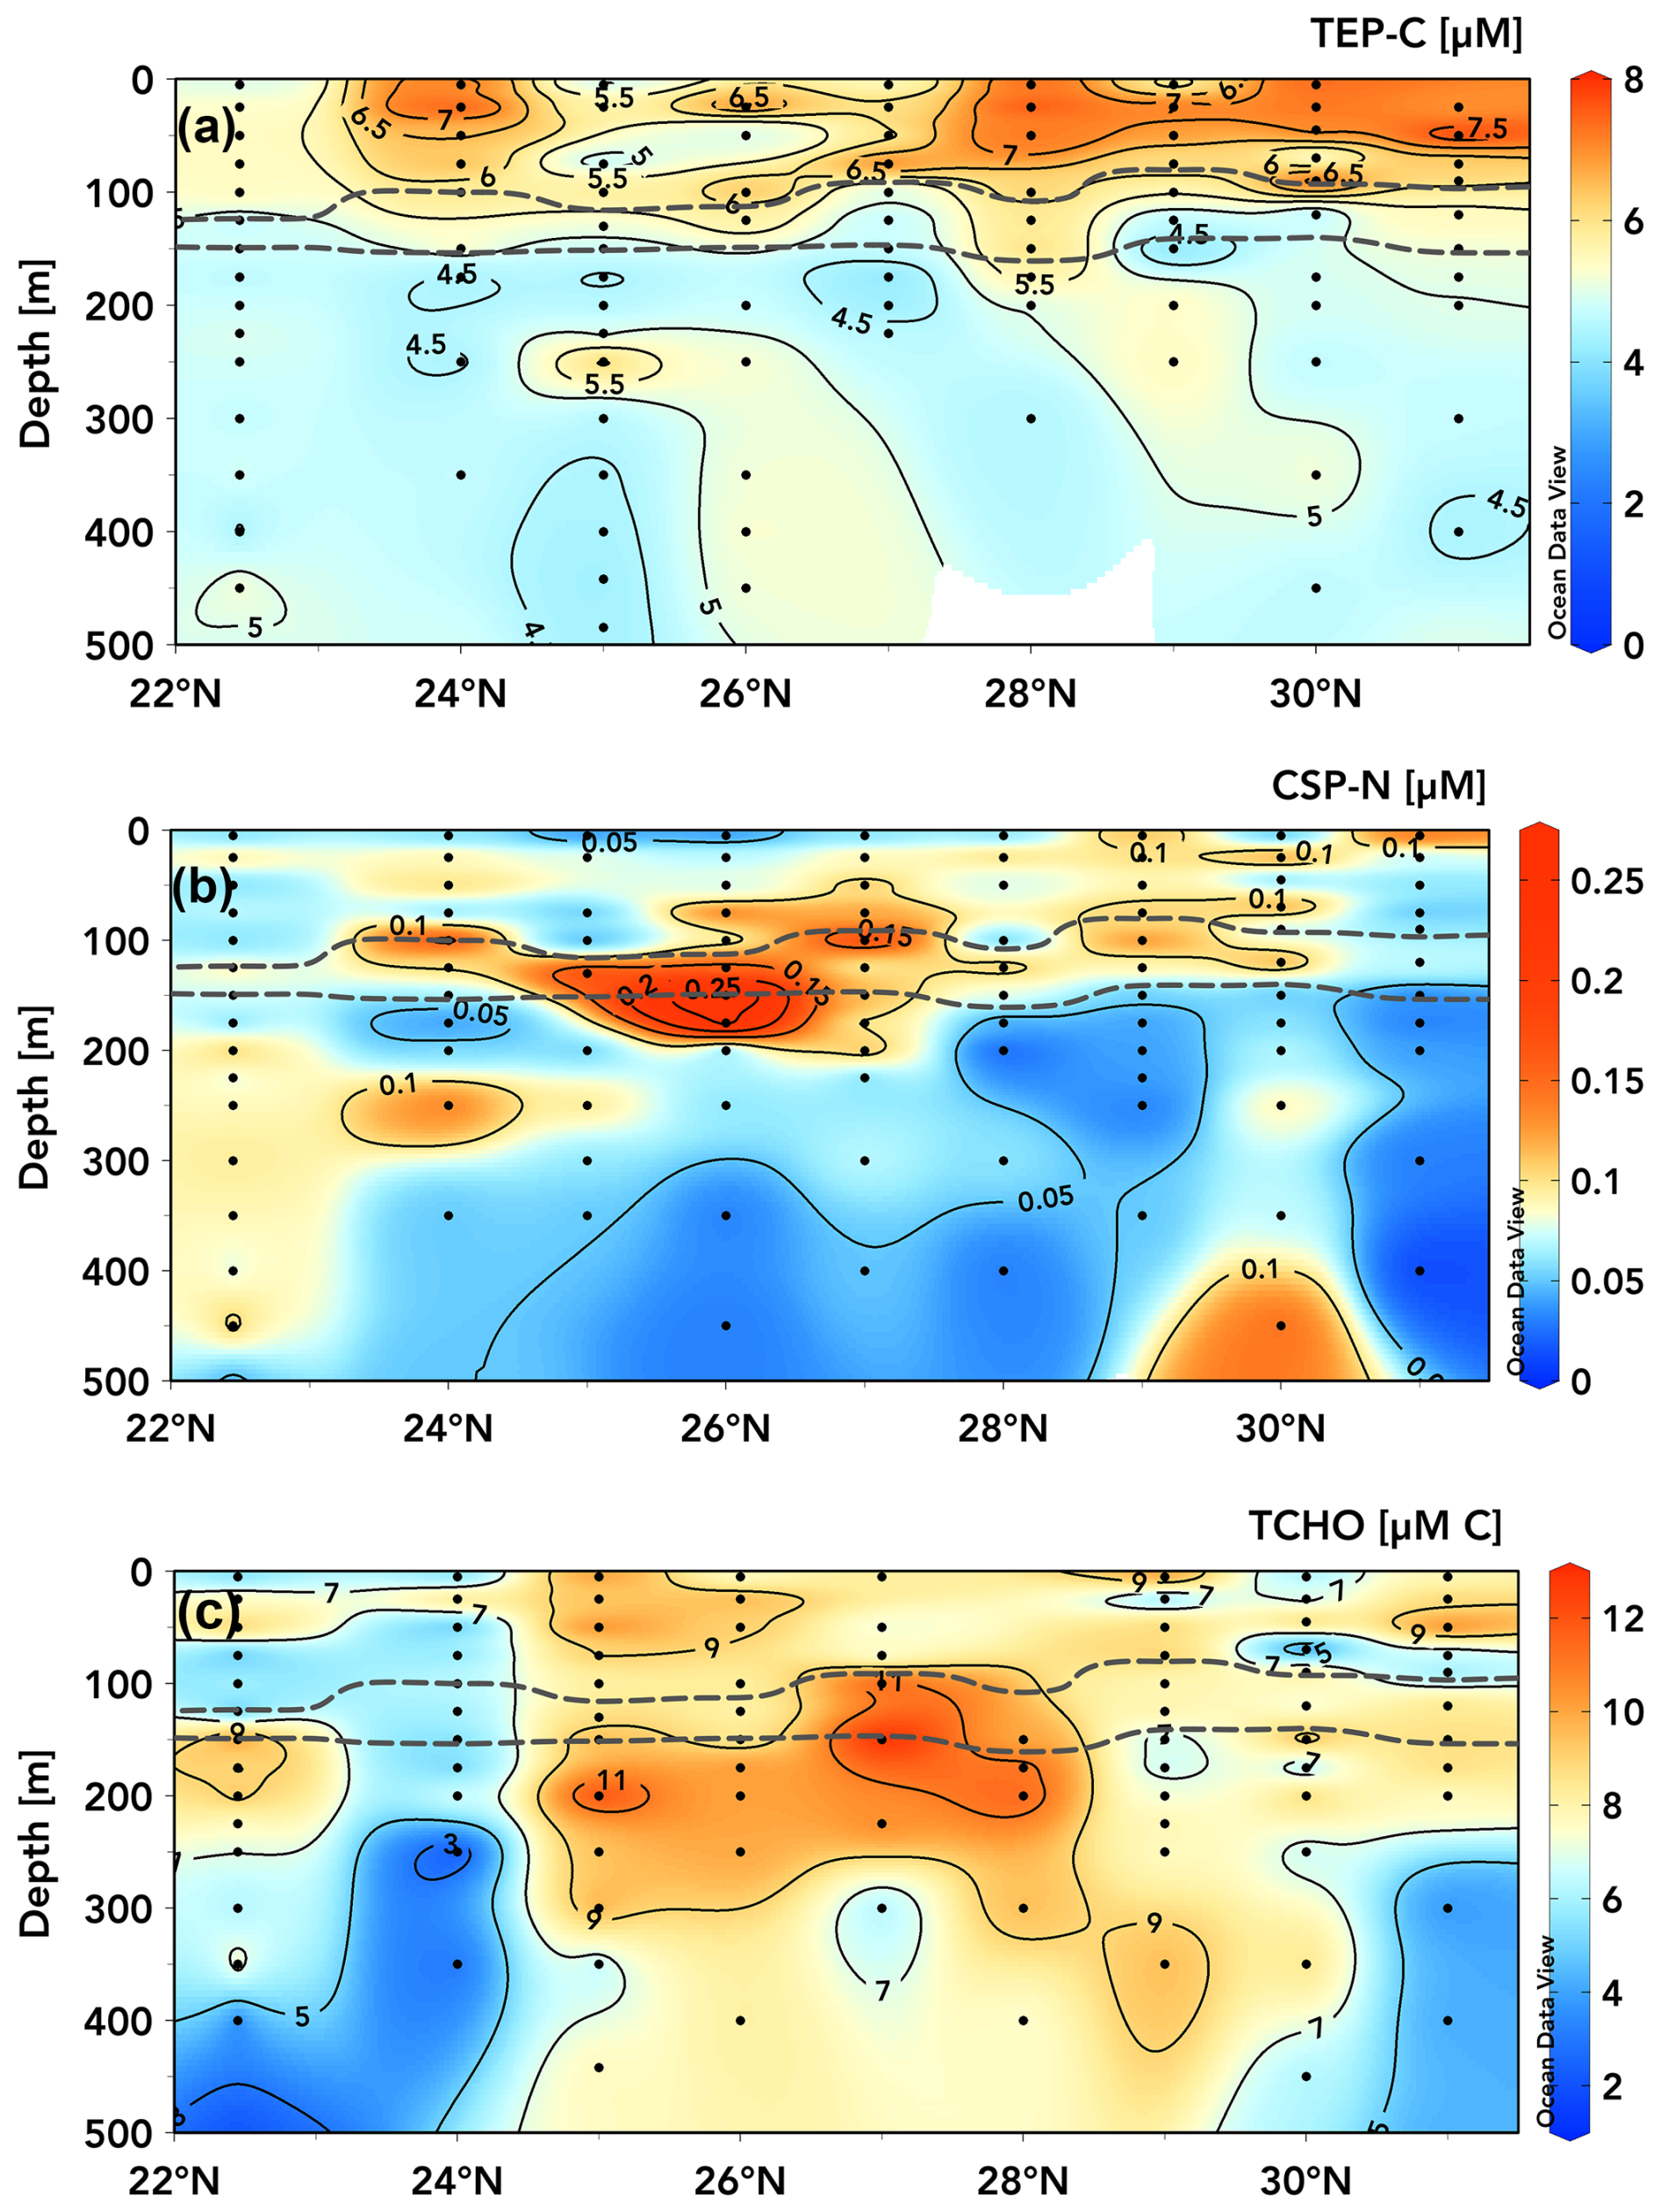
Figure 6TEP-C [µM C] (a), CSP-N [µM N] (b), and TCHO [µM C] concentrations (with contour lines shown) within the upper 500 m measured during the June 2021 transect from 22.75 to 31° N along ∼ 158° W. Dashed grey lines bound elevated CTD-mounted fluorescence, indicating the deep-chlorophyll maximum (Schlitzer, 2025, Ocean Data View, https://odv.awi.de, last access: 15 April 2025).
3.6 TEP, CSP, and TCHO concentrations on the June transect, 22.75 to 31° N
The meridional transects of TEP-C and CSP-N concentrations in the upper 500 m taken between 22.75 and 31° N along ∼ 158° W (Fig. 6) during June 2021 show an increase in upper-ocean (above the subsurface chlorophyll max (grey lines, Fig. 6)) TEP concentrations towards the gyre centre (Fig. 6a), with the two instances of station ALOHA at the beginning and end of the transect separated by 10 d having the lowest integrated TEP concentrations and degree of vertical gradient. From 24 to 31° N, all stations exhibited pronounced vertical gradients in TEP concentrations between the surface and the subsurface chlorophyll max, on the order of ∼ 2–3 µM TEP-C. At stations 24 and 28° N, moderate TEP-C concentrations (5.5–7 µM) extended into the subsurface chlorophyll max, whereas high concentrations (6–8 µM) were restricted to the upper 75 m at 29 and 31° N. It is unclear whether these patterns are attributable to variable TEP production and consumption rates across depths, to the production of buoyant TEPs that are retained in the surface ocean, to surface turbulence and wind forcing either converging TEPs to certain latitudes or variably acting to break apart TEPs, to gradients in phytoplankton nutrient or oxidative stress, or to photoacclimation responses affecting exudate production between sites (Sun et al., 2018; Prairie et al., 2019). It is also of note that most stations exhibited a local increase in TEP-C at ∼ 10–20 m immediately above the top of the subsurface chlorophyll max. The surface maximum in TEP-C present at 28–31° N was ∼ 8 µM (Fig. 6a), similar in magnitude to the surface maxima accumulating seasonally in the station ALOHA time series (Figs. 2a, b, 3a). However, the vertical TEP-C gradients encountered from 24 to 31° N in June 2021 were ∼ 2–3 µM, approximately half those observed seasonally at station ALOHA (Fig. 2b). The observed ∼ 2 µM latitudinal gradient in 0–100 m TEP-C concentrations (e.g. ∼ 5 to ∼ 7 µM at 22.75–24° N and similarly at 25 to 28–31° N; Fig. 6a) may also be attributed to the build-up of less labile or less export-prone (or coagulation efficient) TEPs as waters move towards the gyre interior (Mari et al., 2007; Rochelle-Newall et al., 2010; Mari et al., 2017), a feature that is also observed for the marine DOC pool (Hansell et al., 2009).
The meridional and vertical gradients in CSP-N concentrations (Fig. 6b) throughout the transect did not correspond to those of TEP-C (Fig. 6a). CSP-N concentrations were highest (0.15–0.26 µM) between 75 and 200 m for stations 24–29° N. Profiles at 22.75, 30, and 31° N were more uniform, with moderate CSP-N concentrations (0.05–0.12 µM) observed below 250 m. Elevated CSP concentrations appear to be more closely associated with peak fluorescence signals within the subsurface chlorophyll max (grey lines), while TEPs are most abundant in the surface waters above. This disconnect between TEP and CSP distributions suggests different dynamics in formation, residence time, and decomposition and export process between the two classes of exopolymers (Grossart et al., 2006; Engel et al., 2015; Thornton, 2018).
Measured concentrations of TCHOs varied between ∼ 2.5 and 13 µM C across the June 2021 transect (Fig. 6c). Elevated TCHO concentrations did show some overlap with elevated surface TEP concentrations but were not consistent with TEP concentrations below the subsurface chlorophyll max (Fig. 6c). At many stations, e.g. 25–28° N, TCHO concentrations were elevated (9–12.5 µM) around and below the subsurface chlorophyll max, where TEP-C concentrations were low (4.5–5.5 µM C), but CSP-N concentrations were elevated (> 0.015 µM N). Most stations exhibited vertical gradients between surface or subsurface chlorophyll maxima (≥ 10 µM) and reduced TCHO concentrations (2–8 µM) below 250 m, but some stations were more consistent with depth (24, 29° N), with peak values near the surface. These patterns are generally dissimilar to TEP distributions, which are elevated in surface waters. Measurements from this study were on the lower end of marine dissolved carbohydrate measurements but were consistent with previous measurements taken within the subtropical North Pacific (Pakulski and Benner, 1994), were 30 %–60 % lower than observed across the subtropical Atlantic (Burney et al., 1979; Goldberg et al., 2010), and were 40 %–100 % higher than in the Bay of Bengal and the Arabian Sea (Bhosle et al., 1998).
4.1 TEP, CSP, TCHO, and exopolymer C : N stoichiometry patterns at station ALOHA
A major motivation for this study of exopolymer particle dynamics at station ALOHA was to assess the potential for this organic matter pool to help explain the shallow subsurface negative and euphotic zone positive preNO anomalies and DIC drawdown at this site, which have thus far evaded a complete accounting in the relevant tracer budgets of carbon, oxygen, and nutrients (Johnson et al., 2010; Letscher and Villareal, 2018). DIC drawdown from the surface mixed layer at station ALOHA occurs from ∼ April through October (Keeling et al., 2004), a period of the seasonal cycle that coincides with positive-preNO-anomaly generation in the lower euphotic zone (∼ 40–100 m) and negative-preNO-anomaly generation below (∼ 100–180 m), which are in approximate stoichiometric balance (Letscher and Villareal, 2018). These preNO anomalies suggest biogeochemical processes acting on the oxygen and nitrate pools that produce O2 with little nitrate drawdown in the lower euphotic zone and oxygen consumption with little accumulation of nitrate below in the shallow mesopelagic. Surface ocean production/accumulation of exopolymer particles and their export and subsequent remineralization below the shallow mesopelagic is one candidate biogeochemical process that could help explain the preNO anomaly generation, as well as surface mixed layer DIC drawdown in the absence of nutrient injection. This would be supported if seasonal patterns of these exopolymer dynamics match the April through October timing of peak DIC and preNO changes and if the exopolymer particle pool exhibits elevated C : N stoichiometry, which drive comparatively larger changes in the DIC and O2 pools than nitrate does.
We observe a seasonal pattern for TEP concentrations at station ALOHA that includes elevated concentrations (∼ 4–8 µM C) above ∼ 100 m in the late-spring through early-fall months, with lower concentrations (∼ 1–3 µM C) at these depths in November through March, especially in 2020–2021 (Fig. 2a, b), a pattern that is similar to TEP concentrations at ∼ 100–350 m throughout the year. CSP concentrations are generally similar in pattern; however, there are notable differences such as slightly deeper upper-ocean maxima (e.g. from the surface down to ∼ 120 m), earlier seasonal peaks in the late winter early spring, and seasonal lows (ending by Sep) in the upper 100 m (Fig. 2c, d). The limited data on the exopolymer precursor pool of dissolved TCHOs preclude a complete description of the seasonal cycle; however, the most elevated concentrations (∼ 8–12 µM C) in the upper ∼ 100 m found in early 2021 immediately precede the growth of the seasonal peak in TEPs that year beginning in May (Fig. 2e, b). Viewed as a monthly climatology (Fig. 3a), TEP concentrations in the upper 100 m are at the annual minimum in November through March (< 3 µM C), begin to increase in concentration from April to July, and are maintained at elevated concentrations of ∼ 4–8 µM C through October. TEP concentrations below 100 m are low (< 3 µM C) year-round, with the exception of some intermediate concentrations (∼ 3–5 µM C) in the ∼ 100–350 m depth range in July through October (Fig. 3a), which were more present in 2020 and 2021 than in 2022 (Fig. 2b). The seasonal upper-100 m peak in CSPs is restricted to July and August in the monthly climatology (Fig. 3b), with a wintertime peak also observed (December–January) that was more present in 2020 than 2021 or 2022 (Fig. 2d). The empirically estimated C : N stoichiometry of the exopolymer pool in the upper 125 m is ∼ 1.4–2.1 times more C rich/N poor in June 2021 than in October 2021 (Table 1), suggesting that the seasonal cycles of TEPs and CSPs may drive a seasonal cycle in exopolymer particle stoichiometry, with the most N-poor material found during summer months. All of the above seasonal patterns in euphotic zone and upper-mesopelagic TEP, CSP, and exopolymer particle stoichiometry are consistent with these pools, potentially helping explain the April through October patterns of surface mixed layer DIC drawdown, euphotic zone positive preNO, and subsurface negative preNO anomalies at station ALOHA.
4.2 Contribution of TEP production to net community production and preNO anomalies
Here we use the seasonal study of TEP distributions from the upper 350 m at station ALOHA to quantify TEP's potential contribution to help explain the dual enigmas of significant net community production (DIC drawdown) from the surface mixed layer in the absence of large vertical nutrient inputs and the generation of preNO anomalies within and immediately below the euphotic zone of the subtropical North Pacific. The potential contribution of TEPs to surface excess DIC drawdown and subsurface negative preNO anomalies under nutrient limitation has been previously identified through field and lab observations (Mari et al., 2017; Fawcett et al., 2018; Letscher and Villareal, 2018; Nagata et al., 2021). The seasonal ∼ 4–6 µM TEP-C concentration gradient observed between April and October in the upper 100 m and the waters below in this study at station ALOHA may account for a significant contribution of TEP/exopolymer particles to both the seasonal mixed layer net community production and upper-ocean preNO anomalies through the processes of TEP production, sinking or matter exported during winter mixing, and subsequent remineralization at depth. TEPs may have a significant role in exporting low-N organic matter to underlying waters, particularly during the summer to early-autumn months (Fig. 3) when the seasonal maximum in upper-100 m TEP concentrations extends vertically into the 100–300 m layer, suggestive of vertical sinking.
The 4–6 µM vertical TEP gradient that arises seasonally at station ALOHA, e.g. 5–8 µM in the upper 100 m from April to October decreasing to 1–2 µM below, is higher than that observed by Cisternas-Novoa et al. (2015) (∼ 10 µg XG equiv. µg L−1/∼ 0.5 µM TEP-C) in the Sargasso Sea and by Wurl et al. (2011b) (1.4–3.2 µM TEP-C, with one high-TEP station with a gradient of 27 µM TEP-C) in the subtropical North Pacific when applying the carbon-converted units measured in this study. The wintertime erasure in vertical TEP gradients between the surface and 200 m is observed in February–March and November–December samples from station ALOHA in this study (Fig. 3a), supporting the hypothesis of TEP-C export to a depth of ∼ 100 m at ALOHA and possibly deeper at latitudes further north in the subtropical North Pacific via the seasonal mixed layer pump, which can deliver suspended particulate organic carbon (Dall'Olmo et al., 2016) and DOC (Hansell and Carlson, 2001) to sub-euphotic depths. This may operate in conjunction with the formation of sinking TEP aggregates, which may occur year-round (Mari et al., 2017). As the C : N stoichiometry at station ALOHA was 40 %–110 % greater for summer than for autumn, it seems that exported exopolymer particles from the surface mixed layer to depths below may contribute disproportionally to positive- and negative-preNO-anomaly generation during the summer months at elevated C : N stoichiometry, meaning that respiration associated with sinking exopolymers may have variable O2 drawdown to nitrate release throughout the year.
The background particulate carbon flux at 150 m measured at station ALOHA, 27.8 ± 9.7 mg C m2 d−1 (845 ± 295 mmol C m−2 yr−1; Karl et al., 2021), would seem to indicate that the export of even a portion of the 0–150 m integrated 750 ± 150 mmol C m−2 summer/fall TEP stock by either TEP sinking or by vertical export following winter mixing would be a significant flux of carbon on an annual scale. Furthermore, sediment trap data indicate that particulate matter exported at station ALOHA is typically slightly above Redfieldian C : N proportions, e.g. ∼ 8.0 (Hannides et al., 2009), while TEPs measured in this study varied between 16.4 in October and 34.3 in June (Table 1). The annual net community production rate estimated from the seasonal DIC cycle within the surface mixed layer (∼ 50 m) at station ALOHA is 2.3 ± 0.8 mol m−2 yr−1 (Keeling et al., 2004); thus, the annual production of a surface accumulated TEP-C stock of 0.2–0.3 mol m−2 in the upper 50 m (e.g. ΔTEP = 4–6 mmol C m−3 multiplied by 50 m) may contribute 6.5 %–20 % of the overall net community production estimated from DIC drawdown (e.g. 0.2–0.3 divided by 2.3 ± 0.8 mol C m−2 yr−1) if this material is exported below. The minimum contribution of TEPs to mixed layer net community production is slightly lower, ∼ 3.5 % if the seasonal ΔTEP value of ∼ 2 mmol C m−3 from 2020 is used.
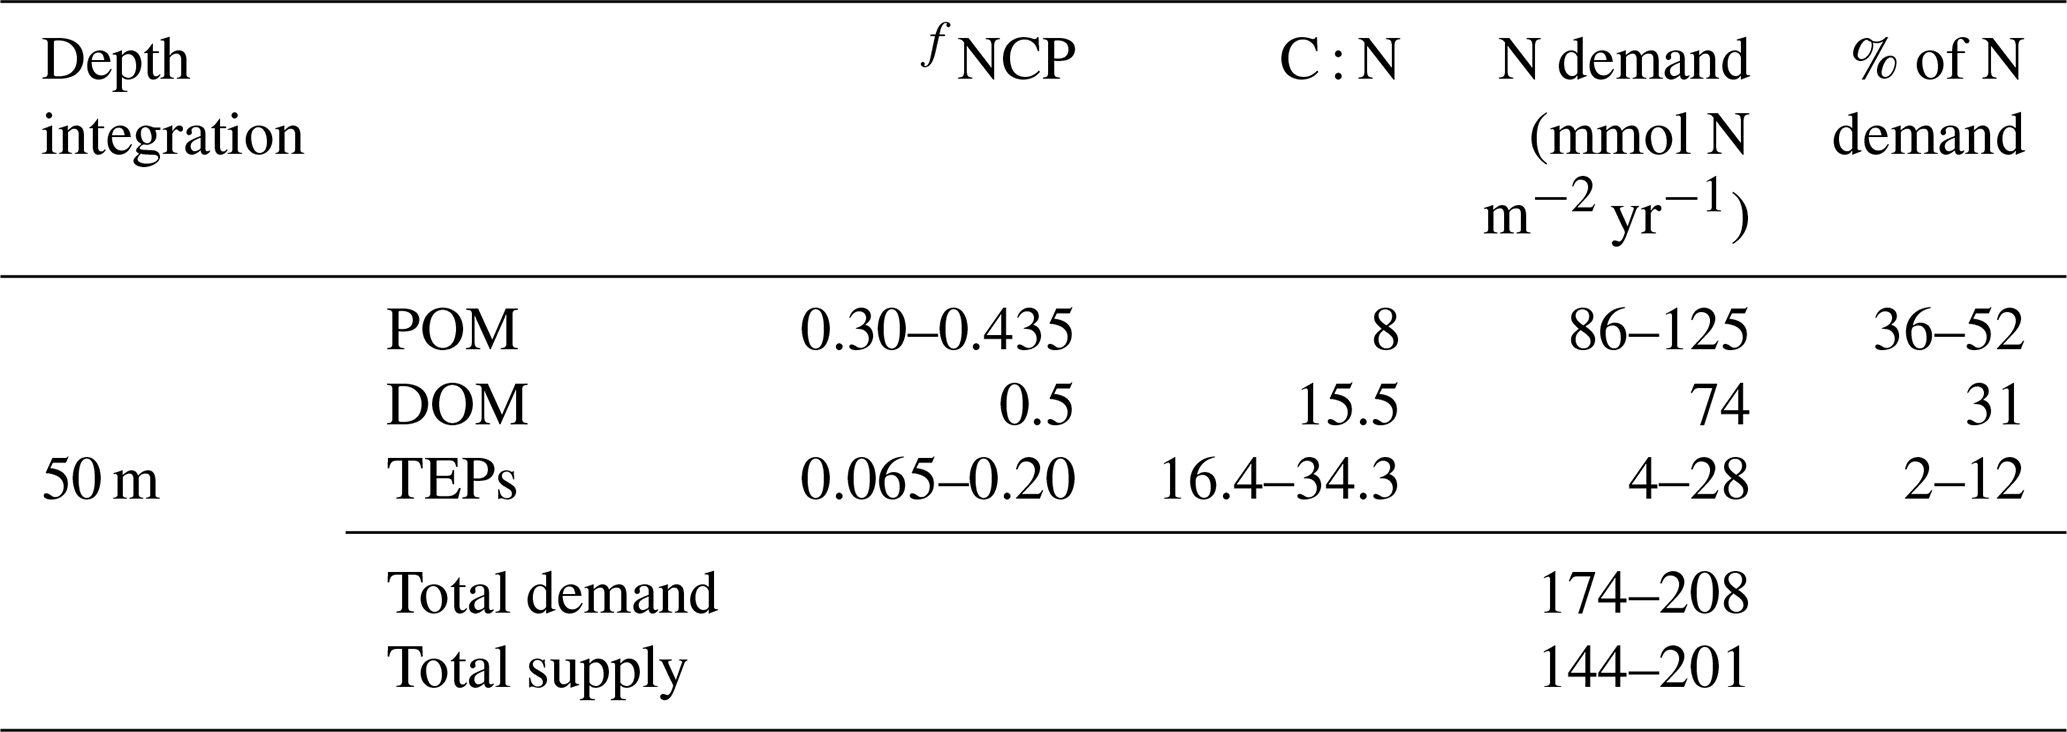
From the calculation above, TEP production within and subsequent export below the surface mixed layer may explain up to 20 % of the total net community production, but how does this estimate compare to the estimates of excess DIC drawdown, that is, DIC drawdown in excess of known N inputs (Johnson et al., 2010) at this site? For this calculation, it is helpful to compute the N demand required to produce the observed net community production rate partitioned amongst the relative proportions explained by the production of POM and DOM. Johnson et al. (2010) computed a total N demand of 287 mmol N m−2 yr−1 at station ALOHA, assuming that total organic matter production followed a C : N stoichiometry of 8.0, matching the sinking POM stoichiometry (Hannides et al., 2009). Letscher and Villareal (2018) empirically determined the fraction of net community production partitioned to DOM at station ALOHA from tracer budgets in upper mesopelagic isopycnal layers from the station ALOHA climatology, finding that ∼ 50 % of net community production is exported as DOM. We have computed the mean DOM C : N stoichiometry in the upper 200 m as 15.5 ± 1.3 from the same climatology. Assuming that net community production is partitioned 50 % / 50 % between POM and DOM with C : N stoichiometries of 8.0 and 15.5, respectively, we compute a revised N demand of 218 mmol N m−2 yr−1 to satisfy the observed 2.3 mol C m−2 yr−1 net community production within the mixed layer (Keeling et al., 2004) for the scenario whereby only POM and DOM contribute to export production. Johnson et al. (2010) summarized total N supply to the mixed layer at station ALOHA, finding a magnitude of 144–201 mmol N m−2 yr−1. Thus, approximately 8 %–34 % (mean = 21 %) of the observed net community production N requirement is not accounted for by the known N supply (i.e. “unexplained”) for the scenario whereby only POM and DOM export contribute to net community production. Our study suggests that exopolymer particles may contribute a third organic matter pool that can be exported to balance net community production. Our estimate of TEP production and its contribution to net community production at this site is 6.5 %–20 %, with an observationally determined C : N stoichiometry of 16.4–34.3 (Table 1). The addition of TEPs into the surface mixed layer net community production budget yields an N demand to explain TEP production of 4–28 mmol N m−2 yr−1, which reduces the revised total N demand of 218 mmol N m−2 yr−1 (after accounting for elevated C : N DOM) even further, to 174–208 mmol N m−2 yr−1. Comparing this N demand to the previously calculated N demand that included POM and DOM but ignored TEPs, TEP contributions to the upper-ocean net community production budget help explain ∼ 57 % of the “unexplained” excess DIC drawdown from the surface mixed layer, i.e. by reducing the overall unexplained drawdown from a mean of ∼ 21 % to ∼ 9 %, which was estimated by comparing the revised N demand for an upper-ocean ecosystem including TEP production of 174–208 mmol N m−2 yr−1 to the estimated N supply of 144–201 mmol N m−2 yr−1 at station ALOHA (Johnson et al., 2010).
Table 2Estimates of the nitrogen demand required to satisfy each fractional contribution (fNCP) of the mixed layer 2.3 mol m−2 yr−1 net community production at station ALOHA partitioned amongst POM, DOM, and TEPs using their respective C : N stoichiometries. Total N supply is taken from Johnson et al. (2010) and includes vertical NO3 fluxes and N2 fixation. fNCPPOM varies as the particulate fraction not attributable to TEPs or DOM (fNCP (fNCPTEP +fNCPDOM)). POM C : N is from Hannides et al. (2009), fNCPDOM is from Letscher and Villareal (2018), DOM C : N is from the upper-200 m average of the station ALOHA climatology, and fNCPTEP and TEP C : N (Table 1) are from this study. N demand is computed from 2.3 mol C m−2 yr−1 divided by C : N multiplied by fNCP.
Lastly, we compare the seasonal TEP cycle observed at station ALOHA in 2020–2022 to previous estimates of the formation rates of residual preNO anomalies within and immediately below the euphotic zone. Letscher and Villareal (2018) estimated that the seasonal (∼ April–October) development of a residual positive preNO anomaly (i.e. the residual anomaly after accounting for non-Redfield POM and DOM stoichiometry) within the upper 100 m had a climatological magnitude of 0.53 ± 0.27 µM N. A similar seasonal negative preNO anomaly develops between ∼ 100 and 180 m, with a climatological magnitude of −0.54 ± 0.25 µM N over a ∼ 180 d period from April to October, consistent with surface TEP accumulation before winter mixing (Fig. 2). With an assumed 1:1 C : O2 stoichiometry of TEP formation and remineralization (as for nearly pure carbohydrate material), the consumption of 4–6 µM seasonally exported TEP-C (at a C : N ratio of 25 ± 8) should release the equivalent of 0.12–0.35 µM nitrate, which is 23 %–67 % of the 0.53 µM mean residual negative preNO anomaly and 22 %–64 % of the 0.54 µM mean residual positive preNO anomaly. These values for TEPs' potential contribution to preNO anomalies assume the export of surface TEPs to underlying waters (100–200 m) where they are subsequently remineralized. If a large proportion of seasonal TEP production is quickly exported to the deeper mesopelagic through aggregation and gravitational settling or winter mixing, then these values will likely be overestimates. The remaining mechanisms to explain the remainder of preNO anomaly formation include mining of sub-euphotic zone nitrate by vertically migrating phytoplankton (Pilskaln et al., 2005; Villareal et al., 2014) and heterotrophic bacterial uptake of nitrate when consuming C-rich organic matter such as TEPs (Fawcett et al., 2018).
Finally, we note that moderate concentrations of TEPs at 150–350 m (3–5 µM C) are present throughout the late-summer to early-autumn months at station ALOHA (Figs. 2b, 3a), but whether these concentrations represent matter exported from the surface or subsurface chlorophyll max below the depth of the negative preNO anomaly (∼ 100–180 m; Letscher and Villareal, 2018) or whether they represent separate activity in the upper mesopelagic is unclear. Compositional analysis of TEP molecules and polysaccharide-associated enzymes throughout the water column and over an annual cycle may elucidate sources and sinks of TEPs beyond physical sinking and mixing processes.
4.3 TEP, CSP, and TCHO meridional patterns in the NPSG
Previous observations of TEP and CSP concentrations in high-latitude oceans and temperate shelf seas have observed that both exopolymers are coupled to chlorophyll distributions (Beauvais et al., 2003; Busch et al., 2017; Nosaka et al., 2017; Anastasi, 2025; von Jackowski et al., 2020). Other midlatitude regions such as the Sargasso Sea (Cisternas-Novoa et al., 2015) and Catalan Sea (Zamanillo et al., 2021) exhibit different dynamics, where TEPs are disconnected from CSP distributions, as was observed in this study in the subtropical North Pacific.
Exopolymers measured across the upper 500 m of the subtropical North Pacific in June 2021 (Fig. 6) were found to have depth gradients similar to those under summertime conditions at station ALOHA (Figs. 2, 3), with elevated concentrations in surface waters for TEPs, around the subsurface chlorophyll max for CSPs, and lower concentrations below in the shallow mesopelagic. There are also meridional gradients present (Fig. 6) with increasing surface ocean TEP concentrations northwards towards 31° N, while CSPs are most elevated at 24–30° N. Without additional data on TEP/exopolymer molecular composition, it is difficult to ascertain whether this meridional gradient represents accumulation of more refractory TEPs or enhanced production/depressed export from waters towards 31° N. However, this TEP meridional gradient matches that observed for surface ocean DOC in the region (Abell et al., 2000), which is thought to arise from the convergence of a semilabile component of DOC with lifetimes of years supplied by the Ekman circulation across subtropical gyres (Hansell et al., 2009). The C : N stoichiometry of the exopolymer particle pool was also found to increase from station ALOHA to 31° N at both the surface (∼ 26 vs. ∼ 33) and 125 m (∼ 34 vs. ∼ 38) (Table 1). Dissolved TCHOs were more elevated (> 7 µM C) north of 24° N as well (Fig. 6c). The observed disconnect between TEP and TCHO distributions may be attributed to both formation and degradation processes: precursors are created around the subsurface chlorophyll max by phytoplankton and the resultant low-density TEPs concentrating in surface waters or sinking TEPs are hydrolyzed below the subsurface chlorophyll max by bacteria, yielding reduced TCHO concentrations. The latter process is consistent with the hypothesized remineralization of low-N organic matter requiring heterotrophic nitrate uptake, generating a negative preNO anomaly (Fawcett et al., 2018). Compositional analysis of TEPs, dissolved sugars, and stable isotopic measurements of the relevant nutrient and organic matter N contents through the upper 400 m would help confirm. Lastly, a lack of spatiotemporal coherence in the distributions of TEPs and the precursor TCHOs may result from the differing timescales over which they are biotically cycled, with the latter possibly processed 3–10 times faster by bacteria than other common labile organic materials like amino acids in open-ocean environments (Kaiser and Benner, 2012).
The meridional patterns observed in TEP, CSP, TCHO, and exopolymer particle C : N stoichiometry all suggest that the contributions of exopolymer particle dynamics to upper-ocean net community production, export, and nutrient cycling diagnosed at station ALOHA (Sect. 4.2) may play a larger role further north towards the core of the subtropical North Pacific gyre. While the TEP concentrations measured in this study were low (∼ 2–15 XG equiv. µg L−1; 1–8 µM C) compared to those in other regions (e.g. ∼ 20–40 XG equiv. µg L−1 in the Sargasso Sea, Cisternas-Novoa et al., 2015 and ∼ 1–20 µM C in the tropical North Pacific, Wurl et al., 2011b), their highly carbon-enriched stoichiometry (particularly in summer with C : N = 26–38) means that these particles are a significant component of the upper-ocean organic matter pool. The seasonal and latitudinal variation that we observed in carbon and nitrogen conversion factors suggest that using a single factor will bias many estimates of TEP-C and CSP-N from dye-binding assays. We therefore hope that more effort will be made in future studies to constrain TEP and CSP elemental stoichiometry to compare exopolymer concentrations from different depths, seasons, and locations with greater confidence.
The seasonal, interannual, and meridional variation in the TEPs and CSPs observed in this study reinforce the building evidence that exopolymer production, accumulation, and remineralization are not static processes, even in oligotrophic regions (Radić et al., 2006; Cisternas-Novoa et al., 2015; Engel et al., 2015; Zäncker et al., 2017). Further process experiments that incorporate TEP and CSP dynamics with respect to other biological and chemical parameters are needed to understand the biogeochemistry of each exopolymer type for a given location and season, aiding efforts to model both with respect to other parameters through depth and time at a synoptic scale. Work that helps to validate the sources and sinks of exopolymers within the water column is particularly important to quantify how much carbon is exported from or cycled within surface waters (including the surface microlayer) and where these molecules are remineralized. Compositional analysis of TEP and dissolved carbohydrate compositions and associated proteomic or transcriptomic analyses may elucidate the vertical distribution of TEP production, enzymatic hydrolyzation, and remineralization of the resulting labile monomeric sugars.
TEP concentrations measured with the Alcian Blue spectrophotometric method and converted to µM C with our empirically derived carbon conversion factors were found to be greater than GF/F collected particulate carbon measurements from the Hawaiian Ocean time series. Additionally, the estimated C : N stoichiometry of 16.4–38.1 for exopolymer particles from this study is significantly C rich/N poor relative to the C : N of the sinking flux collected in sediment traps at station ALOHA, 8.0 (Hannides et al., 2009). This supports the hypotheses that TEPs and marine microgels may be “missed” by traditional sampling techniques for sinking and suspended particulate organic carbon (Quigg et al., 2021), possibly due to disaggregation of the gel particles upon encountering the GF/F filter or the collection brine of sediment traps, as well as potential rapid microbial remineralization within trap cups (Fawcett et al., 2018, and references therein). Future research is required to resolve the mechanisms leading to inefficient collection of TEPs within standard marine particle sampling protocols and to fully integrate TEPs and marine gels sampling within marine carbon biogeochemistry studies. Further work is also needed to ascertain the degree to which exopolymer particles are exported below the surface ocean via slow gravitational sinking and/or vertical mixing within the seasonal mixed layer pump (Quigg et al., 2021; Mari et al., 2017).
Although TEP sinking rates, remineralization rates, and C : O2 respiration stoichiometry are not addressed in this dataset, previous studies in analogous regions indicate that the summertime production of highly non-Redfieldian exopolymers and potential winter export observed in this time series may explain a significant portion of subtropical positive and negative preNO anomalies (22 %–67 %), consistent with this mechanism's description and modelling by Letscher and Villareal (2018). Uncertainty regarding the contribution of TEPs/exopolymers to preNO anomalies (and excess DIC drawdown) primarily results from variability in the total TEP upper-ocean accumulation and its C : N ratio, with some evidence for seasonal, vertical, and meridional differences in these ratios evidenced by this study. The upper-ocean exopolymer cycle helps to close the C, N, and O2 budgets at station ALOHA by contributing 8.5 %–20 % of net community production and by reducing the “missing” mixed layer DIC drawdown and N supply by ∼ 57 % and ∼ 12 %, respectively, while leaving room for significant contributions from other processes, such as vertically migrating phytoplankton and heterotrophic nitrate uptake, to be further validated. More frequent measurements of TEP concentrations and their stoichiometry from the subtropical North Pacific and elsewhere would help quantify this potentially overlooked component of the ocean's biological pump operating across the vast subtropical gyres.
The data reported in this study are available at https://www.bco-dmo.org/project/772658 (Letscher and Curran, 2025a, b).
RTL and TV conceptualized this study as part of NSF grants 1923687 and 1923667 “Transparent exopolymer and phytoplankton vertical migration as sources for preformed nitrate anomalies in the subtropical N. Pacific Ocean”. KC and RTL performed fieldwork; KC performed laboratory analyses for TEPs, CSPs, and TCHOs and the respective data analyses. KC, RTL, and TV contributed to writing and editing.
The contact author has declared that none of the authors has any competing interests.
Publisher’s note: Copernicus Publications remains neutral with regard to jurisdictional claims made in the text, published maps, institutional affiliations, or any other geographical representation in this paper. While Copernicus Publications makes every effort to include appropriate place names, the final responsibility lies with the authors.
We would like to thank the crew and technicians aboard the RV Kilo Moana for their assistance in collecting samples through the COVID pandemic and for assisting during the June 2021 transect cruise. We are grateful to Angelicque White (UH-Manoa) for her assistance and leadership in accommodating the TEP, CSP, and TCHO sampling on the 2020–2022 HOT cruises and to Brandon Brenes (UH-Manoa) for much of the sample collection at sea. We also wish to thank former UNH graduate students Jessica Grey and Sarah Benson for their assistance with sampling during the 2021 cruise. Data from the Hawaiian Ocean time series were obtained via the Hawaii Ocean time series HOT-DOGS application, University of Hawai'i at Mānoa, National Science Foundation Award no. 1756517.
This research has been supported by the Directorate for Geosciences, Division of Ocean Sciences (grant nos. 1923687 to Robert T. Letscher and 1923667 to Tracy A. Villareal).
This paper was edited by Julia Uitz and reviewed by three anonymous referees.
Abell, J., Emerson, S., and Renaud, P.: Distributions of TOP, TON and TOC in the North Pacific subtropical gyre: Implications for nutrient supply in the surface ocean and remineralization in the upper thermocline, J. Mar. Res., 58, 203–222, 2000.
Abell, J., Emerson, S., and Keil, R. G.: Using preformed nitrate to infer decadal changes in DOM remineralization in the subtropical North Pacific, Global Biogeochem. Cy., 19, GB1008, https://doi.org/10.1029/2004GB002285, 2005.
Anastasi, G.: Observations and modelling of transparent exopolymer particles (TEP) and their role in carbon cycling in shelf seas, University of East Anglia Digital Repository, 237, https://ueaeprints.uea.ac.uk/id/eprint/70104 (last access: 12 December 2023), 2025.
Annane, S., St-Amand, L., Starr, M., Pelletier, E., and Ferreyra, G. A.: Contribution of transparent exopolymeric particles (TEP) to estuarine particulate organic carbon pool, Mar. Ecol. Prog. Ser., 529, 17–34, https://doi.org/10.3354/meps11294, 2015.
Arnosti, C., Wietz, M., Brinkhoff, T., Hehemann, J.-H., Probandt, D., Zeugner, L., and Amann, R.: The Biogeochemistry of Marine Polysaccharides: Sources, Inventories, and Bacterial Drivers of the Carbohydrate Cycle, Annu. Rev. Mar. Sci., 13, 81–108, https://doi.org/10.1146/annurev-marine-032020-012810, 2021.
Ascani, F., Richards, K. J., Firing, E., Grant, S., Johnson, K. S., Jia, Y., Lukas, R., and Karl, D. M.: Physical and biological controls of nitrate concentrations in the upper subtropical North Pacific Ocean, Deep-Sea Res. Pt. II, 93, 119–134, https://doi.org/10.1016/j.dsr2.2013.01.034, 2013.
Azetsu-Scott, K. and Passow, U.: Ascending marine particles: Significance of transparent exopolymer particles (TEP) in the upper ocean, Limnol. Oceanogr., 49, 741–748, https://doi.org/10.4319/lo.2004.49.3.0741, 2004.
Bar-Zeev, E., Berman, T., Rahav, E., Dishon, G., Herut, B., Kress, N., and Berman-Frank, I.: Transparent exopolymer particle (TEP) dynamics in the eastern Mediterranean Sea, Mar. Ecol. Prog. Ser., 431, 107–118, https://doi.org/10.3354/meps09110, 2011.
Beauvais, S., Pedrotti, M. L., Villa, E., and Lemée, R.: Transparent exopolymer particle (TEP) dynamics in relation to trophic and hydrological conditions in the NW Mediterranean Sea, Mar. Ecol. Prog. Ser., 262, 97–109, https://doi.org/10.3354/meps262097, 2003.
Berman-Frank, I., Rosenberg, G., Levitan, O., Haramaty, L., and Mari, X.: Coupling between autocatalytic cell death and transparent exopolymeric particle production in the marine cyanobacterium Trichodesmium, Environ. Microbiol., 9, 1415–1422, https://doi.org/10.1111/j.1462-2920.2007.01257.x, 2007.
Bhosle, N. B., Bhaskar, P. V., and Ramachandran, S.: Abundance of dissolved polysaccharides in the oxygen minimum layer of the Northern Indian Ocean, Mar. Chem., 63, 171–182, https://doi.org/10.1016/S0304-4203(98)00061-9, 1998.
Bittar, T. B., Passow, U., Hamaraty, L., Bidle, K. D., and Harvey, E. L.: An updated method for the calibration of transparent exopolymer particle measurements, Limnol. Oceanogr. Method., 16, 621–628, 2018.
Böttjer, D., Dore, J. E., Karl, D. M., Letelier, R. M., Mahaffey, C., Wilson, S. T., Zehr, J., and Church, M. J.: Temporal variability of nitrogen fixation and particulate nitrogen export at Station ALOHA, Limnol. Oceanogr., 62, 200–216, https://doi.org/10.1002/lno.10386, 2017.
Buesseler, K. O., Antia, A. N., Chen, M., Fowler, S. W., Gardner, W. D., Gustafsson, O., Harada, K., Michaels, A. F., Rutgers van der Loeff, M., Sarin, M., Steinberg, D. K., and Trull, T.: An assessment of the use of sediment traps for estimating upper ocean particle fluxes, J. Mar. Res., 65, 345–416, https://doi.org/10.1357/002224007781567621, 2007.
Burney, C. M., Johnson, K. M., Lavoie, D. M., and Sieburth, J. McN.: Dissolved carbohydrate and microbial ATP in the North Atlantic: concentrations and interactions, Deep-Sea Res. Pt. A, 26, 1267–1290, https://doi.org/10.1016/0198-0149(79)90068-2, 1979.
Busch, K., Endres, S., Iversen, M. H., Michels, J., Nöthig, E.-M., and Engel, A.: Bacterial Colonization and Vertical Distribution of Marine Gel Particles (TEP and CSP) in the Arctic Fram Strait, Front. Mar. Sci., 4, 166, https://doi.org/10.3389/fmars.2017.00166, 2017.
Chin, W.-C., Orellana, M. V., and Verdugo, P.: Spontaneous assembly of marine dissolved organic matter into polymer gels, Nature, 391, 568–572, https://doi.org/10.1038/35345, 1998.
Chow, C. H., Cheah, W., and Tai, J.-H.: A rare and extensive summer bloom enhanced by ocean eddies in the oligotrophic western North Pacific Subtropical Gyre, Sci. Rep., 7, 6199, https://doi.org/10.1038/s41598-017-06584-3, 2017.
Cisternas-Novoa, C., Lee, C., and Engel, A.: Transparent exopolymer particles (TEP) and Coomassie stainable particles (CSP): Differences between their origin and vertical distributions in the ocean, Mar. Chem., 175, 56–71, https://doi.org/10.1016/j.marchem.2015.03.009, 2015.
Dall'Olmo, G., Dingle, J., Polimene, L., Brewin, R. J., and Claustre, H.: Substantial energy input to the mesopelagic ecosystem from the seasonal mixed-layer pump, Nat. Geosci., 9, 820–823, 2016.
Dave, A. C. and Lozier, M. S.: Local stratification control of marine productivity in the subtropical North Pacific, J. Geophys. Res.-Ocean., 115, C12032, https://doi.org/10.1029/2010JC006507, 2010.
Emerson, S.: Annual net community production and the biological carbon flux in the ocean, Global Biogeochem. Cy., 28, 14–28, https://doi.org/10.1002/2013GB004680, 2014.
Emerson, S. and Hayward, T.: Chemical tracers of biological processes in shallow waters of North Pacific: preformed nitrate distributions, J. Mar. Res., 53, 499–513, 1995.
Emerson, S., Quay, P., Karl, D., Winn, C., Tupas, L., and Landry, M.: Experimental determination of the organic carbon flux from open-ocean surface waters, Nature, 389, 951–954, https://doi.org/10.1038/40111, 1997.
Engel, A. and Passow, U.: Carbon and nitrogen content of transparent exopolymer particles (TEP) in relation to their Alcian Blue adsorption, Mar. Ecol. Prog. Ser., 219, 1–10, https://doi.org/10.3354/meps219001, 2001.
Engel, A., Borchard, C., Loginova, A., Meyer, J., Hauss, H., and Kiko, R.: Effects of varied nitrate and phosphate supply on polysaccharidic and proteinaceous gel particle production during tropical phytoplankton bloom experiments, Biogeosciences, 12, 5647–5665, https://doi.org/10.5194/bg-12-5647-2015, 2015.
Engel, A., Endres, S., Galgani, L., and Schartau, M.: Marvelous Marine Microgels: On the Distribution and Impact of Gel-Like Particles in the Oceanic Water-Column, Front. Mar. Sci., 7, 405, https://doi.org/10.3389/fmars.2020.00405, 2020.
Fawcett, S. E., Johnson, K. S., Riser, S. C., Van Oostende, N., and Sigman, D. M.: Low-nutrient organic matter in the Sargasso Sea thermocline: A hypothesis for its role, identity, and carbon cycle implications, Mar. Chem., 207, 108–123, https://doi.org/10.1016/j.marchem.2018.10.008, 2018.
Goldberg, S. J., Carlson, C. A., Bock, B., Nelson, N. B., and Siegel, D. A.: Meridional variability in dissolved organic matter stocks and diagenetic state within the euphotic and mesopelagic zone of the North Atlantic subtropical gyre, Mar. Chem., 119, 9–21, https://doi.org/10.1016/j.marchem.2009.12.002, 2010.
Grossart, H.-P., Czub, G., and Simon, M.: Algae–bacteria interactions and their effects on aggregation and organic matter flux in the sea, Environ. Microbiol., 8, 1074–1084, https://doi.org/10.1111/j.1462-2920.2006.00999.x, 2006.
Gruber, N., Keeling, C. D., and Stocker, T. F.: Carbon-13 constraints on the seasonal inorganic carbon budget at the BATS site in the northwestern Sargasso Sea, Deep-Sea Res. Pt. I, 45, 673–717, https://doi.org/10.1016/S0967-0637(97)00098-8, 1998.
Guo, S., Wu, Y., Zhu, M., and Sun, X.: Concentrations of transparent exopolymer particles (TEPs) and their role in the carbon export in the South China Sea and western tropical North Pacific, Mar. Environ. Res., 179, 105699, https://doi.org/10.1016/j.marenvres.2022.105699, 2022.
Hannides, C. C. S., Popp, B. N., Landry, M. R., and Graham, B. S.: Quantification of zooplankton trophic position in the North Pacific Subtropical Gyre using stable nitrogen isotopes, Limnol. Oceanogr., 54, 50–61, https://doi.org/10.4319/lo.2009.54.1.0050, 2009.
Hansell, D. A. and Carlson, C. A.: Biogeochemistry of total organic carbon and nitrogen in the Sargasso Sea: control by convective overturn, Deep-Sea Res. Pt. II, 48, 1649–1667, 2001.
Hansell, D. A., Carlson, C. A., Repeta, D. J., and Schlitzer, R.: Dissolved organic matter in the ocean: A controversy stimulates new insights, Oceanography, 22, 202–211, 2009.
Iuculano, F., Mazuecos, I. P., Reche, I., and Agustí, S.: Prochlorococcus as a Possible Source for Transparent Exopolymer Particles (TEP), Front. Microbiol., 8, 709, https://doi.org/10.3389/fmicb.2017.00709, 2017.
Johnson, K. S., Riser, S. C., and Karl, D. M.: Nitrate supply from deep to near-surface waters of the North Pacific subtropical gyre, Nature, 465, 1062–1065, https://doi.org/10.1038/nature09170, 2010.
Kaiser, K. and Benner, R.: Organic matter transformations in the upper mesopelagic zone of the North Pacific: Chemical composition and linkages to microbial community structure, J. Geophys. Res.-Ocean., 117, C01023, https://doi.org/10.1029/2011JC007141, 2012.
Karl, D. M., Church, M. J., Dore, J. E., Letelier, R. M., and Mahaffey, C.: Predictable and efficient carbon sequestration in the North Pacific Ocean supported by symbiotic nitrogen fixation, P. Natl. Acad. Sci. USA, 109, 1842–1849, https://doi.org/10.1073/pnas.1120312109, 2012.
Karl, D. M., Letelier, R. M., Bidigare, R. R., Björkman, K. M., Church, M. J., Dore, J. E., and White, A. E.: Seasonal-to-decadal scale variability in primary production and particulate matter export at Station ALOHA, Prog. Oceanogr., 195, 102563, https://doi.org/10.1016/j.pocean.2021.102563, 2021.
Keeling, C. D., Brix, H., and Gruber, N.: Seasonal and long-term dynamics of the upper ocean carbon cycle at Station ALOHA near Hawaii, Global Biogeochem. Cy., 18, GB4006, https://doi.org/10.1029/2004GB002227, 2004.
Letelier, R. M., Björkman, K. M., Church, M. J., Hamilton, D. S., Mahowald, N. M., Scanza, R. A., Schneider, N., White, A. E., and Karl, D. M.: Climate-driven oscillation of phosphorus and iron limitation in the North Pacific Subtropical Gyre, P. Natl. Acad. Sci. USA, 116, 12720–12728, https://doi.org/10.1073/pnas.1900789116, 2019.
Letscher, R. T. and Curran, K.: TEP and CSP particles collected from Station ALOHA for HOT time series during R/V Kilo Moana cruises from Jan 2020 to Sep 2022, Biological and Chemical Oceanography Data Management Office (BCO-DMO) [data set], https://doi.org/10.26008/1912/bco-dmo.968732.1, 2025.
Letscher, R. T. and Curran, K.: TEP and CSP particle concentrations from samples collected from Station ALOHA to 31° N in the North Pacific in June 2021 on the R/V Kilo Moana cruise KM2108, Biological and Chemical Oceanography Data Management Office (BCO-DMO) [data set], https://doi.org/10.26008/1912/bco-dmo.968636.1, 2025.
Letscher, R. T. and Moore, J. K.: Preferential remineralization of dissolved organic phosphorus and non‐Redfield DOM dynamics in the global ocean: Impacts on marine productivity, nitrogen fixation, and carbon export, Global Biogeochem. Cy., 29, 325–340, 2015.
Letscher, R. T. and Villareal, T. A.: Evaluation of the seasonal formation of subsurface negative preformed nitrate anomalies in the subtropical North Pacific and North Atlantic, Biogeosciences, 15, 6461–6480, https://doi.org/10.5194/bg-15-6461-2018, 2018.
Liang, Z., Letscher, R. T., and Knapp, A. N.: Global patterns of surface ocean dissolved organic matter stoichiometry, Global Biogeochem. Cy., 37, e2023GB007788, https://doi.org/10.1029/2023GB007788, 2023.
Ling, S. C. and Alldredge, A. L.: Does the marine copepod Calanus pacificus consume transparent exopolymer particles (TEP)?, J. Plankton Res., 25, 507–515, https://doi.org/10.1093/plankt/25.5.507, 2003.
Long, J., Fassbender, A., and Estapa, M.: Depth-Resolved Net Primary Production in the Northeast Pacific Ocean: A Comparison of Satellite and Profiling Float Estimates in the Context of Two Marine Heatwaves, Geophys. Res. Lett., 48, e2021GL093462, https://doi.org/10.1029/2021GL093462, 2021.
Longhurst, A., Sathyendranath, S., Platt, T., and Caverhill, C.: An estimate of global primary production in the ocean from satellite radiometer data, J. Plankton Res., 17, 1245–1271, https://doi.org/10.1093/plankt/17.6.1245, 1995.
Mari, X., Beauvais, S., Lemée, R., and Pedrotti, M. L.: Non-Redfield C : N ratio of transparent exopolymeric particles in the northwestern Mediterranean Sea, Limnol. Oceanogr., 46, 1831–1836, https://doi.org/10.4319/lo.2001.46.7.1831, 2001.
Mari, X., Rochelle-Newall, E., Torréton, J.-P., Pringault, O., Jouon, A., and Migon, C.: Water residence time: A regulatory factor of the DOM to POM transfer efficiency, Limnol. Oceanogr., 52, 808–819, https://doi.org/10.4319/lo.2007.52.2.0808, 2007.
Mari, X., Passow, U., Migon, C., Burd, A. B., and Legendre, L.: Transparent exopolymer particles: Effects on carbon cycling in the ocean, Prog. Oceanogr., 151, 13–37, https://doi.org/10.1016/j.pocean.2016.11.002, 2017.
Martiny, A. C., Pham, C. T., Primeau, F. W., Vrugt, J. A., Moore, J. K., Levin, S. A., and Lomas, M. W.: Strong latitudinal patterns in the elemental ratios of marine plankton and organic matter, Nat. Geosci., 6, 279–283, 2013.
McCarthy, M., Hedges, J., and Benner, R.: Major biochemical composition of dissolved high molecular weight organic matter in seawater, Mar. Chem., 55, 281–297, https://doi.org/10.1016/S0304-4203(96)00041-2, 1996.
Meers, E., Laing, G. D., Unamuno, V. G., Lesage, E., Tack, F. M. G., and Verloo, M. G.: Water Extractability of Trace Metals from Soils: Some Pitfalls, Water Air Soil Pollut., 176, 21–35, https://doi.org/10.1007/s11270-005-9070-1, 2006.
Michaels, A. F., Bates, N. R., Buesseler, K. O., Carlson, C. A., and Knap, A. H.: Carbon-cycle imbalances in the Sargasso Sea, Nature, 372, 537–540, https://doi.org/10.1038/372537a0, 1994.
Myklestad, S. M., Skånøy, E., and Hestmann, S.: A sensitive and rapid method for analysis of dissolved mono-and polysaccharides in seawater, Mar. Chem., 56, 279–286, 1997.
Nagata, T., Yamada, Y., and Fukuda, H.: Transparent Exopolymer Particles in Deep Oceans: Synthesis and Future Challenges, Gels, 7, 75, https://doi.org/10.3390/gels7030075, 2021.
Nosaka, Y., Yamashita, Y., and Suzuki, K.: Dynamics and Origin of Transparent Exopolymer Particles in the Oyashio Region of the Western Subarctic Pacific during the Spring Diatom Bloom, Front. Mar. Sci., 4, 79, https://doi.org/10.3389/fmars.2017.00079, 2017.
Ortega-Retuerta, E., Passow, U., Duarte, C. M., and Reche, I.: Effects of ultraviolet B radiation on (not so) transparent exopolymer particles, Biogeosciences, 6, 3071–3080, https://doi.org/10.5194/bg-6-3071-2009, 2009a.
Ortega-Retuerta, E., Reche, I., Pulido-Villena, E., Agustí, S., and Duarte, C. M.: Uncoupled distributions of transparent exopolymer particles (TEP) and dissolved carbohydrates in the Southern Ocean, Mar. Chem., 115, 59–65, https://doi.org/10.1016/j.marchem.2009.06.004, 2009b.
Ortega-Retuerta, E., Mazuecos, I. P., Reche, I., Gasol, J. M., Álvarez-Salgado, X. A., Álvarez, M., Montero, M. F., and Arístegui, J.: Transparent exopolymer particle (TEP) distribution and in situ prokaryotic generation across the deep Mediterranean Sea and nearby North East Atlantic Ocean, Prog. Oceanogr., 173, 180–191, https://doi.org/10.1016/j.pocean.2019.03.002, 2019.
Pakulski, J. D. and Benner, R.: Abundance and distribution of carbohydrates in the ocean, Limnol. Oceanogr., 39, 930–940, https://doi.org/10.4319/lo.1994.39.4.0930, 1994.
Passow, U.: Formation of transparent exopolymer particles, TEP, from dissolved precursor material, Mar. Ecol. Prog. Ser., 192, 1–11, https://doi.org/10.3354/meps192001, 2000.
Passow, U.: Production of transparent exopolymer particles (TEP) by phyto- and bacterioplankton, Mar. Ecol. Prog. Ser., 236, 1–12, https://doi.org/10.3354/meps236001, 2002a.
Passow, U.: Transparent exopolymer particles (TEP) in aquatic environments, Prog. Oceanogr., 55, 287–333, https://doi.org/10.1016/S0079-6611(02)00138-6, 2002b.
Passow, U., Alldredge, A. L., and Logan, B. E.: The role of particulate carbohydrate exudates in the flocculation of diatom blooms, Deep-Sea Res. Pt. I, 41, 335–357, https://doi.org/10.1016/0967-0637(94)90007-8, 1994.
Pilskaln, C. H., Villareal, T. A., Dennett, M., Darkangelo-Wood, C., and Meadows, G.: High concentrations of marine snow and diatom algal mats in the North Pacific Subtropical Gyre: Implications for carbon and nitrogen cycles in the oligotrophic ocean, Deep-Sea Res. Pt. I, 52, 2315–2332, https://doi.org/10.1016/j.dsr.2005.08.004, 2005.
Prairie, J. C., Montgomery, Q. W., Proctor, K. W., and Ghiorso, K. S.: Effects of Phytoplankton Growth Phase on Settling Properties of Marine Aggregates, J. Mar. Sci. Eng., 7, 265, https://doi.org/10.3390/jmse7080265, 2019.
Quay, P., Emerson, S., and Palevsky, H.: Regional Pattern of the Ocean's Biological Pump Based on Geochemical Observations, Geophys. Res. Lett., 47, e2020GL088098, https://doi.org/10.1029/2020GL088098, 2020.
Quay, P. and Stephens, M.: Regional patterns of organic matter export rates along the GEOTRACES Pacific meridional transect GP15, Global Biogeochem. Cy., 39, e2024GB008277, https://doi.org/10.1029/2024GB008277, 2025.
Quigg, A., Santschi, P. H., Burd, A., Chin, W. C., Kamalanathan, M., Xu, C., and Ziervogel, K.: From nano-gels to marine snow: A synthesis of gel formation processes and modeling efforts involved with particle flux in the ocean, Gels, 7, 114, https://doi.org/10.3390/gels7030114, 2021.
Rabouille, S., Cabral, G. S., and Pedrotti, M. L.: Towards a carbon budget of the diazotrophic cyanobacterium Crocosphaera: effect of irradiance, Mar. Ecol. Prog. Ser., 570, 29–40, https://doi.org/10.3354/meps12087, 2017.
Radić, T., Ivančić, I., Fuks, D., and Radić, J.: Marine bacterioplankton production of polysaccharidic and proteinaceous particles under different nutrient regimes, FEMS Microbiol. Ecol., 58, 333–342, https://doi.org/10.1111/j.1574-6941.2006.00176.x, 2006.
Reintjes, G., Fuchs, B. M., Amann, R., and Arnosti, C.: Extensive microbial processing of polysaccharides in the south pacific gyre via selfish uptake and extracellular hydrolysis, Front. Microbiol., 11, 583158, https://doi.org/10.3389/fmicb.2020.583158, 2020.
Reygondeau, G., Longhurst, A., Martinez, E., Beaugrand, G., Antoine, D., and Maury, O.: Dynamic biogeochemical provinces in the global ocean, Global Biogeochem. Cy., 27, 1046–1058, https://doi.org/10.1002/gbc.20089, 2013.
Rochelle-Newall, E. J., Mari, X., and Pringault, O.: Sticking properties of transparent exopolymeric particles (TEP) during aging and biodegradation, J. Plankton Res., 32, 1433–1442, https://doi.org/10.1093/plankt/fbq060, 2010.
Roshan, S. and DeVries, T.: Efficient dissolved organic carbon production and export in the oligotrophic ocean, Nat. Commun., 8, 2036, https://doi.org/10.1038/s41467-017-02227-3, 2017.
Sambrotto, R. N., Savidge, G., Robinson, C., Boyd, P., Takahashi, T., Karl, D. M., Langdon, C., Chipman, D., Marra, J., and Codispoti, L.: Elevated consumption of carbon relative to nitrogen in the surface ocean, Nature, 363, 248–250, https://doi.org/10.1038/363248a0, 1993.
Schlitzer, R.: Ocean Data View, https://odv.awi.de, last access: 15 April 2025.
Smith, D. C., Simon, M., Alldredge, A. L., and Azam, F.: Intense hydrolytic enzyme activity on marine aggregates and implications for rapid particle dissolution, Nature, 359, 139–142, https://doi.org/10.1038/359139a0, 1992.
Smyth, A. J. and Letscher, R. T.: Spatial and temporal occurrence of preformed nitrate anomalies in the subtropical North Pacific and North Atlantic oceans, Mar. Chem., 252, 104248, https://doi.org/10.1016/j.marchem.2023.104248, 2023.
Sun, C.-C., Sperling, M., and Engel, A.: Effect of wind speed on the size distribution of gel particles in the sea surface microlayer: insights from a wind–wave channel experiment, Biogeosciences, 15, 3577–3589, https://doi.org/10.5194/bg-15-3577-2018, 2018.
Teng, Y.-C., Primeau, F. W., Moore, J. K., Lomas, M. W., and Martiny, A. C.: Global-scale variations of the ratios of carbon to phosphorus in exported marine organic matter, Nat. Geosci., 7, 895–898, https://doi.org/10.1038/ngeo2303, 2014.
Thompson, A. W., van den Engh, G., Ahlgren, N. A., Kouba, K., Ward, S., Wilson, S. T., and Karl, D. M.: Dynamics of Prochlorococcus Diversity and Photoacclimation During Short-Term Shifts in Water Column Stratification at Station ALOHA, Front. Mar. Sci., 5, 488, https://doi.org/10.3389/fmars.2018.00488, 2018.
Thornton, D. C. O.: Coomassie Stainable Particles (CSP): Protein Containing Exopolymer Particles in the Ocean, Front. Mar. Sci., 5, 206, https://doi.org/10.3389/fmars.2018.00206, 2018.
Toggweiler, J. R.: Carbon overconsumption, Nature, 363, 210–211, https://doi.org/10.1038/363210a0, 1993.
Verdugo, P.: Marine microgels, Ann. Rev. Mar. Sci., 4, 375–400, 2012.
Verdugo, P., Alldredge, A. L., Azam, F., Kirchman, D. L., Passow, U., and Santschi, P. H.: The oceanic gel phase: a bridge in the DOM–POM continuum, Mar. Chem., 92, 67–85, 2004.
Villareal, T. A., Pilskaln, C. H., Montoya, J. P., and Dennett, M.: Upward nitrate transport by phytoplankton in oceanic waters: balancing nutrient budgets in oligotrophic seas, PeerJ, 2, e302, https://doi.org/10.7717/peerj.302, 2014.
von Jackowski, A., Grosse, J., Nöthig, E.-M., and Engel, A.: Dynamics of organic matter and bacterial activity in the Fram Strait during summer and autumn, Philos. T. R. Soc., 378, 20190366, https://doi.org/10.1098/rsta.2019.0366, 2020.
Westberry, T. K., Silsbe, G. M., and Behrenfeld, M. J.: Gross and net primary production in the global ocean: An ocean color remote sensing perspective, Earth-Sci. Rev., 237, 104322, https://doi.org/10.1016/j.earscirev.2023.104322, 2023.
Williams, P. J. le B., Quay, P. D., Westberry, T. K., and Behrenfeld, M. J.: The Oligotrophic Ocean Is Autotrophic, Annu. Rev. Mar. Sci., 5, 535–549, https://doi.org/10.1146/annurev-marine-121211-172335, 2013.
Wurl, O., Wurl, E., Miller, L., Johnson, K., and Vagle, S.: Formation and global distribution of sea-surface microlayers, Biogeosciences, 8, 121–135, https://doi.org/10.5194/bg-8-121-2011, 2011a.
Wurl, O., Miller, L., and Vagle, S.: Production and fate of transparent exopolymer particles in the ocean, J. Geophys. Res.-Ocean., 116, C00H13, https://doi.org/10.1029/2011JC007342, 2011b.
Zamanillo, M., Ortega-Retuerta, E., Nunes, S., Estrada, M., Sala, M. M., Royer, S.-J., López-Sandoval, D. C., Emelianov, M., Vaqué, D., Marrasé, C., and Simó, R.: Distribution of transparent exopolymer particles (TEP) in distinct regions of the Southern Ocean, Sci. Total Environ., 691, 736–748, https://doi.org/10.1016/j.scitotenv.2019.06.524, 2019.
Zamanillo, M., Ortega-Retuerta, E., Cisternas-Novoa, C., Marrasé, C., Pelejero, C., Pascual, J., Gasol, J. M., Engel, A., and Simó, R.: Uncoupled seasonal variability of transparent exopolymer and Coomassie stainable particles in coastal Mediterranean waters: Insights into sources and driving mechanisms, Elem. Sci. Anthr., 9, 00165, https://doi.org/10.1525/elementa.2020.00165, 2021.
Zäncker, B., Bracher, A., Röttgers, R., and Engel, A.: Variations of the Organic Matter Composition in the Sea Surface Microlayer: A Comparison between Open Ocean, Coastal, and Upwelling Sites Off the Peruvian Coast, Front. Microbiol., 8, 2369, https://doi.org/10.3389/fmicb.2017.02369, 2017.