the Creative Commons Attribution 4.0 License.
the Creative Commons Attribution 4.0 License.
 | 30 Jul 2025
Coccolithophore abundance and production and their impacts on particulate inorganic carbon cycling in the western North Pacific
Yuye Han
Zvi Steiner
Zhimian Cao
Di Fan
Junhui Chen
Jimin Yu
Coccolithophores are globally distributed, calcifying phytoplankton that play an important role in the marine carbon cycle through their contribution to the carbonate pump. However, limited knowledge of their biogeography and environmental drivers hinders our ability to predict the response of the marine carbonate pump to climate change. Here, we investigated coccolithophore abundance, species composition, coccolithophore-derived calcium carbonate (CaCO3 as calcite), and particulate inorganic carbon (PIC) concentrations in the upper water column of the western North Pacific Ocean. Sampling was conducted along a meridional transect spanning the oligotrophic subtropical gyre and the nutrient-rich Kuroshio–Oyashio transition region. Our results show that Umbellosphaera tenuis is the numerically dominant coccolithophore species in the subtropical gyre, while Emiliania huxleyi and Syracosphaera spp. dominated in the transition region. The coccolithophore community composition exhibited significant depth- and latitude-dependent variations. On average, coccolithophore calcite contributed 79 ± 27 % of the total CaCO3 standing stock in Niskin bottle samples from the euphotic zone, with a higher contribution observed in the subtropical gyre (91 ± 30 %) compared to the Kuroshio–Oyashio transition region (70 ± 24 %). This pattern was further supported by size-fractionated PIC data from in situ pump samples, with the small size fraction (1–51 µm) contributing 76 ± 11 % of the total PIC (> 1 µm) in the subtropical gyre, compared to 67 ± 13 % in the transition region. During the sampling period, coccolithophore CaCO3 production rates ranged from 0.8 to 2.1 mmol m−2 d−1, averaging 1.5 ± 0.7 mmol m−2 d−1 in the subtropical gyre and 1.2 ± 0.4 mmol m−2 d−1 in the transition region. These findings highlight the critical role of coccolithophores in the pelagic CaCO3 cycle, particularly in oligotrophic ocean waters, and emphasize the need for improved mechanistic understanding of their distribution and calcification dynamics in a changing ocean.
- Article
(5082 KB) - Full-text XML
-
Supplement
(1386 KB) - BibTeX
- EndNote


Calcium carbonate (CaCO3) production and dissolution comprise CaCO3 cycling in the ocean and are a key component of the global oceanic carbon cycle (Broecker and Peng, 1982) through the carbonate pump (Volk and Hoffert, 1985). Production of biogenic CaCO3 by calcifying plankton in the euphotic zone elevates the partial pressure of carbon dioxide (CO2) in seawater (e.g., Feely et al., 2002), while ballasting of sinking particles can promote the transport of carbon from the surface to deep sea and marine sediments (e.g., Armstrong et al., 2001; Klaas and Archer, 2002). Dissolution of CaCO3 in the water column acts as a buffer to facilitate ocean sequestration of atmospheric CO2 and reduces the rate of ocean acidification (Feely et al., 2004; Barrett et al., 2014). Over the last decade, ocean acidification, a global reduction in seawater pH caused by the uptake of anthropogenic CO2, has emerged as a significant feedback mechanism, making it harder for calcifying organisms to produce their skeletons, and thus adversely affects marine ecosystems (Feely et al., 2004; Ma et al., 2023). Therefore, quantification of marine CaCO3 production and dissolution is of vital importance in determining the response of marine ecosystems to changes in the partial pressure of CO2.
Marine CaCO3 occurs in the form of calcite, aragonite, and high-magnesium calcite. Coccolithophores are a key single-celled phytoplankton taxonomic group, responsible for a large percentage (30 %–60 %) of modern oceanic CaCO3 production and 10 %–20 % of marine primary production on a global scale (Poulton et al., 2006, 2013). Coccolithophore calcite accounts for a major fraction (24 %–80 %) of the CaCO3 exported to the deep sea and sediments (Broerse et al., 2000; Young and Ziveri, 2000; Rigual Hernández et al., 2020). Field observations along the northeastern Pacific transect from Hawaii to Alaska suggested coccolithophore calcite comprises 90 % of the total CaCO3 production in the euphotic zone, while pteropods and foraminifera only play a minor role (Ziveri et al., 2023). However, large uncertainties remain in estimates of the production rates of CaCO3 in the upper ocean as well as the contributions of different plankton groups, which are still unclear and vary across regions (Balch et al., 2007; Berelson et al., 2007; Smith and Mackenzie, 2016; Ziveri et al., 2023). Based on a global compilation of CaCO3 production using in situ 14C incubations, Daniels et al. (2018) found that calcification rates ranged from < 0.1 to 6 mmol m−2 d−1 in the euphotic zone. A recent estimate of CaCO3 biomass from three main pelagic calcifying plankton groups also suggested large variation in CaCO3 production in the eastern North Pacific Ocean, ranging from 1.1 to 7.3 mmol m−2 d−1 (Ziveri et al., 2023).
The North Pacific Ocean is a vital region for modulating the carbon cycle, as it accounts for ∼ 25 % of the global ocean sink for atmospheric CO2 (Takahashi et al., 2009). In the eastern North Pacific Ocean, CaCO3 production, export, and dissolution have been studied along a transect from Hawaii to Alaska (Dong et al., 2019, 2022; Naviaux et al., 2019; Subhas et al., 2022; Ziveri et al., 2023). Ziveri et al. (2023) found depth-integrated CaCO3 production in the nutrient-rich subpolar gyre is twice as high as that in the nutrient-poor subtropical gyre. This contrast, however, is smaller than the 6-fold to 7-fold difference based on satellite estimates of surface particulate inorganic carbon (PIC), indicating the importance of coccolithophore CaCO3 production over a deeper euphotic zone and the limitation of satellite products as highlighted by Neukermans et al. (2023).
Here, we determined the abundance and species composition of coccolithophores as well as the concentrations of coccolithophore calcite and PIC based on both Niskin bottle and in situ pump sampling in the upper water column of the western North Pacific Ocean. Additionally, we conducted measurements of environmental conditions such as nutrient and carbonate chemistry parameters. The aims of this research were to answer the following questions: (1) what is the distribution of coccolithophore abundances and species compositions across the oligotrophic nutrient-replete environmental gradient? (2) What is the contribution of coccolithophores to CaCO3 production in the euphotic zone?
2.1 Sample collection
Sampling was conducted on board R/V Tan Kah Kee during cruise NORC2022-306 from 9 June to 25 July 2022. The cruise trajectory crossed from the oligotrophic North Pacific Subtropical Gyre (NPSG) to the relatively nutrient-rich Kuroshio–Oyashio transition region along the 155° E meridian (Fig. 1a; Table S1 in the Supplement). Seven sampling stations can be divided into those located in the NPSG region – including stations M30, M32, and M35 – characterized by high sea-surface temperature (SST) and low surface chlorophyll a (Chl a) and PIC concentrations, and those located in the Kuroshio–Oyashio transition region – including stations KE3, STN41, STN43, and STN45 – featuring lower SST but higher Chl a and PIC concentrations (Fig. 1b–d).
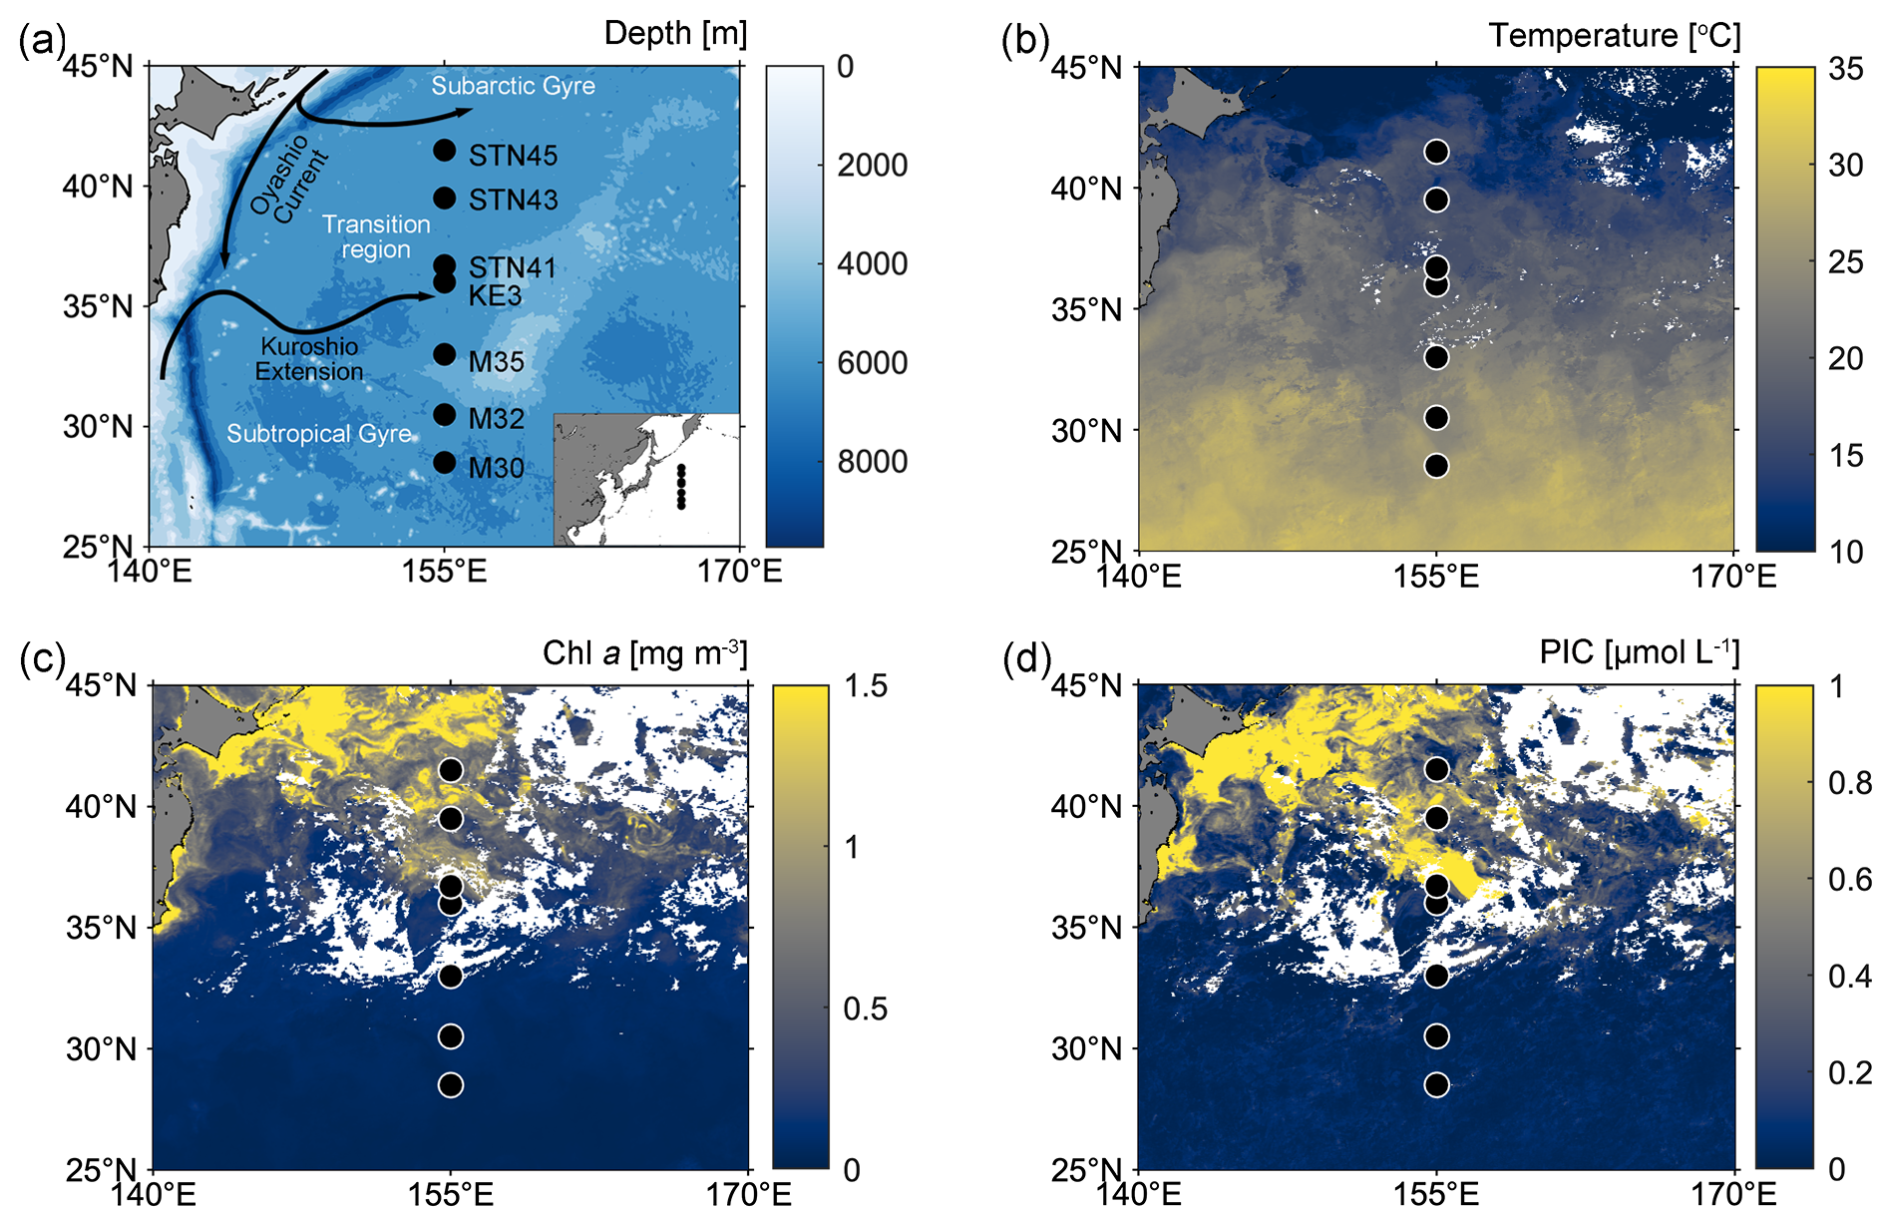
Figure 1(a) Map of the western North Pacific Ocean showing sampling stations (black-filled circles) and major surface currents (solid black lines); (b–d) satellite-based temperature, chlorophyll a (Chl a), and particulate inorganic carbon (PIC) concentrations in surface water from 1 to 30 June 2022 (data from the Moderate Resolution Imaging Spectroradiometer (MODIS)-Aqua satellite; https://oceancolor.gsfc.nasa.gov/l3/, last access: 29 February 2024).
Water samples were collected within the water column above 300 m depth using Niskin bottles on a rosette system equipped with SBE-911 conductivity–temperature–depth (CTD) sensors (Sea-Bird Electronics, Inc., Bellevue, WA, USA). For PIC analyses, 24 L of seawater was collected using acid-cleaned fluorinated bottles and filtered through two quartz microfiber (QMA) filters (1.0 µm pore size, 25 mm diameter). For coccolithophore analyses, 2–4 L of seawater was collected and gently filtered through polycarbonate membranes (0.8 µm pore size, 25 mm diameter), using a vacuum pump at < 20 mm Hg pressure. Membrane filters were oven-dried at 60 °C and stored in plastic petri dishes.
Size-fractionated particles were collected using McLane Research in situ pumps. Filter holders were loaded with a 51 µm Sefar polyester mesh prefilter followed by paired Whatman QMA filters. Hereafter, we refer to the two particle size fractions as large (> 51 µm) and small (1–51 µm) size fractions. One quarter of a subsample of the 51 µm polyester mesh prefilter and two circles of the 23 mm diameter subsample of the QMA filter were analyzed for large and small PIC concentrations, respectively, and the sum of the two fractions yielded the total (size fraction of > 1 µm) PIC concentration.
2.2 Sample analyses
PIC concentrations were determined by measuring the amount of CO2 released after acid treatment of the filters using a Thermo Delta V Plus isotope ratio mass spectrometer (IRMS; Thermo Fisher, USA) coupled with a Thermo GasBench II system at the Center for Isotope Geochemistry and Geochronology of the Laoshan Laboratory (Li et al., 2021). International reference materials of calcite NBS-18 and IAEA-603 were measured for calibration. The analytical precision of PIC determination was < 10 % (1 standard deviation, 1 SD).
Filters were cut and mounted with a carbon sticky tab on a stub and gold-coated prior to analysis using a Quanta 650 FEG field-emission scanning electron microscope (SEM). The coccosphere cell or detached coccolith concentrations (CC; cells or coccoliths L−1) were estimated as follows:
where F is the effective filtration area (336.9 mm2), C is the total number of coccosphere cells or detached coccoliths, V is the filtered seawater volume, and S is the total area of fields of view (mm2). This cell-counting strategy gives a detection limit of at least 1.87 cells mL−1 (Bollmann et al., 2002). The coccolithophore abundance in four samples that were collected at 10 and 200 m at station M30, 200 m at station KE3, and 200 m at station STN45 fell below the detection limit. Despite potential inaccuracies, these values are still meaningful as they indicate an exceptionally low coccolithophore presence. Coccolithophore species identification followed Young et al. (2003) and the Nannotax3 website (http://ina.tmsoc.org/Nannotax3/, last access: 23 August 2023). Aggregates formed by clusters of multiple coccolithophores were quantified in terms of abundance but were excluded from the coccolithophore calcite calculations, mainly due to the difficulty in accurately determining the number of individual coccoliths within the aggregates. Individual coccolithophore calcite content was calculated by multiplying the number of coccoliths per cell by the average coccolith calcite mass of a given species. The average coccolith mass was estimated based on the coccolith size (usually using coccolith length) and a factor related to coccolith cross-sectional shape (Young and Ziveri, 2000):
where l is the coccolith size (µm), Ks is a species-specific shape constant, and 2.7 is the calcite density (CaCO3; pg µm−3). The specific coccolith distal-shield length or process height used in the calculation was measured from SEM images. Measurements were conducted using the ImageJ free software (https://imagej.net/ij/, last access: 23 August 2023) and the Coccobiom2-SEM measuring macro (Young, 2015). The Ks values used were from Young and Ziveri (2000) and Jin et al. (2016). The number of coccoliths per coccosphere was obtained from Yang and Wei (2003) and Boeckel and Baumann (2008). The calculation of coccolith PIC is detailed in Table S2. Sheward et al. (2024) have extensively discussed the potential errors of the morphometric-based calcite estimation method, suggesting an additional uncertainty of 5 %–40 % may arise from slight variations in Ks and size between coccoliths on the same coccosphere as well as errors in coccolith number estimation. Additionally, it is important to note further uncertainties can be introduced by counting inaccuracies, particularly in cases where clumps or overlapping coccoliths are present. Despite these possible errors and limitations, our data and results offer robust and comparable insights into coccolithophore calcite dynamics.
Chl a concentrations were measured after being extracted with 90 % acetone for 14 h at −20 °C using a Trilogy Laboratory Fluorometer with non-acidification module (Turner Designs, USA) (Welschmeyer, 1994). Nutrient samples were collected in acid-washed Nalgene high-density polyethylene bottles and determined on board the vessel using a four-channel continuous-flow Technicon AA3 autoanalyzer (Bran+Luebbe GmbH). The detection limits were 0.1, 0.08, and 0.16 µmol L−1 for dissolved inorganic nitrogen (DIN; nitrate plus nitrite), soluble reactive phosphate (SRP), and dissolved silicate (DSi), respectively. The analytical precisions (derived from repeat measurements of aged deep seawater) were 0.44% for DIN, 0.91 % for SRP, and 0.28 % for DSi (n= 82). Analysis of reference standard LOT.CM (KANSO TECHNOS CO., LTD.) produced concentrations of 33.72 ± 0.13 µmol L−1 for DIN, 2.460 ± 0.025 µmol L−1 for SRP, and 102.2 ± 0.3 µmol L−1 for DSi (n= 20), which agree well with consensus values (http://www.kanso.co.jp/eng/pdf/certificate_cb.pdf, last access: 3 February 2023). For measurements of DIN and SRP concentrations in surface samples below the detection limit of the AA3 autoanalyzer, duplicate samples were collected and frozen separately at −20 °C until analysis. Nanomolar DIN concentrations were determined using a continuous-flow analysis system combined with a liquid waveguide capillary flow cell as described by Zhang (2000). The detection limit was 5.2 nmol L−1 and the analytical precision was 7.5 % (derived from repeat measurements of aged deep seawater with 1000-fold dilution, 36.2 ± 2.7 nmol L−1, and n= 57). Nanomolar SRP concentrations were measured using an automated analyzer including a syringe pump and multiposition selection valve combined with a solid-phase extraction cartridge (Deng et al., 2020). The detection limit was 2.5 nmol L−1 and the analytical precision was 5 % (derived from repeat measurements of aged deep seawater with 1000-fold dilution, 26.0 ± 1.2 nmol L−1, and n= 56). Seawater ammonium (NH) concentrations were measured on board using solid-phase extraction combined with fluorescence determination with a detection limit of 3.6 nmol L−1 (Zhu et al., 2013, 2018).
Samples for analysis of dissolved inorganic carbon (DIC) and total alkalinity (TA) were collected in 250 mL PYREX® borosilicate glass bottles and poisoned with 250 µL of a HgCl2-saturated solution upon sample collection. DIC was measured using an infrared CO2 detector (Apollo ASC-3), with a precision of ± 2 µmol L−1 (Cai et al., 2004). TA was determined on 25 mL samples using an open-cell setting based on the Gran titration technique (Cai et al., 2010), with a Kloehn digital syringe pump. The analytical precision was ±2 µmol L−1. Both DIC and TA concentrations were calibrated against certified reference materials provided by Andrew G. Dickson (Scripps Institution of Oceanography, University of California, San Diego, USA).
2.3 Estimation of CaCO3 production rates
The euphotic zone bottom at each station was defined as the depth where surface photosynthetically active radiation (PAR) reaches 0.1 % (Table S1). CaCO3 production rates in the euphotic zone were determined by dividing measurements of the living CaCO3 standing stock (which only included whole coccosphere cells and excluded loose coccoliths) by the coccolithophore turnover time, which is 0.7–10 d with growth rates ranging from 0.1 to 1.5 cell divisions d−1 (Krumhardt et al., 2017; Ziveri et al., 2023). The coccolithophore turnover time was derived from both laboratory and field estimates, as well as from simulations from a generalized coccolithophore model, which has also been applied to the eastern North Pacific Ocean (Krumhardt et al., 2017; Ziveri et al., 2023). We are aware that different coccolithophore species exhibit widely varying growth rates and cell growth phases differ. Smaller cells produce fewer coccoliths during the exponential growth phase characterized by rapid division, whereas larger cells generate more coccoliths during the early stationary phase when cell division slows down (Raven and Crawfurd, 2012; Krumhardt et al., 2017). We also acknowledge that estimating coccolithophore calcite and production rates using an average coccolith calcite value introduces uncertainties, as this approach does not fully account for the complexity of coccolith dynamics, including rapid cycling and reabsorption (Johns et al., 2023). Despite these possible errors and uncertainties, our estimations, generally comparable with those of prior work (e.g., Daniels et al., 2018), remain a reliable basis for assessing coccolithophore calcification. Uncertainty in the CaCO3 standing stock estimates, which were obtained by vertically integrating PIC concentrations in the euphotic zone, was typically ±10 % (1 SD).
A Monte Carlo-based probabilistic approach was used to determine the CaCO3 production rates and the uncertainties associated with the turnover time using the R package “vioplot”. To obtain an annual CaCO3 production based on our field observations, we used the ratio of satellite-derived PIC concentrations for July 2022 to annual climatology PIC (data from the NASA Goddard Space Flight Center's Ocean Ecology Laboratory) to calibrate for potential seasonal variability (Ziveri et al., 2023).
2.4 Influence of environmental conditions on coccolithophores
The redundancy analysis (RDA) is a widely used multivariate analytical method to identify relationships among individual variables in different categories. Prior to the RDA, statistical differences in environmental variables were evaluated using an analysis of variance (one-way ANOVA), while collinearity between environmental variables was accounted for by calculating variance inflation factors (VIFs). Forward selection of variables was subsequently carried out until all VIF scores were < 10, in order to only include variables that are not significantly correlated. These criteria reduced the number of environmental variables used in the RDA. Monte Carlo permutation tests, based on 1000 randomizations, were performed to identify the most significant and independent effect on variation in the coccolithophore community composition. The overall significance of the explanatory variables after forward selection was evaluated through ANOVA (α < 0.05) and coefficient of determination (r2), and adjusted r2 were calculated to assess the power of a selected RDA model using the vegan package (Oksanen, 2010). The contribution of each environmental variable to community variation was determined by hierarchical partitioning in canonical analysis via the “dbRDA” function in the “rdacca.hp” package in R (Lai et al., 2022).
3.1 Hydrography
Hydrochemical variables exhibited a south to north trend. Temperature and salinity were highest at the surface of station M30, due to strong net evaporation in the subtropical gyre (Fig. 2a and b). There was a northward decrease in temperature and salinity due to the influence of upwelling in the subarctic gyre. In contrast to temperature and salinity and as expected, the distribution of DIN, SRP, and DSi showed a generally northward increasing pattern (Fig. 2c–d and S1a). Surface DIN concentrations were on average 0.006 µmol L−1 in the NPSG region and 0.02 µmol L−1 in the Kuroshio–Oyashio transition region. The NH concentration above 100 m at station STN45 was notably higher than that at other stations (Fig. S1b). The deep chlorophyll maximum (DCM) depth gradually shoaled northward from 110 m at station M30 in the NPSG region to 33 m at station STN45 in the Kuroshio–Oyashio transition region (Fig. 2e).
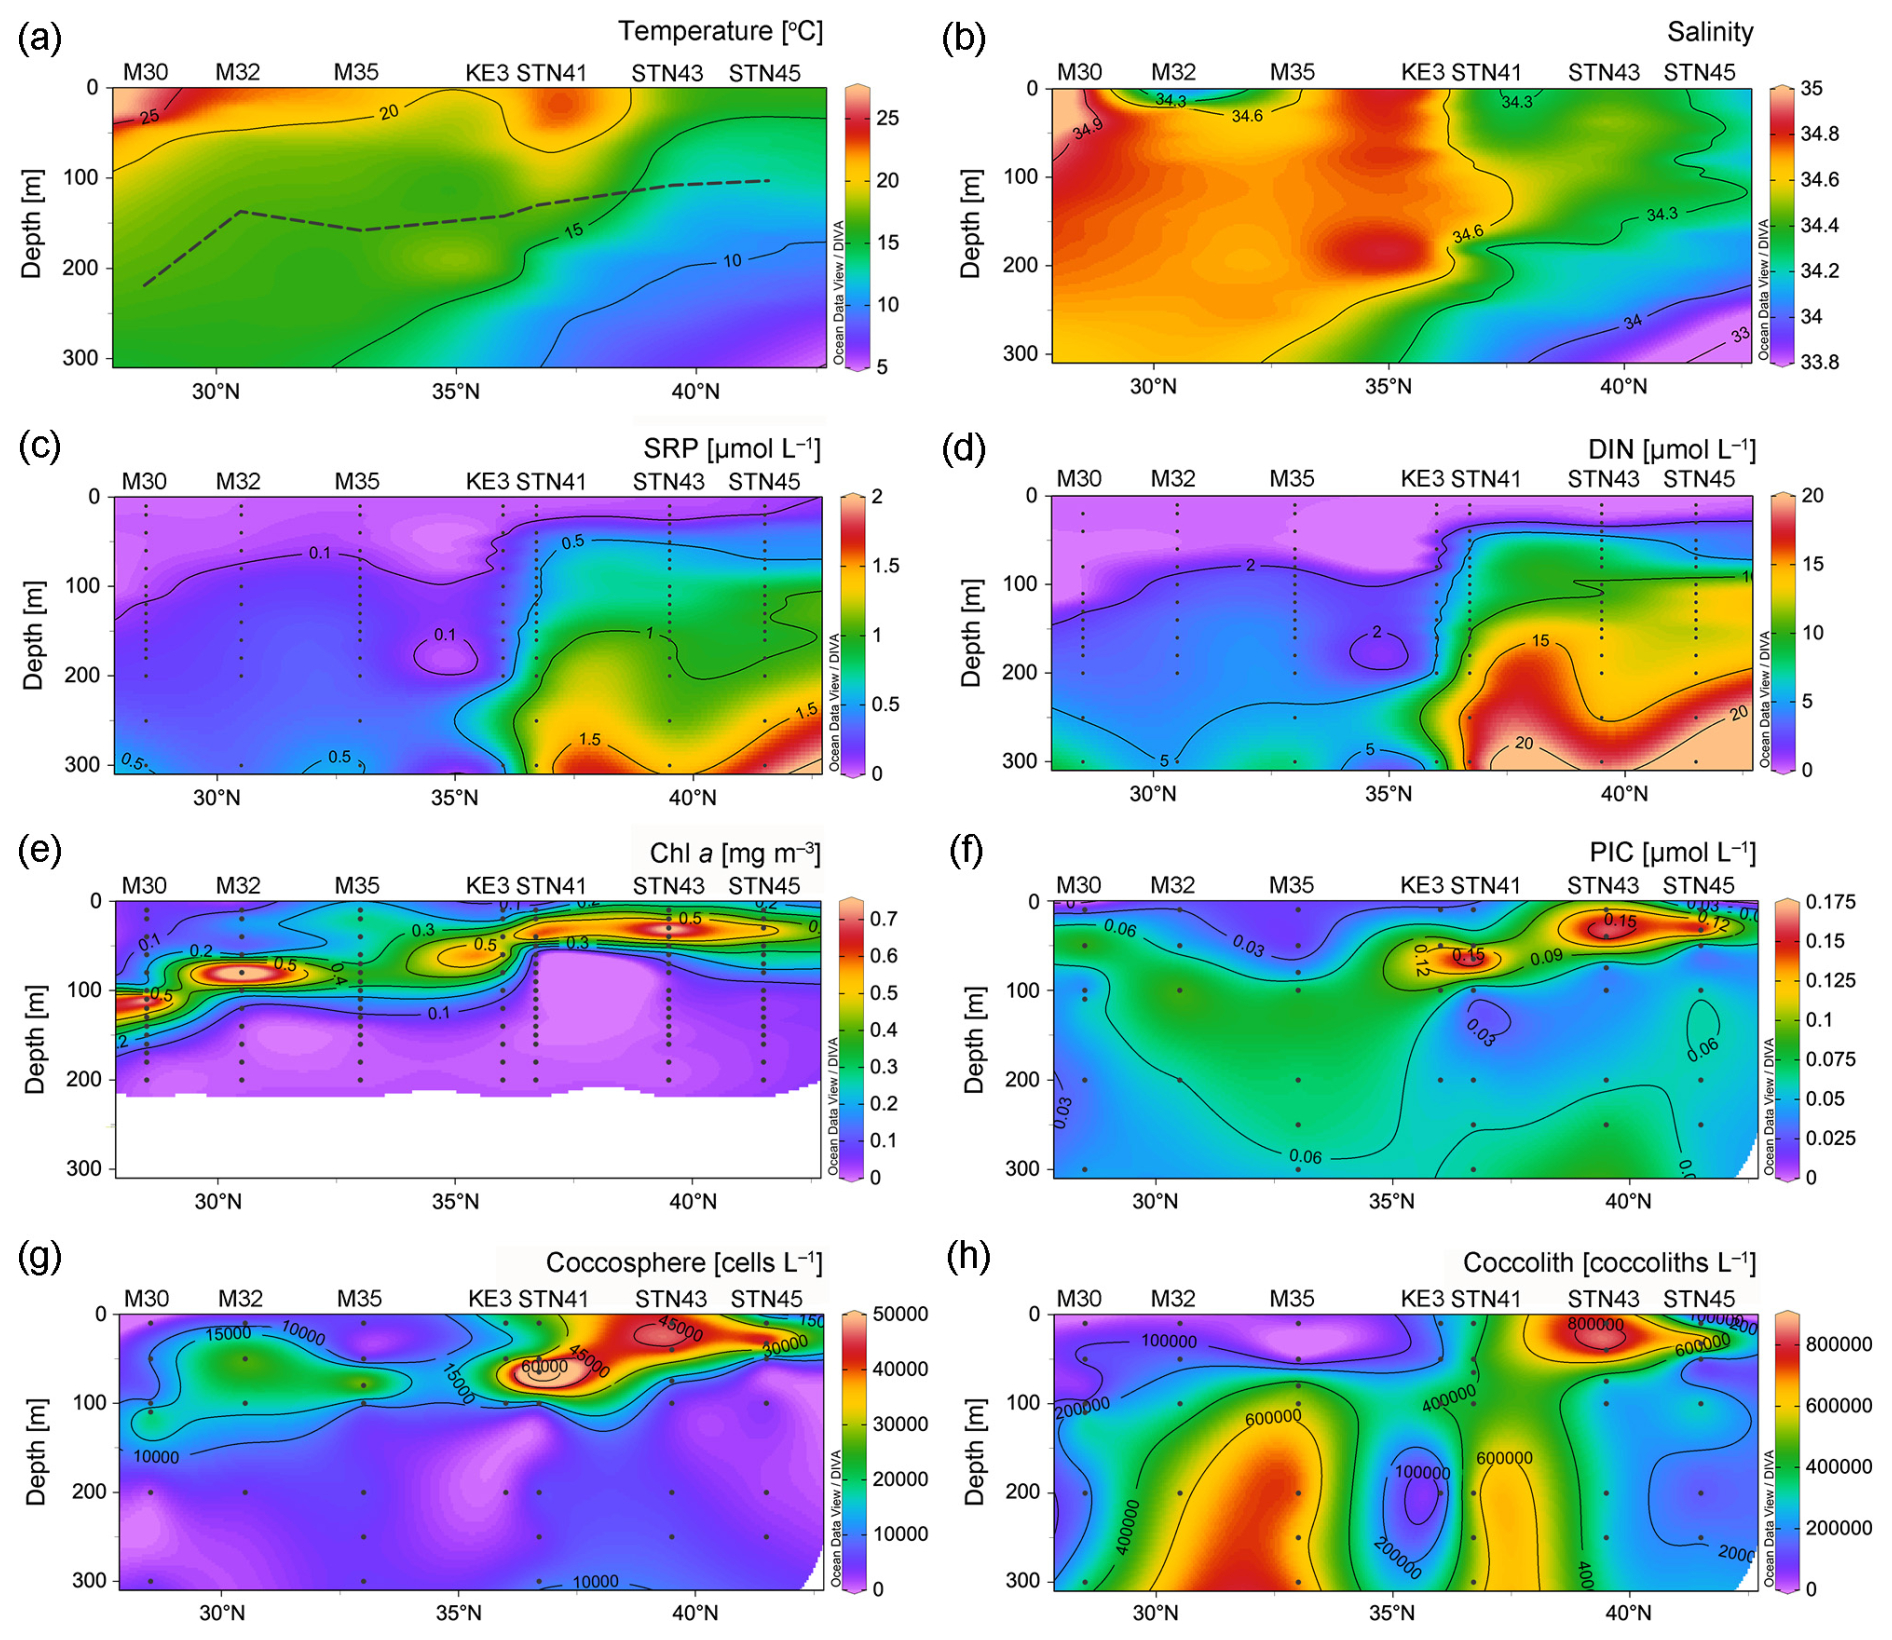
Figure 2Vertical depth distributions of (a) temperature and (b) salinity and concentrations of (c) soluble reactive phosphate (SRP), (d) dissolved inorganic nitrogen (DIN; nitrate plus nitrite), (e) chlorophyll a (Chl a), (f) particulate inorganic carbon (PIC), (g) coccosphere cells, and (h) detached coccoliths in the upper 300 m of the water column in the study area. In (a), the black dashed line indicates the bottom of the euphotic zone (Schlitzer Reiner, Ocean Data View, https://odv.awi.de/, last access: 23 November 2023, 2020).
3.2 Vertical distribution of PIC and coccolithophore concentrations
PIC concentrations along the 155° E transect ranged from 0.02 to 0.17 µmol L−1, with an average of 0.06 ± 0.04 µmol L−1 in the upper 300 m of the water column (Fig. 2f). Generally, PIC concentrations were lower at the surface and increased with increasing depth to attain a maximum in the DCM layer and decreased with depth thereafter. In the DCM layer, PIC concentrations ranged from 0.06 µmol L−1 at 110 m of station M30 in the subtropical gyre to 0.16 µmol L−1 at 33 m of station STN45 in the Kuroshio–Oyashio transition region. The vertical distribution pattern of bottle-derived PIC and coccosphere cell concentrations overall followed that of Chl a, showing a northward shoaling of the subsurface maximum.
Concentrations of coccosphere cells ranged from ca. 970 to 75 000 cells L−1 (Fig. 2g). Along the transect, a subsurface maximum was evidenced around the DCM layer with an average of 42 000 cells L−1 followed by a steep decrease below 100 m. The highest coccosphere cell concentration was observed at 65 m of station STN41, corresponding to the highest PIC concentration. The average coccosphere cell concentration was notably lower in the NPSG region (9800 cells L−1) than in the transition region (18 000 cells L−1). The detached coccolith concentration averaged 340 000 coccoliths L−1, with a range of 11 000 to 800 000 coccoliths L−1 (Fig. 2h). The highest concentration was observed around 10–40 m of station STN43. High coccolith concentrations were also observed below 100 m at stations M32, M35, and STN41.
Size-fractionated PIC concentrations from in situ pumps varied from 0.01 to 0.09 µmol L−1 in the small size fraction and from 0.01 to 0.06 µmol L−1 in the large size fraction. Total PIC concentrations averaged 0.07 ± 0.02 µmol L−1 and were comparable to bottle-derived PIC concentrations (Fig. 3). Roughly 70 % of the PIC was contributed by the small size fraction at each sampling station. Generally, large-size-fraction PIC concentrations increased northward from stations M30–M35 to stations KE3–STN45 and accounted for 22 % and 36 % of total PIC concentrations in the NPSG region and the Kuroshio–Oyashio transition region, respectively. The maximum concentration of large-size-fraction PIC (0.06 µmol L−1) was observed at 26 m of station STN45 (Fig. 3g).
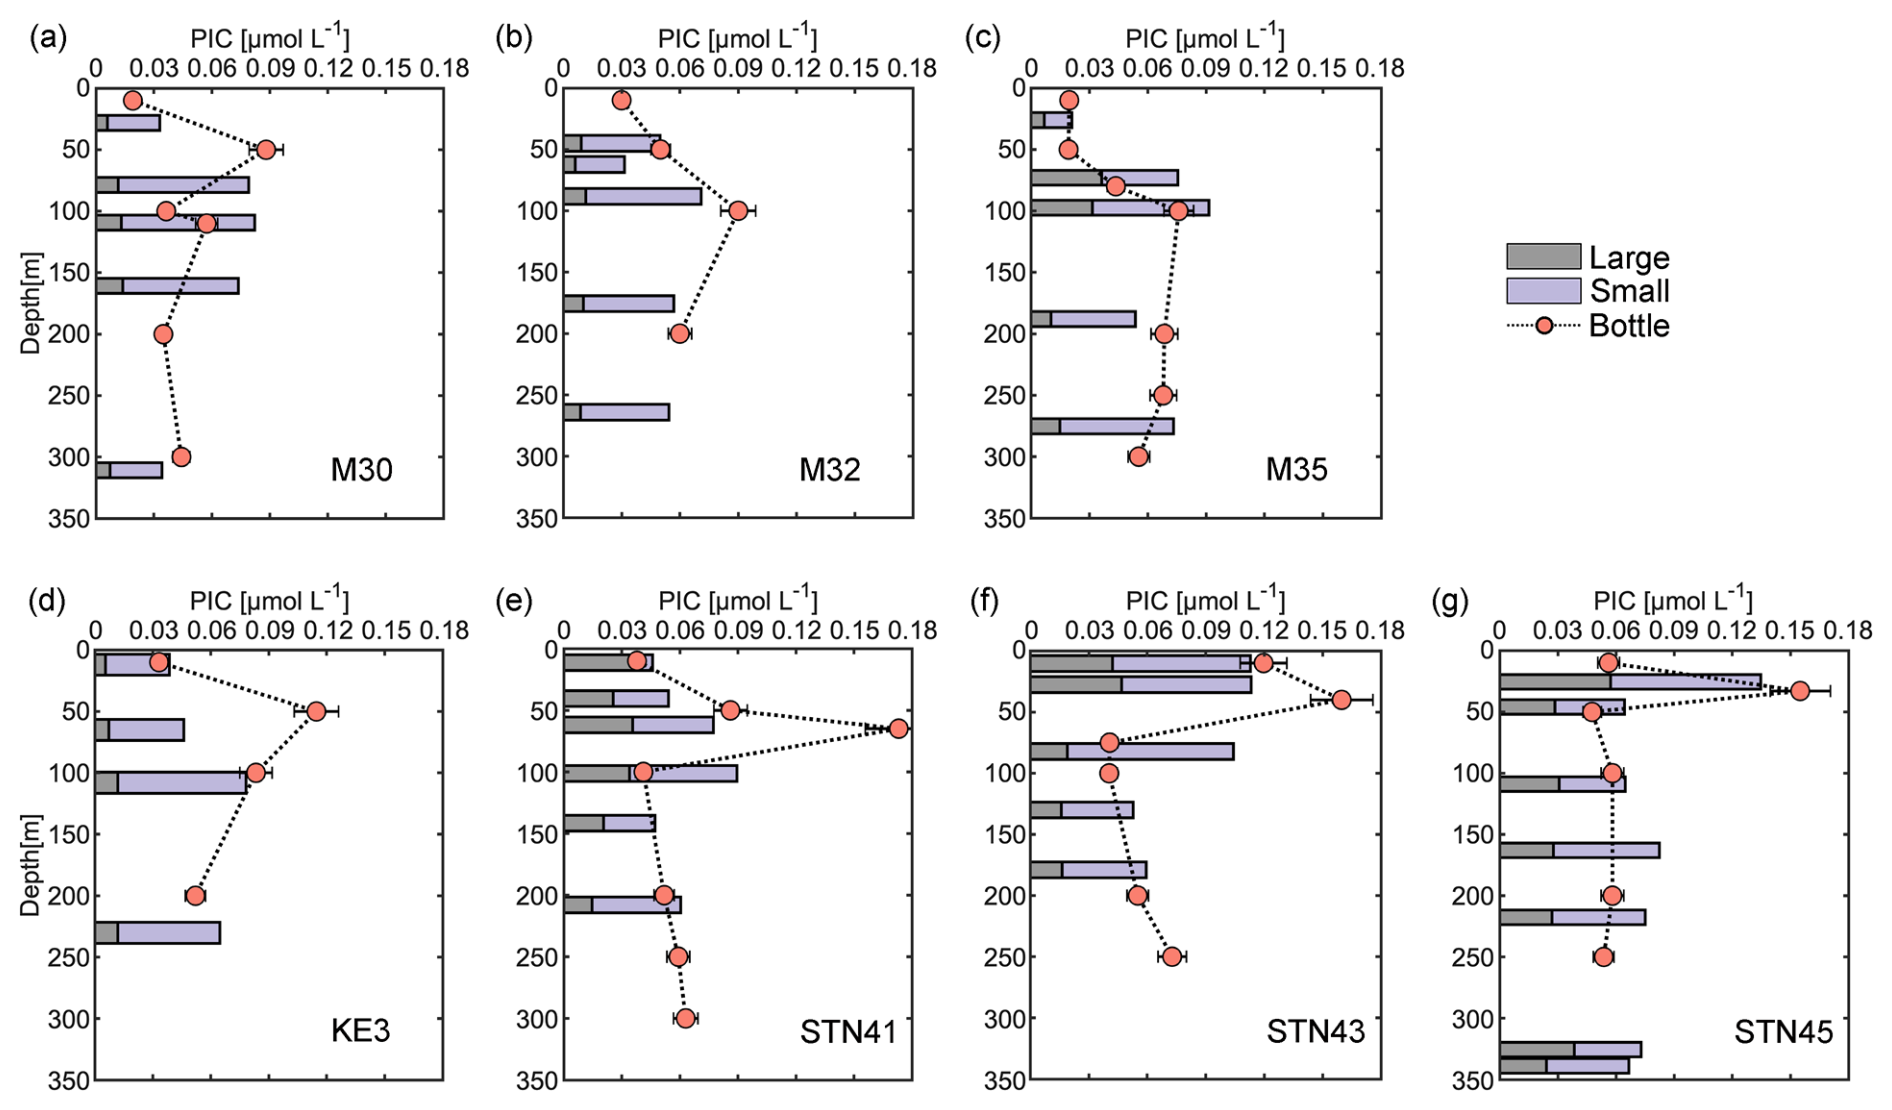
Figure 3Vertical depth distributions of particulate inorganic carbon (PIC) concentrations derived from sampling using both Niskin bottles and in situ pumps (small size fractions of 1–51 µm and large size fractions of > 51 µm) in the upper 350 m of the water column at sampling stations in the study area.
3.3 Characteristics of the coccolithophore assemblage
Coccolithophore populations were predominantly represented by Emiliania huxleyi, Gephyrocapsa ericsonii, Gephyrocapsa oceanica, Umbellosphaera tenuis, Syracosphaera spp., holo-coccolithophores (HOL), Algirosphaera robusta, and Florisphaera profunda (each comprising > 1 % of total coccosphere abundance; Fig. 4). In surface water, coccolithophore cells were dominated by Discosphaera tubifera, U. tenuis, and HOL at stations M30 and M32 (Fig. 4a and b) and by G. ericsonii at stations M35, KE3, and STN41 (Fig. 4c, d, and e), while high abundance of E. huxleyi and Syracosphaera spp. was clearly observed at stations STN43 and STN45 (Fig. 4f and g). It is noteworthy that E. huxleyi contributed the largest fraction (50 %) to the total coccolithophore cells and was also found to be the dominant species in the DCM layer. U. tenuis was mainly observed in subtropical gyre waters, with peak abundance at 50 m and lower abundance at the surface and in the DCM (Fig. 4a and b). Lower euphotic zone (LPZ, defined as the region of the water column that receives 10 %–1 % of surface PAR) coccolithophore species (including A. robusta and F. profunda) were commonly found in the subsurface population below 50 m, accounting for 7 % of the entire coccolithophore community (Jin et al., 2016; Poulton et al., 2017). Overall, coccolithophores were scarce in the NPSG region and dominated by U. tenuis, whereas their abundance notably increased in the Kuroshio–Oyashio transition region where it was dominated by E. huxleyi, Gephyrocapsa, and Syracosphaera spp.
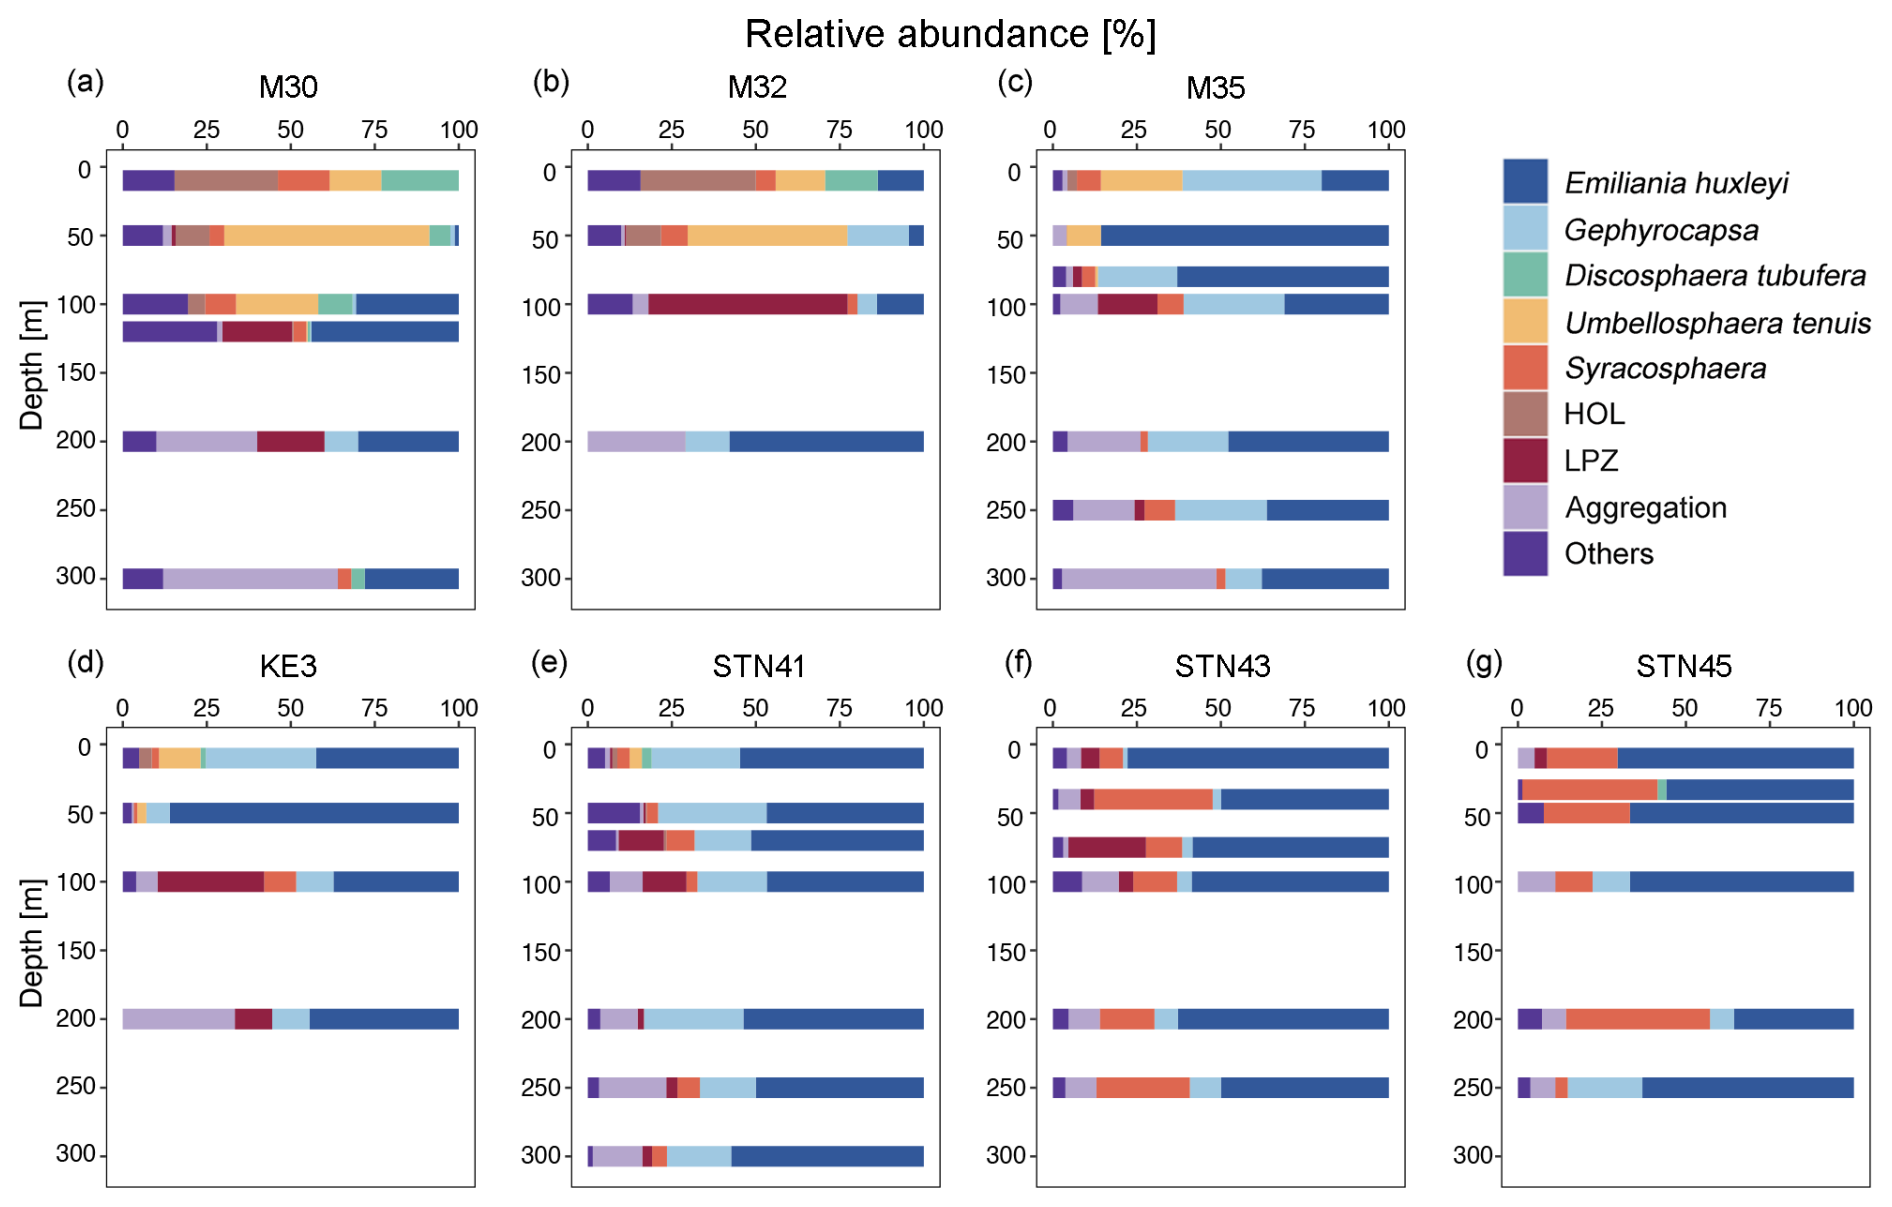
Figure 4Relative abundance of different coccolithophore groups in the upper 300 m of the water column. Lower euphotic zone (LPZ) species include Florisphaera profunda and Algirosphaera robusta; HOL indicates holo-coccolithophores.
The estimated coccolithophore calcite concentrations ranged from < 0.01 to 0.23 µmol L−1, averaging 0.05 ± 0.04 µmol L−1 above 300 m along the 155° E transect. The coccospheres of E. huxleyi accounted for 32 % and 57 % of the total coccolithophore cells but represented only 4 % and 12 % of the coccolithophore calcite concentration in the NPSG region and the Kuroshio–Oyashio transition region, respectively (Fig. 5). In the NPSG region, U. tenuis accounted for 15 % of the total coccolithophore cells and 7 % of the coccolithophore calcite concentration, both notably higher than in the transition region, where its contribution was < 1 % for both measures. Syracosphaera spp. was the largest contributor in the Kuroshio–Oyashio transition region, accounting for 25 % of the coccolithophore calcite concentration (Fig. 5f). The less abundant (< 3 %) species Calcidiscus leptoporus and Oolithotus fragilis accounted for 21 % and 12 % of the coccolithophore calcite concentration in the NPSG region and the Kuroshio–Oyashio transition region, respectively. Additionally, detached coccoliths contributed to 30 % and 24 % of the total coccolithophore calcite concentration in the two regions, respectively (Fig. 5c and f).
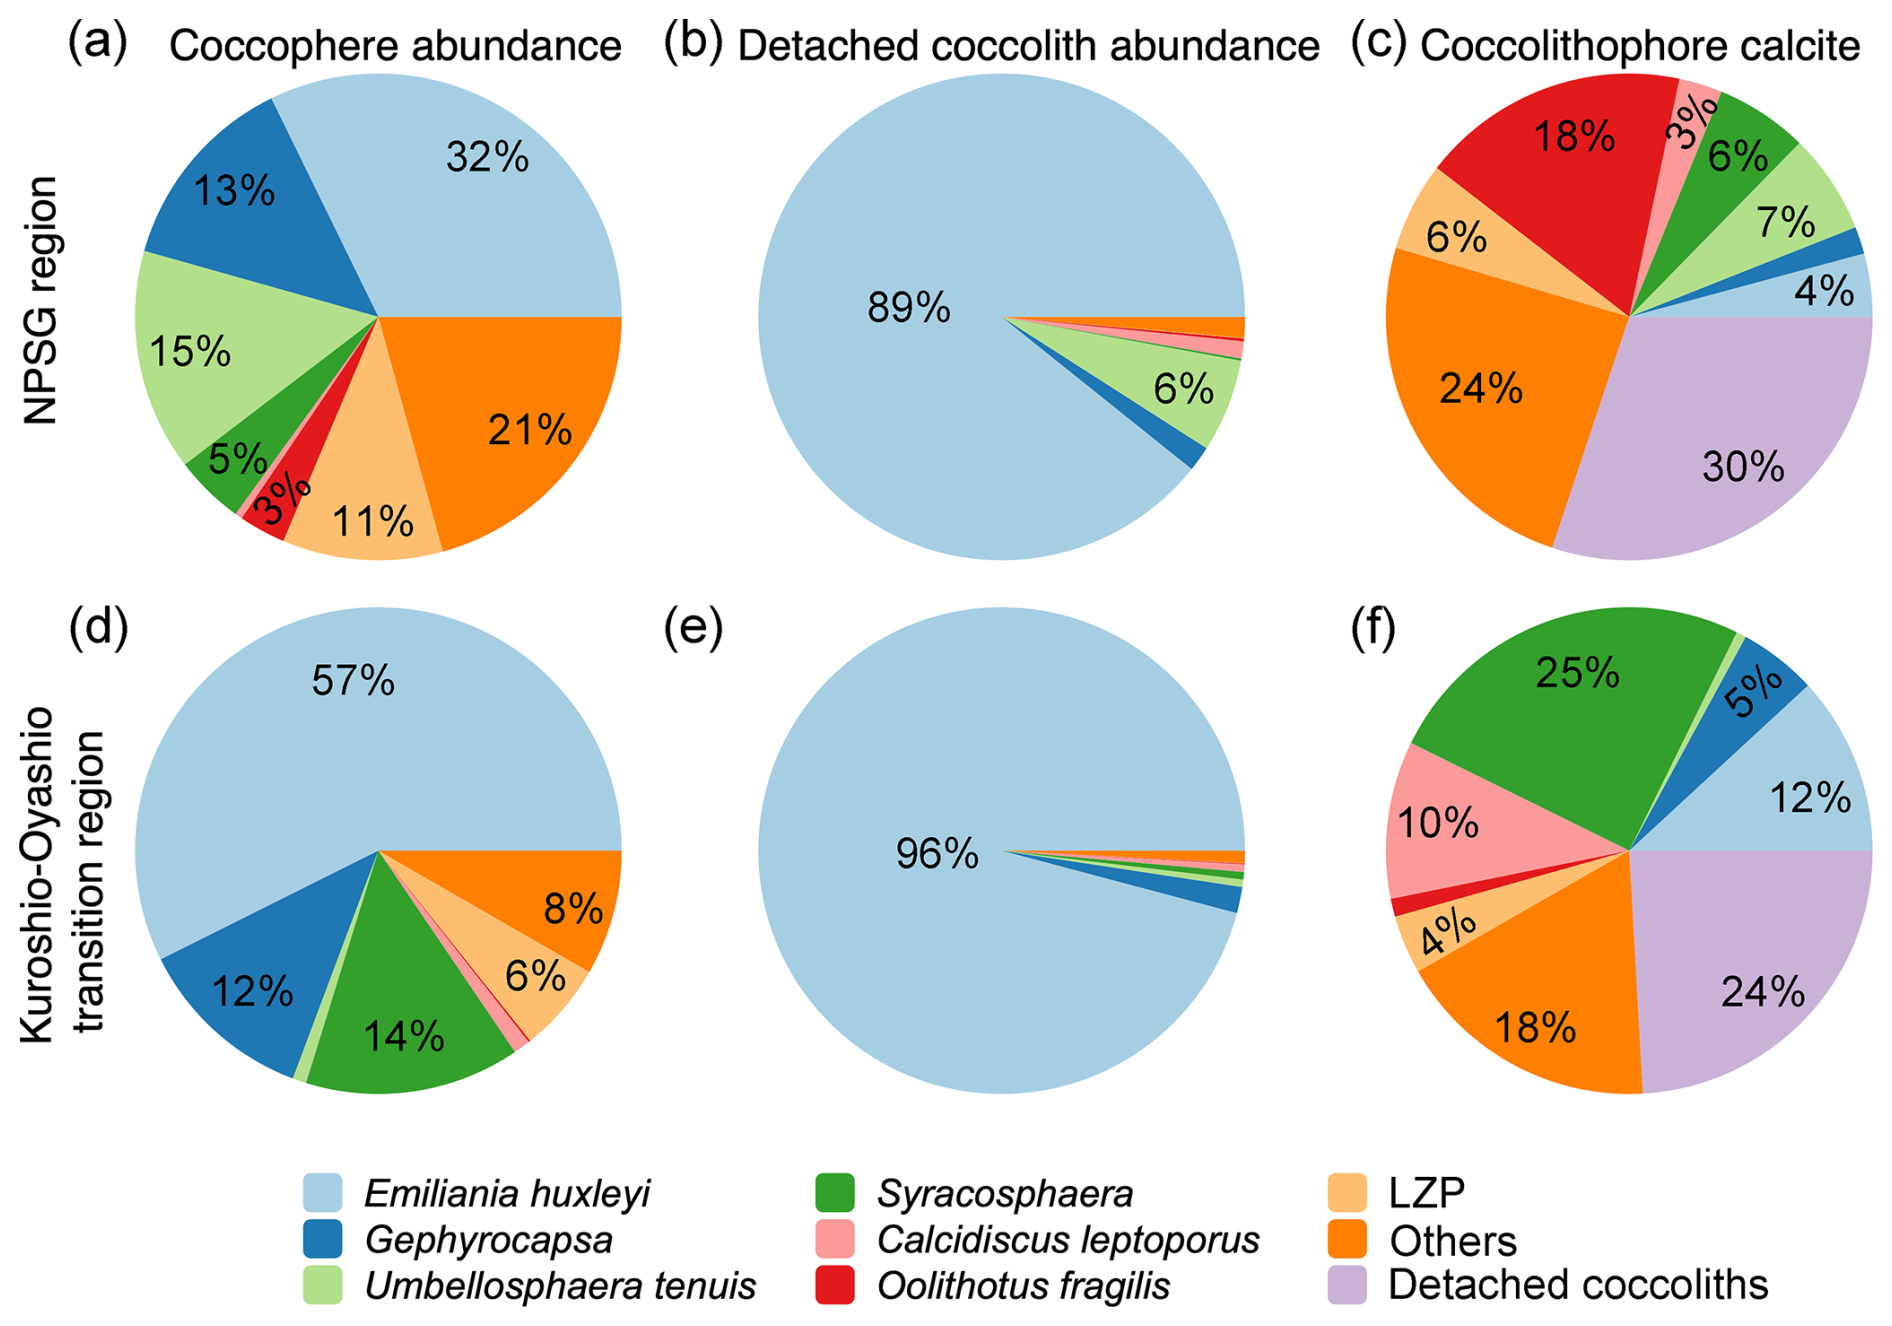
Figure 5Contribution of different coccolithophore groups to coccosphere cell abundance, detached coccolith abundance, and coccolithophore calcite concentrations in the upper 300 m of the water column in (a–c) the North Pacific Subtropical Gyre (NPSG – stations M30, M32, and M35) and (d–f) the Kuroshio–Oyashio transition region (stations KE3, STN41, STN43, and STN45). Lower euphotic zone (LPZ) species include Florisphaera profunda and Algirosphaera robusta.
3.4 CaCO3 standing stock and production
The standing stocks of CaCO3 in the euphotic zone were determined using data from Niskin bottles, coccolithophore calcite, and size-fractionated samples (Fig. 6a). CaCO3 standing stock derived from Niskin bottle sampling ranged from 7.0 to 11.1 mmol m−2 and was slightly lower in the oligotrophic NPSG region (8.7 ± 1.7 mmol m−2) than in the relatively nutrient-high Kuroshio–Oyashio transition region (9.2 ± 1.7 mmol m−2). Based on the estimated coccolithophore calcite concentrations, CaCO3 standing stocks ranged from 4.0 to 11.3 mmol m−2 and peaked at station M30 due to it having the deepest euphotic zone (Figs. 2a and 6a). Calcite from coccolithophores comprised on average 79 ± 27 % of the CaCO3 standing stock from Niskin bottle samples, and the contribution was higher in the NPSG region (91 ± 30 %) than in the Kuroshio–Oyashio transition region (70 ± 24 %; Fig. 6b), demonstrating the vital role of coccolithophores in CaCO3 production, particularly in oligotrophic ocean waters.
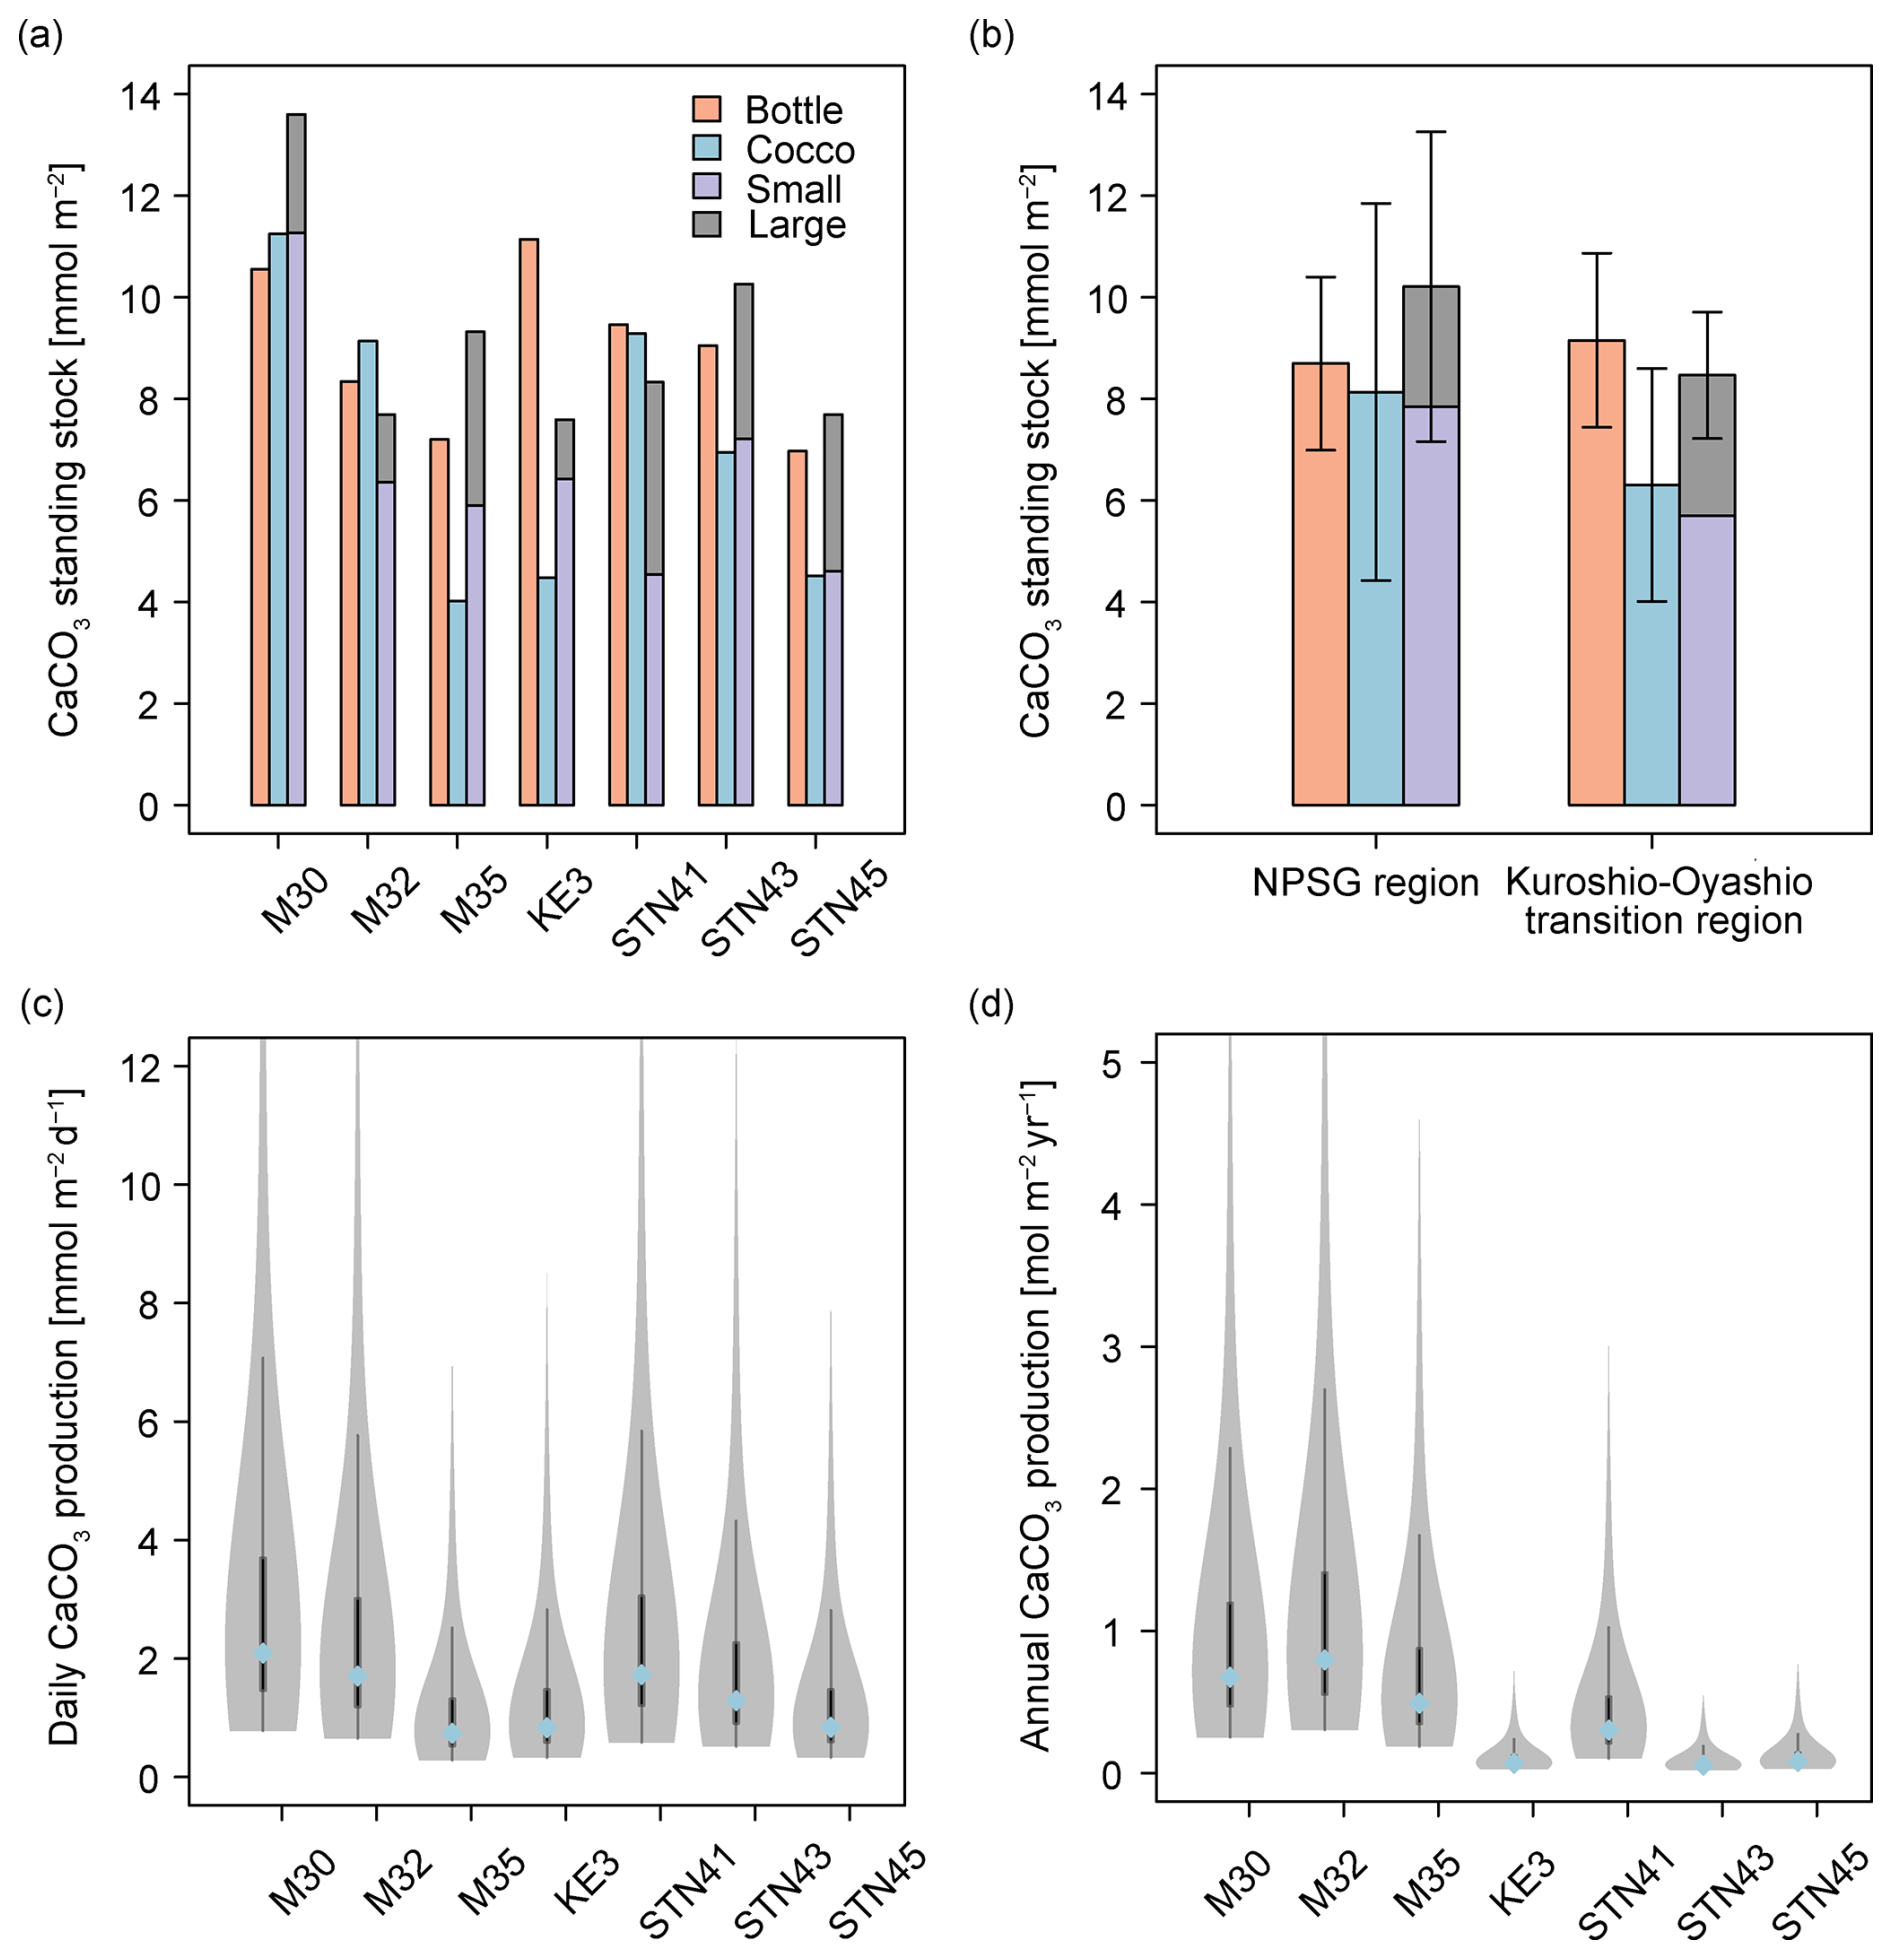
Figure 6Calcium carbonate (CaCO3) standing stock in the euphotic zone estimated from Niskin bottle particulate inorganic carbon (PIC), total calcite (Cocco), and size-fractionated contributions (large and small fractions indicate > 51 and 1–51 µm, respectively). PIC concentrations (a) at each sampling station, (b) in the North Pacific Subtropical Gyre (NPSG) and in the Kuroshio–Oyashio transition regions; (c) CaCO3 production by coccolithophores in the euphotic zone at indicated sampling stations in June–July 2022; (d) annual CaCO3 production corrected for seasonal bias using satellite-derived PIC concentrations. In (c) and (d), the blue-filled circles mark the median value, while the shaded areas display the probability density of the estimates. The gray lines denote the 25 % and 75 % quartiles.
Total CaCO3 standing stock derived from in situ pump samples ranged from 7.6 to 13.6 mmol m−2, averaging 10.2 ± 3.1 mmol m−2 in the subtropical gyre and 8.5 ± 1.2 mmol m−2 in the transition region. The CaCO3 standing stock of the small PIC ranged from 4.5 to 11.3 mmol m−2 and accounted for 71 ± 12 % of the total standing stock in the entire research domain (Fig. 6a).
Given that coccolithophores have a turnover time of 0.7–10 d (Krumhardt et al., 2017; Ziveri et al., 2023), CaCO3 production rates in the euphotic zone ranged from 0.8 to 2.1 mmol m−2 d−1 during the sampling period (Fig. 6c). Generally, the coccolithophore CaCO3 production was comparable in the subtropical gyre and the Kuroshio–Oyashio transition region, averaging 1.5 ± 0.7 and 1.2 ± 0.4 mmol m−2 d−1, respectively. Coccolithophore CaCO3 production in the euphotic zone was maximal at station M30 and the lowest coccolithophore CaCO3 production was observed at station M35.
4.1 Contribution of coccolithophore calcite to PIC
In this study, bottle- and pump-derived PIC concentrations generally agreed with each other (Fig. 3), and both were on the same order of magnitude as suspended PIC concentrations measured in the Atlantic Ocean, Indian Ocean, and Pacific Ocean (Beaufort et al., 2008; Barrett et al., 2014; Lam et al., 2015, 2018; Maranón et al., 2016). Coccolithophore calcite concentrations showed a significant positive correlation with PIC concentrations (r2= 0.52, p < 0.01 and n= 40; Fig. 7a), highlighting the major contribution of coccospheres and detached coccoliths (68 %) to total CaCO3 in the upper 300 m of the water column. This is consistent with findings from the eastern North Pacific Ocean where coccolithophores dominate CaCO3 production (Ziveri et al., 2023). It is noteworthy that detached coccolith concentrations of E. huxleyi, U. tenuis, and Syracosphaera spp. showed significant positive relationships with their coccosphere cell concentrations (Fig. 7b–d), indicating those detached particles were likely shed by cells as part of the dynamic calcification process, during which coccoliths are continuously produced and released (Johns et al., 2023). However, other potential sources and processes, such as advection, cell disintegration from viral lysis and grazing, fecal pellets, or the dissolution associated with microbial respiration, could also contribute to the observed detached coccolith concentrations (Subhas et al., 2022; Vincent et al., 2023; Dean et al., 2024). Coccolith production and shedding vary among species. Fast-growing species like E. huxleyi produce and shed coccoliths rapidly during exponential growth phases, whereas other species exhibit different patterns, which are influenced by their distinct physiological and ecological characteristics (Johns et al., 2023).
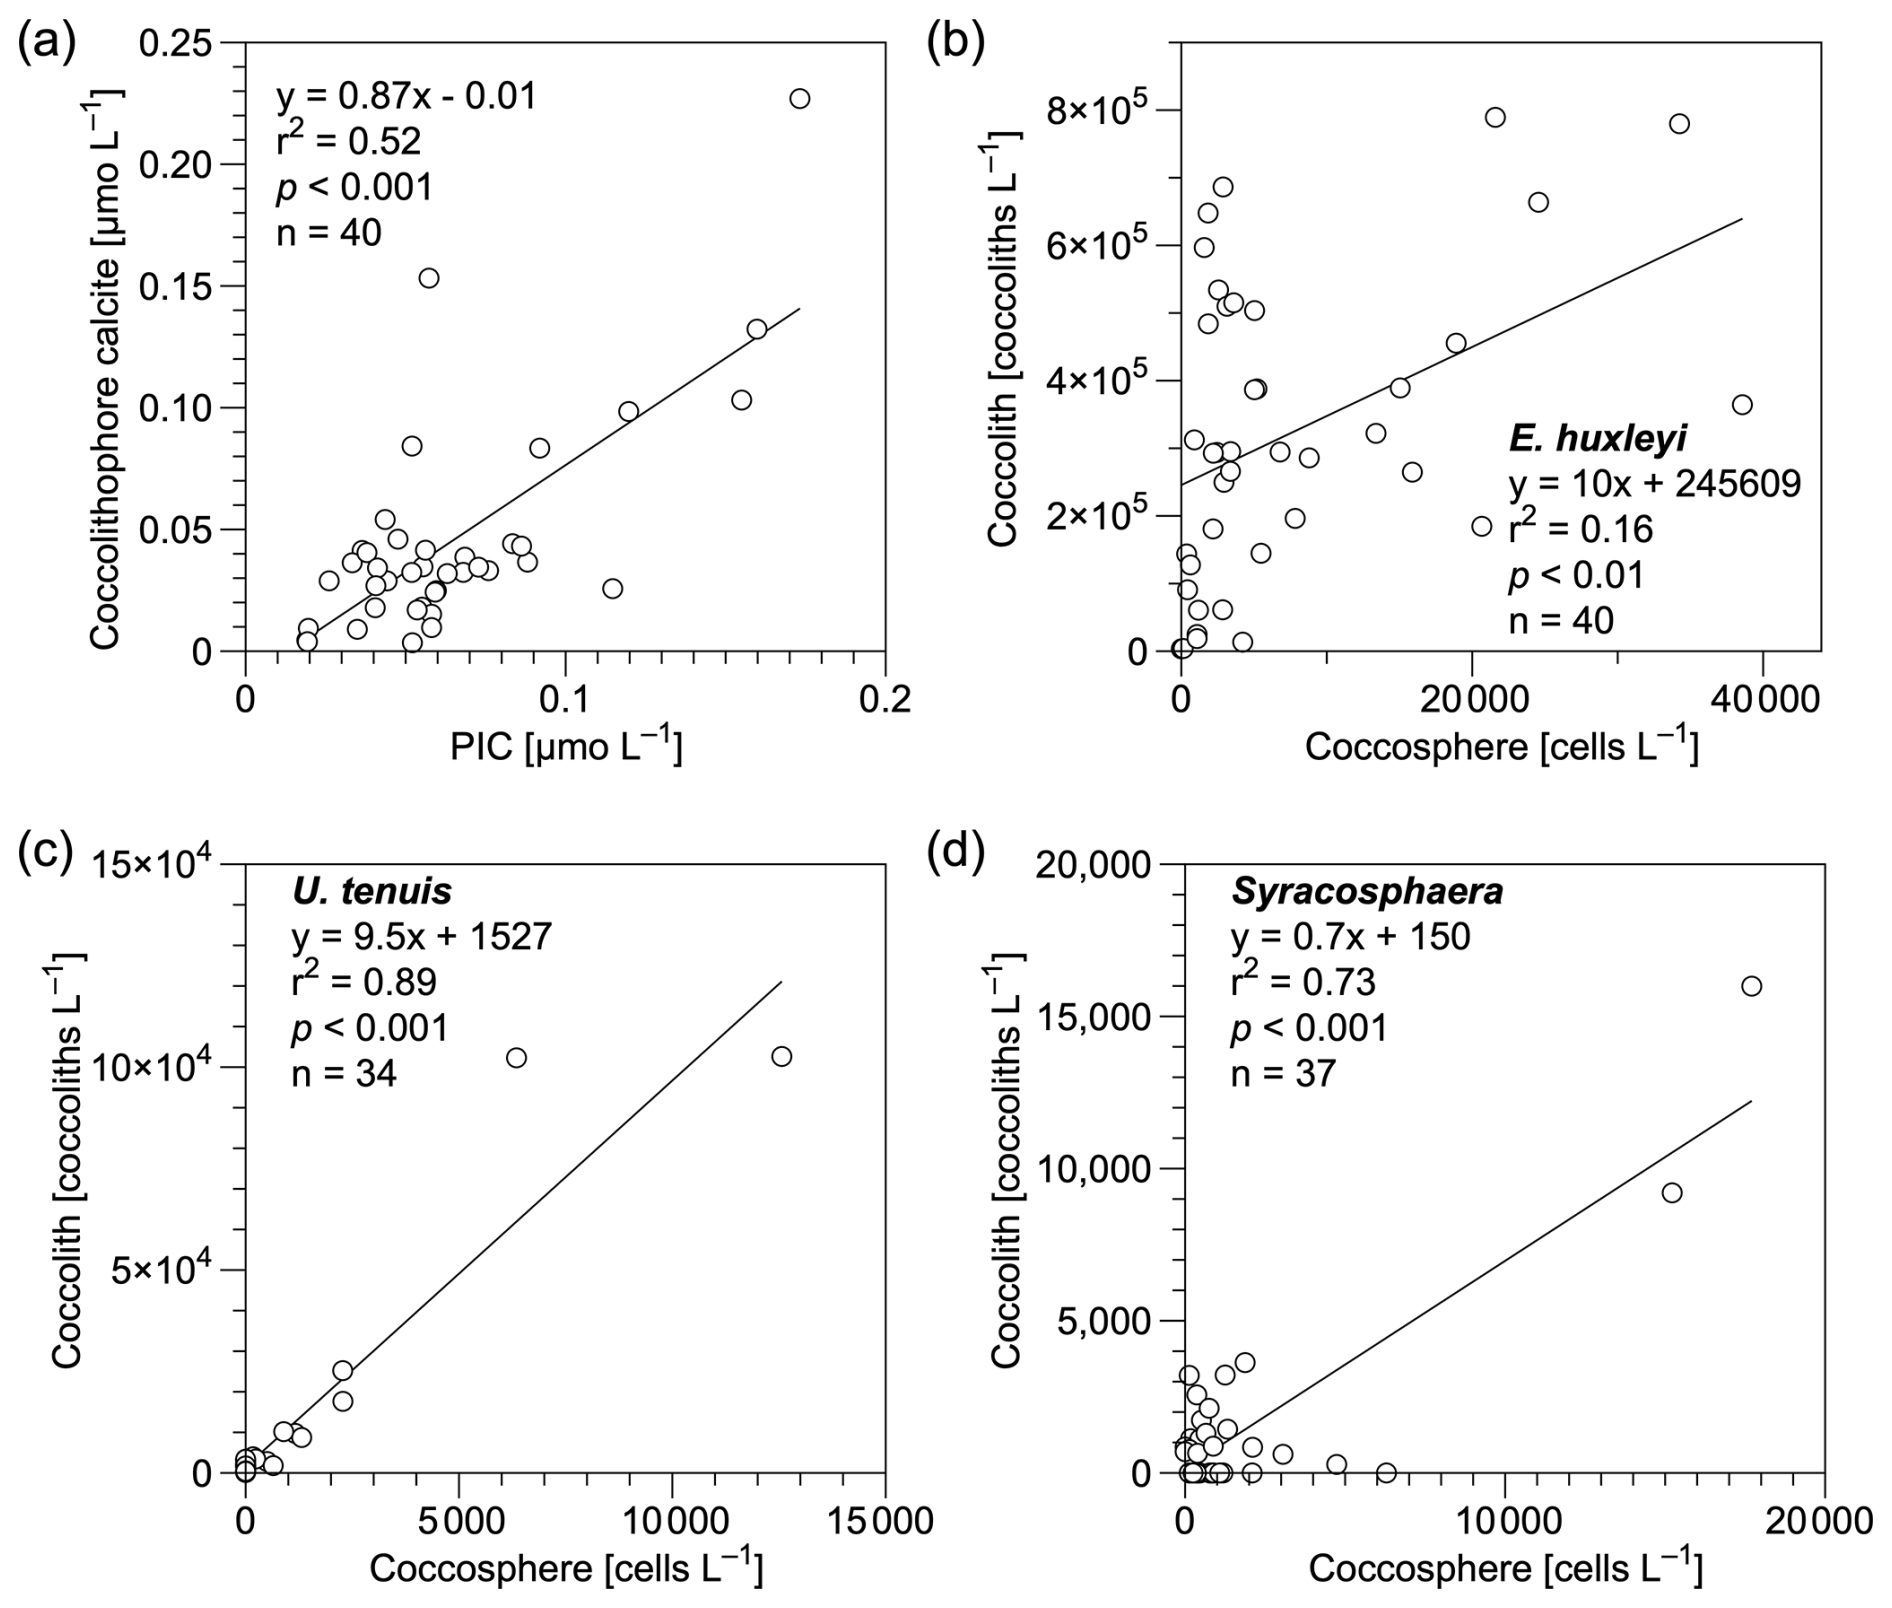
Figure 7Relationships of (a) coccolithophore calcite (coccospheres and detached coccoliths) vs. particulate inorganic carbon (PIC) concentrations and (b–d) detached coccolith vs. coccosphere cell concentrations for (b) Emiliania huxleyi, (c) Umbellosphaera tenuis, and (d) Syracosphaera spp. in the upper 300 m water column in the study area. Equations describing the fitted straight lines are also shown.
The less abundant (< 3 %) species such as C. leptoporus and O. fragilis also made a large contribution to calcite concentrations, accounting for 21 % and 12 % of the coccolithophore calcite concentration in the NPSG region and the Kuroshio–Oyashio transition region, respectively (Fig. 5). It has been reported that despite the relatively low numeric abundance (< 2 %), some larger species of the coccolithophore community such as C. leptoporus, Helicosphaera carteri, and Coccolithus pelagicus may account for most of the coccolithophore CaCO3 flux to the deep ocean (Rigual Hernández et al., 2020). Some rare coccolithophore species with high coccolith and coccosphere cell concentrations have also been identified as important contributors to both upper-ocean calcite production (Daniels et al., 2016) and deep-sea calcite fluxes (Ziveri et al., 2007). Thus, larger and less abundant coccolithophore species can play an important role in CaCO3 production and export.
Higher CaCO3 standing stock in the euphotic zone of the Kuroshio–Oyashio transition region (Fig. 6a) is consistent with satellite observations suggesting higher surface PIC concentrations occur at high latitudes (Balch et al., 2005; Berelson et al., 2007). In the present study, however, the relative contribution of coccolithophores to the CaCO3 standing stock was higher in the NPSG region (∼ 91 %) than in the Kuroshio–Oyashio transition region (∼ 70 %) (Fig. 6a). To date, most studies estimated CaCO3 standing stocks using satellite-derived data, which might be challenging to use in subtropical gyres where the DCM depth usually lies below 100 m (Cornec et al., 2021). In these oligotrophic oceans with low productivity, a subsurface PIC maximum can develop within the euphotic zone, and the highly variable subsurface PIC concentrations are poorly reflected by satellites, potentially limiting the ability to fully capture coccolithophore contributions.
In oligotrophic ocean gyres, subsurface CaCO3 production could still occur even if surface PIC is low (Balch et al., 2018). Along our studied transect, maximum coccolithophore abundances increased about 2-fold from the subtropical gyre to the transition region (Fig. 2g), while a much smaller difference was found in the integrated coccolithophore CaCO3 between the two regions (Fig. 6a). This suggests subsurface coccolithophore CaCO3 contributed substantially to the total upper-water-column PIC concentration in the NPSG region. Coccolithophore groups were diverse in the subtropical gyre, including some rare but relatively large and heavily calcified species that contribute significantly to CaCO3 production. In the Southern Ocean, coccolithophore contribution to the annual CaCO3 export is highest in waters with low algal biomass accumulations (Rigual Hernández et al., 2020). Given that low surface PIC regions (< 0.1 mmol m−3) occupy about 87 % of the global ocean surface (Ziveri et al., 2023), our data highlight the notable contributions of these regions to global coccolithophore CaCO3 production.
Size-fractionated PIC concentrations showed a smaller contribution of coccolithophores to the CaCO3 standing stock in the Kuroshio–Oyashio transition region (67 ± 13 %) than in the NPSG region (76 ± 11 %) (Fig. 6b). This pattern is consistent with that observed in the eastern North Pacific Ocean (Fig. 8), which suggests the contribution of small PIC to CaCO3 standing stock is lower in the subpolar gyre (65 %) than in the subtropical gyre (84 %). In other words, the contribution of large-size-fraction PIC (e.g., zooplanktonic foraminifera, pteropods, and heteropods) to CaCO3 standing stock is higher in the subpolar gyre (35 %) than in the subtropical gyre (16 %) of the eastern North Pacific Ocean (Ziveri et al., 2023). Betzer et al. (1984) reported that foraminifera calcite is more abundant in northern regions (north of 42° N) of the western North Pacific. At Ocean Station Papa in the northeastern Pacific (50° N, 145° W), model results showed that foraminifera calcite accounts for only 18 %–30 % of the total CaCO3 production, whereas coccolithophores are the main producer, contributing to 59 %–77 % of the total CaCO3 production (Fabry, 1989). These findings support our results and suggest the relatively high contribution of large-size-fraction PIC in the northern region of the western North Pacific is likely attributed to foraminifera.
In the Atlantic Ocean, coccolithophore calcite fluxes and species richness are higher in subtropical than in temperate waters, which is ascribed to the reduced competition with diatoms in the former (Broerse et al., 2000). Note that a clear latitudinal gradient of diatom biomass was observed along 160° E in the North Pacific Ocean, consistent with findings from phytoplankton pigment analysis and ocean-color satellite observations (Hirata et al., 2011; Sugie and Suzuki, 2017). The distribution of planktic foraminifera in the North Pacific has been linked to phytoplankton productivity and food availability, with higher abundance in the transitional region compared to the subtropical region (Taylor et al., 2018). Based on these findings, we suggest differences in ecosystem structure among sites modulate the relative contribution of various calcifiers to pelagic PIC production. The higher abundance of non-calcareous phytoplankton (e.g., diatoms) in the transition zone could also reduce coccolithophore biomass via resource competition (Quere et al., 2005; Sinha et al., 2010) and stimulate the growth of foraminifera (Schiebel et al., 2017), resulting in the observed decreased contribution of small coccolithophores to total CaCO3 production. Sediment trap data from the North Pacific also support this pattern, indicating lower fluxes of planktonic foraminifera, organic matter, and biogenic opal in the subtropical region but elevated fluxes in the transitional and subarctic regions (Eguchi et al., 2003).
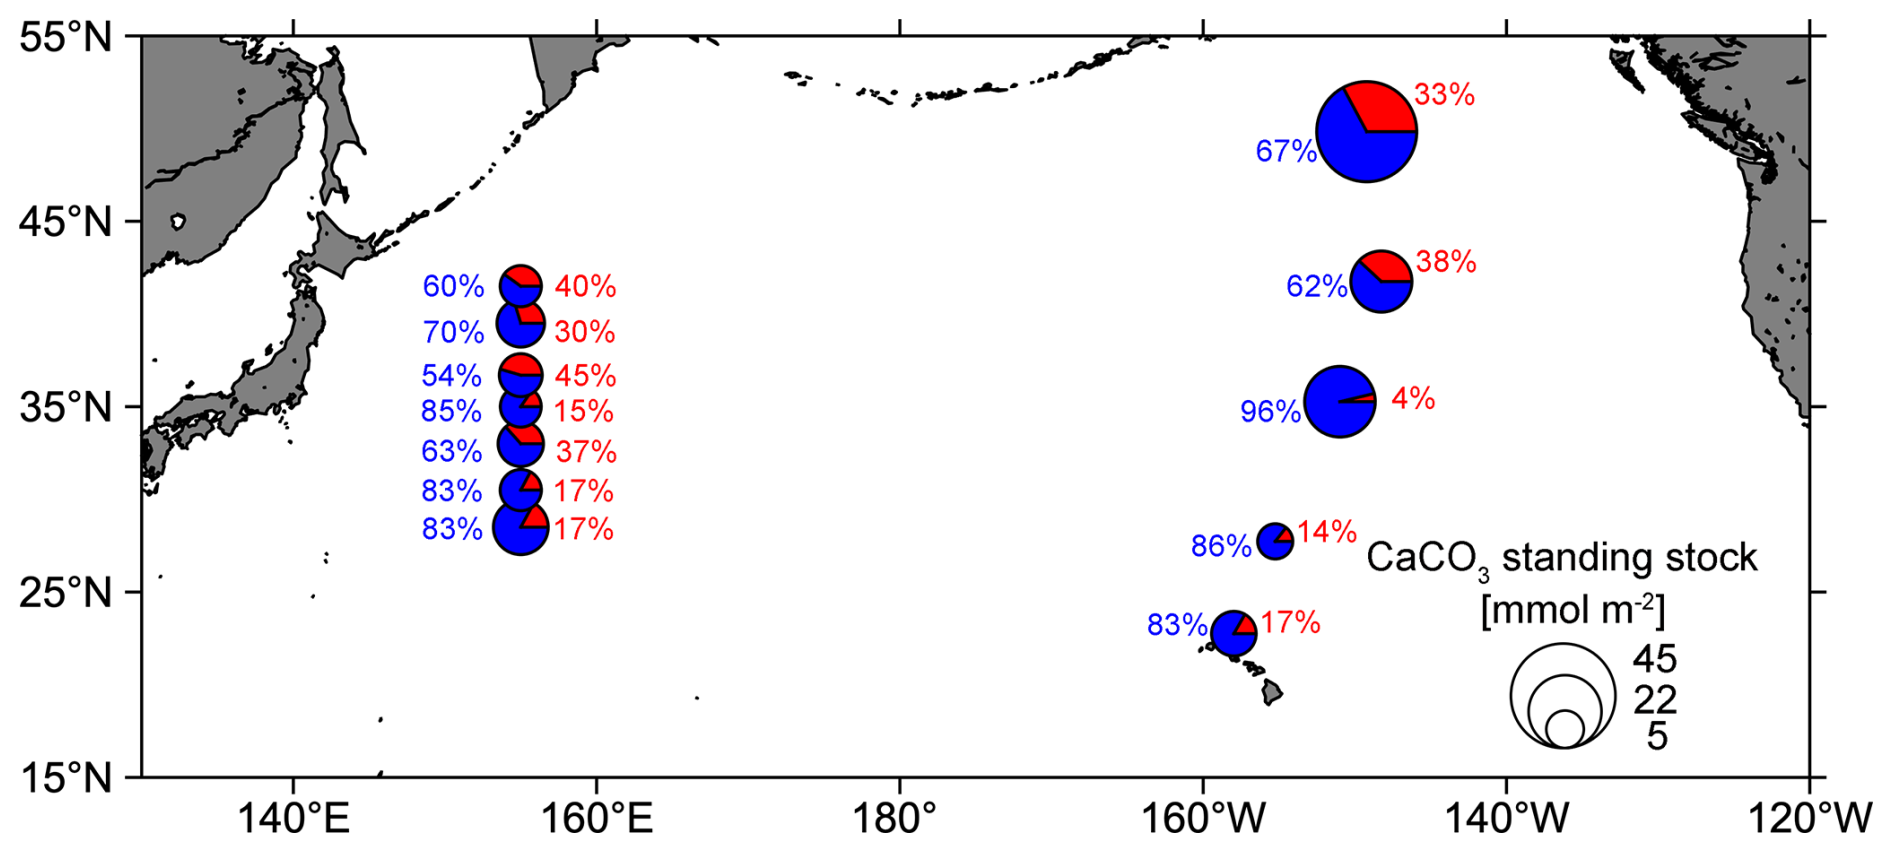
Figure 8Pie charts showing the composition of total calcium carbonate (CaCO3) standing stock in the euphotic zone of the western (this study) and eastern North Pacific Ocean (data from the CDisK-IV cruise; Ziveri et al., 2023). Red represents the standing stock of large-size-fraction (> 51 µm) CaCO3 from this study and planktonic foraminifera, pteropods, and heteropods from the CDisK-IV cruise. Blue represents the standing stock of small-size-fraction (1–51 µm) CaCO3 from this study and coccolithophores from the CDisK-IV cruise.
4.2 Coccolithophore responses to environmental factors
Although biogeographical zones of coccolithophores in the North and Central Pacific were identified a couple of decades ago, few studies have investigated coccolithophore distributions in the North Pacific over the recent 2 decades (Okada and Honjo, 1973; Hagino et al., 2005). In the western North Pacific Ocean, higher diversity and less abundant coccolithophore assemblages were observed in the oligotrophic subtropical gyres, whereas the Kuroshio–Oyashio transition region tended to exhibit a lower diversity corresponding to higher PIC and coccolithophore concentrations (Figs. 2 and S2). This finding is consistent with results from the Atlantic Ocean and a result of the different survival strategies of various coccolithophore species (Poulton et al., 2017; Balch et al., 2019). Coccolithophores are nutrient stress tolerant and have low iron cell quotas and are thus generally abundant in the open ocean (Gregg and Casey, 2007; Brun et al., 2015). Prior studies have shown that coccolithophores, particularly E. huxleyi, can grow more effectively under low iron conditions than other phytoplankton such as diatoms (Hartnett et al., 2012; Balch, 2018). However, when nutrients and light are plentiful, the heavy coccoliths of this group of phytoplankters pose a selective disadvantage over diatoms and chlorophytes (Gregg and Casey, 2007). The dominance of coccolithophores in the Great Calcite Belt is primarily driven by their adaptation to low iron levels, which, together with low surface DSi concentrations, limits diatom growth (Balch et al., 2016). The majority of coccolithophore species are K selected, characterized by relatively slow growth and large cell size, and are more competitive in low-nutrient and well-stratified regions (Brand, 1994), whereas only few r-selected species, such as the fast-growing and small-sized E. huxleyi, thrive in relatively dynamic and nutrient-rich regions (Charalampopoulou, 2011; Brun et al., 2015; O'Brien et al., 2016). In the present study, the most abundant and widely distributed coccolithophore species was E. huxleyi, which showed increasing abundance northward along the study transect (Fig. 4). This is consistent with prior observations demonstrating that E. huxleyi is the most abundant coccolithophore species in the subarctic, subantarctic, and bordering transitional regions (Saavedra-Pellitero et al., 2014).
According to the RDA results, environmental variables accounted for 47.6 % of the total variation in coccolithophore community composition (Fig. 9a). The first two RDA axes suggested there were significant spatial differences in the coccolithophore community across depth and regions (Fig. S3). In the tropical and subtropical Atlantic Ocean, coccolithophore communities exhibit greater variability vertically within the water column than horizontally, at spatial scales of hundreds to thousands of kilometers (Poulton et al., 2017). Moreover, distinct species distributions are identified based on the depth zones (upper euphotic, lower euphotic, and subeuphotic zones), which reflect the lifestyle of the species (Poulton et al., 2017; Balch, 2018). In the NPSG region, our results also reveal a distinct vertical distribution pattern (Fig. 4), which may have been driven by factors such as light availability, temperature, and nutrient levels. These environmental variables likely contribute to the physiological diversity of coccolithophores. A shift in dominant species occurred from U. tenuis and E. huxleyi in the NPSG region to Syracosphaera spp. and E. huxleyi in the transition region (Fig. 5). This is consistent with the prior observations of Balch et al. (2019). Correspondingly, hierarchical partitioning analysis showed that depth and latitude had a significant effect on coccolithophore community variation (p < 0.05). Other environmental factors, such as temperature, salinity, Chl a, and TA, also influenced the coccolithophore community (Fig. 9b).
Based on Spearman's correlation analysis, coccolithophore abundance showed significant positive relationships with temperature, Ωcalcite, and pH and significant negative relationships with depth, DIC, and macronutrient concentrations, especially for D. tubifera, U. tenuis, and HOL, which are more sensitive to environmental factors (Fig. 9c). The positive correlation with temperature is consistent with field observations and model simulations pointing to a general trend of increasing coccolithophore abundance in the context of global warming (Rivero-Calle et al., 2015; Rousseaux and Gregg, 2015). More abundant species like E. huxleyi and Syracosphaera spp., however, only showed a highly positive correlation with depth, latitude, and Chl a concentration, suggesting these species are more adaptable to varying environmental conditions (Schlüter et al., 2014). In the Atlantic Ocean, E. huxleyi has been observed to exhibit an increasing relative abundance with increasing latitude (Balch et al., 2019; Holligan et al., 2010; Poulton et al., 2017). Unlike many other species, E. huxleyi has a widespread distribution attributed to its ability to adapt to diverse environments through both phenotypic plasticity and genetic selection (Lohbeck et al., 2012; Rickaby et al., 2016b; Taylor et al., 2017). Our results indicate that less abundant species, such as C. leptoporus and O. fragilis, also contributed to coccolithophore calcite concentrations (Fig. 5). Their calcification is species-specific, predominantly driven by inherent biological traits, including cell shapes, coccolith types, and architectural variations, which are conservative features of coccolithophore biology (Rickaby et al., 2016a). However, the weak correlation of C. leptoporus and O. fragilis with environmental factors might be due to their low abundance. Overall, our study highlights the significant influence of depths and latitude on coccolithophore community composition, emphasizing the complex interplay between biotic and abiotic factors.
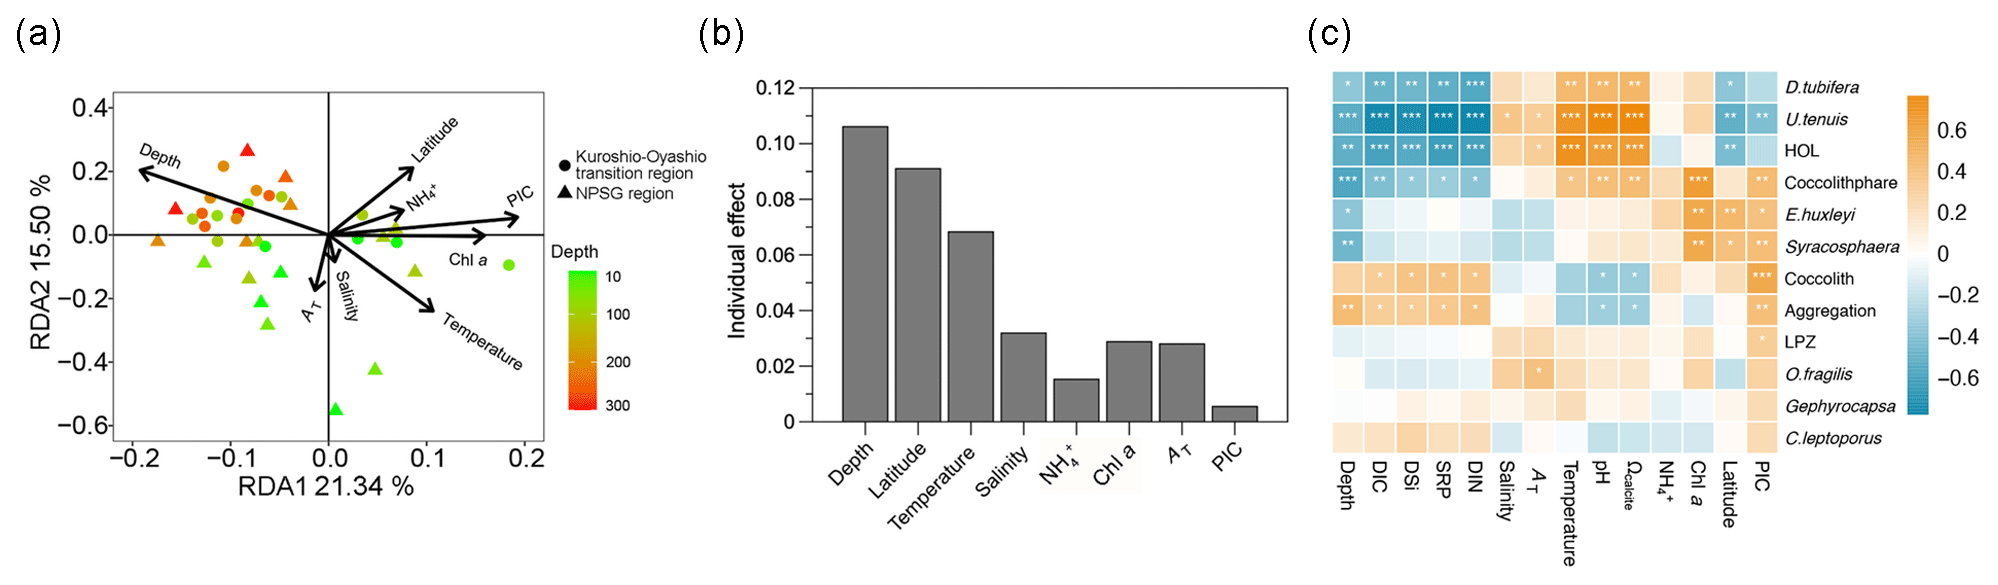
Figure 9(a) Redundancy analysis (RDA) diagram illustrating the relationship between the coccolithophore community and environmental factors, (b) independent contribution of each environmental factor to coccolithophore community variation using hierarchical-partitioning-based canonical analysis, and (c) correlations between coccolithophore groups and environmental factors with color gradients denoting the significance of the Spearman's correlation coefficient r. Asterisks represent the statistical significance ( p < 0.001, p < 0.01, and * p < 0.05). Chl a: chlorophyll a, DIC: dissolved inorganic carbon, AT: total alkalinity, Ωcalcite: saturation state with respect to calcite, PIC: particulate inorganic carbon, DIN: dissolved inorganic nitrogen (nitrate plus nitrite), NH: ammonium, SRP: soluble reactive phosphate, DSi: dissolved silicate, HOL: holo-coccolithophores, and LPZ: lower euphotic zone species Florisphaera profunda and Algirosphaera robusta.
4.3 CaCO3 production compared with the eastern North Pacific
While 14C incubations can provide a direct and precise measurement of in situ calcification rates, the calculation method we used offers a practical approach to convert concentration data into production estimates using turnover time (Graziano et al., 2000; Ziveri et al., 2023). This approach has limitations, particularly due to uncertainties in the estimation of coccolithophore calcite, which relies on cell counts and a morphometric-based calcite estimation method, with potential errors reaching up to 50 % (Young and Ziveri, 2000; Sheward et al., 2024). The calculation of production rates introduces further uncertainty, as it depends on the coccolithophore calcite standing stock and a broad range of turnover time estimates. Despite these challenges, this method produces reasonable results that are comparable to field observations and thus helps fill a critical data gap in the study region.
Our results indicate that the coccolithophore CaCO3 production ranged from 0.8 to 2.1 mmol m−2 d−1 during the sampling period, align with globally reported in situ calcification rates, and are consistent with observations from the North Atlantic subtropical region (Poulton et al., 2006; Daniels et al., 2018). Although station M30 is located in the oligotrophic NPSG region, it exhibits the highest coccolithophore CaCO3 production in the euphotic zone of the study area (Fig. 6c). This is primarily because of the deepest euphotic zone at this site, reaching up to 219 m, and the relatively high coccolithophore species diversity. While the coccolithophore abundance at station M30 was lower than at other stations, the less abundant but larger species played an important role in contributing to the CaCO3 production at this site.
Using a seasonal correction method (Ziveri et al., 2023), the average coccolithophore CaCO3 production in the euphotic zone was estimated to be 0.4 ± 0.3 mol m−2 yr−1 for the entire research domain. In particular, this production was 0.66 ± 0.2 mol m−2 yr−1 in the subtropical gyre and 0.13 ± 0.1 mol m−2 yr−1 in the Kuroshio–Oyashio transition region (Fig. 6d). However, the latter is much lower than the recent estimate of 0.9–1.0 mol m−2 yr−1 by Ziveri et al. (2023) based on data from the transition zone and subpolar gyre in the eastern North Pacific Ocean using the same seasonal correction method.
Several factors may lead to the above discrepancy. First, CaCO3 production rates in the present study were estimated based only on coccolithophores, whereas estimates by Ziveri et al. (2023) also included the contribution from planktonic foraminifera, pteropods, and heteropods. Second, in the CDisK-IV cruise to the eastern North Pacific Ocean, coccolithophore calcite concentrations were significantly higher than suspended seawater PIC concentrations collected by in situ pumps in the transition zone and subpolar gyre (Fig. S4; Dong et al., 2019, 2022). Calculations based on these apparently inconsistent data may result in an overestimation of actual CaCO3 production. Third, high spatial and seasonal variations in PIC production might occur between the two oceanic environments. Particularly, the complex environmental gradients and variability in the transition regions between the subtropical and subpolar gyres may have skewed the coccolithophore community and associated CaCO3 production.
Overall, our findings suggest the idea that while satellite-derived PIC can reflect surface-layer distribution patterns, its calibration should be interpreted with caution, as it does not reliably capture total water column PIC production. We observed a significant positive relationship between surface coccolithophore calcite concentrations and satellite-derived PIC concentrations (r2= 0.84, p < 0.01; Fig. S5a), indicating that satellite data can reflect the spatial distribution trends of the surface calcite. However, this correlation does not extend to actual values, particularly in high-latitude areas where satellite-derived PIC concentrations are likely overestimated. Across the full euphotic zone, no significant correlation was found between satellite-derived PIC concentrations and measured PIC production, which is also noted by Ziveri et al. (2023) for the CDisK-IV cruise (Fig. S5b). More in situ measurements, such as calcification rates determined from 14C incubations and direct measurements of coccolithophore turnover time, are needed to reduce uncertainties in estimating PIC production and assessing the oceanic CaCO3 budget.
We have demonstrated that coccolithophore abundance and species composition had distinct geographic and vertical distribution patterns, with U. tenuis dominating in the NPSG region, while E. huxleyi and Syracosphaera spp. dominate in the Kuroshio–Oyashio transition region. The environmental variables that best described varying coccolithophore communities were depth and latitude. Calcite derived from coccolithophores contributed 79 ± 27 % of the PIC standing stocks in the euphotic zone, with a relatively greater contribution in the subtropical gyre than in the transition region. Less abundant (< 3 %) species such as C. leptoporus and O. fragilis also made a large contribution of 21 % and 12 % to the coccolithophore calcite concentration in the NPSG region and the Kuroshio–Oyashio transition region, respectively. During the sampling period, coccolithophore CaCO3 production ranged from 0.8 to 2.1 mmol m−2 d−1 in the entire research domain, averaging 1.5 ± 0.7 mmol m−2 d−1 in the subtropical gyre and 1.2 ± 0.4 mmol m−2 d−1 in the Kuroshio–Oyashio transition region. Given the important role of CaCO3 dynamics in the marine alkalinity and carbon cycles, coccolithophore production at different scales from seasonal to annual and from regional to global needs further examination.
Data for temperature, salinity, coccolithophore cell and coccolith abundances, coccolithophore calcite, PIC, and nutrient concentrations can be downloaded from the Science Data Bank (https://doi.org/10.57760/sciencedb.12965, Han and Dai, 2025). Satellite-based temperature, Chl a, and PIC concentration data were obtained from the MODIS-Aqua satellite (https://oceancolor.gsfc.nasa.gov/l3/, NASA Ocean Biology Processing Group, 2024).
The supplement related to this article is available online at https://doi.org/10.5194/bg-22-3681-2025-supplement.
YH, ZC, and MD conceived and designed the study. YH, ZS, DF, and JC contributed to data acquisition and analysis. YH, ZS, ZC, and MD wrote the first draft of the paper. YH, ZS, ZC, JY, and MD discussed results and edited the paper. All authors read and approved the final version of the paper.
The contact authors have declared that none of the authors has any competing interests.
Publisher’s note: Copernicus Publications remains neutral with regard to jurisdictional claims made in the text, published maps, institutional affiliations, or any other geographical representation in this paper. While Copernicus Publications makes every effort to include appropriate place names, the final responsibility lies with the authors.
The captain and the crew of R/V Tan Kah Kee are thanked for their cooperation during the cruise. We thank Feipeng Xu and Xin Liu for providing the chlorophyll a data; Lifang Wang, Tao Huang, Yanmin Wang, and Zhijie Tan for the nutrient data; Yi Yang and Xianghui Guo for the carbonate system data; Xuchen Wang for advice on particulate inorganic carbon measurements; and Yanping Xu for logistical assistance. Yuye Han was supported by the Joint Training Program in Marine Environmental Sciences sponsored by the China Scholarship Council. Constructive comments by Alex Poulton, Chloe Dean, and Olivier Sulpis greatly improved the quality of this contribution.
This research was funded by the National Natural Science Foundation of China (NSFC project nos. 42141003 and 42188102). Data and samples were collected on board the R/V Tan Kah Kee during the open research cruise NORC2022-306 supported by the NSFC Shiptime Sharing Project (project no. 42149303).
This paper was edited by Olivier Sulpis and reviewed by Alex Poulton and Chloe Dean.
Armstrong, R. A., Lee, C., Hedges, J. I., Honjo, S., and Wakeham, S. G.: A new, mechanistic model for organic carbon fluxes in the ocean based on the quantitative association of POC with ballast minerals, Deep-Sea Res. Pt. II, 49, 219-236, https://doi.org/10.1016/S0967-0645(01)00101-1, 2001.
Balch, W. M.: The ecology, biogeochemistry, and optical properties of coccolithophores, Annu. Rev. Mar. Sci., 10, 71–98, https://doi.org/10.1146/annurev-marine-121916-063319, 2018.
Balch, W., Gordon, H. R., Bowler, B., Drapeau, D., and Booth, E.: Calcium carbonate measurements in the surface global ocean based on Moderate-Resolution Imaging Spectroradiometer data, J. Geophys. Res.-Oceans, 110, C07001, https://doi.org/10.1029/2004jc002560, 2005.
Balch, W., Drapeau, D., Bowler, B., and Booth, E.: Prediction of pelagic calcification rates using satellite measurements, Deep-Sea Res. Pt. II, 54, 478–495, https://doi.org/10.1016/j.dsr2.2006.12.006, 2007.
Balch, W. M., Bowler, B. C., Drapeau, D. T., Lubelczyk, L. C., and Lyczkowski, E.: Vertical distributions of coccolithophores, PIC, POC, biogenic Silica, and chlorophyll a throughout the global ocean, Global Biogeochem. Cy., 32, 2–17, https://doi.org/10.1002/2016gb005614, 2018.
Balch, W. M., Bates, N. R., Lam, P. J., Twining, B. S., Rosengard, S. Z., Bowler, B. C., Drapeau, D. T., Garley, R., Lubelczyk, L. C., and Mitchell, C.: Factors regulating the Great Calcite Belt in the Southern Ocean and its biogeochemical significance, Global Biogeochem. Cy., 30, 1124–1144, https://doi.org/10.1002/2016GB005414, 2016.
Balch, W. M., Bowler, B. C., Drapeau, D. T., Lubelczyk, L. C., Lyczkowski, E., Mitchell, C., and Wyeth, A.: Coccolithophore distributions of the north and south Atlantic ocean, Deep-Sea Res. Pt. I, 151, 103066, https://doi.org/10.1016/j.dsr.2019.06.012, 2019.
Barrett, P. M., Resing, J. A., Buck, N. J., Feely, R. A., Bullister, J. L., Buck, C. S., and Landing, W. M.: Calcium carbonate dissolution in the upper 1000 m of the eastern North Atlantic, Global Biogeochem. Cy., 28, 386–397, https://doi.org/10.1002/2013gb004619, 2014.
Beaufort, L., Couapel, M., Buchet, N., Claustre, H., and Goyet, C.: Calcite production by coccolithophores in the south east Pacific Ocean, Biogeosciences, 5, 1101–1117, https://doi.org/10.5194/bg-5-1101-2008, 2008.
Berelson, W., Balch, W., Najjar, R., Feely, R., Sabine, C., and Lee, K.: Relating estimates of CaCO3 production, export, and dissolution in the water column to measurements of CaCO3 rain into sediment traps and dissolution on the sea floor: A revised global carbonate budget, Global Biogeochem. Cy., 21, GB1024, https://doi.org/10.1029/2006gb002803, 2007.
Betzer, P., Byrne, R., Acker, J., Lewis, C., Jolley, R., and Feely, R.: The oceanic carbonate system: a reassessment of biogenic controls, Science, 226, 1074–1077, https://doi.org/10.1126/science.226.4678.1074, 1984.
Boeckel, B. and Baumann, K.-H.: Vertical and lateral variations in coccolithophore community structure across the subtropical frontal zone in the South Atlantic Ocean, Mar. Micropaleontol., 67, 255–273, https://doi.org/10.1016/j.marmicro.2008.01.014, 2008.
Bollmann, J., Cortés, M. Y., Haidar, A. T., Brabec, B., Close, A., Hofmann, R., Palma, S., Tupas, L., and Thierstein, H. R.: Techniques for quantitative analyses of calcareous marine phytoplankton, Mar. Micropaleontol., 44, 163–185, https://doi.org/10.1016/s0377-8398(01)00040-8, 2002.
Brand, L. E.: Physiological ecology of marine coccolithophores, in: Coccolithophores, edited by: Winter, A. and Siesser, W. G., Cambridge University Press, UK, 39–49, ISBN 9780521380508, 1994.
Broecker, W. S. and Peng, T.-H.: Tracers in the Sea, Lamont-Doherty Geological Observatory, Columbia University Palisades, New York, https://science.whoi.edu/users/mcgillic/cruises/TN376/cruiseshare/Morton lab/Texts/Tracers in the Sea - Broecker _ Peng.pdf#page=265.49 (last access: 23 August 2023), 1982.
Broerse, A. T., Ziveri, P., van Hinte, J. E., and Honjo, S.: Coccolithophore export production, species composition, and coccolith-CaCO3 fluxes in the NE Atlantic (34 N21 W and 48 N21 W), Deep-Sea Res. Pt. II, 47, 1877–1905, https://doi.org/10.1016/s0967-0645(00)00010-2, 2000.
Brun, P., Vogt, M., Payne, M. R., Gruber, N., O'Brien, C. J., Buitenhuis, E. T., Le Quéré, C., Leblanc, K., and Luo, Y. W.: Ecological niches of open ocean phytoplankton taxa, Limnol. Oceanogr., 60, 1020–1038, https://doi.org/10.1002/lno.10074, 2015.
Cai, W.-J., Dai, M., Wang, Y., Zhai, W., Huang, T., Chen, S., Zhang, F., Chen, Z., and Wang, Z.: The biogeochemistry of inorganic carbon and nutrients in the Pearl River estuary and the adjacent Northern South China Sea, Cont. Shelf Res., 24, 1301–1319, https://doi.org/10.1016/j.csr.2004.04.005, 2004.
Cai, W. J., Hu, X., Huang, W. J., Jiang, L. Q., Wang, Y., Peng, T. H., and Zhang, X.: Alkalinity distribution in the western North Atlantic Ocean margins, J. Geophys. Res.-Oceans, 115, C08014, https://doi.org/10.1029/2009jc005482, 2010.
Charalampopoulou, A.: Coccolithophores in high latitude and polar regions: relationships between community composition, calcification and environmental factors, PhD thesis, University of Southampton, https://eprints.soton.ac.uk/209545/ (last access: 29 February 2024), 2011.
Cornec, M., Laxenaire, R., Speich, S., and Claustre, H.: Impact of mesoscale eddies on deep chlorophyll maxima, Geophys. Res. Lett., 48, e2021GL093470, https://doi.org/10.1029/2021GL093470, 2021.
Daniels, C. J., Poulton, A. J., Young, J. R., Esposito, M., Humphreys, M. P., Ribas-Ribas, M., Tynan, E., and Tyrrell, T.: Species-specific calcite production reveals Coccolithus pelagicus as the key calcifier in the Arctic Ocean, Mar. Ecol. Prog. Ser., 555, 29–47, 2016.
Daniels, C. J., Poulton, A. J., Balch, W. M., Marañón, E., Adey, T., Bowler, B. C., Cermeño, P., Charalampopoulou, A., Crawford, D. W., Drapeau, D., Feng, Y., Fernández, A., Fernández, E., Fragoso, G. M., González, N., Graziano, L. M., Heslop, R., Holligan, P. M., Hopkins, J., Huete-Ortega, M., Hutchins, D. A., Lam, P. J., Lipsen, M. S., López-Sandoval, D. C., Loucaides, S., Marchetti, A., Mayers, K. M. J., Rees, A. P., Sobrino, C., Tynan, E., and Tyrrell, T.: A global compilation of coccolithophore calcification rates, Earth Syst. Sci. Data, 10, 1859–1876, https://doi.org/10.5194/essd-10-1859-2018, 2018.
Dean, C. L., Harvey, E. L., Johnson, M. D., and Subhas, A. V.: Microzooplankton grazing on the coccolithophore Emiliania huxleyi and its role in the global calcium carbonate cycle, Science Advances, 10, eadr5453, https://doi.org/10.1126/sciadv.adr5453, 2024.
Deng, Y., Li, P., Fang, T., Jiang, Y., Chen, J., Chen, N., Yuan, D., and Ma, J.: Automated determination of dissolved reactive phosphorus at nanomolar to micromolar levels in natural waters using a portable flow analyzer, Anal. Chem., 92, 4379–4386, https://doi.org/10.1021/acs.analchem.9b05252.s001, 2020.
Dong, S., Berelson, W. M., Rollins, N. E., Subhas, A. V., Naviaux, J. D., Celestian, A. J., Liu, X., Turaga, N., Kemnitz, N. J., and Byrne, R. H.: Aragonite dissolution kinetics and calcite/aragonite ratios in sinking and suspended particles in the North Pacific, Earth Planet. Sc. Lett., 515, 1–12, https://doi.org/10.1016/j.epsl.2019.03.016, 2019.
Dong, S., Wang, X. T., Subhas, A. V., Pavia, F. J., Adkins, J. F., and Berelson, W. M.: Depth profiles of suspended carbon and nitrogen along a North Pacific transect: Concentrations, isotopes, and ratios, Limnol. Oceanogr., 67, 247–260, https://doi.org/10.1002/lno.11989, 2022.
Eguchi, N. O., Ujiié, H., Kawahata, H., and Taira, A.: Seasonal variations in planktonic foraminifera at three sediment traps in the subarctic, transition and subtropical zones of the central North Pacific Ocean, Mar. Micropaleontol., 48, 149–163, https://doi.org/10.1016/S0377-8398(03)00020-3, 2003.
Fabry, V. J.: Aragonite production by pteropod molluscs in the subarctic Pacific, Deep-Sea Res. Pt. I, 36, 1735–1751, https://doi.org/10.1016/0198-0149(89)90069-1, 1989.
Feely, R., Sabine, C., Lee, K., Millero, F., Lamb, M., Greeley, D., Bullister, J., Key, R., Peng, T. H., and Kozyr, A.: In situ calcium carbonate dissolution in the Pacific Ocean, Global Biogeochem. Cy., 16, 91-1–91-12, https://doi.org/10.1029/2002gb001866, 2002.
Feely, R. A., Sabine, C. L., Lee, K., Berelson, W., Kleypas, J., Fabry, V. J., and Millero, F. J.: Impact of anthropogenic CO2 on the CaCO3 system in the oceans, Science, 305, 362–366, https://doi.org/10.1126/science.1097329, 2004.
Graziano, L. M., Balch, W. M., Drapeau, D., Bowler, B. C., Vaillancourt, R., and Dunford, S.: Organic and inorganic carbon production in the Gulf of Maine, Cont. Shelf Res., 20, 685–705, https://doi.org/10.1016/S0278-4343(99)00091-6, 2000.
Gregg, W. W. and Casey, N. W.: Modeling coccolithophores in the global oceans, Deep-Sea Res. Pt. II, 54, 447–477, https://doi.org/10.1016/j.dsr2.2006.12.007, 2007.
Hagino, K., Okada, H., and Matsuoka, H.: Coccolithophore assemblages and morphotypes of Emiliania huxleyi in the boundary zone between the cold Oyashio and warm Kuroshio currents off the coast of Japan, Mar. Micropaleontol., 55, 19–47, https://doi.org/10.1016/j.marmicro.2005.02.002, 2005.
Han, Y. Y. and Dai, M. H.: Coccolithophore abundance and production and their impacts on particulate inorganic carbon cycling in the western North Pacific, Science Data Bank [data set], https://doi.org/10.57760/sciencedb.12965, 2025.
Hartnett, A., Böttger, L. H., Matzanke, B. F., and Carrano, C. J.: Iron transport and storage in the coccolithophore: Emiliania huxleyi, Metallomics, 4, 1160–1166, https://doi.org/10.1039/c2mt20144e, 2012.
Hirata, T., Hardman-Mountford, N. J., Brewin, R. J. W., Aiken, J., Barlow, R., Suzuki, K., Isada, T., Howell, E., Hashioka, T., Noguchi-Aita, M., and Yamanaka, Y.: Synoptic relationships between surface Chlorophyll-a and diagnostic pigments specific to phytoplankton functional types, Biogeosciences, 8, 311–327, https://doi.org/10.5194/bg-8-311-2011, 2011.
Holligan, P., Charalampopoulou, A., and Hutson, R.: Seasonal distributions of the coccolithophore, Emiliania huxleyi, and of particulate inorganic carbon in surface waters of the Scotia Sea, J. Marine Syst., 82, 195–205, https://doi.org/10.1016/j.jmarsys.2010.05.007, 2010.
Jin, X., Liu, C., Poulton, A. J., Dai, M., and Guo, X.: Coccolithophore responses to environmental variability in the South China Sea: species composition and calcite content, Biogeosciences, 13, 4843–4861, https://doi.org/10.5194/bg-13-4843-2016, 2016.
Johns, C. T., Bondoc-Naumovitz, K. G., Matthews, A., Matson, P. G., Iglesias-Rodriguez, M. D., Taylor, A. R., Fuchs, H. L., and Bidle, K. D.: Adsorptive exchange of coccolith biominerals facilitates viral infection, Science Advances, 9, eadc8728, https://doi.org/10.1126/sciadv.adc8728, 2023.
Klaas, C. and Archer, D. E.: Association of sinking organic matter with various types of mineral ballast in the deep sea: Implications for the rain ratio, Global Biogeochem. Cy., 16, 63-1–63-14, https://doi.org/10.1029/2001gb001765, 2002.
Krumhardt, K. M., Lovenduski, N. S., Iglesias-Rodriguez, M. D., and Kleypas, J. A.: Coccolithophore growth and calcification in a changing ocean, Prog Oceanogr, 159, 276–295, https://doi.org/10.1016/j.pocean.2017.10.007, 2017.
Lai, J., Zou, Y., Zhang, J., and Peres-Neto, P. R.: Generalizing hierarchical and variation partitioning in multiple regression and canonical analyses using the rdacca. hp R package, Methods Ecol. Evol., 13, 782–788, https://doi.org/10.1111/2041-210X.13800, 2022.
Lam, P. J., Ohnemus, D. C., and Auro, M. E.: Size-fractionated major particle composition and concentrations from the US GEOTRACES North Atlantic Zonal Transect, Deep-Sea Res. Pt. II, 116, 303–320, https://doi.org/10.1016/j.dsr2.2014.11.020, 2015.
Lam, P. J., Lee, J.-M., Heller, M. I., Mehic, S., Xiang, Y., and Bates, N. R.: Size-fractionated distributions of suspended particle concentration and major phase composition from the US GEOTRACES Eastern Pacific Zonal Transect (GP16), Mar. Chem., 201, 90–107, https://doi.org/10.1016/j.marchem.2017.08.013, 2018.
Li, Y., Meng, F., Wang, B., Yang, M., Liu, C.-Q., and Xu, S.: Regulation of particulate inorganic carbon by phytoplankton in hydropower reservoirs: Evidence from stable carbon isotope analysis, Chem. Geol., 579, 120366, https://doi.org/10.1016/j.chemgeo.2021.120366, 2021.
Lohbeck, K. T., Riebesell, U., and Reusch, T. B.: Adaptive evolution of a key phytoplankton species to ocean acidification, Nat. Geosci., 5, 346–351, https://doi.org/10.1038/ngeo1441, 2012.
Ma, D., Gregor, L., and Gruber, N.: Four decades of trends and drivers of global surface ocean acidification, Global Biogeochem. Cy., 37, e2023GB007765, https://doi.org/10.1029/2023GB007765, 2023.
Maranón, E., Balch, W. M., Cermeno, P., González, N., Sobrino, C., Fernández, A., Huete-Ortega, M., López-Sandoval, D. C., Delgado, M., and Estrada, M.: Coccolithophore calcification is independent of carbonate chemistry in the tropical ocean, Limnol. Oceanogr., 61, 1345–1357, https://doi.org/10.1002/lno.10295, 2016.
NASA Ocean Biology Processing Group: Moderate Resolution Imaging Spectroradiometer (MODIS)-Aqua satellite Level-3 Ocean Color Data, NASA Ocean Biology Distributed Active Archive Center [data set], https://oceandata.sci.gsfc.nasa.gov/l3/, last access: 29 February 2024.
Naviaux, J. D., Subhas, A. V., Rollins, N. E., Dong, S., Berelson, W. M., and Adkins, J. F.: Temperature dependence of calcite dissolution kinetics in seawater, Geochim. Cosmochim. Ac., 246, 363–384, https://doi.org/10.1016/j.gca.2018.11.037, 2019.
Neukermans, G., Bach, L., Butterley, A., Sun, Q., Claustre, H., and Fournier, G.: Quantitative and mechanistic understanding of the open ocean carbonate pump-perspectives for remote sensing and autonomous in situ observation, Earth-Sci. Rev., 239, 104359, https://doi.org/10.1016/j.earscirev.2023.104359, 2023.
O'Brien, C. J., Vogt, M., and Gruber, N.: Global coccolithophore diversity: Drivers and future change, Prog. Oceanogr., 140, 27–42, https://doi.org/10.1016/j.pocean.2015.10.003, 2016.
Okada, H. and Honjo, S.: The distribution of oceanic coccolithophorids in the Pacific, Deep Sea Research and Oceanographic Abstracts, 355-374, https://doi.org/10.1016/0011-7471(73)90059-4, 1973.
Oksanen, J.: Vegan: community ecology package, http://vegan.r-forge.r-project.org/ (last access: 15 February 2024), 2010.
Poulton, A., Sanders, R., Holligan, P., Stinchcombe, M., Adey, T., Brown, L., and Chamberlain, K.: Phytoplankton mineralization in the tropical and subtropical Atlantic Ocean, Global Biogeochem. Cy., 20, GB4002, https://doi.org/10.1029/2006gb002712, 2006.
Poulton, A. J., Holligan, P. M., Charalampopoulou, A., and Adey, T. R.: Coccolithophore ecology in the tropical and subtropical Atlantic Ocean: New perspectives from the Atlantic meridional transect (AMT) programme, Prog. Oceanogr., 158, 150–170, https://doi.org/10.1016/j.pocean.2017.01.003, 2017.
Poulton, A. J., Painter, S. C., Young, J. R., Bates, N. R., Bowler, B., Drapeau, D., Lyczsckowski, E., and Balch, W. M.: The 2008 Emiliania huxleyi bloom along the Patagonian Shelf: Ecology, biogeochemistry, and cellular calcification, Global Biogeochem. Cy., 27, 1023–1033, https://doi.org/10.1002/2013gb004641, 2013.
Quere, C. L., Harrison, S. P., Colin Prentice, I., Buitenhuis, E. T., Aumont, O., Bopp, L., Claustre, H., Cotrim Da Cunha, L., Geider, R., and Giraud, X.: Ecosystem dynamics based on plankton functional types for global ocean biogeochemistry models, Glob. Change Biol., 11, 2016–2040, https://doi.org/10.1111/j.1365-2486.2005.1004.x, 2005.
Raven, J. A. and Crawfurd, K.: Environmental controls on coccolithophore calcification, Mar. Ecol. Prog. Ser., 470, 137–166, https://doi.org/10.3354/meps09993, 2012.
Rickaby, R., Monteiro, F., Bach, L., Brownlee, C., Bown, P., Poulton, A., Beaufort, L., Dutkiewicz, S., Gibbs, S., and Gutowska, M.: Why marine phytoplankton calcify, Science Advances, 2, e1501822, https://doi.org/10.1126/sciadv.1501822, 2016a.
Rickaby, R. E., Hermoso, M., Lee, R. B., Rae, B. D., Heureux, A. M., Balestreri, C., Chakravarti, L., Schroeder, D. C., and Brownlee, C.: Environmental carbonate chemistry selects for phenotype of recently isolated strains of Emiliania huxleyi, Deep-Sea Res. Pt. II, 127, 28–40, https://doi.org/10.1016/j.dsr2.2016.02.010, 2016b.
Rigual Hernández, A. S., Trull, T. W., Nodder, S. D., Flores, J. A., Bostock, H., Abrantes, F., Eriksen, R. S., Sierro, F. J., Davies, D. M., Ballegeer, A.-M., Fuertes, M. A., and Northcote, L. C.: Coccolithophore biodiversity controls carbonate export in the Southern Ocean, Biogeosciences, 17, 245–263, https://doi.org/10.5194/bg-17-245-2020, 2020.
Rivero-Calle, S., Gnanadesikan, A., Del Castillo, C. E., Balch, W. M., and Guikema, S. D.: Multidecadal increase in North Atlantic coccolithophores and the potential role of rising CO2, Science, 350, 1533–1537, https://doi.org/10.1126/science.aaa8026, 2015.
Rousseaux, C. S. and Gregg, W. W.: Recent decadal trends in global phytoplankton composition, Global Biogeochem. Cy., 29, 1674–1688, https://doi.org/10.1002/2015gb005139, 2015.
Saavedra-Pellitero, M., Baumann, K.-H., Flores, J.-A., and Gersonde, R.: Biogeographic distribution of living coccolithophores in the Pacific sector of the Southern Ocean, Mar. Micropaleontol., 109, 1–20, https://doi.org/10.1016/j.marmicro.2014.03.003, 2014.
Schiebel, R., Spielhagen, R. F., Garnier, J., Hagemann, J., Howa, H., Jentzen, A., Martínez-Garcia, A., Meilland, J., Michel, E., and Repschläger, J.: Modern planktic foraminifers in the high-latitude ocean, Mar. Micropaleontol., 136, 1–13, https://doi.org/10.1016/j.marmicro.2017.08.004, 2017.
Schlitzer, R.: Ocean Data View, https://odv.awi.de (last access: 23 November 2023), 2020.
Schlüter, L., Lohbeck, K. T., Gutowska, M. A., Gröger, J. P., Riebesell, U., and Reusch, T. B.: Adaptation of a globally important coccolithophore to ocean warming and acidification, Nat. Clim. Change, 4, 1024–1030, https://doi.org/10.1038/nclimate2379, 2014.
Sheward, R. M., Poulton, A. J., Young, J. R., de Vries, J., Monteiro, F. M., and Herrle, J. O.: Cellular morphological trait dataset for extant coccolithophores from the Atlantic Ocean, Scientific Data, 11, 720, https://doi.org/10.1038/s41597-024-03544-1, 2024.
Sinha, B., Buitenhuis, E. T., Le Quéré, C., and Anderson, T. R.: Comparison of the emergent behavior of a complex ecosystem model in two ocean general circulation models, Prog. Oceanogr., 84, 204–224, https://doi.org/10.1016/j.pocean.2009.10.003, 2010.
Smith, S. V. and Mackenzie, F. T.: The role of CaCO3 reactions in the contemporary oceanic CO2 cycle, Aquat. Geochem., 22, 153–175, https://doi.org/10.1007/s10498-015-9282-y, 2016.
Subhas, A. V., Dong, S., Naviaux, J. D., Rollins, N. E., Ziveri, P., Gray, W., Rae, J. W., Liu, X., Byrne, R. H., and Chen, S.: Shallow calcium carbonate cycling in the North Pacific Ocean, Global Biogeochem. Cy., 36, e2022GB007388, https://doi.org/10.7185/gold2021.4474, 2022.
Sugie, K. and Suzuki, K.: Characterization of the synoptic-scale diversity, biogeography, and size distribution of diatoms in the North Pacific, Limnol. Oceanogr., 62, 884–897, https://doi.org/10.1002/lno.10473, 2017.
Takahashi, T., Sutherland, S. C., Wanninkhof, R., Sweeney, C., Feely, R. A., Chipman, D. W., Hales, B., Friederich, G., Chavez, F., and Sabine, C.: Climatological mean and decadal change in surface ocean pCO2, and net sea–air CO2 flux over the global oceans, Deep-Sea Res. Pt. II, 56, 554–577, https://doi.org/10.1016/j.dsr2.2008.12.009, 2009.
Taylor, A. R., Brownlee, C., and Wheeler, G.: Coccolithophore cell biology: chalking up progress, Annu. Rev. Mar. Sci., 9, 283–310, https://doi.org/10.1146/annurev-marine-122414-034032, 2017.
Taylor, B. J., Rae, J. W., Gray, W. R., Darling, K. F., Burke, A., Gersonde, R., Abelmann, A., Maier, E., Esper, O., and Ziveri, P.: Distribution and ecology of planktic foraminifera in the North Pacific: Implications for paleo-reconstructions, Quaternary Sci. Rev., 191, 256–274, https://doi.org/10.1016/j.quascirev.2018.05.006, 2018.
Vincent, F., Gralka, M., Schleyer, G., Schatz, D., Cabrera-Brufau, M., Kuhlisch, C., Sichert, A., Vidal-Melgosa, S., Mayers, K., Barak-Gavish, N., Flores, J. M., Masdeu-Navarro, M., Egge, J. K., Larsen, A., Hehemann, J.-H., Marrasé, C., Simó, R., Cordero, O. X., and Vardi, A.: Viral infection switches the balance between bacterial and eukaryotic recyclers of organic matter during coccolithophore blooms, Nat. Commun., 14, 510, https://doi.org/10.1038/s41467-023-36049-3, 2023.
Volk, T. and Hoffert, M. I.: Ocean carbon pumps: analysis of relative strength and efficiencies of in ocean-driven circulation atmospheric CO2 changes, in: The carbon cycle and atmospheric CO2: Natural variation Archean to Present, edited by: Sundquist, E. T. and Broecker, W. S., AGU Monograph 32, American Geophysical Union, Washington, DC, 99–110, https://doi.org/10.1029/gm032p0099, 1985.
Welschmeyer, N. A.: Fluorometric analysis of chlorophyll a in the presence of chlorophyll b and pheopigments, Limnol. Oceanogr., 39, 1985–1992, https://doi.org/10.4319/lo.1994.39.8.1985, 1994.
Yang, T.-N. and Wei, K.-Y.: How many coccoliths are there in a coccosphere of the extant coccolithophorids? A compilation, Br. Phycol. J., 26, 67–80, https://doi.org/10.58998/jnr2275, 2003.
Young, J.: Coccobiom2 Macros, http://ina.tmsoc.org/nannos/coccobiom/Usernotes.html (last access: 23 August 2023), 2015.
Young, J., Geisen, M., Cros, L., Kleijne, A., Sprengel, C., Probert, I., and Østergaard, J.: A guide to extant coccolithophore taxonomy, Journal of Nannoplankton Research, 1, 1–132, https://doi.org/10.58998/jnr2297, 2003.
Young, J. R. and Ziveri, P.: Calculation of coccolith volume and it use in calibration of carbonate flux estimates, Deep-Sea Res. Pt. II, 47, 1679–1700, https://doi.org/10.1016/s0967-0645(00)00003-5, 2000.
Zhang, J.-Z.: Shipboard automated determination of trace concentrations of nitrite and nitrate in oligotrophic water by gas-segmented continuous flow analysis with a liquid waveguide capillary flow cell, Deep-Sea Res. Pt. I, 47, 1157–1171, https://doi.org/10.1016/s0967-0637(99)00085-0, 2000.
Zhu, Y., Yuan, D., Huang, Y., Ma, J., and Feng, S.: A sensitive flow-batch system for on board determination of ultra-trace ammonium in seawater: Method development and shipboard application, Anal. Chim. Acta, 794, 47–54, https://doi.org/10.1016/j.aca.2013.08.009, 2013.
Zhu, Y., Liu, J., Huang, T., Wang, L., Trull, T. W., and Dai, M.: On the fluorometric measurement of ammonium in oligotrophic seawater: Assessment of reagent blanks and interferences, Limnol. Oceanogr.-Meth., 16, 516–524, https://doi.org/10.1002/lom3.10263, 2018.
Ziveri, P., de Bernardi, B., Baumann, K.-H., Stoll, H. M., and Mortyn, P. G.: Sinking of coccolith carbonate and potential contribution to organic carbon ballasting in the deep ocean, Deep-Sea Res. Pt. II, 54, 659–675, https://doi.org/10.1016/j.dsr2.2007.01.006, 2007.
Ziveri, P., Gray, W. R., Anglada-Ortiz, G., Manno, C., Grelaud, M., Incarbona, A., Rae, J. W. B., Subhas, A. V., Pallacks, S., and White, A.: Pelagic calcium carbonate production and shallow dissolution in the North Pacific Ocean, Nat. Commun., 14, 805, https://doi.org/10.1038/s41467-023-36177-w, 2023.