the Creative Commons Attribution 4.0 License.
the Creative Commons Attribution 4.0 License.
 | 06 Aug 2025
Methane, carbon dioxide, and nitrous oxide emissions from two clear-water and two turbid-water urban ponds in Brussels (Belgium)
Thomas Bauduin
Nathalie Gypens
Alberto V. Borges
Shallow ponds can occur either in a clear-water state dominated by macrophytes or a turbid-water state dominated by phytoplankton, but it is unclear if and how these two alternative states affect the emission of greenhouse gases (GHGs) such as carbon dioxide (CO2), methane (CH4), and nitrous oxide (N2O) to the atmosphere. We measured the dissolved concentration of CO2, CH4, and N2O from which the diffusive air–water fluxes were computed, in four urban ponds in the city of Brussels (Belgium): two clear-water macrophyte-dominated ponds (Silex and Tenreuken), and two turbid-water phytoplankton-dominated ponds (Leybeek and Pêcheries) on 46 occasions over 2.5 years (between June 2021 and December 2023). Ebullitive CH4 fluxes were measured with bubble traps in the four ponds during deployments in spring, summer, and autumn, totalling 48 d of measurements. Measured ancillary variables included water temperature, oxygen saturation level ( %O2), concentrations of chlorophyll-a (Chl-a), total suspended matter (TSM), soluble reactive phosphorus (SRP), nitrite (NO), nitrate (NO), and ammonium (NH). The turbid-water and clear-water ponds did not differ significantly in terms of diffusive emissions of CO2 and N2O. Clear-water ponds exhibited higher values of ebullitive CH4 emissions compared to turbid-water ponds, most probably in relation to the delivery of organic matter from macrophytes to sediments, but the diffusive CH4 emissions were not significantly different between clear- and turbid-water ponds. Across seasons, CH4 emissions increased with water temperature in all four ponds, with ebullitive CH4 fluxes having a stronger dependence on water temperature (Q10) than diffusive CH4 fluxes. The temperature sensitivity of ebullitive CH4 fluxes decreased with increasing water depth, implying that shallow sediments would respond more strongly to warming (e.g. heat waves). Total annual CH4 emissions (diffusive + ebullitive) in CO2 equivalents equalled those of CO2 in turbid-water ponds and exceeded those of CO2 in clear-water ponds, while N2O emissions were negligible compared to the other two GHGs. Total annual GHG emissions in CO2 equivalents from all four ponds increased from 2022 to 2023 due to higher CO2 diffusive fluxes, likely driven by higher annual precipitation in 2023 compared to 2022 (leading putatively to higher inputs for organic or inorganic carbon from run-off), possibly in response to the intense El Niño event of 2023. The findings of this work suggest that it might be necessary to account for the presence of submerged macrophytes when extrapolating ebullitive CH4 fluxes in ponds at a larger scale (regional or global) (particularly if Chl-a is used as a descriptor), although it might be less critical for the extrapolation of diffusive CH4, CO2, and N2O fluxes.
- Article
(3630 KB) - Full-text XML
-
Supplement
(2133 KB) - BibTeX
- EndNote


Greenhouse gas (GHG) emissions from inland water (rivers, lakes, and reservoirs) to the atmosphere such as carbon dioxide (CO2), methane (CH4), and nitrous oxide (N2O) are quantitatively important for global budgets (Lauerwald et al., 2023). Global GHG emissions from lakes are lower than from rivers for CO2 (Raymond et al., 2013) and for N2O (Lauerwald et al., 2019; Maavara et al., 2019). However, reported global emissions of CH4 from lakes (Rosentreter et al., 2021; Johnson et al., 2022) are equivalent or even higher compared to rivers (Stanley et al., 2016; Rocher-Ros et al., 2023). Global emissions of CO2 and CH4 from lakes to the atmosphere represent 1.25 to 2.30 Pg CO2 equivalents (CO2-eq) annually, with a significant proportion from CH4 emissions, and represent nearly 20 % of global CO2 emissions from fossil fuels (DelSontro et al., 2018). The contribution of CO2 and CH4 emissions from small lentic water bodies (small lakes and ponds) can be disproportionately high compared to large systems (Holgerson and Raymond, 2016) as small lakes and ponds are the most abundant of all water body types in number (Verpoorter et al., 2014; Cael et al., 2017), and fluxes per square metre are usually higher from smaller water bodies. The emissions of GHGs from artificial water bodies such as agricultural reservoirs, urban ponds, and storm-water retention basins could be higher than those from natural systems (Martinez-Cruz et al., 2017; Grinham et al., 2018; Herrero Ortega et al., 2019; Gorsky et al., 2019; Ollivier et al., 2019; Peacock et al., 2019, 2021; Webb et al., 2019; Bauduin et al., 2024a). These higher GHG emissions seem to result from higher external inputs of anthropogenic organic carbon and dissolved inorganic nitrogen (DIN) into artificial systems but might also reflect other differences compared to natural systems such as in hydrology (Clifford and Heffernan, 2018). Among artificial systems, urban ponds are the subject of a growing body of literature on GHG emissions (Singh et al., 2000; Natchimuthu et al., 2014; van Bergen et al., 2019; Audet et al., 2020; Peacock et al., 2021; Goeckner et al., 2022; Ray and Holgerson, 2023; Ray et al. 2023; Bauduin et al., 2024a). Urban areas can have numerous small artificial water bodies mostly associated with green spaces such as public parks, and their number is increasing due to rapid urbanization worldwide (Brans et al., 2018; Audet et al., 2020; Gorsky et al., 2024; Rabey and Cotner, 2024). Urban ponds are generally small and shallow, and usually their catchment consists of a majority of impervious surfaces with a smaller contribution from soils (Davidson et al., 2015; Peacock et al., 2021). In general, the main function of urban ponds is for storm-water management, but they provide additional benefits including aesthetic/recreational amenities and habitats for wildlife (e.g. Tixier et al., 2011; Hassall, 2014).
Shallow ponds and lakes occur in two alternative states corresponding to systems with either clear waters (macrophyte-dominated) or turbid waters (phytoplankton-dominated) during the productive period of the year (spring and summer in mid-latitudes) (Scheffer et al., 1993). Submerged macrophytes and phytoplankton regulate CO2 dynamics directly through photosynthesis that can be more or less balanced by community respiration in the water column (e.g. Sand-Jensen and Staehr, 2007). However, it is not clear whether the presence of macrophytes increases or decreases the net CO2 emissions from ponds and lakes. Some studies have shown a decrease in CO2 emissions with increasing macrophyte density (Kosten et al., 2010; Ojala et al., 2011; Davidson et al., 2015), but other studies showed the opposite pattern (Theus et al., 2023). In phytoplankton-dominated lakes, CO2 concentrations depend in part on the developmental stage of phytoplankton, with the growth and peak phases generally coinciding with lower CO2 concentrations due to photosynthesis (Grasset et al., 2020; Vachon et al., 2020).
CH4 emissions have been reported to increase with the concentration of chlorophyll-a (Chl-a) in phytoplankton-dominated lakes (DelSontro et al., 2018; Borges et al., 2022). The presence of macrophytes strongly affects the production of CH4 in freshwaters (Bastviken et al., 2023), and vegetated littoral zones of lakes exhibit higher CH4 emissions than non-vegetated zones (Hyvönen et al., 1998; Huttunen et al., 2003; Juutinen et al., 2003; Desrosiers et al., 2022; Theus et al., 2023). Macrophytes influence organic matter decomposition processes in sediments depending on the quality and quantity of plant matter they release into their environment (Reitsema et al., 2018; Grasset et al., 2019; Harpenslager et al., 2022; Theus et al., 2023). Yet, few studies have consistently compared CH4 emissions in clear-water and turbid-water ponds (Hilt et al., 2017). A study in Argentina reported higher dissolved CH4 concentrations in clear-water ponds with submerged macrophytes compared to turbid-water phytoplankton-dominated ponds but no differences in measured CH4 emissions (Baliña et al., 2023).
The production of N2O predominantly occurs through microbial nitrification and denitrification that depend on DIN, O2 levels, and temperature (Codispoti and Christensen, 1985; Mengis et al., 1997; Velthuis and Veraart, 2022). Competition for DIN between primary producers and N2O-producing microorganisms can impact N2O production. Additionally, the transfer of labile phytoplankton organic matter to sediments fuels benthic denitrification and impacts N2O fluxes. Eutrophication is assumed to drive high N2O emissions from lakes and ponds (Audet et al., 2020; Webb et al., 2021; Wang et al., 2021; Xie et al., 2024), but some lakes with elevated Chl-a concentrations can act as sinks of N2O due to removal of N2O by denitrification (Webb et al., 2019; Borges et al., 2022, 2023). The presence of macrophytes also strongly influences nitrogen cycling in sediments of lakes and ponds (Barko et al., 1991; Choudhury et al., 2018; Deng et al., 2020; Dan et al., 2021) and should in theory also affect N2O emissions, although this is seldom investigated, and available studies provide contradictory conclusions. N2O emissions have been shown to follow diurnal cycles of O2 concentrations in areas dominated by submerged macrophytes in Lake Wuliangsuhai (China) (Ni et al., 2022) and the seasonal cycle of aboveground biomass of emerged macrophytes (Phragmites) in Baiyangdian Lake (China) (Yang et al., 2012). On the contrary, a study showed there was no significant difference of N2O production in sediments of macrophyte-rich (n=10) and macrophyte-free (n=12) lakes in subtropical China (Liu et al., 2018). There has been a very limited number of studies systematically investigating how emissions differ between ponds dominated by phytoplankton and those dominated by macrophytes (Baliña et al., 2023) and none simultaneously investigating CO2, CH4, and N2O emissions including both diffusive and ebullitive components.
The emissions of CO2 and N2O from aquatic systems are exclusively through diffusion across the air–water interface (diffusive flux), while CH4 can be additionally emitted as bubbles are released from sediments to the atmosphere (ebullitive flux). At annual scale, ebullitive CH4 flux usually represents more than half of total (diffusive + ebullitive) CH4 emissions from shallow lakes (Wik et al., 2013; Deemer and Holgerson, 2021), although the relative contribution of ebullitive and diffusive CH4 emissions is highly variable seasonally (e.g. Wik et al., 2013; Ray and Holgerson, 2023; Rabaey and Cotner 2024). Ebullitive CH4 fluxes are particularly high in the littoral zone of lakes at depths <5 m (Wik et al., 2013; DelSontro et al., 2016; Borges et al., 2022) and strongly increase in response to temperature (DelSontro et al., 2016; Aben et al., 2017; Rabaey and Cotner, 2024), as well as organic matter availability (DelSontro et al., 2016, 2018). Ebullitive CH4 fluxes tend to be higher in small and shallow water bodies (Deemer and Holgerson, 2021) but are notoriously variable in time and space and are difficult to estimate reliably (DelSontro et al., 2011).
Here, we report a data set of CO2, CH4, and N2O dissolved concentrations in four shallow and small urban ponds (Leybeek, Pêcheries, Silex, and Tenreuken) in the city of Brussels (Belgium) (Fig. 1), with data collected 46 times at regular intervals (between June 2021 and December 2023) on each pond. The air–water diffusive fluxes of CO2, CH4, and N2O were calculated from dissolved concentrations and the gas transfer velocity, while the ebullitive CH4 fluxes were measured with inverted funnels during eight deployments (totalling 48 d) in the four ponds. The four ponds have similar depth, surface area, and catchment urban coverage and mainly differ by the phytoplankton-macrophyte dominance, a clear-water state dominated by macrophytes and a turbid-water state dominated by phytoplankton (alternative states) (Fig. 1). We assess whether the differences in terms of (i) CO2, CH4, and N2O dissolved concentration and diffusive emissions; (ii) ebullitive CH4 emissions; and (iii) the relative contribution of CO2, CH4, and N2O to the total GHG emissions in CO2-eq between the four ponds are explained by the two alternative states.
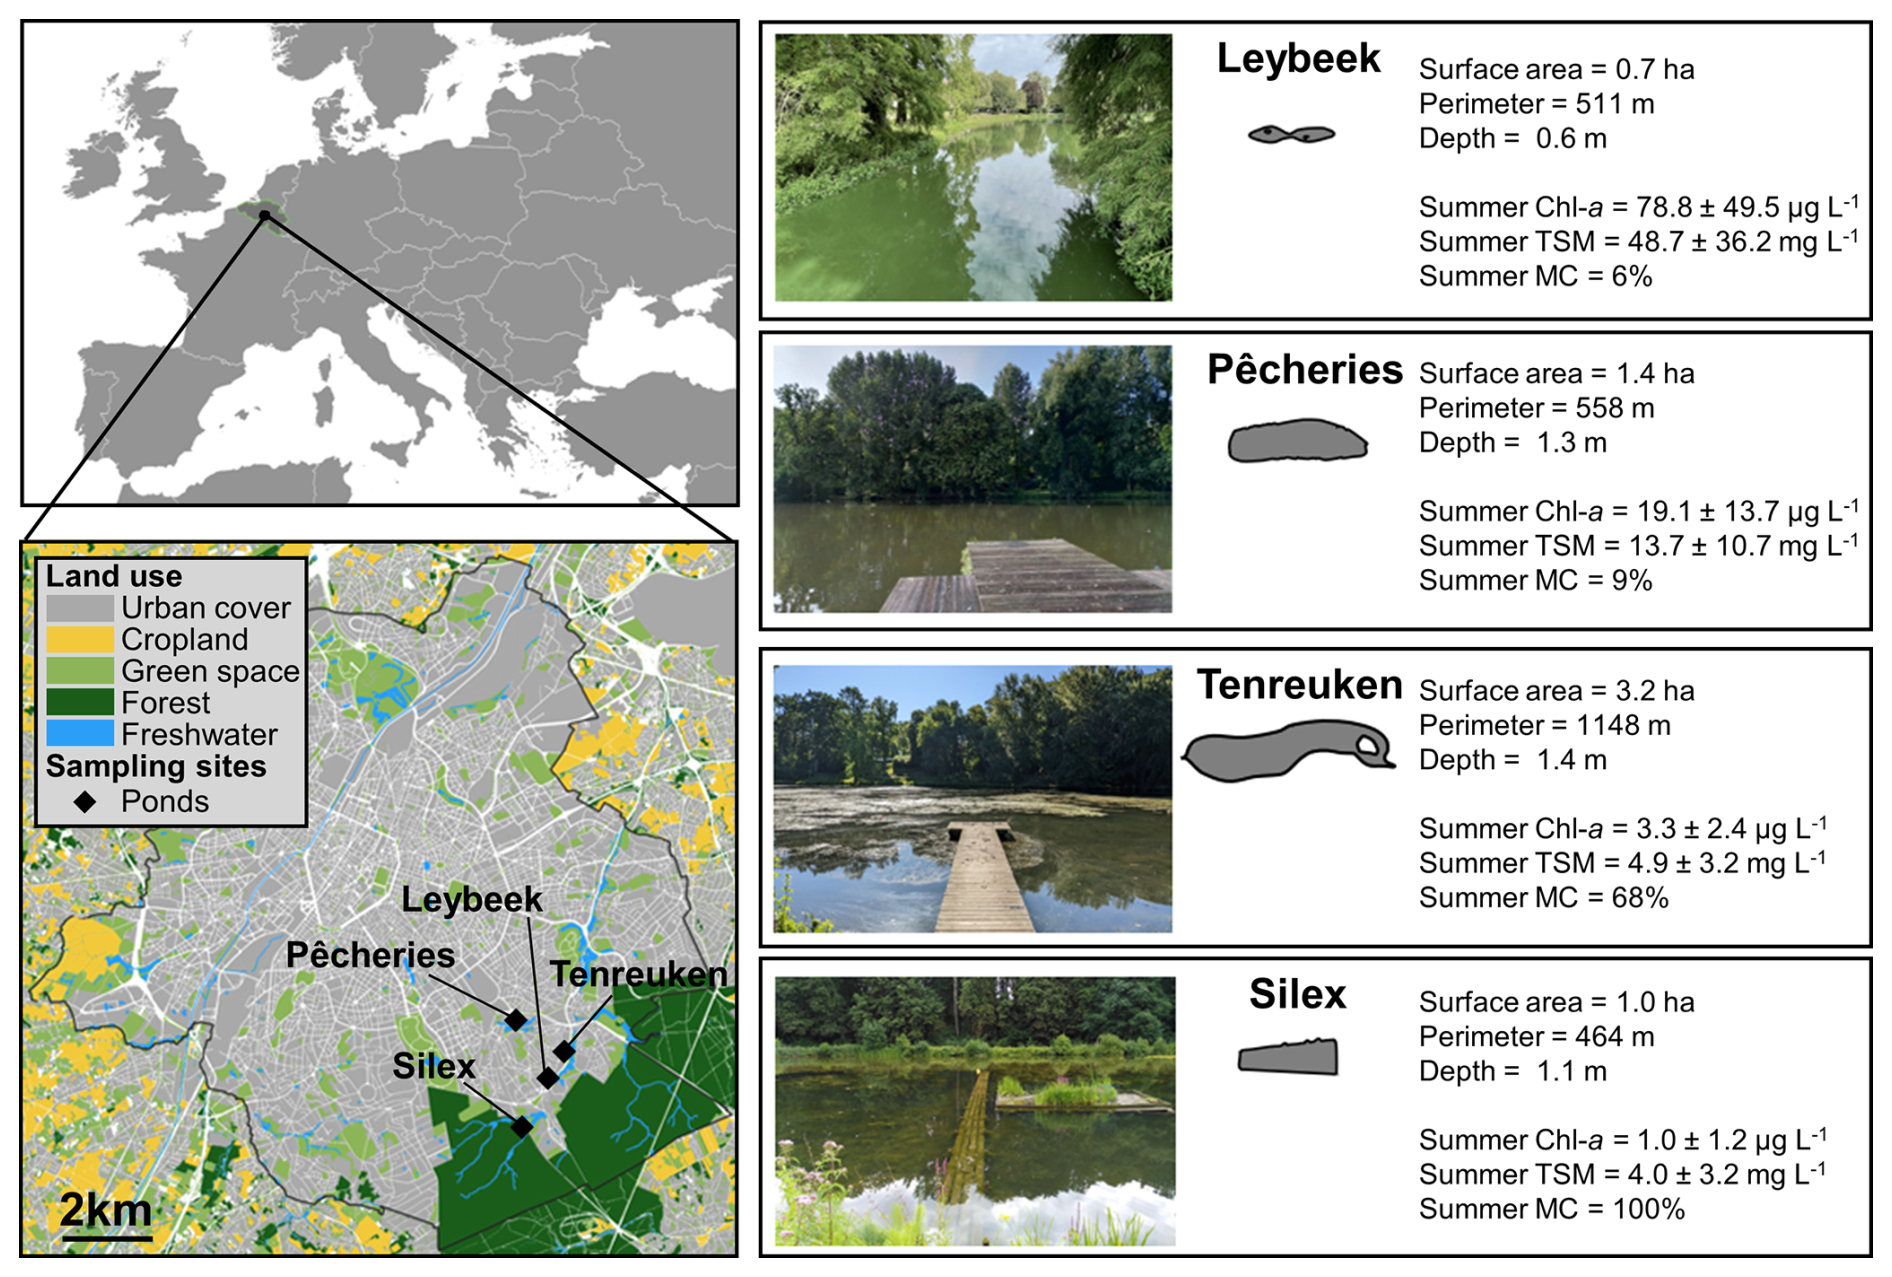
Figure 1Location of the four sampled urban ponds (black diamonds) in the city of Brussels (Belgium) delineated by the black line. Right panels indicate, for each pond, the shape of the ponds, surface area (ha), perimeter (m), average depth (m), mean ± standard deviation of chlorophyll-a (Chl-a, in µg L−1), and total suspended matter (TSM, in mg L−1) in summer (21 June to 21 September 2021, 2022, 2023) and summer total macrophyte cover (MC; in %) (Table S1).
2.1 Field sampling and meteorological data
Sampling was carried out at a single fixed station (pontoon) in each of the four ponds, on the same day between 09:00 am and 11:00 am CET, 46 times on each pond between June 2021 and December 2023 at a frequency ranging from one (winter) to three (summer) times per month. Water was sampled 5 cm below the surface with 60 mL polypropylene syringes for analysis of dissolved concentrations of CO2, CH4, and N2O. Samples for CH4 and N2O were transferred from the syringes with a silicone tube into 60 mL borosilicate serum bottles (Wheaton), preserved with 200 µL of a saturated solution of HgCl2, sealed with a butyl stopper and crimped with an aluminium cap, without a headspace, and stored at ambient temperature in the dark prior to analysis in the laboratory. The partial pressure of CO2 (pCO2) was measured directly in the field, within 5 min of sample collection, with a Li-Cor Li-840 infrared gas analyser (IRGA) based on the headspace technique with four polypropylene syringes (Borges et al., 2019). A volume of 30 mL of sample water was equilibrated with 30 mL of atmospheric air within the syringe by shaking vigorously for 5 min. The headspace of each syringe was then sequentially injected into the IRGA, and a fifth syringe was used to measure atmospheric CO2. The final pCO2 value was computed taking into account the partitioning of CO2 between water and the headspace, as well as equilibrium with HCO (Dickson et al., 2007) using water temperature measured in situ and after equilibration and total alkalinity (data not shown). Samples for total alkalinity were conditioned, stored, and analysed as described by Borges et al. (2019). The IRGA was calibrated in the laboratory with ultrapure N2 and a suite of gas standards (Air Liquide Belgium) with CO2 mixing ratios of 388, 813, 3788, and 8300 ppm. The precision of pCO2 measurements was ±2.0 %. Water temperature, specific conductivity, and oxygen saturation level (%O2) were measured in situ with VWR MU 6100H probe 5 cm below the surface. A 2 L polyethylene water container was filled with surface water for conditioning the samples for other variables at the laboratory in Université Libre de Bruxelles.
Three bubble traps were deployed 50 cm apart for measuring ebullitive CH4 flux. The bubble traps consisted of inverted polypropylene funnels (diameter 23.5 cm) mounted with 60 mL polypropylene syringes, with three-way stop valves allowing the gas to be collected without contamination from ambient air. The polypropylene funnel was attached with steel rods to a polystyrene float. The volume of gas collected in the funnels was sampled with graduated polypropylene 60 mL syringes every 24 h. The value of the collected volume of gas was logged, and the gas was transferred immediately after collection to pre-evacuated 12 mL vials (Exetainers, Labco, UK) that were stored at ambient temperature in the dark prior to the analysis of CH4 concentration in the laboratory. The time series of measurements was longer at the Silex pond than the other three ponds.
Surveys to identify and quantify visually the relative coverage of emerged and submerged macrophytes were conducted in summer 2023 (Table S1). The resulting list of macrophyte species agreed with past studies in Brussels' ponds (Peretyatko et al., 2007). Air temperature, precipitation, wind speed, and atmospheric pressure were retrieved from https://wow.meteo.be/en (last access: 18 January 2024) for the meteorological station of the Royal Meteorological Institute of St-Lambert (50.8408° N, 4.4234° E) in Brussels, located between 2.5 and 5.0 km from the surveyed ponds. Air temperature, wind speed, and atmospheric pressure were averaged over 24 h to obtain a daily mean value. Precipitation was integrated each day to obtain cumulated daily value.
2.2 Laboratory analysis
2.2.1 Chlorophyll-a, total suspended matter, and dissolved inorganic nutrients
Water was filtered through Whatman GF/F glass microfiber filters (porosity 0.7 µm) with a diameter of 47 mm for total suspended matter (TSM) and Chl-a. Filters for TSM were dried in an oven at 50 °C, and filters for Chl-a were kept frozen (−20 °C). The weight of each filter was determined before and after filtration of a known volume of water using an Explorer™ Pro EP214C analytical microbalance (accuracy ±0.1 mg) for determination of TSM concentration. Chl-a concentration was measured on extracts with 90 % acetone by fluorimetry (Kontron model SFM 25) (Yentsch and Menzel, 1963) with a limit of detection of 0.01 µg L−1. Filtered water was stored frozen (−20 °C) in 50 mL polypropylene bottles for analysis of dissolved nutrients. Soluble reactive phosphorus (SRP) was determined by the ammonium molybdate, ascorbic acid, and potassium antimony tartrate staining method (Koroleff, 1983), with a limit of detection of 0.1 µmol L−1. Ammonium (NH) was determined by the nitroprusside–hypochlorite–phenol staining method (Grasshoff and Johannsen, 1972), with a limit of detection of 0.05 µmol L−1. Nitrite (NO) and nitrate (NO) were determined before and after reduction of NO to NO by a cadmium–copper column, using the Griess acid reagent staining method (Grasshoff et al., 2009), with a detection limit of 0.01 and 0.1 µmol L−1, respectively. Concentration of dissolved inorganic nitrogen (DIN) was calculated as the sum of NH, NO, and NO concentrations (in µmol L−1).
2.2.2 CH4 and N2O measurements by gas chromatography
Measurements of N2O and CH4 concentrations dissolved in water were made with the headspace technique (Weiss, 1981) with a headspace volume of 20 mL of ultra-pure N2 (Air Liquid Belgium) and a gas chromatograph (GC) (SRI 8610C) with a flame ionization detector for CH4 and an electron capture detector for N2O calibrated with gas mixtures (Air Liquide Belgium) with mixing ratios of 1, 10, and 30 ppm for CH4 and 0.2, 2.0, and 6.0 ppm for N2O. The precision of measurement based on duplicate samples was ±3.9 % for CH4 and ±3.2 % for N2O. Measurements of CH4 concentration in the gas samples from bubble traps were also made by GC with the same set-up and calibration as for the determination of the dissolved concentrations in water samples.
The CO2 concentration is expressed as partial pressure (pCO2) in parts per million (ppm) and CH4 as dissolved concentration (nmol L−1), as frequently used in the topical literature. CH4 concentrations were systematically and distinctly above saturation level (2–3 nmol L−1), and pCO2 values were below saturation only five times out of the 187 measurements. The N2O concentrations fluctuated around atmospheric equilibrium, so data are presented as a percentage of saturation level (%N2O, where atmospheric equilibrium corresponds to 100 %). The equilibrium with atmosphere for N2O was calculated from the average air mixing ratios of N2O provided by the Global Monitoring Division (GMD) of the National Oceanic and Atmospheric Administration (NOAA) Earth System Research Laboratory (ESRL) (Dutton et al., 2023) and using Henry's constant given by Weiss and Price (1980).
2.3 Calculations
2.3.1 Diffusive GHG emissions
The diffusive air–water CO2, CH4, or N2O fluxes (FG) were computed according to
where k is the gas transfer velocity, and Δ[G] is the air–water gas concentration gradient.
The atmospheric pCO2 was measured in the field with the Li-Cor Li-840. For CH4, the global average present-day atmospheric mixing ratio of 1.9 ppm was used (Lan et al., 2024). k was computed from a value normalized to a Schmidt number of 600 (k600) and from the Schmidt number of CO2, CH4, and N2O in freshwater according to the algorithms as a function of water temperature given by Wanninkhof (1992). k600 was calculated from the parameterization as a function of wind speed of Cole and Caraco (1998). CH4 and N2O emissions were converted into CO2 equivalents (CO2-eq) considering a 100-year time frame, using global warming potentials of 32 and 298 for CH4 and N2O, respectively (Myrhe et al., 2013).
2.3.2 Ebullitive flux
Bubble flux (mL m−2 d−1) was calculated according to
where Vg is the volume of gas collected in the inverted funnel (mL), A is the cross-sectional surface area of the funnel (m2), and Δt is the collection time (d).
A multiple linear regression model of Fbubble dependent on water temperature (Tw in °C) and drops of atmospheric pressure (Δp in atm) was fitted to the data according to
where γ is the y intercept, and α and β are the slope coefficients of the multiple linear regression model.
Δp was calculated according to Zhao et al. (2021):
where p is the atmospheric pressure (atm), p0 a threshold value fixed at 1 atm, and Δt the time interval between two measurements (d) (Fig. S1).
A linear regression model of Fbubble dependent on Tw alone was fitted to the data according to
where α′ is the slope coefficient, and γ′ is the y intercept.
To evaluate the relative importance of Tw and Δp combined and Tw alone in driving Fbubble, the values modelled based on Eqs. (3) and (5) were compared to the observations in the Silex pond alone or in all four ponds together, for three Tw ranges (Tw<15 °C, Tw>15 °C, and the full Tw range).
Ebullitive CH4 fluxes ( in mmol m−2 d−1) were calculated according to
where [CH4] is the measured CH4 concentration in bubbles (mmol mL−1).
The CH4 content in bubbles expressed as a percentage of total gas (%CH4) was fitted with a linear regression model dependent on Tw in the Silex pond. The correlation of %CH4 with Fbubble was tested on the merged data of all the four ponds.
A linear regression model of dependent on Tw was fitted to the data according to
where b is the slope, and c is the y intercept of the linear regression.
Equation (7) is used to predict in each pond from measured time series of Tw, allowing matching to each diffusive CH4 flux estimate derived from Eq. (1).
The ratio of ebullitive CH4 flux to total (diffusive + ebullitive) CH4 flux was fitted as a function of Tw according to DelSontro et al. (2016):
The methane ebullition Q10 represents the change in per 10 °C change in Tw and was computed according to DelSontro et al. (2016):
where b is given by Eq. (7).
The Q10 of diffusive CH4 fluxes was also computed from Eq. (9) but using the b value derived by replacing by the diffusive CH4 flux in Eq. (7).
2.3.3 Statistical analysis
Generalized linear mixed models (GLMMs) were used (1) to find differences in variables among ponds and (2) to relate GHG variables to their putative controls across all ponds and within individual ponds. GLMMs were computed with the lme4 package (Bates et al., 2015) in R version 4.4.1 (R Core Team, 2021).
GLMMs allowed us to compare pCO2, dissolved CH4 concentration, %N2O, Fbubble, %CH4 in bubbles, , and diffusive CH4 fluxes among the four ponds, using the sampling date as a random effect, and post hoc tests were performed using estimated marginal means (emmeans package in R) to assess pairwise differences between ponds. This analysis aimed at investigating if patterns in GHG concentrations and emissions differed among ponds, in particular with regards to clear-water and turbid-water states. Data were also compared among the four ponds separated by seasons, but GLMMs did not converge due to an insufficient number of data points. Comparisons on log10-transformed data were then made using repeated measures analysis of variance (ANOVA) (ezANOVA package in R) with Tukey's honestly significant difference (HSD) post hoc tests. This analysis aimed at investigating if patterns in data shown by the data analysis with the full data set (four seasons merged) were also observed when analysing the data separated by seasons.
For the data sets covering the whole sampling period (four seasons merged), GLMMs were constructed for pCO2, dissolved CH4 concentration, %N2O, Fbubble, %CH4 in bubbles, , and diffusive CH4 fluxes that included Tw, precipitation, %O2, Chl-a, TSM, DIN, and SRP as fixed effects and “pond” and “sampling date” as a random effect to account for repeated measurements with the lme4 package in R. This analysis aimed at investigating (1) the impact of photosynthesis–respiration on CO2 concentrations and emissions based on the relationships with Chl-a, DIN, and SRP; (2) the impact of the response of methanogenesis to warming on CH4 concentrations and diffusive and ebullitive emissions based on the relationships to Tw; and (3) the impact on DIN availability and Tw on N2O concentrations and diffusive emissions. A linear regression model was used to assess the relationship between Chl-a, TSM, %O2, SRP, and DIN versus Tw. This analysis aimed at investigating if some of the patterns between GHG variables versus Chl-a, TSM, %O2, SRP, and DIN might in fact have reflected a relation between these variables and Tw indirectly. The relationships between the annual means of CH4, CO2 and N2O fluxes and the annual means of a subset of variables (Chl-a, macrophyte cover, pond surface area, and depth) were assessed with linear or quadratic regressions. The modelled Fbubble values in the Silex pond and in the four ponds were compared to measured Fbubble values with a linear regression in order to evaluate the model performance. A correlation analysis was used to assess the relationship between %CH4 and Fbubble, as well as between anomalies in annual air temperature and annual precipitation.
The linear regression model and the Pearson correlation coefficient (r) were computed in R using the functions lm and cor(method = “pearson”), respectively. Statistical significance was set at p<0.05 for all analyses. Significant differences between groups presented in box plots are indicated by lower-case letters in the figures.
3.1 Seasonal variations of meteorological conditions and GHG concentrations
The city of Brussels experiences a temperate climate with mild weather year-round and evenly distributed abundant precipitation, totalling 837 mm on average annually for the reference period 1991–2020. The average annual air temperature was 11 °C, with a summer average of 17.9 °C and a winter average of 4.1 °C for the reference period 1991–2020. During the sampling period, from June 2021 to December 2023, Tw in the surface of the four sampled ponds (Leybeek, Pêcheries, Silex, and Tenreuken; Fig. 1) tracked the air temperature closely, which ranged between −1.5 and 30.0 °C following the typical seasonal cycle at mid-latitudes in the Northern Hemisphere (Fig. S2). The years 2022 and 2023 were about 1 °C warmer than the average for the period 1991–2020 (11 °C), while the year 2021 was closer to the long-term average (Fig. 2). The year 2022 was warmer and drier than 2021 and 2023 (Fig. 2), with positive air temperature anomalies observed evenly throughout the year (9 months out of 12) and negative precipitation anomalies in summer, autumn, and early winter (Fig. S2). The year 2021 had warmer and drier months in June and September and colder and wetter months in July and August and was wetter and colder than 2022 overall (Fig. 2). The year 2023 was marked by both positive air temperature and precipitation anomalies (Fig. S2), resulting in a wetter and warmer year than normal and compared to 2021 and 2022 (Fig. 2). Daily wind speed was generally low (<1 m s−1) except for a windier period in spring 2022 (up to 5.8 m s−1, corresponding to the Eunice storm) and in autumn 2023 (up to 9.7 m s−1, corresponding to the Ciarán storm) (Fig. S2).
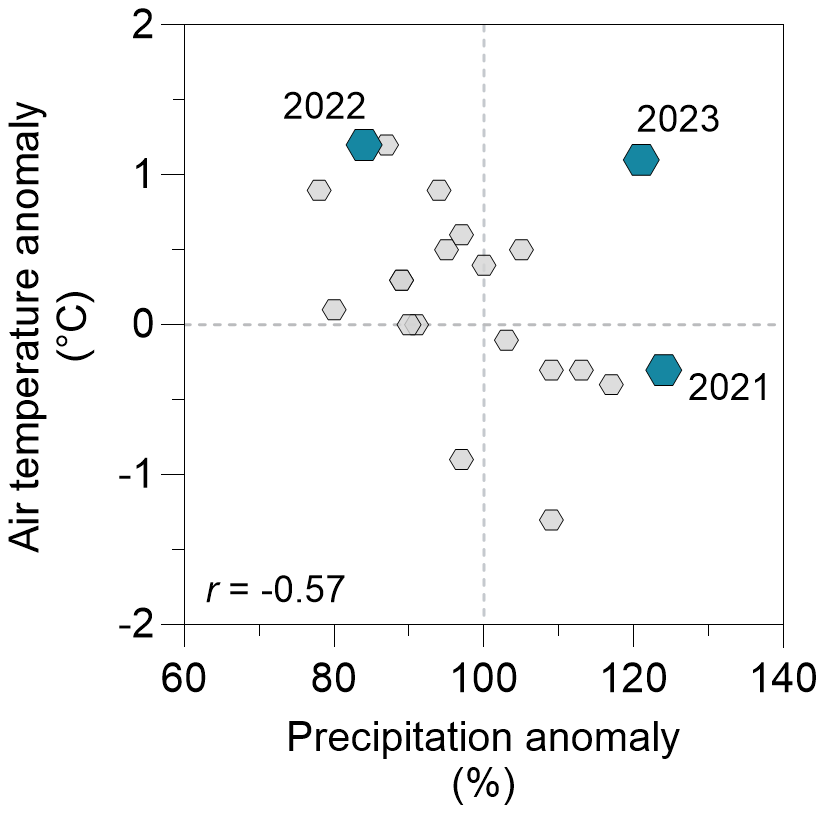
Figure 2Anomaly of annual air temperature (°C) as a function of anomaly of annual precipitation (%) from 2003 to 2023 with respect to the average of the 1991–2020 period (11 °C and 837 mm, respectively). Small grey hexagons represent anomaly values for the years 2003–2020 and larger blue hexagons represent anomaly values for the years 2021–2023. The air temperature anomaly was correlated to the precipitation anomaly for the years 2003–2020 (Pearson , p=0.0147, n=18). Note the anomalous rainy year in 2023 relative to the pattern of precipitation as a function of temperature anomalies for the other years, possibly in response to the strong El Niño event of 2023 (Chen et al., 2024).
The four sampled ponds are situated in the periphery of the city of Brussels, with the Silex pond being bordered by the Sonian Forest (Fig. 1). The four ponds are relatively small (0.7–3.2 ha) and shallow (0.6–1.4 m) and have not been drained or dredged since at least 2018 (Table S2). The four studied ponds had significantly different Chl-a concentration values during summer, with the Leybeek pond having higher Chl-a (78.8 ± 49.5 µ g L−1), followed by the Pêcheries pond (19.1 ± 13.7 µg L−1), the Tenreuken pond (3.3 ± 2.4 µg L−1), and the Silex pond (1.0 ± 1.2 µg L−1) (Figs. 1, 3, Table S3). The Leybeek and Pêcheries ponds with higher summer Chl-a concentration had turbid water (summer TSM = 48.7 ± 36.2 and 13.7 ± 10.7 mg L−1, respectively) and undetectable submerged macrophyte cover in summer (Fig. 1, Table S1). The Tenreuken and Silex ponds with lower summer Chl-a concentrations had clear water (summer TSM = 4.9 ± 3.2 and 4.0 ± 3.2 mg L−1, respectively) and a high total macrophyte cover during summer (68 % and 100 %, respectively, Fig. 1, Table S1). Seasonally, the highest values of Chl-a were observed in summer in the turbid-water Leybeek and Pêcheries ponds, related to algal blooms. Conversely, lowest values of Chl-a were observed in summer in the clear-water Tenreuken and Silex ponds (Figs. 1, 3), probably related to competition for dissolved inorganic nutrients with macrophytes.
The %O2 values ranged from 11 % to 191 % (Fig. 3). The highest %O2 values in the four ponds were observed in spring and summer compared to autumn and winter owing to aquatic primary production. In summer, %O2 was significantly higher in the Leybeek pond (109 ± 46 %), characterized by higher Chl-a concentration compared to the Pêcheries pond (75 ± 23 %, p=0.0212, Table S3). The lowest average %O2 was observed in autumn in the Pêcheries pond (46 ± 22 %) and was significantly lower than in the Leybeek (85 ± 34 %, p=0.0146, Table S3) and Silex ponds (81 ± 19 %, p=0.0130, Table S3).
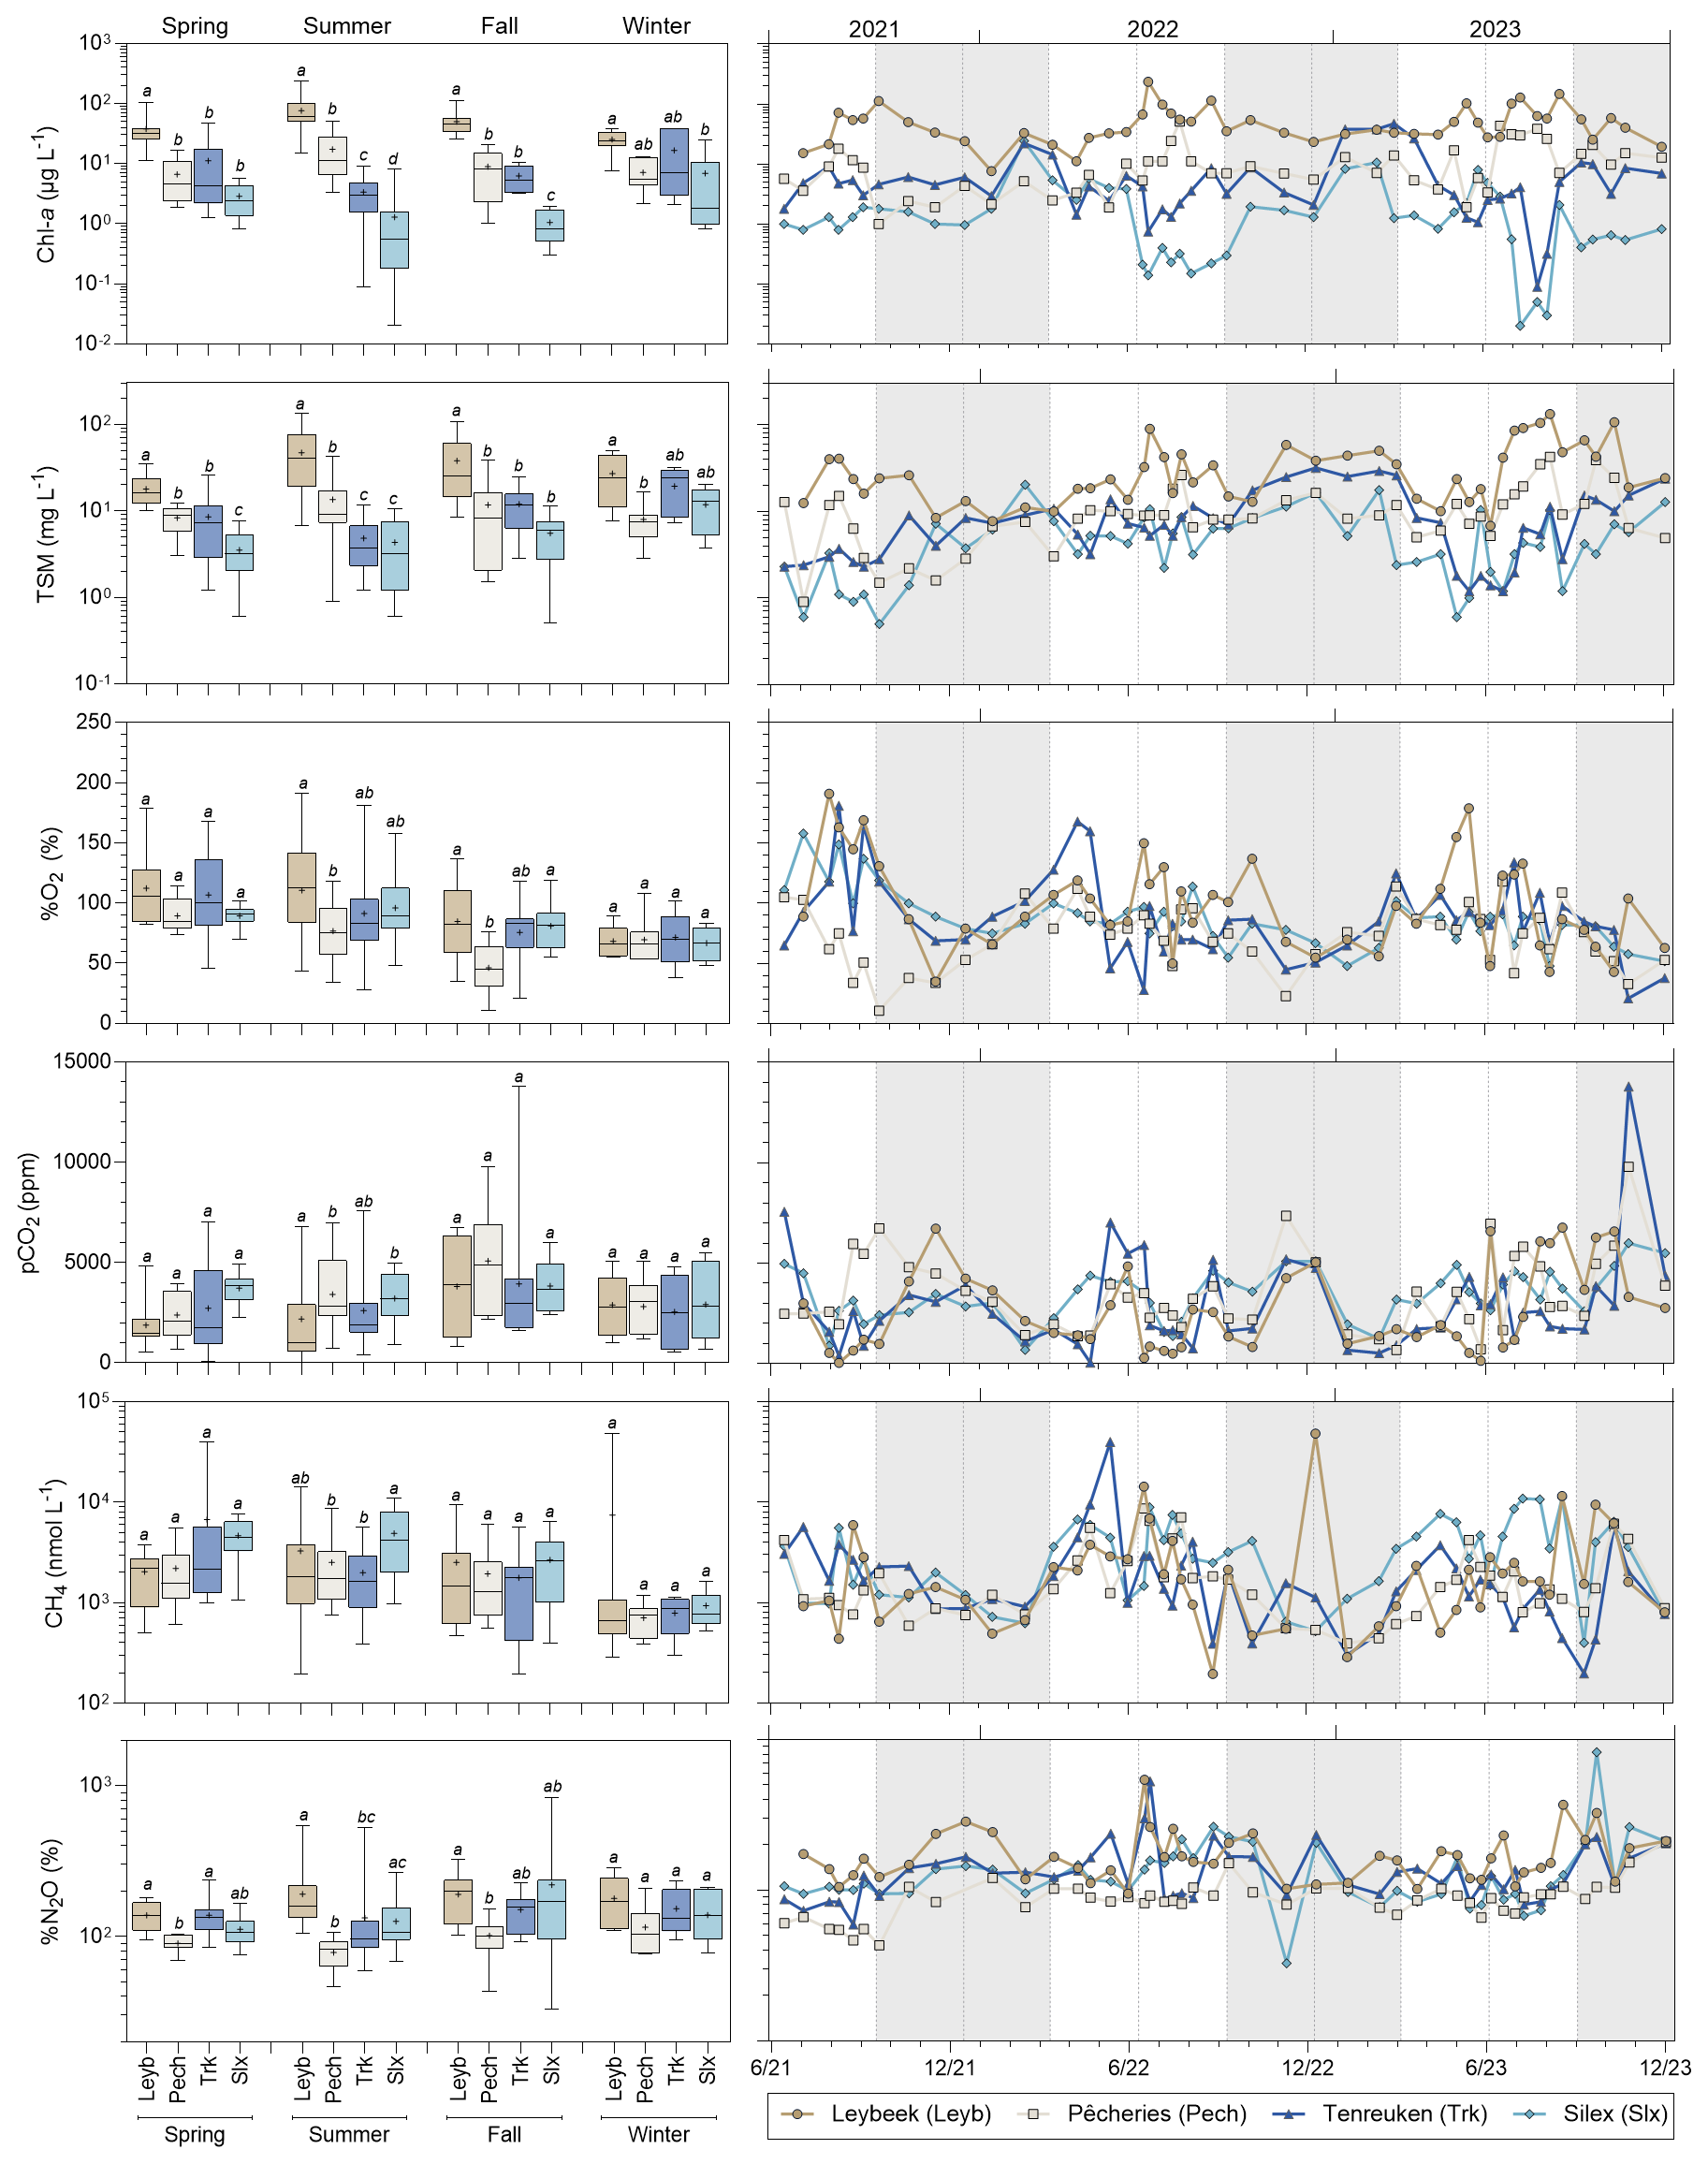
Figure 3Seasonal variations of Chlorophyll-a (Chl-a, in µg L−1), total suspended matter (TSM, in mg L−1), oxygen saturation (%O2, in %), partial pressure of CO2 (pCO2 in ppm), dissolved CH4 concentration (CH4, in nmol L−1), and N2O saturation level (%N2O, in %) in four urban ponds (Leybeek (Leyb), Pêcheries (Pech), Tenreuken (Trk), and Silex (Slx)) in the city of Brussels (Belgium) from June 2021 to December 2023. Box plots show median (horizontal line), mean (cross), and 25 %–75 % percentiles (box limits). Whiskers extend from minimum to maximum values. Grey and white bands in the plots on the right correspond to the autumn/winter and spring/summer periods, respectively, and dotted vertical bars indicate the first day of each season. Lower-case letters indicate significant differences between ponds (Tables S3 and S4).
The pCO2 values ranged from 40 to 13 804 ppm (Fig. 3). Undersaturation of CO2 with respect to atmospheric equilibrium (∼ 410 ppm) was only observed on five occasions out of the 187 measurements, three times in the turbid-water Leybeek pond in summer (40 ppm on 13 August 2021, 220 ppm on 27 June 2022 and 149 ppm on 13 June 2023) and twice in the clear-water Tenreuken pond in spring and summer (383 ppm on 13 August 2021 and 55 ppm on 2 May 2022). Low values of pCO2 were generally observed in spring and summer, and high values of pCO2 were observed in autumn in the four ponds (Fig. 3). In summer, pCO2 was lower in the Leybeek pond (2187 ± 2012 ppm) than in the Pêcheries (3427 ± 1672 ppm, p=0.0015, Table S3) and the Silex (3222 ± 1175 ppm, p=0.0002, Table S3) ponds. When data were pooled, pCO2 was negatively influenced by %O2 and positively by DIN, SRP, and precipitation (Table S4). In individual ponds, pCO2 was negatively influenced by %O2 and positively by precipitation in the four ponds, positively by DIN in the Leybeek pond, positively by DIN and SRP in the Tenreuken pond, and negatively by Chl-a in the Silex pond (Table S5).
The CH4 dissolved concentrations ranged from 194 to 48 380 nmol L−1 (Fig. 3) and were always above saturation (∼ 2 nmol L−1). High values of CH4 dissolved concentrations were generally observed in spring and summer, and low values of CH4 dissolved concentrations were generally observed in winter in the four ponds (Fig. 3). In summer, CH4 dissolved concentration was higher in the Silex pond (4898 ± 3384 nmol L−1) than in the Pêcheries (2518 ± 2105 nmol L−1, p=0.0385, Table S3) and the Tenreuken (2189 ± 1365 nmol L−1, p=0.0055, Table S3) ponds. When data were pooled, dissolved CH4 concentration was influenced positively by Tw (Table S4). In individual ponds, CH4 dissolved concentration was also influenced positively by Tw in each of the four ponds (Table S5). Additionally, CH4 dissolved concentration was positively influenced by precipitation in the Leybeek pond and by SRP in the Silex pond and negatively by DIN in the Pêcheries pond and by Chl-a in the Tenreuken and the Silex ponds. (Table S5). These relationships between CH4 and other variables (SRP, DIN, Chl-a) probably indirectly reflected the seasonal variations of these other variables that were also influenced by Tw. Indeed, DIN was negatively influenced by Tw in the Pêcheries pond, Chl-a was negatively influenced by Tw in the Tenreuken and the Silex ponds, and SRP was positively influenced by Tw in the Silex pond (Table S6).
The %N2O values ranged from 32 % to 826 % (Fig. 3). Undersaturation of N2O with respect to atmospheric equilibrium was observed 66 times out of the 187 measurements. Low values of %N2O were generally observed in spring and summer, and high values of %N2O were generally observed in autumn and winter in the four ponds (Fig. 3). During spring, %N2O was lower in the Pêcheries pond (90 ± 11 %) than the Leybeek (138 ± 30 %, p=0.0043, Table S3) and the Tenreuken (138 ± 41, p=0.0057, Table S3) ponds. During summer, %N2O was lower in the Pêcheries pond (78 ± 17 %) than the Leybeek (191 ± 104 %, p<0.0001, Table S3) and the Silex (126 ± 49 %, p=0.001, Table S3) pond and lower in the Tenreuken pond (133 ± 106 %) than the Leybeek pond (p=0.0219, Table S3). During autumn, %N2O was lower in the Pêcheries pond (103 ± 33 %) than the Leybeek pond (190 ± 70 %, p=0.0174, Table S3). For the whole sampling period, %N2O was lower in the Pêcheries pond (94 ± 28 %) than the Leybeek (178 ± 82 %, p<0.0001, Table S7), the Tenreuken (140 ± 77 %, p<0.0001, Table S7), and the Silex (144 ± 113 %, p<0.0001, Table S7) ponds and was lower in the Tenreuken pond than the Leybeek pond (p=0.0038, Table S7). When data were pooled, %N2O was influenced negatively by Tw and positively by DIN and NH (Table S4). In individual ponds, %N2O was influenced negatively by Tw in the Leybeek, the Pêcheries, and the Tenreuken ponds (Table S5). %N2O was influenced positively by NO in the Leybeek pond and by NH in the Pêcheries and Tenreuken ponds (Table S8). %N2O was influenced positively by Chl-a and TSM in the Tenreuken pond and negatively by Chl-a in the Leybeek pond (Table S5), probably reflecting the negative influence on Chl-a and TSM by Tw in the Tenreuken pond and the positive influence on Chl-a by Tw in the Leybeek pond (Table S6).
3.2 Drivers of bubble flux
The Fbubble measured with inverted funnels in the four sampled ponds in the city of Brussels ranged between 0 and 2078 mL m−2 d−1 and was influenced positively by Tw in all four systems (Fig. 4). The mean %CH4 of the bubbles in the four sampled ponds in the city of Brussels was 31 ± 21 %, and values were influenced positively by Tw in the Silex pond (Fig. 4). The %CH4 of the bubbles was correlated with Fbubble (Fig. S3) as both variables were positively influenced by Tw (Fig. 4).
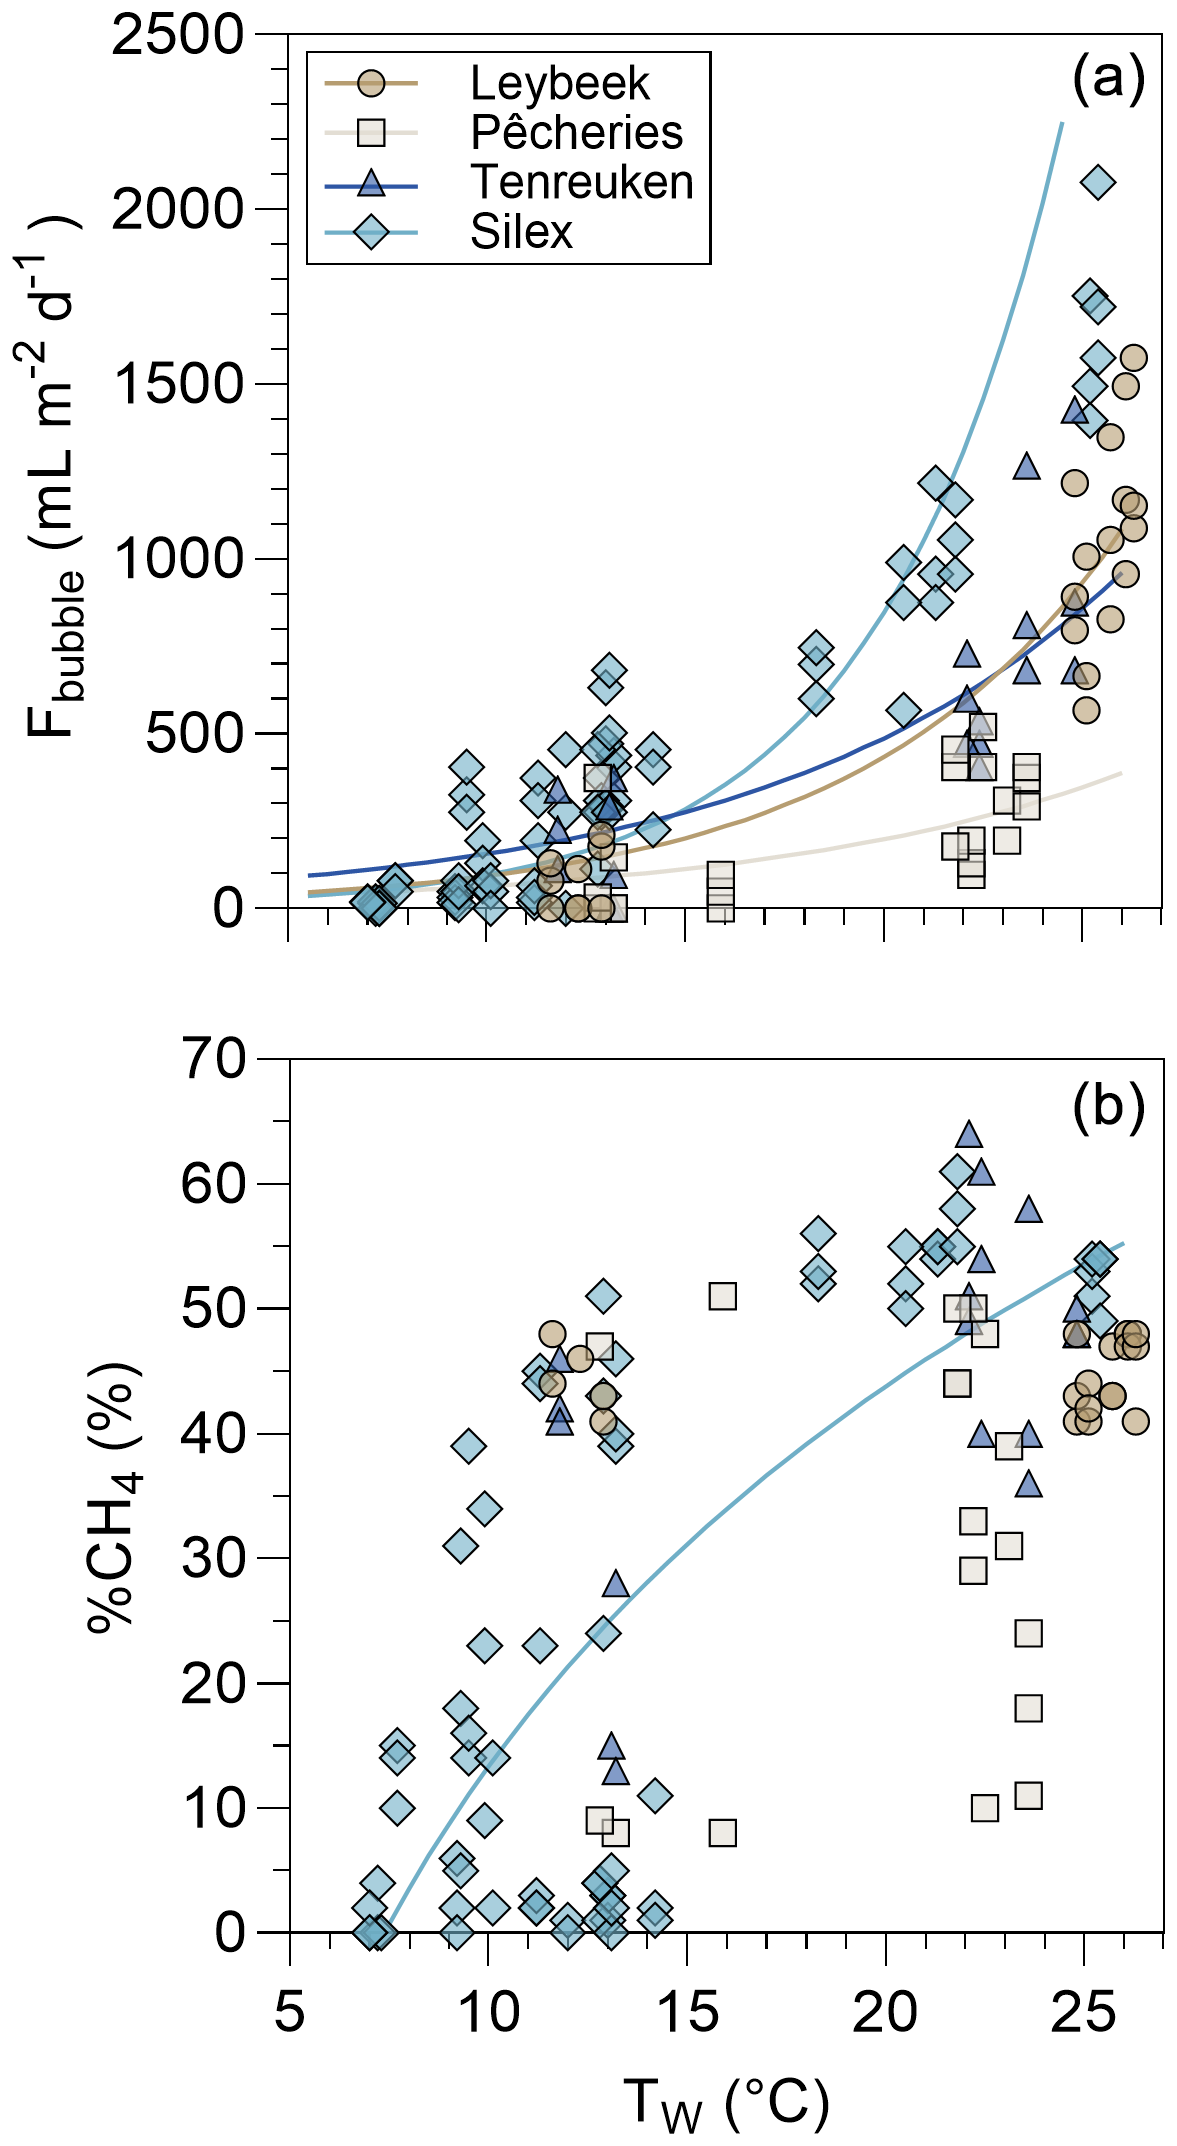
Figure 4Bubble flux (Fbubble in mL m−2 d−1) and the relative CH4 content in bubbles (%CH4, in %) as a function of surface water temperature (Tw in °C) in four urban ponds (Leybeek, Pêcheries, Tenreuken, and Silex) in the city of Brussels (Belgium) from June 2021 to December 2023. Bubbles fluxes were measured with three bubble traps in spring, summer, and autumn of 2022 and 2023, totalling 8 d in the Leybeek, Pêcheries, and Tenreuken ponds and 24 d in the Silex pond. Given the shallowness of the sampled systems (<1.5 m, Fig. 1), we assumed that sediments experience the same temperature as surface waters. In panel (a), solid lines represent linear regression of log10(Fbubble) as a function of Tw for the Leybeek (log, n=22, p<0.0001), the Pêcheries (log, n=22, p=0.0146), the Tenreuken (log, n=19, p<0.0001), and the Silex (log, n=72, p<0.0001) ponds. In panel (b), the solid line represents the linear regression of %CH4 as a function of log10(Tw) for the Silex pond (%CH, n=72, p<0.0001).
The time series at the Silex pond allowed the effects of Tw and atmospheric pressure variations on Fbubble to be investigated in more detail (Fig. 5). In spring 2022, the Fbubble at the Silex pond increased during drops in atmospheric pressure (depressions) (Fig. 5). There was no relation between wind speed and peaks of Fbubble (r2=0.01, p=0.463), suggesting a more important role of changes in atmospheric pressure than of wind speed in triggering bubble fluxes in the Silex pond in spring 2022. The Fbubble values at the Silex pond were higher in summer (1152 ± 433 mL m−2 d−1) than during spring (198 ± 170 mL m−2 d−1), and the temporal changes of Fbubble tracked those of Tw (Fig. 5). In order to evaluate the relative importance of changes of atmospheric pressure and water temperature in triggering bubble fluxes, the Fbubble was modelled as a function of Tw alone or as a function of both Tw and Δp (Figs. 5, S4). For periods of low Tw (<15 °C), the inclusion of the term of Δp in the model improved the performance of the model by comparison to the measurements (Figs. 5, S4). But for warmer periods (>15 °C), when bubbling fluxes were quantitatively more important, the inclusion in the model of the term of Δp did not improve the performance of the model (Figs. 5, S4). For the full Tw range (<15 and >15 °C), the inclusion of the term of Δp only improved the performance of the model very marginally (Fig. S4).
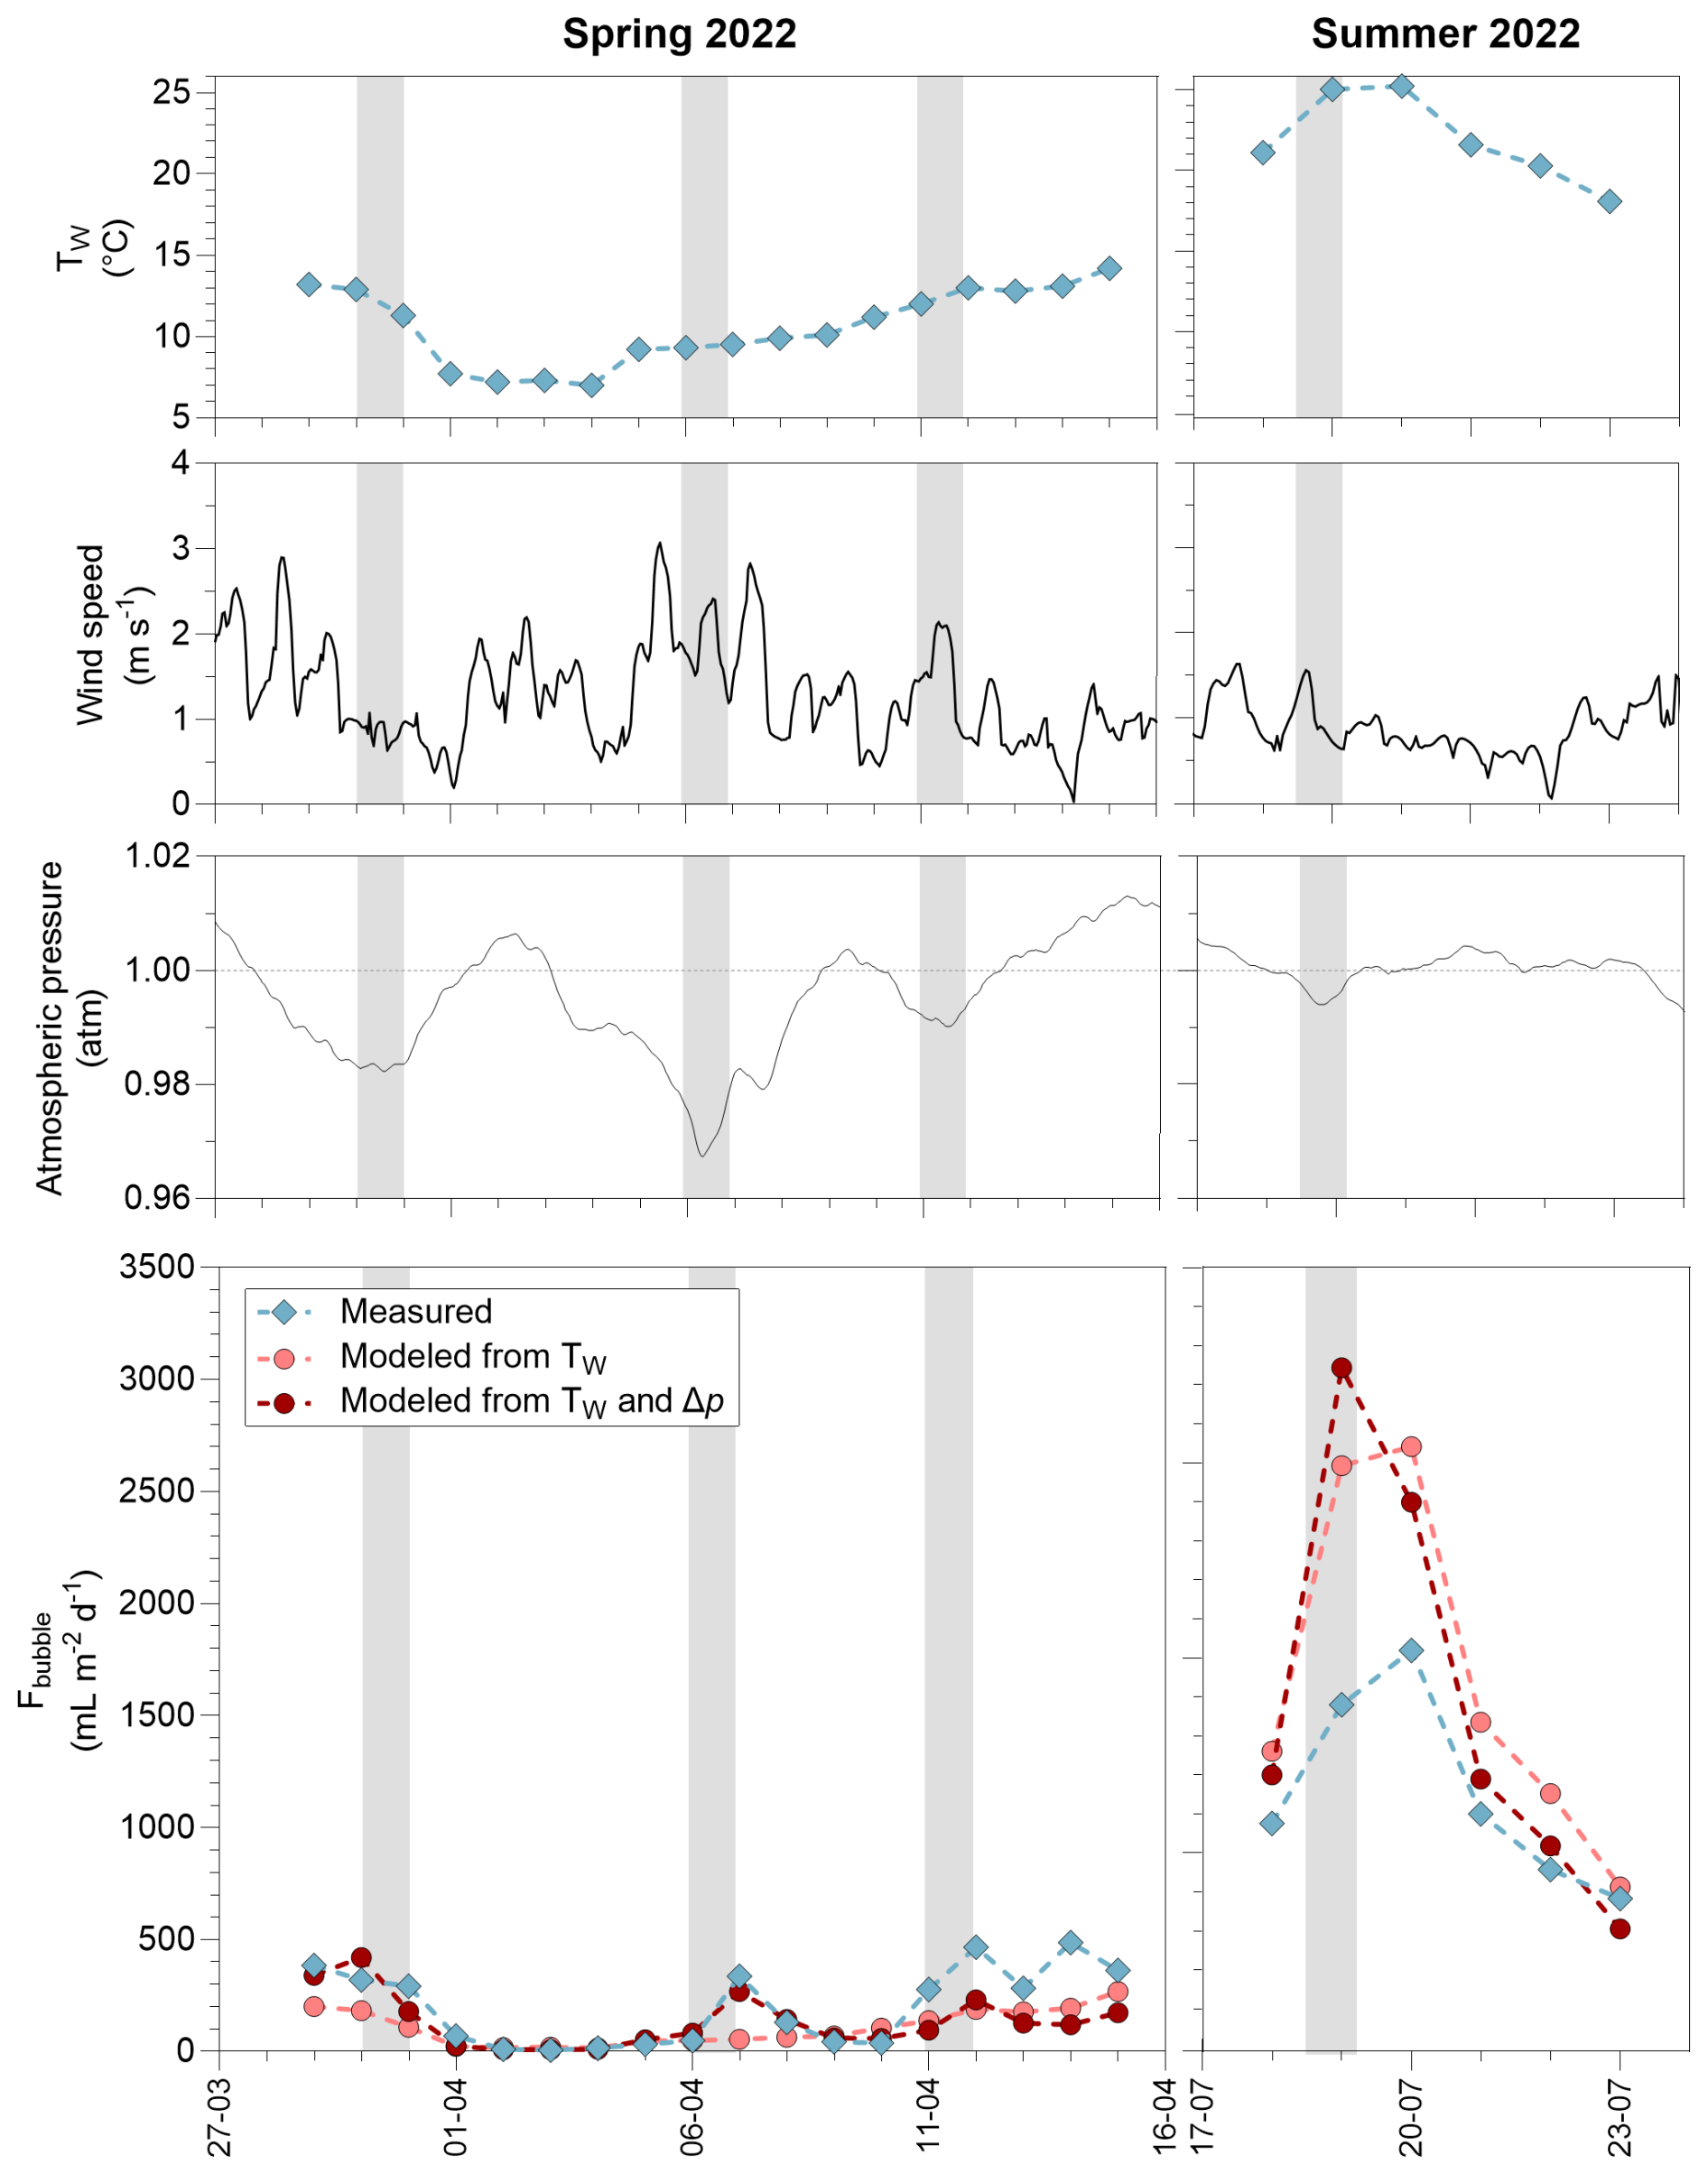
Figure 5Time series of surface water temperature (Tw, °C), wind speed (m s−1), atmospheric pressure (atm), and measured and modelled bubble flux (Fbubble in mL m−2 d−1) in the Silex pond from 29 March 2022 to 15 April 2022 and from 18 July 2022 to 23 July 2022. The bubble flux was modelled from a fit to data based on Tw alone (, p<0.0001, n=72) and based on both Tw and drops in atmospheric pressure (Δp) , p<0.0001, n=72).
3.3 Drivers of methane ebullitive fluxes
The values in the four ponds ranged between 0 and 59 mmol m−2 d−1 and were positively related to Tw (Fig. 6). The fitted relations between and Tw were specific to each pond and encompassed the fitted relations established in similar systems: four small ponds in Quebec (DelSontro et al., 2016) and a small urban pond in the Netherlands (Aben et al., 2017). The Q10 of CH4 ebullition values ranged between 4.4 in the deeper Pêcheries pond and 26.9 in the shallower Leybeek pond (Table S9). The Q10 values of CH4 ebullition in the four studied ponds of the city of Brussels, in Quebec (DelSontro et al., 2016), and in the Netherlands (Aben et al., 2017) were negatively related to water depth (Fig. 6).
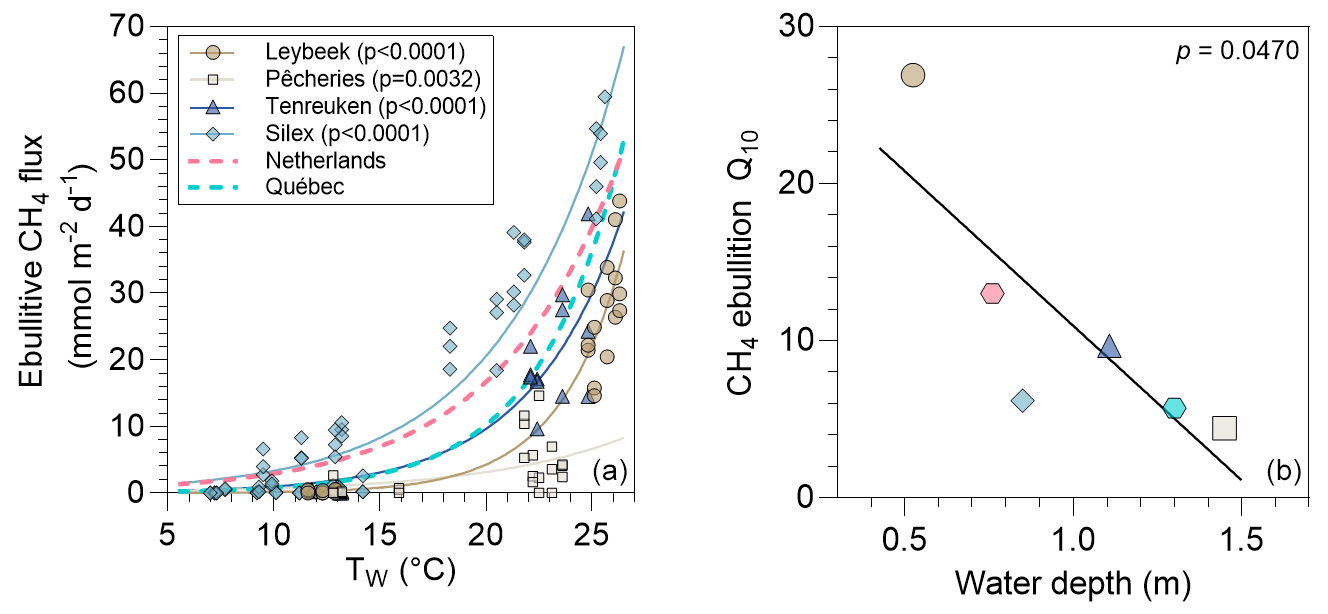
Figure 6(a) Measured ebullitive CH4 fluxes (mmol m−2 d−1) as a function of surface water temperature (°C) in four urban ponds (Leybeek, Pêcheries, Tenreuken, and Silex) in the city of Brussels (Belgium), in spring, summer, and autumn of 2022 and 2023, totalling 8 d in the Leybeek, Pêcheries, and Tenreuken ponds and 24 d in the Silex pond, with three bubble traps. Solid lines represent exponential fit for the Leybeek (, n=22), Pêcheries (, n=22), Tenreuken (, n=19), and Silex (, n=72) ponds (Table S7). Dashed lines represent the published exponential fit established in similar systems: four small ponds in Quebec () (DelSontro et al., 2016) and a small urban pond in the Netherlands () (Aben et al., 2017). (b) Each exponential curve allows us to determine a Q10 of CH4 ebullition, plotted against water depth; the solid line represents linear regression (Y=30.64–19.67⋅X, n=6).
3.4 Relative contribution of methane ebullitive and diffusive fluxes
Diffusive CH4 fluxes computed from dissolved CH4 concentration and k derived from wind speed ranged between 0.1 and 19.7 mmol m−2 d−1 (Fig. 7). The diffusive CH4 fluxes tended to be higher in summer and spring than in autumn and winter, owing to the strong positive influence on CH4 dissolved concentration by Tw (Fig. 3; Tables S4, S5). In addition, wind speed only showed small seasonal variations during sampling (0.6 ± 0.6 m s−1 in spring, 0.3 ± 0.2 m s−1 in summer, 0.7 ± 0.7 m s−1 in autumn, and 0.6 ± 0.2 m s−1 in winter) (Fig. S2). values were calculated from the relations with Tw for each pond given in Figure 6 from the Tw data coincident with the diffusive CH4 fluxes (Fig. 7). The resulting calculated values allowed us both to compare and integrate components of CH4 emissions to the atmosphere seasonally and to calculate the relative contribution of to total (diffusive + ebullitive) CH4 emissions. The relative contribution of to total CH4 emissions ranged between 1 % and 99 % in the four sampled ponds in the city of Brussels (Fig. 7) and was influenced positively by Tw (Fig. S5). The values of Q10 of diffusive CH4 fluxes were lower than those for in each pond and less variable seasonally (1.2 in the Pêcheries pond to 2.9 in the Silex pond) (Table S9).
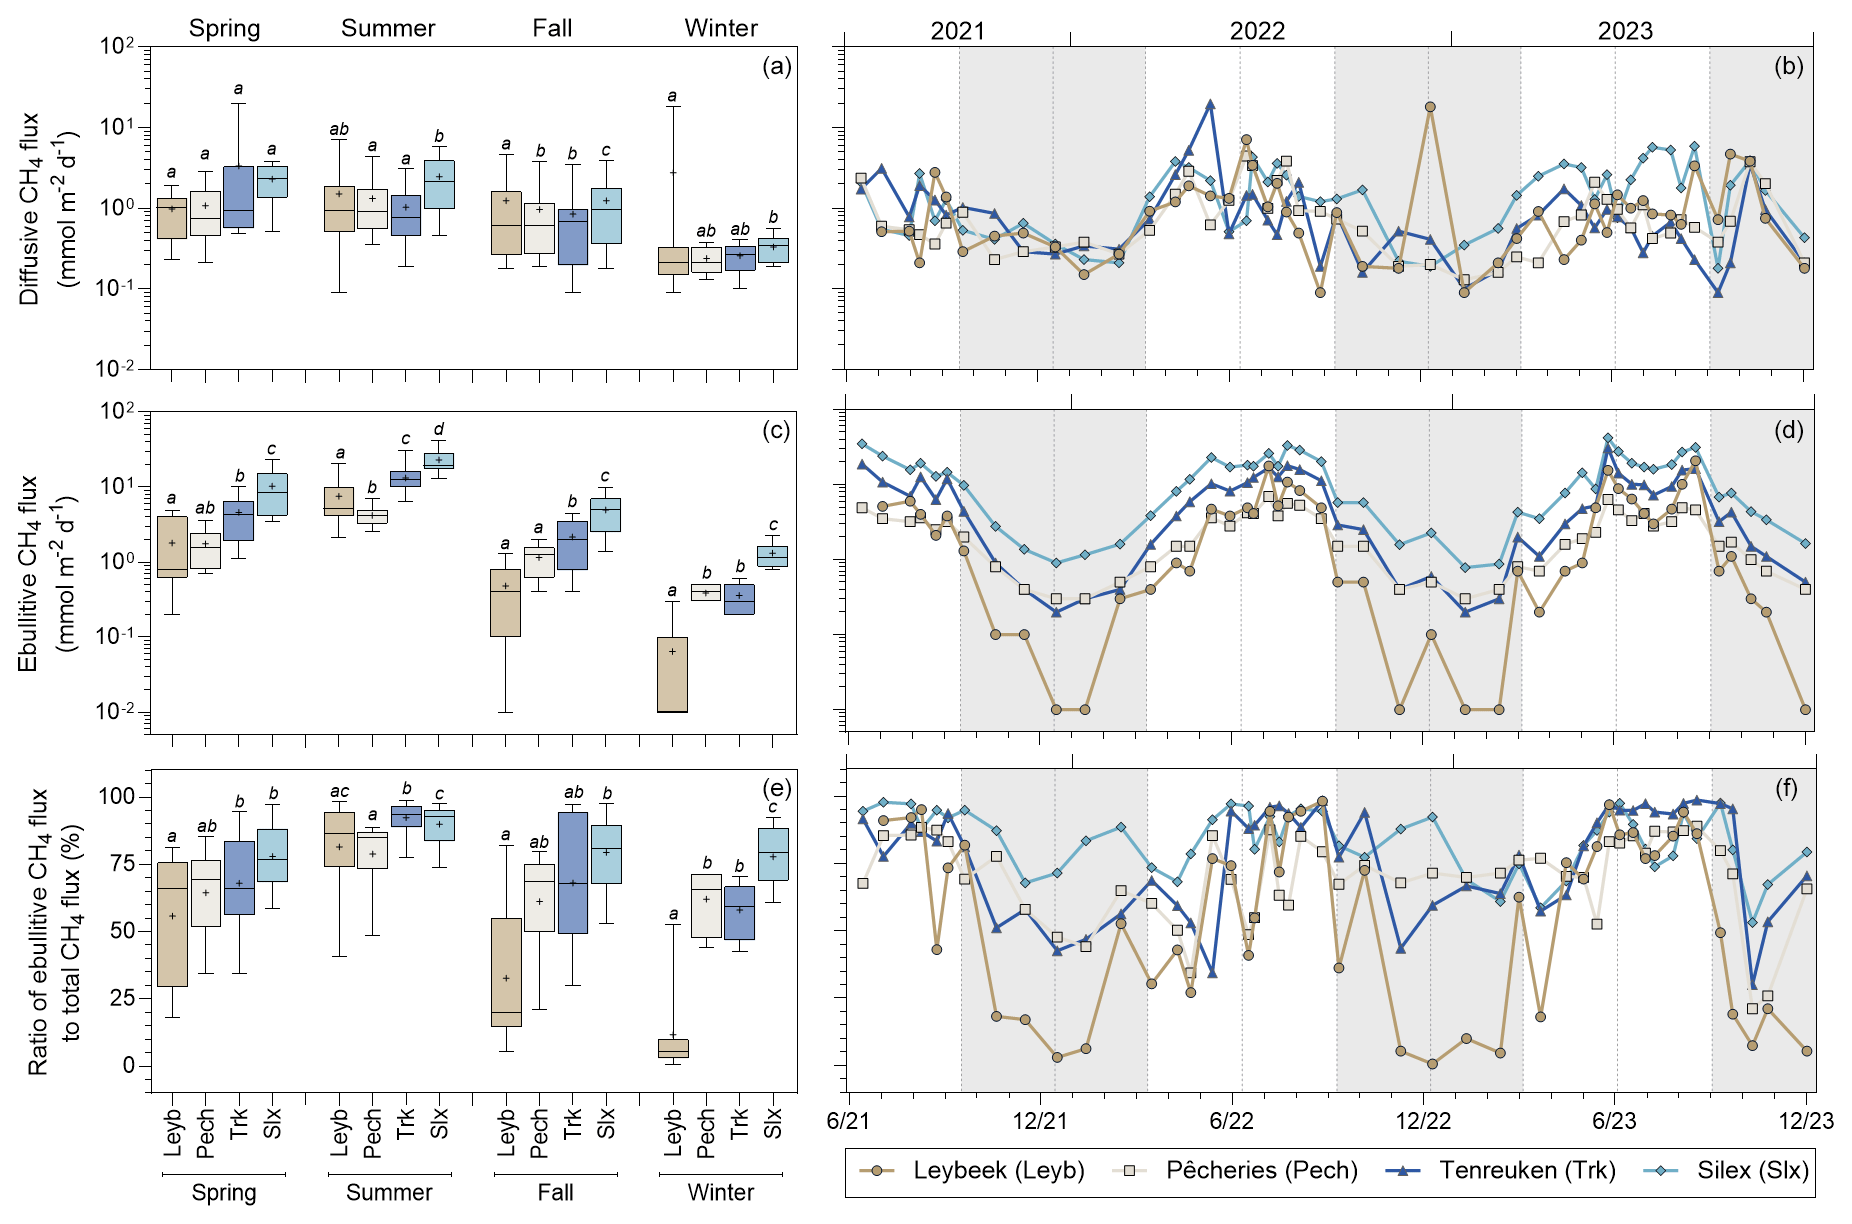
Figure 7Seasonal variations of (a, b) diffusive and (c, d) ebullitive CH4 fluxes (mmol m−2 d−1) and (e, f) the ratio of ebullitive CH4 flux to total (ebullitive + diffusive) CH4 flux (%) in four urban ponds (Leybeek (Leyb), Pêcheries (Pech), Tenreuken (Trk), and Silex (Slx)) in the city of Brussels (Belgium) from June 2021 to December 2023. Diffusive fluxes were calculated from CH4 concentration and gas transfer velocity derived from wind speed. Ebullitive CH4 fluxes were calculated from the relations with water temperature for each pond (Fig. 6; Table S7) from the water temperature data coincident with the diffusive CH4 fluxes. Note that the relations of ebullitive CH4 fluxes as a function of water temperature were established over a temperature range (7.0 to 26.3 °C) that is consistent with the range of water temperature values (2.0–25.9 °C) over which the ebullitive CH4 fluxes were modelled. Box plots show median (horizontal line), mean (cross), and 25 %–75 % percentiles (box limits). Whiskers extend from minimum to maximum values. Grey and white bands in the plots on the right correspond to the autumn/winter and spring/summer periods, respectively, and dotted vertical bars indicate the first day of each season. Lower-case letters indicate significant differences between ponds (Tables S3 and S4).
The annually averaged diffusive and ebullitive fluxes of CH4 in the four ponds in the city of Brussels were plotted against annually averaged Chl-a concentration, total macrophyte cover in summer, water depth, and lake surface area (Fig. 8) that are frequent predictors of variations of CH4 fluxes among lakes and ponds (Holgerson and Raymond, 2016; DelSontro et al., 2018, Deemer and Holgerson, 2021; Casas-Ruiz et al., 2021; Borges et al., 2022). The annually averaged values were significantly higher in the two clear-water ponds (7.3 ± 2.9 and 13.4 ± 3.7 mmol m−2 d−1 in the Tenreuken and the Silex ponds, respectively) than the two turbid-water ponds (3.8 ± 3.2 and 2.5 ± 1.4 mmol m−2 d−1 in the Leybeek and the Pêcheries ponds, respectively) (Table S7). The annually averaged values were significantly higher in the Silex pond, which showed a higher macrophyte cover during summer (100 % in the Silex pond and 68 % in the Tenreuken pond) than the Tenreuken pond (p<0.0001, Table S7), and were not significantly different in the two turbid-water Leybeek and Pêcheries ponds (p=0.0617, Table S7) that showed similar low macrophyte cover during summer (6 % and 9 % in the Leybeek and Pêcheries ponds, respectively) (Fig. 8). The annually averaged values were overall influenced positively by macrophyte cover and negatively by Chl-a (Fig. 8).
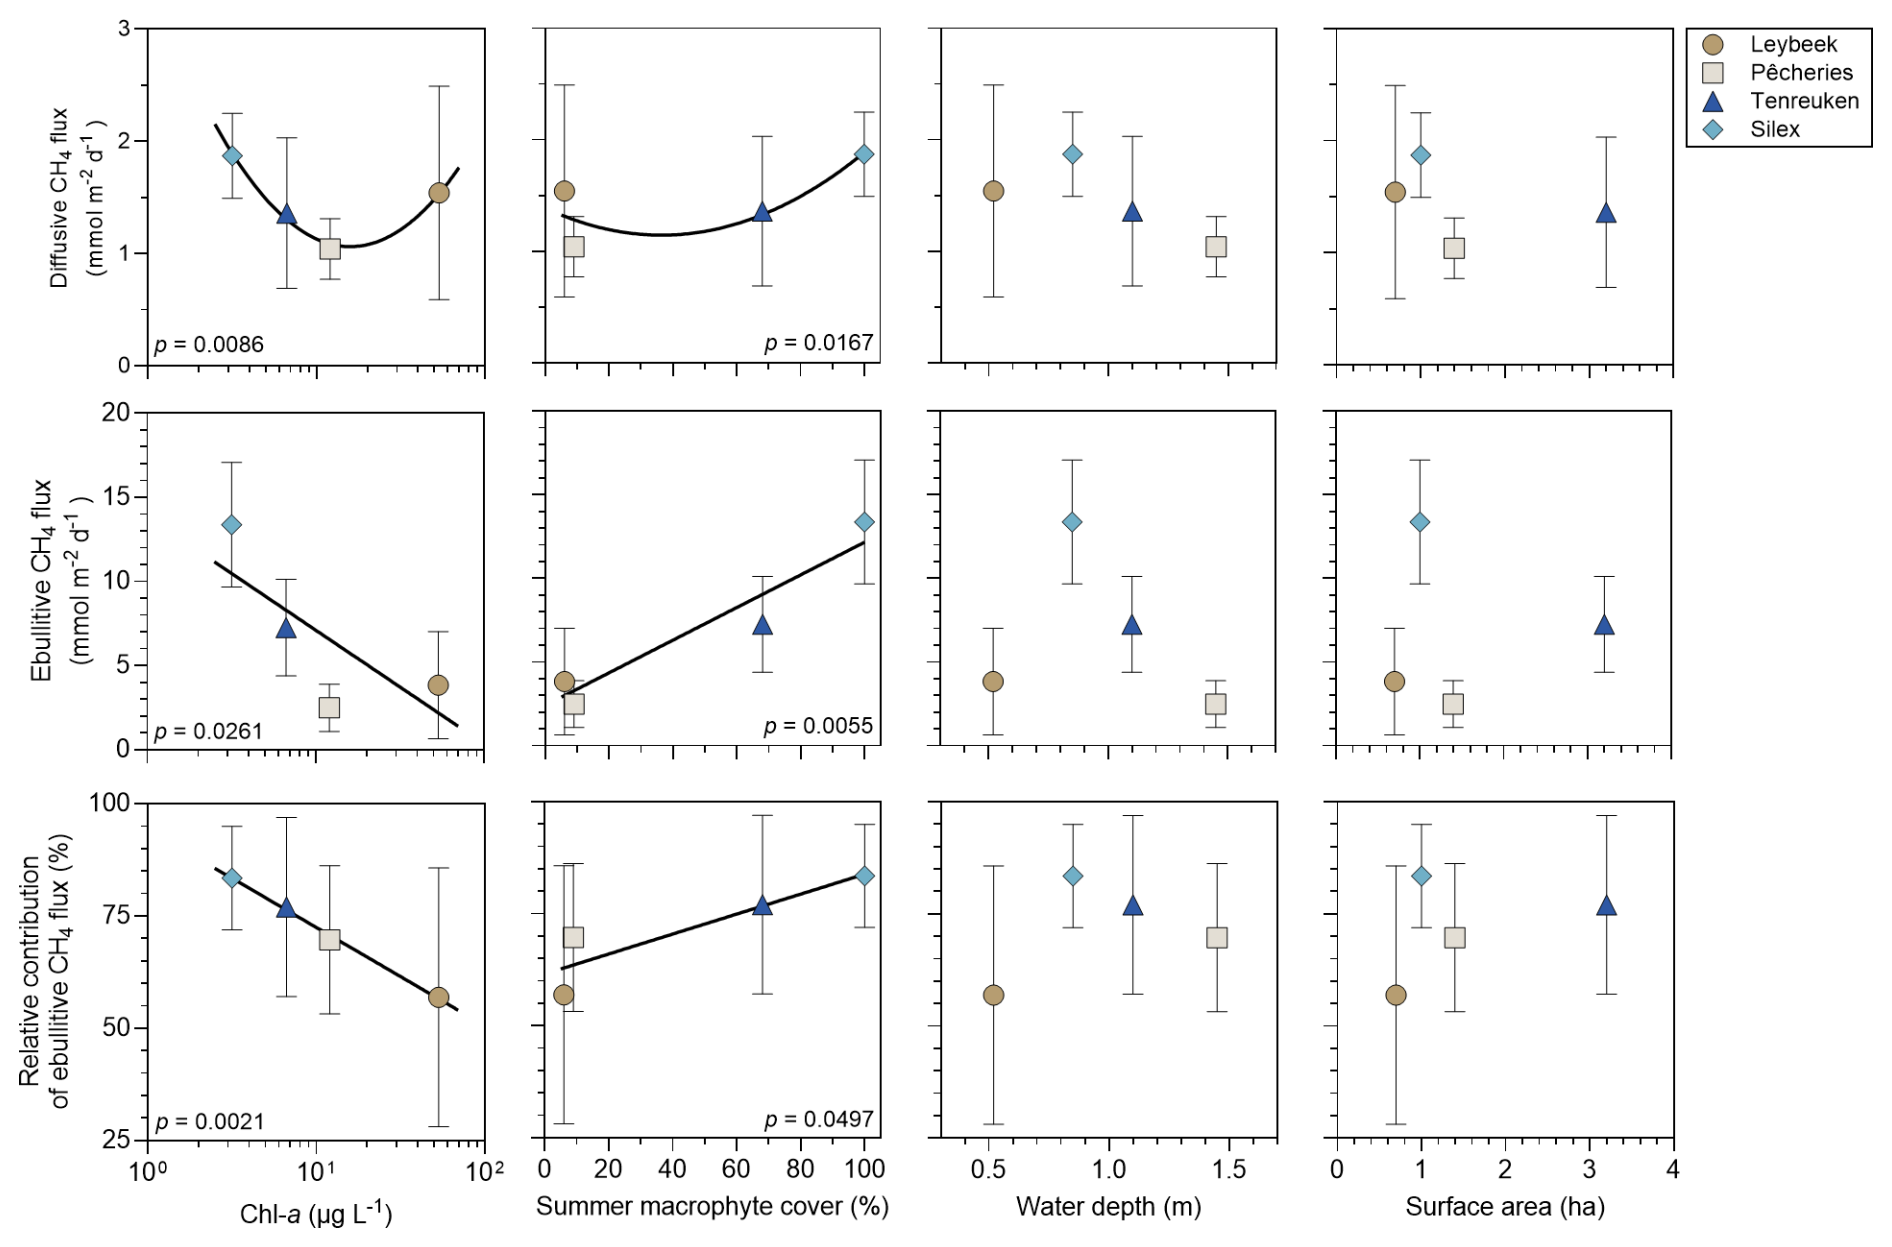
Figure 8Mean diffusive and ebullitive CH4 fluxes (mmol m−2 d−1) and mean ratio of ebullitive CH4 flux to total (diffusive + ebullitive) CH4 flux (%) versus chlorophyll-a (Chl-a, in µg L−1), total macrophyte cover in summer (%), water depth (m), and lake surface area (ha) in four ponds (Leybeek, Pêcheries, Tenreuken, and Silex) in the city of Brussels (Belgium) from June 2021 to December 2023. Error bars indicate the standard deviation. Solid lines indicate either linear or polynomial fits. Statistical comparisons between the four ponds are summarized in Table S3.
In the four sampled urban ponds, annually averaged CH4 diffusive fluxes were higher in the pond with the highest total macrophyte cover in the clear-water ponds and higher in the pond with the highest Chl-a concentration in the turbid-water ponds (Fig. 8). The annually averaged relative contribution of to total CH4 emissions was higher in the two clear-water ponds than the two turbid-water ponds (Table S7). The relative contribution of to the total CH4 flux was influenced positively by macrophyte cover and negatively by Chl-a (Fig. 8).
The annually averaged diffusive fluxes of CO2 () and N2O () in the four ponds in the city of Brussels were also plotted against annually averaged Chl-a concentration, total macrophyte cover in summer, water depth, and lake surface area (Fig. S6). Annually averaged values were lower in the Leybeek pond than the Pêcheries and the Silex ponds (Table S7). was not significantly influenced by the other variables (Chl-a concentration, total macrophyte cover, water depth, and lake surface area) (Fig. S6). Annually averaged was not significantly different between clear-water and turbid-water ponds. was significantly lower in the deeper Pêcheries pond than the two shallower Leybeek and Silex ponds (Table S7), and showed a significant negative relationship with water depth (Fig. S6).
3.5 Relative contribution of CO2, CH4, and N2O emissions
The emissions in CO2-eq for the three GHGs averaged per season for both 2022 and 2023 peaked seasonally in summer in the Silex (2.9 mg CO2-eq m−2 d−1), the Tenreuken (1.7 mg CO2-eq m−2 d−1), and the Leybeek (1.1 mg CO2-eq m−2 d−1) pond (Fig. 9) but peaked in autumn in the Pêcheries pond (1.3 mg CO2-eq m−2 d−1). The higher value of the total GHG emissions in autumn compared to other seasons in the Pêcheries pond was due to an increase of CO2 emissions in autumn that surpassed the peak of CH4 emissions in summer. The GHG fluxes were lowest in winter in the Silex (1.3 mg CO2-eq m−2 d−1), the Tenreuken (0.9 mg CO2-eq m−2 d−1), the Pêcheries (0.8 mg CO2-eq m−2 d−1), and the Leybeek (0.6 mg CO2-eq m−2 d−1) ponds. The relative contribution of peaked in summer in the Silex (73.8 %), the Tenreuken (70.9 %), the Pêcheries (23.6 %), and the Leybeek (58.3 %) ponds. The relative contribution of was lowest in winter in the Silex (22.1 %), the Tenreuken (10.0 %), the Pêcheries (6.7 %), and the Leybeek (1.0 %) ponds.
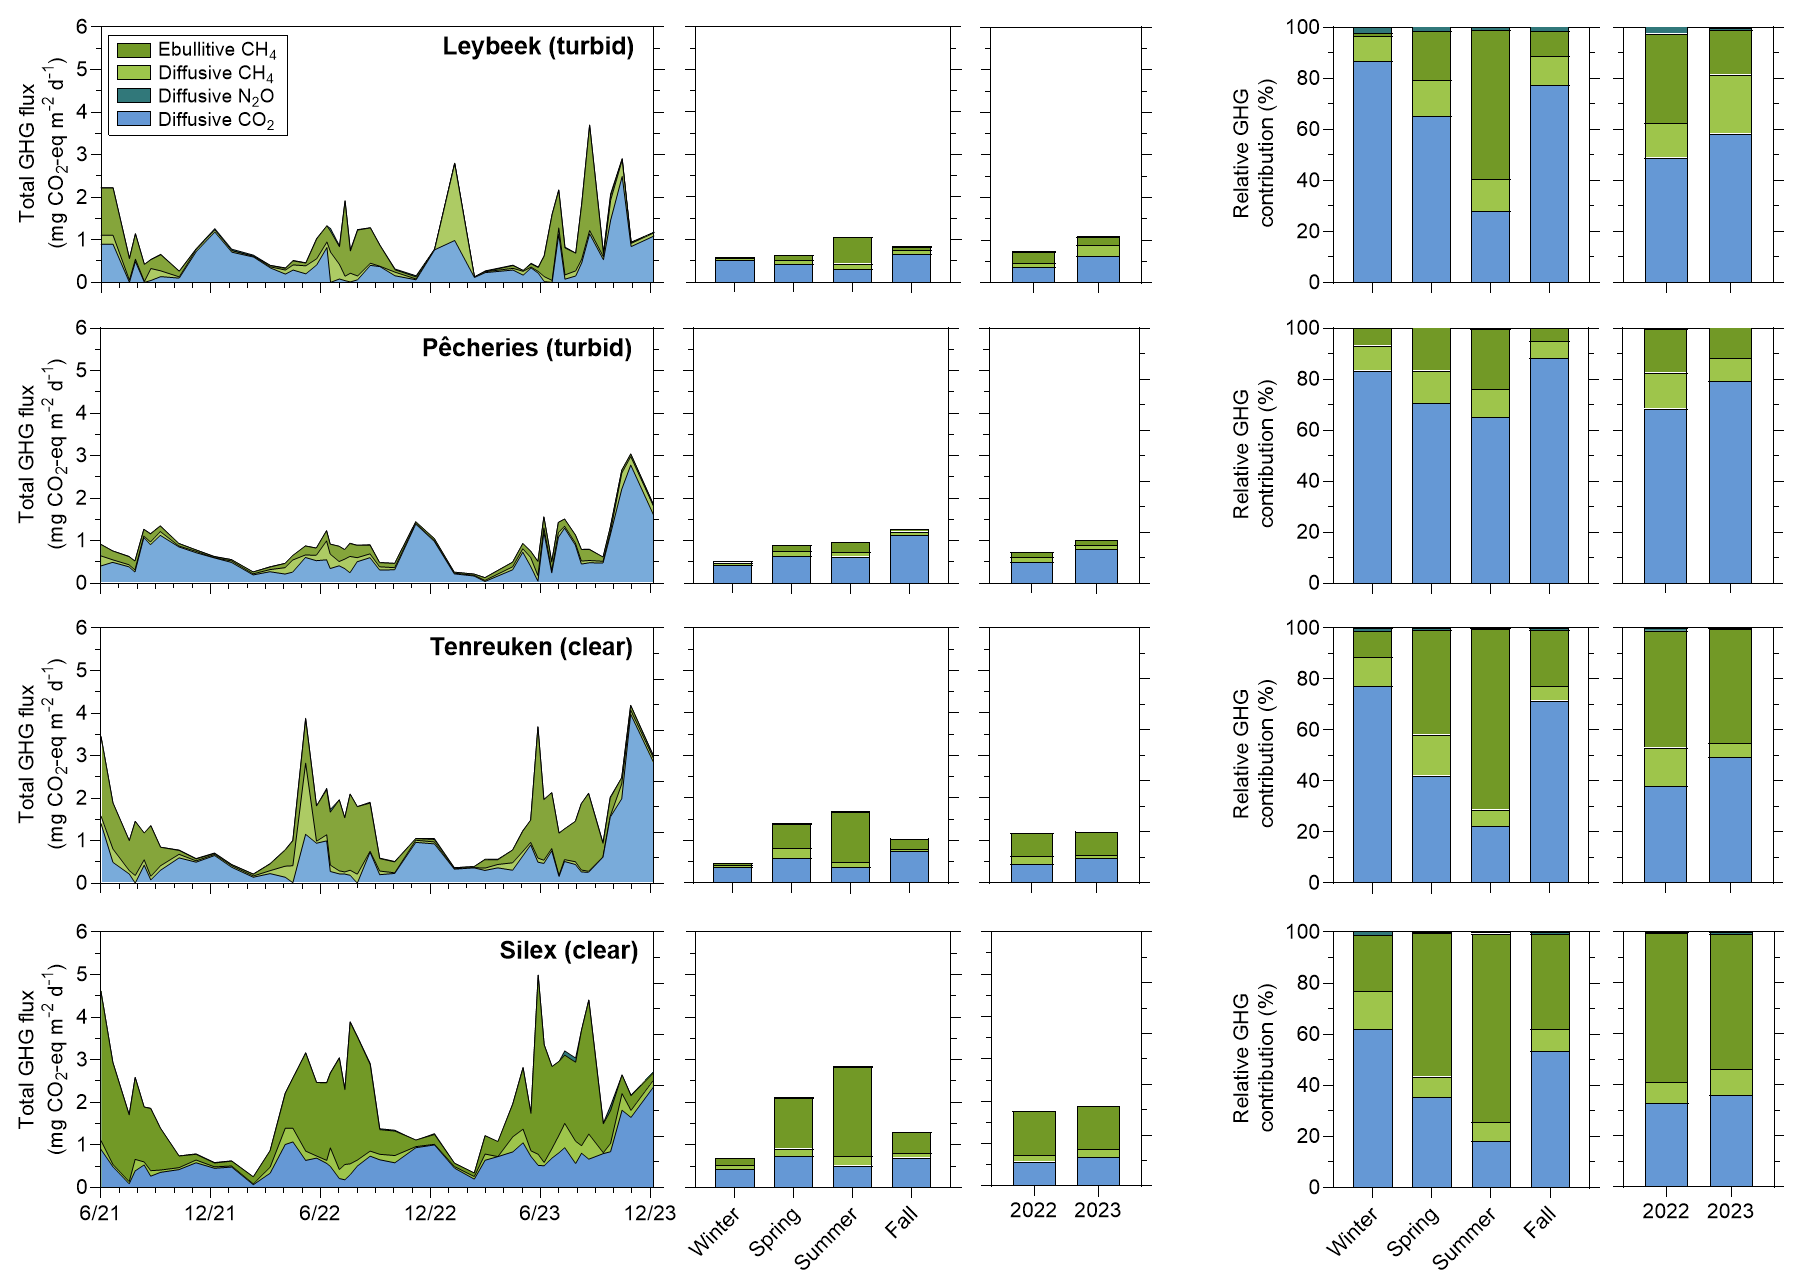
Figure 9Seasonal and year-to-year variations of the emissions to the atmosphere of CO2 (diffusive), CH4 (diffusive and ebullitive), and N2O (diffusive) expressed in CO2 equivalents (in mg CO2-eq m−2 d−1) and their relative contribution (in %), in four urban ponds (Leybeek, Pêcheries, Tenreuken, and Silex) in the city of Brussels (Belgium) from June 2021 to December 2023. Seasonal averages include data from 2021, 2022, and 2023. The annual precipitation was higher in 2023 (1011 mm) than in 2022 (701 mm).
The annual emissions in CO2-eq of the three GHGs (CO2, CH4, and N2O) in 2022 and 2023 were higher in the two clear-water ponds (1.3 ± 0.5 and 1.8 ± 0.9 mg CO2-eq m−2 d−1 in the Tenreuken and Silex ponds, respectively) than in the two turbid-water ponds (1.0 ± 0.2 and 0.9 ± 0.5 mg CO2-eq m−2 d−1 in the Leybeek and Pêcheries ponds, respectively) (Fig. 9) due to higher total CH4 emissions (diffusive + ebullitive) in clear-water ponds (0.7 ± 0.4 and 1.2 ± 0.5 mg CO2-eq m−2 d−1 in the Tenreuken and Silex ponds, respectively) than in turbid-water ponds (0.2 ± 0.2 and 0.4 ± 0.3 mg CO2-eq m−2 d−1 in the Leybeek and Pêcheries ponds, respectively). The contribution of N2O to the total GHG emissions was marginal and did not affect the differences in total GHG fluxes between ponds, with the highest contribution observed in the Leybeek pond, with a contribution of 1.7 %.
The majority of GHG emissions in CO2-eq were related to CO2 and CH4 (diffusive + ebullitive) in the four ponds. In turbid-water ponds CO2 represented the largest fraction of GHG emissions (68.5 % (2022) and 79.3 % (2023) in the Pêcheries pond, and 49.0 % (2022) and 58.3 % (2023) in the Leybeek pond). In clear-water ponds CH4 represented the largest fraction of GHG emissions (66.5 % (2022) and 63.3 % (2023) in the Silex pond and 60.8 % (2022) and 50.0 % (2023) in the Tenreuken pond). The higher annual GHG emissions in CO2-eq from the two clear-water ponds than from the turbid-water ponds were related to the higher contribution of .
The annual GHG fluxes increased from 2022 to 2023 due to an increase in the relative contribution of CO2 diffusive emissions in all four ponds. Diffusive CO2 emissions averaged 0.5 mg CO2 m−2 d−1 annually in 2022 and 0.7 mg CO2 m−2 d−1 annually in 2023 in all four ponds. Diffusive CO2 emissions were 2.1 times higher in summer 2023 than in summer 2022 and 2.5 times higher in autumn 2023 than in autumn 2022 and showed similar values between 2023 and 2022 in spring and winter (1.1 higher and 1.1 lower, respectively).
The Leybeek and Pêcheries ponds are turbid-water systems (high Chl-a and TSM values, low submerged macrophyte cover), and the Tenreuken and Silex ponds are clear-water systems (low Chl-a and TSM values, high submerged macrophyte cover) (Figs. 1, 3). All four ponds have a relatively similar size (0.7 to 3.2 ha) and depth (0.5 to 1.4 m) and are uniformly located in an urban landscape in the city of Brussels. It can be assumed that, among the four systems, the major difference that is expected to affect GHG emissions is the dominance of aquatic primary producer, either phytoplankton or macrophytes, corresponding to two alternative states sensu Scheffer et al. (1993). Our data set provides the opportunity to investigate the effect of the two alternative states on GHG emissions from small lentic systems.
The reported pCO2 values (40 to 13 804 ppm) (Fig. 3) in the four ponds in the city of Brussels were within the range of values typically observed in ponds (Holgerson and Raymond, 2016; Peacock et al., 2019; Audet et al., 2020) (Fig. 3). The pCO2 values were influenced negatively by %O2 and positively by DIN and SRP across seasons (Tables S4, S5), showing that their seasonal variability was driven by aquatic primary production and degradation of organic matter (e.g. Holgerson, 2015). Accordingly, low values of pCO2 were generally observed in spring and summer, probably due to uptake of CO2 by primary production from either phytoplankton or submerged macrophytes. High values of pCO2 were observed in autumn in the four ponds and probably reflect the release of CO2 from degradation of organic matter due to the senescence of phytoplankton or macrophytes (Fig. 3). In all four ponds, pCO2 values were influenced positively by precipitation (Tables S4, S5), suggesting an additional control of external inputs of carbon either as organic carbon sustaining internal degradation of organic matter or as soil CO2 (e.g. Marotta et al., 2010; Ojala et al., 2011; Rasilo et al., 2012; Vachon and del Giorgio, 2014; Holgerson, 2015). The %N2O values (32 % to 826 %) (Fig. 3) in the four ponds were within the range of values typically observed in ponds (Audet et al., 2020; Rabaey and Cotner, 2022). When all the data were pooled, the %N2O was influenced positively by DIN (Table S4), as also frequently reported by other studies in ponds and interpreted as a control of nitrification and/or denitrification (hence N2O production) by DIN levels (Audet et al., 2020; Webb et al., 2021; Wang et al., 2021; Xie et al., 2024). The negative influence on %N2O by Tw (Table S4) might reflect the effect of the inhibition at low temperatures of the final step of denitrification leading to an accumulation of N2O (Velthuis and Veraart, 2022) but could also indirectly result from the higher DIN concentrations observed at low Tw values (Table S6). The CH4 dissolved concentrations (194 to 48 380 nmol L−1) (Fig. 3) in the four ponds were within the range of values typically observed in ponds (Natchimuthu et al., 2014; Holgerson and Raymond, 2016; Peacock et al., 2019; Audet et al., 2020; Rabaey and Cotner, 2022; Ray et al., 2023) and were influenced positively by Tw in all four ponds individually and, when pooled (Tables S4, S5), most probably reflecting the increase in sedimentary methanogenesis with temperature (Schulz and Conrad, 1996).
Temperature also exerted a strong control on bubble flux from sediments and ebullitive CH4 emissions. The Fbubble values (0 and 2078 mL m−2 d−1) in the four sampled ponds (Fig. 4) were within the range of values reported in lentic systems of equivalent size by Wik et al. (2013) (0 to 2772 mL m−2 d−1), DelSontro et al. (2016) (11 to 748 mL m−2 d−1), and Ray and Holgerson (2023) (0 to 2079 mL m−2 d−1). The Fbubble was influenced positively by Tw (Fig. 4), in agreement with previous studies (e.g. Wik et al., 2013; DelSontro et al., 2016; Aben et al., 2017; Ray and Holgerson, 2023). Bubbling events from lake sediments are known to also be triggered by a decrease in hydrostatic pressure on the sediments due to water level fluctuations or drops in atmospheric pressure (Tokida et al., 2007; Scandella et al., 2011; Varadharajan and Hemond, 2012; Wik et al., 2013; Taoka et al., 2020; Zhao et al., 2021). In the Silex pond, in spring 2022, some peaks in Fbubble were related to drops in atmospheric pressure (Fig. 5) but unrelated to wind speed as shown in Gatun Lake (Keller and Stallard, 1994). A statistical model of Fbubble that included the contributions of Tw and Δp was used to quantify the relative importance of each of these two drivers (Fig. S4) and showed that an air pressure drop only seemed quantitatively important at low Tw and that the intensity of bubble flux was mainly driven by temperature change at yearly scales, in agreement with previous studies (e.g. Wik et al., 2013; DelSontro et al., 2016; Aben et al., 2017; Ray and Holgerson, 2023).
The mean %CH4 of the bubbles (31 ± 21 %) in the four sampled ponds in the city of Brussels was comparable to the values obtained by Wik et al. (2013) (35 ± 25 %), DelSontro et al. (2016) (58 ± 25 %), and Ray and Holgerson (2023) (25 ± 13 %) in lentic systems of similar size. The increasing pattern of %CH4 of the bubbles with Tw (Fig. 4) was most probably related to the strong dependence of methanogenesis on temperature (Schulz and Conrad, 1996). The increase in methanogenesis with temperature leads to the build-up of gas bubbles in sediments that are richer in CH4, and consequently to higher bubble fluxes with a higher CH4 content at higher temperatures (Figs. 4, S3). Since both Fbubble and the %CH4 of the bubbles increased with Tw (Fig. 4), values in the four ponds were also positively related to Tw (Fig. 6), as shown previously in other small lentic systems (e.g. Wik et al., 2013; DelSontro et al., 2016; Natchimuthu et al., 2016; Aben et al., 2017; Ray and Holgerson, 2023; Rabaey and Cotner, 2024). Yet, the dependency of CH4 ebullition on temperature (Q10) was different among the four ponds and was negatively related to depth including data from systems in Quebec (DelSontro et al., 2016) and the Netherlands (Aben et al., 2017) (Fig. 6). This implies that an increase in Tw leads to a smaller increase in CH4 ebullitive fluxes (lower Q10) in deeper ponds as the impact of hydrostatic pressure on sediments is higher in deeper ponds compared to shallow ponds, restricting bubble formation and release (e.g. DelSontro et al., 2016). This dependence of Q10 of CH4 ebullition on depth suggests that the response of CH4 ebullition to heat waves (or longer-term warming) might be more intense the shallower the pond, in addition to other effects from heat waves on GHG emissions (e.g. Audet et al., 2017).
The values of Q10 for diffusive CH4 fluxes in the four ponds were lower than those for ebullitive CH4 fluxes (Table S9), as reported by other studies in lentic systems (DelSontro et al., 2016; Xun et al., 2024). The lower dependence on Tw of diffusive CH4 fluxes compared to ebullitive CH4 fluxes might be related to a lower relative change of CH4 concentrations and k with the variation of Tw. Dissolved CH4 concentrations in surface waters of lentic systems are strongly affected by microbial methane oxidation (e.g. Bastviken et al., 2002). A relative increase in methanogenesis in sediments might lead to a stronger increase in CH4 emission by ebullition than by diffusion because of a reduction of CH4 diffusive emissions resulting from microbial methane oxidation. Additionally, k depends on wind speed, but in the four ponds, the warmer periods of the year (summer) tended to be less windy (∼ 0.3 m s−1) than the other seasons (>0.6 m s−1), also contributing to a lower dependence on Tw of CH4 diffusive fluxes compared to ebullitive fluxes (lower Q10 values).
The difference in the Q10 of diffusive and ebullitive CH4 fluxes was consistent with a seasonally variable contribution of the diffusive and ebullitive CH4 fluxes as a function of Tw. The contribution of to total (diffusive + ebullitive) CH4 emissions strongly increased with Tw in the four ponds (Fig. S5). At an annual scale, represented between 55 % and 83 % of the total CH4 emissions in the Leybeek and Silex ponds, respectively. This finding is consistent with other studies showing that ebullitive CH4 fluxes can account for more than half of total CH4 emissions in small and shallow lentic systems (e.g. Wik et al., 2013; Deemer and Holgerson, 2021; Ray and Holgerson, 2023; Rabaey and Cotner, 2024). The averaged values were higher in the two clear-water ponds (10.4 mmol m−2 d−1) than the two turbid-water ponds (3.2 mmol m−2 d−1) (Fig. 7). The averaged values in the four ponds were influenced positively by macrophyte cover and negatively by Chl-a (Fig. 8). The higher values from the two clear-water ponds would suggest that the delivery of organic matter to sediments from macrophytes sustained a quantitatively larger methane production than from phytoplankton. This finding is consistent with the notion that vegetated littoral zones of lakes are hotspots of CH4 production and emission (e.g. Hyvönen et al., 1998; Huttunen et al., 2003; Juutinen et al., 2003; Desrosiers et al., 2022). CH4 fluxes in lentic systems have been extrapolated at a global scale assuming a dependency on aquatic productivity using Chl-a as a predictor (e.g. DelSontro et al., 2018). The negative relation between values with Chl-a (Fig. 8) shows that Chl-a concentration alone fails to predict ebullitive fluxes in macrophyte-dominated clear-water ponds.
The annually averaged diffusive CH4 emissions in the four ponds seemed to respond positively to both increasing phytoplankton and macrophyte biomass, resulting in a U-shaped relation between diffusive CH4 emissions and Chl-a, as well as macrophyte cover (Fig. 8). Higher values of annually averaged CH4 diffusive fluxes occurred at the extreme values of Chl-a or of macrophyte cover (minimum or maximum), and lower values occurred at the intermediate values of Chl-a or macrophyte cover. Such a U-shape relation resulted from the inverse relationship between macrophyte cover and Chl-a (alternative states) and is consistent with the reported positive relation between diffusive CH4 fluxes with both macrophyte cover (e.g. Ray et al., 2023; Theus et al., 2023) and phytoplankton biomass (e.g. DelSontro et al., 2018; Yan et al., 2019; Bartosiewicz et al., 2021). The relative contribution of to the total annual CH4 flux increased with the macrophyte cover (Fig. 8), in agreement with the idea of an increase in CH4 ebullition relative to diffusive CH4 emissions in vegetated sediments compared to unvegetated sediments (e.g. Desrosiers et al., 2022; Ray et al., 2023; Theus et al., 2023).
Fluxes of CH4 and CO2 have been reported to be negatively related to surface area and depth by numerous studies in ponds (e.g. Holgerson, 2015; Holgerson and Raymond, 2016; Ray et al., 2023; Theus et al., 2023) and lakes (e.g. Kankaala et al., 2013; DelSontro et al., 2018, Deemer and Holgerson, 2021; Casas-Ruiz et al., 2021; Borges et al., 2022). Annual diffusive and were both unrelated to surface area and depth in the four studied ponds (Figs. 8, S6) resulting from the narrow range of variation of water depth (0.6 to 1.4 m) and surface area (0.7 to 3.2 ha). The lack of relationship between annual and both Chl-a and macrophyte cover in the four ponds (Fig. S6) might be surprising since other studies have reported lower CO2 fluxes in more productive lentic systems (e.g. Sand-Jensen and Staehr, 2007; Borges et al., 2022). We hypothesize that given that the four systems were either phytoplankton-dominated or macrophyte-dominated (alternative states), the ponds had an important submerged productivity, in both cases, resulting in a relatively invariant as a function of either Chl-a or macrophyte cover.
Global average emissions of GHGs in CO2-eq from inland waters are dominated by CO2 followed by CH4 with a small contribution from N2O according to Lauerwald et al. (2023). However, in small lentic systems such as ponds, the CO2-eq emissions from CH4 can match or dominate those of CO2 (e.g. Webb et al., 2023; Ray and Holgerson, 2023; Rabaey and Cotner, 2024). The meta-analysis of Holgerson and Raymond (2016) suggested that the CO2 and CH4 emissions in CO2-eq are numerically close in small lentic systems such as ponds but become increasingly dominated by CO2 emissions in larger lentic systems. In the four studied ponds, the GHG emissions in CO2-eq were dominated by CO2 and CH4 with a marginal contribution (<2 %) from N2O (Fig. 9). Annually, CO2 represented the largest fraction of GHG emissions in CO2-eq (∼ 60 %) in turbid-water ponds (Leybeek and Pêcheries), while CH4 represented the largest fraction of GHG emissions in CO2-eq (∼ 60 %) in clear-water ponds (Silex and Tenreuken) as a result of higher values in the clear-water ponds (Fig. 7).
The annual GHG emissions in CO2-eq increased from 2022 to 2023 due to an increase in the relative contribution of CO2 diffusive emissions in all four ponds (Fig. 9) as a result of higher precipitation in 2023 (Fig. 2). Air temperatures were similar in both years (annual average of 12.2 °C in 2022 and 12.1 °C in 2023), and precipitation was 1.5 times higher in 2023 than in 2022. Higher precipitation is likely to increase the inputs of organic and inorganic carbon from soils to ponds, as previously shown in other lentic systems (e.g. Marotta et al., 2010; Ojala et al., 2011; Rasilo et al., 2012; Vachon and del Giorgio, 2014; Holgerson, 2015). This hypothesis is only based on the comparison of 2 years, but the increase in the relative contribution of CO2 diffusive emissions in 2023 was observed in all four ponds. The synchronicity of the increase in CO2 diffusive emissions in 2023 compared to 2022 suggests a common uniform driver in all four ponds that would be consistent with a large variation in weather between the 2 years, such as annual precipitation. The strong El Niño event in 2023 induced low-level cyclonic wind anomalies and higher precipitation over western Europe, including Belgium (Chen et al., 2024).
Ebullitive CH4 emissions in 2022–2023 were higher in the two clear-water, macrophyte-dominated ponds (Tenreuken and Silex) than in the two turbid-water, phytoplankton-dominated ponds (Pêcheries and Leybeek) of the city of Brussels, although the diffusive CH4 fluxes were not significantly different between the clear-water ponds and the turbid-water ponds. The annually averaged diffusive N2O and CO2 fluxes were not significantly different in the two clear-water ponds from those in the two turbid-water ponds. Other studies have found no difference in N2O sedimentary production in lakes with a high and low density of submerged macrophytes. We hypothesize that CO2 fluxes were relatively invariant among the four sampled ponds because of their similar size, depth, and putatively productivity (either from phytoplankton or submerged macrophytes). The total (diffusive and ebullitive) CH4 emissions represented 58 % of total annual GHG emissions in CO2-eq in the two clear-water ponds compared to 41 % in the two turbid-water ponds. CO2 represented nearly all the remainder of total annual GHG emissions in CO2-eq, and N2O represented a very marginal fraction (<2 %).
The seasonal variations in GHG emissions were mainly driven by CH4 ebullitive emissions that peaked in summer (both quantitatively and relatively), as CH4 ebullition was related positively to Tw, resulting from an increase in both the flux of bubbles and CH4 content of bubbles with warming. The pCO2 values in the four sampled ponds increased with precipitation at a seasonal scale, probably in relation to higher inputs of organic and inorganic carbon from soils. The years 2022 and 2023 were abnormally dry and wet, respectively. The GHG emissions were higher in 2023 than 2022, mainly due to an increase in the relative contribution of CO2 emissions, probably due to higher precipitation in response to a strong El Niño event of 2023. This would suggest that variations in precipitation also affected year-to-year variations in CO2 emissions in addition to partly regulating seasonal variations in CO2 emissions from the four studied ponds.
The full data set is available at https://doi.org/10.5281/zenodo.11103556 (Bauduin et al., 2024b).
The supplement related to this article is available online at https://doi.org/10.5194/bg-22-3785-2025-supplement.
AVB and NG conceived the study; TB collected field samples; TB and AVB conducted the laboratory analysis; and TB and AVB jointly interpreted data and drafted the manuscript with substantial inputs from NG.
The contact author has declared that none of the authors has any competing interests.
Publisher’s note: Copernicus Publications remains neutral with regard to jurisdictional claims made in the text, published maps, institutional affiliations, or any other geographical representation in this paper. While Copernicus Publications makes every effort to include appropriate place names, the final responsibility lies with the authors.
We thank Ozan Efe (University of Liège) and Adriana Anzil (Université Libre de Bruxelles) for analytical assistance; Florence Charlier (Université Libre de Bruxelles) for help in macrophyte identification and density quantification (Table S1); Bruxelles Environnement for providing information on history of operations in the ponds (Table S2); and Ricky Mwanake, one anonymous reviewer, and the associate editor (Gabriel Singer) for comments and suggestions on the previous versions of the manuscript.
Thomas Bauduin received funding from the Brussels-Capital Region's institute for the encouragement of scientific research and innovation (Innoviris) as part of the Smartwater project (RBC/2020-EPF-6 h) and from the “Fonds pour la formation à la Recherche dans l'Industrie et dans l'Agriculture” (FRIA, Belgium). Alberto V. Borges is a research director at the FRS-FNRS.
This paper was edited by Gabriel Singer and reviewed by Ricky Mwanake and one anonymous referee.
Aben, R. C. H., Barros, N., Van Donk, E., Frenken, T., Hilt, S., Kazanjian, G., Lamers, L. P. M., Peeters, E. T. H. M., Roelofs, J. G. M., de Senerpont Domis, L. S., Stephan, S., Velthuis, M., Van de Waal, D., Wik, M., Thornton, B., Wilkinson, J., DelSontro, T., and Kosten, S.: Cross continental increase in methane ebullition under climate change, Nat. Commun., 8, 1682, https://doi.org/10.1038/s41467-017-01535-y, 2017.
Audet, J., Neif, É.M., Cao, Y., Hoffmann, C. C., Lauridsen, T. L., Larsen, S. E., Søndergaard, M., Jeppesen, E., and Davidson, T. A.: Heat-wave effects on greenhouse gas emissions from shallow lake mesocosms, Freshwater Biol., 62, 1130–1142, https://doi.org/10.1111/fwb.12930, 2017.
Audet, J., Carstensen, M. V., Hoffmann, C. C., Lavaux, L., Thiemer, K., and Davidson, T. A.: Greenhouse gas emissions from urban ponds in Denmark, Inland Waters, 10, 373–385, https://doi.org/10.1080/20442041.2020.1730680, 2020.
Baliña, S., Sanchez, M. L., Izaguirre, I., and del Giorgio, P. A.: Shallow lakes under alternative states differ in the dominant greenhouse gas emission pathways, Limnol. Oceanogr., 68, 1–13, https://doi.org/10.1002/lno.12243, 2023.
Barko, J. W., Gunnison, D., and Carpenter, S. R.: Sediment interactions with submersed macrophyte growth and community dynamics, Aquat. Bot., 41, 41–65, https://doi.org/10.1016/0304-3770(91)90038-7, 1991.
Bartosiewicz, M., Maranger, R., Przytulska, A., and Laurion, I.: Effects of phytoplankton blooms on fluxes and emissions of greenhouse gases in a eutrophic lake, Water Res., 196, 116985, https://doi.org/10.1016/j.watres.2021.116985, 2021.
Bastviken, D., Ejlertsson, J., and Tranvik, L.: Measurement of methane oxidation in lakes: A comparison of methods, Environ. Sci. Technol., 36, 3354–3361, https://doi.org/10.1021/es010311p, 2002.
Bastviken, D., Treat, C. C., Pangala, S. R., Gauci, V., Enrich-Prast, A., Karlson, M., Gålfalk, M., Romano, M. B., and Sawakuchi, H. O.: The importance of plants for methane emission at the ecosystem scale, Aquat. Bot., 184, 103596, https://doi.org/10.1016/j.aquabot.2022.103596, 2023.
Bates, D., Maechler, M., Bolker, B., and Walker, S.: Fitting linear mixed-effects models using lme4, J. Stat. Softw., 67, 1–48, https://doi.org/10.1126/science.1176170, 2015.
Bauduin, T., Gypens, N., and Borges, A. V.: Seasonal and spatial variations of greenhouse gas (CO2, CH4 and N2O) emissions from urban ponds in Brussels, Water Res., 253, 121257, https://doi.org/10.1016/j.watres.2024.121257, 2024a.
Bauduin, T., Gypens, N., and Borges, A. V.:. Biogeochemical data from two clear-water and two turbid-water urban ponds in Brussels (Belgium) from June 2021 to December 2023, Zenodo [data set], https://doi.org/10.5281/zenodo.11103557, 2024b.
Borges, A. V., Darchambeau, F., Lambert, T., Morana, C., Allen, G. H., Tambwe, E., Toengaho Sembaito, A., Mambo, T., Nlandu Wabakhangazi, J., Descy, J.-P., Teodoru, C. R., and Bouillon, S.: Variations in dissolved greenhouse gases (CO2, CH4, N2O) in the Congo River network overwhelmingly driven by fluvial-wetland connectivity, Biogeosciences, 16, 3801–3834, https://doi.org/10.5194/bg-16-3801-2019, 2019.
Borges, A. V., Deirmendjian, L., Bouillon, S., Okello, W., Lambert, T., Roland, F. A. E., Razanamahandry, V. F., Voarintsoa, N. R. G., Darchambeau, F., Kimirei, I. A., Descy, J., Allen, G. H., and Morana, C.: Greenhouse gas emissions from African lakes are no longer a blind spot, Sci. Adv., 8, eabi8716, https://doi.org/10.1126/sciadv.abi8716, 2022.
Borges, A. V., Okello, W., Bouillon, S., Deirmendjian, S., Nankabirwa, A., Nabafu, E., Lambert, T., Descy, J.-P., and Morana, C.: Spatial and temporal variations of dissolved CO2, CH4 and N2O in Lakes Edward and George (East Africa), Journal of Great Lakes Research, 49, 229–245, https://doi.org/10.1016/j.jglr.2022.11.010, 2023.
Brans, K. I., Engelen, J. M., Souffreau, C., and De Meester, L.: Urban hot-tubs: local urbanization has profound effects on average and extreme temperatures in ponds, Landscape Urban Plan., 176, 22–29, https://doi.org/10.1016/j.landurbplan.2018.03.013, 2018.
Cael, B. B., Heathcote, A. J., and Seekell, D. A.: The volume and mean depth of Earth's lakes, Geophys. Res. Lett., 44, 209–218, https://doi.org/10.1002/2016GL071378, 2017.
Casas-Ruiz, J. P., Jakobsson, J., and del Giorgio, P. A.: The role of lake morphometry in modulating surface water carbon concentrations in boreal lakes, Environ. Res. Lett., 16, 074037, https://doi.org/10.1088/1748-9326/ac0be3, 2021.
Chen, B., Zhang, L., and Wang, C.: Distinct impacts of the central and eastern Atlantic Niño on the European climate, Geophys. Res. Lett., 51, e2023GL107012, https://doi.org/10.1029/2023GL107012, 2024.
Choudhury, M. I., McKie, B. G., Hallin, S., and Ecke, F.: Mixtures of macrophyte growth forms promote nitrogen cycling in wetlands, Sci. Total Environ., 635, 1436–1443, https://doi.org/10.1016/j.scitotenv.2018.04.193, 2018.
Clifford, C. C. and Heffernan, J. B.: Artificial aquatic ecosystems, Water, 10, 1096, https://doi.org/10.3390/w10081096, 2018.
Codispoti, L. A. and Christensen, J. P.: Nitrification, denitrification and nitrous oxide cycling in the eastern tropical South Pacific Ocean, Mar. Chem., 16, 277–300, https://doi.org/10.1016/0304-4203(85)90051-9, 1985.
Cole, J. J. and Caraco, N. F.: Atmospheric exchange of carbon dioxide in a low-wind oligotrophic lake measured by the addition of SF6, Limnol. Oceanogr., 43, 647–656, https://doi.org/10.4319/lo.1998.43.4.0647, 1998.
Dan, Z., Chuan, W., Qiaohong, Z., and Xingzhong, Y.: Sediments nitrogen cycling influenced by submerged macrophytes growing in winter, Water Sci. Technol., 83, 1728–1738, https://doi.org/10.2166/wst.2021.081, 2021.
Davidson, T. A., Audet, J., Svenning, J. C., Lauridsen, T. L., Søndergaard, M., Landkildehus, F., and Jeppesen, E.: Eutrophication effects on greenhouse gas fluxes from shallow-lake mesocosms override those of climate warming, Glob. Change Biol., 21, 4449–4463, https://doi.org/10.1111/gcb.13062, 2015.
Deemer, B. R. and Holgerson, M. A.: Drivers of methane flux differ between lakes and reservoirs, complicating global upscaling efforts, J. Geophys. Res.-Biogeosci, 126, 1–15, https://doi.org/10.1029/2019JG005600, 2021.
DelSontro, T., Kunz, M. J., Kempter, T., Wüest, A., Wehrli, B., and Senn, D. B.: Spatial Heterogeneity of Methane Ebullition in a Large Tropical Reservoir, Environ. Sci. Technol., 45, 9866–9873, https://doi.org/10.1021/es2005545, 2011.
DelSontro, T., Boutet, L., St-Pierre, A., del Giorgio, P. A., and Prairie, Y. T.: Methane ebullition and diffusion from northern ponds and lakes regulated by the interaction between temperature and system productivity, Limnol. Oceanogr., 61(S1), S62–S77 https://doi.org/10.1002/lno.10335, 2016.
DelSontro, T., Beaulieu, J. J., and Downing, J. A.: Greenhouse gas emissions from lakes and impoundments: Upscaling in the face of global change, Limnol. Oceanogr. Lett., 3, 64–75, https://doi.org/10.1002/lol2.10073, 2018.
Deng, Hg., Zhang, J., Wu, J., Yao, X., and Yang, L.-W.: Biological denitrification in a macrophytic lake: implications for macrophytes-dominated lake management in the north of China, Environ. Sci. Pollut. Res., 27, 42460–42471. https://doi.org/10.1007/s11356-020-10230-3, 2020.
Desrosiers, K., DelSontro, T., and del Giorgio, P. A.: Disproportionate Contribution of Vegetated Habitats to the CH4 and CO2 Budgets of a Boreal Lake, Ecosystems, 25, 1522–1541, https://doi.org/10.1007/s10021-021-00730-9, 2022.
Dickson, A. G.; Sabine, C. L., and Christian, J. R.: Guide to best practices for ocean CO2 measurement, Sidney, British Columbia, North Pacific Marine Science Organization, 191 pp., PICES Special Publication 3, IOCCP Report 8, https://doi.org/10.25607/OBP-1342, 2007.
Dutton, G., Elkins II, J., and Hall, B., and NOAA ESRL: Earth System Research Laboratory Halocarbons and Other Atmospheric Trace Gases Chromatograph for Atmospheric Trace Species (CATS) Measurements, NOAA National Centers for Environmental Information [data set], Version 1, https://doi.org/10.7289/V5X0659V, 2023.
Goeckner, A. H., Lusk, M. G., Reisinger, A. J., Hosen, J. D., and Smoak, J. M.: Florida's urban stormwater ponds are net sources of carbon to the atmosphere despite increased carbon burial over time, Commun. Earth Environ., 3, 1–8, https://doi.org/10.1038/s43247-022-00384-y, 2022.
Gorsky, A. L., Racanelli, G. A., Belvin, A. C., and Chambers, R. M.: Greenhouse gas flux from stormwater ponds in southeastern Virginia (USA), Anthropocene, 28, 100218, https://doi.org/10.1016/j.ancene.2019.100218, 2019.
Gorsky, A. L., Dugan, H. A., Wilkinson, G. M., and Stanley, E. H.: Under-ice oxygen depletion and greenhouse gas supersaturation in north temperate urban ponds, J. Geophys. Res.-Biogeosci., 129, 1–13, https://doi.org/10.1029/2024JG008120, 2024.
Grasset, C., Abril, G., Mendonça, R., Roland, F., and Sobek, S.: The transformation of macrophyte-derived organic matter to methane relates to plant water and nutrient contents, Limnol. Oceanogr., 64, 1737–1749, https://doi.org/10.1002/lno.11148, 2019.
Grasset, C., Sobek, S., Scharnweber, K., Moras, S., Villwock, H., Andersson, S., Hiller, C., Nydahl, A. C., Chaguaceda, F., Colom, W., and Tranvik, L. J.: The CO2-equivalent balance of freshwater ecosystems is non-linearly related to productivity, Glob. Change Biol., 26, 5705–5715, https://doi.org/10.1111/gcb.15284, 2020.
Grasshoff, K. and Johannsen, H.: A new sensitive and direct method for the automatic determination of ammonia in sea water, ICES Journal of Marine Science, 34, 516–521, https://doi.org/10.1093/icesjms/34.3.516, 1972.
Grasshoff, K., Kremling, K., and Ehrhardt, M.: Methods of Seawater Analysis: Determination of Nitrite, John Wiley & Sons, 365–371, ISBN 978-3-527-61399-1, 2009.
Grinham, A., Albert, S., Deering, N., Dunbabin, M., Bastviken, D., Sherman, B., Lovelock, C. E., and Evans, C. D.: The importance of small artificial water bodies as sources of methane emissions in Queensland, Australia, Hydrol. Earth Syst. Sci., 22, 5281–5298, https://doi.org/10.5194/hess-22-5281-2018, 2018.
Harpenslager, S. F., Thiemer, K., Levertz, C., Misteli, B., Sebola, K. M., Schneider, S. C., Hilt, S., and Köhler, J.: Short-term effects of macrophyte removal on emission of CO2 and CH4 in shallow lakes, Aquat. Bot., 182, 103555, https://doi.org/10.1016/j.aquabot.2022.103555, 2022.
Hassall, C.: The ecology and biodiversity of urban ponds, WIREs Water, 1, 187–206, https://doi.org/10.1002/wat2.1014, 2014.
Herrero Ortega, S., Romero González-Quijano, C., Casper, P., Singer, G. A., and Gessner, M. O.: Methane emissions from contrasting urban freshwaters: rates, drivers, and a whole-city footprint, Glob. Change Biol., 25, 4234–4243, https://doi.org/10.1111/gcb.14799, 2019.
Hilt, S., Brothers, S., Jeppesen, E., Veraart, A. J., and Kosten, S.: Translating regime shifts in shallow lakes into changes in ecosystem functions and services, BioScience, 67, 928–936, https://doi.org/10.1093/biosci/bix106, 2017.
Holgerson, M. and Raymond, P.: Large contribution to inland water CO2 and CH4 emissions from very small ponds, Nat. Geosci., 9, 222–226, https://doi.org/10.1038/ngeo2654, 2016.
Holgerson, M. A.: Drivers of carbon dioxide and methane supersaturation in small, temporary ponds, Biogeochemistry, 124, 305–318, https://doi.org/10.1007/s10533-015-0099-y, 2015.
Huttunen, J. T., Alm, J., Liikanen, A., Juutinen, S., Larmola, T., Hammar, T., Silvola, T., and Martikainen, P. J.: Fluxes of methane, carbon dioxide and nitrous oxide in boreal lakes and potential anthropogenic effects on the aquatic greenhouse gas emissions, Chemosphere, 52, 609–621, https://doi.org/10.1016/S0045-6535(03)00243-1, 2003.
Hyvönen, T., Ojala, A., Kankaala, P., and Martikainen, P. J.: Methane release from stands of water horsetail (Equisetum fluviatile) in a boreal lake, Freshwater Biol., 40, 275–284, https://doi.org/10.1046/j.1365-2427.1998.00351.x, 1998.
Johnson, M. S., Matthews, E., Du, J., Genovese, V., and Bastviken, D.: Methane Emission from Global Lakes: New Spatiotemporal Data and Observation-Driven Modeling of Methane Dynamics Indicates Lower Emissions, J. Geophys. Res.-Biogeosci., 127, 1–22, https://doi.org/10.1029/2022JG006793, 2022.
Juutinen, S., Alm, J., Larmola, T., Huttunen, J. T., Morero, M., Martikainen, P. J., and Silvola, J.: Major implication of the littoral zone for methane release from boreal lakes, Global Biogeochem. Cy., 17, 1117, https://doi.org/10.1029/2003GB002105, 2003.
Kankaala, P., Huotari, J., Tulonen, T., and Ojala, A.: A Lake-size dependent physical forcing drives carbon dioxide and methane effluxes from lakes in a boreal landscape, Limnol. Oceanogr., 58, 1915–1930, https://doi.org/10.4319/lo.2013.58.6.1915, 2013.
Keller, M. and Stallard, R. F.: Methane emission by bubbling from Gatun Lake, Panama, J. Geophys. Res.-Atmos., 99, 8307–8319, https://doi.org/10.1029/92JD02170, 1994.
Koroleff, J.: Determination of total phosphorus by alkaline persulphate oxidation, Methods of Seawater Analysis, Verlag Chemie, Wienheim, 136–138, ISBN 978-0-895-73070-1, 1983.
Kosten, S., Roland, F., Da Motta Marques, D. M., Van Nes, E. H., Mazzeo, N., Sternberg, L. D. S., Scheffer, M., and Cole, J. J. Climate-dependent CO2 emissions from lakes, Global Biogeochem. Cy., 24, 1–7, https://doi.org/10.1029/2009GB003618, 2010.
Lan, X., Thoning, K. W., and Dlugokencky, E. J.: Trends in globally-averaged CH4, N2O, and SF6 determined from NOAA Global Monitoring Laboratory measurements, NOAA Global Monitoring Laboratory measurements [data set], Version 2024-08, https://doi.org/10.15138/P8XG-AA10, 2024.
Lauerwald, R., Regnier, P., Figueiredo, V., Enrich-Prast, A., Bastviken, D., Lehner, B., Maavara, T., and Raymond, P.: Natural Lakes Are a Minor Global Source of N2O to the Atmosphere, Global Biogeochem. Cy., 33, 1564–1581, https://doi.org/10.1029/2019GB006261, 2019.
Lauerwald, R., Allen, G. H., Deemer, B. R., Liu, S., Maavara, T., Raymond, P., Alcott, L., Bastviken, D., Hastie, A., Holgerson, M.A., Johnson, M. S., Lehner, B., Lin, P., Marzadri, A., Ran, L., Tian, H., Yang, X., Yao, Y., and Regnier, P.: Inland water greenhouse gas budgets for RECCAP2: 2. Regionalization and homogenization of estimates, Global Biogeochem. Cy., 37, e2022GB007658, https://doi.org/10.1029/2022GB007658, 2023.
Liu, W., Jiang, X., Zhang, Q., Li, F., and Liu, G.: Has submerged vegetation loss altered sediment denitrification, N2O production, and denitrifying microbial communities in subtropical lakes?, Global Biogeochem. Cy., 32, 1195–1207, https://doi.org/10.1029/2018GB005978, 2018.
Maavara, T., Lauerwald, R., Laruelle, G. G., Akbarzadeh, Z., Bouskill, N. J., Van Cappellen, P., and Regnier, P.: Nitrous oxide emissions from inland waters: Are IPCC estimates too high?, Glob. Change Biol., 25, 473–488, https://doi.org/10.1111/gcb.14504, 2019.
Marotta, H., Duarte, C. M., Pinho, L., and Enrich-Prast, A.: Rainfall leads to increased pCO2 in Brazilian coastal lakes, Biogeosciences, 7, 1607–1614, https://doi.org/10.5194/bg-7-1607-2010, 2010.
Martinez-Cruz, K., Gonzalez-Valencia, R., Sepulveda-Jauregui, A., Plascencia- Hernandez, F., Belmonte-Izquierdo, Y., and Thalasso, F.: Methane emission from aquatic ecosystems of Mexico City, Aquat. Sci., 79, 159–169, https://doi.org/10.1007/s00027-016-0487-y, 2017.
Mengis, M., Gächter, R., and Wehrli, B.: Sources and sinks of nitrous oxide (N2O) in deep lakes, Biogeochemistry, 38, 281–301, https://doi.org/10.1023/A:1005814020322, 1997.
Myrhe, G., Shindell, D., Bréon, F.M., Collins, W., and Al, E. Anthropogenic and natural radiative forcing, Climate Change 2013 the Physical Science Basis: working Group I Contribution to the Fifth Assessment Report of the Intergovernmental Panel on Climate Change, Chapter 8: Anthropogenic and Natural Radiative Forcing 9781107057, 659–740, https://doi.org/10.1017/CBO9781107415324.018, 2013.
Natchimuthu, S., Panneer Selvam, B., and Bastviken, D.: Influence of weather variables on methane and carbon dioxide flux from a shallow pond, Biogeochemistry, 119, 403–413, https://doi.org/10.1007/s10533-014-9976-z, 2014.
Natchimuthu, S., Sundgren, I., Gålfalk, M., Klemedtsson, L., Crill, P., Danielsson, Å., and Bastviken, D.: Spatio-temporal variability of lake CH4 fluxes and its influence on annual whole lake emission estimates, Limnol. Oceanogr., 61, S13–S26, https://doi.org/10.1002/lno.10222, 2016.
Ni, M., Liang, X., Hou, L., Li, W., and He, C.: Submerged macrophytes regulate diurnal nitrous oxide emissions from a shallow eutrophic lake: A case study of Lake Wuliangsuhai in the temperate arid region of China, Sci. Total Environ., 811, 152451, https://doi.org/10.1016/j.scitotenv.2021.152451, 2022.
Ojala, A., Bellido, J. L., Tulonen, T., Kankaala, P., and Huotari, J.: Carbon gas fluxes from a brown-water and a clear-water lake in the boreal zone during a summer with extreme rain events, Limnol. Oceanogr., 56, 61–76, https://doi.org/10.4319/lo.2011.56.1.0061, 2011.
Ollivier, Q. R., Maher, D. T., Pitfield, C., and Macreadie, P. I.: Punching above their weight: large release of greenhouse gases from small agricultural dams, Global Change Biol., 25, 721–732, https://doi.org/10.1111/gcb.14477, 2019.
Peacock, M., Audet, J., Jordan, S., Smeds, J., and Wallin, M. B.: Greenhouse gas emissions from urban ponds are driven by nutrient status and hydrology, Ecosphere, 10, e02643, https://doi.org/10.1002/ecs2.2643, 2019.
Peacock, M., Audet, J., Bastviken, D., Cook, S., Evans, C. D., Grinham, A., Holgerson, M. A., Högbom, L., Pickard, A. E., Zieliński, P., and Futter, M. N.: Small artificial waterbodies are widespread and persistent emitters of methane and carbon dioxide, Glob. Change Biol., 27, 5109–5123, https://doi.org/10.1111/gcb.15762, 2021.
Peretyatko, A., Symoens, J. J., and Triest, L.: Impact of macrophytes on phytoplankton in eutrophic peri-urban ponds, implications for pond management and restoration, Belgian Journal of Botany, 83–99, https://www.jstor.org/stable/20794626, 2007.
R Core Team: R: A language and environment for statistical computing, R Foundation for Statistical Computing, Vienna, Austriaa, https://www.R-project.org/ (last access: 14 May 2025), 2021.
Rabaey, J. and Cotner, J.: Pond greenhouse gas emissions controlled by duckweed coverage, Front. Environ. Sci., 10, 889289, https://doi.org/10.3389/fenvs.2022.889289, 2022.
Rabaey, J. and Cotner, J.: The influence of mixing on seasonal carbon dioxide and methane fluxes in ponds, Biogeochemistry, 167, 1–18, https://doi.org/10.1007/s10533-024-01167-7, 2024.
Rasilo, T., Ojala, A., Huotari, J., and Pumpanen, J.: Rain Induced Changes in Carbon Dioxide Concentrations in the Soil–Lake–Brook Continuum of a Boreal Forested Catchment, Vadose Zone J., 11, vzj2011.0039, https://doi.org/10.2136/vzj2011.0039, 2012.
Ray, N. E. and Holgerson, M. A.: High Intra-Seasonal Variability in Greenhouse Gas Emissions from Temperate Constructed Ponds, Geophys. Res. Lett., 50, e2023GL104235, https://doi.org/10.1029/2023GL104235, 2023.
Ray, N. E., Holgerson, M. A., Andersen, M. R., Bikše, J., Bortolotti, L. E., Futter, M., Kokorïte, I., Law, A., McDonald, C., Mesman, J. P., Peacock, M., Richardson, D. C., Arsenault, J., Bansal, S., Cawley, K., Kuhn, M., Shahabinia, A. R., and Smufer, F.: Spatial and temporal variability in summertime dissolved carbon dioxide and methane in temperate ponds and shallow lakes, Limnol. Oceanogr., 68, 1530–1545, https://doi.org/10.1002/lno.12362, 2023.
Raymond, P. A., Hartmann, J., Lauerwald, R., Sobek, S., McDonald, C., Hoover, M., Butman, D., Striegl, R., Mayorga, E., Humborg, C., Kortelainen, P., Dürr, H., Meybeck, M., Ciais, P., and Guth, P.: Global carbon dioxide emissions from inland waters, Nature, 503, 355–359, https://doi.org/10.1038/nature12760, 2013.
Reitsema, R. E., Meire, P., and Schoelynck, J.: The future of freshwater macrophytes in a changing world: dissolved organic carbon quantity and quality and its interactions with macrophytes, Front. Plant Sci., 9, 301954, https://doi.org/10.3389/fpls.2018.00629, 2018.
Rocher-Ros, G., Stanley, E. H., Loken, L. C., Casson, N. J., Raymond, P. A., Liu, S., Amatulli, G., and Sponseller, R. A.: Global methane emissions from rivers and streams, Nature, 621, 530–535, https://doi.org/10.1038/s41586-023-06344-6, 2023.
Rosentreter, J. A., Borges, A. V., Deemer, B. R., Holgerson, M. A., Liu, S., Song, C., Melack, J., Raymond, P. A., Duarte, C. M., Allen, G. H., Olefeldt, D., Poulter, B., Battin, T. I., and Eyre, B. D.: Half of global methane emissions come from highly variable aquatic ecosystem sources, Nature Geosci., 14, 225–230, https://doi.org/10.1038/s41561-021-00715-2, 2021.
Sand-Jensen, K. and Staehr, P. A.: Scaling of pelagic metabolism to size, trophy and forest cover in small Danish lakes, Ecosystems, 10, 128–142, https://doi.org/10.1007/s10021-006-9001-z, 2007.
Scandella, B. P., Varadharajan, C., Hemond, H. F., Ruppel, C., and Juanes, R.: A conduit dilation model of methane venting from lake sediments. Geophys. Res. Lett., 38, https://doi.org/10.1029/2011GL046768, 2011.
Scheffer, M., Hosper, S. H., Meijer, M. L., Moss, B., and Jeppesen, E.: Alternative equilibria in shallow lakes. Trends in ecology & evolution, 8, 275–279, https://doi.org/10.1016/0169-5347(93)90254-M, 1993.
Schulz, S. and Conrad, R.: Influence of temperature on pathways to methane production in the permanently cold profundal sediment of Lake Constance, FEMS Microbiol. Ecol., 20 1–14, https://doi.org/10.1111/j.1574-6941.1996.tb00299.x, 1996.
Singh, S. N., Kulshreshtha, K., and Agnihotri, S.: Seasonal dynamics of methane emission from wetlands, Chemosphere-Global Change Science, 2, 39–46, https://doi.org/10.1016/S1465-9972(99)00046-X, 2000.
Stanley, E. H., Casson, N. J., Christel, S. T., Crawford, J. T., Loken, L. C., and Oliver, S. K.: The ecology of methane in streams and rivers: patterns, controls, and global significance, Ecol. Monogr., 86, 146–171, https://doi.org/10.1890/15-1027, 2016.
Taoka, T., Iwata, H., Hirata, R., Takahashi, Y., Miyabara, Y., and Itoh, M.: Environmental controls of diffusive and ebullitive methane emissions at a subdaily time scale in the littoral zone of a midlatitude shallow lake, J. Geophys. Res.-Biogeosci., 125, e2020JG005753, https://doi.org/10.1029/2020JG005753, 2020.
Theus, M. E., Ray, N. E., Bansal, S., and Holgerson, M. A.: Submersed macrophyte density regulates aquatic greenhouse gas emissions, J. Geophys. Res.-Biogeosci., 128, 1–12, https://doi.org/10.1029/2023JG007758, 2023.
Tixier, G., Lafont, M., Grapentine, L., Rochfort, Q., and Marsalek, J.: Ecological risk assessment of urban stormwater ponds: Literature review and proposal of a new conceptual approach providing ecological quality goals and the associated bioassessment tools, Ecol. Indic., 11, 1497–1506, https://doi.org/10.1016/j.ecolind.2011.03.027, 2011.
Tokida, T., Miyazaki, T., Mizoguchi, M., Nagata, O., Takakai, F., Kagemoto, A., and Hatano, R.: Falling atmospheric pressure as a trigger for methane ebullition from peatland, Global Biogeochem. Cy., 21, 1–8, https://doi.org/10.1029/2006GB002790, 2007.
Vachon, D. and del Giorgio, P. A.: Whole-Lake CO2 Dynamics in Response to Storm Events in Two Morphologically Different Lakes, Ecosystems, 17, 1338–1353, https://doi.org/10.1007/s10021-014-9799-8, 2014.
Vachon, D., Langenegger, T., Donis, D., Beaubien, S. E., and McGinnis, D. F.: Methane emission offsets carbon dioxide uptake in a small productive lake, Limnol. Oceanogr. Lett,, 5, 384–392, https://doi.org/10.1002/lol2.10161, 2020.
van Bergen, T. J. H. M., Barros, N., Mendonça, R., Aben, R. C. H., Althuizen, I. H. J., Huszar, V., Lamers, L. P. M., Lürling, M., Roland, F., and Kosten, S.: Seasonal and diel variation in greenhouse gas emissions from an urban pond and its major drivers, Limnol. Oceanogr., 64, 2129–2139, https://doi.org/10.1002/lno.11173, 2019.
Varadharajan, C. and Hemond, H. F.: Time-series analysis of high-resolution ebullition fluxes from a stratified, freshwater lake, J. Geophys. Res.-Biogeosci., 117, 1–15, https://doi.org/10.1029/2011JG001866, 2012.
Velthuis, M. and Veraart, A. J.: Temperature sensitivity of freshwater denitrification and N2O emission – A meta-analysis, Global Biogeochem. Cy., 36, 1–14, https://doi.org/10.1029/2022GB007339, 2022.
Verpoorter, C., Kutser, T., Seekell, D. A., and Tranvik, L. J.: A global inventory of lakes based on high-resolution satellite imagery, Geophys. Res. Lett., 41, 6396–6402, https://doi.org/10.1002/2014GL060641, 2014.
Wang, G., Xia, X., Liu, S., Zhang, S., Yan, W., and McDowell, W. H.: Distinctive Patterns and Controls of Nitrous Oxide Concentrations and Fluxes from Urban Inland Waters, Environ. Sci. Technol., 55, 8422–8431, https://doi.org/10.1021/acs.est.1c00647, 2021.
Wanninkhof, R.: Relationship between gas exchange and wind speed over the ocean, J. Geophys. Res.-Oceans, 97, 7373–7381, https://doi.org/10.1029/92JC00188, 1992.
Webb, J. R., Leavitt, P. R., Simpson, G. L., Baulch, H. M., Haig, H. A., Hodder, K. R., and Finlay, K.: Regulation of carbon dioxide and methane in small agricultural reservoirs: optimizing potential for greenhouse gas uptake, Biogeosciences, 16, 4211–4227, https://doi.org/10.5194/bg-16-4211-2019, 2019.
Webb, J. R., Clough, T. J., and Quayle, W. C.: A review of indirect N2O emission factors from artificial agricultural waters, Environ. Res. Lett., 16, 043005, https://doi.org/10.1088/1748-9326/abed00, 2021.
Webb, J. R., Quayle, W. C., Ballester, C., and Wells, N.: Semi-arid irrigation farm dams are a small source of greenhouse gas emissions, Biogeochemistry, 166, 123–138, https://doi.org/10.1007/s10533-023-01100-4, 2023.
Weiss, R. F.: Determinations of carbon dioxide and methane by dual catalyst flame ionization chromatography and nitrous oxide by electron capture chromatography, J. Chromatogr. Sci., 19, 611–616, https://doi.org/10.1093/chromsci/19.12.611, 1981.
Weiss, R. F. and Price, B. A.: Nitrous oxide solubility in water and seawater, Mar. Chem., 8, 347–359, https://doi.org/10.1016/0304-4203(80)90024-9, 1980.
Wik, M., Crill, P. M., Varner, R. K., and Bastviken, D.: Multiyear measurements of ebullitive methane flux from three subarctic lakes, J. Geophys. Res.-Biogeosci., 118, 1307–1321, https://doi.org/10.1002/jgrg.20103, 2013.
Xie, S., Xia, T., Li, H., Chen, Y., and Zhang, W.: Variability in N2O emission controls among different ponds within a hilly watershed, Water Res., 267, 122467, https://doi.org/10.1016/j.watres.2024.122467, 2024.
Xun, F., Feng, M., Ma, S., Chen, H., Zhang, W., Mao, Z., Zhou, Y., Xiao, Q, Wu, Q. L., and Xing, P.: Methane ebullition fluxes and temperature sensitivity in a shallow lake, Sci. Total Environ., 912, 169589, https://doi.org/10.1016/j.scitotenv.2023.169589, 2024.
Yan, X., Xu, X., Ji, M., Zhang, Z., Wang, M., Wu, S., Wang, G., Zhang, C., and Liu, H.: Cyanobacteria blooms: A neglected facilitator of CH4 production in eutrophic lakes, Sci. Total Environ., 651, 466–474, https://doi.org/10.1016/j.scitotenv.2018.09.197, 2019.
Yang, Z., Zhao, Y., and Xia, X.: Nitrous oxide emissions from Phragmites australis-dominated zones in a shallow lake, Environ. Pollut., 166, 116–124, https://doi.org/10.1016/j.envpol.2012.03.006, 2012.
Yentsch, C. S. and Menzel, D. W.: A method for the determination of phytoplankton chlorophyll and phaeophytin by fluorescence, Deep Sea Research and Oceanographic Abstracts, 10, Elsevier, 221–231, https://doi.org/10.1016/0011-7471(63)90358-9, 1963.
Zhao, K., Tedford, E. W., Zare, M., and Lawrence, G. A.: Impact of atmospheric pressure variations on methane ebullition and lake turbidity during ice-cover, Limnol. Oceanogr. Lett., 6, 253–261, https://doi.org/10.1002/lol2.10201, 2021.